the Creative Commons Attribution 4.0 License.
the Creative Commons Attribution 4.0 License.
 | 26 Mar 2019
In situ measurements of trace gases, PM, and aerosol optical properties during the 2017 NW US wildfire smoke event
Vanessa Selimovic
Robert J. Yokelson
Gavin R. McMeeking
Sarah Coefield
In mid-August through mid-September of 2017 a major wildfire smoke and haze episode strongly impacted most of the NW US and SW Canada. During this period our ground-based site in Missoula, Montana, experienced heavy smoke impacts for ∼ 500 h (up to 471 µg m−3 hourly average PM2.5). We measured wildfire trace gases, PM2.5 (particulate matter ≤2.5 µm in diameter), and black carbon and submicron aerosol scattering and absorption at 870 and 401 nm. This may be the most extensive real-time data for these wildfire smoke properties to date. Our range of trace gas ratios for ΔNH3∕ΔCO and ΔC2H4∕ΔCO confirmed that the smoke from mixed, multiple sources varied in age from ∼ 2–3 h to ∼ 1–2 days. Our study-average ΔCH4∕ΔCO ratio (0.166±0.088) indicated a large contribution to the regional burden from inefficient smoldering combustion. Our ΔBC∕ΔCO ratio (0.0012±0.0005) for our ground site was moderately lower than observed in aircraft studies (∼ 0.0015) to date, also consistent with a relatively larger contribution from smoldering combustion. Our ΔBC∕ΔPM2.5 ratio (0.0095±0.0003) was consistent with the overwhelmingly non-BC (black carbon), mostly organic nature of the smoke observed in airborne studies of wildfire smoke to date. Smoldering combustion is usually associated with enhanced PM emissions, but our ΔPM2.5∕ΔCO ratio (0.126±0.002) was about half the ΔPM1.0∕ΔCO measured in fresh wildfire smoke from aircraft (∼ 0.266). Assuming PM2.5 is dominated by PM1, this suggests that aerosol evaporation, at least near the surface, can often reduce PM loading and its atmospheric/air-quality impacts on the timescale of several days. Much of the smoke was emitted late in the day, suggesting that nighttime processing would be important in the early evolution of smoke. The diurnal trends show brown carbon (BrC), PM2.5, and CO peaking in the early morning and BC peaking in the early evening. Over the course of 1 month, the average single scattering albedo for individual smoke peaks at 870 nm increased from ∼ 0.9 to ∼ 0.96. Bscat401∕Bscat870 was used as a proxy for the size and “photochemical age” of the smoke particles, with this interpretation being supported by the simultaneously observed ratios of reactive trace gases to CO. The size and age proxy implied that the Ångström absorption exponent decreased significantly after about 10 h of daytime smoke aging, consistent with the only airborne measurement of the BrC lifetime in an isolated plume. However, our results clearly show that non-BC absorption can be important in “typical” regional haze and moderately aged smoke, with BrC ostensibly accounting for about half the absorption at 401 nm on average for our entire data set.
- Article
(2752 KB) - Full-text XML
-
Supplement
(657 KB) - BibTeX
- EndNote


Biomass burning (BB) emissions are an important source of trace gases and particles that can influence local, regional, and global atmospheric chemistry, air quality, climate forcing, and human health (Crutzen and Andreae, 1990). BB is one of the largest sources of fine primary organic aerosol (OA), black carbon (BC), brown carbon (BrC) (Bond et al., 2004, 2013; Akagi et al., 2011), total greenhouse gases, and non-methane organic gases (NMOG) (Yokelson et al., 2008, 2009), which are precursors for the formation of ozone and OA. While the majority of BB occurs in the tropics, the small fraction of the global BB in the western US is responsible for a significant portion of US air quality impacts (Park et al., 2007; Liu et al., 2017; Wilkins et al., 2018; Zhou et al., 2018) and contributes to increasing health concerns. Wildfire smoke has been shown to have adverse respiratory and cardiovascular health effects, is associated with mortality and morbidity, and exhibits lung toxicity and mutagenicity (Le et al., 2014; Liu et al., 2015; Reid et al., 2016; Adetona et al., 2016; Kim et al., 2018). In some cases, long-range transport of biomass burning emissions can cause air quality standards to be exceeded hundreds or thousands of kilometers downwind of the fire source (Jaffe et al., 2013; Wigder et al., 2013). In addition to health concerns, particulate matter from wildfires can reduce visibility, which can have impacts on safety and transportation (United States Environmental Protection Agency, 2019), and is a concern in protected visual environments such as national parks and wilderness areas, most of which are in the western US, where a majority of wildfires occur. The Interagency Monitoring of Protected Visual Environments (IMPROVE) program initiated in 1985 implemented long-term monitoring that establishes current visibility conditions and has helped to improve visibility in protected areas. However, record high temperatures, drought, and fire-control practices over the last century have culminated into a situation in which we can anticipate more frequent fires of a larger size and intensity in the western US and Canada (Yue et al., 2015; Westerling et al., 2006). These fires are expected to impact all aspects of air quality in the US – and have other impacts, including on visibility. In fact, over the last few decades, the annual number of wildfires in the US has not changed significantly, but the annual area burned has increased by a factor of about 3 (United States National Interagency Fire Center, 2019), and many of the highest burned-area years have coincided with many of the warmest years on record (United States Environmental Protection Agency, 2019). Despite these important issues, many of the emissions from BB remain either understudied or completely unstudied. To date, most of the research on the emissions and evolution of smoke from US fires in the field has targeted prescribed fires (Burling et al., 2011; Akagi et al., 2013; Yokelson et al., 2013a; May et al., 2014; Müller et al., 2016), and while there are studies that probe trace gas and optical property emissions of wildfire smoke sampled in the field (Liu et al., 2017; Lindaas et al., 2017; Landis et al., 2017; Collier et al., 2016; Eck et al., 2013; Sahu et al., 2012; Lack et al., 2012), much of the information is limited in temporal extent or incomplete chemically and fails to assess important issues such as the aging and evolution of smoke over varying and extended amounts of time, nighttime evolution and oxidation, or the contribution of constituents of increasingly recognized importance such as BrC (UV-absorbing OA), to name a few.
BrC emissions are typically mixed with co-emitted BC and non-absorbing OA, which can result in some measurement difficulties and uncertainty in isolating and evaluating the optical properties of BrC and its overall radiative impact (Wang et al., 2017). In lab-simulated wildfires, BrC was associated with smoldering combustion and accounted for about 86 % of absorption by particles in the UV in the fresh smoke, which has several implications in atmospheric chemistry, including impacts on radiative forcing, UV-driven photochemical reactions producing ozone, and the lifetime of NOx and HONO (Selimovic et al., 2018). In addition, there are sources of BrC not directly emitted from BB, including the photo-oxidation of volatile organic compounds (VOCs) and aqueous-phase chemistry in cloud droplets. These processes produce BrC with optical properties and lifetimes that are not yet well characterized (Graber and Rudich, 2006; Ervens et al., 2011; Wang et al., 2014; Laskin et al., 2015; Tomaz et al., 2018). In fact, several factors, such as chemical transformation, mixing state, combustion conditions, and photochemical aging, can all influence the absorption of BrC (Wang et al., 2017). Most modeling studies have found that despite the multiple variables contributing to the absorption of BrC, including BrC in climate models would mean the net radiative forcing of biomass burning would move in a more positive direction. (Feng et al., 2013; Jacobsen, 2014; Saleh et al., 2014; Forrister et al., 2015). Unfortunately, observational constraints on BrC are scarce, making it difficult to assess and enhance models based on observational evidence. Thus, more field measurements are required to get an accurate estimate of the impact of BrC, both regionally and globally.
Most of the western US, including the Rocky Mountains, constitutes a large fire-prone region. Missoula, Montana, is the largest city completely surrounded by the Rocky Mountains. Missoula is also located within a large region of the inland Pacific Northwest, where wildfires have caused air quality trends to deviate from the pattern in the rest of the US (McClure and Jaffe, 2018). Missoula frequently experiences smoke impacts typical of much of the urban and rural west due to local and regional western fires. A few airborne studies have sampled western wildfires and are most sensitive to lofted emissions (Liu et al., 2017; Yates et al., 2016), but wildfires may produce some unlofted emissions, especially at night. Ground-based studies could probe these unlofted emissions but have difficulty to representatively sample lofted emissions unless advection accompanies transport. Despite these platform-based considerations, our laboratory on the eastern edge of Missoula is a relevant receptor for mixed-age (1–2 h to 1–2 days) western wildfire smoke. In this study, we measured the wildfire smoke characteristics for 500 smoke-impacted hours during August–September of 2017, which constituted a prolonged period of record-breaking air quality impacts in Missoula. This very large sample of wildfire smoke helps address some of the afore-mentioned observational gaps in current wildfire field data. Specifically, two photoacoustic extinctiometers (PAXs) and a Fourier-transform-infrared spectrometer (FTIR) characterized the smoke that entered the Missoula valley. A Montana Department of Environmental Quality (DEQ) PM2.5 (particulate matter ≤2.5 µm in diameter) monitor provided additional insight and verified some impacts. The PAXs provided measurements of scattering and absorption at two wavelengths (nominal 405 nm, actual 401 nm; 870 nm), BC, and derivations of single scattering albedo (SSA), and Ångström absorption exponent (AAE) for PM1.0. The FTIR measured the BB “tracer” carbon monoxide (CO) and a few other trace gases that help estimate effective average smoke age. The main goals of this work are to document the net combined effect of numerous fires on a heavily impacted surface site embedded in the region and, thus, also help assess the representativeness of field measurements, emissions inventories, and models. In more detail, we characterize the smoke impacts on a population center and we document the real-world regional significance of BrC. Comparisons are possible to our time series of BC, CO, or PM, etc. or diurnal cycles for these species for a more relaxed test. Our real-time through study-average ratios for “inert” tracers such as ΔBC∕ΔCO are compared with ΔBC∕ΔCO in the field measurements that are available to build emissions inventories that serve as model input. The time-resolved and study-average values of dynamic ratios (e.g., ΔPM∕ΔCO) help elucidate the net effect of secondary aerosol formation and evaporation. Our measurements provide real-world aerosol optical properties (e.g., SSA and AAE) and can be used with the aerosol mass data at real time through study-average resolution to probe multi-step, bottom-up calculations of climate-relevant aerosol optical properties. We present our results and compare them to those previously reported for wildfire field measurements and prescribed fire field measurements.
2.1 Site descriptions
Trace gases and particles were measured through co-located inlets at the University of Montana (UM), ∼ 12.5 m above the ground through the window of our laboratory on the fourth (top) floor of the Charles H. Clapp building (CHCB). The UM campus encompasses an area of ∼ 0.89 km2 and is located on the eastern edge of Missoula, with the CHCB located in the southeastern corner of campus. The CHCB is ∼ 1.1 km from the nearest road that gets appreciable traffic during the summer; thus our measurements were not significantly influenced by automobile emissions (see Sect. 3.1). PM2.5 measurements were made by the Montana Department of Environmental Quality via a stationary PM2.5 monitor located in Boyd Park, Missoula, which is ∼ 3.2 km southwest of our UM laboratory, with both sites being located in the Missoula valley proper.
2.2 Instrument details
2.2.1 Fourier transform infrared spectrometer
Trace gas measurements were made using an FTIR (Midac, Corp., Westfield, MA) with a Stirling cycle cooled mercury-cadmium-telluride (MCT) detector (Infrared Associates, Stuart, FL; Ricor USA Inc., Salem, NH) interfaced with a 17.22 m path closed multipass White cell (Infrared Analysis, Inc., Anaheim, CA) that is coated with a halocarbon wax (1500 Grade, Halocarbon Products Corp., Norcross, GA) to minimize surface losses (Yokelson et al., 2003). Although the system was designed for source measurements and is described elsewhere in more detail (Akagi et al., 2013; Stockwell et al., 2016a, b), the FTIR is convenient for ambient monitoring because the Stirling cooled detector does not require refilling of liquid nitrogen and thus allows for mostly autonomous operation. Ambient air was drawn through the 2.47 L White cell at ∼ 6 L min−1 via a downstream IDP-3 dry scroll vacuum pump (Agilent Technologies) using a 0.635 cm o.d. corrugated Teflon inlet that was positioned outside the window (∼ 12.5 m above ground level). Cell temperature and pressure were also logged on the system computer (Minco TT176 TRD, MKS Baratron 722A). Spectra were collected at a resolution of 0.50 cm−1 covering a frequency range of 600–4200 cm−1. A time resolution of approximately 5 min was more than adequate, and sensitivity was increased by co-adding scans at this frequency. Gas-phase species (with their respective detection limits in parentheses), including carbon monoxide (CO, 20 ppb), methane (CH4, 20 ppb), acetylene (C2H2, 2 ppb), ethylene (C2H4, 2 ppb), methanol (CH3OH, 3 ppb), and ammonia (NH3, 2 ppb) were quantified by fitting selected regions of the mid-IR transmission spectra with a synthetic calibration nonlinear least-squares method (Griffith, 1996; Yokelson et al., 2007). The uncertainties in the individual mixing ratios (ppmv) varied by spectrum and molecule and were influenced by uncertainty in the reference spectra (1 %–5 %) or the real-time detection limit, whichever was larger. The procedure used to correct for gases outside of the spectrometer cell raised the uncertainty to ∼ 20 ppb for background CO and CH4 but did not affect the measured enhancements above the background during smoke episodes. Calibrations with NIST-traceable standards indicate that peak CO values had an uncertainty of less than 5 %. The FTIR system was designed for source sampling, and the sensitivity was adequate to measure a significant amount of usable trace gas data but not every species on every event. In addition, an FTIR system problem caused the trace gas data to terminate about 1 day before the smoke cleared.
2.2.2 Photoacoustic extinctiometers (PAXs) at 870 and 401 nm
Particle absorption and scattering coefficients (Babs, Mm−1, Bscat, Mm−1) were measured directly at 1 s time resolution using two photoacoustic extinctiometers (PAX, Droplet Measurement Technologies, Inc., Longmont, CO; Lewis et al., 2008; Nakayama et al., 2015), and single scattering albedo (SSA) at 401 (nominally a 405 nm system) and 870 nm, and the Ångström absorption exponent (AAE) were derived using those measurements. Although the PAXs measured every second, data were averaged to 5 min, which was deemed adequate for the final analysis and matched the time resolution used by the FTIR for the same reason. A 1 L min−1 aerosol sample flow was drawn through each PAX using a downstream IDP-3 dry scroll vacuum pump (Agilent Technologies) and split internally between a nephelometer and photoacoustic resonator for simultaneous measurement of light scattering and absorption. Both PAX instruments contain an internal pump; however these internal pumps were bypassed to improve measurement sensitivity, as the pumps can contribute an amount of acoustic noise that is noticeable in clean-air ambient measurements. Scattering of the PAX laser light was measured using the wide-angle (6–174∘) reciprocal nephelometer that responds to all particle types regardless of chemical makeup, mixing state, or morphology. For absorption measurements, the laser beam was directed through the aerosol stream and modulated at a resonant frequency of the acoustic chamber. Absorbing particles transferred heat to the surrounding air, inducing pressure waves that were detected via a sensitive microphone. Advantages of the PAX include direct in situ measurements, a fast response time, continuous autonomous operation, and elimination of the need for filter collection and the uncertainties that come with filter artifacts (Subramanian et al., 2007).
The PAX sample line was ∼ 4.7 m of 0.483 cm o.d. conductive silicon tubing positioned outside the window ∼ 12.5 m above ground level and co-located with the FTIR inlet. The tubing transferred outside air to a scrubber to remove light-absorbing gases (Purafil-SP Media, minimum removal efficiency 99.5 %) and then a diffusion dryer (Silica Gel 4–10 mesh) to remove water, with post-dryer relative humidity varying between 13 % and 30 %. The scrubber and dryer were refreshed before any signs of deterioration were observed (e.g., color change). The diffusion-based designs will cause small particle losses, but losses were not explicitly measured. After the dryer, a splitter connected to the two instruments. After the splitter, each sample line featured a 1.0 µm size cutoff cyclone and two acoustic notch filters that reduced noise. Both PAX instruments were calibrated before, during, and after the experiment using the manufacturer-recommended scattering and absorption calibration procedures utilizing ammonium sulfate particles and a propane torch to generate purely scattering and strongly absorbing aerosols, respectively. The 401 nm data were only used after 27 August because of frequent clogging of the PM1.0 cyclone before that date. The estimated uncertainty in PAX absorption and scattering measurements has been estimated to be ∼ 4 %–11 % (Nakayama et al., 2015).
In the PAX, the incident laser light is absorbed in situ by light absorbing particles without filter or filter-loading effects that can be difficult to correct, particularly for samples with high organic aerosol loadings (Lack et al., 2008; Li et al., 2019). We directly measure aerosol absorption (Babs, Mm−1) and used the literature- and manufacturer-recommended mass absorption coefficient (MAC) (4.74±0.63 m2 g−1 at 870 nm) to calculate the BC concentration (µg m−3) at ambient temperature and pressure (Bond and Bergstrom, 2006), but the BC mass can be adjusted using different MAC values if supported by future work. Because the PAXs also measured light scattering, scattering and absorption values can be combined to directly calculate the single scattering albedo (SSA, the ratio of scattering to total extinction). SSA is a useful input for climate models, where an SSA closer to 1 indicates a more “cooling” highly scattering aerosol:
To a good approximation, sp2-hybridized carbon (including BC) absorbs light proportional to frequency (Bond and Bergstrom, 2006). Thus, the Babs contribution from BC at 401 nm can be calculated from 2.17 times Babs at 870 nm (an absorption Ångström exponent of 1), where BrC absorption is expected to be negligible, and any additional Babs at 401 nm can be assigned to BrC (Babs, BrC) subject to limitations due to “lensing” by coatings discussed elsewhere (Pokhrel et al., 2016, 2017; Lack and Langridge, 2013; Lack and Cappa, 2010). Coating effects are very difficult to isolate from BrC direct absorption effects, and this adds some uncertainty to the BrC attribution (±25 %) but not to the absorption measurements themselves. Additionally, the absorption Ångström exponent (AAE) (401/870) can be calculated from the 401 and 870 data, where the AAE of pure BC is usually close to 1, and larger values are indicative of smoke absorption more dominated by BrC emissions:
The AAE is useful as an indicator of BrC ∕ BC, but in addition, the full aerosol absorption spectrum is often approximated with a power law function (absorption ), and thus the AAE determined with any wavelength pair can be used to approximately calculate the shape of absorption across the UV–VIS range (Reid et al., 2005b). An equation similar to Eq. (2) provides the scattering Ångström exponent (SAE), which can be used to calculate scattering at unmeasured wavelengths.
A few other sources of uncertainty in the measurements and/or calculations are poorly characterized; MAC increases due to coatings, potential particle losses in the dryer or scrubber, and truncation error in the nephelometer. Mie calculations provided by the manufacturer suggest the scattering could be underestimated by about 1 % at 870 nm and 2.5 % at 401 nm due to truncation error (John Walker, personal communication, 2019). This would reduce the mass scattering coefficients (Sect. 3.5), and, typically, a 1 % reduction in scattering would imply approximately a tenth of a percent of value underestimate of SSA. Miyakawa et al. (2017) reported a size-independent particle transmission up to 400 nm of 84±5 % in their diffusion dryer. Larger particles may be transmitted more efficiently. We did not measure size distribution or transmission efficiency in this study, and, thus, we did not adjust the data. Size-independent particle losses would reduce scattering, absorption, and derived BC but should only have a small impact on SSA or AAE. Unlike particle losses, an increased MAC due to lensing via coatings could inflate BC values by up to ∼ 30 % (Pokhrel et al., 2017).
2.2.3 Montana Department of Environmental Quality PM2.5
The Montana DEQ uses beta attenuation monitors (Met One Instruments, Model BAM-1020) in accordance with US EPA Federal Equivalent Methods (FEMs) for continuous PM2.5 monitoring. At the beginning of each sample hour, a constant 14C source emits beta rays though a spot of clean glass fiber filter tape. The beta rays are measured by a photomultiplier tube to determine a zero reading. The BAM-1020 then advances this spot of tape to the sample nozzle, where it filters a measured amount of outside air at 16.7 L min−1. At the end of the sample hour, the attenuation of the beta ray signal by the filter spot is used to determine the mass (and concentration µg m−3 at ambient temperature and pressure) of the particulate matter. Hourly detection limits for the BAM-1020 are <2.4 µg m−3 (1σ). Current and archived air quality data for the state of Montana can be accessed using the following link: http://svc.mt.gov/deq/todaysair/ (last access: 20 March 2019). More information on the BAM-1020 can be found at http://metone.com/air-quality-particulate-measurement/regulatory/bam-1020/ (last access: 20 March 2019). Note the PAX size cutoff throughout this study was 1.0 µm, and the PM size cutoff is 2.5 µm. The mass in the 1.0–2.5 µm range is thought to be a small part of the total mass (e.g., 10 %–20 % in Fig. 2 in Reid et al., 2005a), but the size range difference does affect data interpretation as detailed later. (PM2.5 cyclones have now been obtained for the PAXs for ongoing studies.)
2.2.4 Emission ratios (ERs) and downwind enhancement ratios
Time series are useful to characterize impacts and evaluate models, but we also used the time series of mixing ratios or concentrations for each analyte measured to derive other values that are broadly useful for study comparisons and implementation in local to global chemistry and climate models. As part of this, we produced emission ratios (ERs) and enhancement ratios. The calculation of these two types of ratios is the same, but an emission ratio is only the appropriate term for a ratio measured directly at a source or further downwind for relatively inert species such as BC or CO. First, an excess mixing ratio or concentration (denoted by “ΔX” for each species X) is calculated for all species measured by subtracting the relatively small background value based on a sloping baseline from before to after a smoke impact. For example, the ratio for each species relative to CO (ΔX∕ΔCO) is the ratio between the sum of ΔX over the entire smoke impacted period relative to the sum of ΔCO over the entire smoke impacted period. Mass or molar ratios to CO were calculated for BC, PM, and all the gases measured by the FTIR that exhibited enhancement above background levels for each smoke impacted period. Emission factors (EFs), which can be derived by including the molar ER to CO2 in the carbon mass balance method were not calculated (Selimovic et al., 2018). The diurnal variation for CO2 is considerable, and the smoke was mainly aged (not reflecting initial emissions for most species) in Missoula. The prolonged “small” ΔCO2 peaks that persist for times similar to the natural, substantial variation that CO2 has have uncertain values. For example, for CO2, the wildfire smoke impacts in Missoula are largely diluted and protracted enough to not completely dominate background variability, as is the case for the other gases and for source sampling (Stockwell et al., 2016a, b; Akagi et al., 2011, 2012). Since ΔCO2 is not as reflective of fire impacts, then by extension, the modified combustion efficiency (MCE), which is defined as , is not as useful as an index of the flaming to smoldering combustion ratio in this study as measurements closer to the source (Yokelson et al., 2013b). Other approximate indicators of the relative amount of flaming to smoldering combustion such as ΔBC∕ΔCO or ΔCH4∕ΔCO can still be used.
2.3 Investigating smoke origin and back trajectory calculations
To investigate the sources contributing to smoke events, we used a combination of back trajectory calculations, satellite imagery, and local meteorological data that provided insights into mixing and smoke origin. Back trajectories were calculated utilizing the National Oceanic and Atmospheric Administration (NOAA) Air Resources Laboratory Hybrid Single Particle Lagrangian Integrated Trajectory (HYSPLIT; Stein et al., 2015; Draxler, 1999; Draxler and Hess, 1997, 1998) initialized from UM (46.8601∘ N, 113.9852∘ W) at 500, 1200, and 3000 m above ground level during the hour at which enhancements for that particular smoke event were at a maximum. Back trajectories were run using the High Resolution Rapid Refresh (HRRR) operational model, which uses the Weather Research and Forecasting (WRF) modeling system combined with observational data assimilation and is run over the contiguous US at 3 km × 3 km resolution (Benjamin et al., 2016). For events that spanned multiple days, multiple back trajectories were initialized during the hour(s) at which enhancements for the sub-events were at a maximum. Because of the complex local topography and micrometeorology, the combination of back trajectories, satellite imagery (GOES “loops”), and other evidence can only suggest a most likely smoke origin and cannot provide an exact smoke age. Our best guess at the smoke origin for each event is listed in Table S1 in the Supplement.
2.4 Brief description of 2017 regional and selected local fires
Missoula experienced smoke impacts from local (western Montana) and regional fires with regional fires including fires in California, Idaho, Oregon, Washington, and British Columbia. Over ∼ 1.2 million ha burned in British Columbia in 2017 (BC Wildfire Service, 2017). More than 4 million ha burned in the US during the 2017 fire season, making it one of the largest to date. Idaho, Oregon, and Washington had burned areas over 263 000, 283 000, and 161 000 ha, respectively. California and Montana experienced their largest burned areas to date, with both states experiencing close to 526 000 ha burned each (https://www.predictiveservices.nifc.gov/intelligence/2017_statssumm/fires_acres17.pdf, last access: 21 March 2019). Although the complicated meteorology and topography of the Missoula valley makes attributing smoke sources somewhat difficult (as noted above), we can say with some degree of certainty that the majority of the fresh smoke impacting Missoula came from two local fires, the Lolo Peak Fire and the Rice Ridge Fire (Table S1). The Lolo Peak Fire started at high elevation ∼ 15 km SW of Missoula (46.674∘ N, 114.268∘ W) on 15 July 2017 and burned continuously (mostly at lower and lower elevations) until it eventually grew to over 20 000 ha. The fuel description as given by Inciweb (https://inciweb.nwcg.gov/incident/5375/, last access: 20 March 2019) is summarized as containing generally sparse or patchy subalpine fir (Abies lasiocarpa) with dead Whitebark pine (Pinus albicaulis) above ∼ 2100 m. Below 2100 m, fuels were mainly typical of a variety of coniferous-dominated ecosystems with major tree species such as ponderosa pine (Pinus ponderosa), subalpine fir (Abies lasiocarpa), and lodgepole pine (Pinus contorta). Lower elevations near containment lines were dominated by ponderosa pine with grassy understory. The Rice Ridge Fire started 24 July 2017 ∼ 52 km NE of Missoula (47.268∘ N, 113.485∘ W). The fire eventually burned over 64 000 ha, with a notable run on 3 September 2017, where it doubled in size from ∼ 20 000 to ∼ 40 000 ha. Fuels involved were timber (litter and understory) and brush (https://inciweb.nwcg.gov/incident/5414/, last access: 20 March 2019).
3.1 Overview of 2017 fire season smoke impact in Missoula
Figure 1 shows the hourly average mixing ratios of CO, BC, and PM2.5 observed from 11 August to 10 September 2017, which includes nearly all of the 2017 Missoula smoke impacts. There were more than 20 distinct periods of major smoke impacts that are readily identified by large simultaneous enhancements in CO, BC, and PM2.5. Sustained periods when PM2.5 was elevated well above the 12.5 µg m−3 EPA standard for “good” air quality were designated as events and assigned a letter in Fig. 1 and Table S1. The highest hourly values were observed on 4 September 2017, the morning after the Rice Ridge Fire doubled in size (PM2.5, 471 µg m−3, CO 2.78 ppm, BC 3.62 µg m−3). This event is discussed in more depth as a case study in a later section (Sect. 3.6). Numerous other PM2.5 peaks exceeded, e.g., levels of 100 µg m−3. “Cleaner” periods between smoke peaks became less extensive as the regional atmosphere became increasingly polluted until widespread clearing on 10 September 2017. Overall high correlation of CO and BC to PM2.5 suggests that the smoke was normally well mixed on the spatial scale that separated the PM2.5 and UM monitors. Many of the longer smoke impacts that spanned several days were necessarily integrated as a single event for calculating ratios between species, but we also initialized back trajectories from local maxima to further explore the source region of the smoke, which was probably always mixed to some extent (Table S1).
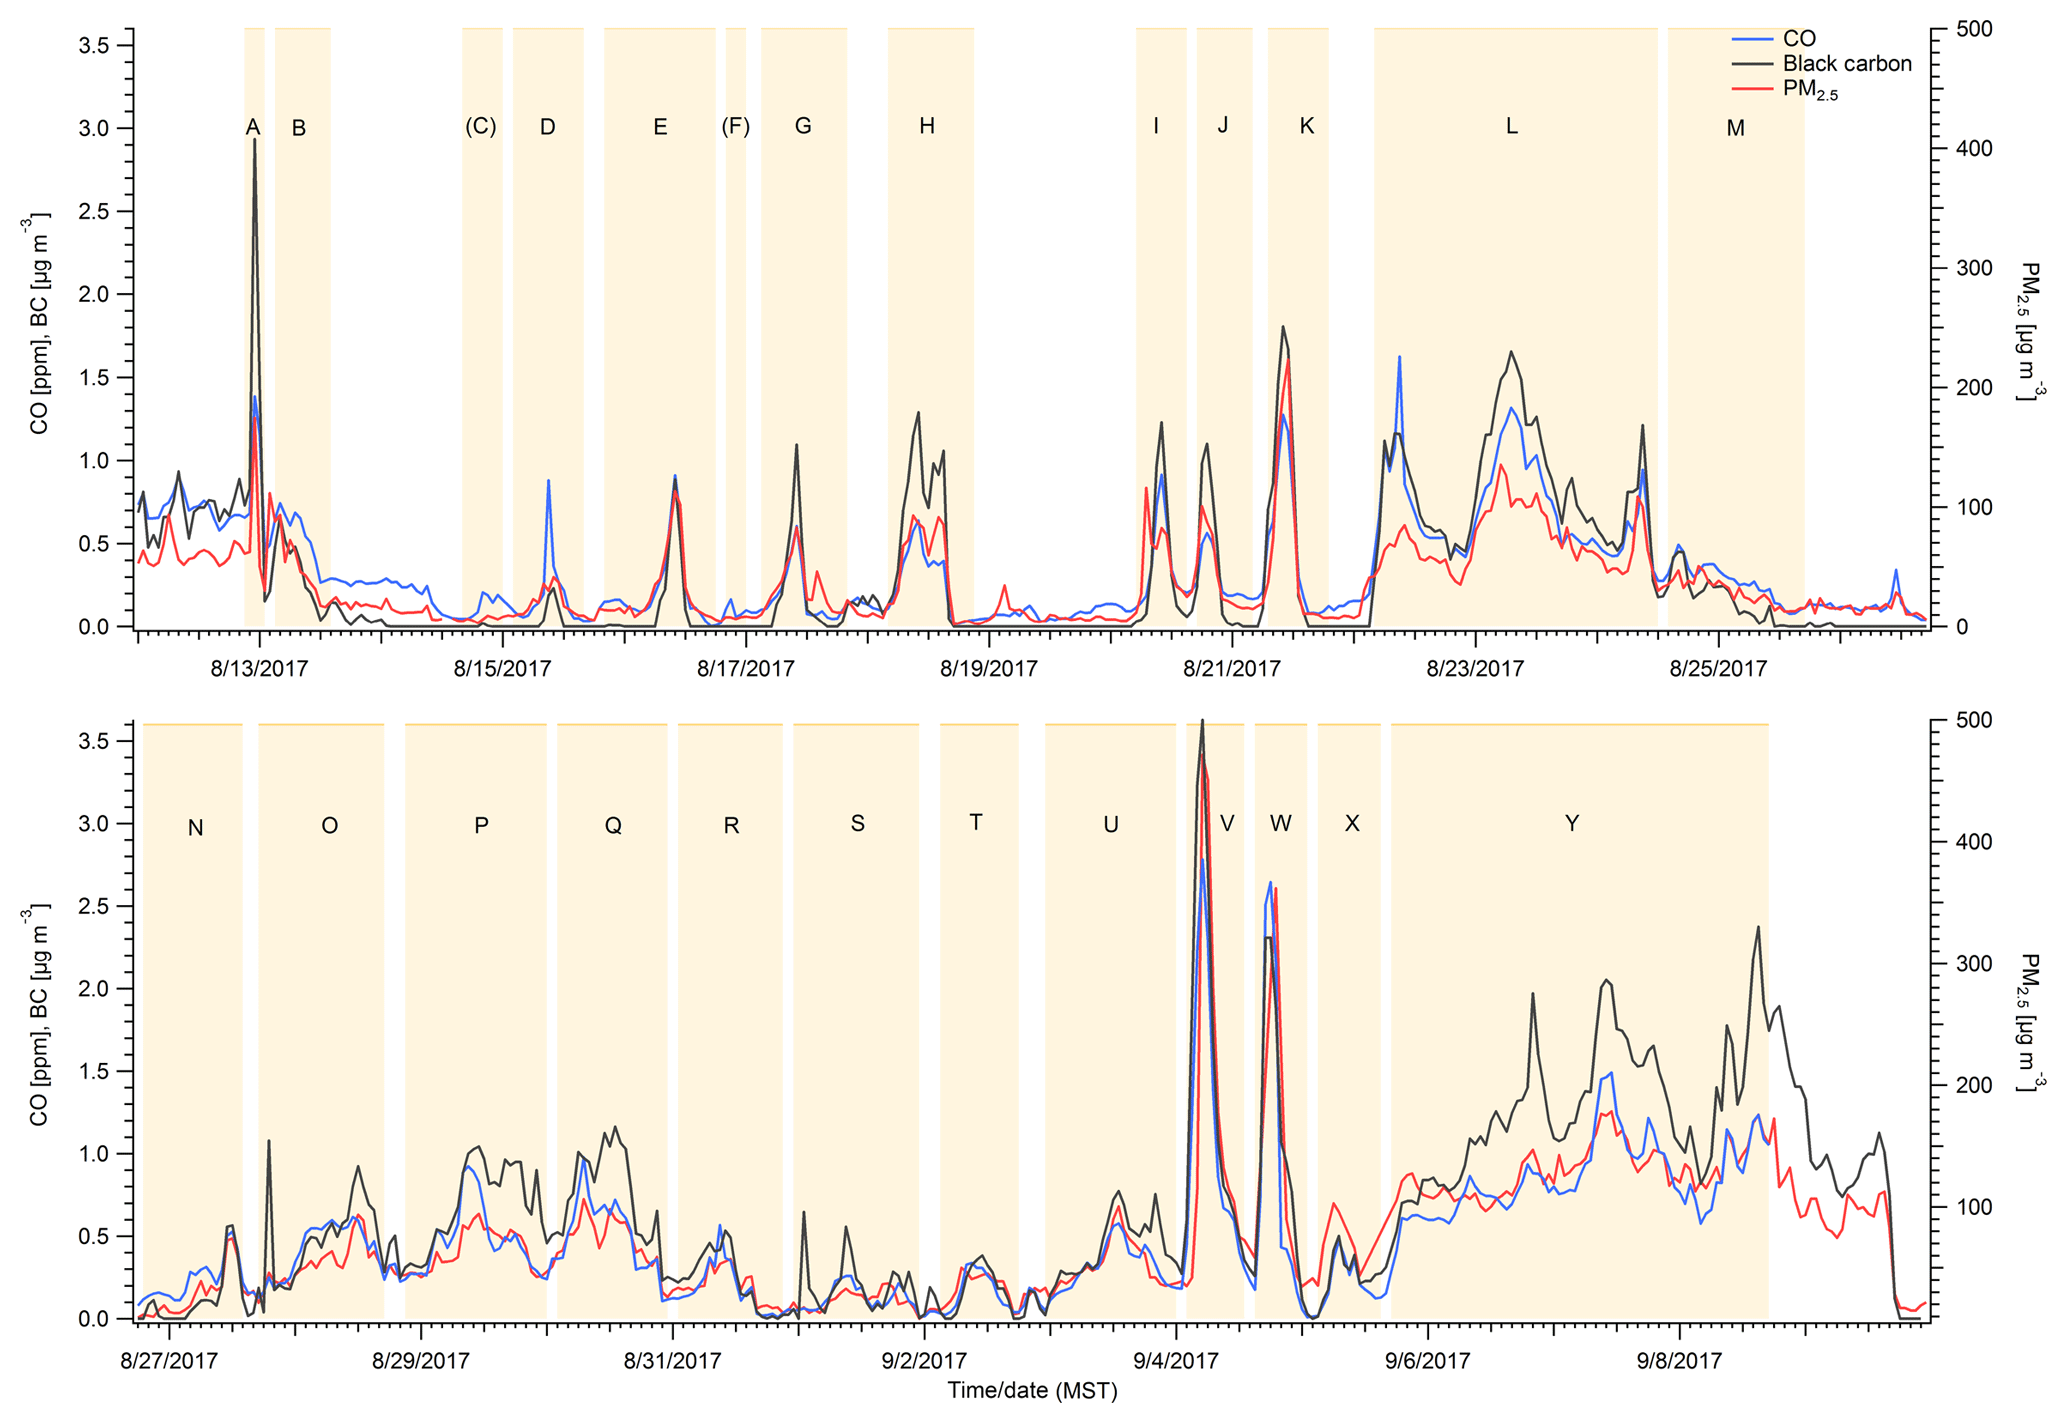
Figure 1Time series of hourly CO, BC, and PM2.5 measurements from Missoula. Sections highlighted in yellow roughly indicate smoke-impacted periods. A few small peaks that could not be attributed to biomass burning sources were excluded from analysis.
3.2 Trace gas ratios
Table 1 reports study-average ratios weighted by event duration (time-weighted) to CO for gases measured by the FTIR. These measurements are representative of moderately aged regional wildfire smoke. We interpret our results by comparing them to emission ratios measured in the lab (Selimovic et al., 2018) and other field studies mostly in fresher smoke (Liu et al., 2017; Landis et al., 2017; Radke et al., 1991). CO is a major pollutant in the atmosphere, with BB as a main source. In Missoula, especially in the summer, the CO background is not strongly influenced by non-fire sources. CH4 on the other hand has more background variability, but at these smoke levels the ratio of CH4 to CO, while variable, yields a study average (0.166±0.088) that mostly reflects the real average ΔCH4∕ΔCO fire emission ratio. Yates et al. (2016) reported a smoldering stage ΔCH4∕ΔCO ER of 0.095 (±0.023) for the Rim Fire, which is lower than our study-average ER, but the ratio reported in Yates et al. (2016) comes from airborne measurements closer to the source and from a single fire source. Our higher study-average ER of CH4 is indicative of smoldering (Reisen et al., 2018; Yokelson et al., 1997). Because the measurement was not in a direct downslope flow of smoke into Missoula, this ratio suggests that smoldering emissions from regional fires can be and were frequently transported to the Missoula valley. This may be why our study average is higher than observed in airborne studies. In a consistent observation, we find that ERs for ΔCH4∕ΔCO are lower when the ΔBC∕ΔCO ERs are higher (Fig. 2), which is indicative of a flaming to smoldering ratio dependence (Christian et al., 2003). This is a useful result, because our two metrics for combustion characteristics at the fire sources are consistent, and it indicates that the variability in ratios between species observed at Missoula was partly due to variable combustion types at the regional fire sources along with the expected effects of variable aging that are discussed next.
Table 1Time-weighted study-average enhancement ratios (ratioed to CO) compared to emission ratios reported in other studies.
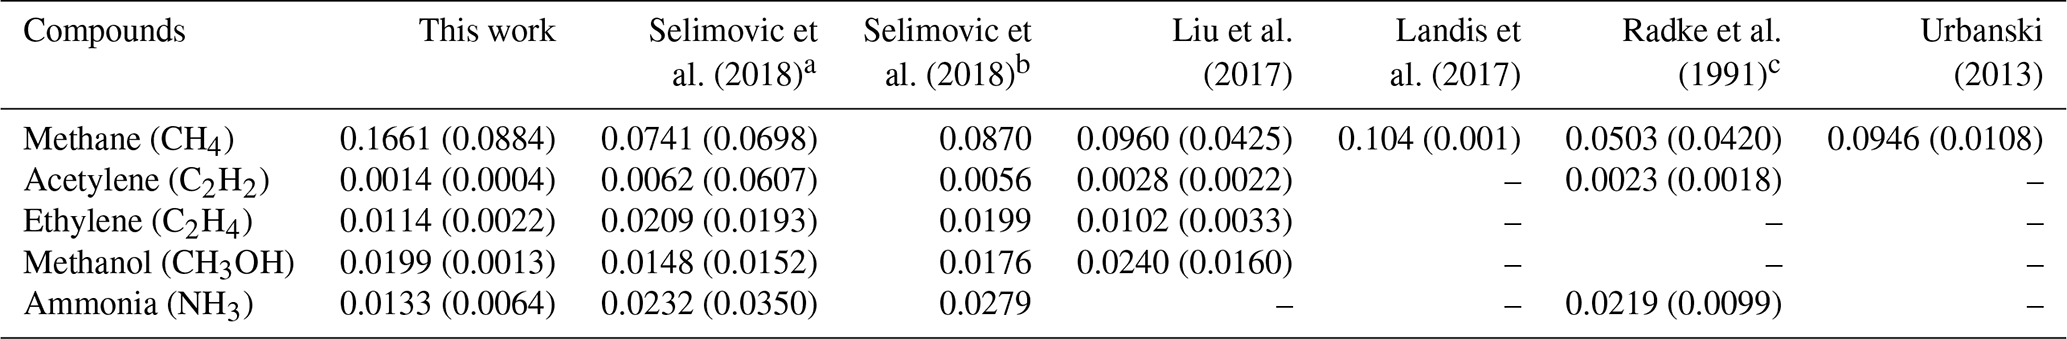
a Measured lab values at lab fire MCE.
b Calculated from EF versus MCE fit based on average wildfire MCE
reported in Liu et al. (2017). c Averages of Myrtle Fall Creek and
Silver Fire.
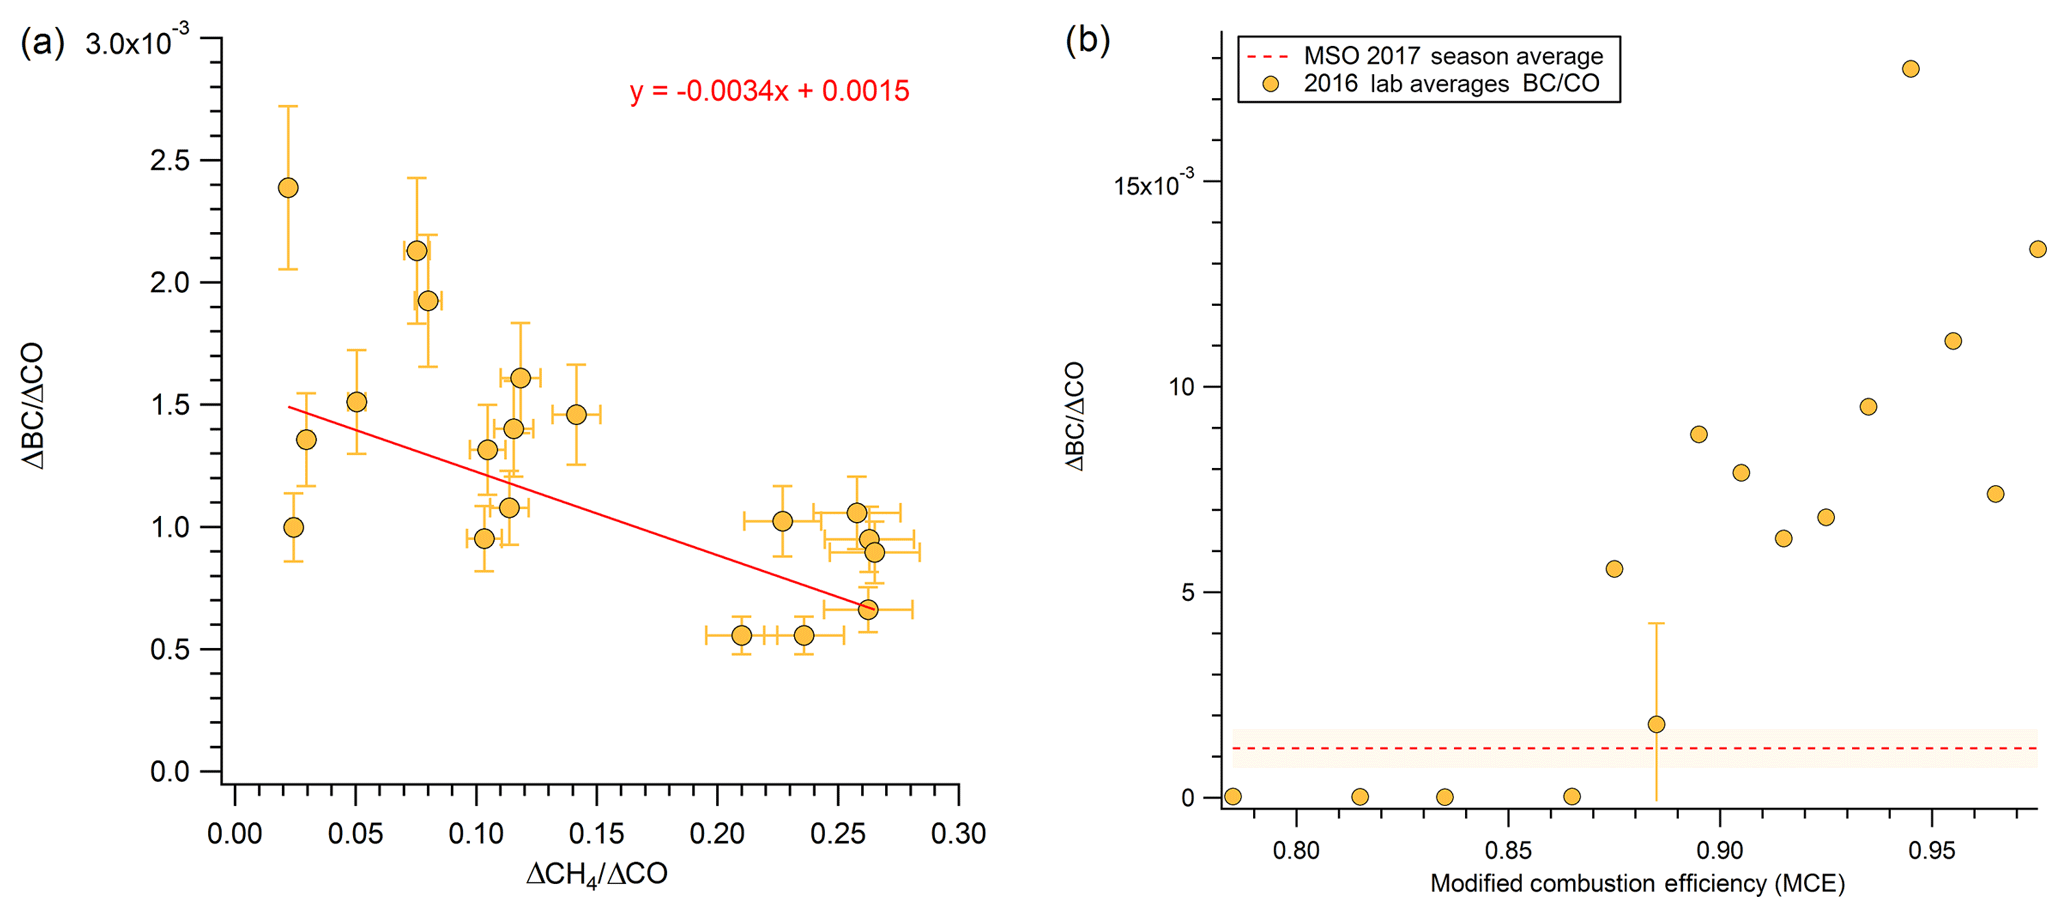
Figure 2(a) Methane emission ratio versus black carbon emission ratio. Point shown are for events that have both a CH4∕CO ratio and a BC ∕ CO ratio. (b) Lab average (Selimovic et al., 2018) BC ∕ CO ratio versus modified combustion efficiency (MCE), separated into bins by 0.01 of MCE.
Next, we compare other measured trace gas ratios, including some more reactive VOC, to the limited amount of data available from previous airborne and lab studies. Liu et al. (2017) sampled smoke between 1 and 2 h old on average and did not report an ER value for NH3. However, Liu et al. (2017) reported an average wildfire MCE that Selimovic et al. (2018) used with measurements of very fresh lab fire smoke to calculate an ER value for ΔNH3∕ΔCO based on the average wildfire MCE reported in Liu et al. (2017). The predicted NH3 value (0.0279) for wildfires based on an average wildfire MCE (0.91) is about twice our observed average ΔNH3∕ΔCO (0.0133). Radke et al. (1991) measured an ΔNH3∕ΔCO range from 0.037 for fresh smoke to 0.011 when including samples up to 48 h old. Our 2017 individual ratios span a range (Table S1). Near the high end we see ΔNH3∕ΔCO of 0.0196 for relatively fresh smoke assigned to the nearby Lolo Peak Fire and 0.0216 for event “S” of which the origin is unclear. Our lowest ratios are about 1∕4 of our highest ratios (0.0044) (Table S1). Akagi et al. (2012) measured a midday ΔNH3∕ΔCO half-life of ∼ 5 h, which suggests that our average sample age is roughly equivalent to ∼ 5 h of midday processing, and our oldest samples (with NH3 data) are aged equivalent to about 10 h of midday processing (Table S1). However, the “time since emission” is potentially longer than indicated by a “photochemical age”, since, according to the GOES satellite, a lot of smoke was produced in the evening and OH processing may not have started fully until the next day. In addition, we note that the true processing ages have potential to be even longer, since the true initial ΔNH3∕ΔCO may have been higher than our highest observed ratios as we were not immediately adjacent to sources. This possibility is supported by the fact that NH3 and CH4 emissions have been shown to be linked (Yokelson et al., 1997), and our “high” ΔCH4∕ΔCO value for event S (∼ 0.14) could indicate that the real initial ΔNH3∕ΔCO was higher than ∼ 0.022. Finally, the ΔNH3∕ΔCO ratio is also related to the size and age of particles, as will be discussed in future sections (Sect. 3.4).
C2H4 has been observed to decay in isolated plumes with a similar half-life to ammonia (Akagi et al., 2012; Hobbs et al., 2003), and our study-average ΔC2H4∕ΔCO ratio (0.011) is again about half that in the other wildfire studies in younger smoke reported in Table 1 (∼ 0.02) or listed elsewhere (Akagi et al., 2011). Our lower ΔC2H4∕ΔCO ratios tended to occur when the ΔNH3∕ΔCO ratio was also lower (Table S1), but unfortunately there are only two events with data for both gases and not enough measured values to warrant a detailed analysis. Methanol and acetylene react at least an order of magnitude more slowly with OH than C2H4. Our average methanol enhancement ratio (0.019) thus falls in the middle of the other wildfire values (0.0148–0.024) as might be expected when any aging effects are smaller than the natural high variability in initial emissions (Akagi et al., 2011). In fact ΔCH3OH∕ΔCO has been observed to increase or decrease slightly or stay the same for several hours of aging (Akagi et al., 2012, 2013; Müller et al., 2016). We only have a few data points for ΔC2H2∕ΔCO, but their average is significantly lower than the other wildfire studies. Since C2H2 is associated with flaming combustion (Lobert et al., 1991; Yokelson et al., 2013a), this could be due to the prevalence of smoldering that was also indicated by the high average ΔCH4∕ΔCO ratios as noted above. Another point about our trace gas data is that our mixing ratios for CO are valuable as an inert tracer for wildfire emissions for comparison to models, and they can be useful for inferring the initial emissions of other gases if those gases emission ratios to CO have been measured elsewhere (Selimovic et al., 2018; Koss et al., 2018; Liu et al., 2017). CO can also be used as a scaling/normalizing factor for particle emissions, which is discussed in the next section.
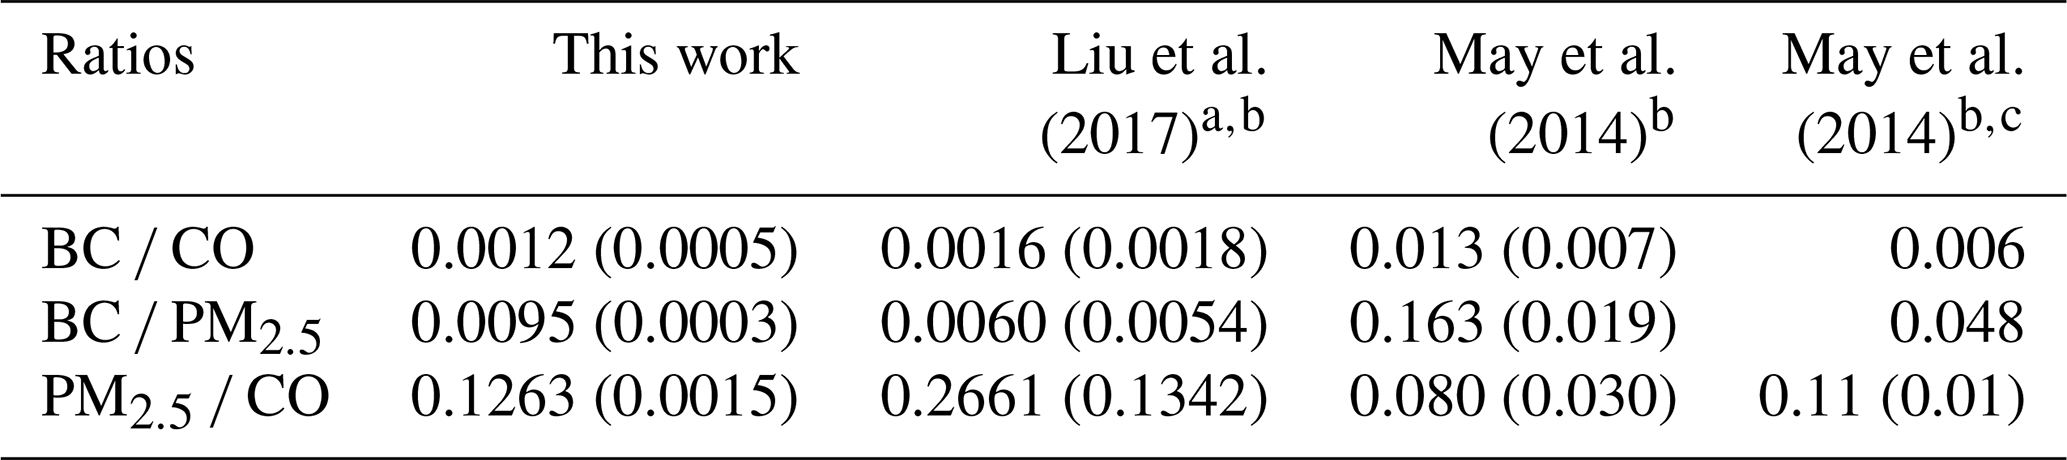
3.3 ΔBC∕ΔPM2.5, ΔBC∕ΔCO, ΔPM2.5∕ΔCO
BC is estimated to be the second strongest global climate warming agent, and BB is the main BC source (Bond et al., 2004). Accurate BC measurements are challenging, and aerosol absorption remains poorly understood in atmospheric models (Bond et al., 2013). In contrast, CO is measured reliably at a network of surface sites and in aircraft campaigns and can also be retrieved by satellite (MOPITT, IASI, AIRS, etc.). As a result, CO emissions estimates are available for most sources, including fires, and the estimates are in reasonable agreement for western wildfires (Liu et al., 2017). BC and ΔBC∕ΔCO measurements using modern methods for wildfires are rare; thus, our BC, CO, and ΔBC∕ΔCO measurements from a large sample of wildfire smoke can be used with CO emissions to update BC emissions estimates from wildfires (see below). BC is only made by flaming combustion at a fire source, and despite the fact that its production rate can vary strongly with flame turbulence, the ΔBC∕ΔCO ratio can serve as a rough indicator of the fire's flaming to smoldering ratio (Vakkari et al., 2018; Christian et al., 2003; Yokelson et al., 2009; Shaddix et al., 1994) as demonstrated earlier in Fig. 2b. Table 2 reports our study-average ratios (time-weighted) of ΔBC∕ΔCO, ΔBC∕ΔPM2.5, and ΔPM2.5∕ΔCO and compares them to the limited measurements of wildfire smoke available in the lab (Selimovic et al., 2018) and in the field (Liu et al., 2017; Sahu et al., 2012; Hobbs et al., 1996). Our ΔBC∕ΔCO ratio (0.0012) is a bit lower than the aircraft-measured averages of Sahu et al. (2012) (0.0014) and Liu et al. (2017) (0.0016) and the Selimovic et al. (2018) estimate at the field average MCE for wildfires from Liu et al. (2017, 0.0018). The Hobbs et al. (1996) average value for their two fires specifically identified as wildfires is notably higher than the other values and is actually an ΔEC∕ΔCO measurement that could be biased high (Li et al., 2019). The Selimovic et al. (2018) lab average is also higher but obtained at the higher lab-average MCE. The uncertainty in our value is likely asymmetric because coatings in aged PM could inflate absorption and our BC value by a small amount. Taken together, this suite of observations is roughly consistent with our ground-based site being impacted by relatively more smoldering combustion (MCE , based on Fig. 2b) than airborne studies on average (MCE 0.91, Liu et al., 2017; 0.90, Sahu et al., 2012; 0.883, Urbanski, 2013). Liu et al. (2017) calculated an average annual CO production from western US wildfires for 2011–2015 of 5240±2240 Gg, which they reported was in good agreement with an EPA estimate based on a similar burned area in the 2011 National Emissions Inventory (4894 Gg). Ratioing to the Liu et al. (2017) estimate with the average field study ΔBC∕ΔCO in Table 2 (0.0014±0.0002) suggests that western US wildfires emit 7.3±3.3 Gg of BC per year. This is significantly lower than a previous estimate, but the other estimate is not strictly comparable since it is based on EC measurements and for a different year (2006) (Mao et al., 2015).
Table 2Time-weighted study-average enhancement ratios (g g−1 ratioed to CO) compared to emission ratios reported in other studies.
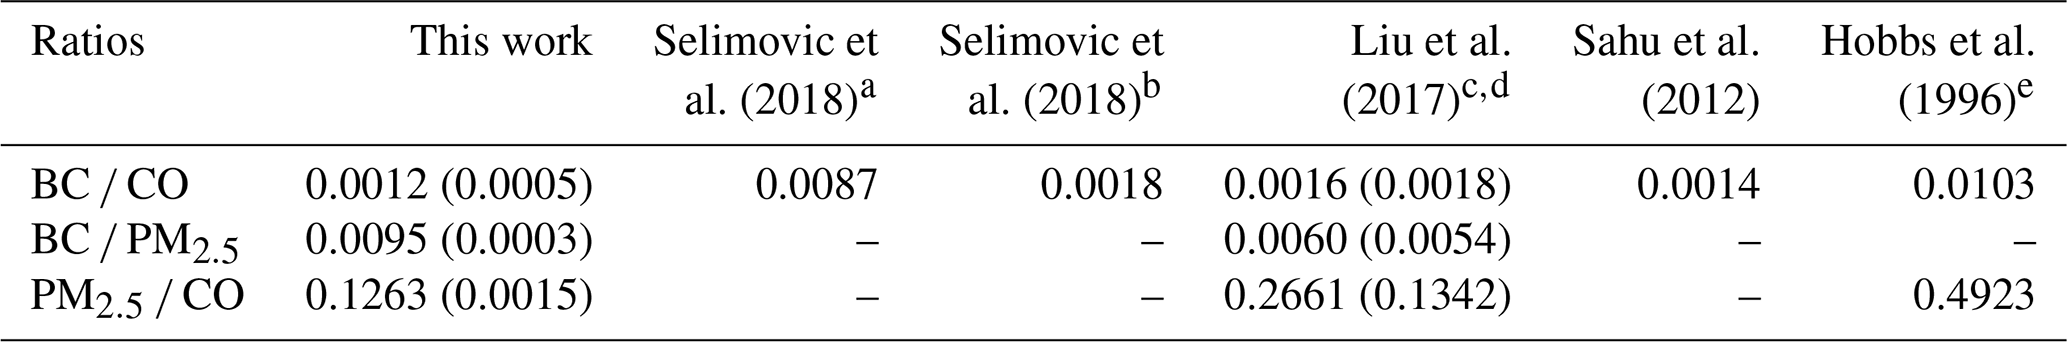
a Measured lab values at lab fire MCE. b Calculated from EF versus MCE fit based on average wildfire MCE reported in Liu et al. (2017). c Average of Rim Fire and Big Windy Complex. BC data were analyzed for Liu et al. (2017) study but not reported. d PM values reported are PM1.0. e PM values reported are PM3.5.
Changes in the ΔPM∕ΔCO ratio as a plume ages can be used as a metric for the net effect of secondary formation or evaporation of organic and inorganic aerosol (Yokelson et al., 2009; Akagi et al., 2012; Jolleys et al., 2012; Vakkari et al., 2014, 2018). Table 2 indicates that our ground-based ΔPM2.5∕ΔCO (0.126±0.002) is about half that obtained at aircraft altitudes in fresher wildfire smoke (0.266±0.134) as reported by Liu et al. (2017) and ∼ 4 times less than that reported for very fresh smoke by Hobbs et al. (1996) (0.492). Further, our lower ΔBC∕ΔCO ratio suggests enhanced smoldering, which should preclude a large drop in ΔPM∕ΔCO (Reisen et al., 2018). Liu et al. (2017) and Forrister et al. (2015) measured smoke aging for the Rim Fire (a large California wildfire) as the plume aged and found that the ΔOA∕ΔCO ratio started high and then dropped to a value (0.125±0.025) similar to our ΔPM2.5∕ΔCO. However, Collier et al. (2016) found no age dependence for ΔOA∕ΔCO for plumes intercepted at Mount Bachelor or on the G-1 aircraft and obtained a value for ΔOA∕ΔCO (0.25±0.07) close to both the ΔOA∕ΔCO and ΔPM1.0∕ΔCO of Liu et al. (2017) in fresh Rim Fire smoke. Taken together, these observations suggest that, on timescales up to ∼ 1–2 days for the wildfire smoke studied to date, aging and/or higher average ambient temperatures at lower elevations may encourage some OA evaporation and reduce downwind PM impacts. Some studies in other fire types have found secondary formation to dominate at low elevation (Yokelson et al., 2009; Vakkari et al., 2014), so it is premature to generalize this observation to all BB, and more study is needed. However, both of the latter studies measured smoke from smaller fires within a few hours of the source, and our lower ΔPM2.5∕ΔCO indicates that evaporation of PM dominated over formation of PM as smoke was transported to the Missoula valley in smoke that was between several hours and several days old.
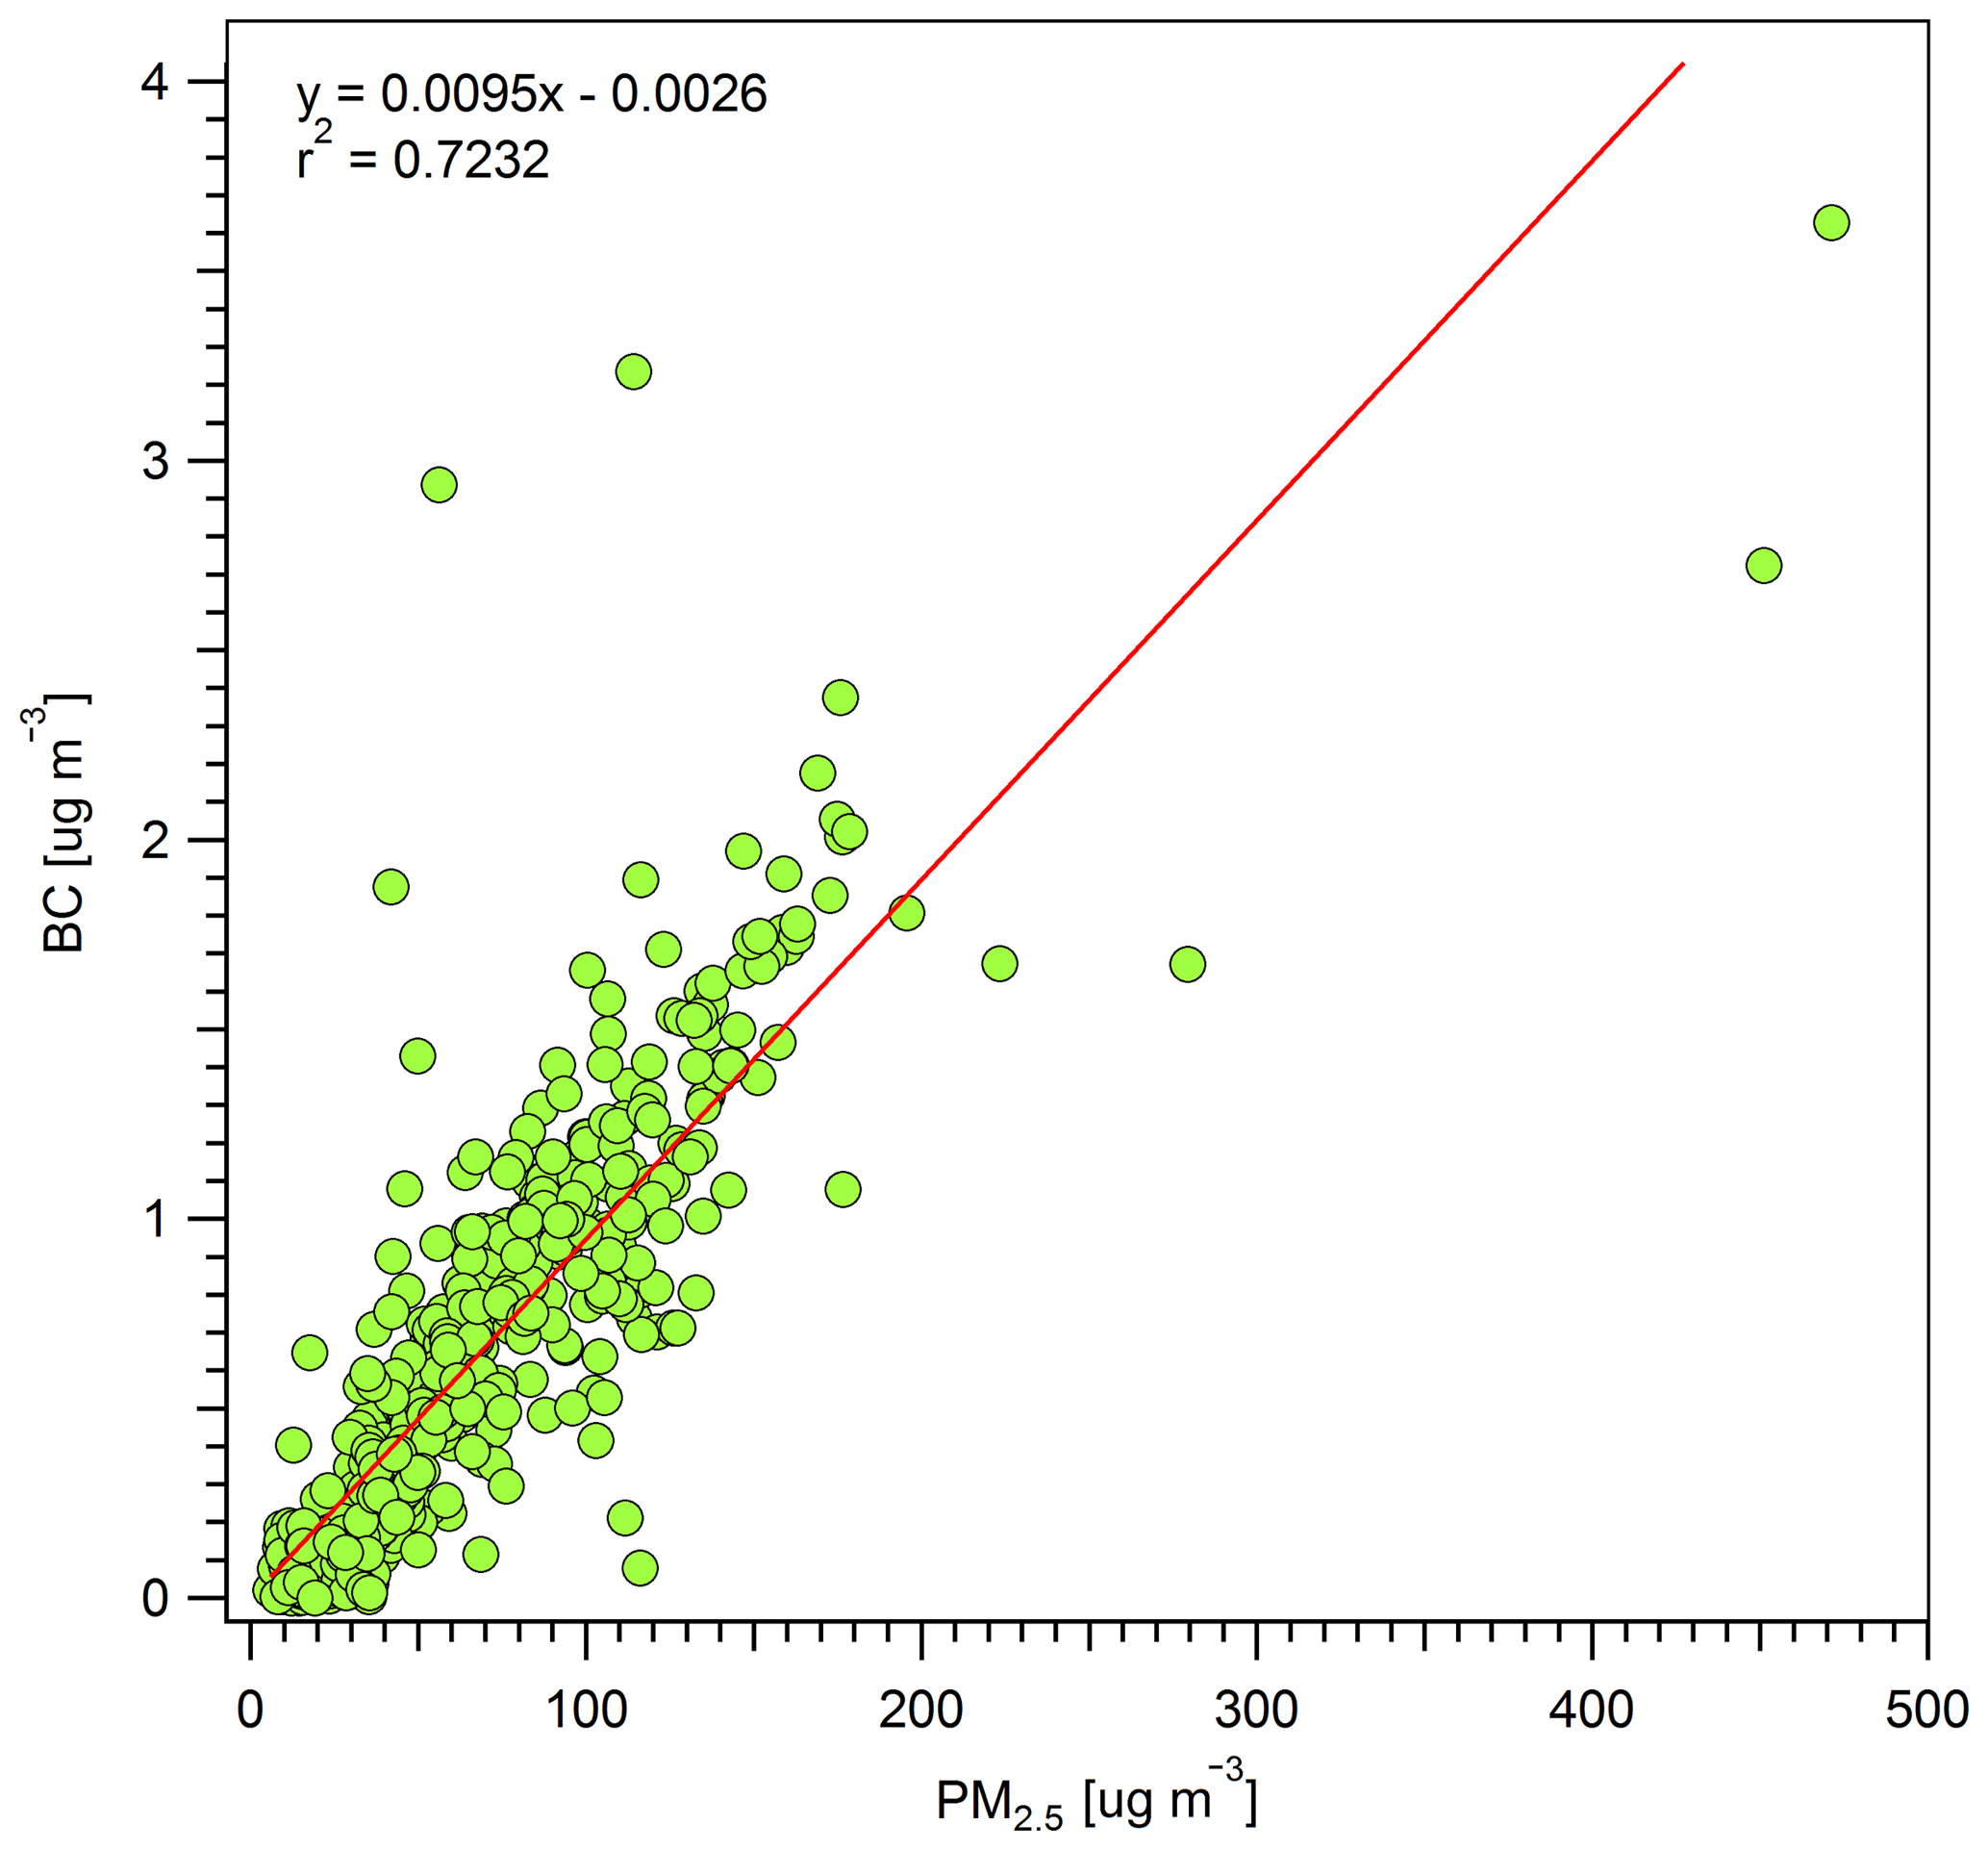
The climate impacts of smoke are strongly related to the ΔBC∕ΔPM ratio and also the SSA and BrC, which are described in more detail in other sections. The ΔBC∕ΔPM ratio also allows for a rough estimate of ambient BC from ambient PM data when BC is not measured, but caution is needed since PM may not be conserved as long as BC, and ΔBC∕ΔPM is also variable at the source. Our study-average ΔBC∕ΔPM2.5 ratio (0.0095; Fig. 3) is higher than the study-average ΔBC∕ΔPM1.0 in Liu et al. (2017, 0.006) but falls within the range observed for two wildfires measured in Liu et al. (2017), despite the differences in measurement techniques (PM2.5 versus PM1.0, etc.). It's possible that the ΔBC∕ΔPM ratio reported in this study is up to ∼ 30 % too high if we consider the effects of coating on BC and lensing as a positive error (Pokhrel et al., 2017). Previous studies found that smoldering combustion emits anywhere between 2–49 times more PM than flaming combustion (Jen et al., 2019; Kim et al., 2018; Reisen et al., 2018; Yokelson et al., 2013a), so the combination of our ΔBC∕ΔCO ratio that is indicative of more smoldering combustion and a BC/PM ratio that is similar to or slightly above measurements closer to fire sources (Liu et al., 2017) again suggests that some net evaporation of PM is occurring at lower, warmer altitudes during transport between the wildfire sources and our surface site. Reduced light levels at night or in thick plumes could delay secondary aerosol formation in wildfire smoke. Again, this is worth more study since this could modify air quality and health effects.
OA is the main component of wildfire PM, and the ΔBC∕ΔPM ratio is likely similar to the ΔBC∕ΔOA ratio. Our ΔBC∕ΔPM ratio (∼ 1 %) then suggests that the aerosol measured was overwhelmingly organic and thus strongly cooling, especially if the impact of BrC or lensing was small. Further, the mass absorption coefficient (MAC) for OA scales with the ΔBC∕ΔOA ratio (Saleh et al., 2014), so we anticipate a low MAC, which is explored more next.
3.4 UV absorption by brown carbon
While the attribution of BrC is not exact and varies across studies (Pokhrel et al., 2017), BrC absorption will offset the climate cooling calculated for purely scattering OA depending on the amount emitted, its MAC, and its lifetime (Feng et al., 2013). One field study of BrC lifetime suggests a significant decrease of BrC over the course of a day but a prolonged persistence of BrC nonetheless (∼ 6 % above background even after 50 h following emission) (Forrister et al., 2015), and studies of relevant chemical mechanisms involving BrC have shown both increases and decreases (Lin et al., 2015; Liu et al., 2016; Xu et al., 2018). Satellite retrievals employing reasonable a priori aerosol layer heights indicate that BrC can have a strong impact in fresh BB plumes and a persistent significant impact in downwind regional haze (Jethva and Torres, 2011; Hammer et al., 2016). Here we present in situ data showing persistent widespread regional impacts of BrC. Table 3 lists the study-average AAE and percent contribution to absorption at 401 nm by BrC. We interpret our results by comparing them to the limited measurements of wildfire smoke in the lab and field and measurements for “flaming-dominated” savanna fires (Selimovic et al., 2018; Forrister et al., 2015; Eck et al., 2013). Theoretically, aerosol absorption that is dominated by black carbon would have an AAE close to 1.0 (Bergstrom et al., 2002; Bond and Bergstrom, 2006; Bergstrom et al., 2007), which is the case in Eck et al. (2013), who report an average AAE of 1.20 for measurements of savannah fires in southern Africa. On the other hand, Selimovic et al. (2018) and Forrister et al. (2015) calculated AAEs for fresh smoke of 3.31 and 3.75, respectively, for various mixed coniferous fuels burned in a laboratory and in the field. Our study-average AAE (1.96±0.38) is almost 2 times lower than the average value recommended for fresh wildfire smoke (∼ 3.5) in Selimovic et al. (2018) but higher than that reported in Eck et al. (2013). This is also the case for the percent contribution to absorption at 401 nm by BrC, where a lower AAE corresponds to lower BrC absorption. The AAE recommended for fresh wildfire smoke implies the % absorption by BrC at 401 nm is close to 86 %, but we still see significant (∼ 50 %) absorption by BrC at 401 nm, on average, despite some aging of the smoke at our site.
Table 3Time-weighted study-average AAE and % BrC contribution compared to other studies.
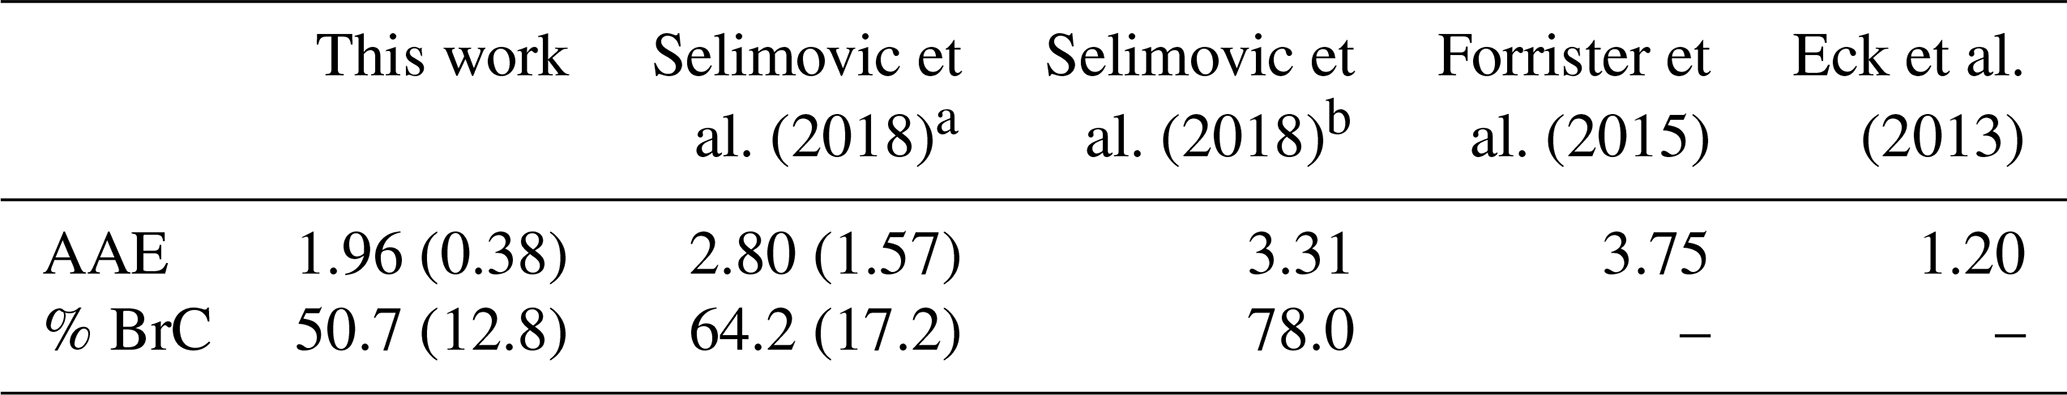
a Measured lab values at lab fire MCE. b Calculated from average wildfire MCE reported in Liu et al. (2017).
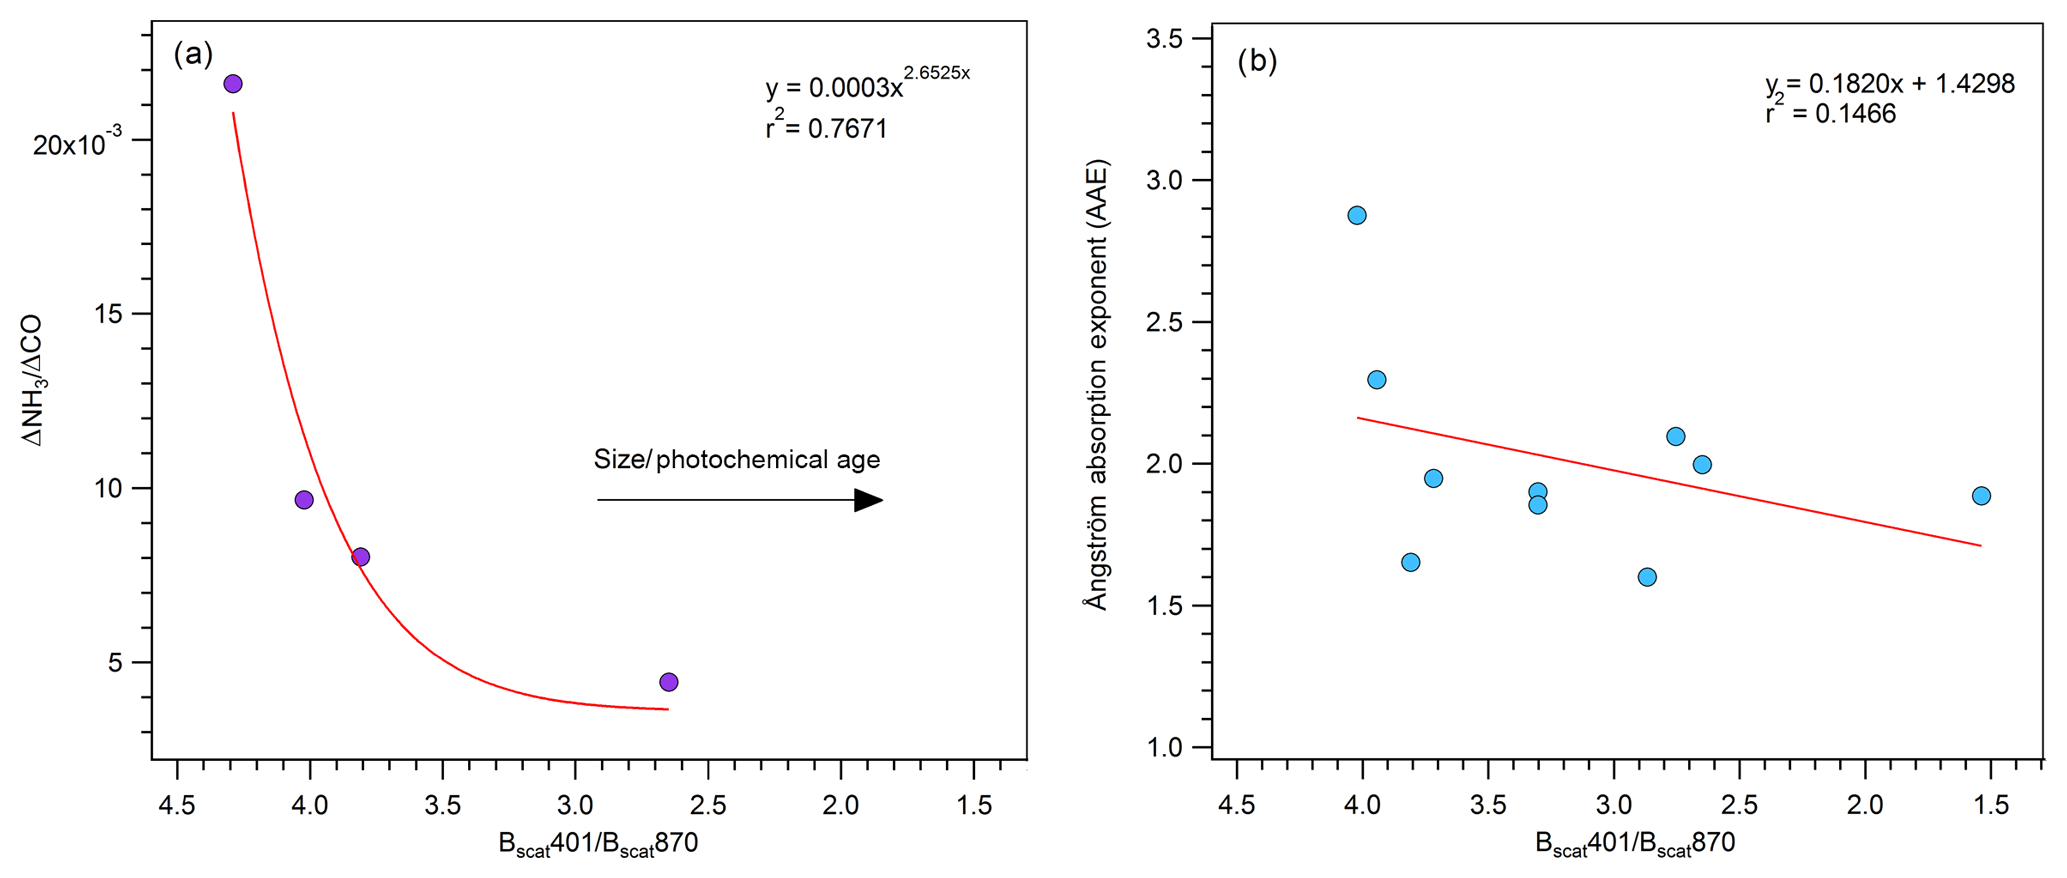
Figure 4(a) Plot of the peak-integrated ΔNH3∕ΔCO ratio versus our size and age proxy (401 scattering/870 scattering) for smoke impacts that have an ΔNH3∕ΔCO ratio. (b) Plot of the peak-integrated absorption Ångström exponent versus our size and age proxy (401 scattering/870 scattering) when both PAXs were operational.
Although we cannot determine precise smoke ages in this study, we can construct an analysis of our data that probes the trend in AAE and % absorption by BrC with aging. We start by noting that Mie scattering calculations (John Walker, personal communication, 2017) imply that the ratio of Bscat401∕Bscat870 should decrease as average particle size increases (e.g., Schuster et al., 2006; Eck et al., 1999; Kaufman et al., 1994), and average particle size is well known to increase with particle age (Akagi et al., 2012; Eck et al., 2013; Capes et al., 2008; Carrico et al., 2016). We also show in Fig. 4a that the ΔNH3∕ΔCO ratio decreases with Bscat401∕Bscat870, and we know NH3∕CO decreased with aging with a ∼ 5 h half-life in the fall and under slower photochemical conditions in Table 2 in Akagi et al. (2012). Thus, the range in Bscat401∕Bscat870 shown in Fig. 4a represents about 10 h of daytime aging. We also see a weak trend but significant decrease in AAE over a similar range of our size and age parameter in Fig. 4b. Our data for AAE versus a proxy for average age of mixed-age smoke are more variable than the AAE versus known transport time for a single plume in Forrister et al. (2015) but still support a similar conclusion: the net effect of BrC aging is a substantial decrease in AAE over the course of ∼ 10 h of aging.
We also speculate that, in addition to aging, the time of day that smoke is formed may impact BrC and AAE. We motivate that hypothesis next and then explore the issue in subsequent sections. Selimovic et al. (2018) showed that BrC accounted for most of the absorption at 401 nm when MCEs were in a low range associated with dominant smoldering combustion. Benedict et al. (2017) further observed that smoke impacts from a nearby wildfire had a much higher smoldering to flaming ratio at night than during the day, which then suggests the potential for increased BrC formation at night (Saide et al., 2015). It is also known that smoldering combustion of biomass emits many precursors, including monoterpenes, furans, and cresol (Stockwell et al., 2015), which can react quickly with the major nighttime oxidant, NO3, and ostensibly form UV-absorbing organic nitrates that could augment BrC. In fact, estimates using current data strongly suggest that a substantial nighttime secondary BrC source could exist. The EF for primary organic aerosol (POA) produced by BB typically ranges from 3 to 30 g kg−1 (May et al., 2014; Liu et al., 2016, 2017). The EF for known plus unidentified non-methane organic gases (NMOGs) with intermediate to low volatility ranges from 3 to 100 g kg−1. Converting even a small percentage of the co-emitted NMOGs that are known to react quickly with NO3 could yield substantial amounts of BrC and build up a reservoir of BrC during dark hours. Once daytime commences, other studies show that some types of BrC, depending on the precursor, can experience rapid photochemical degradation or formation via both direct photolysis and oxidation (Zhao et al., 2015; Lee et al., 2014; Zhong and Jang, 2014; Sareen et al., 2010). In summary, our extensive in situ measurements show that even after 1–2 days of aging, BrC remains a significant component of ambient smoke and that the climate properties of the regional haze have a non-BC absorption contribution. However, the details of the formation and lifetime of BrC are complicated and probably vary diurnally.
3.5 Single scattering albedo, mass absorption coefficient, mass scattering coefficient
This section starts with an important reminder/caveat. Our scattering and absorption data are measured for particles up to 1.0 µm, but the PM mass reported by the Missoula DEQ site includes particles up to 2.5 µm. Thus, using our data to calculate mass absorption coefficients (MACs) and mass scattering coefficients (MSCs) will produce lower limit values that are not directly comparable to those obtained when the range for both optical and mass measurements goes up to 2.5 µm. Nevertheless it is potentially useful to link PM1.0 and PM2.5 measurements since measurements at 1 µm cutoffs are common in field campaigns, but PM2.5 still remains the common measurement in regional networks.
Our MAC and MSC values were calculated by plotting 1 h averages of Bscat401, Babs401, Bscat870, and Babs870 versus the 1 h PM2.5 values to calculate an MSC(401), MAC(401), MSC(870), and MAC(870), respectively (Fig. S1). Values at other wavelengths were calculated with a power law fit using the calculated averages (Table 4). Our (ΔPM1.0∕ΔPM2.5) MSC values are lower than those reported for PM2.5/PM2.5 but still potentially useful. For instance, the ΔPM1.0∕ΔPM2.5 MSC at 870 nm is one to a good approximation, which suggests a convenient way to estimate PM2.5 directly from PAX-870 scattering data. Using a 1 µm cutoff probably isolated the combustion-generated OA and BC pretty well, but dust, ash, and biological particles can be physically entrained in wildfire plumes (Formenti et al., 2003; Gaudichet et al., 1995; Hungershoefer et al., 2008). The particles in the 1.0–2.5 µm range are a small part of the total mass in smoke emissions (Reid et al., 2005a), but they contribute disproportionately to the scattering. The additional absorption that we might have measured with a 2.5 µm cutoff may be less significant. Our study-average MAC at 401 nm is only 0.19±0.08 m2 g−1, consistent with a low BC ∕ OA ratio (Saleh et al., 2014).
SSA, AAE, and SAE are commonly used to calculate aerosol absorption and scattering in models and satellite retrievals (Ramanathan et al., 2001; McComiskey et al., 2008). Uncertainty in the SSA is one of the largest sources of uncertainty in estimating the radiative effect of aerosols (Jiang and Feingold, 2006; McComiskey et al., 2008). Some models and satellite (e.g., MODIS) retrievals assume a constant value of SSA for fire aerosol throughout the biomass burning season and the entire year, which may be an inaccurate approach. Eck et al. (2013) found an increase in SSA at 550 nm from 0.81 in July to 0.88 in October in southern Africa. In Fig. 5 we present evidence for an increase in the SSA for moderately aged wildfire smoke over a prolonged period of biomass burning. While we did not directly measure SSA at 550 nm, we did measure SSA at 870 nm for the duration of the sampling period and SSA at 401 nm for the duration that the PAX 401 was operational. Figure 5 shows a moderate increasing trend in the SSA at 870 nm but no significant trend in the SSA at 401 nm. It could be that because the sampling period of the PAX 401 nm only covers ∼ 2 weeks, any trend that may be present is not apparent within this time frame. Table 4 shows our study-average SSA at 870 and 401 nm, both of which are ∼ 0.93, which is similar to the SSA reported at 550 nm in McMeeking et al. (2005b) of 0.92. Our SSA and the SSA reported in McMeeking et al. (2005b) are higher than the sometimes quoted typical surface SSA of the earth (∼ 0.9; Praveen et al., 2012), which suggests that the wildfire PM1.0 in regional haze would contribute to regional cooling (Thornhill et al., 2018; Kolusu et al., 2015). Conversely, an SSA range like that reported in Eck et al. (2013) could contribute to warming, which could potentially contribute to a positive-feedback cycle associated with biomass burning (Jacobsen, 2014).
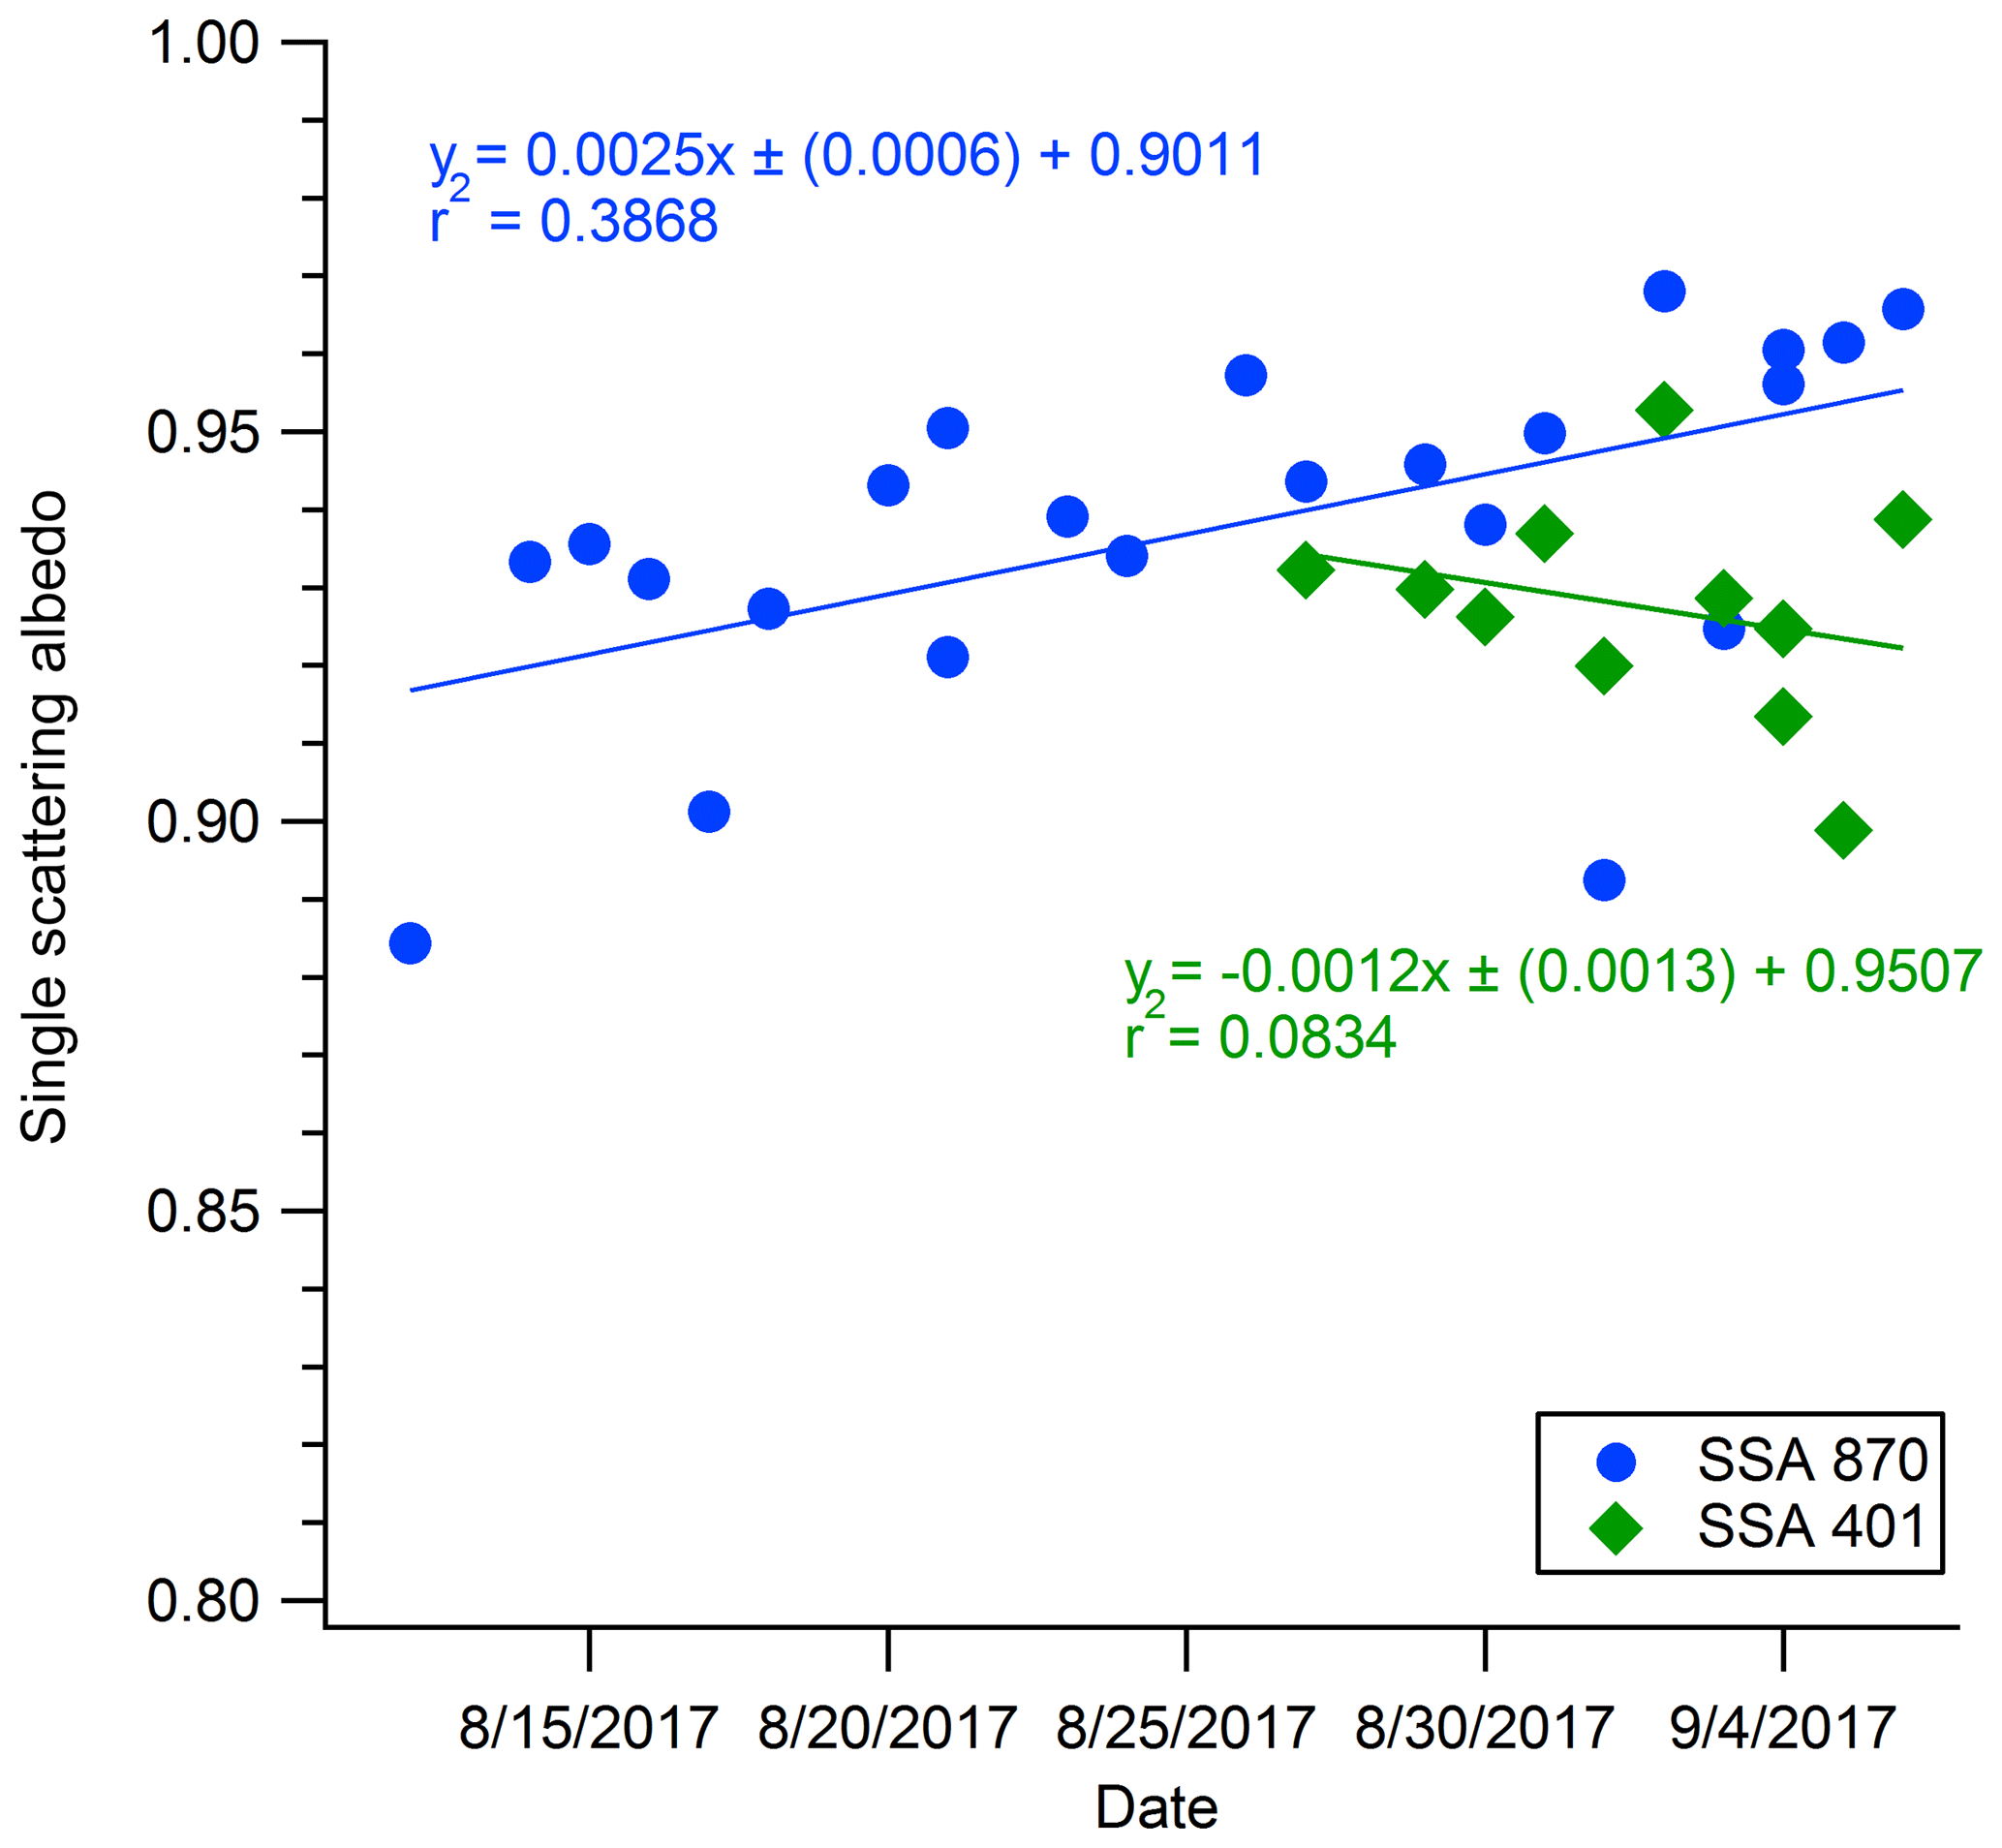
Figure 5Plot of single scattering albedo over the course of the ambient smoke-monitoring period. Points represent SSA from absorption and scattering integrated over smoke-impacted events.
Table 4Time-weighted study-average SSA, MAC, and MSC compared to other works.

a In this work MAC and MSC values are PM1.0 absorption and scattering divided by PM2.5 mass, and values between 401 and 870 nm are obtained from power law fits. b Measured values at lab fire MCE. c Calculated from EF versus MCE fit based on average wildfire MCE reported in Liu et al. (2017). d McMeeking et al. (2005b). e McMeeking et al. (2005a).
3.6 Case study: Labor Day weekend
Figure 6 highlights our data for Labor Day weekend (LDW), spanning ∼ 50 h from 4 to 5 September 2017. We focus on this time period because it includes the largest impacts in Missoula, a regional smoke-production episode detected as far downwind as Europe (An American Aerosol in Paris, 2019; Ansmann et al., 2018), and an opportunity to compare what is likely smoke from one fire, subjected to different processing scenarios. Peak “V” is smoke that was likely primarily produced at night and transported to Missoula at night before subsequent photochemistry and dilution in the Missoula Valley. In contrast, peak “W” is smoke that was likely produced and transported during the day before aging in Missoula. Surface winds observed coming from the east, our back trajectory calculations, and satellite observations along with the high concentration values of peak V all imply that the smoke was mostly sourced from a local fire (Rice Ridge) and about 2–4 h old. Our peak-integrated proxy for particle size (4.02, smaller particle size) and the peak-integrated ΔNH3∕ΔCO ratio () for peak V suggest that the smoke retained fairly fresh characteristics even factoring in the daytime tail on the peak (Table S2). The peak integrated AAE (2.88) is the highest observed value for AAE from this study for any peak for which an AAE could be derived. The same is true for the %401 absorption by BrC (∼ 77 %). The UV absorption results are within the range observed for fresh smoke reported in Selimovic et al. (2018) and reiterated again earlier in Table 3, which lists average AAE values for fresh smoke between 2.80 and 3.75 (Forrister et al., 2015). Average values for %401 absorption by BrC in fresh smoke ranged between 64 % and 86 % (Selimovic et al., 2018), and again our integrated result for peak V falls in this range. In summary, the moderately aged, strongly night-influenced peak has properties not inconsistent with significant amounts of BrC due to smoldering combustion or substantial nighttime BrC formation via reactions with NO3 or O3.
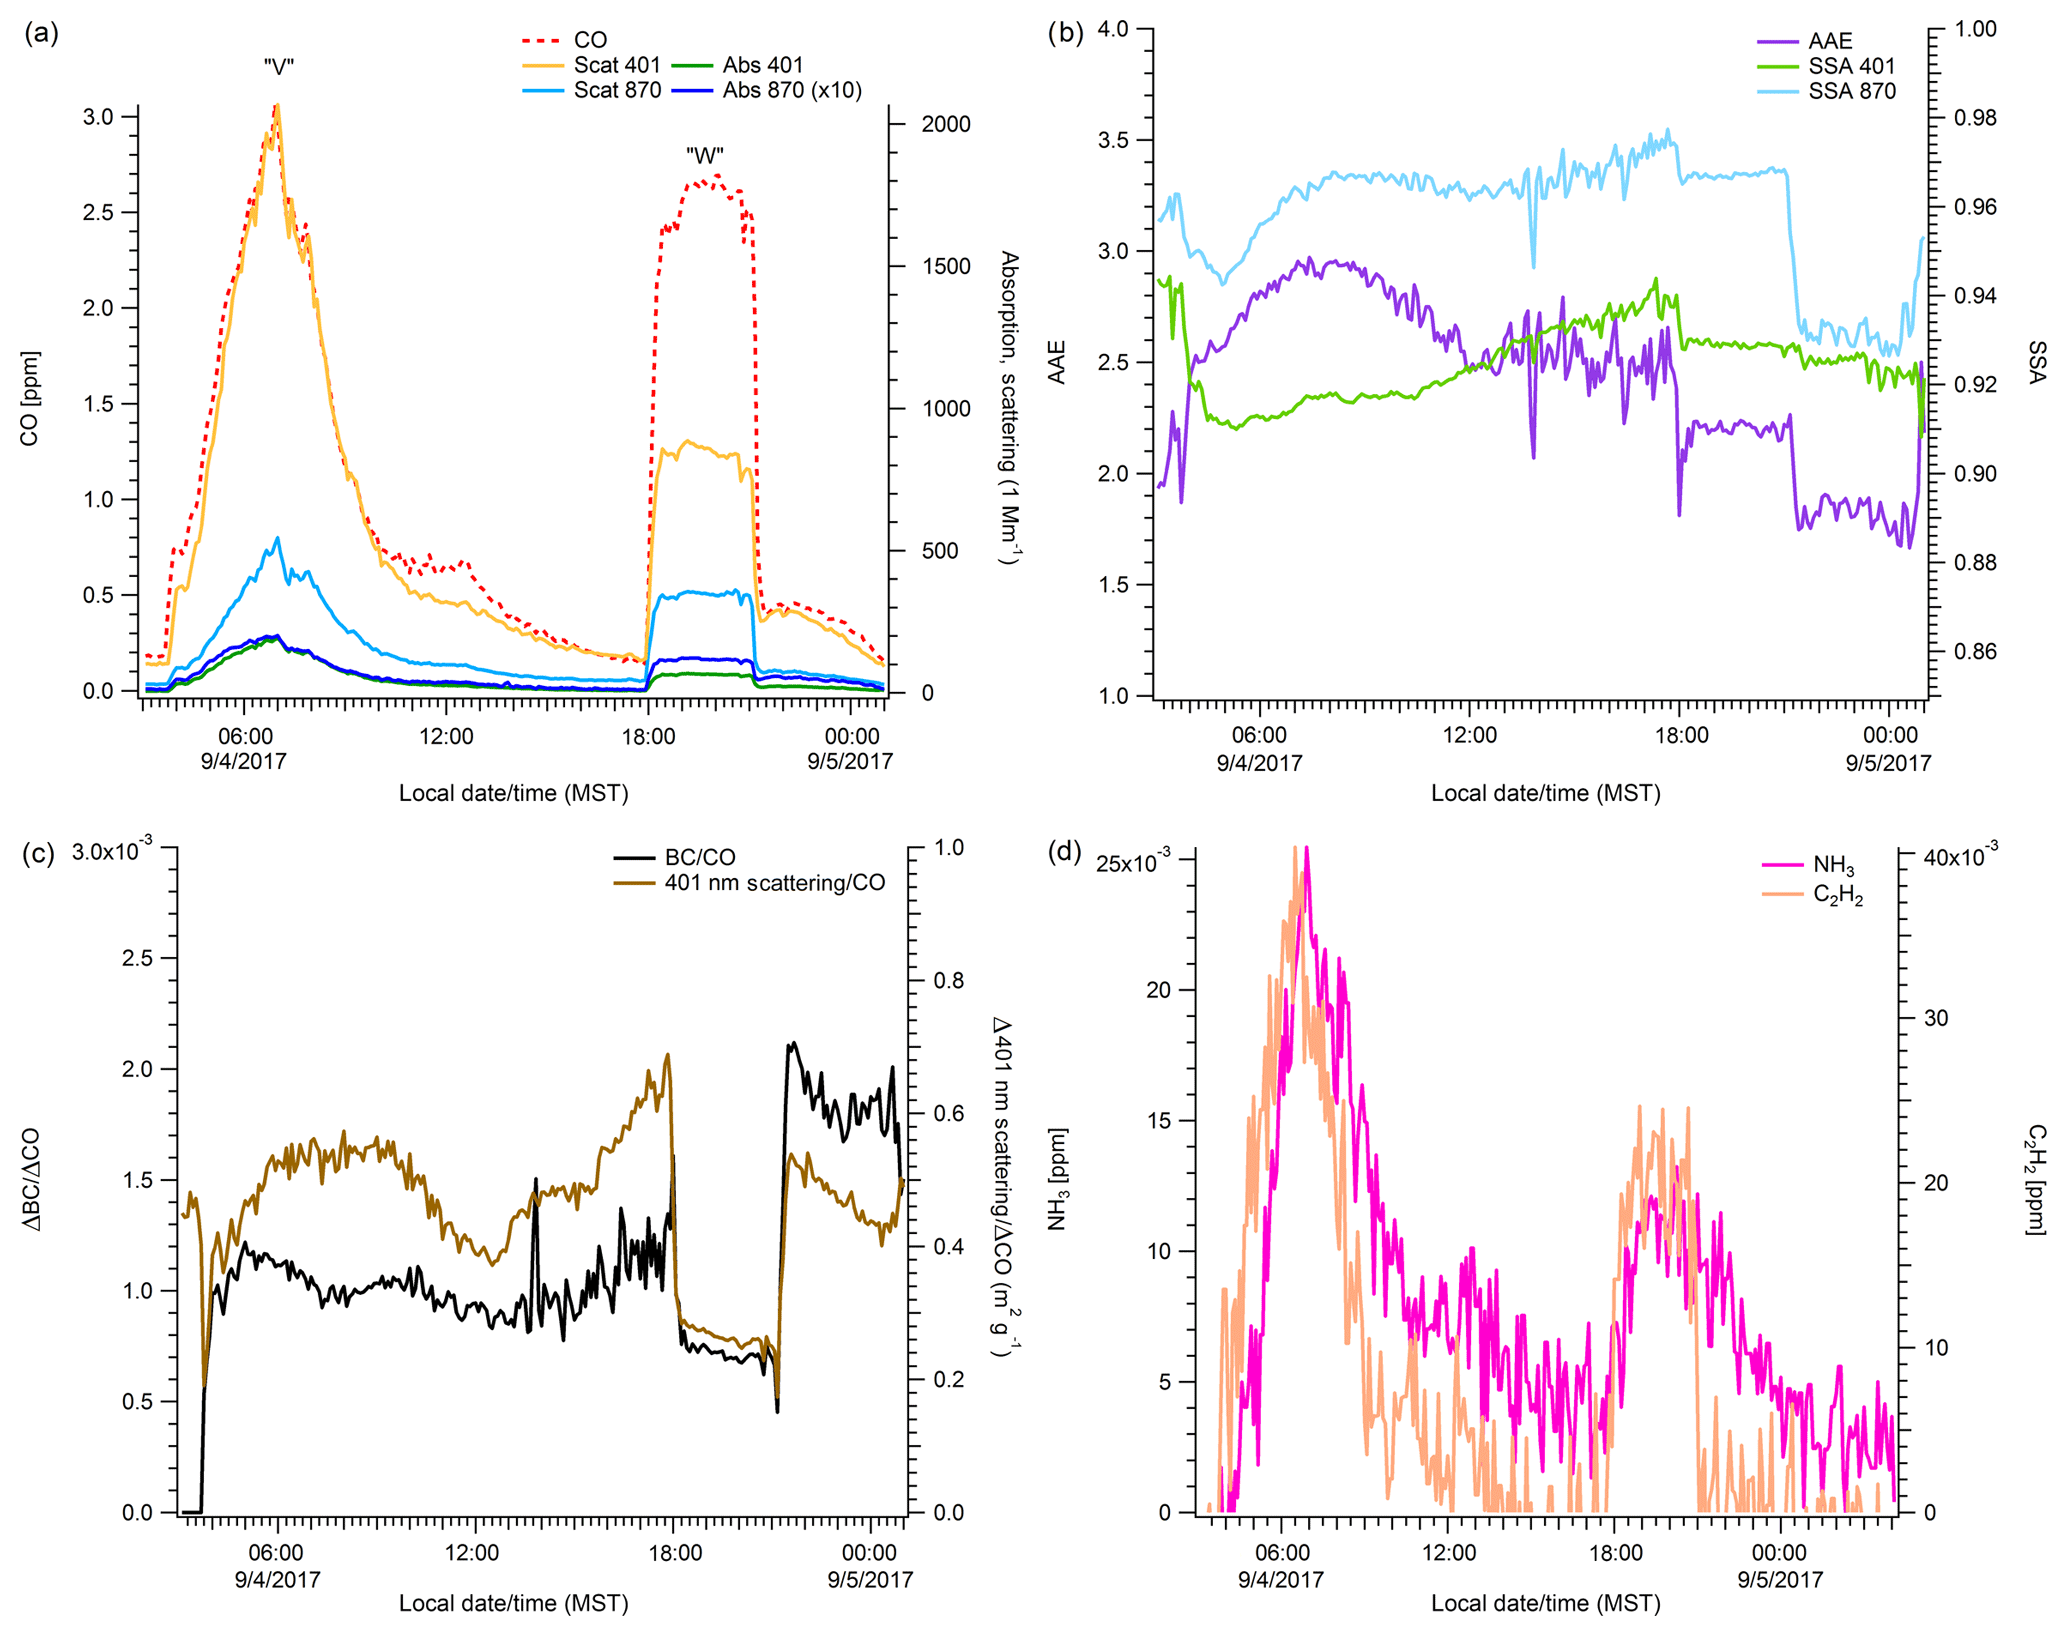
Figure 6High-resolution (5 min) time series of smoke impacts measured in Missoula over Labor Day weekend (see Sect. 3.6).
While not readily apparent via satellite observations due to stacked smoke layers, our back trajectory calculations, a similar peak shape on an upwind monitor, visual observations of a wall of smoke arriving from the northeast, and high concentrations of PM at the Missoula measuring site strongly suggest that peak W, with an onset in the early evening, also mostly came from the Rice Ridge Fire as daytime produced/processed smoke. Peak W has a 401∕870 scattering ratio (2.65) that implies larger particle sizes and an ΔNH3∕ΔCO ratio (0.0044) that is ∼ 50 % that of Peak V. The ratio of ΔC2H4∕ΔCO decreases by ∼ 30 % from peak V to peak W. The AAE for peak W is 2.00, which is ∼ 30 % less than the AAE for Peak V, and corresponds to a lower %401 absorption by BrC for the evening-onset peak (∼ 54 %). Taken together, these values imply larger particles and more photochemically aged smoke. Interestingly, the ratios of ΔCH4∕ΔCO and ΔBC∕ΔCO are essentially similar for peaks V and W. This implies the flaming to smoldering ratio at the source for these events was similar (NO3 chemistry could still have been more important for peak V). While nighttime wildland fire combustion may normally be more smoldering-dominated, LDW was marked by an unusual lack of nighttime RH recovery and an aggressive doubling of the fire size. Thus data from a different, more typical period are likely needed to probe diurnal differences in fresh smoke.
3.7 Diurnal cycles
Diurnal cycles of smoke measured in Missoula provide some insight into regional meteorological effects and have some potential to further probe the day versus night flaming to smoldering issues raised in the previous section (Sect. 3.6). There is, however, a variable delay from production to receptor. Figure 7 shows the diurnal cycle of CO and the average hourly PM2.5 measured across the entirety of the smoke sampling period. Levels of CO and PM2.5 peak together from about 05:00 to 11:00, which is consistent with increased smoldering at night but would also reflect the mixed layer height. Figure 8 shows the diurnal cycles of PM2.5, hourly average BC, and hourly average %401 absorption by BrC (27 August to 10 September 2017). In this case we see that potential BrC absorption peaks in the early morning while BC peaks in the evening. One possible explanation for this is that despite variation in mixed layer height, there is typically an increase in the flaming to smoldering ratio that produces more black carbon and less brown carbon during the day. If nearby (less diluted) fires with shorter transport times strongly influence the peak times, a signal of diurnal variation at the source could be partially evident at our site. However, we cannot rule out that an increase in photo-bleaching throughout the middle of the day impacts the peak position for absorption by BrC, but even then, the absorption by BrC remains about half of the absorption at 401 nm on average.
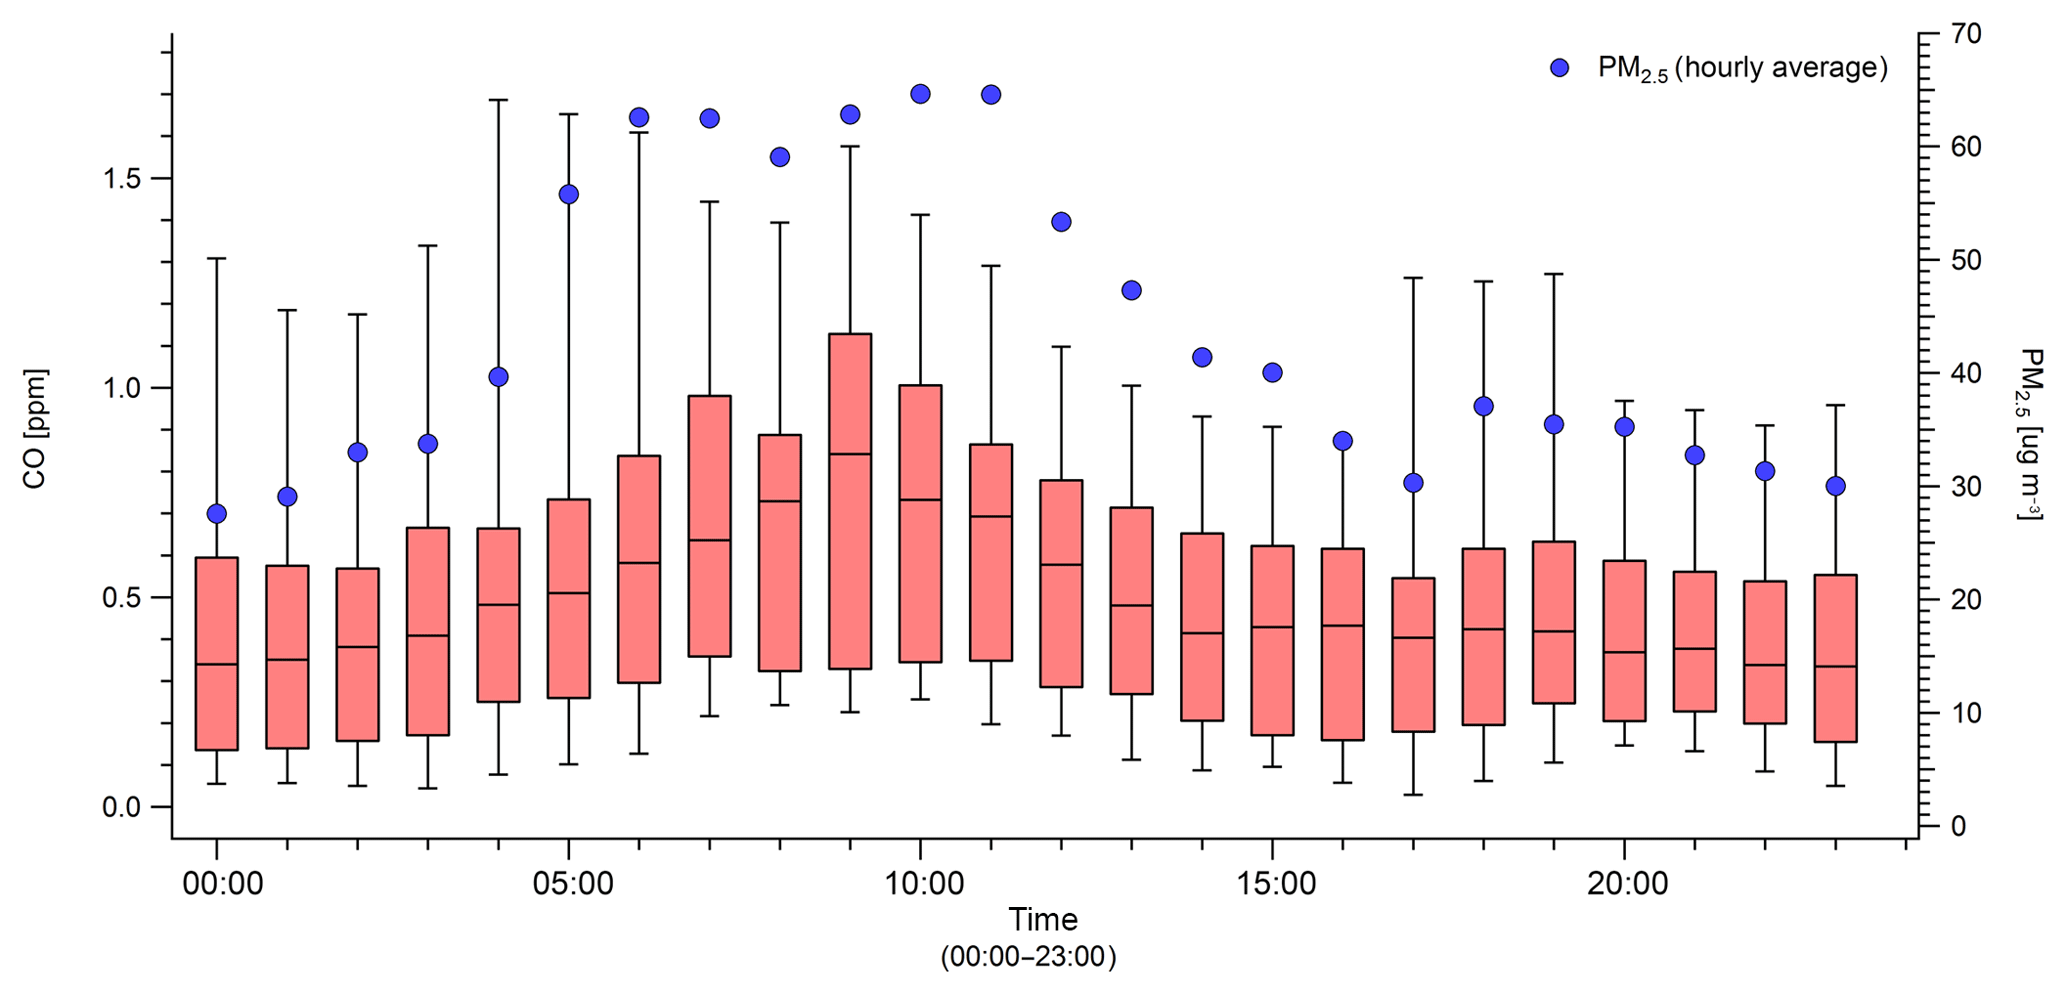
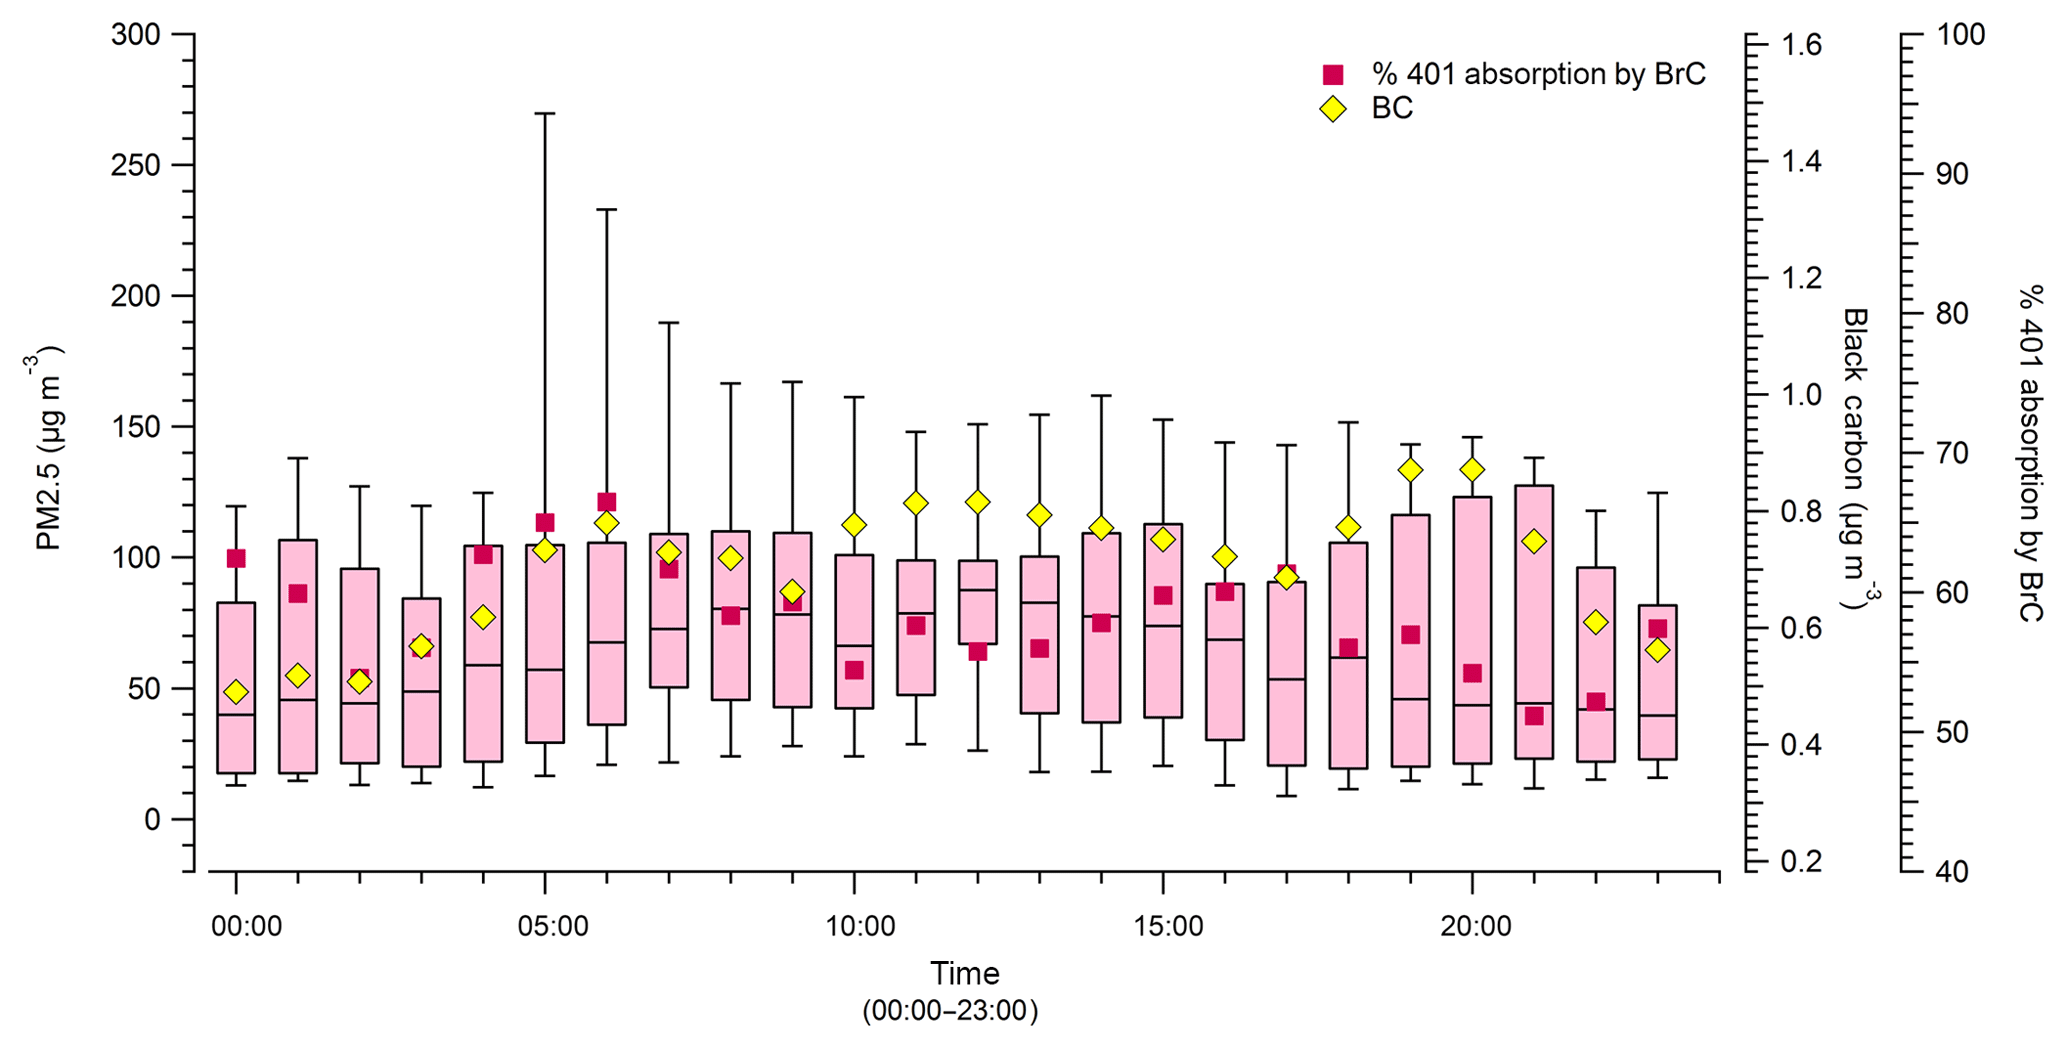
Figure 8Diurnal plot of average PM2.5, hourly average %401 absorption by BrC, and hourly average BC. BC and PM shown for the entirety of the monitoring period but %401 absorption by BrC only shown for when the PAX 401 was operational.
3.8 Brief comparison to prescribed fire data
Of the 718 h we sampled during August and September 2017, 500.5 h were part of a smoke event, which is close to three-quarters (∼ 70 %) of the total monitoring time period. Of the total 718 h of monitoring, over half (56 %) violated the National Ambient Air Quality Standards (NAAQS) for allowable PM2.5 averaged over 24 h (35 µg m−3). The hourly average for the entire sampling period of ∼ 54 µg m−3 of PM2.5 is an average exceedance of the 24 h NAAQS standard by 42 %. One possible approach to minimizing wildfire air-quality impacts is preemptive prescribed burning. Prescribed fires reduce hazardous fuels, burn less fuel per unit area, make less smoke per unit fuel consumption, and can be ignited when conditions are favorable for minimizing air quality impacts (Liu et al., 2017).
Table 5Comparison of wildfire emission/enhancement ratios to prescribed fire emission ratios (g g−1).
a Average of Rim Fire and Big Windy Complex. BC data were analyzed for Liu et al. (2017) study but not reported. b PM values reported are PM1.0. c Values for the Shaver and Turtle fires (prescribed burns).
It is of interest to compare our large sample of ambient wildfire data to the comparatively rare data from airborne wildfire studies and prescribed fire data to see if our large sample size supports the earlier (Liu et al., 2017) conclusions regarding the nature of the smoke and emissions. More strongly supported conclusions can reinforce the land management implications. Table 5 lists the ΔBC∕ΔCO, ΔBC∕ΔPM, and ΔPM∕ΔCO ratios for our ambient wildfire study, the airborne wildfire study from Liu et al. (2017), and prescribed fire values reported in May et al. (2014). The ΔPM∕ΔCO values for fresh wildfire smoke in Liu et al. (2017) and aged wildfire smoke (this study) are about 3 and 1.5 times higher than ΔPM∕ΔCO for fresh smoke from prescribed fires in May et al. (2014) when comparing to all their US prescribed fires (Table 5). For only prescribed fires in western US mountain coniferous ecosystems (last column Table 5), the ΔPM∕ΔCO for fresh smoke is close to our value for aged wildfire smoke. However, May et al. (2015) noted that ΔPM∕ΔCO decreased by about a factor of 2 after several hours of aging on at least one prescribed fire.
The ΔBC∕ΔCO for prescribed fires is higher than the wildfire average by a factor of ∼ 9 (all prescribed fires) or ∼ 4 (last column), roughly suggesting a higher MCE for prescribed fires. Ignoring smoke age, the ΔBC∕ΔPM for prescribed fires is higher than the wildfire average by a factor of ∼ 20 (all prescribed fires) or ∼ 6 (last column). The ΔBC∕ΔPM observations suggest that wildfire smoke is overwhelmingly more organic, which is important partly because many optical properties scale with the BC ∕ OA ratio (Saleh et al., 2014). In general, our ground-based wildfire study confirms the earlier airborne indications that prescribed fires are less smoky but also less cooling than wildfires. Differences in smoke production and chemistry between wild and prescribed fires should be researched more and have air quality and land management implications.
A major, prolonged wildfire smoke and haze episode impacted the NW US and SW Canada during August through September of 2017. During this episode, we collected over 500 h of data characterizing smoke and haze properties with a FTIR and PAXs at 870 and 401 nm at a ground-based site in Missoula, Montana. This is probably the most extensive real-time data on wildfire smoke properties to date. Our low ΔBC∕ΔPM (0.0095±0.0005) ratio confirmed the overwhelmingly organic nature of the smoke observed in the airborne studies of wildfire smoke to date. Our ΔBC∕ΔCO ratio (0.0012±0.0005) for our ground site was moderately lower than observed in aircraft studies, suggesting a relatively larger contribution from smoldering combustion. Despite our lower ΔBC∕ΔCO ratio our ΔPM∕ΔCO ratio was about half that measured in fresh smoke from aircraft. Taken together with aircraft measurements in aged wildfire smoke, this suggests that OA evaporation, at higher ambient temperatures nearer the surface, may typically reduce wildfire PM air quality impacts on the timescale of several hours to days. Bscat401∕Bscat870 was used as a proxy for size and age of the smoke particles, with this interpretation being supported by the trace gas data. The size and age proxy implied that AAE decreased significantly after about 10 h of smoke aging, consistent with the single BrC lifetime measurement in an isolated plume. The results clearly show that non-BC absorption can be important in “typical” regional haze and moderately aged smoke with BrC accounting for about half the absorption at 401 nm on average for the entire data set. The diurnal trends show BrC, PM, and CO peaking in the early morning and BC peaking in the early evening. Over the course of 1 month, the SSA at 870 nm increased from ∼ 0.9 to ∼ 0.96.
Raw data used to derive ERs and other quantities reported that are not included in the supplement can be obtained by contacting the corresponding author.
The supplement related to this article is available online at: https://doi.org/10.5194/acp-19-3905-2019-supplement.
VS and RJY conducted the UM measurements and the data analysis. VS, RJY, GRM, and SC contributed to the discussion and interpretation of the results and writing of the manuscript.
The authors declare that they have no conflict of interest.
Vanessa Selimovic and Robert J. Yokelson were supported by the NSF grants AGS-1748266 and AGS-1349976, NOAA-CPO grant NA16OAR4310100, and NASA grant NNX13AP46G to UM. Gavin R. McMeeking was supported by the NOAA-CPO grant NA16OAR4310109. Purchase and preparation of the PAXs was supported by NSF grant AGS-1349976 to Robert J. Yokelson. We thank John Walker for providing us with Mie scattering calculations.
This paper was edited by Ilona Riipinen and reviewed by three anonymous referees.
Adetona, O., Reinhardt, T. E., Domitrovich, J., Broyles, G., Adetona, A. M., Kleinman, M. T., Ottmar, R. D., and Naeher, L. P.: Review of the health effects of wildland fire smoke on wildland firefighters and the public, Inhal. Toxicol., 28, 95–139, https://doi.org/10.3109/08958378.2016.1145771, 2016.
Akagi, S. K., Yokelson, R. J., Wiedinmyer, C., Alvarado, M. J., Reid, J. S., Karl, T., Crounse, J. D., and Wennberg, P. O.: Emission factors for open and domestic biomass burning for use in atmospheric models, Atmos. Chem. Phys., 11, 4039–4072, https://doi.org/10.5194/acp-11-4039-2011, 2011.
Akagi, S. K., Craven, J. S., Taylor, J. W., McMeeking, G. R., Yokelson, R. J., Burling, I. R., Urbanski, S. P., Wold, C. E., Seinfeld, J. H., Coe, H., Alvarado, M. J., and Weise, D. R.: Evolution of trace gases and particles emitted by a chaparral fire in California, Atmos. Chem. Phys., 12, 1397–1421, https://doi.org/10.5194/acp-12-1397-2012, 2012.
Akagi, S. K., Yokelson, R. J., Burling, I. R., Meinardi, S., Simpson, I., Blake, D. R., McMeeking, G. R., Sullivan, A., Lee, T., Kreidenweis, S., Urbanski, S., Reardon, J., Griffith, D. W. T., Johnson, T. J., and Weise, D. R.: Measurements of reactive trace gases and variable O3 formation rates in some South Carolina biomass burning plumes, Atmos. Chem. Phys., 13, 1141–1165, https://doi.org/10.5194/acp-13-1141-2013, 2013.
An American Aerosol in Paris: https://earthobservatory.nasa.gov/images/90980/an-american-aerosol-in-paris, last access: 14 February 2019.
Ansmann, A., Baars, H., Chudnovsky, A., Mattis, I., Veselovskii, I., Haarig, M., Seifert, P., Engelmann, R., and Wandinger, U.: Extreme levels of Canadian wildfire smoke in the stratosphere over central Europe on 21–22 August 2017, Atmos. Chem. Phys., 18, 11831–11845, https://doi.org/10.5194/acp-18-11831-2018, 2018.
Benedict, K. B., Prenni, A. J., Carrico, C. M., Sullivan, A. P., Schichtel, B. A., and Collett Jr., J. L.: Enhanced concentrations of reactive nitrogen species in wildfire smoke, Atmos. Environ., 148, 8–15, 2017.
Benjamin, S. G., Weygandt, S. S., Brown, J. M., Hu, M., Alexander, C., Smirnova, T. G., Olson, J. B., James, E., Dowell, D. C., Grell, G. A., Lin, H., Peckham, S. E., Smith, T. L., Moninger, W. R., Kenyon, J., and Manikin, G. S.: A North American Hourly Assimilation and Model Forecast Cycle: The Rapid Refresh, Mon. Weather Rev., 144, 1669–1694, https://doi.org/10.1175/MWR-D-15-0242.1, 2016.
Bergstrom, R. W., Russell, P. B., and Hignett, P: Wavelength dependence of the absorption of black carbon particles: predictions and results from the TARFOX experiment and implications for aerosol single scattering albedo, J. Atmos. Sci., 59, 567–577, https://doi.org/10.1175/1520-0469(2002)059<0567:WDOTAO>2.0.CO;2, 2002.
Bergstrom, R. W., Pilewskie, P., Russell, P. B., Redemann, J., Bond, T. C., Quinn, P. K., and Sierau, B.: Spectral absorption properties of atmospheric aerosols, Atmos. Chem. Phys., 7, 5937–5943, https://doi.org/10.5194/acp-7-5937-2007, 2007.
Bond, T. C. and Bergstrom, R.: Light absorption by carbonaceous particles: An investigative review, Aerosol Sci. Tech., 40, 27–67, https://doi.org/10.1080/02786820500421521, 2006.
Bond, T. C., Streets, D. G., Yarber, K. F., Nelson, S. M., Woo, J.-H., and Klimont, Z.: A technology-based global inventory of black and organic carbon emissions from combustion, J. Geophys. Res., 109, D14203, https://doi.org/10.1029/2003JD003697, 2004.
Bond, T. C., Doherty, S. J., Fahey, D.W., Forster, P. M., Berntsen, T., DeAngelo, B. J., Flanner, M. G.,Ghan, S., Kärcher, B., Koch, D., Kinne, S., Kondo, Y., Quinn, P. K., Sarofim, M. C., Schultz, M. G., Schulz, M., Venkataraman, C., Zhang, H., Zhang, S., Bellouin, N., Guttikunda, S. K., Hopke, P. K., Jacobson, M. Z., Kaiser, J. W. , Klimont, Z., Lohmann, U., Schwarz, J. P., Shindell, D., Storelvmo, T., Warren, S. G., and Zender, C. S.: Bounding the role of black carbon in the climate system: A scientific assessment, J. Geophys. Res., 118, 5380–5552, https://doi.org/10.1002/jgrd.50171, 2013.
Burling, I. R., Yokelson, R. J., Akagi, S. K., Urbanski, S. P., Wold, C. E., Griffith, D. W. T., Johnson, T. J., Reardon, J., and Weise, D. R.: Airborne and ground-based measurements of the trace gases and particles emitted by prescribed fires in the United States, Atmos. Chem. Phys., 11, 12197–12216, https://doi.org/10.5194/acp-11-12197-2011, 2011.
Capes, G., Johnson, B., McFiggans, G., Williams, P. I., Haywood, J., and Coe, H.: Aging of biomass burning aerosols over West Africa: Aircraft measurements of chemical composition, microphysical properties, and emission ratios, J. Geophys. Res., 113, D00C15, https://doi.org/10.1029/2008JD009845, 2008.
Carrico, C., Prenni, A., Kreidenweis, S., Levin, E., McCluskey, C., DeMott, P., McMeeking, G., Nakao, S., Stockwell, C., and Yokelson, R. J.: Rapidly evolving ultrafine and fine mode biomass smoke physical properties: Comparing laboratory and field results, J. Geophys. Res., 121, 5750–5768, https://doi.org/10.1002/2015JD024389, 2016.
Christian, T., Kleiss, B., Yokelson, R. J., Holzinger, R., Crutzen, P. J., Hao, W. M., Saharjo, B. H., and Ward, D. E.: Comprehensive laboratory measurements of biomass-burning emissions: 1. Emissions from Indonesian, African, and other fuels, J. Geophys. Res., 108, 4719, https://doi.org/10.1029/2003JD003704, 2003.
Collier, S., Zhou, S., Onasch, T.B., Jaffe, D. A., Kleinman, L., Sedlacek III., A. J., Briggs, N. L., Hee, J., Fortner, E., Shilling, J. E., Worsnop, D., Yokelson, R. J., Parworth, C., Ge, X., Xu, J., Butterfield, Z., Chand, D., Dubey, M. K., Pekour, M. S., Springston, S., and Zhang, Q.: Regional influence of aerosol emissions from wildfires driven by combustion efficiency: insights from the BBOP campaign, Environ. Sci. Technol., 50, 8513–8522, https://doi.org/10.1021/acs.est.6b01617, 2016.
Crutzen, P. J. and Andreae, M. O.: Biomass burning in the tropics: Impact on atmospheric chemistry and biogeochemical cycles, Science, 250, 1669–1678, https://doi.org/10.1126/science.250.4988.1669, 1990.
Draxler, R. R.: HYSPLIT4 user's guide, NOAA Tech. Memo. ERL ARL-230, NOAA Air Resources Laboratory, Silver Spring, MD, USA, 1999.
Draxler, R. R. and Hess, G. D.: Description of the HYSPLIT_4 modeling system, NOAA Tech. Memo. ERL ARL-224, NOAA Air Resources Laboratory, Silver Spring, MD, USA, 24 pp., 1997.
Draxler, R. R. and Hess, G. D.: An overview of the HYSPLIT_4 modeling system of trajectories, dispersion, and deposition, Aust. Meteor. Mag., 47, 295–308, 1998.
Eck, T., Holben, B. N, Reid, J., Dubovik, O., Smirnov, A., O'Neill, N., Slutsker, I., and Kinne, S: Wavelength dependence of the optical depth of biomass burning, urban, and desert dust aerosols, J. Geophys. Res., 104, 31333–31349, 1999.
Eck, T. F., Holben B. N., Reid, J. S., Mukelabai, M. M., Piketh, S. J., Torres, O., Jethva, H. T., Hyer, E. J., Ward, D. E., Dubovik, O., Sinyuk, A., Schafer, J. S., Giles, D. M., Sorokin, M., Smirnov, A., and Slutsker, I.: A seasonal trend of single scattering albedo in southern African biomass-burning particles: implications for satellite products and estimates of emissions for the world's largest biomass burning source, J. Geophys. Res.-Atmos., 118, 6414–6432, https://doi.org/10.1002/jgrd.50500, 2013.
Ervens, B., Turpin, B. J., and Weber, R. J.: Secondary organic aerosol formation in cloud droplets and aqueous particles (aqSOA): a review of laboratory, field and model studies, Atmos. Chem. Phys., 11, 11069–11102, https://doi.org/10.5194/acp-11-11069-2011, 2011.
Feng, Y., Ramanathan, V., and Kotamarthi, V. R.: Brown carbon: a significant atmospheric absorber of solar radiation?, Atmos. Chem. Phys., 13, 8607–8621, https://doi.org/10.5194/acp-13-8607-2013, 2013.
Formenti, P., Elbert, W., Maenhaut, W., Haywood, J., Osborne, S., and Andreae, M. O: Inorganic and carbonaceous aerosols during the Southern African Regional Science Initiative (SAFARI 2000) experiment: Chemical characteristics, physical properties, and emission data for smoke from African biomass burning, J. Geophys. Res., 108, 8488, https://doi.org/10.1029/2002JD002408, 2003.
Forrister, H., Liu, J., Scheuer, E., Dibb, J., Ziemba, L., Thornhill, K. L., Anderson, B., Diskin, G., Perring, A. E., Schwarz, J. P., Campuzano-Jost, P., Day, D. A., Palm, B. B., Jimenez, J. L., Nenes, A., and Weber, R. J.: Evolution of brown carbon in wildfire plumes. Geophys. Res. Lett., 42, 4623–4630, https://doi.org/10.1002/2015GL063897, 2015.
Gaudichet, A., Echalar, F., Chatenet, B., Quisefit, J. P., Malingre, G., Cachier, H., Buat-Menard, P., Artaxo, P., and Maenhaut,W.: Trace Elements in Tropical African Savanna, J. Atmos. Chem., 22, 19–39, https://doi.org/10.1007/BF00708179, 1995.
Graber, E. R. and Rudich, Y.: Atmospheric HULIS: How humic-like are they? A comprehensive and critical review, Atmos. Chem. Phys., 6, 729–753, https://doi.org/10.5194/acp-6-729-2006, 2006.
Griffith, D. W. T.: Synthetic calibration and quantitative analysis of gas phase infrared spectra, Appl. Spectrosc., 50, 59–70, 1996.
Hammer, M. S., Martin, R. V., van Donkelaar, A., Buchard, V., Torres, O., Ridley, D. A., and Spurr, R. J. D.: Interpreting the ultraviolet aerosol index observed with the OMI satellite instrument to understand absorption by organic aerosols: implications for atmospheric oxidation and direct radiative effects, Atmos. Chem. Phys., 16, 2507–2523, https://doi.org/10.5194/acp-16-2507-2016, 2016.
Hobbs, P. V., Reid, J. S., Herring, J. A., Nance, J. D., Weiss, R. E., Ross, J. L., Hegg, D. A., Ottmar, R. D., and Liousse, C.: Particle and trace-gas measurements in smoke from prescribed burns of forest products in the Pacific Northwest, Biomass Burning and Global Change, vol. 1, MIT Press, New York, USA, 1996.
Hobbs, P. V., Sinha, P., Yokelson, R. J., Christian, T. J., Blake, D. R., Gao, S., Kirchstetter, T. W., Novakov, T., and Pilewskie, P.: Evolution of gases and particles from a savanna fire in South Africa, J. Geophys. Res., 108, 8485, https://doi.org/10.1029/2002JD002352, 2003.
Hungershoefer, K., Zeromskiene, K., Iinuma, Y., Helas, G., Trentmann, J., Trautmann, T., Parmar, R. S., Wiedensohler, A., Andreae, M. O., and Schmid, O.: Modelling the optical properties of fresh biomass burning aerosol produced in a smoke chamber: results from the EFEU campaign, Atmos. Chem. Phys., 8, 3427–3439, https://doi.org/10.5194/acp-8-3427-2008, 2008.
Jacobson, M. Z.: Effects of biomass burning on climate, accounting for heat and moisture fluxes, black and brown carbon, and cloud absorption effects, J. Geophys. Res.-Atmos., 119, 8980–9002, https://doi.org/10.1002/2014JD021861, 2014.
Jaffe, D. A., Wigder, N., Downey, N., Pfister, G., Boynard, A., and Reid, S. B: Impact of wildfires on ozone exceptional events in the western U.S., Environ. Sci. Technol., 47, 11065–11072, https://doi.org/10.1021/es402164f, 2013.
Jen, C. N., Hatch, L. E., Selimovic, V., Yokelson, R. J., Weber, R., Fernandez, A. E., Kreisberg, N. M., Barsanti, K. C., and Goldstein, A. H.: Speciated and total emission factors of particulate organics from burning western US wildland fuels and their dependence on combustion efficiency, Atmos. Chem. Phys., 19, 1013–1026, https://doi.org/10.5194/acp-19-1013-2019, 2019.
Jethva, H. and Torres, O.: Satellite-based evidence of wavelength-dependent aerosol absorption in biomass burning smoke inferred from Ozone Monitoring Instrument, Atmos. Chem. Phys., 11, 10541–10551, https://doi.org/10.5194/acp-11-10541-2011, 2011.
Jiang, H. and Feingold, G.: Effect of aerosol on warm convective clouds: aerosol-cloud-surface flux feedbacks in a new coupled large eddy model, J. Geophys. Res.-Atmos., 111, D01202, https://doi.org/10.1029/2005JD006138, 2006.
Jolleys, M. D., Coe, H., McFiggans, G., Capes, G., Allan, J. D., Crosier, J., Williams, P. I., Allen, G., Bower, K. N., Jimenez, J. L., Russell., L. M., Grutter, M., and Baumgardner, D: Characterizing the aging of biomass buring organic aerosol by use of mixing ratios: a meta-analysis of four regions, Environ. Sci. Technol., 46, 13093–13102, https://doi.org/10.1021/es302386v, 2012.
Kaufman, Y., Gitelson, A., Karnieli, A., Ganor, E., Fraser, R., Nakajima, T., Mattoo, S., and Holben, B. N.: Size distribution and scattering phase function of aerosol particles retrieved from sky brightness measurements, J. Geophys. Res., 99, 10341–10356, 1994.
Kim, Y. H., Warren, S., Krantz, Q. T., King, C., Jaskot, R., Preston, W. T., George, B. J., Hays, M. D., Landis, M. S., Higuchi, M., DeMarini, D., and Gilmour, M. R: Mutagenicity and lung toxicity of smoldering versus flaming emissions from various biomass fuels: implications for health effects from wildland fires, Environ. Health Persp., 126, 017011, https://doi.org/10.1289/EHP2200, 2018.
Kolusu, S. R., Marsham, J. H., Mulcahy, J., Johnson, B., Dunning, C., Bush, M., and Spracklen, D. V.: Impacts of Amazonia biomass burning aerosols assessed from short-range weather forecasts, Atmos. Chem. Phys., 15, 12251–12266, https://doi.org/10.5194/acp-15-12251-2015, 2015.
Koss, A. R., Sekimoto, K., Gilman, J. B., Selimovic, V., Coggon, M. M., Zarzana, K. J., Yuan, B., Lerner, B. M., Brown, S. S., Jimenez, J. L., Krechmer, J., Roberts, J. M., Warneke, C., Yokelson, R. J., and de Gouw, J.: Non-methane organic gas emissions from biomass burning: identification, quantification, and emission factors from PTR-ToF during the FIREX 2016 laboratory experiment, Atmos. Chem. Phys., 18, 3299–3319, https://doi.org/10.5194/acp-18-3299-2018, 2018.
Lack, D. A. and Cappa, C. D.: Impact of brown and clear carbon on light absorption enhancement, single scatter albedo and absorption wavelength dependence of black carbon, Atmos. Chem. Phys., 10, 4207–4220, https://doi.org/10.5194/acp-10-4207-2010, 2010.
Lack, D. A. and Langridge, J. M.: On the attribution of black and brown carbon light absorption using the Ångström exponent, Atmos. Chem. Phys., 13, 10535–10543, https://doi.org/10.5194/acp-13-10535-2013, 2013.
Lack, D. A., Cappa, C. D., Covert, D. S., Baynard, T., Massoli, P., Sierau, B., Bates, T. S., Quinn, P. K., Lovejoy, E. R., and Ravishankara, A. R.: Bias in Filter Based Aerosol Light Absorption Measurements Due to Organic Aerosol Loading: Evidence from Ambient Measurements, Aerosol Sci. Tech., 42, 1033–1041, https://doi.org/10.1080/02786820802389285, 2008.
Lack, D. A., Langridge, J. M, Bahreini, R., Cappa, C. D., Middlebrook, A. M., and Schwarz, J. P.: Brown carbon and internal mixing in biomass burning particles, P. Natl. Acad. Sci. USA, 109, 14802–14807, https://doi.org/10.1073/pnas.1206575109, 2012.
Landis, M. S., Edgerton, E. S., White, E. M., Wentworth, G. R., Sullivan, A. P., and Dillner, A. M: The impact of the 2016 Fort McMurray Horse River wildfire on ambient air pollution levels in the Athabasca Oil Sands Region, Alberta, Canada, Sci. Total. Environ., 618, 1665—1676, https://doi.org/10.1016/j.scitotenv.2017.10.008, 2017.
Laskin, A., Laskin, J., and Nizkorodov, S. A: Chemistry of atmospheric brown carbon, Chem. Rev., 115, 4335–4382, https://doi.org/10.1021/cr5006167, 2015.
Le, G. E., Breysse, P. N., McDermott, A., Eftim, S. E., Geyh, A., Berman, J. D., and Curriero, F. C: Canadian forest fires and the effects of long-range transboundary air pollution on hospitalizations among the elderly, ISPRS Int. Geo-Inf., 3, 713–731, https://doi.org/10.3390/ijgi3020713, 2014.
Lee, H. J., Aiona, P. K., Laskin, A., Laskin, J., and Nizkorodov, S. A.: Effect of solar radiation on the optical properties and molecular composition of laboratory proxies of atmospheric brown carbon, Environ. Sci. Technol., 48, 10217–10226, https://doi.org/10.1021/es502515r, 2014.
Lewis, K., Arnott, W. P., Moosmuller, H., and Wold, C. E.: Strong spectral variation of biomass smoke light absorption and single scattering albedo observed with a novel dual-wavelength photoacoustic instrument, J. Geophys. Res., 113, D16203, https://doi.org/10.1029/2007JD009699, 2008.
Li, H., Lamb, K. D., Schwarz, J. P., Selimovic, V., Yokelson, R. J., McMeeking, G. R., and May, A.: Inter-comparison of black carbon measurement methods for simulated open biomass burning emissions, Atmos. Environ., 206, 156–169, https://doi.org/10.1016/j.atmosenv.2019.03.010, 2019.
Lin, P., Liu, J., Shilling, J. E., Kathmann, S. M., Laskin, J., and Laskin, A.: Molecular characterization of brown carbon (BrC) chromophores in secondary organic aerosol generated from photo-oxidation of toluene, Phys. Chem. Chem. Phys., 17, 23312–23325, https://doi.org/10.1039/C5CP02563J, 2015.
Lindaas, J., Farmer, D. K., Pollack, I. B., Abeleira, A., Flocke, F., Roscioli, R., Herndon, S., and Fischer, E. V.: Changes in ozone and precursors during two aged wildfire smoke events in the Colorado Front Range in summer 2015, Atmos. Chem. Phys., 17, 10691–10707, https://doi.org/10.5194/acp-17-10691-2017, 2017.
Liu, J. C., Pereira, G., Uhl, S. A., Bravo, M. A., and Bell, M. L: A systematic review of the physical health impacts from non-occupational exposure to wildfire smoke, Environ. Res., 136, 120–132, https://doi.org/10.1016/j.envres.2014.10.015, 2015.
Liu, X., Zhang, Y., Huey, L. G., Yokelson, R. J., Wang, Y., Jimenez, J. L., Campuzano-Jost, P., Beyersdorf, A. J., Blake, D. R., Choi, Y., St Clair, J. M., Crounse, J. D., Day, D. A., Diskin, G. S., Fried, A., Hall, S. R., Hanisco, T. F., King, L. E., Meinardi, S., Mikoviny, T., Palm, B. B., Peischl, J., Perring, A. E., Pollack, I. B., Ryerson, T. B., Sachse, G., Schwarz, J. P., Simpson, I. J., Tanner, D. J., Thornhill, K. L., Ullmann, K., Weber, R. J., Wennberg, P. O., Wisthaler, A., Wolfe, G. M., and Ziemba, L. D.: Agricultural fires in the southeastern US during SEAC4RS: Emissions of trace gases and particles and evolution of ozone, reactive nitrogen, and organic aerosol, J. Geophys. Res.-Atmos., 121, 7383–7414, https://doi.org/10.1002/2016jd025040, 2016.
Liu, X., Huey, G. L., Yokelson, R. J., Selimovic, V., Simpson, I. J., Müller, M., Jimenez. J. L., Campuzano-Jost, P., Beyersdorf. A. J., Blake, D. R., Butterfield, Z., Choi, Y., Crounse, J. D., Day, D. A., Diskin, G. S., Dubey, M. K., Fortner, E., Hanisco, T. F., Hu, W., King, L. E., Kleinman, L., Meinardi, S., Mikoviny, T., Onasch, T. B., Palm, B. B., Peischl, J., Pollack, I. B., Ryerson, T. B., Sachse, G. W., Sedlacek, A. J., Shilling, J. E., Springston, S., St. Clair, J. M., Tanner, D. J, Peng, A. P., Wennberg, P. O., Wisthaler, A., and Wolfe, G. M.: Airborne measurements of western U.S wildfire emissions: Comparison with prescribed burning and air quality implications, J. Geophys. Res.-Atmos., 122, 6108–6129, https://doi.org/10.1002/2016JD026315, 2017.
Lobert, J. M., Scharffe, D. H., Hao, W. M., Kuhlbusch, T. A., Seuwen, R., Wameck, P., and Crutzen, P. J.: Experimental evaluation of biomass burning emissions: Nitrogen and carbon containing compounds, in: Global Biomass Burning: Atmospheric, Climatic and Biospheric Implications, edited by: Levine, J. S., 289–304, MIT Press, Cambridge, Mass., USA, 1991.
Mao, Y. H., Li, Q. B., Henze, D. K., Jiang, Z., Jones, D. B. A., Kopacz, M., He, C., Qi, L., Gao, M., Hao, W.-M., and Liou, K.-N.: Estimates of black carbon emissions in the western United States using the GEOS-Chem adjoint model, Atmos. Chem. Phys., 15, 7685–7702, https://doi.org/10.5194/acp-15-7685-2015, 2015.
May, A. A., McMeeking., G. R., Lee, T., Taylor, J. W., Craven, J. S., Burling, I., Sullivan, A. P., Akagi, S., Collett Jr., J. L., Flynn, M., Coe, H., Urbanski, S. P., Seinfeld, J. H., Yokelson, R. J., and Kreidenweis, S. M.: Aerosol emissions from prescribed fires in the United States: A synthesis of laboratory and aircraft measurements, J. Geophys. Res.-Atmos., 119, 11826–11849, https://doi.org/10.1002/2014JD021848, 2014.
May, A. A., Lee, T., McMeeking, G. R., Akagi, S., Sullivan, A. P., Urbanski, S., Yokelson, R. J., and Kreidenweis, S. M.: Observations and analysis of organic aerosol evolution in some prescribed fire smoke plumes, Atmos. Chem. Phys., 15, 6323–6335, https://doi.org/10.5194/acp-15-6323-2015, 2015.
McClure, C. D. and Jaffe, D. A: US particulate matter air quality improves except in wildfire-prone areas, P. Natl. Acad. Sci. USA, 115, 7901–7906, https://doi.org/10.1073/pnas.1804353115, 2018.
McComiskey, A., Schwartz, S. E., Schmid, B., Guan, H., Lewis, E. R., Ricchiazzi, P., and Ogren, J. A.: Direct aerosol forcing: calculation from observables and sensitivities to inputs, J. Geophys. Res.-Atmos., 113, D09202, https://doi.org/10.1029/2007JD009170, 2008.
McMeeking, G. R., Kreidenweis, S. M., Carrico, C. M., Collett, J. L., Day, D. E., and Malm, W. C.: Observations of smoke-influenced aerosol during the Yosemite Aerosol Characterization Study: Size distributions and chemical composition J. Geophys. Res., 110, D18209, https://doi.org/10.1029/2004JD005389, 2005a.
McMeeking, G. R., Kreidenweis, S. M., Carrico, C. M., Collett, J. L., Day, D. E., and Malm, W. C.: Observations of smoke-influenced aerosol during the Yosemite Aerosol Characterization Study: 2. Aerosol scattering and absorbing properties, J. Geophys. Res., 110, D18209, https://doi.org/10.1029/2004JD005624, 2005b.
Miyakawa, T., Oshima, N., Taketani, F., Komazaki, Y., Yoshino, A., Takami, A., Kondo, Y., and Kanaya, Y.: Alteration of the size distributions and mixing states of black carbon through transport in the boundary layer in east Asia, Atmos. Chem. Phys., 17, 5851–5864, https://doi.org/10.5194/acp-17-5851-2017, 2017.
Müller, M., Anderson, B. E., Beyersdorf, A. J., Crawford, J. H., Diskin, G. S., Eichler, P., Fried, A., Keutsch, F. N., Mikoviny, T., Thornhill, K. L., Walega, J. G., Weinheimer, A. J., Yang, M., Yokelson, R. J., and Wisthaler, A.: In situ measurements and modeling of reactive trace gases in a small biomass burning plume, Atmos. Chem. Phys., 16, 3813–3824, https://doi.org/10.5194/acp-16-3813-2016, 2016.
Nakayama, T. Suzuki, H., Kagamitani, S., and Ikeda, Y.: Characterization of a three wavelength Photoacoustic Soot Spectrometer (PASS-3) and a Photoacoustic Extinctiometer (PAX), J. Meteorol. Soc. Jpn., 93, 285–308, https://doi.org/10.2151/jmsj.2015-016, 2015.
Park, R. J., Jacob, D. J., and Logan, J. A.: Fire and biofuel contributions to annual mean aerosol mass concentrations in the United States, Atmos. Environ., 41, 7389–7400, https://doi.org/10.1016/j.atmosenv.2007.05.061, 2007.
Pokhrel, R. P., Wagner, N. L., Langridge, J. M., Lack, D. A., Jayarathne, T., Stone, E. A., Stockwell, C. E., Yokelson, R. J., and Murphy, S. M.: Parameterization of single-scattering albedo (SSA) and absorption Ångström exponent (AAE) with EC ∕ OC for aerosol emissions from biomass burning, Atmos. Chem. Phys., 16, 9549–9561, https://doi.org/10.5194/acp-16-9549-2016, 2016.
Pokhrel, R. P., Beamesderfer, E. R., Wagner, N. L., Langridge, J. M., Lack, D. A., Jayarathne, T., Stone, E. A., Stockwell, C. E., Yokelson, R. J., and Murphy, S. M.: Relative importance of black carbon, brown carbon, and absorption enhancement from clear coatings in biomass burning emissions, Atmos. Chem. Phys., 17, 5063–5078, https://doi.org/10.5194/acp-17-5063-2017, 2017.
Praveen, P. S., Ahmed, T., Kar, A., Rehman, I. H., and Ramanathan, V.: Link between local scale BC emissions in the Indo-Gangetic Plains and large scale atmospheric solar absorption, Atmos. Chem. Phys., 12, 1173–1187, https://doi.org/10.5194/acp-12-1173-2012, 2012.
Radke, L. F., Hegg, D. A., Hobbs, P. V., Nance, J. D., Lyons, J. H., Laursen, K. K., Weiss, R. E., Riggan, P. J., and Ward, D. E.: Particulate and trace gas emissions from large biomass fires in North America, in: Global biomass burning – Atmospheric, climatic, and biospheric implications, MIT Press, Cambridge, MA, USA, 209–224, 1991.
Ramanathan, V., Crutzen, P. J., Kiehl, J. T., and Rosenfeld, D: Aerosols, climate, and the hydrological cycle, Science, 294, 2219–2124, https://doi.org/10.1126/science.1064034, 2001.
Reid, C. E., Brauer, M., Johnson, F. H., Jerrett, J., Balmes, J. R., and Elliot, C. T.: Critical review of health impacts of wildfire smoke exposure, Environ. Health Persp., 124, 1334–1343, https://doi.org/10.1289/ehp.1409277, 2016.
Reid, J. S., Koppmann, R., Eck, T. F., and Eleuterio, D. P.: A review of biomass burning emissions part II: intensive physical properties of biomass burning particles, Atmos. Chem. Phys., 5, 799–825, https://doi.org/10.5194/acp-5-799-2005, 2005a.
Reid, J. S., Eck, T. F., Christopher, S. A., Koppmann, R., Dubovik, O., Eleuterio, D. P., Holben, B. N., Reid, E. A., and Zhang, J.: A review of biomass burning emissions part III: intensive optical properties of biomass burning particles, Atmos. Chem. Phys., 5, 827–849, https://doi.org/10.5194/acp-5-827-2005, 2005b.
Reisen, F., Meyer, C. P., Weston, C. J., and Volkova, L: Ground-Based field measurements of PM2.5 emission factors from flaming and smoldering combustion in eucalypt forests, J. Geophys. Res.-Atmos., 123, 8301–8314, https://doi.org/10.1029/2018JD028488, 2018.
Sahu, L. K., Kondo, Y., Moteki, N., Takegawa, N., Zhao, Y., Cubison, M. J., Jimenez, J. L., Vay, S., Diskin, G. S., Wisthaler, A., Mikoviny, T., Huey, L. G., Weinheimer, A. J., and Knapp, D. J: Emission characteristics of black carbon in anthropogenic and biomass burning plumes over California during ARCTAS-CARB 2008, J. Geophys. Res-Atmos, 117, D16302, https://doi.org/10.1029/2011JD017401, 2012.
Saide, P. E., Peterson, D. A., da Silva, A., Anderson, B., Ziemba, L. D., Diskin, G., Sachse, G., Hair, J., Butler, C., Fenn, M., Jimenez, J. L., Campuzano-Jost, P., Perring, A. E., Schwarz, J. P., Markovic, M. Z., Russell, P., Redemann, J., Shinozuka, Y., Streets, D. G., Yan, F., Dibb, J., Yokelson, R., Toon, O. B., Hyer, E., and Carmichael, G. R.: Revealing important nocturnal and day-to-day variations in fire smoke emissions through a multiplatform inversion, Geophys. Res. Lett., 42, 2015GL063737, https://doi.org/10.1002/2015GL063737, 2015.
Saleh, R., Robinson E. S., Tkacik, D. S., Ahern, A. T., Liu, S., Aiken, A. C., Sullivan, R. C., Presto, A. A., Dubey, M. K., Yokelson, R. J., Donahue, N. M., and Robinson, A. L.: Brownness of organics in aerosols from biomass burning linked to their black carbon content, Nat. Geosci., 7, 647–650, https://doi.org/10.1038/ngeo2220, 2014.
Sareen, N., Schwier, A. N., Shapiro, E. L., Mitroo, D., and McNeill, V. F.: Secondary organic material formed by methylglyoxal in aqueous aerosol mimics, Atmos. Chem. Phys., 10, 997–1016, https://doi.org/10.5194/acp-10-997-2010, 2010.
Schuster, G. L., Dubovik, O., and Holben, B. N.: Angstrom exponent and bimodal aerosol size distributions, J. Geophys. Res., 111, D07207, https://doi.org/10.1029/2005JD006328, 2006.
Selimovic, V., Yokelson, R. J., Warneke, C., Roberts, J. M., de Gouw, J., Reardon, J., and Griffith, D. W. T.: Aerosol optical properties and trace gas emissions by PAX and OP-FTIR for laboratory-simulated western US wildfires during FIREX, Atmos. Chem. Phys., 18, 2929–2948, https://doi.org/10.5194/acp-18-2929-2018, 2018.
Shaddix, C. R., Harrington, J. E., and Smyth, K. C: Quantitative measurements of enhanced soot production in a flickering methane/air diffusion flame, Combust. Flame., 99, 723–732, https://doi.org/10.1016/0010-2180(94)90067-1, 1994.
Stein, A. F., Draxler, R. R., Rolph, G. D., Stunder, B. J. B., Cohen, M. D., and Ngan, F.: NOAA's HYSPLIT atmospheric transport and dispersion modeling system, B. Am. Meteorol. Soc., 96, 2059–2077, https://doi.org/10.1175/BAMS-D-14-00110.1, 2015.
Stockwell, C. E., Veres, P. R., Williams, J., and Yokelson, R. J.: Characterization of biomass burning emissions from cooking fires, peat, crop residue, and other fuels with high-resolution proton-transfer-reaction time-of-flight mass spectrometry, Atmos. Chem. Phys., 15, 845–865, https://doi.org/10.5194/acp-15-845-2015, 2015.
Stockwell, C. E., Jayarathne, T., Cochrane, M. A., Ryan, K. C., Putra, E. I., Saharjo, B. H., Nurhayati, A. D., Albar, I., Blake, D. R., Simpson, I. J., Stone, E. A., and Yokelson, R. J.: Field measurements of trace gases and aerosols emitted by peat fires in Central Kalimantan, Indonesia, during the 2015 El Niño, Atmos. Chem. Phys., 16, 11711–11732, https://doi.org/10.5194/acp-16-11711-2016, 2016a.
Stockwell, C. E., Christian, T. J., Goetz, J. D., Jayarathne, T., Bhave, P. V., Praveen, P. S., Adhikari, S., Maharjan, R., DeCarlo, P. F., Stone, E. A., Saikawa, E., Blake, D. R., Simpson, I. J., Yokelson, R. J., and Panday, A. K.: Nepal Ambient Monitoring and Source Testing Experiment (NAMaSTE): emissions of trace gases and light-absorbing carbon from wood and dung cooking fires, garbage and crop residue burning, brick kilns, and other sources, Atmos. Chem. Phys., 16, 11043–11081, https://doi.org/10.5194/acp-16-11043-2016, 2016b.
Subramanian, R., Roden, C. A., Boparai, P., and Bond, T. C: Yellow beads and missing particles: trouble ahead for filter-based absorption measurements, Aerosol. Sci. Tech., 41, 630–637, https://doi.org/10.1080/02786820701344589, 2007.
Thornhill, G. D., Ryder, C. L., Highwood, E. J., Shaffrey, L. C., and Johnson, B. T.: The effect of South American biomass burning aerosol emissions on the regional climate, Atmos. Chem. Phys., 18, 5321–5342, https://doi.org/10.5194/acp-18-5321-2018, 2018.
Tomaz, S, Cui, T., Chen, Y., Sexton, K. G., Roberts, J. M., Warneke, C., Yokelson, R. J., Surratt, J. D., and Turpin, B. J: Photochemical cloud processing of primary wildfire emissions as a potential source of secondary organic aerosol, Environ. Sci. Technol., 52, 11027—11037, https://doi.org/10.1021/acs.est.8b03293, 2018.
United States Environmental Protection Agency: “Climate Indicators: Wildfires”, available at: http://web.archive.org/web/20160512002554/https://www3.epa.gov/climatechange/science/indicators/ecosystems/wildfires.html, last access: 21 March 2019.
United States National Interagency Fire Center: Total Wildland Fires and Acres (1926–2017), available at: https://www.nifc.gov/fireInfo/fireInfo_stats_totalFires.html, last access: 21 March 2019.
Urbanski, S. P.: Combustion efficiency and emission factors for wildfire-season fires in mixed conifer forests of the northern Rocky Mountains, US, Atmos. Chem. Phys., 13, 7241–7262, https://doi.org/10.5194/acp-13-7241-2013, 2013.
Vakkari, V., Kerminen, V., Beukes, J. P., Tiitta, P., van Zyl, P. G., Josipovic, M., Venter, A. D., Jaars, K., Worsnop, D. R., Kulmala, M., and Laasko, L: Rapid changes in biomass burning aerosols by atmospheric oxidation, Geophys. Res. Lett., 41, 2644–2651, https://doi.org/10.1002/2014GL059396, 2014.
Vakkari, V., Beukes, J. P., Dal Maso, M., Aurela, M., Josipovic, M., and van Zyl, P. G.: Major secondary aerosol formation in southern African open biomass burning plumes, Nat. Geosci., 11, 580–583, https://doi.org/10.1038/s41561-018-0170-0, 2018.
Wang, J., Geng, N. B., Xu, Y. F., Zhang, W. D., Tang, X. Y., and Zhang, R. Q: PAHs in PM2.5 in Zhengzhou: concentration, carcinogenic risk analysis and source apportionment, Environ. Monit. Assess., 186, 7461–7473, https://doi.org/10.1007/s10661-014-3940-1, 2014.
Wang, J., Yue, Y., Wang, Y., Ichoku, C., Ellison, L., and Zeng, J: Mitigating satellite-bassed fire sampling limitations in deriving biomass burning emission rates: application to WRF-Chem model over the northern sub-saharan African region, J. Geophys. Res.-Atmos, 123, 507–528, https://doi.org/10.1002/2017JD026840, 2017.
Westerling, A. L., Hidalgo, H. G., Cayan, D. R., and Swetnam, T. W.: warming and earlier spring increase western U.S forest wildfire activity, Science, 313, 940–943, https://doi.org/10.1126/science.1128834, 2006.
Wigder, N. L., Jaffe, D. A., and Saketa, F. A.: Ozone and particulate matter enhancements from regional wildfires observed at Mount Bachelor during 2004–2011, Atmos. Environ., 75, 24—31, https://doi.org/10.1016/j.atmosenv.2013.04.026, 2013.
Wilkins, J. L., Pouliot, G., Foley, K., Appel., W., and Pierce, T.: The impact of US wildland fires on ozone and particulate matter a comparison of measurements and CMAQ model predictions from 2008 to 2012, Int. J. Wildland Fire, 27, 684–698, https://doi.org/10.1071/WF18053, 2018.
Xu, J., Zhang, Q., Shi, J., Ge, X., Xie, C., Wang, J., Kang, S., Zhang, R., and Wang, Y.: Chemical characteristics of submicron particles at the central Tibetan Plateau: insights from aerosol mass spectrometry, Atmos. Chem. Phys., 18, 427–443, https://doi.org/10.5194/acp-18-427-2018, 2018.
Yates, E. L., Iraci, L. T., Singh, H. B., Tanaka, T., Roby, M. C., Hamill, P., Clements, C. B., Lareau, N., Contezac, J., Blake, D. R., Simpson, I. J., Wisthaler, A., Mikoviny, T., Diskin, G. S., Beyersdorf, A. J., Choi, Y., Ryerson, T. B., Jimenez, J. L., and Gore, W.: Airborne measurements and emissions estimates of greenhouse gases and other trace constituents form the 2013 California Yosemite Rim wildfire, Atmos. Environ., 127, 293–302, https://doi.org/10.1016/j.atmosenv.2015.12.038, 2016.
Yokelson, R. J., Susott, R., Ward, D. E., Reardon, J., and Griffith, D. W. T.: Emissions from smoldering combustion of biomass burning measured by open-path Fourier transform infrared spectroscopy, J. Geophys. Res.-Atmos., 102, 18865–18877, https://doi.org/10.1029/97JD00852, 1997.
Yokelson, R. J., Christian, T. J., Bertschi, I. T., and Hao, W. M.: Evaluation of adsorption effects on measurements of ammonia, acetic acid, and methanol, J. Geophys. Res., 108, 4649, https://doi.org/10.1029/2003JD003549, 2003.
Yokelson, R. J., Karl, T., Artaxo, P., Blake, D. R., Christian, T. J., Griffith, D. W. T., Guenther, A., and Hao, W. M.: The Tropical Forest and Fire Emissions Experiment: overview and airborne fire emission factor measurements, Atmos. Chem. Phys., 7, 5175–5196, https://doi.org/10.5194/acp-7-5175-2007, 2007.
Yokelson, R. J., Christian, T. J., Karl, T. G., and Guenther, A.: The tropical forest and fire emissions experiment: laboratory fire measurements and synthesis of campaign data, Atmos. Chem. Phys., 8, 3509–3527, https://doi.org/10.5194/acp-8-3509-2008, 2008.
Yokelson, R. J., Crounse, J. D., DeCarlo, P. F., Karl, T., Urbanski, S., Atlas, E., Campos, T., Shinozuka, Y., Kapustin, V., Clarke, A. D., Weinheimer, A., Knapp, D. J., Montzka, D. D., Holloway, J., Weibring, P., Flocke, F., Zheng, W., Toohey, D., Wennberg, P. O., Wiedinmyer, C., Mauldin, L., Fried, A., Richter, D., Walega, J., Jimenez, J. L., Adachi, K., Buseck, P. R., Hall, S. R., and Shetter, R.: Emissions from biomass burning in the Yucatan, Atmos. Chem. Phys., 9, 5785–5812, https://doi.org/10.5194/acp-9-5785-2009, 2009.
Yokelson, R. J., Burling, I. R., Gilman, J. B., Warneke, C., Stockwell, C. E., de Gouw, J., Akagi, S. K., Urbanski, S. P., Veres, P., Roberts, J. M., Kuster, W. C., Reardon, J., Griffith, D. W. T., Johnson, T. J., Hosseini, S., Miller, J. W., Cocker III, D. R., Jung, H., and Weise, D. R.: Coupling field and laboratory measurements to estimate the emission factors of identified and unidentified trace gases for prescribed fires, Atmos. Chem. Phys., 13, 89–116, https://doi.org/10.5194/acp-13-89-2013, 2013a.
Yokelson, R. J., Andreae, M. O., and Akagi, S. K.: Pitfalls with the use of enhancement ratios or normalized excess mixing ratios measured in plumes to characterize pollution sources and aging, Atmos. Meas. Tech., 6, 2155–2158, https://doi.org/10.5194/amt-6-2155-2013, 2013b.
Yue, C., Ciais, P., Cadule, P., Thonicke, K., and van Leeuwen, T. T.: Modelling the role of fires in the terrestrial carbon balance by incorporating SPITFIRE into the global vegetation model ORCHIDEE – Part 2: Carbon emissions and the role of fires in the global carbon balance, Geosci. Model Dev., 8, 1321–1338, https://doi.org/10.5194/gmd-8-1321-2015, 2015.
Zhao, R., Lee, A. K. Y., Huang, L., Li, X., Yang, F., and Abbatt, J. P. D.: Photochemical processing of aqueous atmospheric brown carbon, Atmos. Chem. Phys., 15, 6087–6100, https://doi.org/10.5194/acp-15-6087-2015, 2015.
Zhong, M. and Jang, M.: Dynamic light absorption of biomass-burning organic carbon photochemically aged under natural sunlight, Atmos. Chem. Phys., 14, 1517–1525, https://doi.org/10.5194/acp-14-1517-2014, 2014.
Zhou, L., Baker, K. R., Napelenok., S. L., Pouliot, G., Elleman, R., O'Neill, S. M., Urbanski, S. P., and Wong, D. C: Modeling crop residual burning experiments to evaluate smoke emissions and plume transport, Sci. Total Environ., 627, 523–533, https://doi.org/10.1016/j.scitotenv.2018.01.237, 2018.