the Creative Commons Attribution 4.0 License.
the Creative Commons Attribution 4.0 License.
 | 20 Mar 2019
Carbon monoxide air pollution on sub-city scales and along arterial roads detected by the Tropospheric Monitoring Instrument
Joost aan de Brugh
Sudhanshu Pandey
Otto Hasekamp
Ilse Aben
Sander Houweling
Jochen Landgraf
The Tropospheric Monitoring Instrument (TROPOMI) on the Sentinel-5 Precursor satellite provides measurements of carbon monoxide (CO) total column concentrations based on earthshine radiance measurements in the 2.3 µm spectral range with a spatial resolution of 7 km×7 km and daily global coverage. Due to the high accuracy of the observations, CO pollution can be detected over cities and industrial areas using single orbit overpasses. In this study, we analyzed local CO enhancements in an area around Iran from 1 November to 20 December 2017. We employed the Weather Research and Forecasting (WRF) model v3.8.1 using the EDGAR v4.2 emission inventory and evaluated CO emissions from the cities of Tehran, Yerevan, Urmia, and Tabriz on a spatial resolution comparable to that of TROPOMI. For background conditions, the WRF simulation agrees well with TROPOMI CO, with a mean difference of 5.7 %. However, the emissions for the city area had to be significantly increased in order to match the observations. Moreover, significant differences at the sub-city scale remain. To match the TROPOMI CO observations around the Armenian city of Yerevan, it is necessary to introduce CO emissions along a southeast arterial road of Yerevan. Overall, this hints at deficits in the EDGAR inventory in the region around Iran and indicates TROPOMI's capability to identify localized CO pollution on sub-city scales, which at the same time challenges current atmospheric modeling at high spatial and temporal resolution.
- Article
(20272 KB) - Full-text XML
- BibTeX
- EndNote


The Tropospheric Monitoring Instrument (TROPOMI) was launched on the Copernicus Sentinel-5 Precursor satellite on 13 October 2017. The instrument is a nadir looking pushbroom grating spectrometer that performs measurements of the solar light reflected by the Earth's atmosphere in the ultraviolet–visible (UV–VIS, 270–495 nm), near-infrared (NIR, 710–775 nm), and shortwave infrared (SWIR, 2305–2385 nm) spectral domain. The novelty of the mission is the combination of high spatial resolution of the measurements (7 km×7 km, SWIR) in nadir observation geometry, the daily global coverage, and a high signal-to-noise ratio (Veefkind et al., 2012).
One of the primary objectives of the mission is to measure the total column concentration of carbon monoxide (CO), which is an atmospheric trace gas emitted to the atmosphere mainly by incomplete combustion. The major sink of CO is its reaction with the hydroxyl radical OH (Spivakovsky et al., 2000). With its low background concentration (ca. 80 ppb, parts per billion, in the Northern Hemisphere) and the moderately long atmospheric residence time of weeks to months (Holloway et al., 2000), CO is a good tracer to monitor atmospheric transport processes (Gloudemans et al., 2009) as well as to detect pollution sources of natural (e.g., biomass burning, wild fires; Yurganov et al., 2004, 2005) and anthropogenic origin (e.g., megacities; Pommier et al., 2013; Stremme et al., 2013).
Landgraf et al. (2016a, b) developed the operational code for the TROPOMI mission to retrieve the total column concentration of CO from the SWIR measurements of the instrument. The high spatial resolution in combination with a high signal-to-noise ratio of the measurements allows for the detection of CO pollution from large cities (e.g., Mexico, Tehran, Isfahan) and industrial areas (e.g., Po Valley in Italy) from single orbit overpasses and the tracking of the transport of pollution on regional (e.g., India) to global scales (e.g., biomass burning in Africa) with daily global coverage (Borsdorff et al., 2018a). Borsdorff et al. (2018b) reported a good agreement between the TROPOMI CO dataset and the simulations of the European Centre for Medium-Range Weather Forecasts (ECMWF) Integrated Forecasting System (IFS) model. Already in the early phase of the mission, a validation with TCCON (Total Carbon Column Observing Network) and NDACC-IRWG (Network for the Detection of Atmospheric Composition Change – the Infrared Working Group) ground-based measurements showed compliance with the mission objectives on precision (<10 %) and accuracy (<15 %) (Borsdorff et al., 2018a). In July 2018, the dataset was released to the public (ESA, 2018).
For this study, we analyze TROPOMI observations using CO tracer simulations for the period 1 November–20 December 2017 using the Weather Research and Forecasting (WRF) model (Skamarock et al., 2008). The model domain is centered over Iran with a spatial resolution comparable to that of TROPOMI. During this period frequent clear sky observations are possible over this region, which makes it particularly suited to study localized hot spots of CO emissions from urban areas. Considering the CO emissions from the cities of Yerevan, Urmia, Tabriz, and Tehran as independent atmospheric tracers, we compared the modeled CO columns with spatiotemporally coincident TROPOMI measurements to evaluate TROPOMI's monitoring capability of CO emissions on city and sub-city scales.
The paper is structured as follows: Sect. 2 introduces the TROPOMI CO dataset and the WRF model simulations. Section 3 presents our approach to estimate emissions from the TROPOMI data for the example of the city of Tehran and a selected domain over Armenia. Finally, Sect. 4 summarizes and concludes our study.
2.1 TROPOMI CO total column densities
The TROPOMI CO dataset is inferred from the 2.3 µm measurements of the instrument by deploying the Shortwave Infrared CO Retrieval (SICOR) algorithm, which was developed for the operational processing of TROPOMI data. The algorithm is based on the profile scaling approach, whereby a prior vertical distribution of CO is scaled to fit the observation (Borsdorff et al., 2014). The implementation and retrieval settings are presented in detail by Landgraf et al. (2016a), where the CO profile, to be scaled by the retrieval, is taken from monthly averaged simulations of the global chemical transport model TM5 (Krol et al., 2005) with a latitude–longitude resolution of . The retrieval accounts for atmospheric light scattering by clouds and aerosols and estimates the trace gas columns together with surface albedo and effective cloud parameters (cloud height, z; and cloud optical thickness, τ) to account for the cloud contamination of the measurements (Landgraf et al., 2016b). Borsdorff et al. (2018a, b) showed the validity of the CO data product for both clear sky and cloudy measurement conditions. An essential element of the TROPOMI CO data product is the column averaging kernel Acol, which describes the sensitivity of the retrieved CO column cret to changes in the true vertical profile ρtrue of CO (Rodgers, 2000), namely
where ϵCO represents the error of the retrieved CO column.

Figure 1Topological map of the model domain taken form the 2000 Shuttle Radar Topography Mission (SRTM) data with a resolution of 15 arcsec (Farr et al., 2007). An analogous terrain height is used for the WRF simulation. The cities of Yerevan, Urmia, Tabriz, and Tehran with CO hot spots are marked in the map.
This study considers only TROPOMI clear sky observations (τ<0.5 and z<5 km, over land) with good sensitivity to CO in the tropospheric boundary layer close to the emission sources as shown in Fig. 1 of Borsdorff et al. (2018b). Here, the averaging kernel varies between 0.9 and 1 in the altitude range from the surface to 15 km. The data filtering is described in more detail by Borsdorff et al. (2018b). For the comparison of the TROPOMI CO data product with WRF model simulations, we apply the averaging kernel to the CO model profile ρmod and compare Acolρmod directly to the TROPOMI CO column measurement cret, where the averaging kernel accounts for the vertical sensitivity of the satellite measurement.
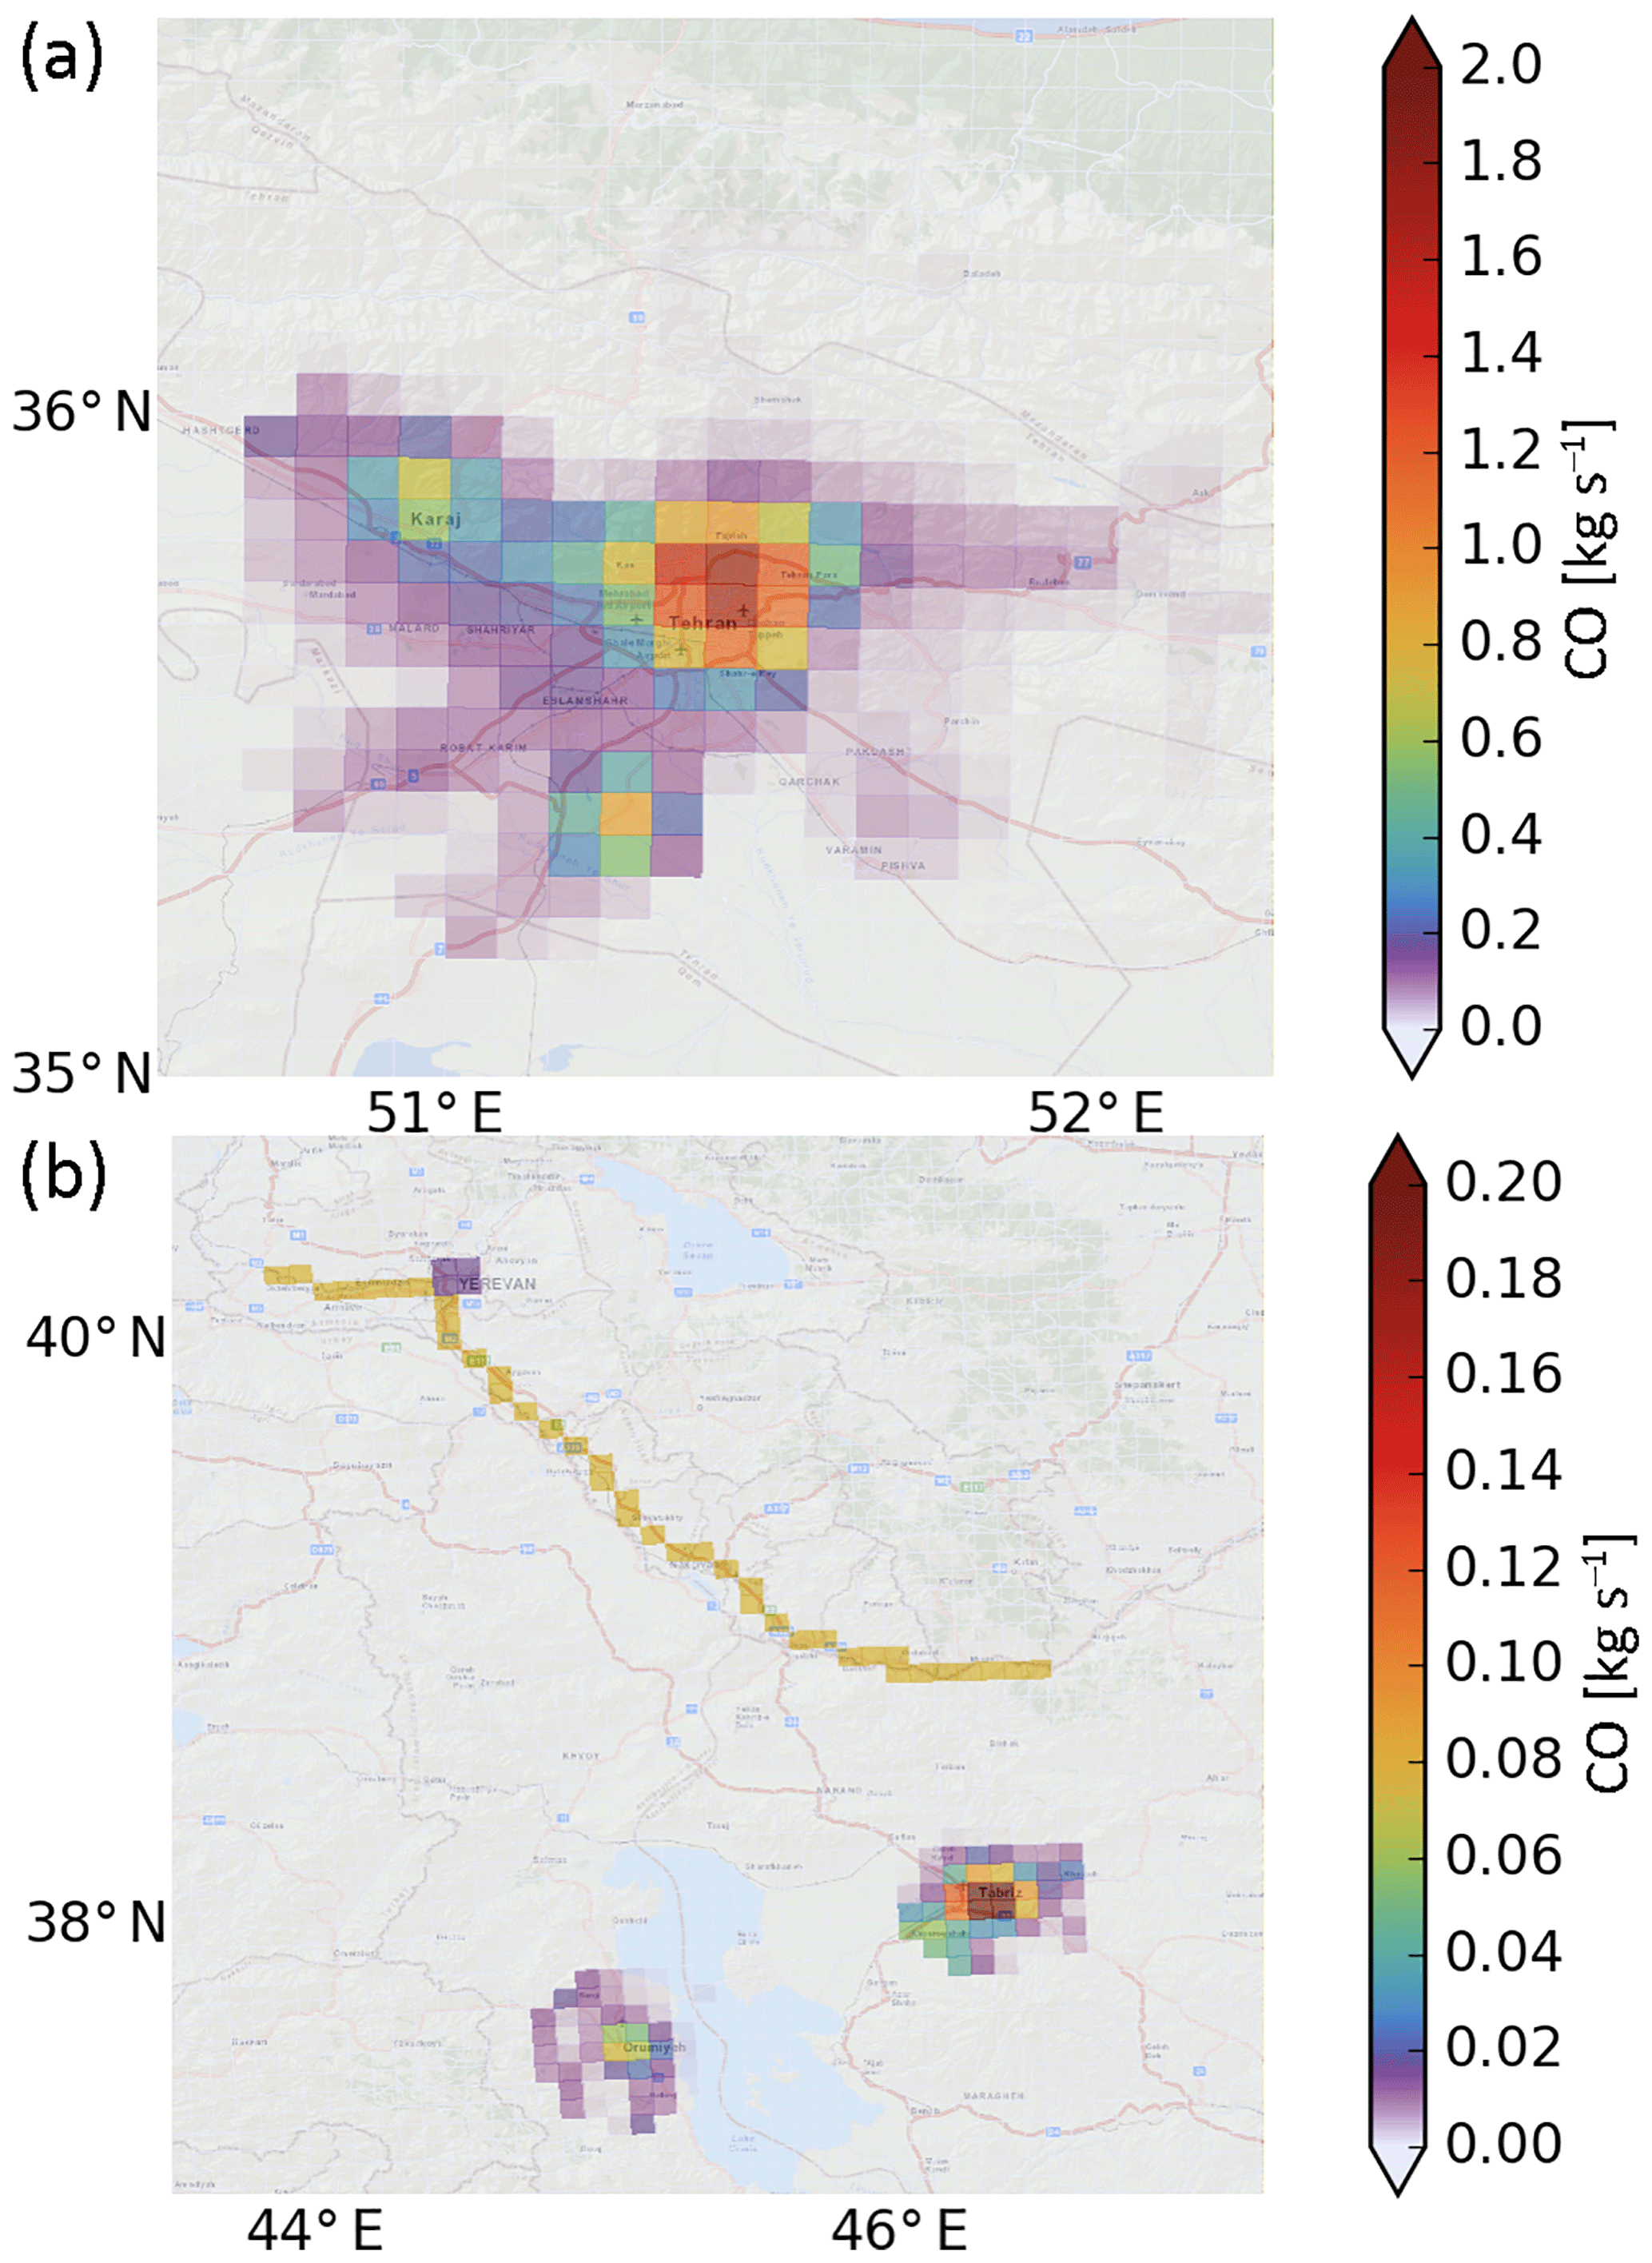
Figure 2Emission used for the WRF tracer runs. Emission 70 km around Tehran (a) extracted from EDGAR. (b) The emissions of Yerevan, Tabriz, and Urmia extracted from EDGAR 30 km around the cities, and the additionally introduced emission along a main traffic road in Armenia not present in EDGAR.
2.2 WRF model simulations
For a domain of 2408 km×2674 km around Iran centered at 50.2∘ E and 33.5∘ N, we simulated the atmospheric CO field using WRF v3.8.1 (Skamarock et al., 2008) and its Chem module by Grell et al. (2005) for tracer transport. Photochemical oxidation and secondary production of CO in the atmosphere have been ignored, justified by the long lifetime of CO compared with the size of the model domain (Dekker et al., 2017, 2019). The model domain includes regions of complex terrain of mountains and valleys as illustrated in Fig. 1, which affects regional weather processes. For the cities of Yerevan, Urmia, Tabriz, and Tehran, we have identified pollution hot spots in the TROPOMI data, as will be discussed in the next section. The CO simulations were performed for the period 1 November to 20 December 2017 at a resolution of 7 km×7 km and at 29 pressure levels from the Earth's surface up to 50 hPa. The WRF settings were the same as those used in Dekker et al. (2017), including the Yonsei University (YSU) boundary layer scheme (Hu et al., 2013) and the convection parameterization by Grell and Freitas (2014). The initial and boundary conditions of CO are adapted from ECMWF Copernicus Atmosphere Monitoring Service (CAMS) near-real-time analysis data (George et al., 2015). The WRF simulation has been nudged to NCEP final analysis meteorological fields (ds083.2, NCEP, 2000) at and 6-hourly resolution at the model's initial and domain boundaries. Anthropogenic surface emissions of CO for 2010 are from the Emission Database for Global Atmospheric Research (EDGAR) version 4.2 (Crippa et al., 2016). The EDGAR inventory comprises global anthropogenic emissions based on publicly available data that can be used as input for atmospheric models. The emissions used in this study are time invariant.
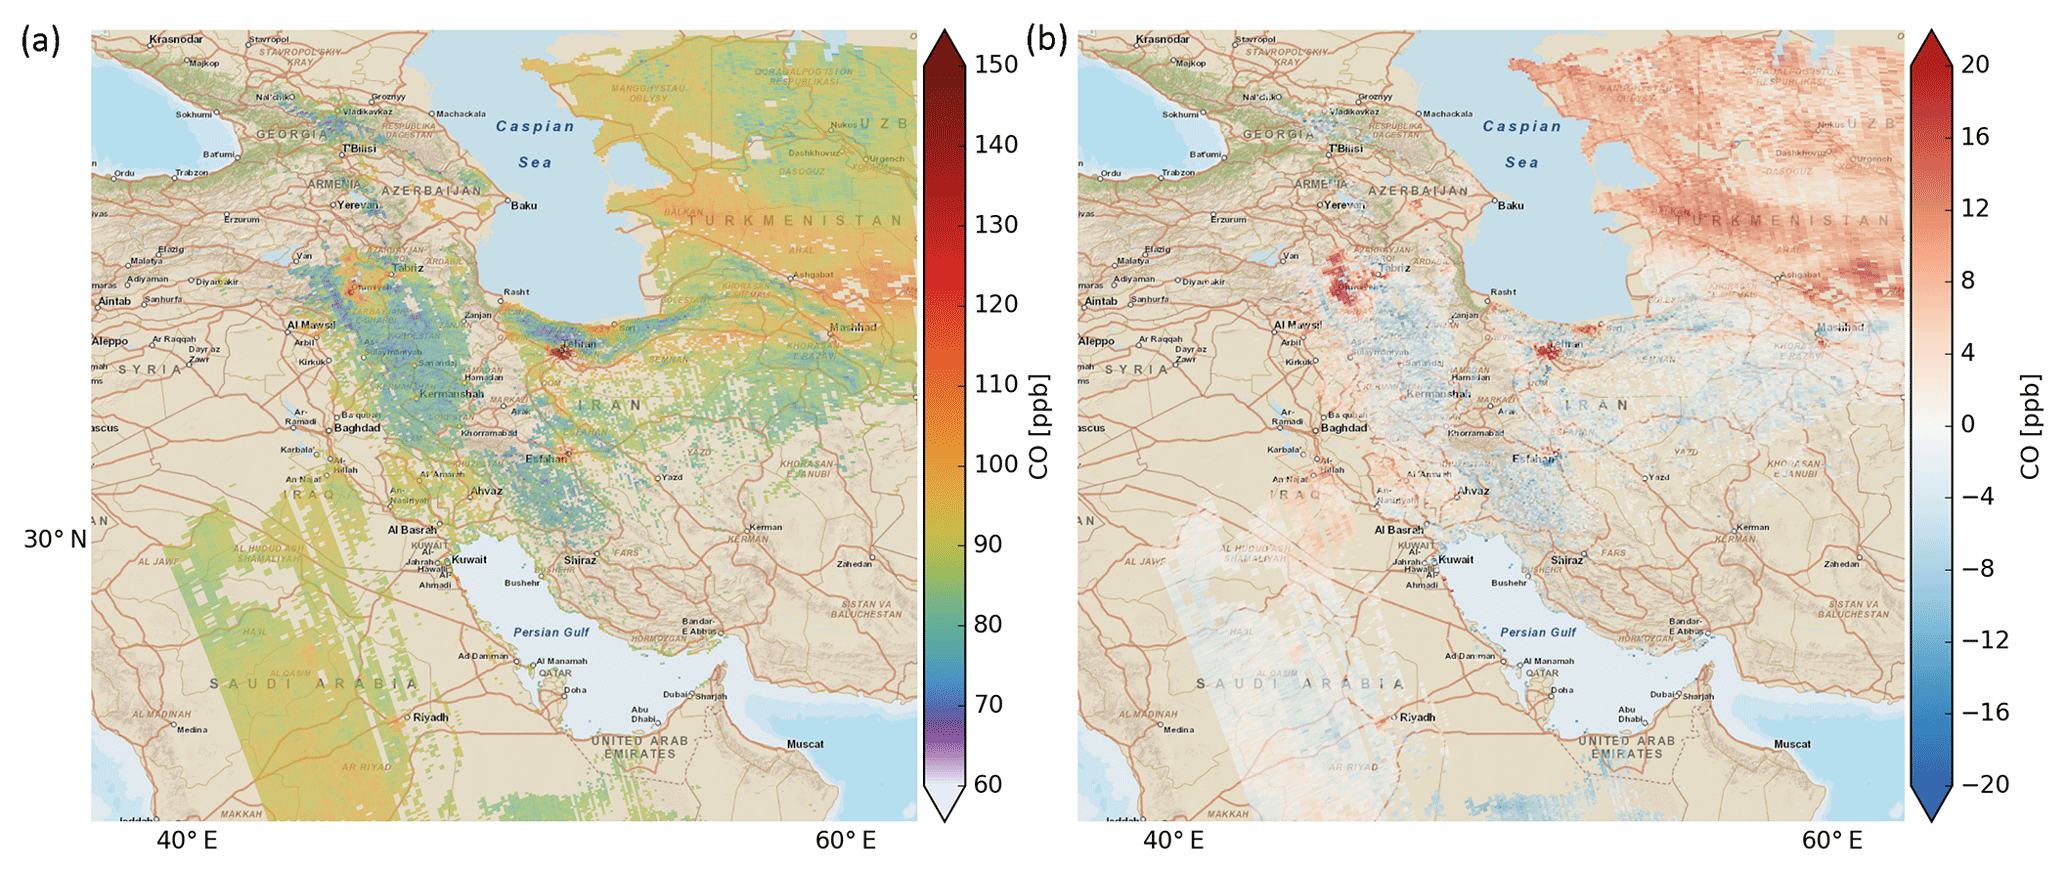
Figure 3TROPOMI CO retrieval of one orbit on 18 December 2017 09:37 UTC (a) and the difference (TROPOMI − WRF, b).
3.1 Scaling of the EDGAR emissions
To compare the simulated CO fields with the TROPOMI CO columns, we first selected the CO field from the hourly WRF data, which is closest to the overpass time of TROPOMI, and subsequently interpolate the model data to the geolocation of the individual TROPOMI ground pixels. Subsequently, by analogy with Eq. (1), we applied the total column averaging kernel Acol of the TROPOMI CO product to the corresponding model profile. In this way, we account for the CO column sensitivity of the retrieval in our comparison (Borsdorff et al., 2014).
We start with a WRF model run using the EDGAR emission without any adjustments. Figure 3 shows the comparison of the TROPOMI CO data with the collocated CO field of the WRF simulation for an overpass on 18 December 2017 09:37 UTC. The WRF simulation and the contribution of the background tracer field to the simulated total column is shown in Fig. 4. The overall agreement is good with a mean difference of 5.7 %, which agrees well with the finding of Borsdorff et al. (2018a), who compared the TROPOMI CO data with ECMWF-CAMS near-real-time analysis data. This is expected because the WRF simulation is constrained by the same data at the domain boundaries. However, a closer look reveals that the model underestimates the CO enhancements sensed by TROPOMI above pollution hot spots, hinting at an inconsistency between the observations and the EDGAR emissions over urban areas. Furthermore, large-scale deviations occur in the northeast of the model domain that are caused by the ECMWF-CAMS side constraints since the same can be seen in the background CO tracer of WRF for the day shown in Fig. 4.
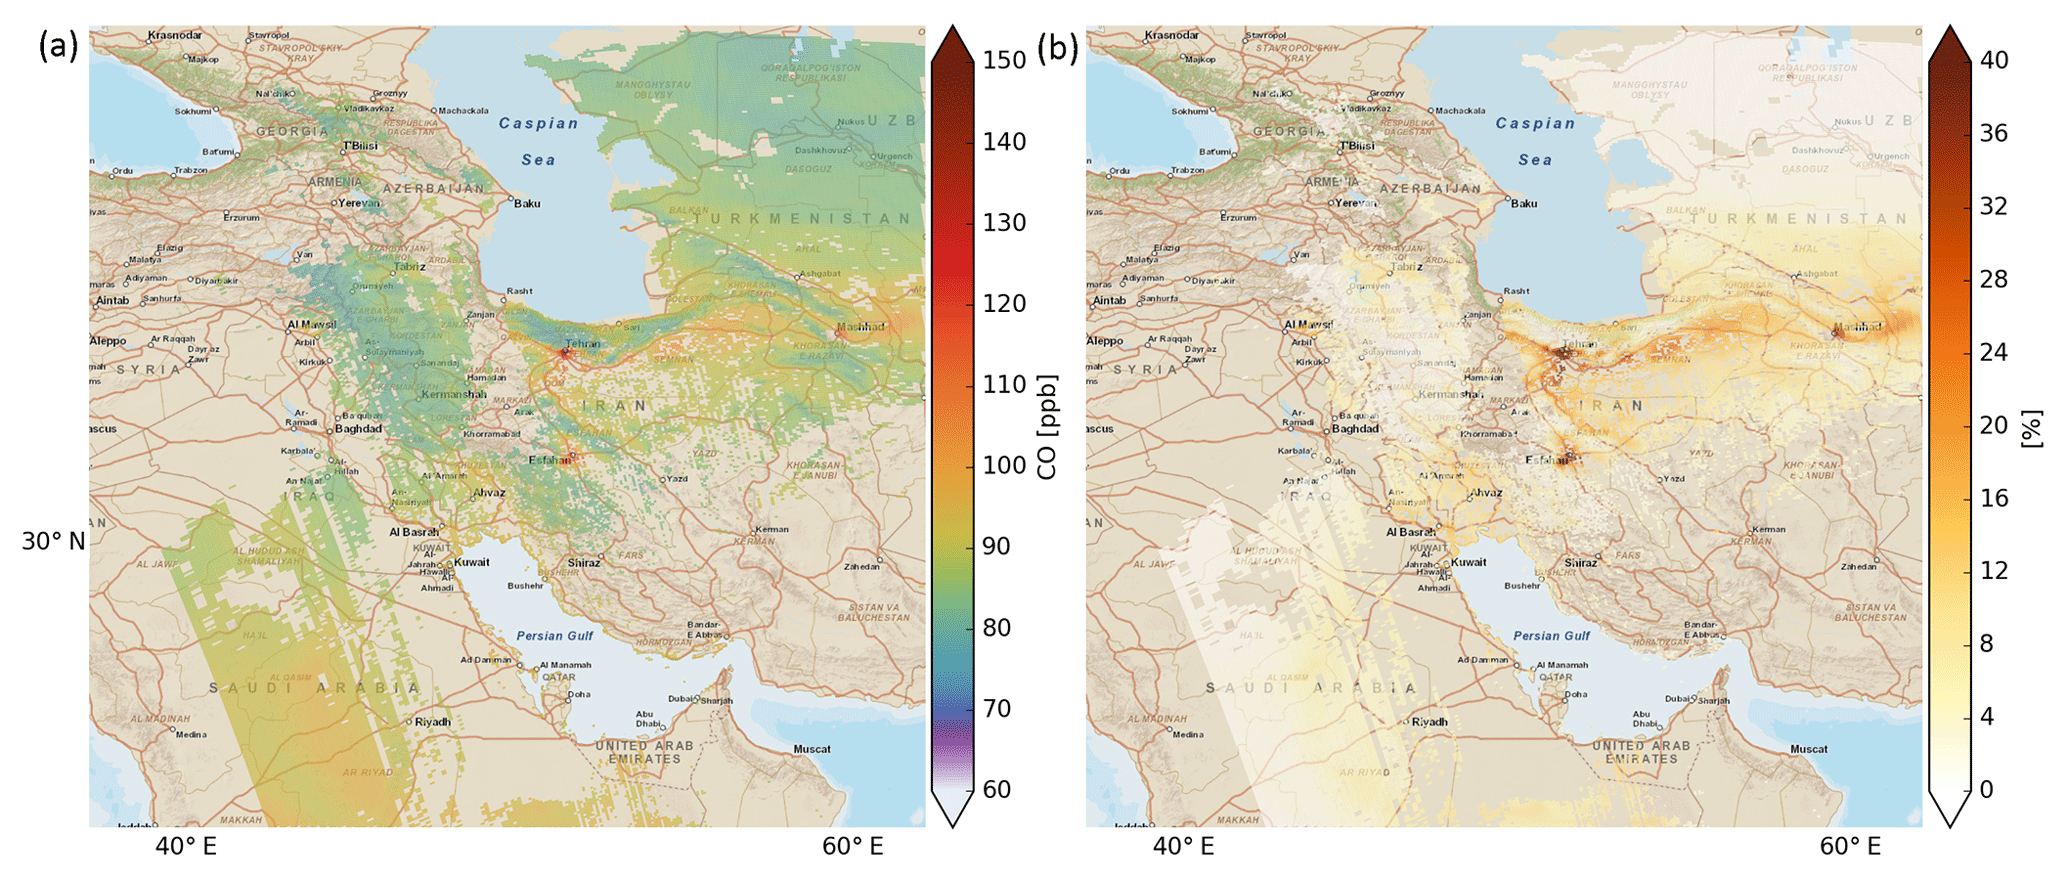
Figure 4WRF simulation for 18 December 2017 09:37 UTC collocated and fitted to the TROPOMI data (a), and the relative difference of the WRF simulated total column to the background CO tracer column (100 × (WRF − background)/background).
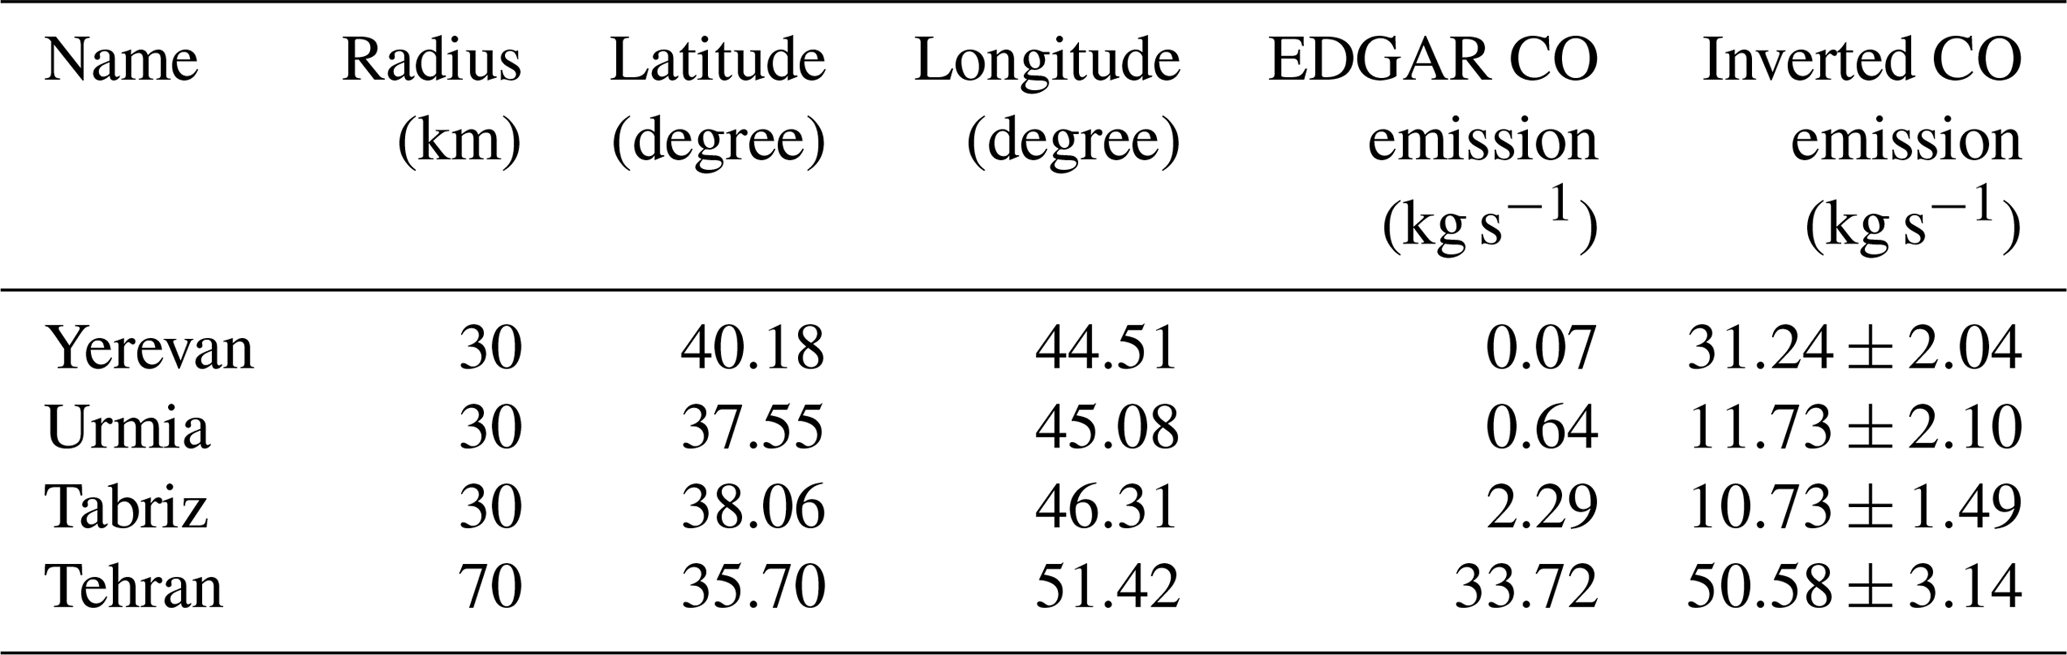
To disentangle the CO emissions from different urban areas, we isolated the EDGAR CO emissions of several cities from the remaining emissions and treated them as individual tracers. Figure 2 shows the selected city emissions from the EDGAR inventory within a 70 km radius around Tehran and with 30 km around the cities of Yerevan, Tabriz, and Urmia. Alternatively, the Yerevan emissions can be replaced by a spatially extended emission source covering the city including an arterial road. The strengths of the city emission sources are summarized in Table 1.
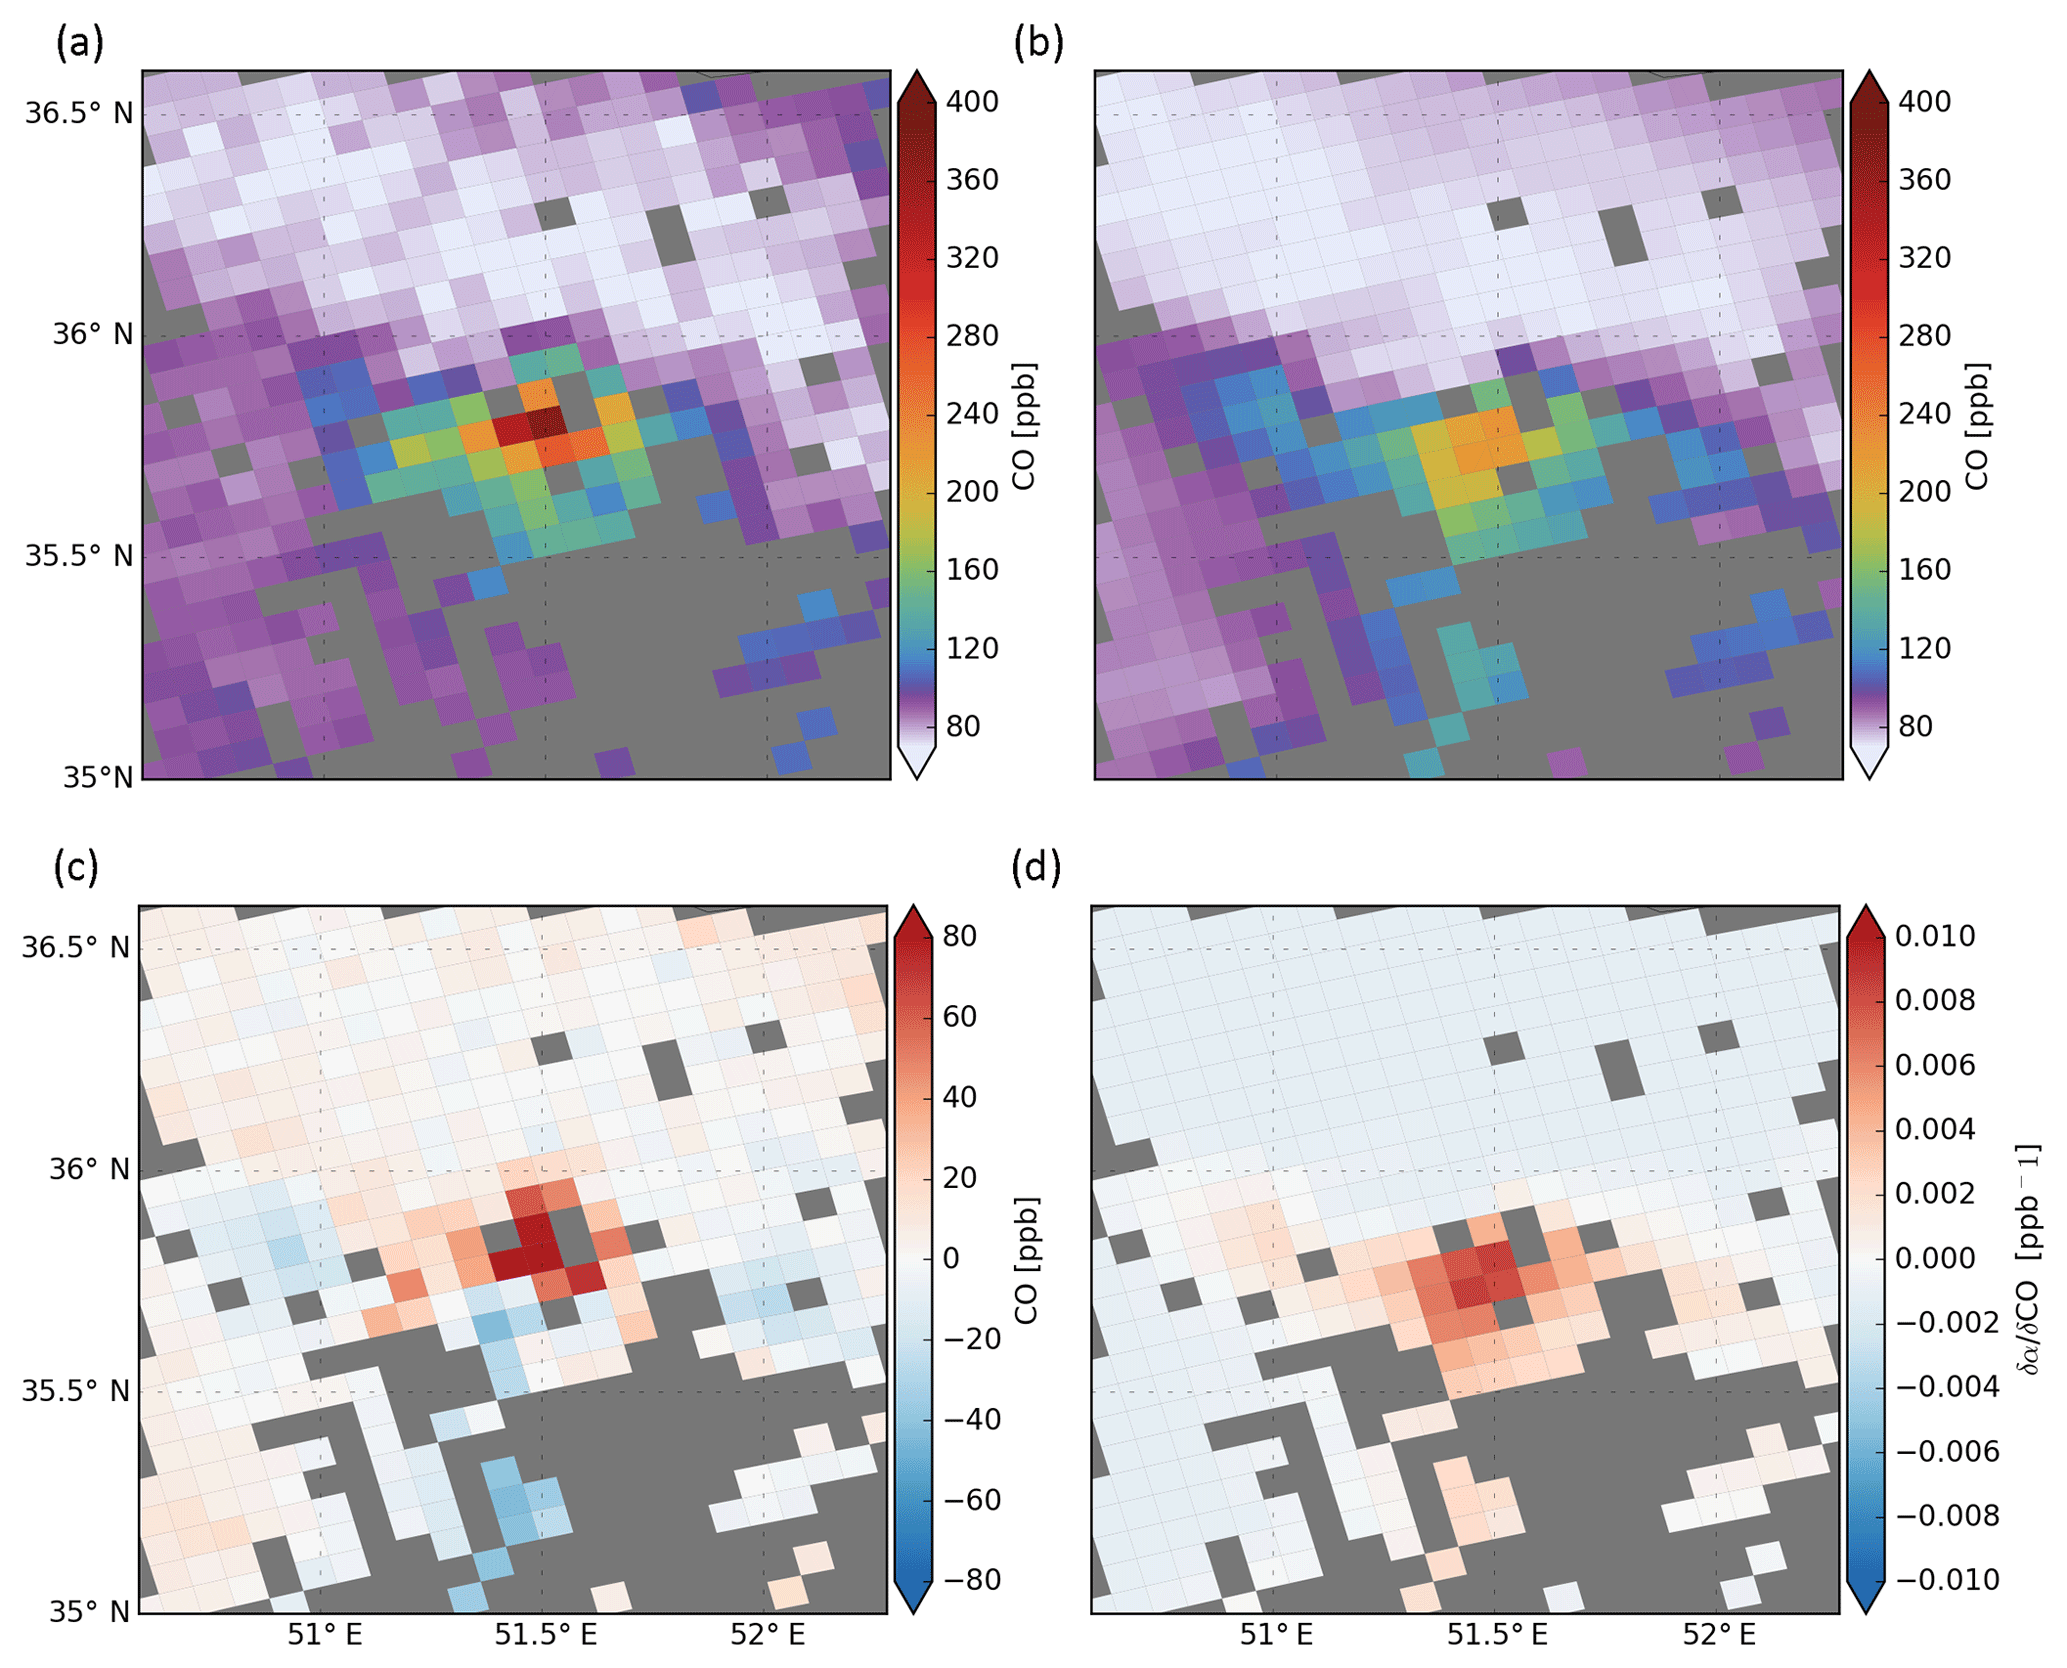
Figure 5TROPOMI CO retrieval above Tehran on the 18 December 2017 (a), the collocated WRF simulation scaled to the TROPOMI data (b), the difference between the TROPOMI and scaled WRF data (TROPOMI − WRF, c), and the sensitivity of fitting the WRF data to the TROPOMI retrieval (d).
Assuming the linearity of the simulated CO concentration with respect to the source strength of a tracer, we can express the total CO columns of the WRF simulation by a superposition of the individual tracers, namely
with
where the CO fields from the individual hot spots are named by the corresponding cities, COCO denotes the background field originating from the ECMWF-CAMS boundary conditions, and COrest summarizes the contribution of the remaining EDGAR sources. The different coefficients of vector α describe a scaling of the corresponding CO fields and thus can be adjusted to fit the TROPOMI CO observations in the spatial domain of interest. Having the different tracer fields available, we fitted the coefficients α shown in Eq. (2) with a standard least-squares method to improve the match between the simulated CO fields and the TROPOMI observations. Here, the sensitivity of the scaling factors to changes in the measured CO field COTROPOMI is described by the partial derivative as a result of the least-squares fitting. Hence, the optimization of the CO fields yields the relative change of the emission for the different tracer sources, where we estimate the corresponding uncertainties by bootstrapping. To this end, we created 1000 data samples by repeatedly reducing the TROPOMI data to 50 % of the original data volume. Subsequently for each of those samples we estimated the emission sources with the approach described above. The statistics of the results are shown in Table 1, which reports the mean and the standard deviation calculated from the emission estimates of the 1000 data samples as a robust error estimate. The fitting of the tracer fields improves the agreement between TROPOMI and WRF; however we still see significant differences on sub-city scales, and missing emissions in the EDGAR inventory hamper the interpretation of the TROPOMI data. These points will be discussed in the following sections.
Table 1CO emissions extracted from the EDGAR inventory in a radius around the indicated cities and inverted from the TROPOMI CO retrievals shown in Fig. 3. on 18 December 2017.
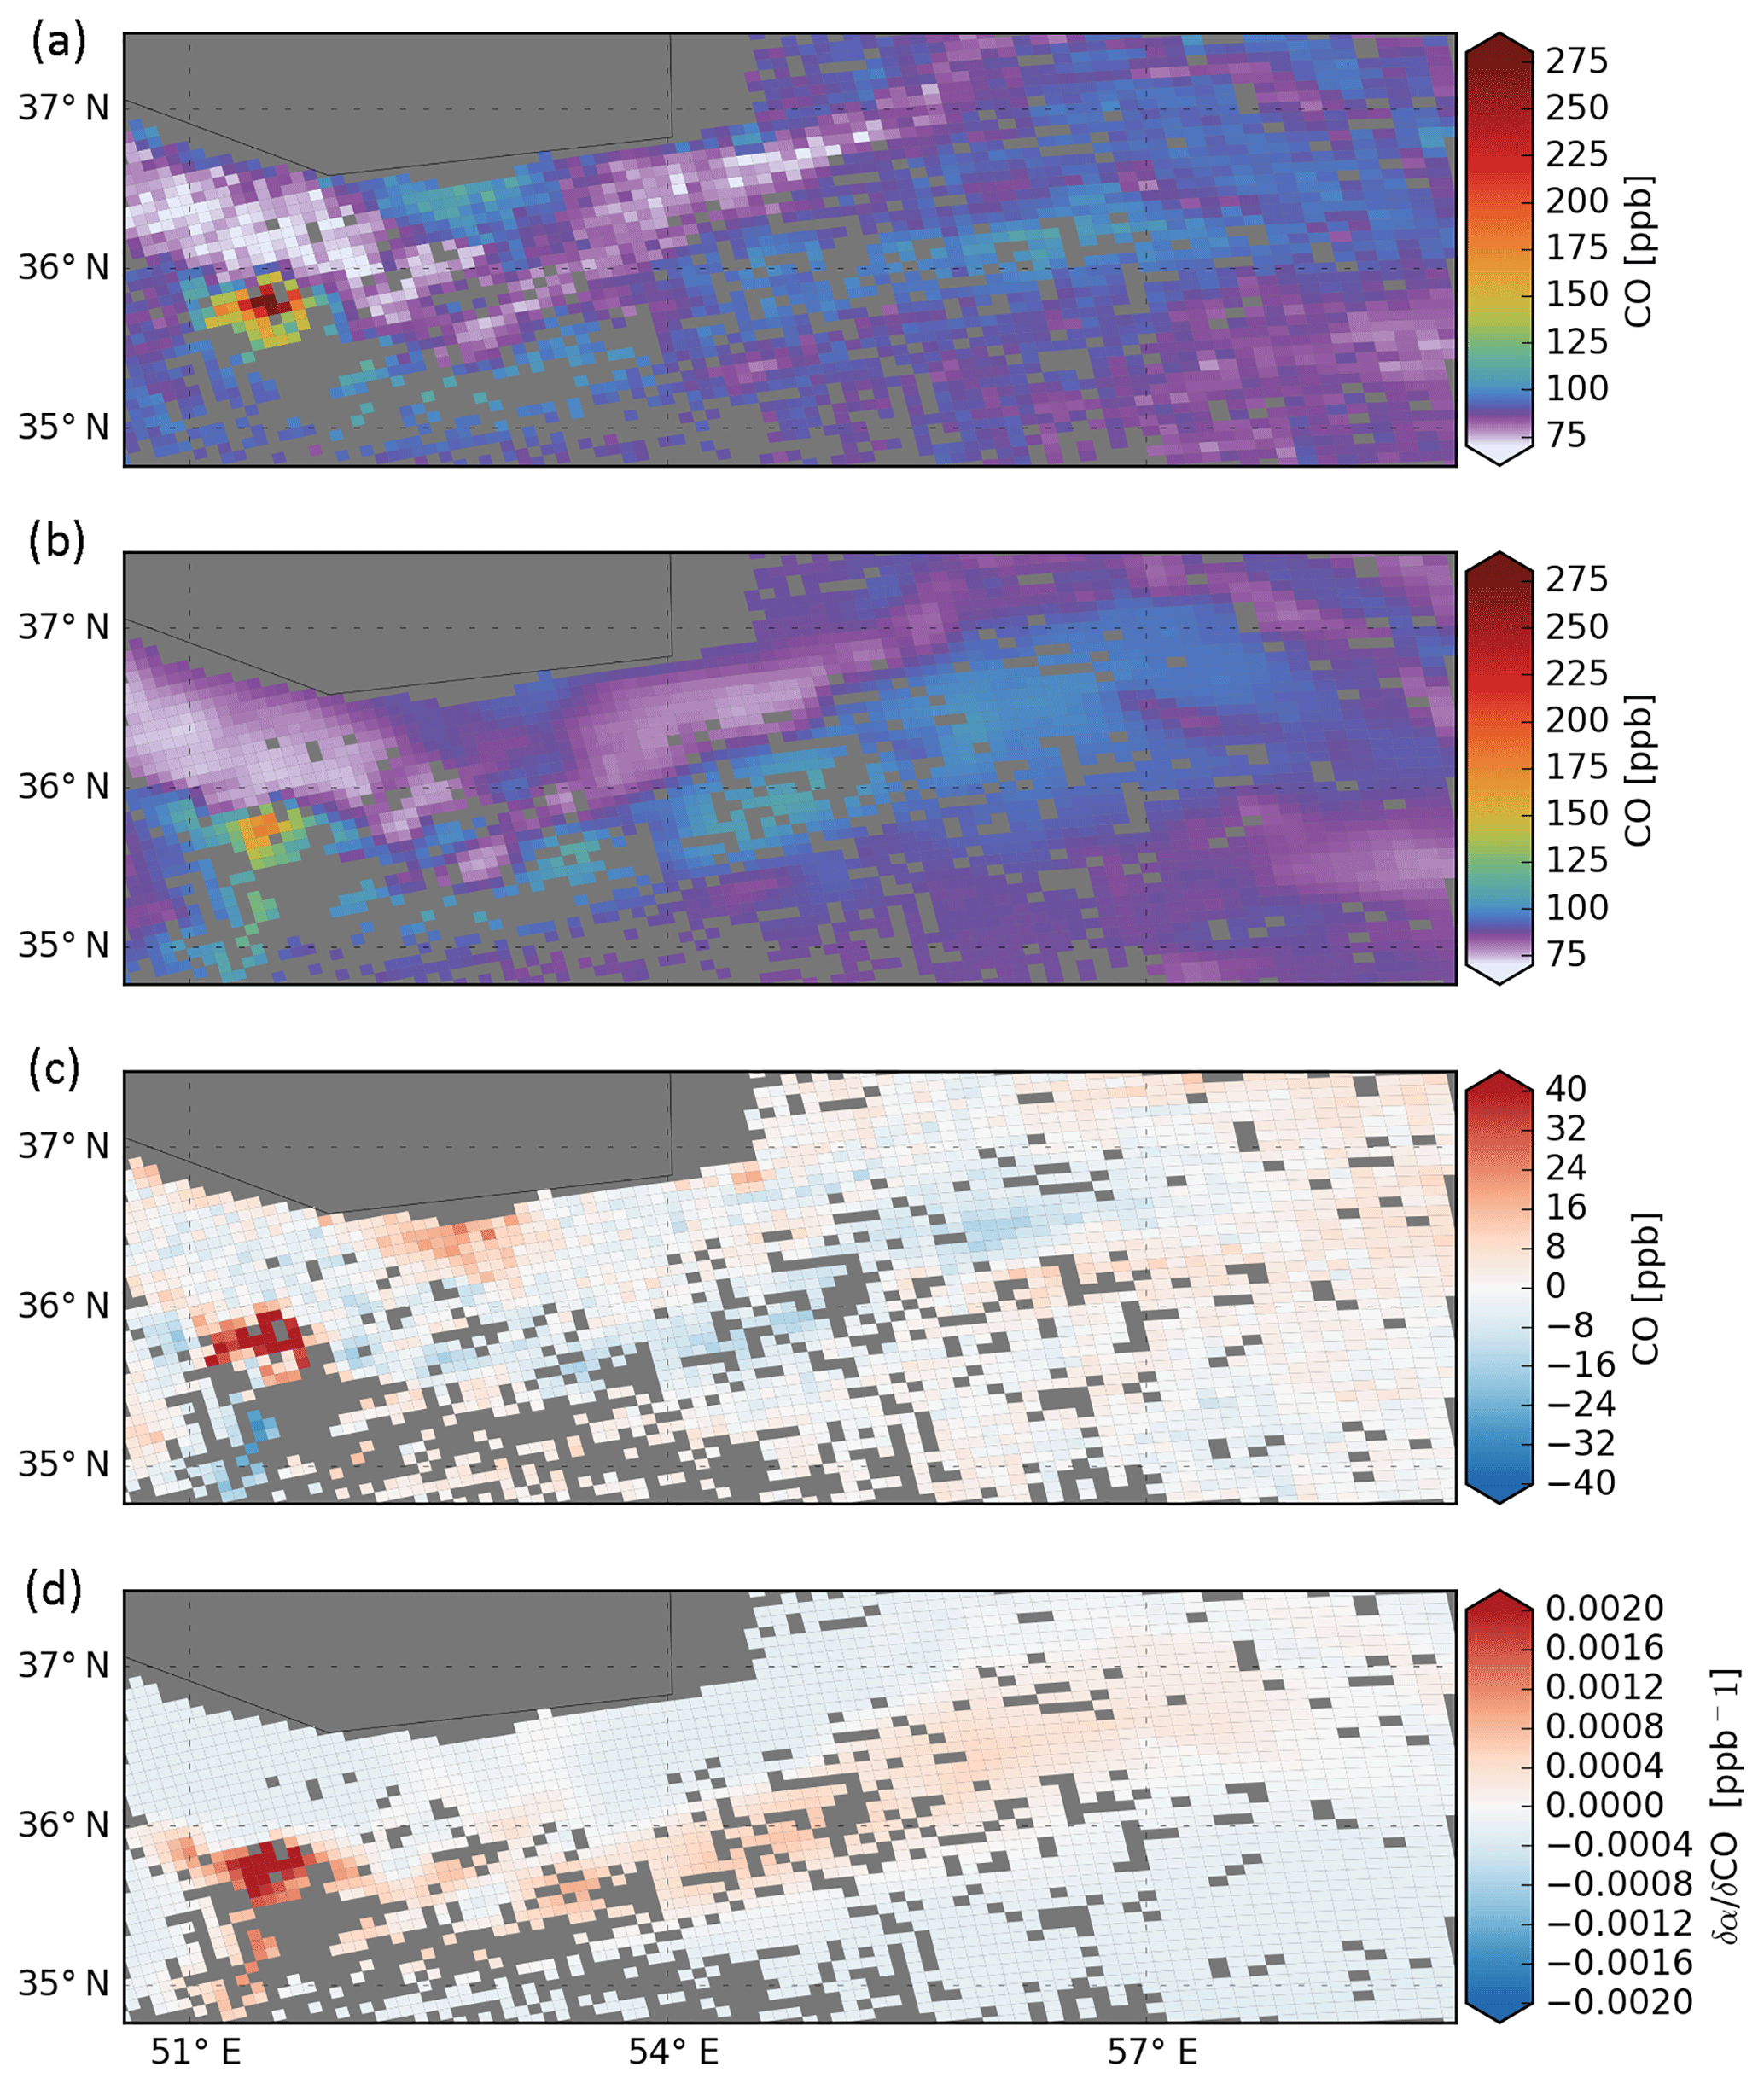
3.2 Sensing pollution on sub-city scales in Tehran
The city of Tehran shows clearly enhanced CO concentrations well isolated from the low surrounding background concentration of about 80 ppb that is pronounced in many TROPOMI overpasses over Tehran. Figure 5 compares the TROPOMI CO measurements with the WRF simulation over Tehran for 18 December 2017 09:37 UTC. The WRF data (Fig. 5b) were fitted to the TROPOMI measurements (Fig. 5a) by scaling WRF's background CO field with and the Tehran emissions with . The other CO tracer fields of WRF were kept unchanged. Overall, the simulation and the TROPOMI data agree well; however, still significant differences between the model and TROPOMI remain at the city of Tehran (Fig. 5c). This suggests that TROPOMI can sense pollution hot spots on sub-city scales that are not well reflected by the model. Even though the fit shows a high sensitivity for CO at the center of Tehran (Fig. 5d) a trustworthy emission estimate is only possible when those differences are reduced. To this end, the model calculation needs emission inventories that more realistically reflect the spatial distribution of the pollution sources within the hot spot including temporal resolution, which is not provided by the EDGAR inventory used. Modeling CO on sub-city scales is challenging for the WRF model, and the doubling of the EDGAR emissions for the city of Tehran that is inferred from the TROPOMI measurements must be considered with caution.
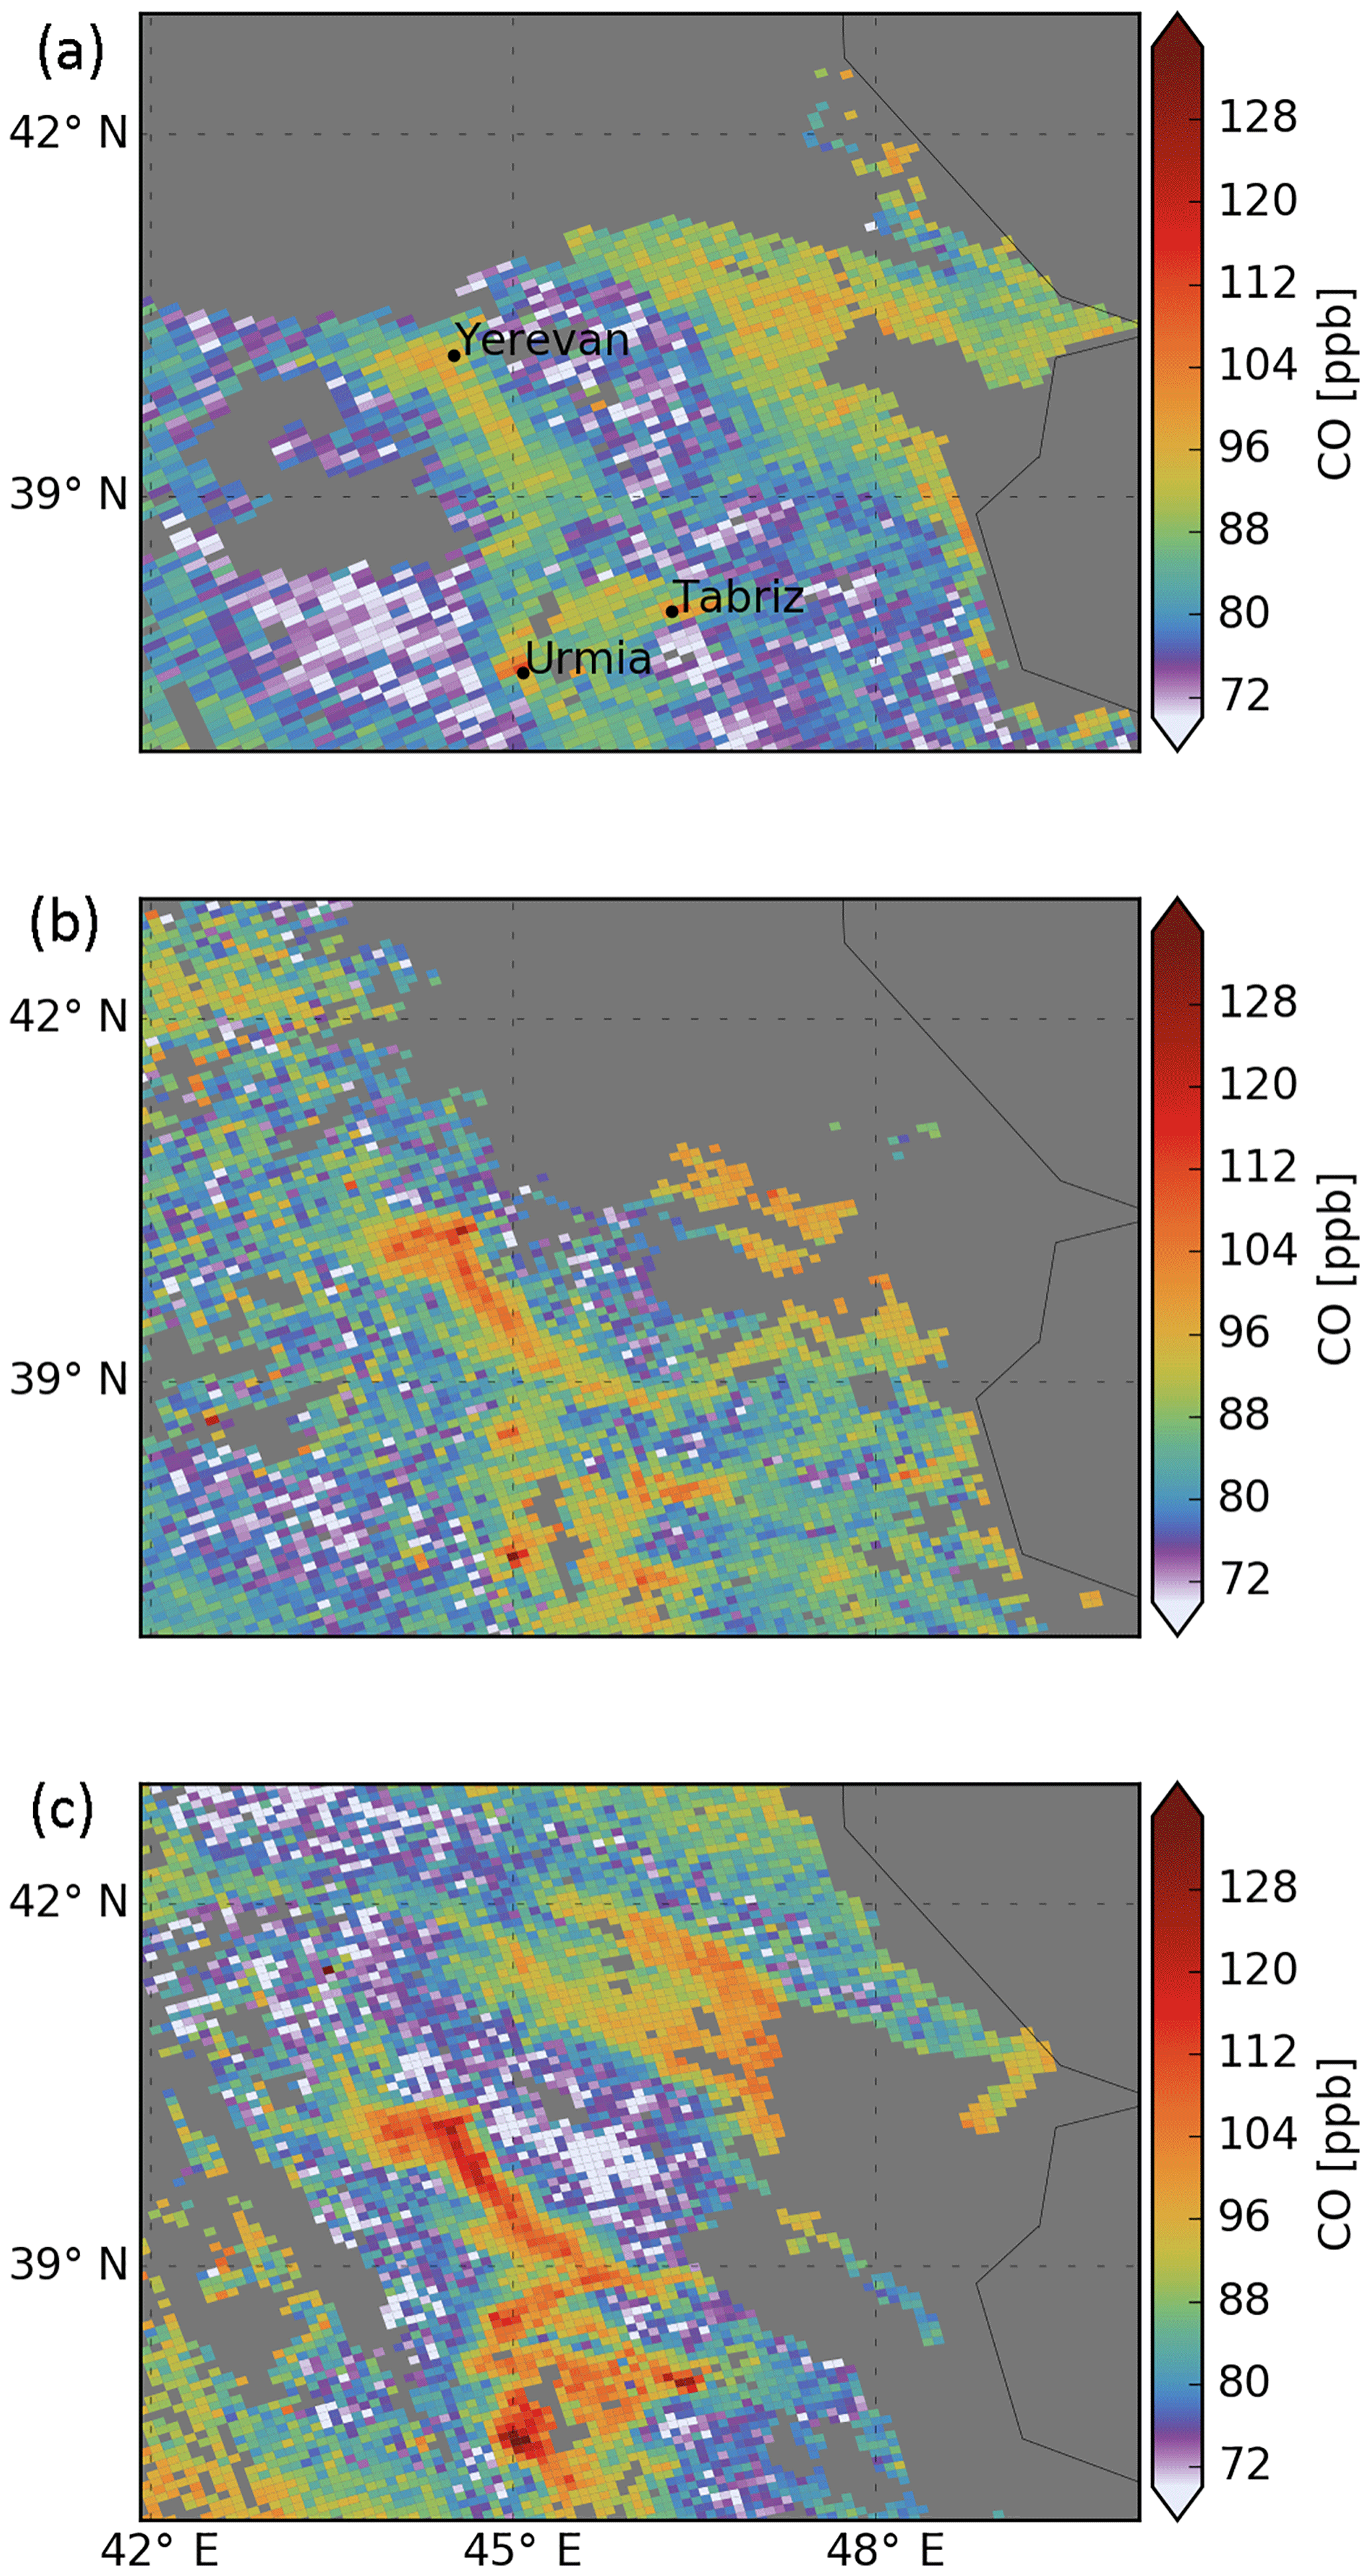
Figure 7Sequence of high-CO pollution events measured by TROPOMI on (a) 27 November 09:31 UTC, (b) 12 November 09:50 UTC, and (c) 17 December 2017 09:56 UTC above Armenia. The panels show the same region as in the lower part of Fig. 2.
On 18 December 2017 the pollution of Tehran was transported up to 600 km eastward and the corresponding CO plume is nicely reflected in both the TROPOMI data and the WRF simulation, as shown in Fig. 6. Fitting the model to the TROPOMI data over the entire plume domain results in a scaling of the EDGAR Tehran emissions by and , but when leaving out the urban area of Tehran, the source inversion results in a scaling of of the EDGAR emissions. The inconsistency of the emission estimates may come from an inappropriate simulation of the hot spot as mentioned above but may also be caused by temporal variability of the emission at Tehran or small errors in the wind fields, thereby causing shifts in the downwind area. Based on the EDGAR inventory, the WRF simulations assume time-invariant emissions. However, the transport of 600 km needs about 33 h assuming a wind speed of about 5 m s−1. Hence, the plume could reflect a different source strength that changed through time.
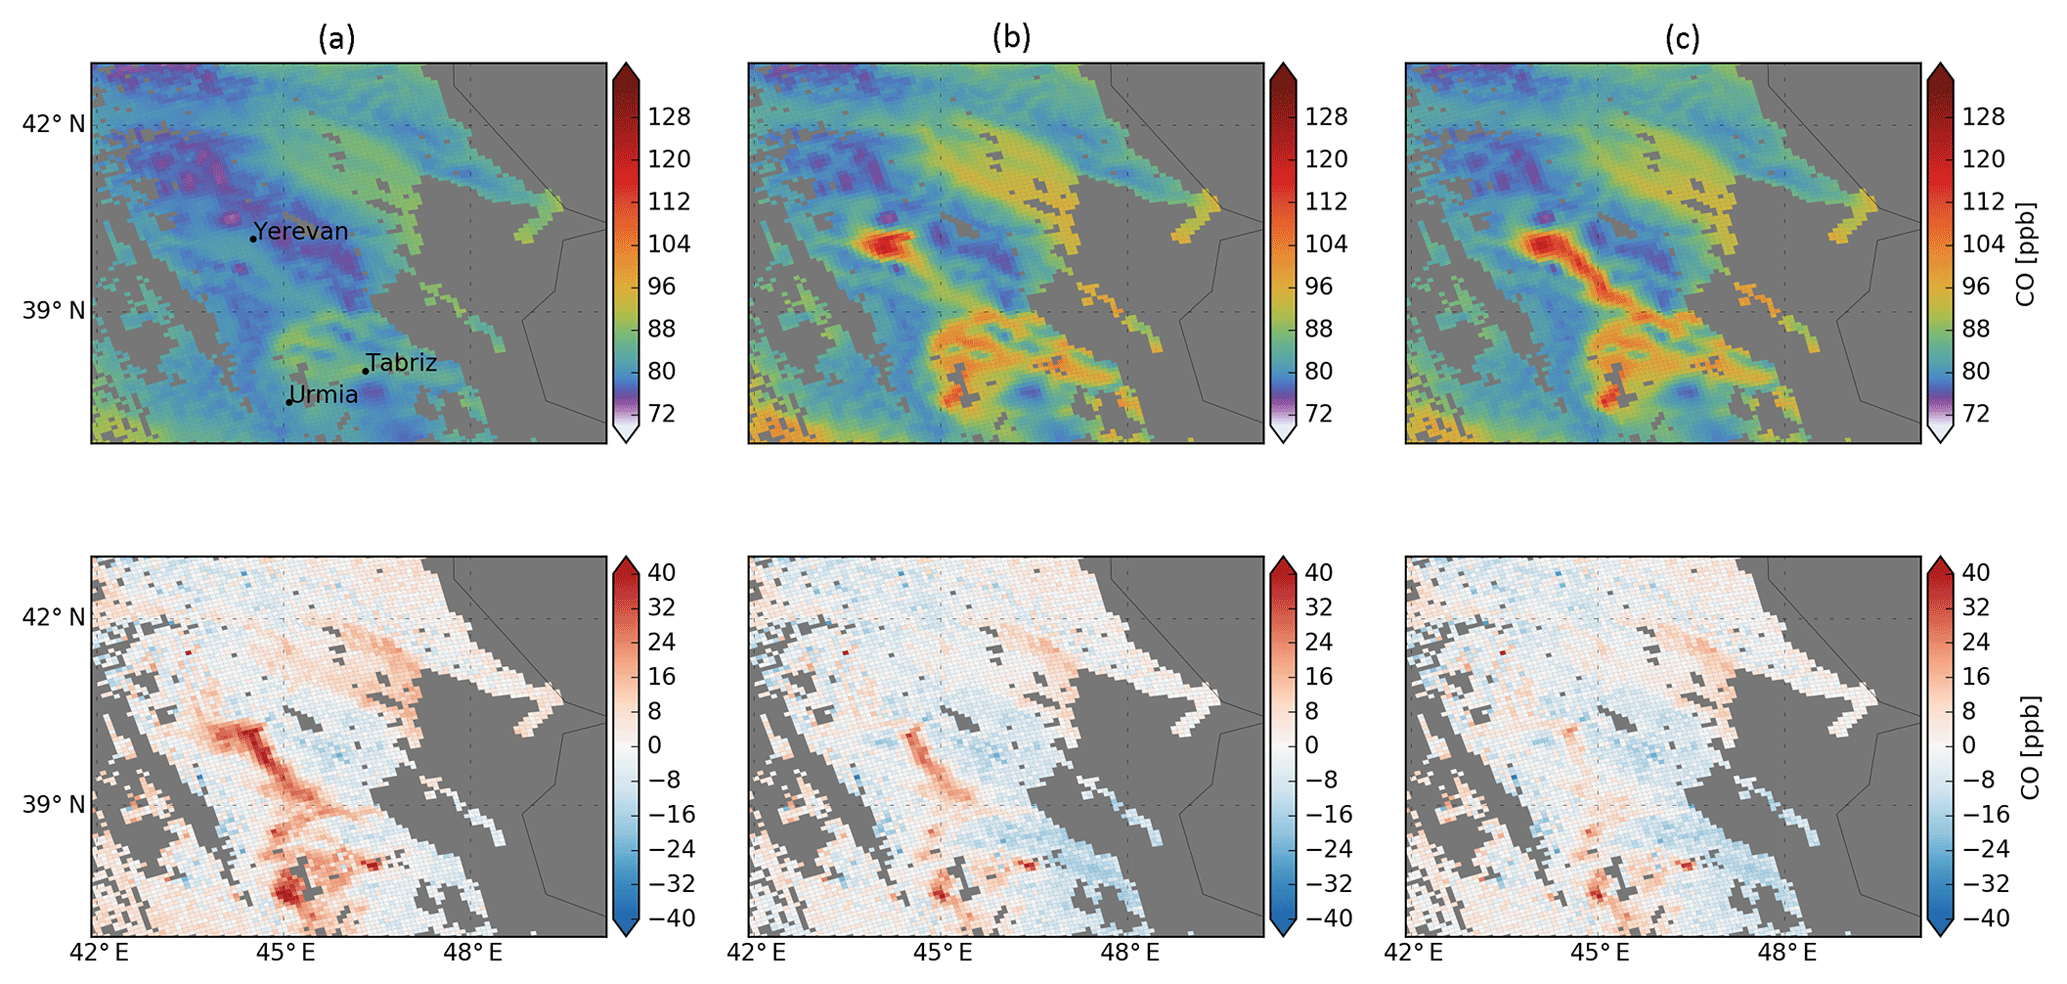
Figure 8Comparison of TROPOMI CO and WRF (top row: WRF simulation; lower row: difference, TROPOMI − WRF) on 17 December 2017 09:56 UTC above Armenia. (a) WRF run with EDGAR emissions. (b) WRF run with adjusted emissions for Yerevan, Tabriz, and Urmia. (c) WRF run with adjusted emission of Yerevan, Tabriz, and Urmia and the traffic route near Yerevan.
3.3 Sensing pollution along main traffic roads
On 27 November 09:31 UTC, 12 November 09:50 UTC, and 17 December 2017 09:56 UTC, TROPOMI detected a sequence of strong CO pollution events near the city of Yerevan in Armenia, which are depicted in Fig. 7. The enhancements in CO show a clear time dependency, probably due to varying local meteorology. The high CO concentration follows the orographic pattern of the region in Fig. 3 and indicates an accumulation of pollution in the mountainous region. Furthermore, CO pollution hot spots at the cities of Urmia and Tabriz are clearly visible. Here, the WRF tracer transport simulations of CO are used to conclude on the strength of the emission sources and how local winds impact the strong CO enhancement sensed by TROPOMI. The CO enhancement cannot be explained by the background signal and the sensitivity of the different hot spots can be clearly separated in this region. Figure 8 compares the 17 December pollution event measured by TROPOMI with the corresponding WRF simulation. Using the original EDGAR emissions without scaling, the large differences indicate that the enhancement cannot be explained by atmospheric transport as simulated by WRF and indicate an underestimation of the CO emissions in the EDGAR data. In this case the root-mean-square (rms) difference between the WRF simulation and TROPOMI is 3.38 ppb.
Table 2Emissions (kg s−1) estimated from the TROPOMI measurements shown in Fig. 7. First three rows: when fitting the emission of Yerevan, Tabriz, and Urmia; last three rows: when fitting the emission of Tabriz, Urmia, and an assumed pollution along a traffic route near Yerevan.
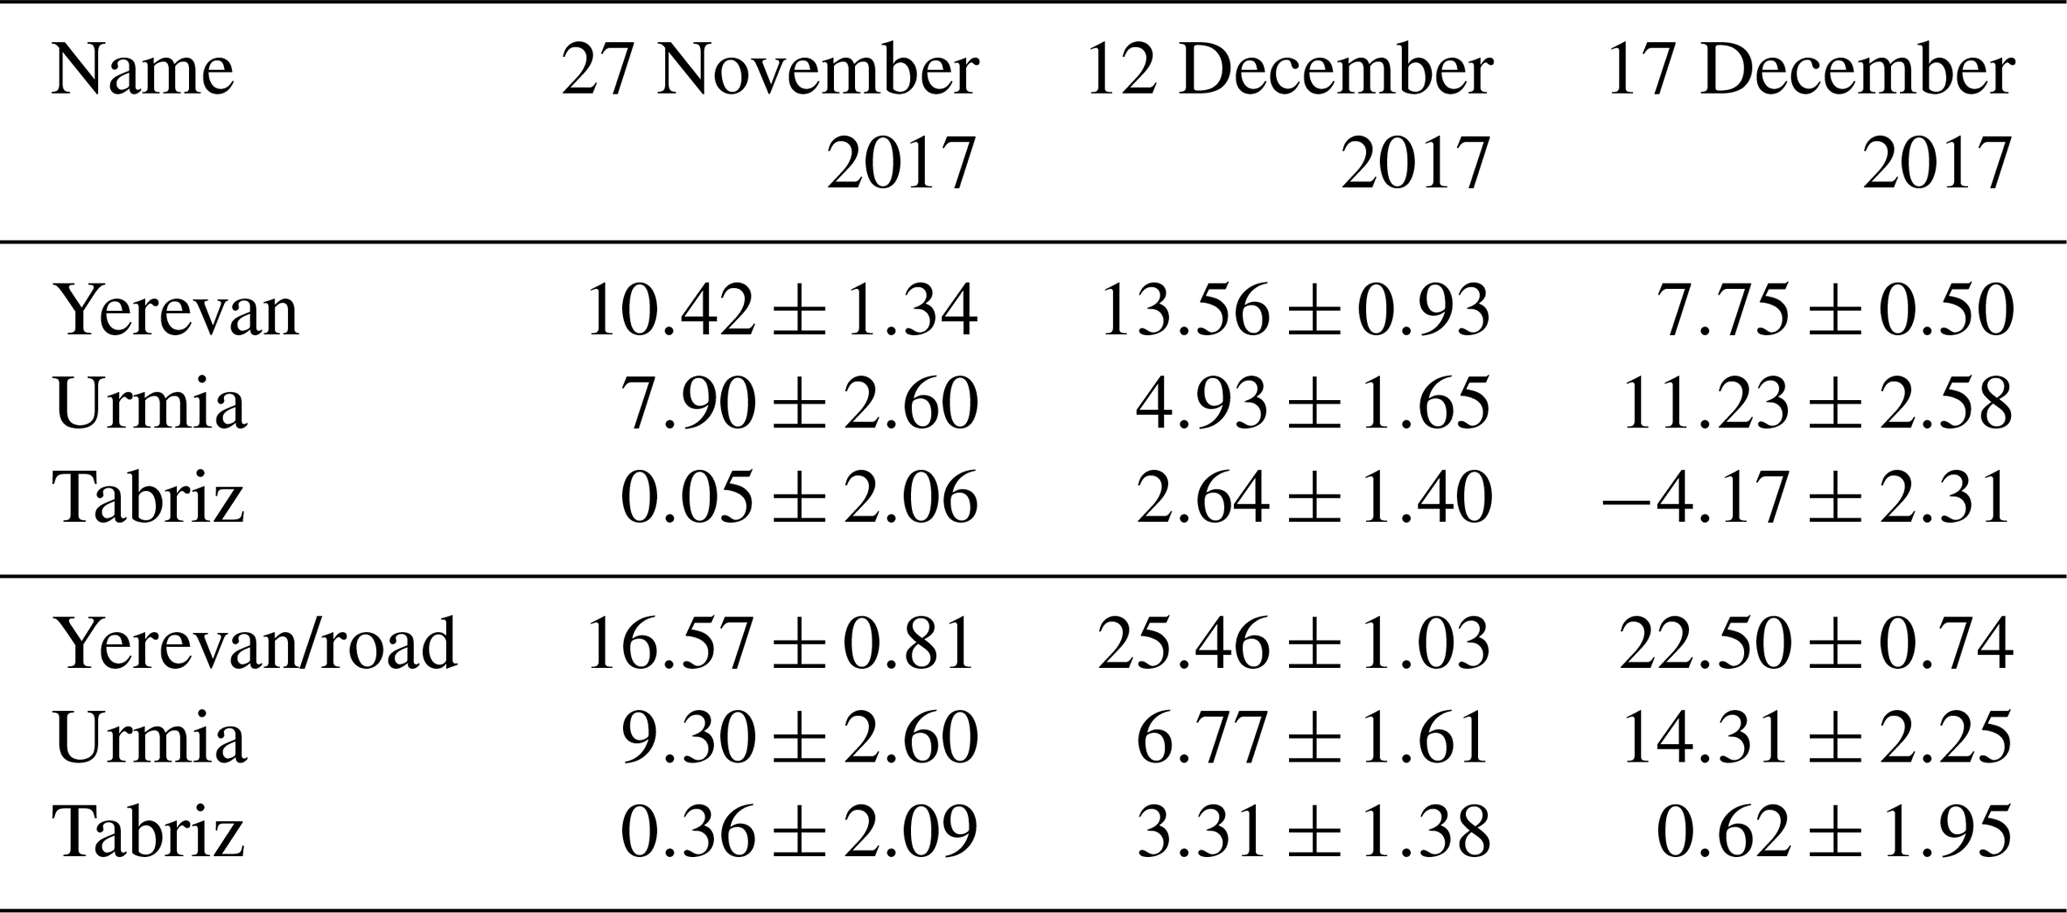
The two middle panels of Fig. 8 show the situation after adjusting the urban emission strengths by the optimized scaling factors αYerevan, αTabriz, and αUrmia, and these emissions are summarized in the first three rows of Table 2. Here, the emissions of the remaining tracers COTehran and COrest were not adjusted. The results indicate that the prior assumed emissions are too low for Tabriz and far too low for Yerevan and Urmia. After adjusting the emission sources, the WRF simulation can reproduce to a major extent the observed regional CO enhancement. It is remarkable how well the WRF model describes the pollution at Tabriz and Urmia and the nearby valley. Also, the accumulation of CO pollution from Yerevan westward of the city is well reproduced by the model, but still a large difference remains southeast of the city. The rms difference between WRF and TROPOMI is reduced to 2.52 ppb.
To account for the residuals, we extended the emission pattern of Yerevan along a main traffic roadway of the city, as indicated in Fig. 2. After fitting the emissions, the agreement between the TROPOMI observations and WRF simulations is further improved (see panels of Fig. 8c) with a rms difference of 2.29 ppb. The estimated emissions are shown in the last three rows of Table 2. The improved fit convincingly shows the need for a more extended emission source along the arterial road of the city, which is not represented in the current EDGAR inventory but could be identified with TROPOMI CO measurements. Obviously, the CO measurements cannot attribute missing emissions to specific processes. So both high traffic load and/or other activities, e.g., industrial, along the road may explain our findings. Table 2 also summarizes the emission estimates for the other days, 27 November and 12 December, which indicates emission of similar magnitude but with some temporal variability. Follow-up studies must show if this variability can be attributed to a variation of the emission sources or to biases of the inversion approach used. For 17 December, we found negative emissions for Tabriz that are slightly higher than the estimated error. Moreover, looking at the result for individual cities, in this area, we recognize remaining differences after optimization of the emissions. As discussed for Tehran in the previous subsection, we assume that TROPOMI is sensitive to pollution patterns at the sub-city scale that are not well reflected by the EDGAR dataset, which may lead to these biases.
In this study, we compared TROPOMI CO total column densities with CO tracer simulations of the WRF model v3.8.1 for a regional domain centered over Iran from 1 November to 20 December 2017 with a spatial resolution comparable to that of TROPOMI (7 km×7 km). Anthropogenic surface emissions of the simulations are based on the EDGARv4.2 emission inventory. Considering the CO emissions from the cities of Yerevan, Tehran, Urmia, and Tabriz as independent atmospheric tracers allowed us to infer the strength of CO surface emissions from the observed CO enhancements in the TROPOMI data. For comparing TROPOMI CO data with model simulations, it was necessary to bring both datasets to the same spatiotemporal sampling and to apply column averaging kernels of the TROPOMI product to the model data even though this introduces computationally expensive operations.
When looking over the full domain, we found that the WRF simulations using EDGAR emissions are in good agreement with the TROPOMI measurements with a mean difference of 5.7 %. Both TROPOMI and WRF show the same large-scale variation in CO over the region considered. A CO pollution plume seen by TROPOMI with an extension of 600 km and its origin at Tehran could be simulated well by the WRF model considering synoptic transport of CO emissions from the city. On city scales we identified significant differences between the model simulation and TROPOMI observations, which we attribute to shortcomings in the EDGAR inventory due to time-invariant emissions, underestimation of existing emission sources, and a lack of sufficient emission sources in Armenia. An additional source of uncertainty might be the capability of the WRF model to simulate CO on sub-city scales, which is further limited by the availability of appropriate emission inventories but also the challenging task of modeling wind fields on this scale.
For Tehran, we show that the spatial emission patterns of the dataset are not consistent with the TROPOMI observations, hinting at problems of the emission inventory at sub-city scales. The strong CO enhancements over Yerevan, Urmia, and Tabriz seen by TROPOMI are only reflected by the model after substantially adjusting the emission strength of the city emissions. Additionally, a series of pollution events near Yerevan can only be reproduced by WRF simulations when CO emissions along an arterial road are introduced in addition to the EDGARv4.2 inventory.
In this study, we showed that the TROPOMI CO dataset is capable of distinguishing CO pollution on city and sub-city scales and can even detect CO pollution along an arterial road. We demonstrated that TROPOMI can identify new emission sources and can thereby help to fill gaps in emission inventories, which at the same time challenges atmospheric modeling on the spatial and temporal scales observed by TROPOMI. An interesting topic for follow-up studies is to apply the method presented in this publication to other regions worldwide. For this it is important to restrict the analysis to clear-sky-only scenes to ensure that the TROPOMI CO retrieval is sensitive for boundary layer pollution. Moreover, for bigger cities pollution on sub-city scales becomes more important and may need adjustment of the inversion approach.
The TROPOMI CO dataset and the WRF simulations of this study are available for download at ftp://ftp.sron.nl/pub/pub/DataProducts/TROPOMI_CO/ (SRON, 2019a). The underlying data of the figures presented in this publication can be found at ftp://ftp.sron.nl/open-access-data-2/TROPOMI/tropomi/co/ (SRON, 2019b).
TB, JadB, OH, and JL provided the TROPOMI CO retrieval and data analysis. SP, IA, and SH are responsible for the WRF simulation. JL supervised the study. All authors discussed the results and commented on the manuscript.
The authors declare that they have no conflict of interest.
The presented work has been performed in the frame of the Sentinel-5 Precursor Validation Team (S5PVT) or Level 1/Level 2 Product Working Group activities. Results are based on preliminary (not fully calibrated/validated) Sentinel-5 Precursor data that might change in the future.
This article is part of the special issue “TROPOMI on Sentinel-5 Precursor: first year in operation (AMT/ACPT inter-journal SI)”. It is not associated with a conference.
We would like to thank the team that designed the TROPOMI instrument, consisting of the partnership between Airbus Defense and Space, KNMI, SRON, and TNO and commissioned by the Netherlands Space Office (NSO) and the European Space Agency (ESA). The Sentinel-5 Precursor is a ESA mission on behalf of the European Commission (EC). The TROPOMI payload is a joint development by ESA and the NSO. The Sentinel-5 Precursor ground-segment development has been funded by ESA and with national contributions from the Netherlands, Germany, and Belgium. This research has been funded in part by the TROPOMI national program from the NSO. The TROPOMI data processing was carried out on the Dutch national e-infrastructure with the support of the SURF Cooperative. The work contains modified Copernicus Atmosphere Monitoring Service Information (2017). Neither the European Commission nor ECMWF is responsible for any use that may be made of the Copernicus information or data it contains.
This paper was edited by Hartmut Boesch and reviewed by three anonymous referees.
Borsdorff, T., Hasekamp, O. P., Wassmann, A., and Landgraf, J.: Insights into Tikhonov regularization: application to trace gas column retrieval and the efficient calculation of total column averaging kernels, Atmos. Meas. Tech., 7, 523–535, https://doi.org/10.5194/amt-7-523-2014, 2014. a, b
Borsdorff, T., aan de Brugh, J., Hu, H., Hasekamp, O., Sussmann, R., Rettinger, M., Hase, F., Gross, J., Schneider, M., Garcia, O., Stremme, W., Grutter, M., Feist, D. G., Arnold, S. G., De Mazière, M., Kumar Sha, M., Pollard, D. F., Kiel, M., Roehl, C., Wennberg, P. O., Toon, G. C., and Landgraf, J.: Mapping carbon monoxide pollution from space down to city scales with daily global coverage, Atmos. Meas. Tech., 11, 5507–5518, https://doi.org/10.5194/amt-11-5507-2018, 2018a. a, b, c, d
Borsdorff, T., de Brugh, J. A., Hu, H., Aben, I., Hasekamp, O., and Landgraf, J.: Measuring Carbon Monoxide With TROPOMI: First Results and a Comparison With ECMWF-IFS Analysis Data, Geophys. Res. Lett., 45, 2826–2832, https://doi.org/10.1002/2018GL077045, 2018b. a, b, c, d
Crippa, M., Janssens-Maenhout, G., Dentener, F., Guizzardi, D., Sindelarova, K., Muntean, M., Van Dingenen, R., and Granier, C.: Forty years of improvements in European air quality: regional policy-industry interactions with global impacts, Atmos. Chem. Phys., 16, 3825–3841, https://doi.org/10.5194/acp-16-3825-2016, 2016. a
Dekker, I. N., Houweling, S., Aben, I., Röckmann, T., Krol, M., Martínez-Alonso, S., Deeter, M. N., and Worden, H. M.: Quantification of CO emissions from the city of Madrid using MOPITT satellite retrievals and WRF simulations, Atmos. Chem. Phys., 17, 14675–14694, https://doi.org/10.5194/acp-17-14675-2017, 2017. a, b
Dekker, I. N., Houweling, S., Pandey, S., Krol, M., Röckmann, T., Borsdorff, T., Landgraf, J., and Aben, I.: What caused the extreme CO concentrations during the 2017 high pollution episode in India?, Atmos. Chem. Phys. Discuss., https://doi.org/10.5194/acp-2018-1061, in review, 2018. a
ESA: Sentinel-5P Pre-Operations Data Hub, https://s5phub.copernicus.eu/dhus/ (last access: 12 March 2019), 2018. a
Farr, T. G., Rosen, P. A., Caro, E., Crippen, R., Duren, R., Hensley, S., Kobrick, M., Paller, M., Rodriguez, E., Roth, L., Seal, D., Shaffer, S., Shimada, J., Umland, J., Werner, M., Oskin, M., Burbank, D., and Alsdorf, D.: The Shuttle Radar Topography Mission, Rev. Geophys., 45, 8755–1209, https://doi.org/10.1029/2005rg000183, 2007. a
George, M., Clerbaux, C., Bouarar, I., Coheur, P.-F., Deeter, M. N., Edwards, D. P., Francis, G., Gille, J. C., Hadji-Lazaro, J., Hurtmans, D., Inness, A., Mao, D., and Worden, H. M.: An examination of the long-term CO records from MOPITT and IASI: comparison of retrieval methodology, Atmos. Meas. Tech., 8, 4313–4328, https://doi.org/10.5194/amt-8-4313-2015, 2015. a
Gloudemans, A. M. S., de Laat, A. T. J., Schrijver, H., Aben, I., Meirink, J. F., and van der Werf, G. R.: SCIAMACHY CO over land and oceans: 2003–2007 interannual variability, Atmos. Chem. Phys., 9, 3799–3813, https://doi.org/10.5194/acp-9-3799-2009, 2009. a
Grell, G. A. and Freitas, S. R.: A scale and aerosol aware stochastic convective parameterization for weather and air quality modeling, Atmos. Chem. Phys., 14, 5233–5250, https://doi.org/10.5194/acp-14-5233-2014, 2014. a
Grell, G. A., Peckham, S. E., Schmitz, R., McKeen, S. A., Frost, G., Skamarock, W. C., and Eder, B.: Fully coupled “online” chemistry within the WRF model, Atmos. Environ., 39, 6957–6975, https://doi.org/10.1016/j.atmosenv.2005.04.027, 2005. a
Holloway, T., Levy, H., and Kasibhatla, P.: Global distribution of carbon monoxide, J. Geophys. Res.-Atmos., 105, 12123–12147, https://doi.org/10.1029/1999jd901173, 2000. a
Hu, X.-M., Klein, P. M., and Xue, M.: Evaluation of the updated YSU planetary boundary layer scheme within WRF for wind resource and air quality assessments, J. Geophys. Res.-Atmos., 118, 10490–10505, https://doi.org/10.1002/jgrd.50823, 2013. a
Krol, M., Houweling, S., Bregman, B., van den Broek, M., Segers, A., van Velthoven, P., Peters, W., Dentener, F., and Bergamaschi, P.: The two-way nested global chemistry-transport zoom model TM5: algorithm and applications, Atmos. Chem. Phys., 5, 417–432, https://doi.org/10.5194/acp-5-417-2005, 2005. a
Landgraf, J., aan de Brugh, J., Borsdorff, T., Houweling, S., and Hasekamp, O.: Algorithm Theoretical Baseline Document for Sentinel-5 Precursor: Carbon Monoxide Total Column Retrieval, Atbd, SRON, Sorbonnelaan 2, 3584 CA Utrecht, The Netherlands, 2016a. a, b
Landgraf, J., aan de Brugh, J., Scheepmaker, R., Borsdorff, T., Hu, H., Houweling, S., Butz, A., Aben, I., and Hasekamp, O.: Carbon monoxide total column retrievals from TROPOMI shortwave infrared measurements, Atmos. Meas. Tech., 9, 4955–4975, https://doi.org/10.5194/amt-9-4955-2016, 2016b. a, b
NCEP: NCEP FNL Operational Model Global Tropospheric Analyses, continuing from July 1999, https://doi.org/10.5065/D6M043C6, 2000. a
Pommier, M., McLinden, C. A., and Deeter, M.: Relative changes in CO emissions over megacities based on observations from space, Geophys. Res. Lett., 40, 3766–3771, https://doi.org/10.1002/grl.50704, 2013. a
Rodgers, C. D.: Inverse methods for atmospheric sounding: theory and practice, in: Series on atmospheric, oceanic and planetary physics, vol. 2, World Scientific, Singapore, River Edge, NJ, 2000. a
Skamarock, W. C., Klemp, J. B., Dudhia, J., Gill, D. O., Barker, M., Duda, K. G., Huang, X. Y., Wang, W., and Powers, J. G.: A description of the Advanced Research WRF Version 3, Tech. Rep., National Center for Atmospheric Research, 2008. a, b
SRON: DataProducts, availale at: ftp://ftp.sron.nl/pub/pub/DataProducts/TROPOMI_CO/, last access: 12 March 2019a. a
SRON: TROPOMI CO data product, availale at: ftp://ftp.sron.nl/open-access-data-2/TROPOMI/tropomi/co/, last access: 12 March 2019b. a
Spivakovsky, C. M., Logan, J. A., Montzka, S. A., Balkanski, Y. J., Foreman-Fowler, M., Jones, D. B. A., Horowitz, L. W., Fusco, A. C., Brenninkmeijer, C. A. M., Prather, M. J., Wofsy, S. C., and McElroy, M. B.: Three-dimensional climatological distribution of tropospheric OH: Update and evaluation, J. Geophys. Res.-Atmos., 105, 8931–8980, https://doi.org/10.1029/1999jd901006, 2000. a
Stremme, W., Grutter, M., Rivera, C., Bezanilla, A., Garcia, A. R., Ortega, I., George, M., Clerbaux, C., Coheur, P.-F., Hurtmans, D., Hannigan, J. W., and Coffey, M. T.: Top-down estimation of carbon monoxide emissions from the Mexico Megacity based on FTIR measurements from ground and space, Atmos. Chem. Phys., 13, 1357–1376, https://doi.org/10.5194/acp-13-1357-2013, 2013. a
Veefkind, J., Aben, I., McMullan, K., Förster, H., de Vries, J., Otter, G., Claas, J., Eskes, H., de Haan, J., Kleipool, Q., van Weele, M., Hasekamp, O., Hoogeveen, R., Landgraf, J., Snel, R., Tol, P., Ingmann, P., Voors, R., Kruizinga, B., Vink, R., Visser, H., and Levelt, P.: TROPOMI on the ESA Sentinel-5 Precursor: A GMES mission for global observations of the atmospheric composition for climate, air quality and ozone layer applications, Remote Sens. Environ., 120, 70–83, https://doi.org/10.1016/j.rse.2011.09.027, 2012. a
Yurganov, L. N., Blumenstock, T., Grechko, E. I., Hase, F., Hyer, E. J., Kasischke, E. S., Koike, M., Kondo, Y., Kramer, I., Leung, F.-Y., Mahieu, E., Mellqvist, J., Notholt, J., Novelli, P. C., Rinsland, C. P., Scheel, H. E., Schulz, A., Strandberg, A., Sussmann, R., Tanimoto, H., Velazco, V., Zander, R., and Zhao, Y.: A quantitative assessment of the 1998 carbon monoxide emission anomaly in the Northern Hemisphere based on total column and surface concentration measurements, J. Geophys. Res.-Atmos., 109, D15305, https://doi.org/10.1029/2004JD004559, 2004. a
Yurganov, L. N., Duchatelet, P., Dzhola, A. V., Edwards, D. P., Hase, F., Kramer, I., Mahieu, E., Mellqvist, J., Notholt, J., Novelli, P. C., Rockmann, A., Scheel, H. E., Schneider, M., Schulz, A., Strandberg, A., Sussmann, R., Tanimoto, H., Velazco, V., Drummond, J. R., and Gille, J. C.: Increased Northern Hemispheric carbon monoxide burden in the troposphere in 2002 and 2003 detected from the ground and from space, Atmos. Chem. Phys., 5, 563–573, https://doi.org/10.5194/acp-5-563-2005, 2005. a