the Creative Commons Attribution 4.0 License.
the Creative Commons Attribution 4.0 License.
 | 20 Mar 2019
Abundances, emissions, and loss processes of the long-lived and potent greenhouse gas octafluorooxolane (octafluorotetrahydrofuran, c-C4F8O) in the atmosphere
François Bernard
Blagoj Mitrevski
L. Paul Steele
Cathy M. Trudinger
Stefan Reimann
Ray L. Langenfelds
Paul B. Krummel
Paul J. Fraser
David M. Etheridge
Mark A. J. Curran
James B. Burkholder
The first atmospheric observations of octafluorooxolane (octafluorotetrahydrofuran, c-C4F8O), a persistent greenhouse gas, are reported. In addition, a complementary laboratory study of its most likely atmospheric loss processes, its infrared absorption spectrum, and global warming potential (GWP) are reported. First atmospheric measurements of c-C4F8O are provided from the Cape Grim Air Archive (41∘ S, Tasmania, Australia, 1978–present), supplemented by two firn air samples from Antarctica, in situ measurements of ambient air at Aspendale, Victoria (38∘ S), and a few archived air samples from the Northern Hemisphere. The atmospheric abundance in the Southern Hemisphere has monotonically grown over the past decades and leveled at 74 ppq (parts per quadrillion, femtomole per mole in dry air) by 2015–2018. The growth rate of c-C4F8O has decreased from a maximum in 2004 of 4.0 to <0.25 ppq yr−1 in 2017 and 2018. Using a 12-box atmospheric transport model, globally averaged yearly emissions and abundances of c-C4F8O are calculated for 1951–2018. Emissions, which we speculate to derive predominantly from usage of c-C4F8O as a solvent in the semiconductor industry, peaked at 0.15 (±0.04, 2σ) kt yr−1 in 2004 and have since declined to <0.015 kt yr−1 in 2017 and 2018. Cumulative emissions over the full range of our record amount to 2.8 (2.4–3.3) kt, which correspond to 34 Mt of CO2-equivalent emissions. Infrared and ultraviolet absorption spectra for c-C4F8O as well as the reactive channel rate coefficient for the O(1D) + c-C4F8O reaction were determined from laboratory studies. On the basis of these experiments, a radiative efficiency of 0.430 W m−2 ppb−1 (parts per billion, nanomol mol−1) was determined, which is one of the largest found for synthetic greenhouse gases. The global annually averaged atmospheric lifetime, including mesospheric loss, is estimated to be >3000 years. GWPs of 8975, 12 000, and 16 000 are estimated for the 20-, 100-, and 500-year time horizons, respectively.
- Article
(1403 KB) - Full-text XML
-
Supplement
(606 KB) - BibTeX
- EndNote


Halogenated organic substances are generally potent greenhouse gases and contribute significantly to climate change, despite their relatively low abundances in the atmosphere (Myhre et al., 2013; Carpenter and Reimann, 2014). Hydrofluorocarbons (HFCs), perfluorocarbons (PFCs), sulfur hexafluoride (SF6), and nitrogen trifluoride (NF3) are important anthropogenic greenhouse gases, which are included in the Kyoto Protocol to the United Nations' Framework Convention on Climate Change (UNFCCC). Although they do not have the capacity to destroy stratospheric ozone (unlike, for example, chlorofluorocarbons, CFCs), HFCs have also been added to the Montreal Protocol on Substances That Deplete the Ozone Layer through the recent Kigali Amendment so that emissions can be curtailed by the effective method of restricting HFC use (United Nations, 2016).
The topic of the present research is the heterocyclic and fully fluorinated compound octafluorooxolane (c-C4F8O, CAS 773-14-8), better known by its older name as octafluorotetrahydrofuran, from which it has recently been renamed to its present name by IUPAC (Favre and Powell, 2014). The compound is listed in the Intergovernmental Panel on Climate Change (IPCC) 2006 guidelines in support of UNFCCC (IPCC, 2006, Vol. 1, chap. 8) as a compound for which countries are encouraged to provide emissions estimates (on a mass unit until a published greenhouse warming potential, GWP, will become available). In the 2013 revisions of the UNFCCC reporting guidelines (UNFCCC, 2013), c-C4F8O is absent from the list of compounds with mandatory reporting. Additional reporting regulations exist on country or state levels. For example, in the USA large suppliers and emitters of c-C4F8O are required to report the amounts they supply or emit under the Greenhouse Gas Reporting Program (GHGRP; https://www.epa.gov/ghgreporting, last access: 30 January 2019). When CO2-equivalent emissions are required for these submissions, a default GWP for fully fluorinated greenhouse gases (GHGs) of 10 000 (100 year time horizon) is used due to the lack of a peer-reviewed GWP. Emissions have mainly been reported under the “Fluorinated Gas Production” subpart for 2011–2017 with a maximum of 40 t in 2013 and a subsequent decline to 4.5 t by 2017.
c-C4F8O has been under discussion in the recent literature foremost as a new chemical vapor deposition (CVD) chamber cleaning agent in the semiconductor industry (Pruette et al., 2000; McCoy, 2000; Oh et al., 2001; Kim et al., 2002, 2004). It was evaluated against the widely used perfluoroethane (C2F6) and perfluoropropane (C3F8) in terms of cleaning effectiveness and reduction in greenhouse gas emissions. Its advantages over NF3, another alternative cleaning agent, are stated as lower toxicity and a smaller adjustment to existing chamber cleaning structures using C2F6. However, its disadvantages are potential byproducts such as tetrafluoromethane (CF4), which is another long-lived potent greenhouse gas (Beu, 2005). c-C4F8O has also been evaluated as part of a gas mixture to replace SF6 in high-voltage gaseous insulation applications, again driven by the desire to reduce greenhouse gas emissions (Dahl et al., 2014; Chachereau et al., 2016; Kočišek et al., 2018). Another niche application is its use as a radiator gas for Cherenkov detectors in large-scale particle acceleration experiments (Artuso et al., 2006; Acconcia et al., 2014).
The above applications have emerged only within the last two decades. Whether c-C4F8O was used earlier than that is undocumented. Frick and Anderson (1972) patented a method to synthesize c-C4F8O for potential use as an inert solvent for highly reactive or corrosive halogenated materials in naval applications. However, it remains unclear if this led to mass production of c-C4F8O at that time.
Little is known of c-C4F8O in relation to its radiative properties and gas-phase loss processes in the atmosphere. A GWP of 8700 (with no reference to the time horizon) has been reported, which was derived based on structural analogies to octafluorocyclobutane (c-C4F8), for which the GWP is known (3M Company, internal analysis cited by Pruette et al., 2000). A material safety data sheet for PFG-3480 (trade name for c-C4F8O) lists a GWP of 13 900 (100-year time horizon) and a lifetime of <4000 years (3M Company, 2007). It is unknown to us how these results were obtained. Information is also lacking on other potential loss processes for c-C4F8O, such as uptake by oceans and land. In addition, no atmospheric measurements, and consequently no atmospheric observation-based (top-down) emissions estimates, are presently available for c-C4F8O.
The present study aims to improve our knowledge on the chemical and radiative properties of c-C4F8O relevant to determining its atmospheric lifetime and to provide the first atmospheric measurements from which we derive estimated global emissions to the atmosphere. Measurements were made on atmospheric samples archived in canisters and Antarctic firn, and in modern air from in situ observations. From these measurements, historical records of abundance and emissions were estimated using a 12-box chemical transport model of the atmosphere (Cunnold et al., 1983; Rigby et al., 2013; Vollmer et al., 2016). We also conducted laboratory experiments to determine the infrared and ultraviolet (UV) absorption spectra of c-C4F8O, and the rate coefficient for the O(1D) + c-C4F8O reaction to estimate the atmospheric lifetime and GWP of c-C4F8O.
2.1 c-C4F8O in air samples
2.1.1 Measurements of c-C4F8O in archived and ambient in situ air
For the present study, archived and urban ambient air samples were analyzed at the Commonwealth Scientific and Industrial Research Organization (CSIRO) laboratory at Aspendale (Victoria, Australia) using Medusa gas chromatographic (GC) mass spectrometric (MS) techniques (Miller et al., 2008). The archived air samples consisted primarily of the Cape Grim Air Archive (CGAA) samples collected under clean air baseline conditions for archival purposes since 1978 at the Cape Grim Baseline Air Pollution Station (Tasmania, Australia; 40.7∘ S, 144.7∘ E). These >100 samples were collected into 34 L internally electropolished stainless steel canisters (Essex Industries, USA) using cryogenic techniques (Fraser et al., 1991; Langenfelds et al., 1996, 2014; Fraser et al., 2016). The CGAA record was complemented with a few samples collected in the Northern Hemisphere (33–53∘ N) mostly using oil-free diving compressors.
Two firn air samples were also analyzed, which were collected at the Aurora Basin North site in Antarctica (71.1∘ S, 111.4∘ E). The site is located 550 km inland from Australia's Casey Station, at 2710 m a.s.l., and has a low mean annual air temperature of −44∘C. Samples were collected in December 2013; those for the halocarbon measurements were collected into internally electropolished stainless steel containers using a two-stage Teflon-coated Viton diaphragm pump. Only two samples were available for the present study as other samples from this site were used for a different halocarbon study.
In situ measurements of c-C4F8O at Aspendale (38.0∘ S, 145.1∘ E) were started in February 2017. These samples are collected from the rooftop at CSIRO (at 11 m height from the ground) through a 3∕8 in. OD Synflex 1300 tube (Saint-Gobain, France) using a continuous-flow air sampling module (Miller et al., 2008) with a diaphragm sampling pump fitted with stainless steel heads and a neoprene membrane (KNF Neuberger, Germany).
All archived air samples were analyzed on the Medusa-GCMS “Medusa-9” in December 2016 along with a suite of other trace gases. The instrument is based on the original design of the Medusa-GCMS used in the Advanced Global Atmospheric Gases Experiment (AGAGE) network (Miller et al., 2008; Prinn et al., 2018) but fitted with different chromatography columns (Vollmer et al., 2018). A GS-GasPro main capillary column (0.32 mm ID × 60 m, Agilent Technologies) was used for the main separation and a column of the same type (5 m) was fitted as a precolumn, allowing for a backflushing of late-eluting compounds. In this GCMS setup (Agilent 6890 GC, 5975 MS), c-C4F8O was identified using a multicomponent diluted mixture of known composition with the MS in scan and selected ion modes. The choice for the two fragments used in the analysis of our air samples was based on the mass spectrum, which we measured for c-C4F8O, to the best of our knowledge the first one published for this compound (see the Supplement).
Analytes from the samples were cryogenically preconcentrated on a first microtrap of the GCMS and subsequently transferred to a second microtrap, both filled with HayeSep D and held at ∘C. During this process, water vapor was largely removed using Nafion dryers; nitrogen, oxygen, and a large fraction of noble gases were removed due to their trap breakthroughs, and carbon dioxide was removed using a molecular sieve (4Å) packed column between the traps. To enhance the signal size of the measured compounds, 3 L sample sizes were used for each measurement (compared to normally 2 L) and the MS electron multiplier voltage was increased by 50 V compared to what was given by the autotune algorithm. Analysis of a single sample lasted 65 min. Archived air sample measurements were bracketed by measurements of a standard (E-146S) to track and correct for MS sensitivity changes. This standard was air compressed into a 34 L tank at the remote Rigi-Seebodenalp station (Switzerland) using an oil-free compressor, and was additionally spiked with small amounts of c-C4F8O and other compounds to enhance the GCMS peak size and signal-to-noise ratio. In general, three measurements of each archived air sample were made. For some, no standard measurement was made between the second and third sample to assess potential memory effects of the system. For c-C4F8O, no memory effect and no signal in the blank runs could be detected. Detection limits are estimated at 5 ppq (parts per quadrillion, femtomole per mole). Mean precisions (2σ) for the measurements of the archived air samples ranged 3–4 ppq (20 %–5 %) for the low (∼15 ppq) to high (∼70 ppq) mole fractions, respectively. Based on two different types of experiments, a linear system response for the relevant mole fraction range was found (see the Supplement). In situ urban air measurements at Aspendale are based on 2 L samples and without alteration of the MS electron multiplier voltage. Consequently the precisions are slightly poorer for these measurements. These air precisions were estimated at ∼12 ppq (∼17 %, 2σ) under the assumption that c-C4F8O remains constant in the air measured in situ at Aspendale on a daily basis.
2.1.2 Absolute calibration and uncertainty estimates for air measurements
A primary calibration scale was prepared based on a commercially obtained multicomponent mixture in dry synthetic air (Carbagas, Switzerland, HCP-04Carba), with a mole fraction of c-C4F8O at 10 ppm (parts per million, micromole per mole). This mixture was diluted manometrically and using a bootstrap technique, resulting in a primary calibration standard (EP-001) with c-C4F8O at 1.81 ppt (parts per trillion, picomole per mole). Three secondary standards were additionally prepared from ambient air compressed into cylinders (Essex Industries, USA) and spiked with small quantities of c-C4F8O resulting in mole fractions of ∼0.5 ppt. These secondary standards were the base for propagating the calibration scale to other calibration standards, in particular that used for the Cape Grim Air Archive measurements (E-146S). They define the Empa-2013 calibration scale for c-C4F8O on which our results are reported. The systematic uncertainty of the preparation of this primary calibration scale (including its propagation to the working standards), which defines its accuracy, is estimated at 15 % (2σ). Details of the dilution technique and the primary calibration scale are provided by Vollmer et al. (2015).
2.2 Models and inversion
2.2.1 Firn model
We use a numerical firn air model (Trudinger et al., 1997, 2013) to quantify the movement of c-C4F8O in firn air in order to determine the time period for which c-C4F8O in the firn samples is representative of the atmosphere. Vertical diffusion in the firn and other physical processes cause a tracer in a firn air sample to correspond to an age spectrum relative to the atmosphere, rather than a discrete age. Green's functions from the firn model represent the age spectrum of a tracer in each firn sample and are used in this work to relate the measured mole fractions of c-C4F8O in firn to the time range of the corresponding atmospheric mole fractions.
For Aurora Basin North, the firn model uses an accumulation rate of 97 kg m−2 yr−1, a temperature of −44 ∘C, and pressure of 695 hPa. The density profile used was based on a spline fit to density measurements. Diffusion parameters in the firn model are calibrated for Aurora Basin North using 12 tracers at between 5 and 11 depths each throughout the firn. The diffusion coefficient used in this work for c-C4F8O in air relative to CO2 in air (for a temperature of 253 K) is 0.460. This value was determined using Eq. (4) from Fuller et al. (1966) with Le Bas volume increments (e.g., Table 1.3.1, Mackay et al., 2006) and a multiplier for the Le Bas increments of 0.97 (this value minimizes the difference of calculated relative diffusion coefficients of a number of compounds from values measured by Matsunaga et al., 1993, 2002, 2005). Further details on diffusivity in the firn model calculations for Aurora Basin North are given in the Supplement.
2.2.2 12-box atmospheric model
We use the AGAGE 12-box atmospheric model (Rigby et al., 2013) to relate the atmospheric mole fractions to surface emissions. Briefly, in this model, the atmosphere is divided into four zonal bands, separated at the Equator and at the 30∘ latitudes, thereby creating boxes of similar air masses. There are also vertical separations, at altitudes represented by 500 and 200 hPa, resulting in the overall 12 boxes. Model transport parameters and stratospheric photolytic loss vary seasonally and repeat interannually (Rigby et al., 2013). We anticipate that variations in emissions dominate atmospheric trends, particularly over the longer (multi-annual) timescales that are our primary focus, so interannual variation in transport is not expected to be important here. Loss processes other than those in the atmosphere, such as uptake by land and oceans – and potential natural sources – are not included in the model. Green's functions derived from the 12-box atmospheric model relate atmospheric mole fraction in the high-latitude Northern Hemisphere and Southern Hemisphere to annual global emissions in preceding years, and are used in the inversion (Trudinger et al., 2016).
2.2.3 Global inversions
To estimate global emissions to the atmosphere from the mole fraction measurements, we employ an inverse calculation (inversion InvE2 from Trudinger et al., 2016, and termed “CSIRO” inversion in Vollmer et al., 2016, 2018) that was developed to focus on sparse observations from air archives, and firn air and ice core samples that are associated with age spectra. The inversion combines Green's functions from both the firn model and the AGAGE 12-box atmospheric model described above to relate firn and tropospheric mole fraction to c-C4F8O surface emissions. The Green's functions from the 12-box model were calculated using a constant distribution of emissions into the four zonal boxes at the surface, and for this we used the relative contributions 0.675, 0.325, 0.0, and 0.0 in the northernmost to southernmost zonal bands. Results are fairly insensitive to emissions distributions that have most emissions in the Northern Hemisphere (see the Supplement). The characteristics of sparse atmospheric, firn, and ice core data necessitate the use of constraints on the inversion to avoid unrealistic oscillations in the reconstructed mole fractions or negative values of mole fraction or emissions. The inversion uses non-negativity constraints and favors relatively small changes in annual emissions between adjacent years over large, unrealistic fluctuations. A prior emissions history is needed as a starting point for the inversion. A nonlinear constrained optimization method (constrained_min routine in IDL (Harris Geospatial Solutions Inc., Broomfield, Colorado) is used to find the solution that minimizes a cost function consisting of the model–data mismatch weighted by the observation uncertainties, plus the sum of the year-to-year changes in emissions (Trudinger et al., 2016). Given the lack of industry-based bottom-up emission estimates for c-C4F8O, we use emissions derived from observations of perfluorooctane, which was found present for many decades and at low abundances in the global atmosphere (Ivy et al., 2012). Because the prior is not based on information on c-C4F8O, we do not include the prior in the cost function. The emissions derived from the inversion are rather insensitive to the choice of the prior (see the Supplement) because the prior is used here as a starting point for the inversion only, and not as a constraint. Our observations used in the inversion are the firn measurements and annual values of mole fraction from a smoothing spline fit (50 % attenuation at 10 years) to measurements of the CGAA and in situ measurements at Aspendale. Northern Hemisphere measurements were compared with the reconstructed mole fractions for that hemisphere, but were not used in the inversion. Uncertainties in the emissions are estimated using a bootstrap method that incorporates temporally correlated uncertainties in the annual values derived from the atmospheric data (see the Supplement), uncertainty in firn measurements, uncertainty of ±15 % in the calibration scale, and uncertainties in the firn model parameters through the use of an ensemble of firn Green's functions.
2.3 Laboratory studies
Laboratory studies to measure the infrared and UV spectra of c-C4F8O and the rate coefficient for the O(1D) + c-C4F8O reaction were conducted at the Chemical Sciences Division Laboratories at the National Oceanic and Atmospheric Administration (NOAA), Boulder, Colorado, USA. The apparatus and methods used in this work are described separately below.
2.3.1 Absorption spectra
Absorption spectra, A(v) (base e), or integrated band strengths, were quantified using Beer's law
where A is the measured absorbance at wavelength λ; I(λ) and I0(λ) are the measured light intensities with and without the sample present in the absorption cell, respectively; L is the optical absorption path length; σ(λ) is the infrared or UV cross section of c-C4F8O; and [c-C4F8O] is the concentration of c-C4F8O. In total, 11 independent absorption spectrum measurements were used in the linear least-squares fit. The c-C4F8O concentration was determined using the ideal gas law and absolute pressure measurements of either the pure compound or of a dilute mixture of the compound in a helium (He) bath gas.
The c-C4F8O sample was obtained from SynQuest Laboratories Inc. (Alachua, Florida, USA, 99 % purity). For the experiments described below, c-C4F8O was introduced into the absorption cells as a pure sample or in a dilute mixture prepared off-line. The dilute mixtures of c-C4F8O in a He (UHP, 99.999 %) bath gas were prepared manometrically in a 12 L Pyrex bulb with an estimated accuracy of ∼1 %, as derived from the accuracy of the pressure measurements. The pressure measurement uncertainty includes the uncertainty in the sample pressure, the total mixture pressure, and the linearity of the pressure gauge (estimated to be 0.2 %). Pressures were measured with 100 and 1000 Torr (130 and 1300 hPa, respectively) capacitance manometers. Quoted uncertainties are 2σ.
Infrared absorption spectra were measured at 296 K using Fourier transform infrared (FTIR) spectroscopy over the 500–4000 cm−1 spectral region at 1 cm−1 resolution with boxcar apodization. The apparatus has been used extensively in previous studies (Bernard et al., 2017, 2018). The FTIR was coupled to a 15 cm path length single-pass absorption cell with potassium bromide (KBr) windows. A liquid-nitrogen-cooled HgCdTe/B semiconductor detector was used. Infrared spectra were recorded in 100 or 500 co-added scans. Absorption spectra were recorded under static conditions using a dilute mixture of c-C4F8O in He with a 0.00180 mixing ratio. The c-C4F8O concentration used in the absorption measurements was in the range 1.75 × 10¹⁵ to 2.34 × 10¹⁶ molecule cm−3. Integrated band strengths (IBSs) were obtained from the measurement of 11 individual IR spectra.
The UV absorption spectrum of c-C4F8O was measured at 296 K using a 0.5 m spectrometer (1 nm resolution) equipped with a charge-coupled device (CCD) detector. The collimated output of a 30 W deuterium lamp passed through a 100 cm long and 2.5 cm diameter Pyrex absorption cell with quartz windows. Spectral measurements were made over the wavelength region 200–350 nm. The wavelength scale of the spectrometer was calibrated using the emission lines from a low-pressure Hg Pen-Ray lamp. c-C4F8O was added to the absorption cell in pure form from the original sample. Measurements were performed over a range of c-C4F8O concentrations from 2.51 × 10¹⁸ to 2.16 × 10¹⁹ molecule cm−3. Eleven independent UV absorption spectrum measurements were used in the final linear least-squares fit.
2.3.2 O(1D) reaction rate coefficient
The reactive rate coefficient, k1, for the reaction
i.e., the channel resulting in the loss of c-C4F8O, was measured at 294 K using a relative method (e.g., Baasandorj et al., 2013). The loss of c-C4F8O was measured relative to the loss of the reference compound CHF3 during the same experiment:
The recommended total rate coefficient for Reaction (R2), k2, is ( cm3 molecule−1 s−1 and the recommended reactive channel branching ratio, k2a∕k2, is 0.25, i.e., cm3 molecule−1 s−1 (Burkholder et al., 2015).
Provided c-C4F8O and the reference compound are removed solely by reaction with O(1D), the rate coefficient for Reaction (R1a) is related to the reference compound rate coefficient by the equation
where [c-C4F8O], [CHF3], [c-C4F8O]t, and [CHF3]t are the concentrations of c-C4F8O and CHF3 at times zero (t0) and t, respectively. The k1a and k2a are the reactive rate coefficients for the reaction of O(1D) with c-C4F8O Reaction (R1a) and CHF3 Reaction (R2a), respectively.
The Pyrex reactor, which was 100 cm long and with a 2.2 cm internal diameter, was coupled with a Teflon circulating pump to an absorption cell where the losses of c-C4F8O and CHF3 were measured using FTIR spectroscopy. The FTIR absorption cell was equipped with a multi-pass cell (485 cm path length) with KBr windows. Spectra were recorded in 100 co-adds at a spectral resolution of 1 cm−1.
O(1D) was produced by KrF (248 nm) excimer pulsed laser photolysis of ozone:
The yield of the O(1D) channel is 0.9 (Burkholder et al., 2015). After thoroughly mixing the gas mixture in the system, a time zero infrared spectrum was recorded. Ozone was then slowly added to the reactor with the photolysis laser and gas circulation on. The photolysis laser fluence was in the range ∼2–7.4 mJ cm−2 pulse−1. The laser was operated at 10 or 20 Hz. The total pressure in the cell increased during an experiment by ∼300 Torr, mostly due to the addition of He carrier gas used to flush ozone into the reactor. Infrared spectra were recorded at regular intervals with approximately 10 spectra recorded over the course of an experiment. Experiments performed separately demonstrated that there was no significant loss of c-C4F8O or CHF3 under identical conditions in the absence of photolysis. The initial c-C4F8O and CHF3 concentrations were in the range 6.4–6.8 × 10¹⁴ molecule cm−3 and 4.5–5.0 × 10¹⁴ molecule cm−3, respectively.
3.1 Infrared spectrum
The infrared absorption spectrum of c-C4F8O obtained in this study is shown in Fig. 1. Over the range of c-C4F8O concentrations used, the spectra obeyed Beer's law with high precision (∼0.2 %). Spectra recorded at different total pressures had identical band shapes, i.e., the spectrum was independent of the total pressure (He bath gas) over the range of 30–400 Torr.
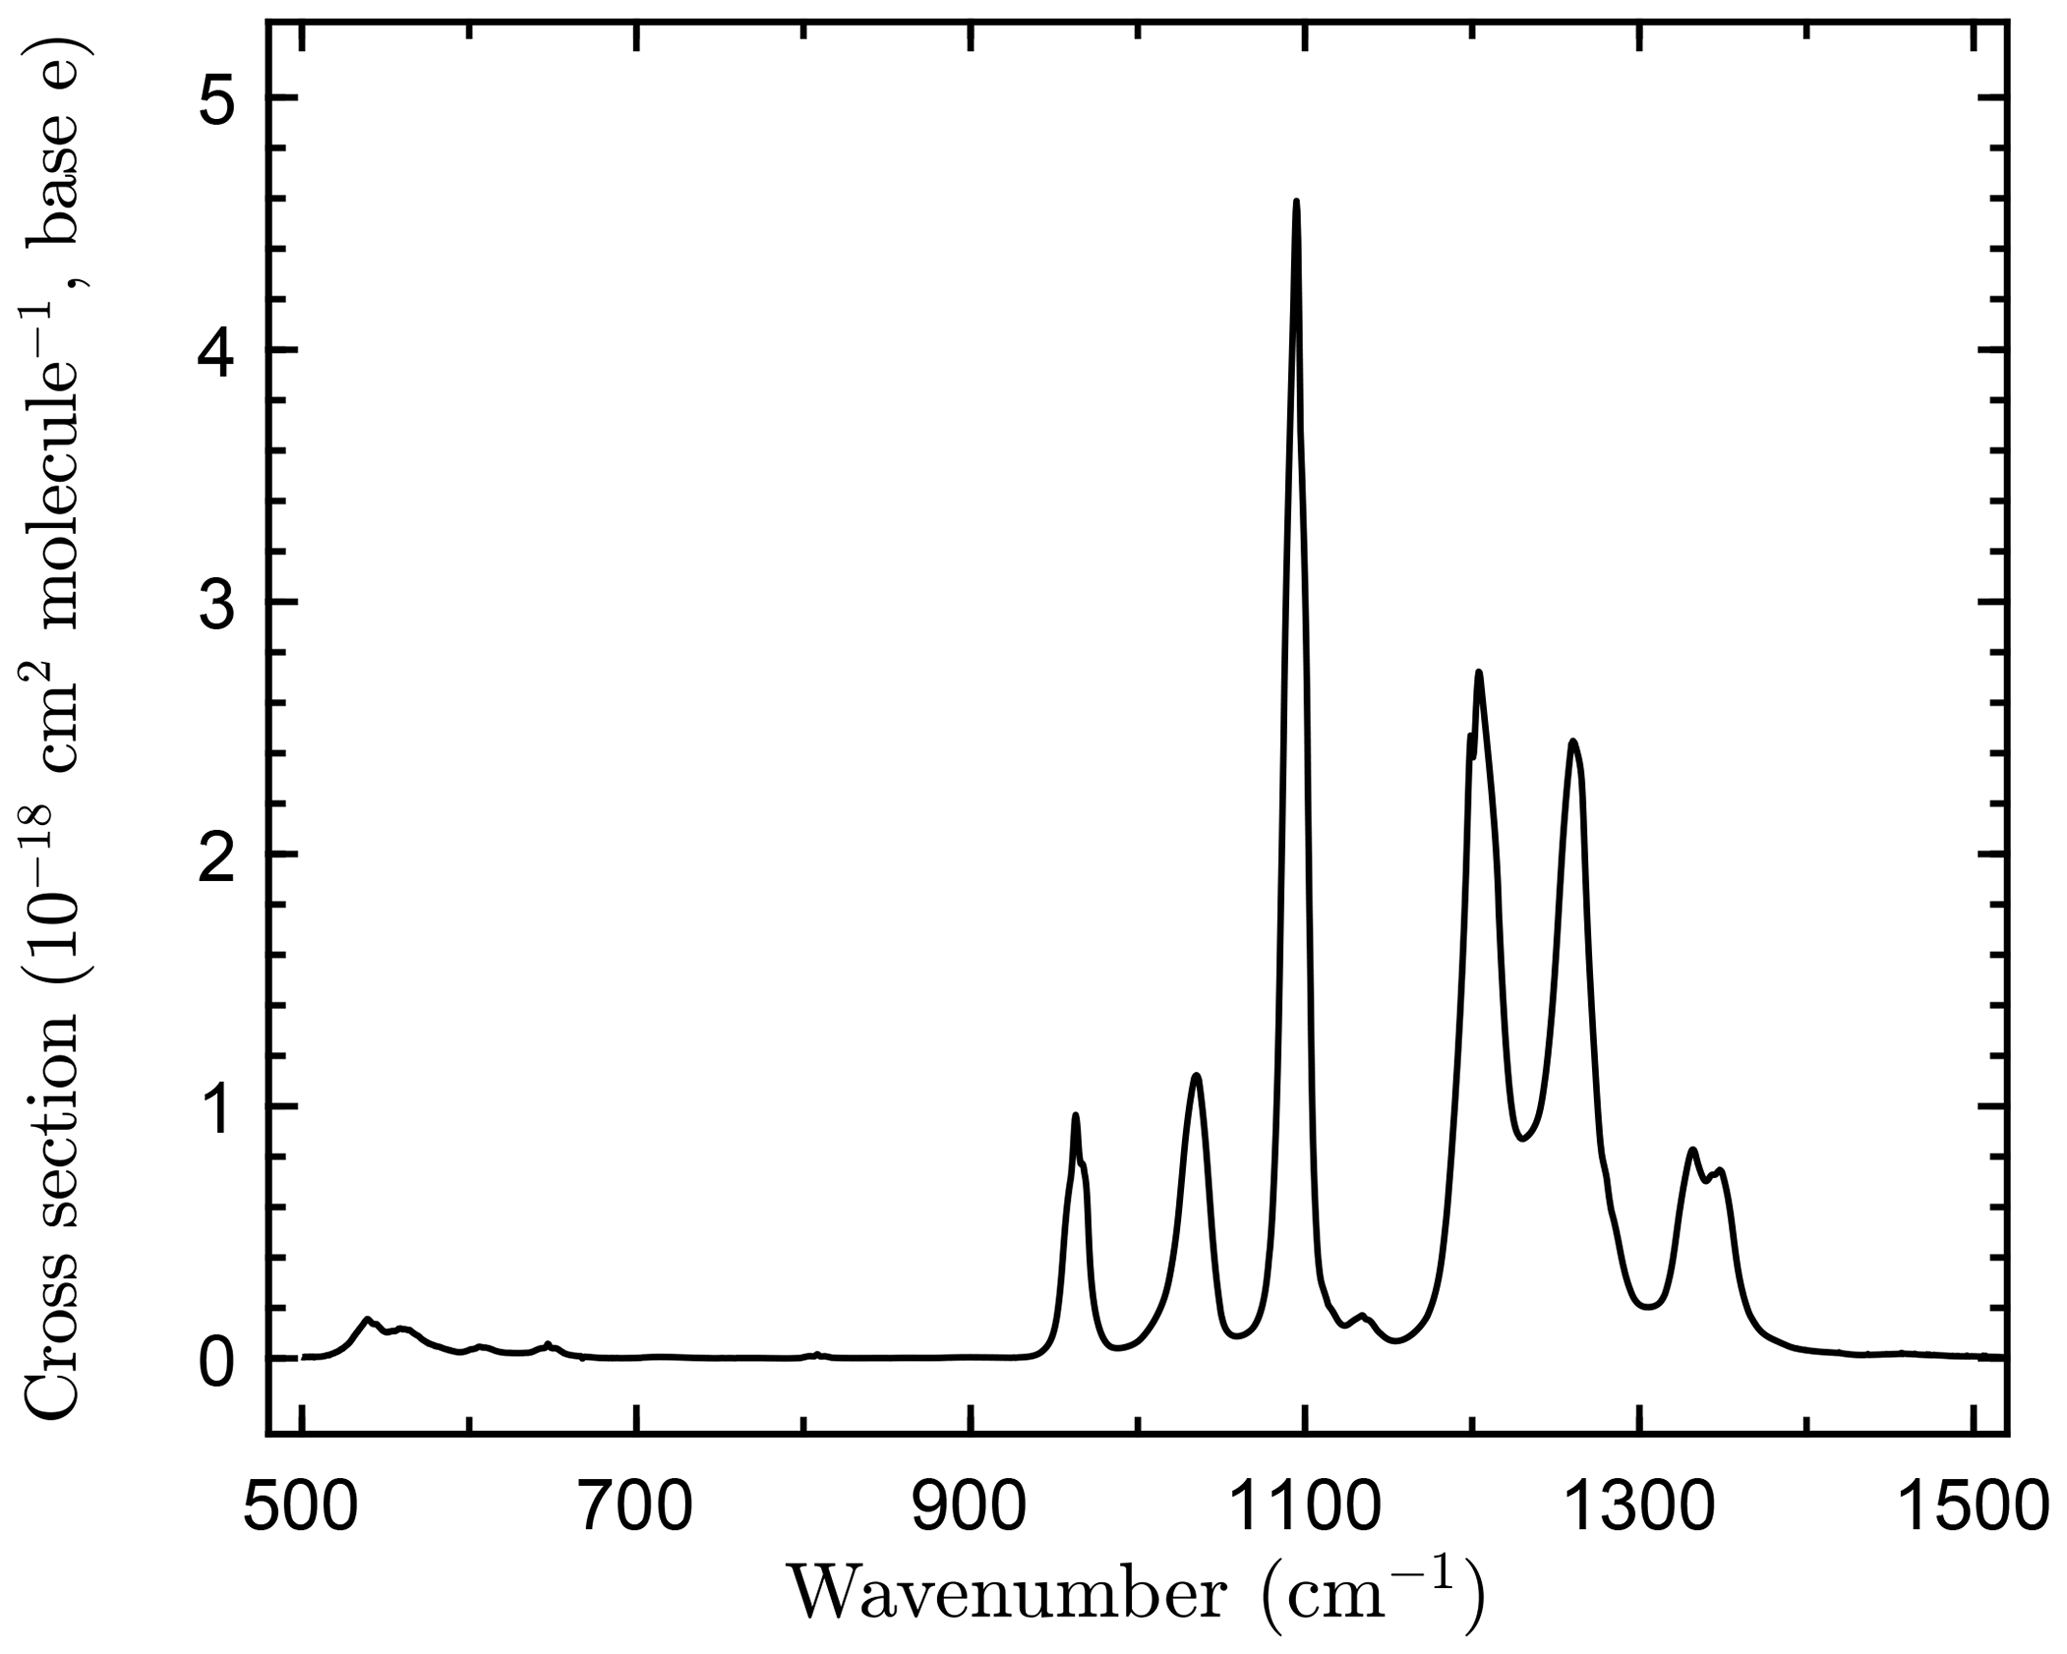
Figure 1Infrared absorption spectrum of octafluorooxolane (c-C4F8O) measured in this work at 296 K at 1 cm−1 resolution.
The IBS over the spectral region 500–1500 cm−1 was determined to be (3.21±0.01) × 10−16 cm2 molecule−1 cm−1, where the quoted uncertainty is the precision of the linear least-squares fit of the data to Beer's law (Eq. 1). The absolute uncertainty in the c-C4F8O spectrum includes estimated uncertainties in the optical path length (±0.5 %), measured absorbance (±0.005), temperature (±1 K), and pressure (±0.2 %). The absolute uncertainty in the total integrated band strength is estimated to be 3 %.
3.2 UV absorption
UV absorption of c-C4F8O was observed between 200 and 225 nm, a range that is most critical for calculations of the c-C4F8O atmospheric photolysis rates. The spectrum is continuous, with cross sections decreasing monotonically with increasing wavelength. The cross-section measurements obeyed Beer's law with values of (9.2±3.9) × 10−24 and (4.4±2.3) × 10−24 cm2 molecule−1 cm−1 at 200 and 225 nm, respectively. An example of the measured UV spectrum of the c-C4F8O sample is shown in the Supplement. Overall, the cross sections of c-C4F8O were very low, and therefore the measurements are susceptible to interference from even minor sample impurities. Therefore, we choose to assign a conservative UV cross section of cm2 molecule−1 cm−1 over the 200–225 nm range.

Figure 2Atmospheric observations (a), growth rates (b), and emissions (c) of octafluorooxolane (octafluorotetrahydrofuran, c-C4F8O). Abundances are given as dry air mole fractions in ppq (femtomol mol−1) on the Empa-2013 primary calibration scale. Vertical bars denote the measurement precision (2σ) for the flask samples. Emission uncertainties are 2σ. Samples were collected in the Northern Hemisphere at Cape Meares (Oregon; 45.5∘ N, 124.0∘ W), Jungfraujoch (Switzerland; 46.5∘ N, 8.0∘ E), Mace Head (Ireland; 53.3∘ N, 9.9∘ W), La Jolla (California; 32.9∘ N, 117.3∘ W), and Dübendorf (Switzerland; 47.4∘ N, 8.6∘ E). Southern Hemisphere samples were mainly from the Cape Grim Air Archive collected at Cape Grim (Tasmania; 40.7∘ S, 144.7∘ E), two samples from the Aurora Basin North firn air sampling site (Antarctica, 71.2∘ S, 111.4∘ E), and in situ monthly means since February 2017 from Aspendale, Victoria, Australia (38.0∘ S, 145.1∘ E), with uncertainty bars for Aspendale omitted to aid visual clarity. Growth rates and emissions are globally averaged. Emissions (c) are shown with units on the left y axis and as CO2-equivalent emissions based on a global warming potential of 12 000 (100-year time frame), with units on the right y axis. USA factory-level emissions are from https://www.epa.gov/ghgreporting, last access: 30 January 2019. The early history is shown as dotted lines to emphasize the greater uncertainties before 1978.
3.3 O(1D) reaction
We found the reactivity of c-C4F8O with O(1D) to be low, which makes the determination of an accurate rate coefficient more challenging. The relative rate data are shown in Fig. 3 and tabulated in the Supplement. The precision of the three independent measurements is high with a fit precision of a few percent. However, the agreement between the independent measurements is relatively poor. The low conversion of c-C4F8O, <2 %, and the precision of the infrared spectral subtractions are the primary sources of uncertainty in the measurements. The low conversion of c-C4F8O and CHF3 achieved in these experiments was primarily due to the build up of O2 associated with the addition of ozone to the reactor, making the loss of O(1D) by reaction with O2 more significant than its reaction with c-C4F8O and CHF3. The absorption bands used in this study were 1120–1000 and 1180–1120 cm−1 for c-C4F8O and CHF3, respectively. The spectral subtraction uncertainty is illustrated by the error bars included in Fig. 3. The average of individual measurements yields a rate coefficient ratio of 0.21±0.07. However, we recommend a conservative upper limit of 0.5. Using the recommended O(1D)+CHF3 reactive rate coefficient, (2.41±0.12) × 10−12 cm3 molecule−1 s−1 (Burkholder et al., 2015) yields a c-C4F8O reactive rate coefficient of cm3 molecule−1 s−1. Given the small O(1D) rate coefficient of c-C4F8O, a refinement of the measured O(1D) reactive rate coefficient will have a negligible impact to the total atmospheric loss of c-C4F8O.
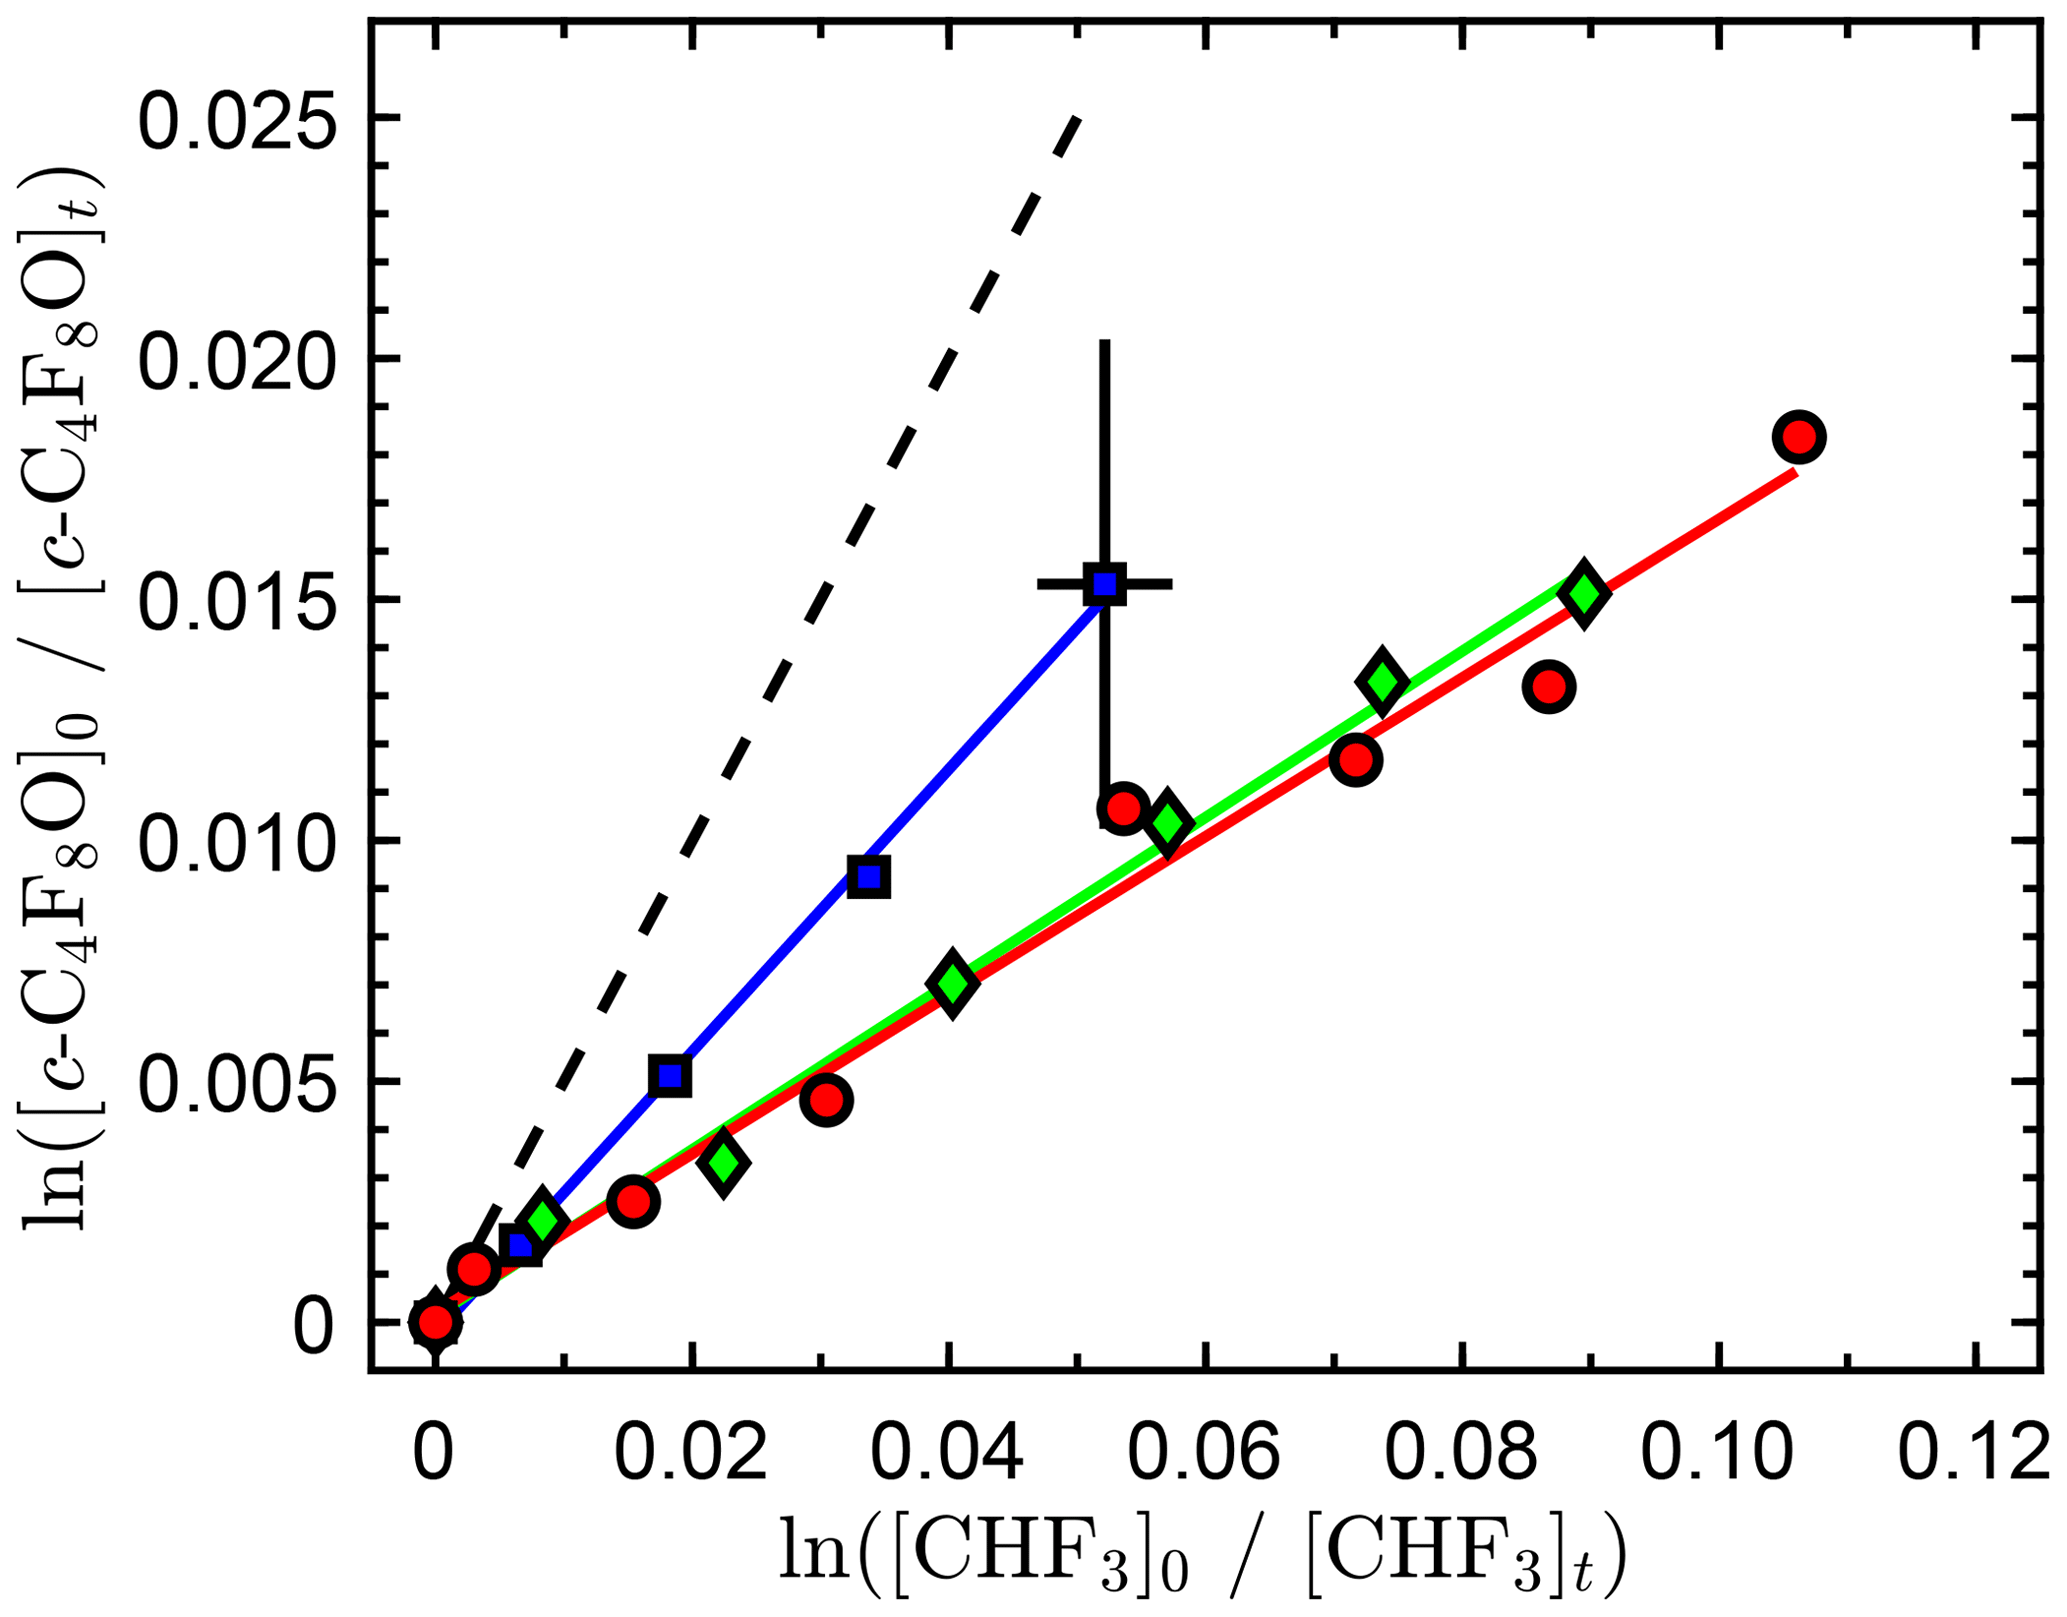
Figure 3Relative rate data obtained in this work for the O(1D) + c-C4F8O reaction at 296 K. The different symbols are results from independent experiments, and the solid lines are linear least-square fits to the data of the individual experiments. Representative estimated error bars from the infrared spectral analysis are included only on a single data point for improved clarity of the graph. The dashed line represents the upper-limit rate coefficient ratio recommended in this work.
3.4 Atmospheric lifetime
The global annually averaged atmospheric lifetime (τ) of c-C4F8O is defined with respect to the individual partial lifetimes by the relationship:
where the individual global loss processes are combined to derive the overall global lifetime. In the present analysis, only O(1D), UV photolysis, and Lyman-α terms are considered. This study has focused primarily on the atmospheric loss processes of c-C4F8O, i.e., potential deposition or heterogeneous loss processes of c-C4F8O were beyond the scope of this study. Deposition or heterogeneous loss processes, if significant, would lead to a shorter global lifetime for c-C4F8O. The loss of c-C4F8O via reaction with the OH radical is assumed to make a negligible contribution to the global lifetime in our analysis. The OH rate coefficient would need to be cm3 molecule−1 s−1 (equivalent to a 3000 year lifetime) to make a significant global lifetime contribution. Such a low rate coefficient represents a significant challenge to current rate coefficient measurement methods. Additionally, an expected low OH reactivity of c-C4F8O is supported by its low O(1D) reactivity measured in this work. Consequently, we ignore the last term in Eq. (3). Additional laboratory studies, that are beyond the scope of the present work, would be needed to quantify the OH reaction.
The laboratory results for the O(1D) reaction and UV photolysis obtained in this study are combined with an estimated Lyman-α lifetime to derive the lifetime utilizing the 2-D atmospheric model calculation parameterizations reported by Bernard et al. (2019). The O(1D) reaction represents a stratospheric loss process for c-C4F8O with a partial lifetime, , estimated to be >30 000 years. This extremely long lifetime is a result of the low c-C4F8O reactivity combined with the turn-over time of the stratosphere. The UV photolysis lifetime, τhν, is derived from the c-C4F8O UV cross section upper-limit of 10−23 cm2 molecule−1 and an assumed quantum yield of unity for the 200–225 nm region, and is >15 000 years. Combining the estimated O(1D) and UV photolysis lifetimes yields an estimated global lifetime for c-C4F8O >7500 years.
Given the long atmospheric lifetime of c-C4F8O in the troposphere and stratosphere, upper atmospheric loss processes may contribute to the global atmospheric lifetime. Here, we consider the loss due to Lyman-α photolysis, although other loss processes are possible. To date, the vacuum UV (VUV) absorption spectrum of c-C4F8O, which includes the Lyman-α absorption (121.567 nm), has not been reported. The scope of the present study did not include a measurement of the Lyman-α cross section. It is, however, reasonable to assume a Lyman-α cross section of cm2 molecule−1 for c-C4F8O, which is in the range of values for highly fluorinated compounds of (0.035–10) × 10−17 cm2 molecule−1 (SPARC, 2013). Therefore, in the absence of experimental data, we consider the Lyman-α cross section cm2 molecule−1, used in our lifetime analysis, as a reasonable estimate. Note that a smaller (larger) Lyman-α cross section would lead to a longer (shorter) photolysis lifetime, although the lifetime dependence on the cross section value is not linear due to the lifetime dependence on the transport time to the mesosphere. On the basis of these assumptions, Lyman-α photolysis in the lower mesosphere could be the dominant atmospheric loss process for c-C4F8O. Including this Lyman-α photolysis lifetime yields a c-C4F8O globally averaged atmospheric lifetime of >3000 years.
3.5 Global warming potential (GWP)
c-C4F8O has strong vibrational absorption bands within the Earth's atmospheric infrared transmission window (Hodnebrog et al., 2013, Fig. 4). We determine a radiative efficiency for c-C4F8O of 0.430 W m−2 ppb−1 using the parameterization for atmospherically well-mixed compounds given in Hodnebrog et al. (2013). c-C4F8O is therefore a potent greenhouse gas with a radiative efficiency greater than those of HFCs and CFCs, which are typically less than 0.3 W m−2 ppb−1 (Myhre et al., 2013).
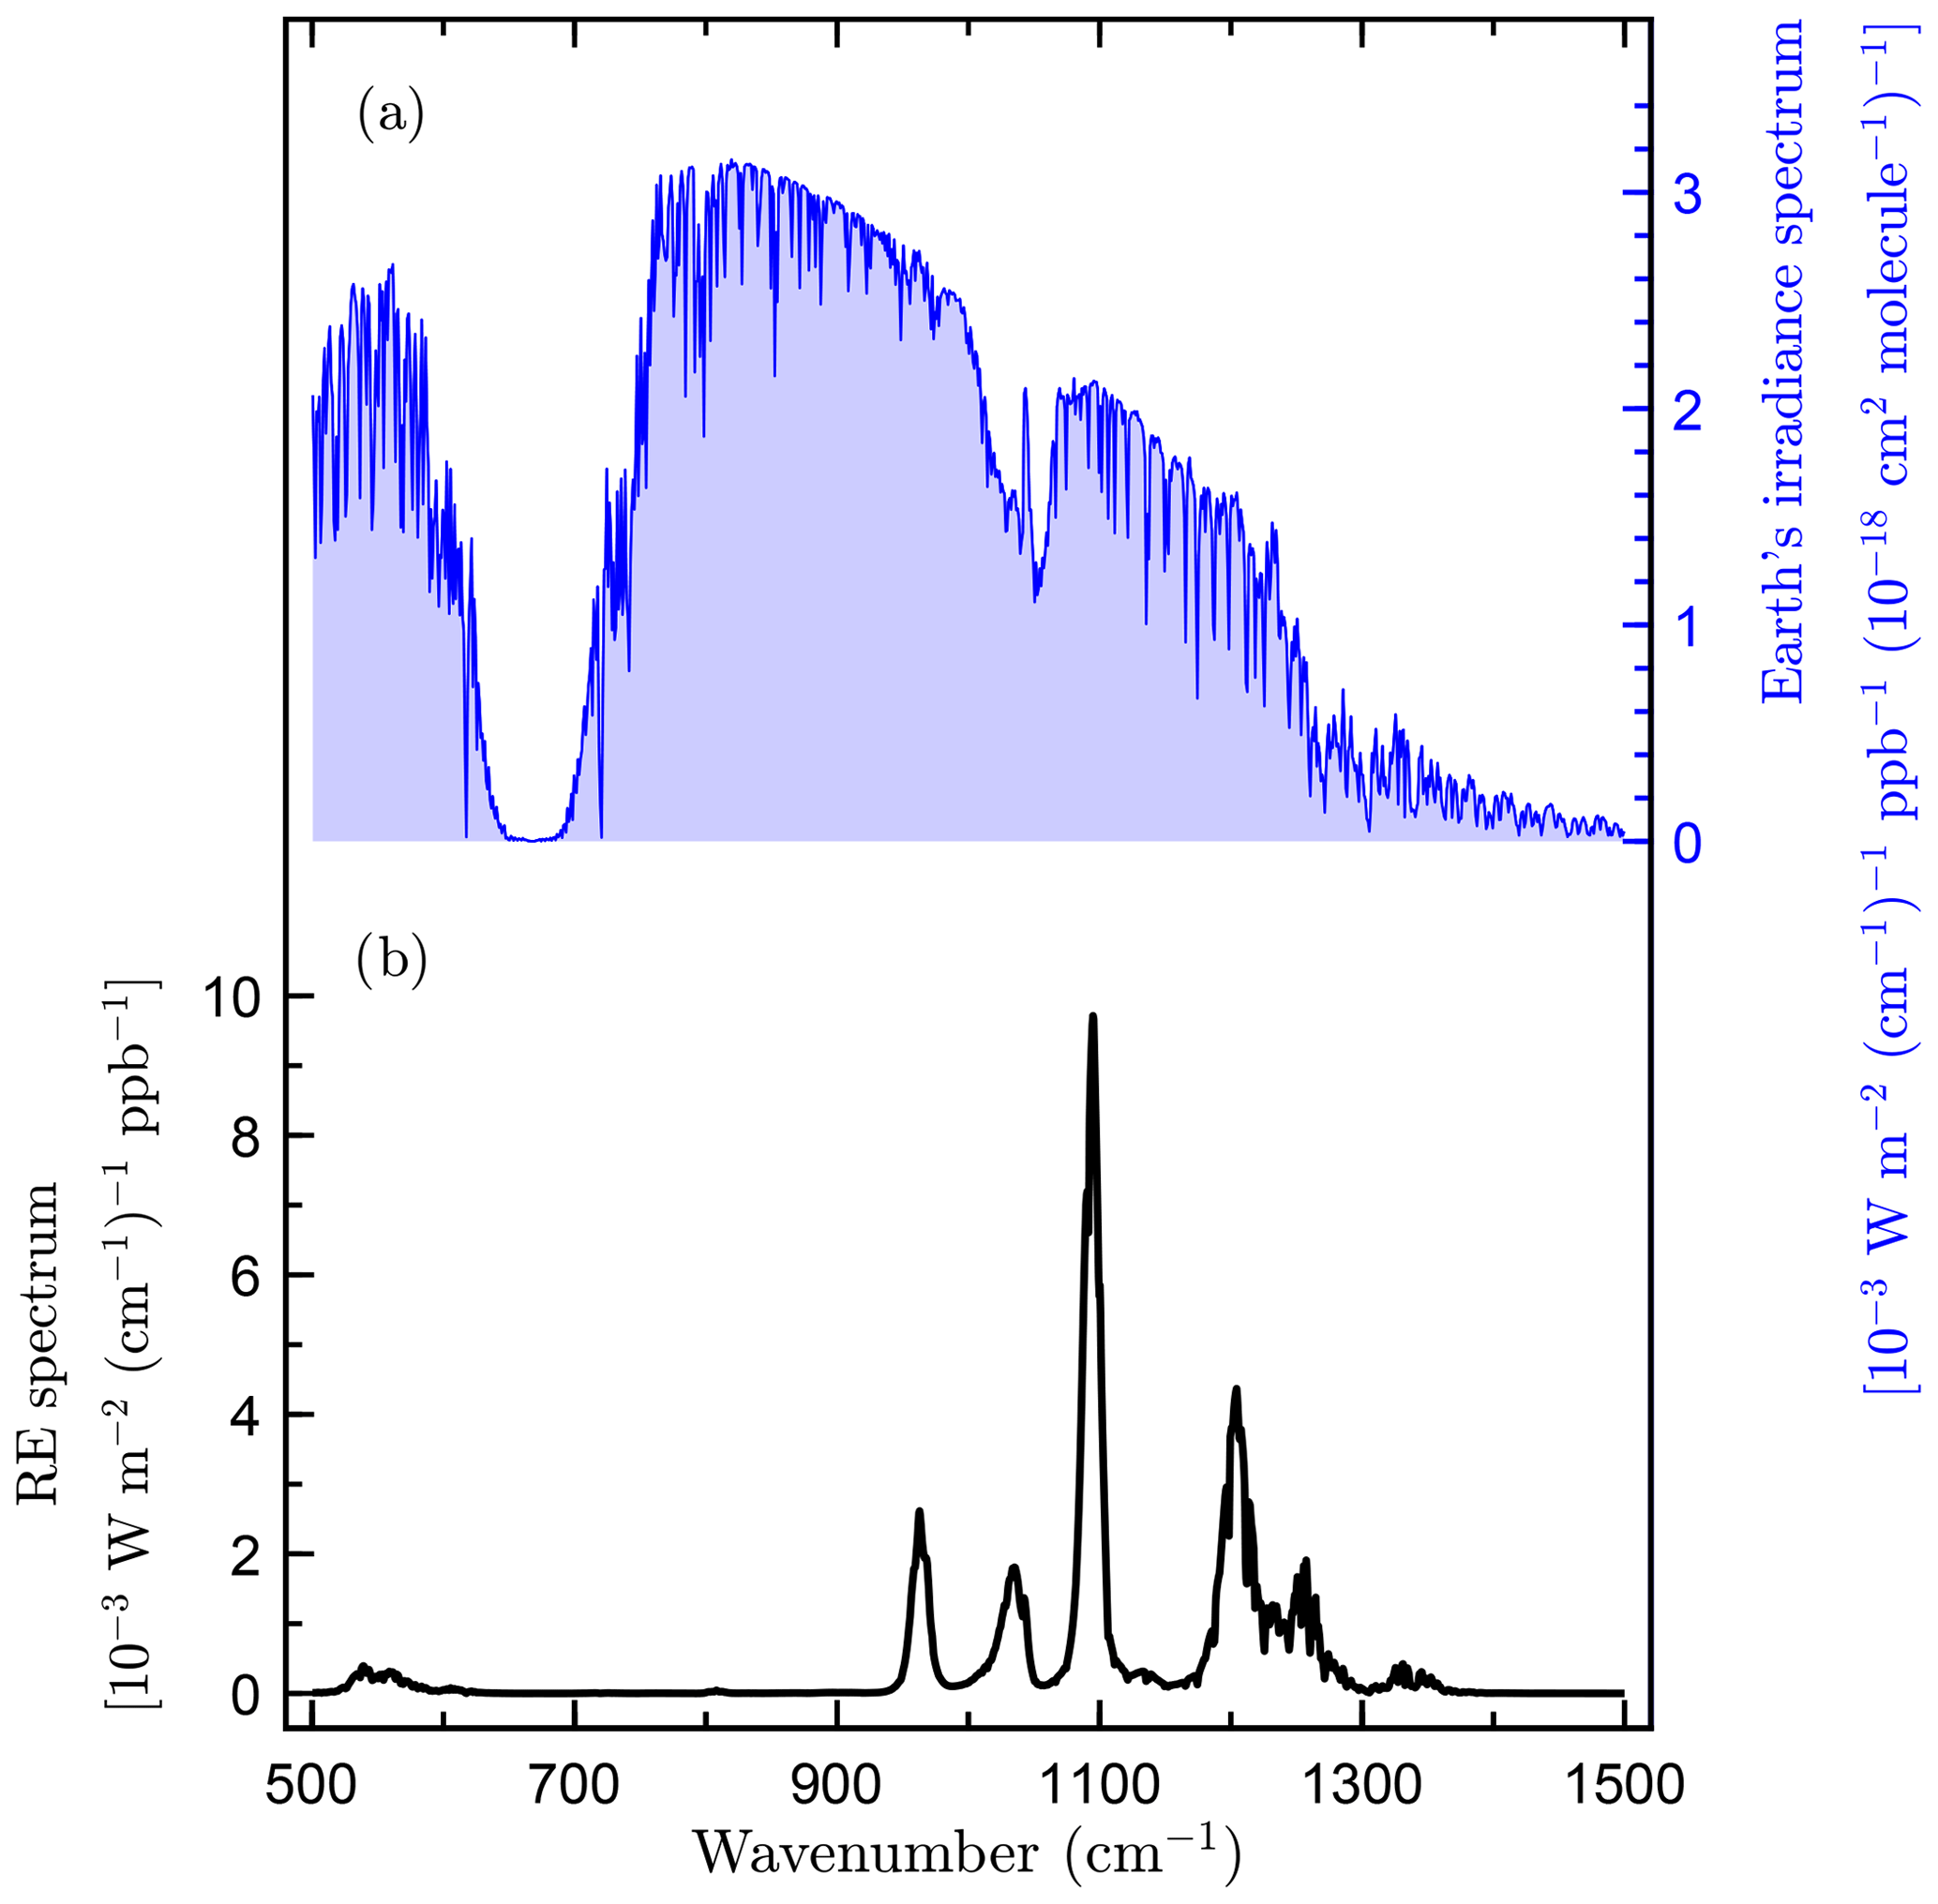
Figure 4(a) Earth's irradiance spectrum as reported by Hodnebrog et al. (2013) and (b) radiative efficiency (RE) spectrum of octafluorooxolane (c-C4F8O).
The GWP of c-C4F8O was calculated using the global atmospheric lifetime lower-limit of 3000 years and the radiative efficiency determined in this work:
where RE is the radiative efficiency, T is the time horizon (in years), is the molar weight of c-C4F8O, and RF is the radiative forcing of CO2. The GWPs are 8975, 12 000, and 16 000 for the 20-, 100-, and 500-year time horizons, respectively. Therefore, c-C4F8O is a potent radiative forcing agent due to the combination of its high radiative efficiency and long atmospheric lifetime. The GWPs for c-C4F8O are comparable to the values for long-lived perfluorocarbons (PFCs) that have GWP100 values in the range 6300–11 100 (Harris and Wuebbles, 2014).
3.6 Atmospheric observations and emissions of c-C4F8O
We observe a general increase in c-C4F8O in the atmosphere over the sample period starting in 1978 (Fig. 2). c-C4F8O was detectable in all samples but its abundance was low in the early record (<20 ppq) until about 1998, when its growth rate increased strongly. Its abundance increased rather steadily for more than a decade but has subsequently leveled at 73–75 ppq in 2015–2018. The growth rate was at a maximum of 4.0 ppq yr−1 in 2004 and declined from that to <0.25 ppq yr−1 in 2017 and 2018 as a consequence of the relatively constant abundance in the last few years.
The c-C4F8O measurements in the Southern Hemisphere provide a strong constraint on the trend in both hemispheres due to the very long lifetime of c-C4F8O in the atmosphere, the relatively rapid mixing of the atmosphere, and the expectation that most c-C4F8O emissions are in the Northern Hemisphere. Most anthropogenic gases are released predominantly in the Northern Hemisphere, including gases released by the semiconductor industry. The assumption of mainly Northern Hemisphere emissions for c-C4F8O leads to higher mole fraction values in the Northern Hemisphere than in the Southern Hemisphere, and this is confirmed by comparison of the modeled Northern Hemisphere history with the few Northern Hemisphere samples that we do have. In the Supplement, we test the sensitivity of inferred global emissions and mole fraction in both hemispheres to the assumed spatial distribution of emissions.
The two firn air samples fit well into the CGAA record with the older sample at slightly lower mole fraction than the oldest CGAA samples. Due to the very long lifetime, this suggests that c-C4F8O was below 10 ppq in the Southern Hemisphere before 1978, and could only have been steady or increasing. However, it is impossible to further pin down the first appearance of this compound in the atmosphere and the exact course of the abundance until ∼1980 because our knowledge of c-C4F8O prior to the CGAA is based on only one firn sample measurement with air spanning several decades (see calculated Green's functions in the Supplement). Also, potential small contamination during firn air sampling by modern air or sampling devices cannot be fully excluded, and the measurement of the older firn air sample is close to the instrument's detection limit. Given these limitations, we are not able to draw any conclusions on any potential naturally occurring c-C4F8O. Nevertheless, the two firn air sample measurements allow us to draw conclusions on storage stability of c-C4F8O in canisters. Given that the storage time of the two firn air samples in the canisters is much shorter than those of the older CGAA samples, the good agreement of the firn air results with those of the CGAA is supportive of storage stability of c-C4F8O in the CGAA tanks and confirms that the observed multidecadal record is not a simple artifact of degradation of c-C4F8O in canisters over time.
In situ measurements at Aspendale, which are available on a regular measurement basis since February 2017, show a constant abundance of c-C4F8O at ∼74 ppq. This lack of growth is an indication of currently very small, if at all any, emissions of this compound. Also, pollution events are absent from this urban in situ record within the precision of these measurements, suggesting that c-C4F8O is not emitted within the air mass footprints of the site.
Emissions derived from the atmospheric observations were low during the first part of our record (Fig. 2). Until 1980, when the global mean abundance of c-C4F8O was 10 ppq, cumulative emissions had reached 0.38 kt. For the time after ∼1980, when observations became more frequent, emissions were 0.02–0.03 kt yr−1 for about a decade. From the mid 1990s, emissions increased strongly to a maximum of 0.15 (±0.04, 2σ) kt yr−1 in 2004. Surprisingly, emissions have declined since, to <0.015 kt yr−1 by 2017 and 2018. This rapid decline is suggestive of a switch to alternative compounds in large-scale industrial applications such as in the semiconductor industry, or of a better containment in these applications or where c-C4F8O might be emitted as byproduct.
For the USA, reported bottom-up emissions of c-C4F8O under the GHGRP subpart “Fluorinated Gas Production” for 2011–2017 are surprisingly high (about half) compared to our top-down emissions estimates (Fig. 2c). It therefore appears unlikely that these bottom-up emissions derive entirely from fugitive emissions during c-C4F8O production, but they could, at least in part, derive from emissions of c-C4F8O as a byproduct during the production of other fluorochemicals. Anyhow, they reveal a surprisingly similar relative decline compared to our top-down estimates.
Cumulative emissions until 2018 amount to 2.8 (2.4–3.3) kt. If scaled with the GWP on a 100-year time horizon, as derived below, they correspond to 34 Mt CO2-equivalents. Despite the high GWP, these emissions are small compared to the major greenhouse gases but of similar magnitude to some of the other minor greenhouse gases such as minor perfluorocarbons and fluorinated inhalation anesthetics (Ivy et al., 2012; Vollmer et al., 2015). Whether these cumulative emissions remain at low levels will depend on potential future choices for c-C4F8O in large-scale applications.
We provide first laboratory experiments of atmospheric loss processes and first atmospheric observations of c-C4F8O. We measured infrared and UV absorption spectra of c-C4F8O, and the rate coefficient for the O(1D) + c-C4F8O reaction. These experimental results suggest that c-C4F8O is an atmospherically persistent trace gas with an atmospheric lifetime of >3000 years. In addition, its strong absorption in the “atmospheric window” results in a very high radiative efficiency, and when combined with the long atmospheric lifetime, yields a high GWP of 12 000 (100-year time horizon), which is exceeded by only a few other greenhouse gases. We show an increase in c-C4F8O in the atmosphere to present mole fractions of ∼75 ppq. Emissions, which were derived from these observations, have strongly declined after a peak in 2004. The reasons for this recent decline, and whether this is only a temporary feature, remain speculative. We hypothesize that the emissions decline could be, at least in part, a result of the industry's choice for alternative substances for chemical vapor chamber cleaning, which we assumed to have been its primary use in the last two decades. However, even if emissions were completely halted, it will, under the assumption of insignificant non-atmospheric sinks, take thousands of years for c-C4F8O to be removed from the atmosphere.
Data used in this study are available from the Supplement. Mention of trade names or commercial products does not constitute an endorsement or recommendation for use by the authors' affiliated organizations.
The supplement related to this article is available online at: https://doi.org/10.5194/acp-19-3481-2019-supplement.
MKV, FB, PBK, LPS, SR, and JBB were responsible for the overall project design. RLL, LPS, PJF, BM, and PBK provided the Cape Grim Air Archive samples, and DME and MAJC provided the firn air samples; MKV, BM, and LPS provided the air sample measurements; FB and JBB provided the laboratory measurements and analysis; and CMT provided the modeling part for the atmospheric observations. The manuscript was written by MKV and FB with contributions from all co-authors.
The authors declare that they have no conflict of interest.
We acknowledge the station personnel at Cape Grim for flask sampling for the
Cape Grim Air Archive (CGAA) project, which is jointly operated by CSIRO and
the Australian government Bureau of Meteorology. CSIRO research at Cape Grim
is supported by CSIRO, Bureau of Meteorology, the Australian government
Department of Environment and Energy, and Refrigerant Reclaim Australia. We
gratefully acknowledge the field team and the national research programs that
supported the Aurora Basin North drilling project. Martin K. Vollmer
acknowledges support from the Swiss Federal Office for the Environment (FOEN)
within the Swiss National Programs HALCLIM and CLIMGAS-CH, and 2016 grants
from Empa and the Swiss National Science Foundation (SNSF) for technical
development and archived air and firn air measurements at CSIRO Aspendale.
The work at NOAA was supported in part by the NOAA Climate Office's
Atmospheric Chemistry, Carbon Cycle, and Climate Program. General instrument
support is provided by members of the Advanced Global Atmospheric Gases
Experiment (AGAGE). We acknowledge the contribution by Peter Salameh, who
developed and supports GCWerks, a software control system used in the
Medusa-GCMS measurements of air samples described here. Deborah Ottinger is
acknowledged for her clarifications related to the USA GHG reporting
regulations, and Matt Rigby for his contributions to the AGAGE 12-box model.
We acknowledge two anonymous reviewers for their detailed and thorough
comments on the manuscript.
Edited by:
Andreas Engel
Reviewed by: two anonymous referees
3M Company: 3M Material Safety Data Sheet 3M(TM) PFG-3480 Specialty Gas, https://userweb.jlab.org/~brads/c4f8o/c4f8o-3M-msds.pdf (last access:15 May 2018), 2007. a
Acconcia, T. V., Agócs, A. G., Barile, F., Barnaföldi, G. G., Bellwied, R., Bencédi, G., Bencze, G., Berényi, D., Boldizsár, L., Chattopadhyay, S., Chinellato, D. D., Cindolo, F., Cossyleon, K., Das, D., Das, K., Das-Bose, L., Dash, A. K., D'Ambrosio, S., De Cataldo, G., De Pasquale, S., Di Bari, D., Di Mauro, A., Futó, E., Garcia-Solis, E., Hamar, G., Harton, A., Iannone, G., Jimenez, R. T., Kim, D. W., Kim, J. S., Knospe, A., Kovács, L., Lévai, P., Markert, C., Martinengo, P., Molnár, L., Nappi, E., Oláh, L., Paić, G., Pastore, C., Patimo, G., Patino, M. E., Peskov, V., Pinsky, L., Piuz, F., Pochybová, S., Sgura, I., Sinha, T., Song, J., Takahashi, J., Timmins, A., Van Beelen, J. B., Varga, D., Volpe, G., Weber, M., Xaplanteris, L., Yi, J., and Yoo, I.-K.: VHMPID RICH prototype using pressurized C4F8O radiator gas and VUV photon detector, Nucl. Instrum. Meth. A, 767, 50–60, https://doi.org/10.1016/j.nima.2014.08.005, 2014. a
Artuso, M., Boulahouache, C., Blusk, S., Butt, J., Dorjkhaidav, O., Menaa, N., Moutain, R., Muramatsu, H., Nandakumar, R., Randrianarivony, K., Sia, R., Skwarnicki, T., Stone, S., Wang, J. C., and Zhang, K.: Performance of a C4F8O gas radiator ring imaging Cherenkov detector using multi-anode photomultiplier tubes, Nucl. Instrum. Meth. A, 558, 373–387, https://doi.org/10.1016/j.nima.2005.11.221, 2006. a
Baasandorj, M., Fleming, E. L., Jackman, C. H., and Burkholder, J. B.: O(1D) kinetic study of key ozone depleting substances and greenhouse gases, J. Phys. Chem. A, 117, 2434–2445, https://doi.org/10.1021/jp312781c, 2013. a
Bernard, F., Papanastasiou, D. K., Papadimitriou, V. C., and Burkholder, J. B.: Infrared absorption spectra of linear (L2–L5) and cyclic (D3–D6) permethylsiloxanes, J. Quant. Spectrosc. Ra., 202, 247–254, https://doi.org/10.1016/j.jqsrt.2017.08.006, 2017. a
Bernard, F., Papanastasiou, D. K., Papadimitriou, V. C., and Burkholder, J. B.: Infrared absorption spectra of N(CxF2x+1)3, x=2–5 perfluoroamines, J. Quant. Spectrosc. Ra., https://doi.org/10.1016/j.jqsrt.2018.02.039, 2018. a
Bernard, F., Portmann, R. W., Papanastasiou, D. K., and Burkholder, J. B.: Atmospheric loss processes and global warming potentials for perfluoroamines: N(CxF2x+1)3, x=3–5, in preparation, 2019. a
Beu, L. S.: Reduction of Perfluorocompound (PFC) Emissions: 2005 State-of-the-Technology Report, International SEMATECH Manufacturing Initiative Technology Transfer #05104693A-ENG, Semiconductor Manufacturing Technology, SEMATECH, Austin, TX 78741, USA, http://ismi.sematech.org (last access: 28 December 2018), 2005. a
Burkholder, J. B., Sander, S. P., Abbatt, J., Barker, J. R., Huie, R. E., Kolb, C. E., Kurylo, M. J., Orkin, V. L., Wilmouth, D. M., and Wine, P. H.: Chemical Kinetics and Photochemical Data for Use in Atmospheric Studies, Evaluation No. 18 of the NASA Panel for Data Evaluation, JPL Publication 15–10, Jet Propulsion Laboratory, Pasadena, http://jpldataeval.jpl.nasa.gov (9 September 2018), 2015. a, b, c
Carpenter, L. J. and Reimann, S.: Ozone-Depleting Substances (ODSs) and Other Gases of Interest to the Montreal Protocol, Chapter 1, in: Scientific Assessment of Ozone Depletion: 2014, Global Ozone Research and Monitoring Project – Report No. 55, World Meteorological Organisation, Geneva, Switzerland, 2014. a
Chachereau, A., Fedor, J., Janečková, R., Kočišek, J., Rabie, M., and Franck, C. M.: Electron attachment properties of c-C4F8O in different environments, J. Phys. D, 49, 375201, https://doi.org/10.1088/0022-3727/49/37/375201, 2016. a
Cunnold, D. M., Prinn, R. G., Rasmussen, R. A., Simmonds, P. G., Alyea, F. N., Cardelino, C. A., Crawford, A. J., Fraser, P. J., and Rosen, R. D.: The atmospheric lifetime experiment 3. Lifetime methodology and application to 3 years of CFCl3 data, J. Geophys. Res., 88, 8379–8400, https://doi.org/10.1029/JC088iC13p08379, 1983. a
Dahl, D. A., Rabie, M., Häfliger, P., and Franck, C. M.: Electron attaching properties of c-C4F8O derived from swarm parameter measurements in buffer gases, In Proceedings of the Gas Discharge (GD) 2014, Orléans, France, 6–11 July 2014. a
Favre, H. A. and Powell, W. H.: Nomenclature of Organic Chemistry, IUPAC Recommendations and Preferred Names 2013, The Royal Society of Chemisty, Cambridge, UK, 2014. a
Fraser, P. J., Langenfelds, R., Derek, N., and Porter, L. W.: Studies in air archiving techniques. Part 1: Long term stability of atmospheric trace gases in dry, natural air stored in high-pressure, surface-treated aluminium cylinders, in: Baseline Atmospheric Program Australia 1989, edited by: Wilson, S. R. and Gras, J. L., Bureau of Meteorology and CSIRO Division of Atmospheric Research, Canberra, Australia, vol. 1989, 16–29, 1991. a
Fraser, P. J., Steele, L. P., Pearman, G. I., Coram, S., Derek, N., Langenfelds, R. L., and Krummel, P. B.: Non-carbon dioxide greenhouse gases at Cape Grim: a 40 year odyssey, in: Baseline Atmospheric Program (Australia) History and Recollections, 40th Anniversary Special Edition, edited by: Derek, N., Krummel, P. B., and Cleland, S. J., Bureau of Meteorology and CSIRO Oceans and Atmosphere, Melbourne, Australia, pp. 45–76, 2016. a
Frick, H. R. and Anderson, R. W.: Preparation of Octafluorotetrahydrofuran, https://patents.google.com/patent/US3679709 (last access: 22 September 2018), US Patent 3679709, 1972. a
Fuller, E. N., Schettler, P. D., and Giddings, J. C.: A new method for prediction of binary gas-phase diffusion coefficients, Ind. Eng. Chem., 58, 19–27, https://doi.org/10.1021/ie50677a007, 1966. a
Harris, N. R. P. and Wuebbles, D. J.: Scenarios and information for policymakers, Chapter 5, in: Scientific Assessment of Ozone Depletion: 2014, Global Ozone Research and Monitoring Project – Report No. 55, World Meteorological Organisation, Geneva, Switzerland, 2014. a
Hodnebrog, Ø., Etminan, M., Fuglestvedt, J. S., Marston, G., Myhre, G., Nielsen, C. J., Shine, K. P., and Wallington, T. J.: Global warming potentials and radiative efficiencies of halocarbons and related compounds: A comprehensive review, Rev. Geophys., 51, 300–378, https://doi.org/10.1002/rog.20013, 2013. a, b, c
IPCC: 2006 IPCC Guidelines for National Greenhouse Gas Inventories, Prepared by the National Greenhouse Gas Inventories Programme, IGES, Japan, Institute for Global Environmental Strategies, Hayama, Kanagawa, Japan, 2006. a
Ivy, D. J., Rigby, M., Baasandorj, M., Burkholder, J. B., and Prinn, R. G.: Global emission estimates and radiative impact of C4F10, C5F12, C6F14, C7F16 and C8F18, Atmos. Chem. Phys., 12, 7635–7645, https://doi.org/10.5194/acp-12-7635-2012, 2012. a, b
Kim, J. H., Bae, J. W., Oh, C. H., Kim, K. J., Lee, N. E., and Yeom, G. Y.: C4F8O/O2/N-based additive gases for silicon nitride plasma enhanced chemical vapor deposition chamber cleaning with low global warming potentials, Jpn. J. Appl. Phys., 41, 6570–6573, https://doi.org/10.1143/JJAP.41.6570, 2002. a
Kim, K. J., Oh, C. H., Lee, N.-E., Kim, J. H., Bae, J. W., Yeom, G. Y., and Yoon, S. S.: Global warming gas emission during plasma cleaning process of silicon nitride using c-C4F8O∕O2 chemistry with additive Ar and N2, J. Vac. Sci. Technol. B, 22, 483–488, https://doi.org/10.1116/1.1645881, 2004. a
Kočišek, J., Janečková, R., and Fedor, J.: Long-lived transient anion of c-C4F8O, J. Chem. Phys., 148, 074303, https://doi.org/10.1063/1.5017478, 2018. a
Langenfelds, R. L., Fraser, P. J., Francey, R. J., Steele, L. P., Porter, L. W., and Allison, C. E.: The Cape Grim air archive: The first seventeen years, 1978–1995, in: Baseline Atmospheric Program (Australia) 1994–95, edited by: Francey, R. J., Dick, A. L., and Derek, N., Bureau of Meteorology and CSIRO Division of Atmospheric Research, Australian Bureau of Meteorology and CSIRO Marine and Atmospheric Research, Melbourne, Australia, 53–70, 1996. a
Langenfelds, R. L., Krummel, P. B., Fraser, P. J., Steele, L. P., Ward, J., and Somerville, N. T.: Archiving of Cape Grim air, in: Baseline Atmospheric Program Australia 2009–2010, edited by: Derek, N., Krummel, P. B., and Cleland, S. J., Australian Bureau of Meteorology and CSIRO Marine and Atmospheric Research, Melbourne, Australia, 44–45, 2014. a
Mackay, D., Shiu, W.-Y., and Ma, K.-C. (Eds).: Illustrated Handbook of Physical-chemical Properties and Environmental Fate for Organic Chemicals, 1, 880 pp., 2006. a
Matsunaga, N., Hori, M., and Nagashima, A.: Mutual diffusion coefficients of halogenated-hydrocarbon refrigerant-air systems, in: High Temperatures – High Pressures, 13 ECTP Proceedings, 25, 63–70, 1993. a
Matsunaga, N., Hori, M., and Nagashima, A.: Measurements of the mutual diffusion coefficients of gases by the Tylor method (7th report, measurements on the SF6-air SF6-N2, SF6-O2, CFC12-N2, CFC12-O2, HCFC22-N2 and HCFC22-O2 systems), Trans. Jpn. Soc. Mech. Eng. B., 68, 550–555, 2002. a
Matsunaga, N., Hori, M., and Nagashima, A.: Measurements of the mutual diffusion coefficients of carbon tetrafluoride and methyl bromide in air, nitrogen and oxygen, Proc. 26th Jpn. Symp. Therm. Props, 26, 499–501, 2005. a
McCoy, M.: Booming semiconductor business smiles on chemical suppliers, Chemical and Engineering News, 78, 23–24, https://doi.org/10.1021/cen-v078n030.p023, 2000. a
Miller, B. R., Weiss, R. F., Salameh, P. K., Tanhua, T., Greally, B. R., Mühle, J., and Simmonds, P. G.: Medusa: A sample preconcentration and GC/MS detector system for in situ measurements of atmospheric trace halocarbons, hydrocarbons, and sulfur compounds, Anal. Chem., 80, 1536–1545, https://doi.org/10.1021/ac702084k, 2008. a, b, c
Myhre, G., Shindell, D., Breon, F.-M., Collins, W., Fuglestvedt, J., Huang, J., Koch, D., Lamarque, J.-F., Lee, D., Mendoza, B., Nakajima, T., Robock, A., Stephens, G., Taekmura, T., and Zhang, H.: Anthropogenic and Natural Radiative Forcing, in: Climate Change 2013: The Physical Science Basis. Contribution of Working Group I to the Fifth Assessment Report of the Intergovernmental Panel on Climate Change, edited by: Stocker, T. F., Qin, D., Plattner, G.-K., Tignor, M., Allen, S. K., Boschung, J., Nauels, A., Xia, Y., Bex, V., and Midgley, P. M., Cambridge University Press, Cambridge, United Kingdom and New York, NY, USA, 2013. a, b
Oh, B. H., Bae, J. W., Kim, J. H., Kim, K. J., Ahn, Y. S., Lee, N.-E., Yeom, G. Y., Yoon, S. S., Chae, S.-K., Ku, M.-S., Lee, S.-G., and Cho, D.-H.: Effect of O2(CO2)∕C4F8O gas combinations on global warming gas emission in silicon nitride PECVD plasma cleaning, Surface and Coatings Technology, 146/147, 522–527, https://doi.org/10.1016/S0257-8972(01)01463-3, 2001. a
Prinn, R. G., Weiss, R. F., Arduini, J., Arnold, T., DeWitt, H. L., Fraser, P. J., Ganesan, A. L., Gasore, J., Harth, C. M., Hermansen, O., Kim, J., Krummel, P. B., Li, S., Loh, Z. M., Lunder, C. R., Maione, M., Manning, A. J., Miller, B. R., Mitrevski, B., Mühle, J., O'Doherty, S., Park, S., Reimann, S., Rigby, M., Saito, T., Salameh, P. K., Schmidt, R., Simmonds, P. G., Steele, L. P., Vollmer, M. K., Wang, R. H., Yao, B., Yokouchi, Y., Young, D., and Zhou, L.: History of chemically and radiatively important atmospheric gases from the Advanced Global Atmospheric Gases Experiment (AGAGE), Earth Syst. Sci. Data, 10, 985–1018, https://doi.org/10.5194/essd-10-985-2018, 2018. a
Pruette, L., Karecki, S., Reif, R., Tousignant, L., Reagan, W., Kesari, S., and Zazzera, L.: Evaluation of C4F8O as an alternative plasma-enhanced chemical vapor deposition chamber clean chemistry, J. Electrochem. Soc., 147, 1149–1153, https://doi.org/10.1149/1.1393328, 2000. a, b
Rigby, M., Prinn, R. G., O'Doherty, S., Montzka, S. A., McCulloch, A., Harth, C. M., Mühle, J., Salameh, P. K., Weiss, R. F., Young, D., Simmonds, P. G., Hall, B. D., Dutton, G. S., Nance, D., Mondeel, D. J., Elkins, J. W., Krummel, P. B., Steele, L. P., and Fraser, P. J.: Re-evaluation of lifetimes of the major CFCs and CH3CCl3 using atmospheric trends, Atmos. Chem. Phys., 13, 2691–2702, https://doi.org/10.5194/acp-13-2691-2013, 2013. a, b, c
SPARC: SPARC Report on the Lifetimes of Stratospheric Ozone-Depleting Substances, Their Replacements, and Related Species, Tech. Rep. 6, WCRP-15/2013, 2013. a
Trudinger, C. M., Enting, I. G., Etheridge, D. M., Francey, R. J., Levchenko, V. A., Steele, L. P., Raynaud, D., and Arnaud, L.: Modeling air movement and bubble trapping in firn, J. Geophys. Res., 102, 6747–6763, https://doi.org/10.1029/96JD03382, 1997. a
Trudinger, C. M., Enting, I. G., Rayner, P. J., Etheridge, D. M., Buizert, C., Rubino, M., Krummel, P. B., and Blunier, T.: How well do different tracers constrain the firn diffusivity profile?, Atmos. Chem. Phys., 13, 1485–1510, https://doi.org/10.5194/acp-13-1485-2013, 2013. a
Trudinger, C. M., Fraser, P. J., Etheridge, D. M., Sturges, W. T., Vollmer, M. K., Rigby, M., Martinierie, P., Mühle, J. Worton, D. R., Krummel, P. B., Steele, L. P., Miller, B. R., Laube, J., Mani, F., Rayner, P. J., Harth, C. M., Witrant, E., Blunier, T., Schwander, J., O'Doherty, S., and Battle, M.: Atmospheric abundance and global emissions of perfluorocarbons CF4, C2F6 and C3F8 since 1800 inferred from ice core, firn, air archive and in situ measurements, Atmos. Chem. Phys., 16, 11733–11754, https://doi.org/10.5194/acp-16-11733-2016, 2016. a, b, c
UNFCCC: Decision 24/CP.19, Revision of the UNFCCC Reporting Guidelines on Annual Inventories for Parties included in Annex I to the Convention, Tech. Rep. FCCC/CP/2013/10/Add.3, UNFCCC, 2013. a
United Nations: Montreal Protocol on Substances That Deplete the Ozone Layer. Montreal, 16 September 1987. Amendment to the Montreal Protocol on Substances That Deplete the Ozone Layer, Kigali, 15 October 2016, Tech. Rep. C.N.872.2016.TREATIES-XXVII.2.f (Depositary Notification), United Nations, New York, 10017, 2016. a
Vollmer, M. K., Rhee, T. S., Rigby, M., Hofstetter, D., Hill, M., Schoenenberger, F., and Reimann, S.: Modern inhalation anesthetics: Potent greenhouse gases in the global atmosphere, Geophys. Res. Lett., 42, 1606–1611, https://doi.org/10.1002/2014GL062785, 2015. a, b
Vollmer, M. K., Mühle, J., Trudinger, C. M., Rigby, M., Montzka, S. A., Harth, C. M., Miller, B. R., Henne, S., Krummel, P. B., Hall, B. D., Young, D., Kim, J., Arduini, J., Wenger, A., Yao, B., Reimann, S., O'Doherty, S., Maione, M., Etheridge, D. M., Li, S., Verdonik, D. P., Park, S., Dutton, G., Steele, L. P., Lunder, C. R., Rhee, T. S., Hermansen, O., Schmidbauer, N., Wang, R. H. J., Hill, M., Salameh, P. K., Langenfelds, R. L., Zhou, L., Blunier, T., Schwander, J., Elkins, J. W., Butler, J. H., Simmonds, P. G., Weiss, R. F., Prinn, R. G., and Fraser, P. J.: Atmospheric histories and global emissions of halons H-1211 (CBrClF2), H-1301 (CBrF3), and H-2402 (CBrF2CBrF2), J. Geophys. Res.-Atmos., 121, 3663–3686, https://doi.org/10.1002/2015JD024488, 2016. a, b
Vollmer, M. K., Young, D., Trudinger, C. M., Mühle, J., Henne, S., Rigby, M., Park, S., Li, S., Guillevic, M., Mitrevski, B., Harth, C. M., Miller, B. R., Reimann, S., Yao, B., Steele, L. P., Wyss, S. A., Lunder, C. R., Arduini, J., McCulloch, A., Wu, S., Rhee, T. S., Wang, R. H. J., Salameh, P. K., Hermansen, O., Hill, M., Langenfelds, R. L., Ivy, D., O'Doherty, S., Krummel, P. B., Maione, M., Etheridge, D. M., Zhou, L., Fraser, P. J., Prinn, R. G., Weiss, R. F., and Simmonds, P. G.: Atmospheric histories and emissions of chlorofluorocarbons CFC-13 (CClF3), ΣCFC-114 (C2Cl2F4), and CFC-115 (C2ClF5), Atmos. Chem. Phys., 18, 979–1002, https://doi.org/10.5194/acp-18-979-2018, 2018. a, b