the Creative Commons Attribution 4.0 License.
the Creative Commons Attribution 4.0 License.
Ground-based MAX-DOAS observations of tropospheric formaldehyde VCDs and comparisons with the CAMS model at a rural site near Beijing during APEC 2014
Pinhua Xie
Jin Xu
Ang Li
Fengcheng Wu
Zhaokun Hu
Cheng Liu
Qiong Zhang
Formaldehyde (HCHO), a key aerosol precursor, plays a significant role in atmospheric photo-oxidation pathways. In this study, HCHO column densities were measured using a Multi-AXis Differential Optical Absorption Spectroscopy (MAX-DOAS) instrument at the University of Chinese Academy of Science (UCAS) in Huairou District, Beijing, which is about 50 km away from the city center. Measurements were taken during the period of 1 October 2014 to 31 December 2014, and the Asia-Pacific Economic Cooperation (APEC) summit was organized on 5–11 November. Peak values of HCHO vertical column densities (VCDs) around noon and a good correlation coefficient R2 of 0.73 between HCHO VCDs and surface O3 concentration during noontime indicated that the secondary sources of HCHO through photochemical reactions of volatile organic compounds (VOCs) dominated the HCHO values in the area around UCAS. Dependences of HCHO VCDs on wind fields and backward trajectories were identified and indicated that the HCHO values in the area around UCAS were considerably affected by the transport of pollutants (VOCs) from polluted areas in the south. The effects of control measures on HCHO VCDs during the APEC period were evaluated. During the period of the APEC conference, the average HCHO VCDs were and lower than that during the pre-APEC and post-APEC periods calculated at the 95 % confidence limit, respectively. This phenomenon could be attributed to both the effects of prevailing northwest wind fields during APEC and strict control measures. We also compared the MAX-DOAS results with the Copernicus Atmosphere Monitoring Service (CAMS) model. The HCHO VCDs of the CAMS model and MAX-DOAS were generally consistent with a correlation coefficient R2 greater than 0.68. The peak values were consistently captured by both data datasets, but the low values were systematically underestimated by the CAMS model. This finding may indicate that the CAMS model can adequately simulate the effects of the transport and the secondary sources of HCHO but underestimates the local primary sources.
- Article
(12577 KB) - Full-text XML
-
Supplement
(624 KB) - BibTeX
- EndNote
The 2014 Asia-Pacific Economic Cooperation (APEC) conference was held in the Huairou District of Beijing from 5–11 November 2014. To improve the air quality in Beijing during the APEC conference, a group of collaborators on atmospheric pollution prevention and control in the Beijing–Tianjin–Hebei (Jing–Jin–Ji) region and surrounding areas compiled the “The APEC conference air quality assurance policy” (Liu et al., 2015). Some provinces, including Beijing, Tianjin, Hebei, Shanxi, Inner Mongolia, and Shandong implemented different emission reduction strategies in accordance with the air quality assurance plan (Z. S. Wang et al., 2016). Since 1 November 2014, parts of the Jing–Jin–Ji region and surrounding areas have begun to implement an emission reduction plan according to the APEC conference air quality assurance policy. Formal emission reduction measures were implemented in the Jing–Jin–Ji region and surrounding areas from 3 November and included limiting the production of factories, shutting down construction sites, implementing traffic restrictions based on even- and odd-numbered license plates, and improving road cleaning procedures (Z. S. Wang et al., 2016). In response to the possible adverse weather conditions from 8 to 10 November, the “enhanced emission reduction measures” were implemented in the Jing–Jin–Ji region and surrounding areas from 6 November. These various efforts coupled with relatively favorable weather conditions compared with previous years resulted in the emission reduction measures having significant effects. Based on estimations, all types of main pollutants were reduced by over 40 % in Beijing and by over 30 % in other provinces through these measures (Z. S. Wang et al., 2016). From 1 to 12 November 2014, the air quality was at an excellent level, referred to as “APEC blue”.
Recently, many studies have analyzed the effects of emission reduction measures during the APEC summit. Ground-based observations were taken to investigate the air quality changes associated with a series of stringent emission reduction measures (Fan et al., 2016; Li et al., 2016; Liu et al., 2016; Tang et al., 2015; Chen et al., 2015; Z. S. Wang et al., 2016; H. Wang et al., 2016; G. Wang et al., 2017). Z. S. Wang et al. (2016) selected five representative in situ stations in different locations in Beijing, which were Miyun Reservoir Station (city background station), Yuzhan Station (regional station), Changping Station (suburban station), Olympic Sports Center Station (city station) and Xizhimen North Street Station (transport station), and found that average concentrations of SO2, NO2, PM10, and PM2.5 decreased by 62 %, 41 %, 36 %, and 47 %, respectively, whereas the average O3 level approximately doubled over this period than the same period over the last 5 years (PM2.5 since 2013). O3 production rate depends on the ratios of volatile organic carbon (VOC) and NOx. The urban and suburban areas of Beijing are controlled by the NOx saturated condition of O3 production. Since emission control measures are mainly focused on NOx, but not VOCs, a decrease of NOx can cause significant increases of O3 concentration (Z. S. Wang et al., 2016). Although the traffic and urban stations produce a lot of pollution due to motor vehicle emissions, the NO2 concentrations of suburban and regional stations significantly dropped (47 %) compared with the traffic and urban stations (23 %) as a result of the control measures. The NO2 emitted by motor vehicles in the Beijing urban area remained high, even under the measures taken to limit the number of vehicles (Z. S. Wang et al., 2016). Space observations were also used to evaluate the effect of emission control measures on the changes in NO2 tropospheric vertical column densities (VCDs) and aerosol optical depth (AOD) in Beijing and its surroundings based on the Ozone Monitoring Instrument (OMI) and Moderate Resolution Imaging Spectroradiometer (MODIS) retrieval. The results showed that NO2 VCD and AOD were mostly reduced by 47 % and 34 % in Beijing, respectively (Huang et al., 2015; Wei et al., 2016; Meng et al., 2015). The analytical results of the Chemical Mass Balance (CMB) model showed that the contributions of coal-fired boilers, dust, and motor vehicles to PM2.5 in Beijing were around 2 %, 7 %, and 30 %, respectively, during the APEC summit (Cheng et al., 2016). Zhang et al. (2017) analyzed the characteristics of aerosol size distribution and the vertical backscattering coefficient profile during the 2014 APEC summit using lidar observation. Particles with larger sizes were better controlled during the APEC period, with the number concentration of accumulation-mode and coarse-mode particles experiencing more significant decreases of 47 % and 68 % than before and after the APEC period (Zhang et al., 2017). Published studies have focused mainly on the effects of commonly measured gas pollutants, particulate matter, and aerosols, but not formaldehyde (HCHO; Cheng et al., 2016; Fan et al., 2016; Huang et al., 2015; Li et al., 2016; Liu et al., 2016; Meng et al., 2015; Tang et al., 2015; Chen et al., 2015; Z. S. Wang et al., 2016; H. Wang et al., 2016; G. Wang et al., 2017; Wei et al., 2016).
As an abundant product of the oxidation of many volatile organic compounds (VOCs), HCHO is known to harm human health, for instance, by damaging oral epithelial cells (Nilsson et al., 1998; Pinardi et al., 2013). A variety of other hydrocarbons generally determine the concentration of HCHO. Thus, HCHO is used as an indicator of VOCs (Fried et al., 2011). Tropospheric formaldehyde mainly originates from two sources. The primary emissions emanate from incomplete combustion, such as anthropogenic (e.g., industrial emissions) and pyrogenic (mainly biomass burning) sources. Secondary sources originate from the photo-oxidation process of many VOCs. In addition, a small fraction of HCHO originates from the direct emissions of biogenic sources (e.g., vegetation). The variability in HCHO over continents is particularly dominated by the distributions of local emissions of non-methane volatile organic compounds (NMVOCs) (Chance et al., 2000). Being a short lifetime oxidation product, long-lived VOCs, such as methane (CH4), contribute to the background levels of HCHO (Pinardi et al., 2013; Stavrakou et al., 2009; Vrekoussis et al., 2010). The monitoring of NMVOC emissions is essential not only for the hydroxyl radical OH, but also for the formation and transport of secondary organic aerosols (Palmer et al., 2006; Stavrakou et al., 2009; De Smedt et al., 2015). HCHO is an important indicator of atmospheric photochemical reactions. As an active gas, HCHO can be photolyzed to generate HO2 free radicals. HO2 rapidly and radically reacts with NO to generate OH, which can influence the oxidation ability of the atmosphere. All of the photolysis equations of HCHO to form the OH radical at wavelengths below 370 nm are listed as follows:
Therefore, HCHO can reflect anthropogenic VOC emissions and VOC emissions through the fast production of short-lived NMVOCs. Identifying the major sources of HCHO is essential for quantifying the photolysis sources of OH and their contributions to aerosol formation and for effectively controlling photochemical pollution (Bauwens et al., 2016; Chang et al., 2016; Ling et al., 2017; Ma et al., 2016; Tanaka et al., 2016).
The implementation of a series of temporary reduction measures for atmospheric pollutant emissions in major international events in China is relatively rare. The APEC summit provided an opportunity to study the relationship between environmental concentrations and pollutant emissions (Cheng et al., 2016). Studying the influences of control measures on HCHO is crucial for improving air quality.
A type of passive differential optical absorption spectroscopy system, called Multi-AXis Differential Optical Absorption Spectroscopy (MAX-DOAS), has been used over the past decade to measure tropospheric trace gases (Hönninger et al., 2004; Wagner et al., 2004, 2007; Sinreich et al., 2005; Vigouroux et al., 2009). The information obtained from MAX-DOAS measurements includes tropospheric column densities, surface volume mixing ratios (VMRs), and vertical profiles of aerosol extinction and trace gas mixing ratios. HCHO can be measured in the ultraviolet spectral range using the MAX-DOAS technique (Vigouroux et al., 2009; Wagner et al., 2011; Pinardi et al., 2013; Li et al., 2013; Borovski et al., 2014; Cheung et al., 2014; Franco et al., 2015; Lee et al., 2015; Schreier et al., 2016; Y. Wang et al., 2017a, b).
In this study, we used the ground-based MAX-DOAS instrument installed in the Huairou District (suburban area) of Beijing to evaluate the effects of the sources and depositions of HCHO and their relations with emission control measures and meteorological conditions during the period from 26 October to 20 November 2014. Two pollution episodes and their relationships with meteorological conditions were analyzed during APEC to evaluate the effects of regional transport and local emissions. Afterwards, three episodes, defined as “pre-APEC,” the period of APEC, and “post-APEC,” were used to evaluate the influences of emission control measures on the changes in HCHO VCD during APEC. The correlations between HCHO VCDs with NO2 VCDs and O3 were used to determine the main HCHO sources and evaluate the dominant error sources of HCHO simulations of Copernicus Atmosphere Monitoring Service (CAMS) model. Finally, the HCHO VCDs retrieved from the MAX-DOAS measurements were then compared with the results from the CAMS model simulations from 1 October to 31 December 2014. Consistencies and discrepancies between the model and measurements are discussed. This study can be used as a reference for evaluating the effectiveness of photochemical pollution control measures adopted during the APEC summit. Moreover, this study could practically assist in the development of control strategies in the future and also provides support for verifying the model simulations.
2.1 Monitoring locations and instrument
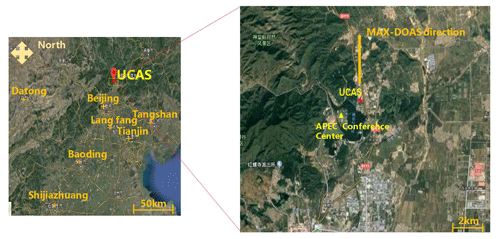
To evaluate the emission control measures, a supersite was established in the Yanqi Lake campus of the University of Chinese Academy of Sciences (UCAS) in Huairou District, in the northeast suburban area of Beijing. The APEC conference was also held in the Yanqi Lake region near the campus of UCAS (Fig. 1). The field campaign was performed for nearly 4 months from 1 October 2014 to 20 January 2015. However, this study only discusses the period from October to December 2014.
The Yanshan are in the west of the site, and Yanqi Lake lies at the edge of the mountains to the southwest of the site. Beijing urban areas and the industrial cities of Tangshan, Baoding, Shijiazhuang, and Tianjin are also located in the south. Relevant pollution sources in Tangshan, Baoding, Shijiazhuang, and Tianjin are primary pollution hotspots. In Beijing, vehicles are the predominant pollution source, especially in the urban areas (Lin et al., 2009, 2012; Shao et al., 2006; Tang et al., 2015; Wei et al., 2016). Thus, air flow coming from the south may bring anthropogenic emissions. The site is mainly influenced by emissions from vehicles on the China National Highway 111 that runs from the north and south as well as some stationary sources from the rural settlements across the highway (Zhang et al., 2017).
The MAX-DOAS instrument was deployed on the balcony (without a roof) of a classroom on the fourth floor in the laboratory building in the campus of UCAS (116.67∘ E, 40.4∘ N). The UCAS supersite is on the top floor of the laboratory building, which is about 10 m away from the MAX-DOAS instrument. Nitrogen oxide (NO, NO2, and NOx) was measured by chemiluminescence (Thermo Scientific, Model 42i), and ozone (O3) was measured by UV photometry (Thermo Scientific, Model 49i). These gas analyzers had precision values of 0.5 and 0.4 ppb, respectively.
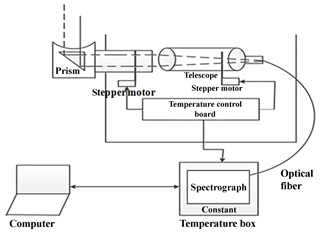
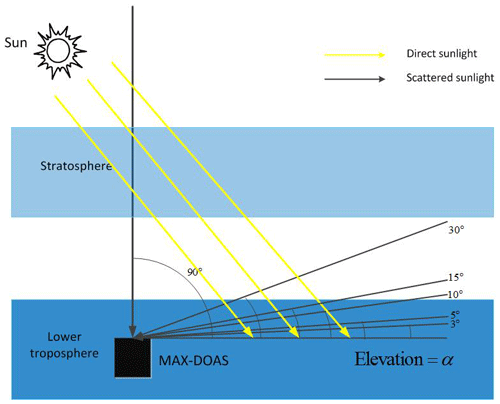
Figure 2 shows a structural representation of the MAX-DOAS system. This system comprises a telescope, stepper motor, spectrometer, and computer. Sunlight is focused by the telescope, which is installed outdoors and reaches the spectrometer through an optical fiber. The spectrometer was placed in a temperature-controlled box at 20 ∘C to ensure that the spectrograph could work at a stable temperature under the changing ambient temperature from −15 to 30 ∘C in China. The spectrometer was produced by Ocean Optics and was named Maya (https://oceanoptics.com/product/maya2000-pro-custom/#tab-specifications, last access: 5 December 2017). The spectrometer covers the range of 290 to 420 nm, and its instrumental function is approximated as a Gaussian function with a full width at half maximum (FWHM) of 0.5 nm. MAX-DOAS was routinely operated for 24 h. Due to the intensity of the sunlight, only the daytime measurements were used for analysis. The nighttime measurements could be used to correct the dark current and offset. The azimuth angle view of the telescope was fixed at 0∘ (north) during the entire observation period. A full MAX-DOAS scan comprises six elevation angles (EAs) (3, 5, 10, 15, 30, and 90∘) and lasts for approximately 10 min (see Fig. 3). Each measurement had an average of 100 scans, and the integration time was adjusted automatically based on the light intensity. Table 1 lists the detailed setup of the MAX-DOAS instrument.
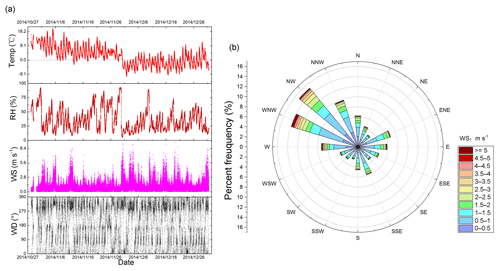
Meteorological parameters, including wind speed (WS), wind direction (WD), temperature (T), and relative humidity (RH), were continuously measured by a MetPak automatic weather station (Gill Instruments Ltd, Lymington, UK) at the UCAS superstation from 28 October to 31 December 2014 (Fig. 4a). All of the measured meteorological parameters were recorded at 1 min time intervals. During the campaign, there were clear diurnal variations in maximum temperature at noon and minimum temperature at night. The temperature was within a range of −10.6 to 20.7 ∘C, with a sudden drop to below 0 ∘C on 1 December 2014. The wind rose indicates that the prevailing wind direction was from the northwest (Fig. 4b). Halfacre et al. (2014) defines the relatively calm conditions with wind speeds of less than 3.5 m s−1 as the static weather situation. The static weather situation frequently occurred during the observations, while wind speeds of more than 3.5 m s−1 usually appeared under northwest and west winds.
2.2 DOAS spectral retrieval and determination of tropospheric VCD
MAX-DOAS, which is an optical remote-sensing technology that records the spectra of scattered sunlight at different elevation angles, can be used to quantitatively measure trace gases based on the Beer–Lambert law (Hönninger and Platt, 2002; Bobrowski et al., 2003; Roozendael et al., 2003; Trebs et al., 2004; Hönninger et al., 2004; Wagner et al., 2004). The spectra obtained from the MAX-DOAS observations were analyzed using WINDOAS software (Hermans et al., 2003). The fitting range was from 335 to 360 nm. The gas cross sections of HCHO at 293 K (Meller and Moortgat, 2000), BrO at 223 K (Fleischmann and Hartmann, 2004), NO2 at 294 K (Vandaele et al., 1996), O3 at 223 and 243 K (Serdyuchenko et al., 2014), and O4 at 293 K (Thalman and Volkamer, 2013) were included in the fit. A spectrum at the 90∘ EA recorded at 12:09 local time (LT) on 6 November 2014 was used as the Fraunhofer reference spectrum (FRS) for all the retrievals to determine slant column densities (SCDs). This day was a very clear day with very low pollution and was also during the period when strict pollution control measures were in place. The ring structure (Fish and Jones, 2013), which is used to account for rotational Raman scattering effects, was calculated using DOASIS software (Kraus, 2006) based on the FRS and was included in the fit. Table 2 lists the parameter settings used for the HCHO analysis. We excluded data for solar zenith angles (SZAs) larger than 75∘ because of the stronger absorptions of stratospheric species and a low signal-to-noise ratio. Data with a large root mean square of the residuals () and large relative intensity offset were also excluded.
Table 2Parameter settings used for spectral analysis using WINDOAS, where x indicates the cross section used in the retrieval.
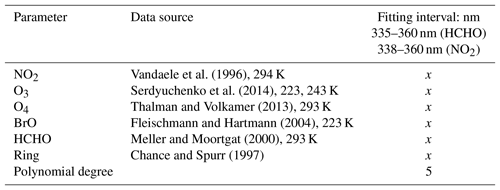
Figure 5 shows an example of the DOAS spectrum analysis in evaluating the HCHO SCD at 12:30 on 19 November 2014. The red and blue curves indicate the fitted absorption structures and the derived absorption structures from the measured spectra, respectively. HCHO dSCD was 7.21×10¹⁶ molecules cm−2, with an error of 8.14×10¹⁵ molecules cm−2. The root mean square of the optical depth of the residual spectral structures was .
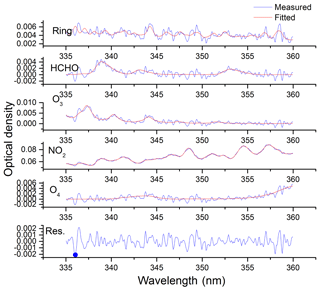
Figure 5Example of a DOAS fit of a spectrum to retrieve the differential slant column densities of HCHO; the red and blue curves indicate the fitted absorption structures and the derived absorption structures from the measured spectra, respectively.
The geometric approximation was used to convert the dSCD to the tropospheric VCD. In the first step, the differential slant column densities (dSCDs) were derived from the DOAS spectral analysis with a so-called FRS (and measured in a small sun zenith angle at 90∘ elevation around noon) (Hermans et al., 2003; Hönninger and Platt, 2002; Kraus, 2006). The SCD includes two parts of the absorption signal of the troposphere and stratosphere. To remove the interference of stratosphere absorption and variation in instrumental properties, dSCDs at off-zenith elevation angles were subtracted by the dSCD at a 90∘ elevation angle in the same elevation sequence to derive ΔSCD following the equation below:
VCD is defined as the integrated concentration of trace gas concentration through the atmosphere along a vertical path and is calculated from dSCD by the use of the air mass factor (AMF) as follows:
The AMF is often used to describe the absorption path of a gas in the atmosphere. Brinksma et al. (2008) proposed the geometric approximation method to calculate the AMF:
Then the tropospheric VCD can be obtained from the following equation:
Numerous studies have compared the error between geometrical VCD and VCD from profile inversion (Brinksma et al., 2008; Hendrick et al., 2014; Hönninger et al., 2004; Y. Wang et al., 2017a). Y. Wang et al. (2017a) showed that the geometric approximations are usually underestimated by 10 % in comparison to the profile inversions for HCHO VCDs at 20∘ elevation, but the error is larger for larger elevation angles and larger relative azimuth angle (RAA). This study used the geometric approximation method to determine HCHO VCDs at an elevation angle of 15∘. The geometric light paths at 15 and 30∘ are good approximations in the boundary layer. However lower systematic errors were achieved at 15∘ than at 30∘ by using the geometrical approximation (discussed in Sect. 2.3 below). Additionally, the geometric approximation method is more stable and less influenced by clouds than the profile inversion method (Hönninger et al., 2004; Clémer et al., 2010; Wagner et al., 2009, 2011; Erle et al., 2013).
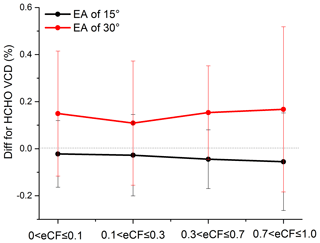
Figure 6Relative differences in the tropospheric HCHO VCDs derived by geometric approximation and from profile inversion as a function of the effective cloud fractions (eCFs), as , , , and for elevation angles of 15 and 30∘. Error bars denote the standard deviations. Diff values were calculated by Eq. (5) in the text.
2.3 Error budgets
The following error sources were considered as the error estimates for the MAX-DOAS results:
-
The systematic error of the HCHO VCDs calculated by the geometric approximation depends on the layer height of the trace gases and aerosols. To evaluate the systematic error of the geometric approximation, we calculated more exact tropospheric HCHO VCDAMF using the PriAM inversion algorithm (Y. Wang et al., 2017a). HCHO VCDgeo values at elevation angles at 15 and 30∘ are obtained from the geometric approximation. The relative difference (Diff) values between VCDAMF and VCDgeo for HCHO were calculated by Eq. (5):
In Fig. 6, the average relative differences for elevation angles of 15 and 30∘ are shown as a function of the effective cloud fractions (eCFs), as , , , and . The cloud fractions (eCFs) are downloaded from the ECMWF CAMS model. It can be seen that the biases caused by the use of the geometric approximation are generally much smaller at EA=15∘ than at EA=30∘, with the Diff being mostly smaller than 6 % for the 15∘ elevation angle and smaller than 16 % for the 30∘ elevation angle in all periods. The bias for Diff caused by using the geometric approximation is about 2 %.
-
The fitting error of the DOAS fit is derived from the dSCD fitting error to VCD error by using geometric approximation, as
and the hourly average of the HCHO VCD fitting error was from 4 % to 27 % for the entire period, with an absolute fit error of .
-
Cross section error also constitutes one of the error sources. Some previous research reported that cross section errors of O4 (aerosols) and HCHO are 5 % and 9 %, respectively (Meller and Moortgat, 2000; Thalman and Volkamer, 2013). Y. Wang et al. (2017a) estimated the errors related to the temperature dependence of the cross sections, and the corresponding systematic error of HCHO was estimated to be up to 6 %.
Since the three errors are mainly independent, the total error can be calculated by combining all the above error sources, adding up to about 7 %–28 %, with 17 % on average.
2.4 ECMWF CAMS model
The European Centre for Medium-Range Weather Forecasting (ECMWF) is at the forefront of research for numerical weather prediction including probabilistic forecasting. Copernicus Atmosphere Monitoring Service (CAMS), which is managed by ECMWF, publicly provides generally reliable atmospheric information. The CAMS model was established utilizing the wealth of Earth observation data from satellite and ground-based systems. The CAMS model produces real-time analyses and forecasts of atmospheric composition for the global view for each day (Persson and Grazzini, 2011). CAMS real-time products can be freely downloaded via a platform (http://apps.ecmwf.int/datasets/data/cams-nrealtime/levtype=sfc/, last access: 15 January 2019) (Andersson, 2015). The operational CAMS uses fully integrated chemistry in the Composition Integrated Forecasting System (C-IFS). C-IFS is a new global chemistry model for the forecasting and assimilation of atmospheric composition. In the simulation of HCHO, chemistry originating from the Transport Model 5 (TM5) had been fully integrated into the C-IFS, in which only gas-phase reactions of HCHO are included. The actual emission totals in the T255 simulation for 2008 from anthropogenic and biogenic sources and biomass burning were used in C-IFS (Flemming et al., 2014). All of the analyzed parameters acquired from the CAMS model are at 00:00, 06:00, 12:00, and 18:00 UTC. We used the CAMS model data with grid resolutions of 0.125∘ × 0.125∘, 0.25∘ × 0.25∘, and 0.5∘ × 0.5∘ at 08:00 LT (00:00 UTC) and 14:00 LT (06:00 UTC).
We evaluate the impact of emission control policy on air quality during APEC based on the MAX-DOAS measurements from the period of 26 October to 20 November 2014. As the measurement station is at a rural site situated about 50 km away from the Beijing downtown area, wind fields, which are transporters of pollutants, were considered in the evaluation. Additionally, MAX-DOAS and the CAMS model were compared to verify the model data in the period of 1 October to 31 December 2014. Since the daytime period is relatively short in autumn, the available MAX-DOAS measurement time was from 06:30 to 18:30 LT. The effects of different cloud coefficients on MAX-DOAS inversion VCDs and the HCHO VCDs from MAX-DOAS and the CAMS model under different cloud coefficients were compared. The results show that the cloud coefficient had a negligible influence on the retrieval of HCHO VCDs by MAX-DOAS. Additionally, sunny and cloudless weather generally occurred during the entire APEC period. Thus, all of the data obtained in the different cloud coefficients were used.
3.1 Effects of pollutant transport
Figure 7 shows the time series of HCHO VCDs measured by MAX-DOAS and meteorological parameters in the period of 3 to 8 November 2014. Two peak values (4 and 7 November 2014) were observed during APEC (Fig. 7a, e). Relative humidity, solar radiation intensity, and ambient temperature are important photo-oxidation factors (Starn et al., 1998; Solberg et al., 2001; Zhang et al., 2009). The daily averaged intensity of solar radiation and temperature on 4 and 7 November was compared with data from the two periods of 4 to 7 November and 1 October to 31 December 2014 (Fig. 8). The differences in averaged solar radiation and temperature on 4 and 7 November compared to the period from 1 October to 31 December 2014 were 2.2 % and −23.5 %, respectively. Solar radiation and temperature did not change significantly during the two peaks of 4 and 7 November 2014; thus, the enhanced HCHO values were not be caused by an increased photo-oxidation rate. The increase in HCHO was probably related to a change in wind direction to the south. Figure 7 indicates the increases in wind speed, and a dominant southerly wind flow with a speed of more than 2.0 m s−1 during the two days was detected. South air flow was dominant during the two days of peak HCHO values during the APEC summit. At noon on 3, 4, and 7 November, the wind direction changed to south, and the wind speed was relatively strong (approximately 4.0 m s−1), thereby leading to the rapid accumulation of HCHO in a few hours. Thereafter, the wind direction changed to northwest, and the wind speed dropped below 2.0 m s−1 during the nighttime along with a gradual dissipation in pollution, which indicated that the contamination of the supersite was affected by the pollution transported from the southwest areas. The value on 6 November 2014 was probably caused by the good dispersion conditions under the northwest winds with speeds of more than 3.5 m s−1, with the air mass mainly originating from the clean northwest area.
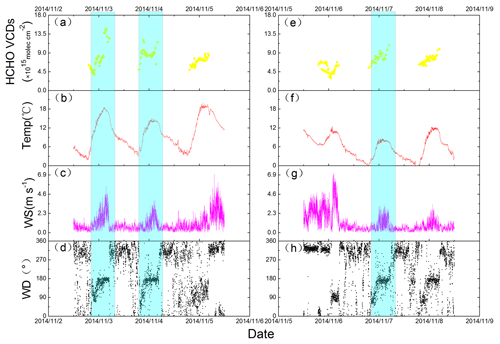
Figure 7Time series of HCHO VCDs (molecules cm−2) and meteorological parameters (ambient temperature, ∘C; relative humidity, %; wind direction, ∘; and wind speed, m s−1) measured at the supersite in the two periods of 3 to 5 November 2014 (a–d) and 6 to 8 November 2014 (e–h).
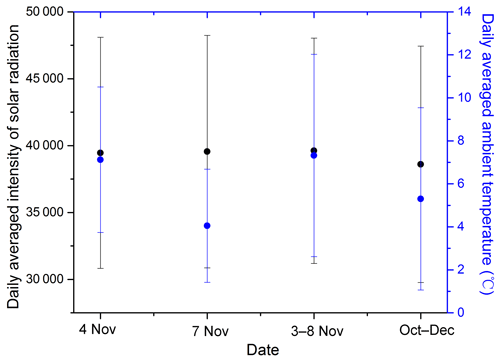
Figure 8Averaged intensity of solar radiation and temperature in the four periods of 4, 7, 3 to 8 November, and 1 October to 31 December 2014. Error bars denote the standard deviations.
To further demonstrate the effect of regional transport, we analyzed 24 h backward trajectories of air mass using the National Oceanic and Atmospheric Administration Hybrid Single Particle Lagrangian Integrated Trajectory (https://ready.arl.noaa.gov/hypub-bin/trajtype.pl?runtype=archive, last access: 12 December 2018) on 4 to 7 November 2014 (Fig. 9). We used 08:00 LT (00:00 UTC) as the start time of the backward trajectories. As shown in Fig. 9, pollutants over the polluted region, including Shijiazhuang and Baoding, in the southwest of Beijing, were transported to the observed area on 4 November 2014. The observed area was mainly affected by the pollution in Tangshan and Langfang located in the south and southeast of Beijing on 7 November 2014. Under the dominant northwest wind (5 to 6 November 2014), the concentrations of HCHO were significantly lower than on 4 and 7 November 2014 and reached the minimum under a high wind speed of up to 7.0 m s−1. Changes in dominant wind fields play important roles in the changes in HCHO at UCAS. Regional transport from the south had a significant impact on the increase in HCHO observed at the site.
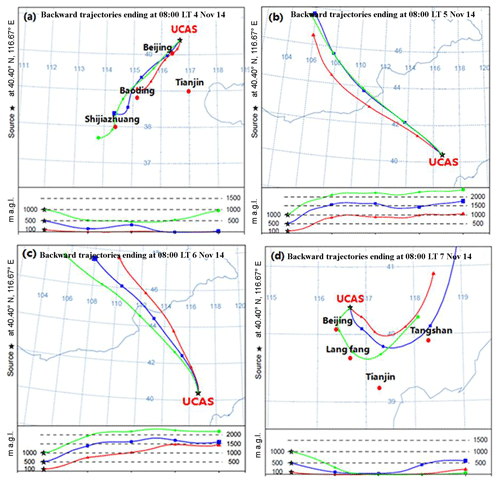
Figure 9Backward trajectories determined by the HYSPLIT model at UCAS on (a) 4, (b) 5, (c) 6, and (d) 7 November 2014.
We further analyzed the relationship between HCHO VCDs and wind direction and speed from 28 October to 20 November 2014 (Fig. 10). Both local emission and transport from remote sources impacted the observed HCHO VCDs. The main wind directions of the UCAS site were east, south, and northwest, with approximate percentages of 17 %, 16 %, and 12 %, respectively. The amount of HCHO VCDs was strongly dependent on the wind speed and direction (Fig. 10). HCHO VCDs considerably depend on wind directions, and the average HCHO VCDs were 7.6×10¹⁵ molecules cm−2 under the southerly wind (including southwest and southeast). This finding was attributed to the fact that Tangshan, Baoding, Shijiazhuang, and Tianjin, and other heavily polluted cities are located in the south of UCAS, including the city center of Beijing (Lin et al., 2009, 2012; Shao et al., 2006; Tang et al., 2015; Wei et al., 2016). In contrast, the northeast and north directions correspond to a minimum in the average HCHO VCDs (6.6×10¹⁵ molecules cm−2). The northern cities are clean with low VOC emissions, and the natural sources of VOC in the north should be much lower than the anthropogenic sources in the winter season. Thus few precursors of HCHO were transported to the measurement station in the north wind. The lower HCHO VCDs under such conditions are mainly due to fewer VOC precursors of HCHO. In summary, the wind from this area prominently contributes to the dispersion of the pollutants. In terms of the dependence of HCHO on wind speed, the HCHO VCDs decrease along with the increasing wind speed under the northerly fast and clean wind, which results in the rapid dissipation of the pollution. Under the southerly wind, the HCHO VCDs increase with increasing wind speed. Thus, transport from the south polluted air to the observation site occurs more easily under southerly winds with relatively high wind speeds. In conclusion, when winds are from the south, the site was considerably affected by the transport of pollutants from the polluted urban areas, including urban superimposed emissions from the city center of Beijing, Baoding, Shijiazhuang, Tianjin, and Langfang.
3.2 Evaluation of HCHO during APEC
The MAX-DOAS results in the period of 26 October to 20 November 2014 were used to evaluate the HCHO values during APEC. The period was split into three episodes. The first episode was defined as the period of APEC (from 1 to 12 November 2014), during which strict air quality policies were implemented at a regional scale. The second and third episodes were defined as the pre-APEC period from 26 to 31 October 2014 and the post-APEC period from 13 to 20 November 2014.
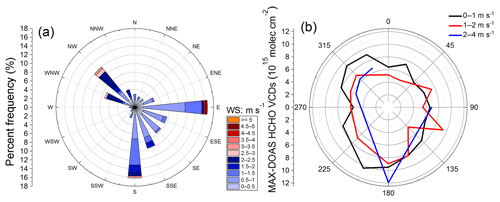
Figure 11 presents the varying series of the daily mean values of HCHO VCDs during APEC in the three episodes. The result shows a fluctuating effect, with the HCHO VCDs increasing abruptly over several days and dropping sharply for a few days during the APEC summit. This phenomenon was also observed in NO2 VCD observations in Beijing urban areas (Liu et al., 2016). The average HCHO VCDs were 9.7×10¹⁵, 6.0×10¹⁵, and 8.6×10¹⁵ molecules cm−2 before, during, and after APEC, with fitting errors of 9.4 %, 10.1 %, and 9.7 %, respectively. A noticeable decrease of and during APEC was found compared with before and after APEC, which was calculated at the 95 % confidence limit. This reduction could be attributed to the control measurements implemented during APEC. However, the systematic difference in wind fields between the three episodes could also play a role considering the effects of the transport of pollutants discussed in Sect. 3.1. The wind rose for wind speed during the three episodes is shown in Fig. 12. The prevailing wind direction of the three episodes was from the northwest. The frequency of northwest winds in the APEC period was more than in the pre-APEC and post-APEC periods. Furthermore, the wind speed in the APEC period was higher. Under the prevailing northwest wind, the transport of pollutants from the polluted south area to the observed area was much less than that under the southerly winds. Therefore, the prevailing northwest wind fields may also contribute to the low HCHO during APEC.
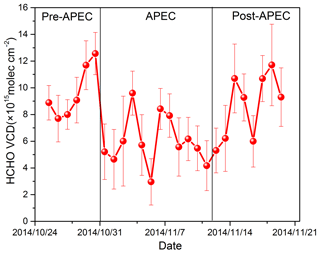
Figure 11Daily averaged values of HCHO VCDs from 26 October to 20 November 2014. Error bars denote standard deviations.
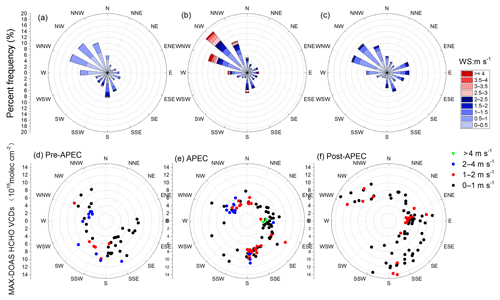
Figure 12Wind roses in (a) the pre-APEC, (b) the APEC, and (c) the post-APEC periods. Dependence of HCHO VCDs (1015 molecules cm−2) on wind directions for different wind speeds in the pre-APEC (d), during the APEC (e), and post-APEC (f) periods.
As the measurement station is located in the northern suburban area of Beijing, the effects of the control measures, which were mainly implemented in the urban areas, on HCHO were only observed at the station when dominant southerly winds occurred (Fan et al., 2016; Li et al., 2015). We thus plotted the dependence of HCHO VCDs on the wind speed and directions in Fig. 12d–f for the pre-APEC, APEC, and post-APEC periods. Figure 12d–f indicate that the averaged HCHO VCDs under south winds during APEC were about 6.5×10¹⁵ molecules cm−2, which was considerably lower than 10.3 and 9.2×10¹⁵ molecules cm−2 in the pre-APEC and post-APEC periods. In addition the peak values due to transport from the south urban area on 4 and 7 November 2014 during APEC shown in Fig. 11 were 25 % and 18 % lower than the peak values under similar wind fields in the pre-APEC and post-APEC periods. In general, the HCHO values under the dominant southerly wind field were considerably lower during APEC than the pre-APEC and post-APEC periods. The phenomenon implies that the control measures had a certain effect on reducing the concentration of HCHO. This suggests that the implementation of control measures during the APEC summit reduced the concentrations of NO2 and aerosols (Liu et al., 2016; Zhang et al., 2017).
3.3 Sources of HCHO
The hourly averaged HCHO VCDs in the three episodes were analyzed to characterize the diurnal variation (Fig. 13). The hourly averaged HCHO VCDs exhibited evident daily variation. High values appeared in the early afternoon, and low values appeared in the morning. Atmospheric photochemical reactions are related to the intensity of solar radiation as indicated in Reaction (R1). The atmospheric photochemistry reaction is generally active when the intensity of the solar radiation is strong. Therefore, HCHO productivity of secondary sources is high (Anderson et al., 1996). Peaks in diurnal variation generally emerged at 14:00, which is likely related to the diurnal variations in photochemical reaction rates. Since most light is available in the early afternoon and local direct emissions are relatively smaller compared to secondary production, the secondary production of formaldehyde primarily caused the peak at 14:00. The diurnal variation in VOC emissions could also play a role in the diurnal variation of HCHO. However, the typical lifetime of VOCs can reach several days. The diurnal variations in VOC emission are unlikely to change the abundance of atmospheric VOCs. Therefore, diurnal variation in the photochemical reaction rate could be the dominant driving factor. Other smaller peaks appeared in the evening during other periods of busy traffic (16:00–18:00 LT), which might be caused by primary pollution sources, e.g., exhaust fumes from vehicles. Thus, the diurnal variations in HCHO during all three episodes were similar to the typical patterns of secondary sources as reported in Anderson et al. (1996), Lee et al. (2015), and Pinardi et al. (2013). The absolute HCHO values during the APEC period were statistically lower than those in the pre-APEC and post-APEC periods.
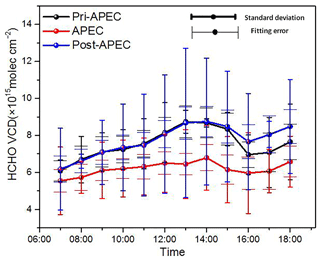
Figure 13Averaged diurnal variation in HCHO VCDs measured by MAX-DOAS in three episodes around APEC. The short cap width of the error bars denotes the 1σ standard deviations around the mean analysis values. The long cap width of the error bars denotes the fitting error.
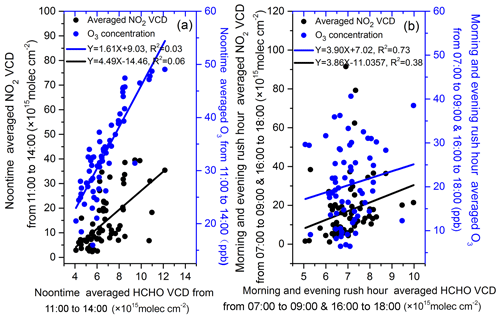
Determining pollution sources is crucial to controlling air pollution. Three time intervals were used for determining the main HCHO sources. The first interval was defined as noontime from 11:00 to 14:00 and is associated with strong photochemical reactions. The second and third intervals were defined as the morning rush hour from 07:00 to 09:00 and the evening rush hour from 16:00 to 18:00. To further determine whether the pollution sources of HCHO at UCAS were primary or secondary formations from other VOCs, the correlations of HCHO with the primary pollutant NO2 or secondary pollutant O3 were analyzed (Anderson et al., 1996; Possanzini et al., 2002). Surface O3 data were obtained from in situ measurements at the UCAS supersite, and troposphere NO2 VCD data were retrieved from the same MAX-DOAS measurements using geometric approximation. The linear correlations of noontime average HCHO VCD with NO2 VCD and O3 from 11:00 to 14:00 and rush hour average HCHO VCD with NO2 VCD and O3 from 07:00 to 09:00 and 16:00 to 18:00 are shown in Fig. 14. Direct analysis of the data indicates that noontime average HCHO had a higher correlation coefficient with NO2 VCD and O3 than in rush hour. This implies that a small amount of HCHO comes from the traffic emissions during rush hour. A good correlation coefficient R2 of 0.73 was found between HCHO VCD and O3 during the noontime, which indicates that the main source of HCHO was from secondary photo-oxidation formation at noon. Here it needs to be clarified that the O3 data are from the surface measurements, but NO2 and HCHO are the retrieved tropospheric VCD by MAX-DOAS. Since NO2 and HCHO are mostly in the boundary layer, the effect of the discrepancy of measured layers on the correlation analysis is not significant. In contrast, a correlation coefficient of 0.38 between HCHO VCD and NO2 VCD during noontime was better than during rush hour (R2=0.06), which may be due to the contribution of vehicle emissions to HCHO precursors. A longer NO2 lifetime with less dispersion efficiency in winter and HCHO from continuously generated photo-oxidation contributed to the higher correlation between HCHO VCD and NO2 VCD at noon higher than during rush hour. The transport of NO2 and VOC may constitute one of the causes. The VOCs from transport generate HCHO due to strong photo-oxidation at noon. This result indicates that secondary photo-oxidation formation of HCHO from other VOCs could be the dominant source at UCAS.
3.4 Comparisons with the model data
HCHO VCDs retrieved from the MAX-DOAS measurements were compared with those from the CAMS model data from the period of 1 October to 31 December 2014 (Fig. 15). The average value of the data from MAX-DOAS in the period of 07:30–08:30 LT was selected for comparison with the CAMS data at 00:00 UTC (08:00 LT) (Fig. 15a). The data from MAX-DOAS in the period 13:30–14:30 LT were averaged for comparisons with the CAMS data at 06:00 UTC (14:00 LT) (Fig. 15c). The CAMS model results with different grids are shown in Fig. 15, and their differences were found to be negligible. On average, the CAMS model underestimated HCHO VCDs by 1.6–2.0×10¹⁵ and 1.3–2.1×10¹⁵ molecules cm−2 compared to the MAX-DOAS measurements at 08:00 LT and 14:00 LT, respectively, due to different grid sizes. The correlation coefficients and linear regressions between the MAX-DOAS data and the model results are shown in Fig. 16. The correlation coefficient R2 was more than 0.68 and 0.79 at 08:00 LT and 14:00 LT, respectively. A comparison of the results in Figs. 15 and 16 shows that the CAMS model and MAX-DOAS results are generally consistent, and the peak values were particularly consistently captured by both datasets, but the low values were systematically underestimated by the CAMS model. As the peak values were mostly related to the transportation of pollutants from the southern area, the high consistency of the peak values between MAX-DOAS and the CAMS model implies that the CAMS model can adequately simulate the transport of pollutants. In addition, in the CAMS model, only gas-phase chemical reactions were considered for HCHO, as described in Sect. 2.5. Therefore, the high consistency of the HCHO values between the MAX-DOAS measurements and the CAMS simulations indicates that the heterogeneous reactions could not dominate the secondary formation of HCHO from other VOCs. The underestimation of the low HCHO values by the CAMS model compared to the MAX-DOAS measurements could be attributed to the lower constraint of local emissions in the model near the UCAS measurement station, and the lack of heterogeneous reactions in the model could also contribute to the underestimation of the low HCHO values. The China National Highway 111 is nearby and runs from north to south. The actual emission totals for the 2008 inventory included anthropogenic, biogenic, and natural sources and biomass burning; thus, highway emissions were considered in the 2008 inventory. However, due to the establishment of the UCAS from 2013 and the holding of the APEC meeting in 2014, the economy near the UCAS has grown rapidly, and the traffic flow has increased significantly in recent years. Thus, the use of the 2008 inventory could underestimate the highway emissions. As UCAS is in the suburban area of Beijing, vehicle emissions could largely contribute the HCHO amount under the weak transportation of pollutants from the polluted southern area. In general, the CAMS model can suitably capture distinct day-to-day variations in HCHO. In addition, day-to-day variations in HCHO could be attributed to variations in transport of pollutants, the secondary formation rate of HCHO, and local primary emissions. While a constant primary emission rate is assumed in the CAMS model simulations, the fluctuations in solar radiance and temperature, which impact the secondary formation rate of HCHO, are much smaller than the day-to-day variations in HCHO. Thus, the transportation of pollutants could be a dominant factor of the captured distinct day-to-day variations in HCHO.
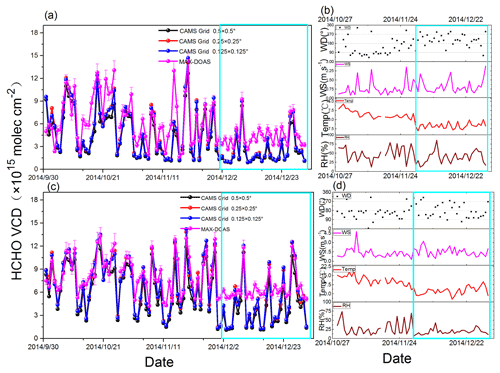
Figure 15Hourly averaged HCHO VCDs derived from the coincident CAMS model (grid of 0.125∘ × 0.125∘, 0.25∘ × 0.25∘, and 0.5∘ × 0.5∘) and MAX-DOAS observations at 08:00 (a) and 14:00 LT (c) from 1 October to 31 December 2014. Error bars denote retrieval error. Time series of coincident hourly averaged meteorological parameters measured at the supersite at 08:00 (b) and 14:00 LT (d) from 28 October to 31 December 2014.
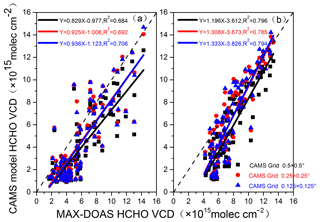
Figure 16Correlation between HCHO VCDs retrieved from the MAX-DOAS measurements and those obtained from the CAMS model at 08:00 LT (a) and 14:00 LT (b) from October to December 2014 in different grids.
The underestimation of HCHO by the CAMS model became statistically significant after 1 December 2014. This phenomenon could be related to the decrease in the temperature after 1 December 2014. Time series data of coincident hourly averaged meteorological parameters measured at the supersite from 28 October to 31 December 2014 at 08:00 and 14:00 LT are shown in Fig. 15b and d, respectively. Temperature is an important parameter impacting the production rate of secondary HCHO. When the temperature decreases, the generation yield of the secondary photochemical reaction to produce HCHO decreases, resulting in low concentrations of HCHO. The temperature dramatically dropped after 1 December 2014, which could cause a low production rate of HCHO. The secondary sources of HCHO can be better simulated than the local primary sources in the model (Stavrakou et al., 2009; Anderson et al., 1996; Kwon et al., 2017). The CAMS model could thus underestimate the local primary emissions of HCHO, but the MAX-DOAS measurements could suitably obtain the HCHO from both local primary emissions and secondary generation. Thus, when the secondary source of HCHO is reduced, namely the local primary emissions of HCHO predominantly contribute to the HCHO VCDs, the difference between the MAX-DOAS observation and CAMS model becomes more pronounced.
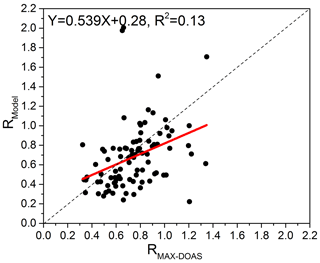
R represents the ratio of HCHO VCDs in the morning (08:00 LT) and noon (14:00 LT). If RModel is close to RMAX-DOAS, it indicates that the trend in diurnal variation of HCHO from the model simulation and MAX-DOAS observation is consistent, suggesting that the model can reasonably simulate the systematic diurnal variation in HCHO. The consistency of RMAX-DOAS and RModel can be used to characterize the ability of the model to simulate the diurnal variation of HCHO. The RMAX-DOAS and RModel are calculated by following Eqs. (7) and (8):
The scatter plots and linear regressions of daily RMAX-DOAS and RModel are provided in Fig. 17. Although large scatters were found, most of the dots were around the 1:1 line. Thus, the model can reasonably simulate the systematic diurnal variation in HCHO. It needs to be noted that the diurnal variation in HCHO is the result of the combined influence of primary emissions, secondary formation, and meteorology. We found that RMAX-DOAS was generally larger than RModel. However, it was impossible to determine the factor causing the deviation in RMAX-DOAS and RModel. Therefore, the R comparisons generally only evaluate the quality of the model simulations for diurnal variations in HCHO.
Clouds can impact the MAX-DOAS measurements. First, clouds can affect atmospheric radiative transport and thus influence optical paths. Furthermore, the atmospheric absorber densities (by (photo)chemistry or convective transport) are potentially altered due to the changes in optical paths (Gratsea et al., 2016). Second, AMFs calculated by geometrical approximation could be significantly biased from the reality under cloudy conditions (Brinksma et al., 2008). The effects could impact comparisons between MAX-DOAS and the CAMS model. To test this, we compared MAX-DOAS and the CAMS model HCHO results under different effective cloud fractions (eCFs) from the ECMWF (Table S1 in the Supplement) (Figs. S1, S2, S3, and S4 in the Supplement). The consistencies between the two datasets varied only slightly as the cloud fractions increased. This outcome indicates that clouds have little effect on the comparisons of MAX-DOAS and the CAMS model, which is consistent with the finding of Y. Wang et al. (2017a).
We studied the tropospheric HCHO VCDs at the UCAS site in Huairou District, Beijing, around the APEC summit based on the MAX-DOAS measurements from 1 October to 31 December 2014.
The UCAS site was affected by the transportation of pollutants from the south. Two peak values on 4 and 7 November 2014 during the APEC summit were caused by a change in wind direction to the south and an increase in wind speed of >2.0 m s−1 when the polluted air masses from the south were transported to the UCAS site. Marked wind speed and direction dependences of HCHO VCDs were identified. Wind direction dependencies indicated that the HCHO values in the area around UCAS were considerably affected by the transportation of pollutants from the south, including the southwest and southeast where heavily polluted cities are located, such as Tangshan, Shijiazhuang, and Tianjin. Conversely, winds from the north and northeast contributed to the dispersion of HCHO.
The impact of control measures on HCHO was evaluated using approximately 1 month of MAX-DOAS data from 26 October to 20 November 2014, which was defined in three episodes. The first episode was the period of APEC (from 1 to 12 November), the second and third episodes were the pre-APEC period from 26 to 31 October 2014, and the post-APEC period was from 13 to 20 November 2014. During the period of the APEC conference, the average HCHO was 6.0×10¹⁵ molecules cm−2, which was and lower than that during the pre-APEC and post-APEC periods calculated at the 95 % confidence limit, respectively. Prevailing northwest wind fields and strict control measures in combination led to the relatively low HCHO values during APEC.
The daily variation in HCHO VCDs at the UCAS site indicated that the values at noon and in evening rush hour were higher than those in the morning. Furthermore, peak values appeared around noon, and a good correlation coefficient R2 of 0.73 between HCHO and O3 was found around noontime. This finding indicates that the secondary sources of HCHO through photochemical reactions dominate in the area around UCAS.
The time series data of HCHO VCDs retrieved by MAX-DOAS and the CAMS model were consistent from 1 October to 31 December 2014. The CAMS model underestimated HCHO VCD by about 24 % on average compared to the MAX-DOAS measurements. The CAMS model could adequately simulate the effects of the transport and the secondary sources of HCHO but underestimated the local primary sources, which were more pronounced under low temperature conditions when the production rate of secondary HCHO was relatively low. Generally consistent ratios of HCHO VCDs at around 08:00 LT and 14:00 LT were found for the CAMS model simulations and MAX-DOAS measurements. It indicates that the CAMS model can reasonably simulate the systematic diurnal variation in HCHO.
The data used in this study are available from the corresponding author upon request (phxie@aiofm.ac.cn).
The supplement related to this article is available online at: https://doi.org/10.5194/acp-19-3375-2019-supplement.
XT, PX, and JX contributed to the design of the research. JX and AL designed the installation location of the MAX-DOAS instrument and installed it at the UCAS. ZH and QZ downloaded and extracted HCHO VCD data from ECMWF. XT performed the data analyses and wrote the manuscript. FW and CL provided suggestions for the manuscript. PX, JX, and YW edited and developed the manuscript.
The authors declare that they have no conflict of interest.
This article is part of the special issue “Regional transport and transformation of air pollution in eastern China”. It is not associated with a conference.
We thank the Belgian Institute for Space Aeronomy (BIRA–IASB) in Brussels, Belgium, for the freely accessible WINDOAS software and the European Meteorology Center for providing free medium-range weather forecasts for CAMS real-time products of HCHO. We also thank the University of Chinese Academy of Sciences and Peking University for their support and assistance in the observation and supply of essential data. This study was supported by the National Natural Science Foundation of China (grant nos. 41530644, 41405033, and 41605013).
This paper was edited by Robert McLaren and reviewed by two anonymous referees.
Andersson, E.: European Centre for Medium-Range Weather Forecasting, available at: http://apps.ecmwf.int/datasets/data/cams-nrealtime/levtype=sfc/ (last access: 15 January 2019), 2015.
Anderson, L. G., Lanning, J. A., Barrell, R., Miyagishima, J., Jones, R. H., and Wolfe, P.: Sources and sinks of formaldehyde and acetaldehyde: An analysis of Denver's ambient concentration data, Atmos. Environ., 30, 2113–2123, https://doi.org/10.1016/1352-2310(95)00175-1, 1996.
Bauwens, M., Stavrakou, T., Müller, J.-F., De Smedt, I., Van Roozendael, M., van der Werf, G. R., Wiedinmyer, C., Kaiser, J. W., Sindelarova, K., and Guenther, A.: Nine years of global hydrocarbon emissions based on source inversion of OMI formaldehyde observations, Atmos. Chem. Phys., 16, 10133–10158, https://doi.org/10.5194/acp-16-10133-2016, 2016.
Bobrowski, N., Hönninger, G., Galle, B., and Platt, U.: Detection of bromine monoxide in a volcanic plume, Nature, 423, 273–276, https://doi.org/10.1038/nature01625, 2003.
Borovski, A. N., Dzhola, A. V., Elokhov, A. S., Grechko, E. I., Kanaya, Y., and Postylyakov, O. V.: First measurements of formaldehyde integral content in the atmosphere using MAX-DOAS in the Moscow region, Int. J. Remote. Sens., 35, 5609–5627, 2014.
Brinksma, E. J., Pinardi, G., Volten, H., Braak, R., Richter, A., Schönhardt, A., Roozendael, M. V., Fayt, C., Hermans, C., Dirksen, R. J., Vlemmix, T., Berkhout, A. J. C., Swart, D. P. J., Oetjen, H., Wittrock, F., Wagner, T., Ibrahim, O. W., Leeuw, G. D., Moerman, M., Curier, R. L., Celarier, E. A., Cede, A., Knap, W. H., Veefkind, J. P., Eskes, H. J., Allaart, M., Rothe, R., Piters, A. J. M., and Levelt, P. F.: The 2005 and 2006 DANDELIONS BO2 and aerosol intercomparison campaigns, J. Geophys. Res., accepted, 113, D16S46, https://doi.org/10.1029/2007JD008808, 2008.
Chance, K., Palmer, P. I., Spurr, R. J., Martin, R. V., Kurosu, T. P., and Jacob, D. J.: Satellite observations of formaldehyde over North America from GOME, Geophys. Res. Lett., 27, 3461–3464, 2000.
Chance, K. V. and Spurr, R. J.: Ring effect studies: Rayleigh scattering, including molecular parameters for rotational Raman scattering, and the Fraunhofer spectrum, Appl. Optics, 36, 5224–5230, https://doi.org/10.1364/AO.36.005224, 1997.
Chang, C. Y., Faust, E., Hou, X. T., Lee, P., Kim, H. C., Hedquist, B. C., and Liao, K. J.: Investigating ambient ozone formation regimes in neighboring cities of shale plays in the Northeast United States using photochemical modeling and satellite retrievals, Atmos. Environ., 142, 152–170, 2016.
Chen, Z., Zhang, J., Zhang, T., Liu, W., and Liu, J.: Haze observations by simultaneous lidar and WPS in Beijing before and during APEC 2014, Sci. China Chem., 58, 1385–1392 , 2015.
Cheng, N. L., Li, Y. T., Zhang, D. W., Chen, T., Li, L. J., Li, J., and Jiang, L.: Improvement of Air Quality During APEC in Beijing in 2014, Environ. Sci., 37, 66–73, https://doi.org/10.13227/j.hjkx.2016.01.001, 2016.
Cheung, R., Colosimo, S. F., Pikelnaya, O., and Stutz, J.: MAX-DOAS Measurements of NO2 and HCHO in Los Angeles from an Elevated Mountain Site at Mt. Wilson, California, Sensors-Basel, 14, 2449–2467, 2014.
Clémer, K., Van Roozendael, M., Fayt, C., Hendrick, F., Hermans, C., Pinardi, G., Spurr, R., Wang, P., and De Mazière, M.: Multiple wavelength retrieval of tropospheric aerosol optical properties from MAXDOAS measurements in Beijing, Atmos. Meas. Tech., 3, 863–878, https://doi.org/10.5194/amt-3-863-2010, 2010.
De Smedt, I., Stavrakou, T., Hendrick, F., Danckaert, T., Vlemmix, T., Pinardi, G., Theys, N., Lerot, C., Gielen, C., Vigouroux, C., Hermans, C., Fayt, C., Veefkind, P., Müller, J.-F., and Van Roozendael, M.: Diurnal, seasonal and long-term variations of global formaldehyde columns inferred from combined OMI and GOME-2 observations, Atmos. Chem. Phys., 15, 12519–12545, https://doi.org/10.5194/acp-15-12519-2015, 2015.
Erle, F., Pfeilsticker, K., and Platt, U.: On the influence of tropospheric clouds on zenith-scattered-light measurements of stratospheric species, Geophys. Res. Lett., 22, 2725–2728, https://doi.org/10.1029/95GL02789, 2013.
Fan, S. B., Tian, L. D., Zhang, D. X., and Guo, J. J.: Evaluation on the Effectiveness of Vehicle Exhaust Emission Control Measures During the APEC Conference in Beijing, Environ. Sci., 37, 74–81, https://doi.org/10.13227/j.hjkx.2016.01.001, 2016.
Fish, D. J. and Jones, R. L.: Rotational Raman scattering and the ring effect in zenith-sky spectra, Geophys. Res. Lett., 22, 811–814, https://doi.org/10.1029/95GL00392, 2013.
Fleischmann, O. C. and Hartmann, M.: New ultraviolet absorption cross-sections of BrO at atmospheric temperatures measured by time-windowing Fourier transform spectroscopy, J. Photochem. Photobiol. A, 168, 117–132, https://doi.org/10.1016/j.jphotochem.2004.03.026, 2004.
Flemming, J., Huijnen, V., Arteta, J., Bechtold, P., Beljaars, A., Blechschmidt, A. M., Diamantakis, M., Engelen, R. J., Gaudel, A., Inness, A., Jones, L., Katragkou, E., Peuch, V. H., Richter, A., Schultz, M. G., Stein, O., and Tsikerdekis, A.: Tropospheric Chemistry in the Integrated Forecasting System of ECMWF, ECMWF Technical Memoranda, available at: https://www.ecmwf.int/sites/default/files/elibrary/2014/9426-tropospheric-chemistry-integrated-forecasting-system-ecmwf.pdf (last access: 11 March 2019), 1–52, 2014.
Franco, B., Hendrick, F., Van Roozendael, M., Müller, J.-F., Stavrakou, T., Marais, E. A., Bovy, B., Bader, W., Fayt, C., Hermans, C., Lejeune, B., Pinardi, G., Servais, C., and Mahieu, E.: Retrievals of formaldehyde from ground-based FTIR and MAX-DOAS observations at the Jungfraujoch station and comparisons with GEOS-Chem and IMAGES model simulations, Atmos. Meas. Tech., 8, 1733–1756, https://doi.org/10.5194/amt-8-1733-2015, 2015.
Fried, A., Cantrell, C., Olson, J., Crawford, J. H., Weibring, P., Walega, J., Richter, D., Junkermann, W., Volkamer, R., Sinreich, R., Heikes, B. G., O'Sullivan, D., Blake, D. R., Blake, N., Meinardi, S., Apel, E., Weinheimer, A., Knapp, D., Perring, A., Cohen, R. C., Fuelberg, H., Shetter, R. E., Hall, S. R., Ullmann, K., Brune, W. H., Mao, J., Ren, X., Huey, L. G., Singh, H. B., Hair, J. W., Riemer, D., Diskin, G., and Sachse, G.: Detailed comparisons of airborne formaldehyde measurements with box models during the 2006 INTEX-B and MILAGRO campaigns: potential evidence for significant impacts of unmeasured and multi-generation volatile organic carbon compounds, Atmos. Chem. Phys., 11, 11867–11894, https://doi.org/10.5194/acp-11-11867-2011, 2011.
Gratsea, M., Vrekoussis, M., Richter, A., Wittrock, F., Schonhardt, A., Burrows, J., Kazadzis, S., Mihalopoulos, N., and Gerasopoulos, E.: Slant column MAX-DOAS measurements of nitrogen dioxide, formaldehyde, glyoxal and oxygen dimer in the urban environment of Athens, Atmos. Environ., 135, 118–131, 2016.
Halfacre, J. W., Knepp, T. N., Shepson, P. B., Thompson, C. R., Pratt, K. A., Li, B., Peterson, P. K., Walsh, S. J., Simpson, W. R., Matrai, P. A., Bottenheim, J. W., Netcheva, S., Perovich, D. K., and Richter, A.: Temporal and spatial characteristics of ozone depletion events from measurements in the Arctic, Atmos. Chem. Phys., 14, 4875–4894, https://doi.org/10.5194/acp-14-4875-2014, 2014.
Hendrick, F., Müller, J.-F., Clémer, K., Wang, P., De Mazière, M., Fayt, C., Gielen, C., Hermans, C., Ma, J. Z., Pinardi, G., Stavrakou, T., Vlemmix, T., and Van Roozendael, M.: Four years of ground-based MAX-DOAS observations of HONO and NO2 in the Beijing area, Atmos. Chem. Phys., 14, 765–781, https://doi.org/10.5194/acp-14-765-2014, 2014.
Hermans, C., Vandaele, A. C., Fally, S., Carleer, M., Colin, R., Coquart, B., Jenouvrier, A., and Merienne, M. F.: Absorption Cross-section of the Collision-Induced Bands of Oxygen from the UV to the NIR, Springer, the Netherlands, 193–202, 2003.
Hönninger, G. and Platt, U.: Observations of BrO and its vertical distribution during surface ozone depletion at Alert, Atmos. Environ., 36, 2481–2489, https://doi.org/10.1016/S1352-2310(02)00104-8, 2002.
Hönninger, G., von Friedeburg, C., and Platt, U.: Multi axis differential optical absorption spectroscopy (MAX-DOAS), Atmos. Chem. Phys., 4, 231–254, https://doi.org/10.5194/acp-4-231-2004, 2004.
Huang, K., Zhang, X., and Lin, Y.: The “APEC Blue” phenomenon: regional emission control effects observed from space, Atmos. Res., 164, 65–75, 2015.
Kraus, S.: DOASIS-A Framework Design for DOAS. PhD Thesis, University of Heidelberg, Heidelberg, Germany, 2006.
Kwon, H. A., Park, R., Nowlan, C., González Abad, G. K., and Janz, S.: Formaldehyde (HCHO) column measurements from airborne instruments: Comparison with airborne in-situ measurements, model, and satellites, 19th EGU General Assembly, EGU2017, proceedings from the conference held 23–28 April, 2017 in Vienna, Austria, p. 11084, 2017.
Lee, H., Ryu, J., Irie, H., Jang, S. H., Park, J., Choi, W., and Hong, H.: Investigations of the Diurnal Variation of Vertical HCHO Profiles Based on MAX-DOAS Measurements in Beijing: Comparisons with OMI Vertical Column Data, Atmosphere, 6, 1816–1832, https://doi.org/10.3390/atmos6111816, 2015.
Li, R., Mao, H., Wu, L., He, J., Ren, P., and Li, X.: The evaluation of emission control to PM concentration during Beijing APEC in 2014, Atmos. Pollut. Res., 7, 363–369, 2016.
Li, W. T., Gao, Q. X., Liu, J. R., Li, L., Gao, W. K., and Su, B. D.: Comparative Analysis on the Improvement of Air Quality in Beijing During APEC, Environ. Sci., 36, 4340–4347, 2015.
Li, X., Brauers, T., Hofzumahaus, A., Lu, K., Li, Y. P., Shao, M., Wagner, T., and Wahner, A.: MAX-DOAS measurements of NO2, HCHO and CHOCHO at a rural site in Southern China, Atmos. Chem. Phys., 13, 2133–2151, https://doi.org/10.5194/acp-13-2133-2013, 2013.
Lin, W. L., Xu, X. B., Ge, B. Z., and Zhang, X. C.: Characteristics of gaseous pollutants at Gucheng, a rural site southwest of Beijing, J. Geophy. Res., 114, D00G14, https://doi.org/10.1029/2008JD010339, 2009.
Lin, W. L., Xu, X. B., Ma, Z. Q., Zhao, H. R., Liu, X. W., and Wang, Y.: Characteristics and recent trends of sulfur dioxide at urban, rural, and background sites in North China: effectiveness of control measures, J. Environ. Sci., 24, 34–49, 2012.
Ling, Z. H., Zhao, J., Fan, S. J., and Wang, X. M.: Sources of formaldehyde and their contributions to photochemical O3 formation at an urban site in the Pearl River Delta, southern China, Chemosphere, 168, 1293–1301, 2017.
Liu, H. R., Liu, C., Xie, Z. Q., Li, Y., Huang, X., Wang, S. S., Xu, J., and Xie, P. H.: A paradox for air pollution controlling in China revealed by “APEC Blue” and “Parade Blue”, Sci. Rep.-UK, 6, 34408, https://doi.org/10.1038/srep34408, 2016.
Liu, J. G., Xie, P. H., Wang, Y. S., Wang, Z. F., He, H., and Liu, W. Q.: Haze Observation and Control Measure Evaluation in Jing-Jin-Ji (Beijing, Tianjin, Hebei) Area during the Period of the Asia-Pacific Economic Cooperation (APEC) Meeting, S & T Society, 30, 368–377, https://doi.org/10.16418/j.issn.1000-3045.2015.03.011, 2015.
Ma, Y., Diao, Y., Zhang, B., Wang, W., Ren, X., Yang, D., Wang, M., Shi, X., and Zheng, J.: Detection of formaldehyde emissions from an industrial zone in the Yangtze River Delta region of China using a proton transfer reaction ion-drift chemical ionization mass spectrometer, Atmos. Meas. Tech., 9, 6101–6116, https://doi.org/10.5194/amt-9-6101-2016, 2016.
Meller, R. and Moortgat, G. K.: Temperature dependence of the absorption cross sections of formaldehyde between 223 and 323 K in the wavelength range 225–375 nm, J. Geophys. Res.-Atmos., 105, 7089–7101, https://doi.org/10.1029/1999JD901074, 2000.
Meng, R., Zhao, F. R., Sun, K., Zhang, R., Huang, C., and Yang, J.: Analysis of the 2014 ”APEC Blue” in Beijing using more than one decade of satellite observations: lessons learned from radical emission control measures, Remote Sens., 7, 15224–15243, 2015.
Nilsson, J. A., Zheng, X., Sundqvist, K., Liu, Y., Atzori, L., Elfwing, A., Arvidson, K., and Grafström, R. C.: Toxicity of Formaldehyde to Human Oral Fibroblasts and Epithelial Cells: Influences of Culture Conditions and Role of Thiol Status, J. Dent. Res., 77, 1896–1903, 1998.
Palmer, P. I., Abbot, D. S., Fu, T. M., Jacob, D. J., Chance, K., Kurosu, T. P., Guenther, A., Wiedinmyer, C., Stanton, J. C., and Pilling, M. J.: Quantifying the seasonal and interannual variability of North American isoprene emissions using satellite observations of the formaldehyde column, J. Geophys. Res.-Atmos., 111, 2503–2511, https://doi.org/10.1029/2005JD006689, 2006.
Persson, A. and Grazzini, F.: User guide to ECMWF forecast products, Meteorol. Bull., 3, 1–129, 2011.
Pinardi, G., Van Roozendael, M., Abuhassan, N., Adams, C., Cede, A., Clémer, K., Fayt, C., Frieß, U., Gil, M., Herman, J., Hermans, C., Hendrick, F., Irie, H., Merlaud, A., Navarro Comas, M., Peters, E., Piters, A. J. M., Puentedura, O., Richter, A., Schönhardt, A., Shaiganfar, R., Spinei, E., Strong, K., Takashima, H., Vrekoussis, M., Wagner, T., Wittrock, F., and Yilmaz, S.: MAX-DOAS formaldehyde slant column measurements during CINDI: intercomparison and analysis improvement, Atmos. Meas. Tech., 6, 167–185, https://doi.org/10.5194/amt-6-167-2013, 2013.
Possanzini, M., Palo, V. D., and Cecinato, A.: Sources and photodecomposition of formaldehyde and acetaldehyde in Rome ambient air, Atmos. Environ., 36, 3195–3201, https://doi.org/10.1016/S1352-2310(02)00192-9, 2002.
Roozendael, M. V., Post, P., Hermans, C., Lambert, J. C., and Fayt, C.: Retrieval of BrO and NO2 from UV-visible observations, Sounding the Troposphere from Space, Springer, Berlin, Heidelberg, 155–165, 2003.
Schreier, S. F., Richter, A., Wittrock, F., and Burrows, J. P.: Estimates of free-tropospheric NO2 and HCHO mixing ratios derived from high-altitude mountain MAX-DOAS observations at midlatitudes and in the tropics, Atmos. Chem. Phys., 16, 2803–2817, https://doi.org/10.5194/acp-16-2803-2016, 2016.
Serdyuchenko, A., Gorshelev, V., Weber, M., Chehade, W., and Burrows, J. P.: High spectral resolution ozone absorption cross-sections – Part 2: Temperature dependence, Atmos. Meas. Tech., 7, 625–636, https://doi.org/10.5194/amt-7-625-2014, 2014.
Shao, M., Tang, X., Zhang, Y., and Li, W.: City clusters in China: Air and surface water pollution, Front. Ecol. Environ., 4, 353–361, 2006.
Sinreich, R., Friess, U., Wagner, T., and Platt, U.: Multi axis differential optical absorption spectroscopy (MAX-DOAS) of gas and aerosol distributions, Faraday Discuss., 130, 153–164, https://doi.org/10.1039/B419274P, 2005.
Solberg, S., Dye, C., Walker, S. E., and Simpson, D.: Long-term measurements and model calculations of formaldehyde at rural European monitoring sites, Atmos. Environ., 35, 195–207, https://doi.org/10.1016/S1352-2310(00)00256-9, 2001.
Starn, T. K., Shepson, P. B., Bertman, S. B., Riemer, D. D., Zika, R. G., and Olszyna, K.: Nighttime isoprene chemistry at an urban-impacted forest site, J. Geophys. Res.-Atmos., 103, 22437–22447, https://doi.org/10.1029/98JD01201, 1998.
Stavrakou, T., Müller, J.-F., De Smedt, I., Van Roozendael, M., van der Werf, G. R., Giglio, L., and Guenther, A.: Global emissions of non-methane hydrocarbons deduced from SCIAMACHY formaldehyde columns through 2003–2006, Atmos. Chem. Phys., 9, 3663–3679, https://doi.org/10.5194/acp-9-3663-2009, 2009.
Tanaka, K., Miyamura, K., Akishima, K., Tonokura, K., and Konno, M.: Sensitive measurements of trace gas of formaldehyde using a mid-infrared laser spectrometer with a compact multi-pass cell, Infrared Phys. Tech., 79, 1–5, 2016.
Tang, G., Zhu, X., Hu, B., Xin, J., Wang, L., Münkel, C., Mao, G., and Wang, Y.: Impact of emission controls on air quality in Beijing during APEC 2014: lidar ceilometer observations, Atmos. Chem. Phys., 15, 12667–12680, https://doi.org/10.5194/acp-15-12667-2015, 2015.
Thalman, R. and Volkamer, R.: Temperature dependent absorption cross-sections of O2-O2 collision pairs between 340 and 630 nm and at atmospherically relevant pressure, Phys. Chem. Chem. Phys., 15, 15371–15381, https://doi.org/10.1039/C3CP50968K, 2013.
Vandaele, A. C., Hermans, C., Simon, P. C., Roozendael, M. V., Guilmot, J. M., Carleer, M., and Colin, R.: Fourier transform measurement of NO2 absorption cross-section in the visible range at room temperature, J. Atmos. Chem., 25, 289–305, 1996.
Vigouroux, C., Hendrick, F., Stavrakou, T., Dils, B., De Smedt, I., Hermans, C., Merlaud, A., Scolas, F., Senten, C., Vanhaelewyn, G., Fally, S., Carleer, M., Metzger, J.-M., Müller, J.-F., Van Roozendael, M., and De Mazière, M.: Ground-based FTIR and MAX-DOAS observations of formaldehyde at Réunion Island and comparisons with satellite and model data, Atmos. Chem. Phys., 9, 9523–9544, https://doi.org/10.5194/acp-9-9523-2009, 2009.
Vrekoussis, M., Wittrock, F., Richter, A., and Burrows, J. P.: GOME-2 observations of oxygenated VOCs: what can we learn from the ratio glyoxal to formaldehyde on a global scale?, Atmos. Chem. Phys., 10, 10145–10160, https://doi.org/10.5194/acp-10-10145-2010, 2010.
Wagner, T., Dix, B., von Friedeburg, C., Frieß, U., Sanghavi, S., Sinreich, R., and Platt, U.: MAX-DOAS O4 measurements: A new technique to derive information on atmospheric aerosols – Principles and information content, J. Geophys. Res., 109, D22205, https://doi.org/10.1029/2004JD004904, 2004.
Wagner, T., Burrows, J. P., Deutschmann, T., Dix, B., von Friedeburg, C., Frieß, U., Hendrick, F., Heue, K.-P., Irie, H., Iwabuchi, H., Kanaya, Y., Keller, J., McLinden, C. A., Oetjen, H., Palazzi, E., Petritoli, A., Platt, U., Postylyakov, O., Pukite, J., Richter, A., van Roozendael, M., Rozanov, A., Rozanov, V., Sinreich, R., Sanghavi, S., and Wittrock, F.: Comparison of box-air-mass-factors and radiances for Multiple-Axis Differential Optical Absorption Spectroscopy (MAX-DOAS) geometries calculated from different UV/visible radiative transfer models, Atmos. Chem. Phys., 7, 1809–1833, https://doi.org/10.5194/acp-7-1809-2007, 2007.
Wagner, T., Deutschmann, T., and Platt, U.: Determination of aerosol properties from MAX-DOAS observations of the Ring effect, Atmos. Meas. Tech., 2, 495–512, https://doi.org/10.5194/amt-2-495-2009, 2009.
Wagner, T., Beirle, S., Brauers, T., Deutschmann, T., Frieß, U., Hak, C., Halla, J. D., Heue, K. P., Junkermann, W., Li, X., Platt, U., and Pundt-Gruber, I.: Inversion of tropospheric profiles of aerosol extinction and HCHO and NO2 mixing ratios from MAX-DOAS observations in Milano during the summer of 2003 and comparison with independent data sets, Atmos. Meas. Tech., 4, 2685–2715, https://doi.org/10.5194/amt-4-2685-2011, 2011.
Wang, G., Cheng, S., Wei, W., Yang, X., Wang, X., Jia, J., Lang, J., and Lv, Z.: Characteristics and emission-reduction measures evaluation of PM2.5 during the two major events: APEC and Parade, Sci. Total Environ., 595, 81–92, 2017.
Wang, H., Zhao, L., Xie, Y., and Hu, Q.: “APEC blue” – the effects and implications of joint pollution prevention and control program, Sci. Total Environ., 553, 429–438, 2016.
Wang, Y., Beirle, S., Lampel, J., Koukouli, M., De Smedt, I., Theys, N., Li, A., Wu, D., Xie, P., Liu, C., Van Roozendael, M., Stavrakou, T., Müller, J.-F., and Wagner, T.: Validation of OMI, GOME-2A and GOME-2B tropospheric NO2, SO2 and HCHO products using MAX-DOAS observations from 2011 to 2014 in Wuxi, China: investigation of the effects of priori profiles and aerosols on the satellite products, Atmos. Chem. Phys., 17, 5007–5033, https://doi.org/10.5194/acp-17-5007-2017, 2017a.
Wang, Y., Lampel, J., Xie, P., Beirle, S., Li, A., Wu, D., and Wagner, T.: Ground-based MAX-DOAS observations of tropospheric aerosols, NO2, SO2 and HCHO in Wuxi, China, from 2011 to 2014, Atmos. Chem. Phys., 17, 2189–2215, https://doi.org/10.5194/acp-17-2189-2017, 2017b.
Wang, Z. S., Li, Y. T., Zhang, D. W., Chen, T., Sun, F., and Li, L. J.: Analysis on air quality in Beijing during the 2014 APEC conference, Acta Scientiae Circumstantiae, 36, 675–683, https://doi.org/10.13671/j.hjkxxb.2015.0495, 2016.
Wei, X., Gu, X. F., Chen, H., Cheng, T. H., Wang, Y., Guo, H., Bao, F. W., and Xiang, K. S.: Multi-scale observations of atmosphere environment and aerosol properties over north China during APEC meeting periods, Atmosphere, 7, 4, https://doi.org/10.3390/atmos7010004, 2016.
Wittrock, F., Oetjen, H., Richter, A., Fietkau, S., Medeke, T., Rozanov, A., and Burrows, J. P.: MAX-DOAS measurements of atmospheric trace gases in Ny-Ålesund – Radiative transfer studies and their application, Atmos. Chem. Phys., 4, 955–966, https://doi.org/10.5194/acp-4-955-2004, 2004.
Zhang, J. S., Chen, Z. Y., Lu, Y. H. , Gui, H. Q., Liu, J. G., Liu, W. Q., Wang, J., Yu, T. Z., Cheng, Y., Chen, Y., Ge, B. Z., Fan, Y., and Luo, X. S.: Characteristics of aerosol size distribution and vertical backscattering coefficient profile during 2014 APEC in Beijing, Atmos. Environ., 148, 30–41, 2017.
Zhang, Y. J., Pang, X. B., and Mu, Y. J.: Contribution of isoprene emitted from vegetable to atmospheric formaldehyde in the ambient air of Beijing city, Environ. Sci., 30, 976–981, 2009.


