the Creative Commons Attribution 4.0 License.
the Creative Commons Attribution 4.0 License.
 | 14 Mar 2019
Multi-satellite retrieval of single scattering albedo using the OMI–MODIS algorithm
Kruthika Eswaran
Sreedharan Krishnakumari Satheesh
Jayaraman Srinivasan
Single scattering albedo (SSA) represents a unique identification of aerosol type and can be a determinant factor in the estimation of aerosol radiative forcing. However, SSA retrievals are highly uncertain due to cloud contamination and aerosol composition. The recent improvement in the SSA retrieval algorithm has combined the superior cloud-masking technique of the Moderate Resolution Imaging Spectroradiometer (MODIS) and the higher sensitivity of the Ozone Monitoring Instrument (OMI) to aerosol absorption. The combined OMI–MODIS algorithm has only been validated over a small spatial and temporal scale. The present study validates the algorithm over global oceans for the period from 2008 to 2012. The geographical heterogeneity in the aerosol type and concentration over the Atlantic Ocean, the Arabian Sea and the Bay of Bengal was useful to delineate the effect of aerosol type on the retrieval algorithm. We also noted that OMI overestimated SSA when absorbing aerosols were present closer to the surface. We attribute this overestimation to data discontinuity in the aerosol height climatology derived from the Cloud-Aerosol Lidar and Infrared Pathfinder Satellite Observations (CALIPSO) satellite. OMI uses predefined aerosol heights over regions where CALIPSO climatology is not present, leading to the overestimation of SSA. The importance of aerosol height was also studied using the Santa Barbara DISORT Atmospheric Radiative Transfer (SBDART) model. The results from the joint retrievals were validated using cruise-based measurements. It was seen that OMI–MODIS SSA retrievals performed better than the OMI only retrieval over the Bay of Bengal during winter, when the aerosols are present closer to the surface. Discrepancy between satellite retrievals and cruise measurements was seen when elevated aerosols were present which might not have been detected by the cruise instruments.
- Article
(5248 KB) - Full-text XML
- BibTeX
- EndNote


Aerosols of different types are spatially distributed in a heterogeneous manner and at different altitudes in the atmosphere. Depending upon their properties, certain aerosols types, such as carbonaceous aerosols emitted from biomass burning, warm the atmosphere by absorbing radiation, whereas other aerosol types such as sea salt emitted from the oceans cool the atmosphere by scattering radiation (Ramanathan et al., 2001). Due to these opposing effects on the atmosphere, aerosols can either have a net warming or net cooling effect on the global climate depending upon the aerosol type, concentration and vertical distribution. The effect of natural and anthropogenic aerosols on the global climate is measured by “aerosol radiative forcing” (the perturbation to the Earth's radiation budget caused by the presence of aerosols). Positive (negative) forcing implies atmospheric warming (cooling) (Liao and Seinfeld, 1998; Podgorny and Ramanathan, 2001; Satheesh, 2002; Johnson et al., 2003; Kim et al., 2004; Moorthy et al., 2004; Meloni et al., 2005; Satheesh and Moorthy, 2005; Seinfeld and Pandis, 2006; Satheesh et al., 2008; Chand et al., 2009; Mishra et al., 2015). According to the Fifth Climate Assessment Report, the estimation of aerosol radiative forcing (due to anthropogenic aerosols) is a major cause of uncertainty in the estimation of climate sensitivity and therefore presents a significant impediment to climate modelling (IPCC, 2013). This uncertainty is mostly due to the lack of accurate measurements of the scattering and absorbing properties of aerosols (Cooke and Wilson, 1996; Menon et al., 2002; Chung and Seinfeld, 2002; Bond and Sun, 2005).
The single scattering albedo (SSA), the fraction of the total extinction of radiation attributed to scattering, is used to distinguish the scattering and absorbing properties of aerosols. The SSA represents a unique fingerprint of the type of aerosol and its radiative forcing (Hansen et al., 1997; Haywood et al., 1997; Myhre et al., 1998). In general, purely scattering aerosols have SSA values of approximately 1, whereas highly absorbing aerosols have SSA values of less than 0.7. However, SSA retrievals lack a high level of certainty (Bond and Bergstrom, 2006; Bond et al., 2013). Uncertainties in SSA retrievals are due to factors such as cloud contamination, instrumentation error and aerosol modification due to atmospheric processes. A small change in SSA can cause the aerosol radiative forcing to change from negative to positive (Hansen et al., 1997; Seinfeld and Pandis, 2006). Loeb and Su (2010) performed a radiative perturbation analysis and found that direct aerosol radiative forcing was highly sensitive to small perturbations in the SSA under clear-sky and cloudy-sky conditions. A simulation study using the Santa Barbara DISORT Atmospheric Radiative Transfer (SBDART) model in the present work (Sect. 5.3) shows that a change in the SSA from 0.8 to 1 can induce a change of 4 W m−2 in the top-of-atmosphere (TOA) flux depending on the aerosol type and aerosol layer height (ALH) (Fig. 8). Better SSA retrievals (both in situ and satellite-based) are required to reduce the uncertainty in the SSA values for a more accurate estimation of aerosol forcing, particularly over regions influenced by a variety of air masses. There is also a need for accurate spectral aerosol absorption measurements, which are required to validate the SSA values derived from satellites (Bergstrom et al., 2007).
Studies on the various measurements of aerosol light absorption using instruments and their uncertainty evaluations have previously been performed (Horvath, 1993; Heintzenberg et al., 1997; Moosmuller et al., 2009). The different methods of SSA retrieval, both ground-based and using satellites, are provided in Table 1. Unlike the aerosol absorption coefficient, SSA is not measured directly by an instrument. Instead, it is retrieved using look-up tables or estimated using other parameters that are measured or calculated using models.
Table 1Ground-based and satellite-based indirect methods of retrieving SSA.
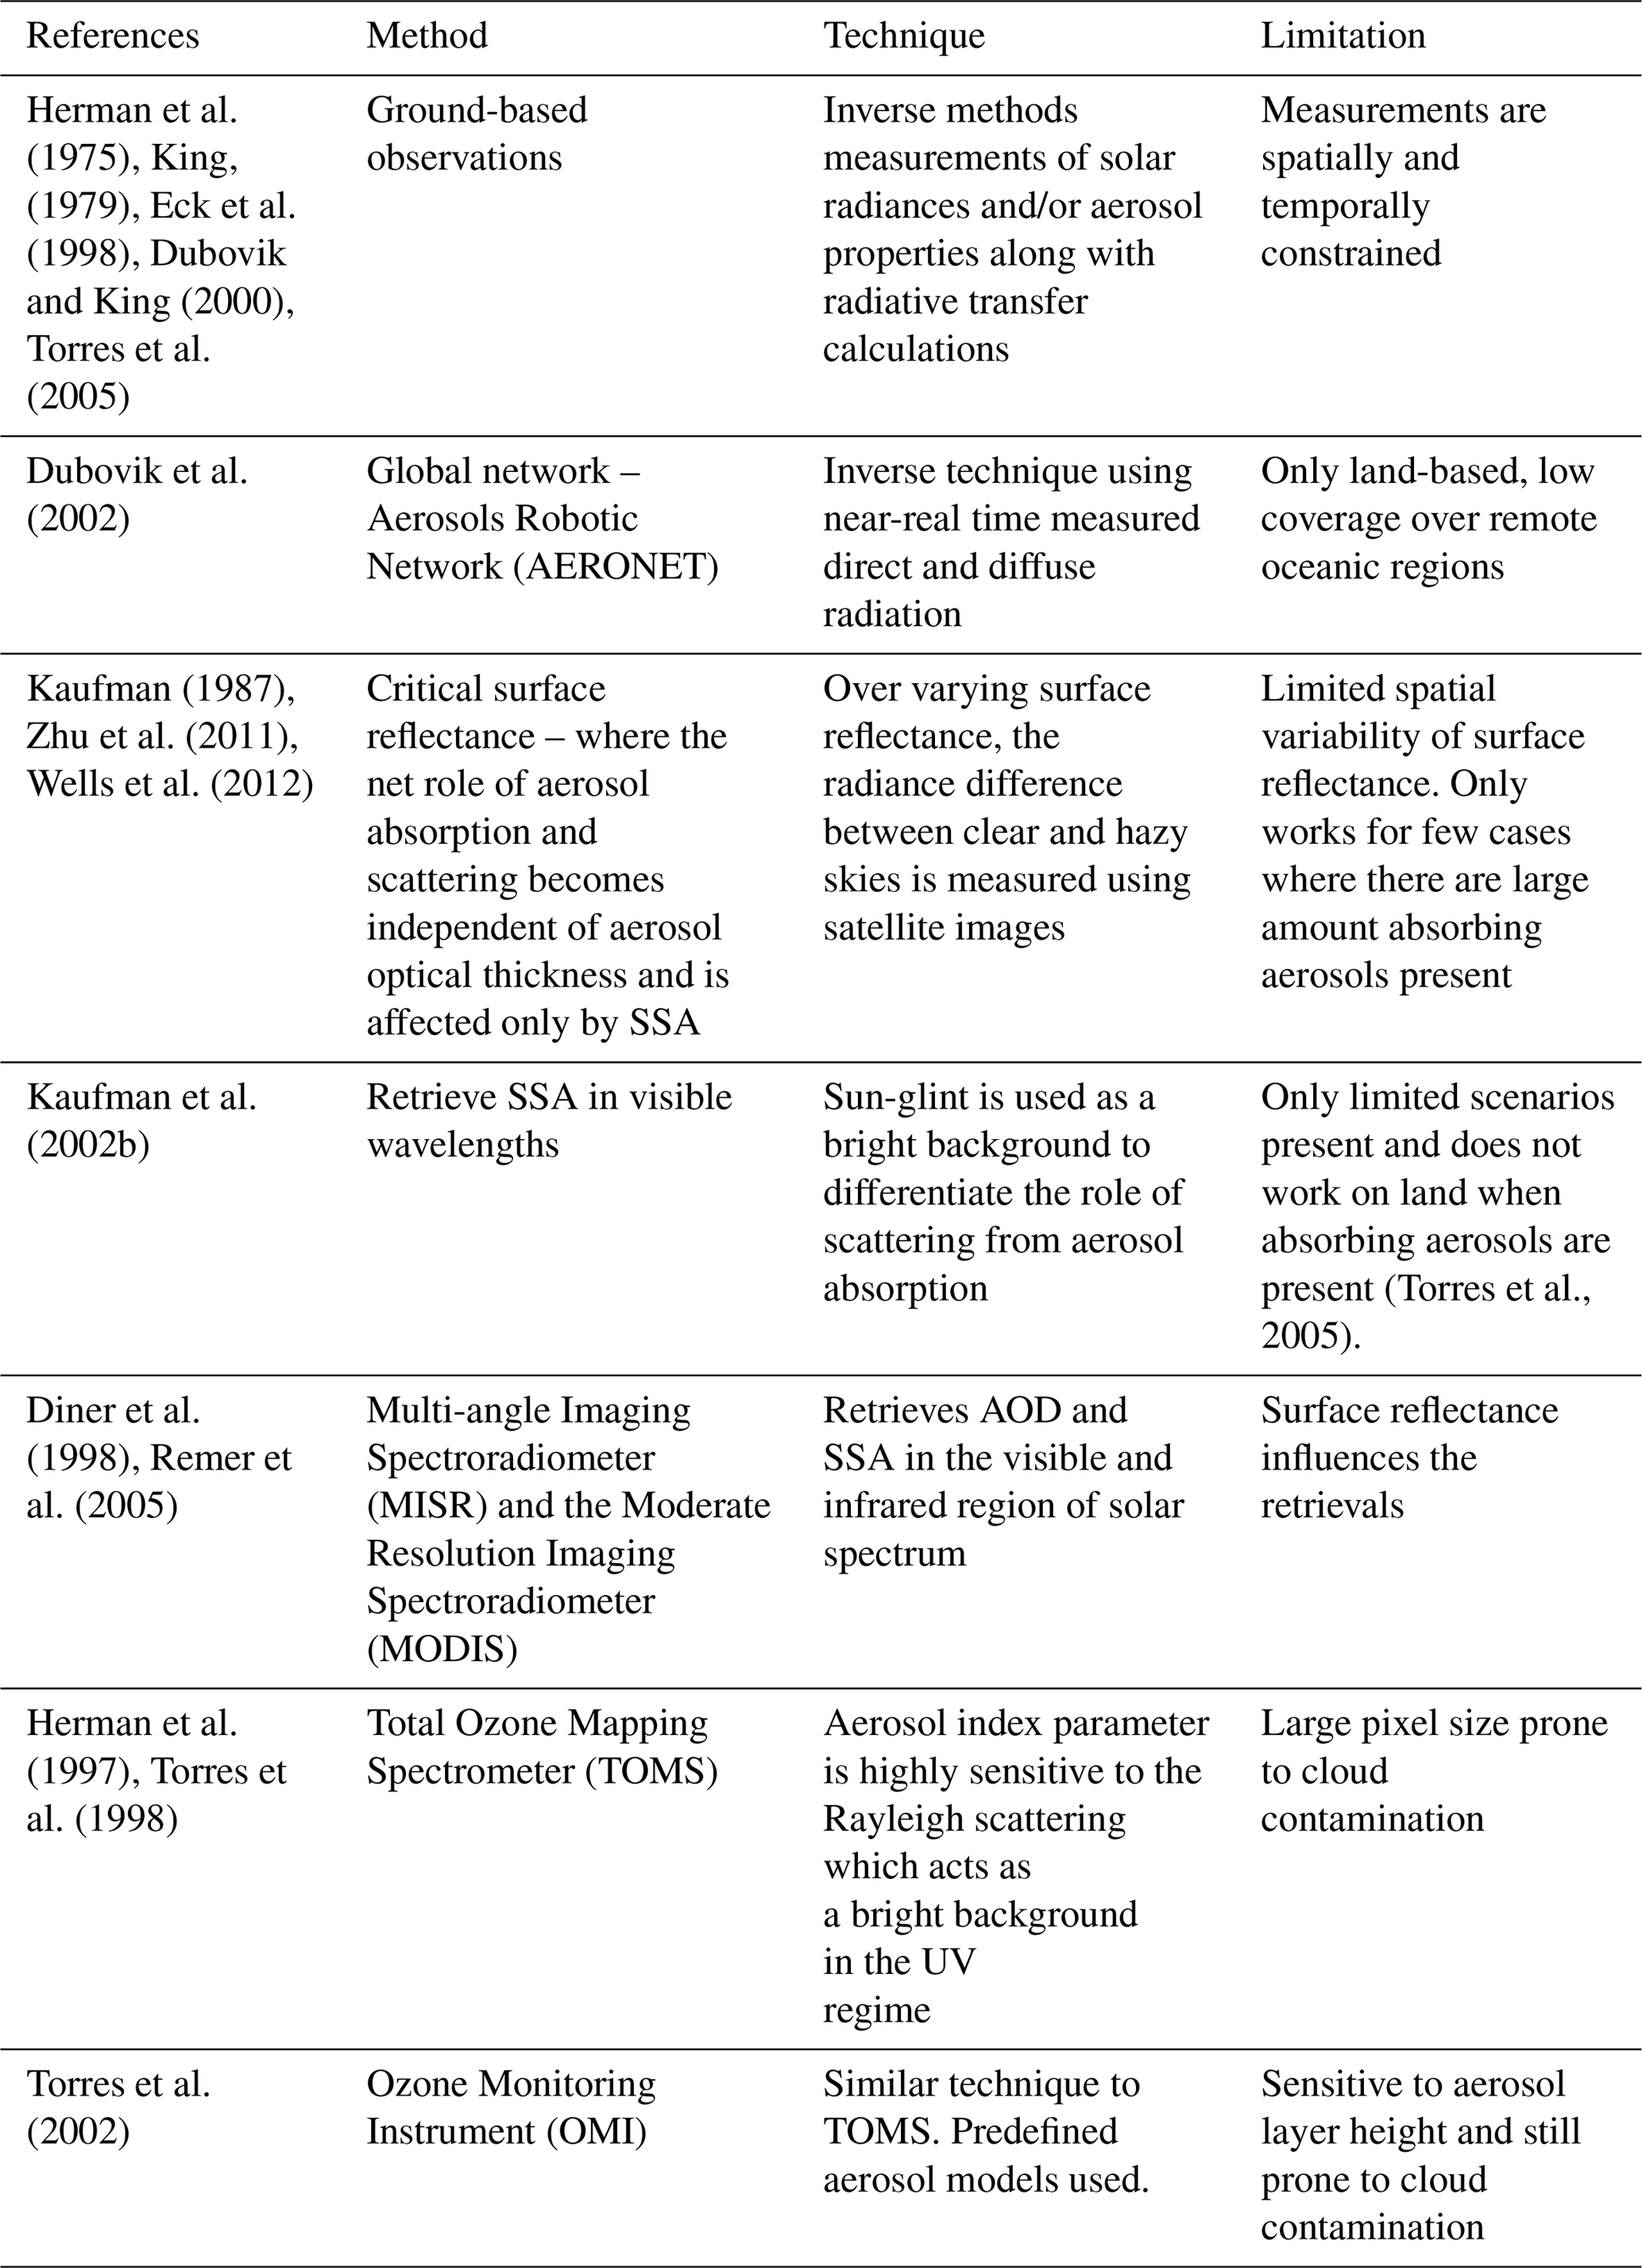
Although these previous studies regarding ground-based retrievals have provided a fundamental understanding of the estimation of amounts of aerosols/aerosol chemistry, their restricted spatial and temporal extents are a significant limitation. Moreover, these studies have a limited availability with respect to locations for indirect retrievals. Some techniques are limited due to cloud contamination, whereas other techniques only operate under specific conditions (e.g. presence of sun glint). This presents the requirement for better SSA retrieval algorithms that overcome the present technical limitations, and that can be applied on a global scale. The global extent of observations from satellites has increased the spatial extent of the observations (Kaufman et al., 2002a). Although the satellite-based SSA retrievals have been shown to be extremely successful over the majority of ocean and land regions, they still have a limited success over deserts and ice sheets. Over deserts and ice sheets, high surface reflectance affects the satellite retrievals in the visible spectrum. To counter this, SSA is retrieved in the UV spectrum (330 to 400 nm) over these regions (Torres et al., 1998, 2007). In the UV spectrum, the upwelling radiances are highly sensitive to the aerosol absorption and also have a lower influence of surface albedo (Torres et al., 2007). Therefore, SSA retrieval in the UV spectrum avoids difficulties encountered over surfaces with high albedo.
The quality of OMI (Ozone Monitoring Instrument) SSA retrievals is affected by sub-pixel cloud contamination (due to the larger footprint size of 13 km × 24 km) and uncertainty in the assumption of spectral surface albedo (Torres et al., 2007). To counter these problems and uncertainties in the OMI SSA retrieval (Table 2), Satheesh et al. (2009) used retrievals from multiple satellites; they used combined retrievals from OMI–MODIS (Moderate Resolution Imaging Spectroradiometer) as each of these sensors have their own strengths and both fly within ∼7–8 min of each other in the A-train constellation (Stephens et al., 2002). The better cloud-screened retrieval of AOD from MODIS (Levy et al., 2003, 2013) and the high sensitivity of OMI to aerosol absorption were used to develop a hybrid algorithm to retrieve SSA (Satheesh et al., 2009). The algorithm uses the MODIS AOD as a reference to infer the ALH and SSA from OMI. This removes any a priori assumption made by the OMI algorithm to retrieve ALH along with SSA. The study by Satheesh et al. 2009 was performed over the east tropical Atlantic Ocean, the central tropical Atlantic Ocean and the Arabian Sea for the year 2006. A comparison of the retrieved aerosol height using aircraft measurements showed that OMI–MODIS was more accurate than OMI. Gassó and Torres (2016) performed a detailed analysis of the OMI UV product retrievals over oceans and island sites, comparing the OMI retrieved AOD with MODIS and AERONET (Aerosol Robotic Network) AODs. They also used the OMI–MODIS algorithm for two particular cases (only) over and near Africa to understand how the assumption of aerosol height and shape affected AOD and SSA retrievals. When the actual height from satellite lidar was used instead of climatological values, and when the shape of dust aerosols was assumed to be non-spherical, the retrievals by OMI showed better agreement with other observations, including the original OMI–MODIS method. The OMI–MODIS algorithm has been used to calculate aerosol radiative forcing (Satheesh et al., 2010) over oceanic regions surrounding India and to retrieve SSA over land (Narasimhan and Satheesh, 2013) as well as to understand the retrievals of OMI UV products for two particular cases (Gassó and Torres, 2016). However, a detailed analysis of the algorithm on a larger spatial and temporal scale has not yet been carried out.
The current work applies the OMI–MODIS algorithm to retrieve SSA on a global scale. It is applied over the global oceans from 2008 to 2012. Regional analysis over the Atlantic, the Arabian Sea and the Bay of Bengal are carried out by incorporating the ALH and the type of aerosols. After estimating SSA values using the OMI–MODIS algorithm, the present study then uses cruise measurements of SSA from the Integrated Campaign for Aerosols, Gases and Radiation Budget (ICARB) and winter ICARB campaigns over the Arabian Sea and the Bay of Bengal from 2006 and 2009, respectively, to validate the same values (Moorthy et al., 2008, 2010).
2.1 The Ozone Monitoring Instrument (OMI)
OMI, onboard the Aura satellite, was launched in 2004. For OMI measurements two aerosol inversion schemes are used: the OMI near-UV (OMAERUV) algorithm and the multi-wavelength (OMAERO) algorithm (Torres et al., 2007). The OMAERO algorithm uses 19 wavelengths in the range of 330–500 nm to retrieve corresponding aerosol characteristics. For the present study, we used the OMAERUV algorithm which uses measurements at two wavelengths: 354 and 388 nm. The reason behind choosing these wavelengths is the high sensitivity of upwelling radiances to aerosol absorption and the lower influence from the surface in the measurements due to low reflectance values in the UV region. In addition to this, the wavelengths also have negligible interference from trace gases. This gives them a unique advantage with respect to retrieving aerosol properties over ocean and land including arid and semi-arid regions (Torres et al., 1998; 2007).
The products derived from the algorithm include AOD, absorption aerosol optical depth (AAOD) and SSA. These are derived from pre-computed reflectance values for different aerosol models. Three major types of aerosols have been used: desert dust, carbonaceous aerosols from biomass burning and background and urban-industrial aerosols. Each type has seven models of SSA. The retrieved products of OMAERUV are sensitive to the ALH (Torres et al., 1998) and are reported for five discrete ALHs, i.e., the surface (exponential profile), 1.5, 3.0, 6.0 and 10.0 km, with latter four following a Gaussian distribution.
Due to the high sensitivity of SSA retrieval to the assumption of aerosol height and aerosol type (Torres et al., 2002), the OMI algorithm was improved (Collection 003-PGE V1.4.2, Torres et al., 2013). The climatology of ALH from CALIPSO (Cloud-Aerosol Lidar and Infrared Pathfinder Satellite Observations) along with carbon monoxide (CO) measurements from the AIRS (Atmospheric Infrared Sounder) have helped distinguish carbonaceous aerosols from dust particles. Torres et al. (2013) showed that the combined use of AIRS CO measurements and the OMI aerosol index (AI) retrievals, helped with identifying the type of absorbing aerosol. Thus, smoke layers were identified when values of the AI and CO measurements were high, and during events of high AI and low CO values, the aerosols were identified as dust. The AIRS CO measurements were also used to identify large aerosol loading which was otherwise represented as clouds by the OMAERUV algorithm. Using collocated observations from OMI and CALIOP (Cloud-Aerosol Lidar with Orthogonal Polarization), Torres et al. (2013) estimated the height of elevated absorbing aerosols for a 30-month period from July 2006 to December 2008. An effective ALH was calculated using the CALIOP 1064 nm attenuated backscatter weighted by corresponding altitudes. The 30-month climatology of aerosol height was used in the OMAERUV retrievals which were then validated against the AERONET observations (Torres et al., 2013). The results showed that there was an improvement in the retrievals.
Since 2007, observations have been affected by an instrumental issue called the “row anomaly” which reduces the quality of radiance at all wavelengths (Jethva et al., 2014). Torres et al. (2018) studied the impact of the row anomaly on the OMAERUV retrievals by comparing monthly values of the AOD, SSA and the UV aerosol index (UVAI) of two different sets of scattering angles. Over regions dominated by carbonaceous and sulfate aerosols, the agreement between the sets was better than over arid regions dominated by dust aerosols. Differences were also found over cloudy regions. The discrepancies were attributed to the inaccurate representation of the scattering effects of dust aerosols and cloud droplets. Better representation of scattering by clouds and the non-spherical (spheroidal) shape assumption of dust aerosols was found to reduce the inconsistencies in aerosol products due to the row anomaly. These improvements have been incorporated in the latest version of the OMAERUV product (version 1.8.9) which was used in the present study. Along with the aerosol products retrieved at different heights, the final set of AOD/SSA/AAOD retrievals in the OMAERUV product is reported at the mean ALH provided by the 30-month long averaged climatology developed using OMI–CALIOP combined observations (Torres et al., 2013). The original aerosol height assumptions were used in the algorithm over regions where the climatology was unavailable.
2.2 The Moderate Resolution Imaging Spectrometer (MODIS)
The MODIS instrument on the Aqua satellite was launched in 2002. This instrument, with 36 spectral channels has a unique ability that allows it to retrieve aerosol properties with better accuracy over both land and ocean (Remer et al., 2005; Levy et al., 2003). Of these, seven channels (0.47–2.13 µm) are used to retrieve aerosol properties over the ocean (Tanré et al., 1997).
As described in Remer et al. (2005), before the retrieval algorithm, masking of sediments, clouds and ocean glint is performed to separate valid pixels from invalid pixels. The retrieval algorithm of MODIS (also called the inversion procedure) has been described in detail previously (Tanré et al., 1997; Levy et al., 2003; Remer et al., 2005). The algorithm uses a “look-up table” (LUT) approach, i.e., for a set of aerosol and surface parameters, radiative transfer calculations are performed. Spectral reflectance derived from the LUT is compared with MODIS-measured spectral reflectance to find the “best” (least-squares) fit. The resulting combination of modes provides the aerosol model from which the size distribution, properties including spectral optical depth, and the effective radius are derived. The product used from MODIS is the Level 2 aerosol (MYD04, Collection 6.1) product. The parameter chosen is “Effective_Optical_Depth_Average_Ocean” which provides the aerosol optical depth over the ocean at seven wavelengths. The value is the average of all of the solutions in the inversion procedure with the least-square error < 3 %.
A combination of OMI and MODIS helps indirectly to counteract the cloud contamination problem and also uses the strengths of the individual sensors: OMI's sensitivity to aerosol absorption combined with the better cloud screening of MODIS and accurate retrieval of AOD and aerosol size (Satheesh et al., 2009; Narasimhan and Satheesh, 2013).
The MODIS aerosol product reports retrievals at 10 km×10 km spatial resolution at nadir (and a cloud mask at 500 m and 1 km resolution), whereas OMI reports retrievals at a spatial resolution 13 km × 24 km. This results in an OMI pixel being prone to cloud contamination which may end in an overestimation of AOD and SSA (Torres et al., 1998). However, AAOD can be retrieved in the presence of a small amount of cloud contamination as there is cancellation of errors (Torres et al., 2007).
The high accuracy of size-resolved aerosol retrievals with MODIS is because the over-ocean algorithm employs all seven channels (0.47–2.13 µm) in the inversion enabling better characterisation of fine and coarse particles. (Tanré et al., 1997; Remer et al., 2005; Levy et al., 2003). While OMI is highly sensitive to aerosol absorption in the near-UV region, the accuracy in the retrieval of AAOD depends on the ALH assumption. OMI provides AOD and AAOD at different heights as prescribed by various aerosol types (Torres et al., 2007).
The assumption of ALH in the OMI algorithm constrains the retrievals of AOD and SSA. The approach proposed in Satheesh et al. (2009) used MODIS AOD as an input to the OMI retrieval algorithm so that the MODIS AOD constrains the OMI inversion, and the OMI inversion is then free to infer the ALH and SSA. Satheesh et al. (2009) extrapolated MODIS AOD from the visible to 388 nm and compared the estimated UV AOD with high-quality ground-based AERONET observations. The deviation between the linearly extrapolated MODIS AOD and the AERONET AOD was more significant at higher AERONET AOD values. This was attributed to the presence of a large number of fine-mode aerosols which caused a non-linear curvature to the AOD spectral dependence and affected AOD at UV wavelengths. Hence, to improve the linear extrapolation, information on the aerosol spectral curvature was also included. This was achieved using an average regression equation to correct the MODIS AOD (Satheesh et al., 2009; Eq. 3). Satheesh et al. (2009) showed that MODIS AOD could first be linearly extrapolated to 388 nm and then corrected for curvature before being used as input to the OMI retrieval algorithm. The present work uses the same algorithm to retrieve SSA over the oceans for the region from 60∘ S to 60∘ N and from 180∘ W to180∘ E from December 2007 to November 2012. The methodology is described in detail in the following section.
The AOD for the ocean obtained from the Level 2 aerosol product of Aqua MODIS (MYD04) was used. Using linear extrapolation with spectral curvature correction (Satheesh et al., 2009), AOD at 388 nm (hereafter AOD388) was calculated from AOD at seven wavelengths ranging from 0.47 to 2.13 µm. OMI provides AOD and SSA for five different ALHs starting from the surface and at 1.5, 3.0, 6.0 and 10.0 km (AODOMI and SSA388). It also provides the best estimate of SSA calculated based on the CALIOP ALH climatology (SSAOMI).
For the present study, polar regions are not included. Hence, pixels from both OMI and MODIS that are outside the 60∘ S–60∘ N and 180∘ W–180∘ E region are excluded. Pixels with invalid or missing values are also excluded. The various parameters extracted from the data were re-gridded onto a uniform 0.5∘ × 0.5∘ grid within the study region to reduce computation time. For both the satellites, this procedure was repeated for each swath of data which were then combined to calculate the daily means.
The daily data from the collocated MODIS and OMI instruments were utilised in the final algorithm. As previously mentioned, OMI provides AOD and SSA for five different ALHs. Using AOD388 as the reference, the corresponding ALH was calculated from the five AODOMI values via linear interpolation. This height was then used as a reference to find the SSA using interpolation from the set of SSA388 values. Finally, this SSA (SSAOMI–MODIS), and the best estimate of SSA (SSAOMI) were compared with each other.
The spatial distribution of SSA retrieved using OMI is shown in Fig. 1a. The values are averaged over 5 years and are plotted seasonally.
The SSA retrieved using the OMI–MODIS algorithm is shown in Fig. 1b.
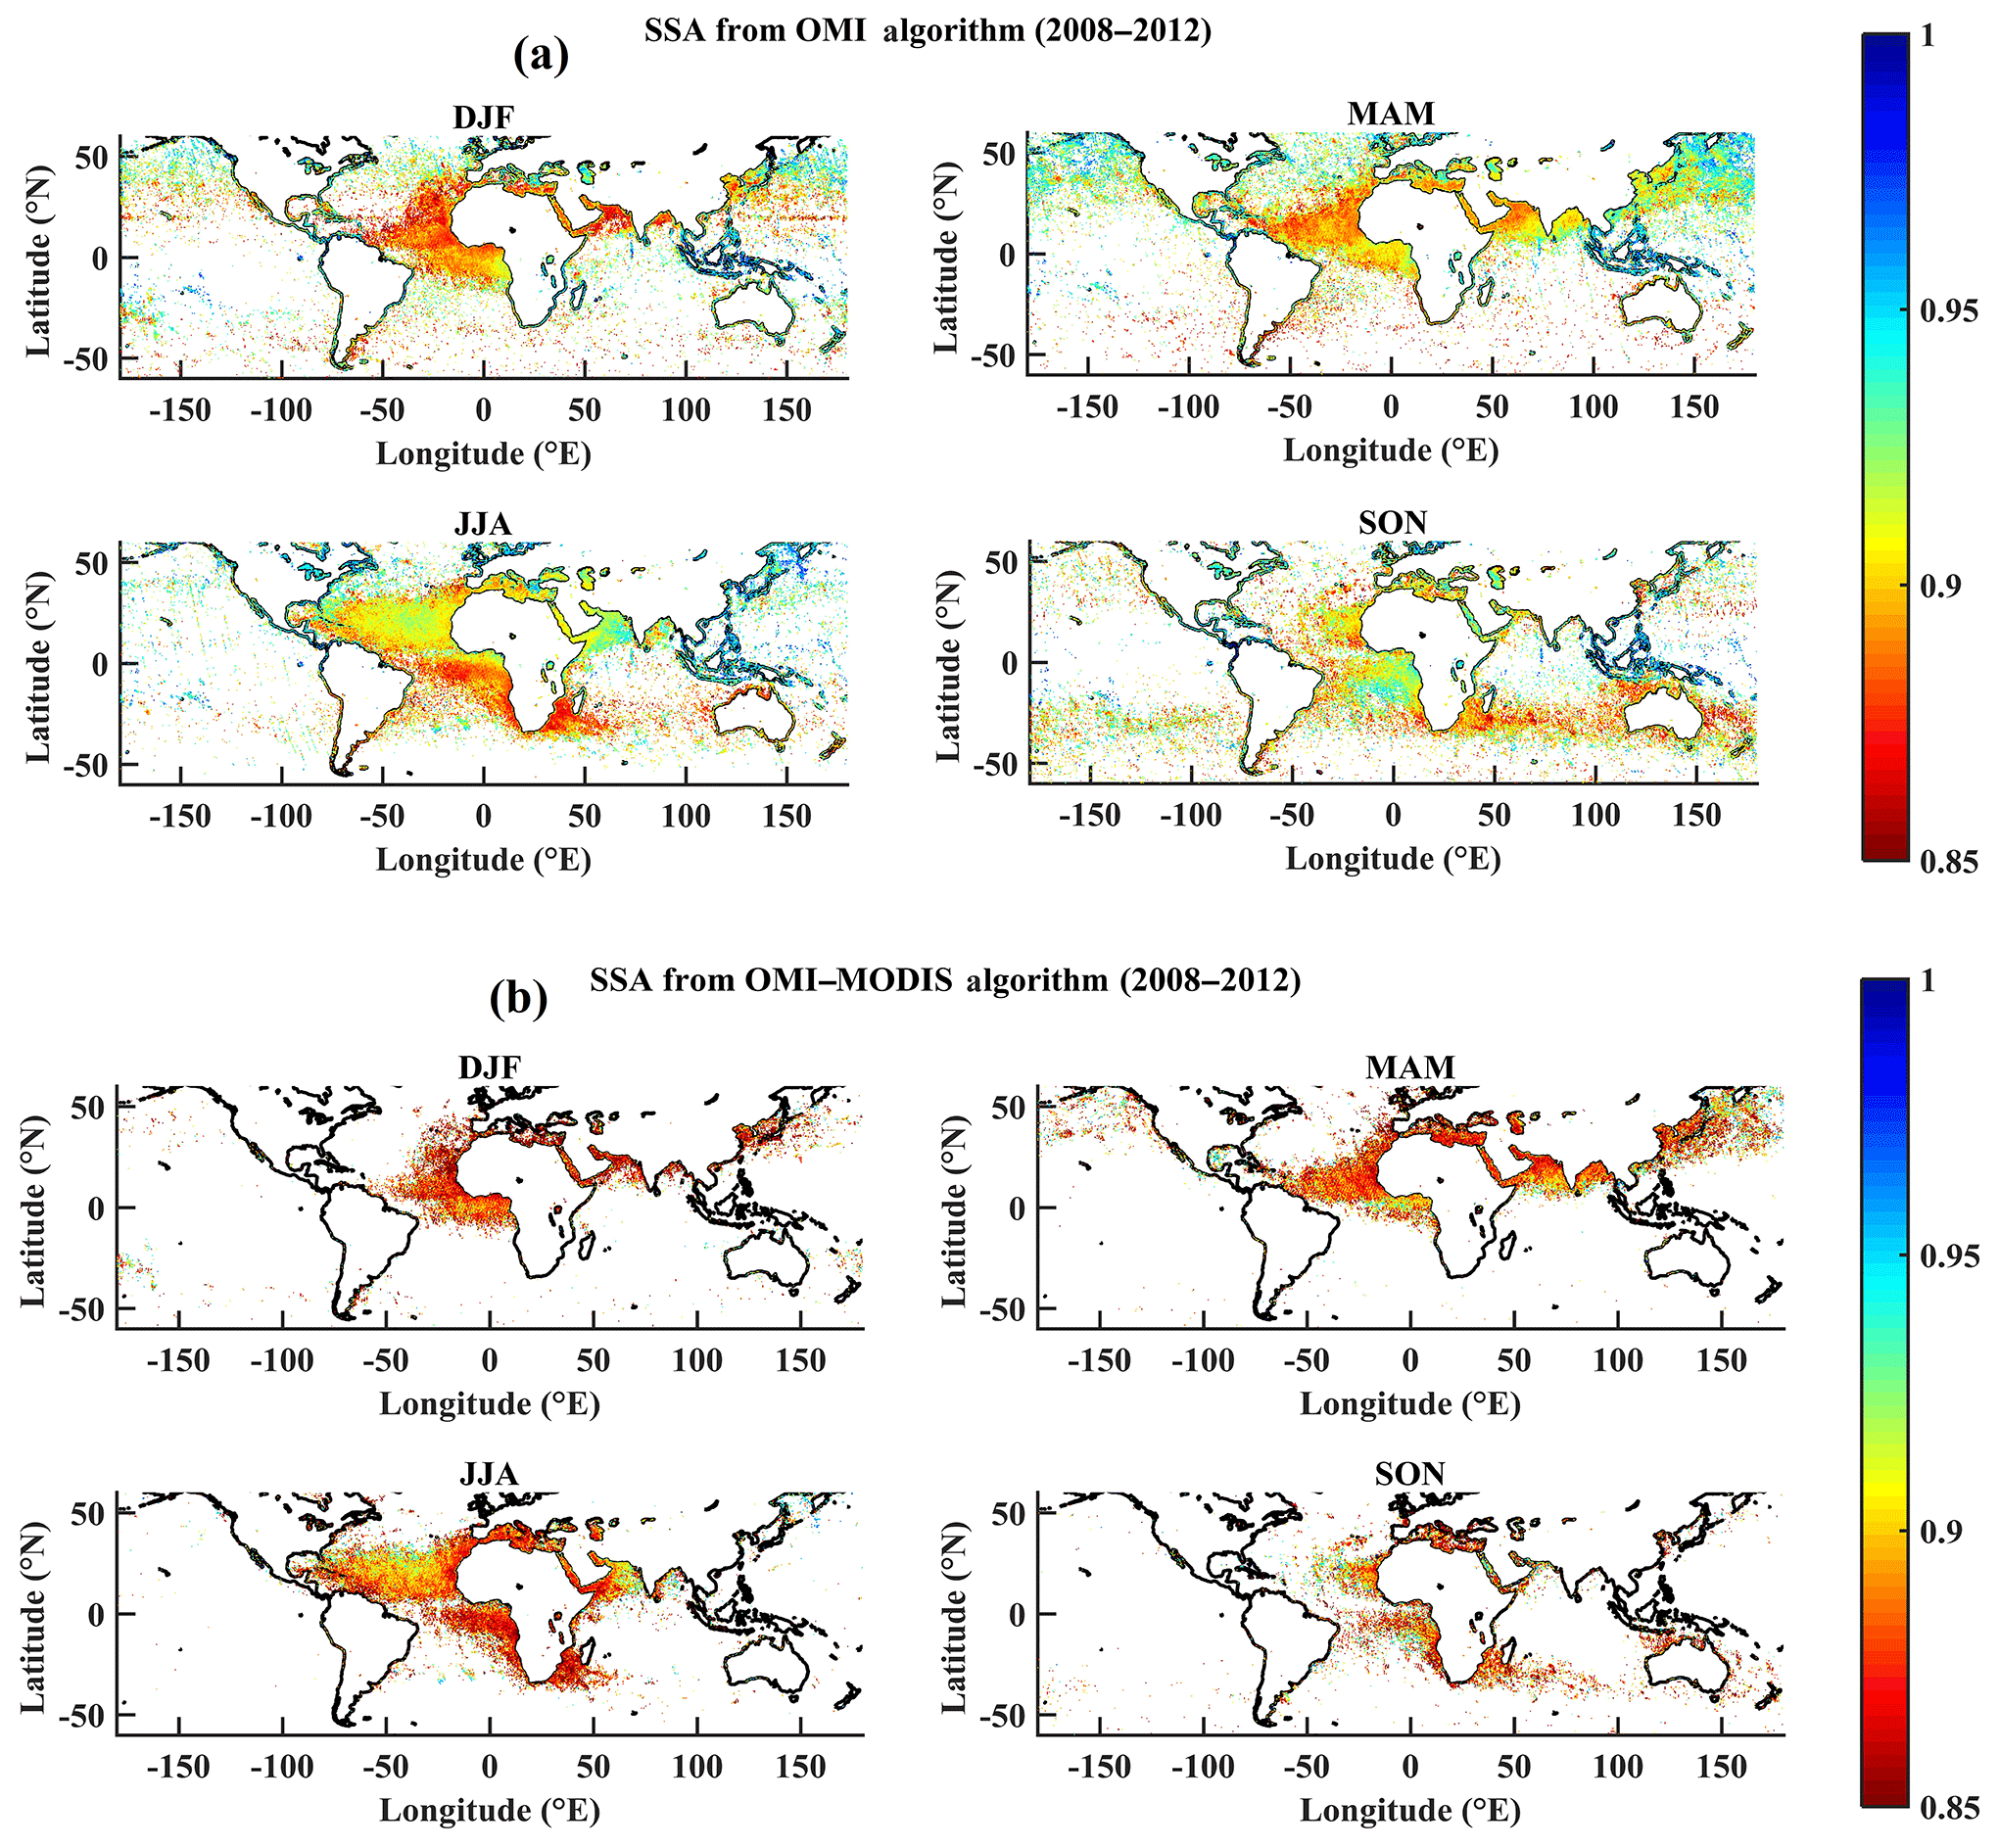
Figure 1Spatial distribution of SSA at 388 nm retrieved by (a) OMI and (b) OMI–MODIS. In the present study, points that had the same SSA value at the five discrete heights provided by OMI or an invalid value at any one height were considered invalid for the OMI–MODIS retrieval as interpolation was not possible. This resulted in a reduction of the number of valid points for OMI–MODIS compared with OMI.
SSA over open oceans is close to 1 due to the presence of a large amount of sea salt and sulfate. Closer to land, a variety of aerosols are present which results in the SSA varying from 0.85 to ∼1. Over the oceans, separation of the ocean colour effects and the aerosol concentrations is difficult. Hence, the OMI algorithm retrieves when enough absorbing aerosols are present, i.e. AI >= 0.8 (Torres et al., 2013). Only pixels that were assigned a quality of 0, or the highest quality by OMI, were used. The points flagged for row anomaly were also not used in this study. Thus, the retrievals did not cover the entire globe. From Fig. 1a it can be seen that majority of the valid SSA retrievals were over major aerosol sources in the world and not over remote oceanic regions like the central equatorial Pacific or Antarctic oceans. The major sources include the vast biomass outflow over the Atlantic Ocean from the west coast of Africa, the dust over the Arabian Sea from the arid areas of the Arabian Peninsula and Africa and the dust blown over the Atlantic Ocean from the Sahara. Other regions like the east coast of China and the Bay of Bengal are influenced by a variety of anthropogenic aerosols during different seasons. In the OMI–MODIS algorithm, the ALH is retrieved through linear interpolation of AODOMI at five different heights, and AOD388 is used as a reference. Linear interpolation was not performed for OMI retrievals which had a missing value at any particular height or if the OMI retrieval was the same at all heights. Such OMI–MODIS values were considered to be invalid. Similarly, if the MODIS AOD was found to be missing or invalid, the corresponding OMI–MODIS retrieval was also considered invalid. This resulted in a reduction of the total number of valid points in the OMI–MODIS algorithm when compared with the OMI algorithm (Fig. 1b). However, both of the algorithms capture the major oceanic regions which are influenced by a large number of aerosols. Gassó and Torres (2016) compared the AOD values retrieved by OMI and MODIS for a particular day over the northern central Atlantic . They contrasted the difference with the aerosol cloud mask retrieved by MODIS. It was found that while most of the retrievals of OMI screened the cloudy pixels, some of the best quality (flag = 0) pixels were cloud contaminated. They attributed the contamination to the coarser pixel size of OMI compared with the smaller pixel size of the MODIS cloud product. At higher cloud fraction, OMI retrieved values implying that it can detect aerosol above clouds or that the pixels are prone to cloud contamination. Gassó and Torres (2016) concluded that only the MODIS cloud fraction could not be used to screen out OMI pixels. A larger spatiotemporal scale is required for such an analysis but is beyond the scope of this paper and will be addressed in the future. However, OMI retrievals at a higher cloud fraction could be the reason for there being more points for OMI in Fig. 1a than for OMI–MODIS in Fig. 1b.
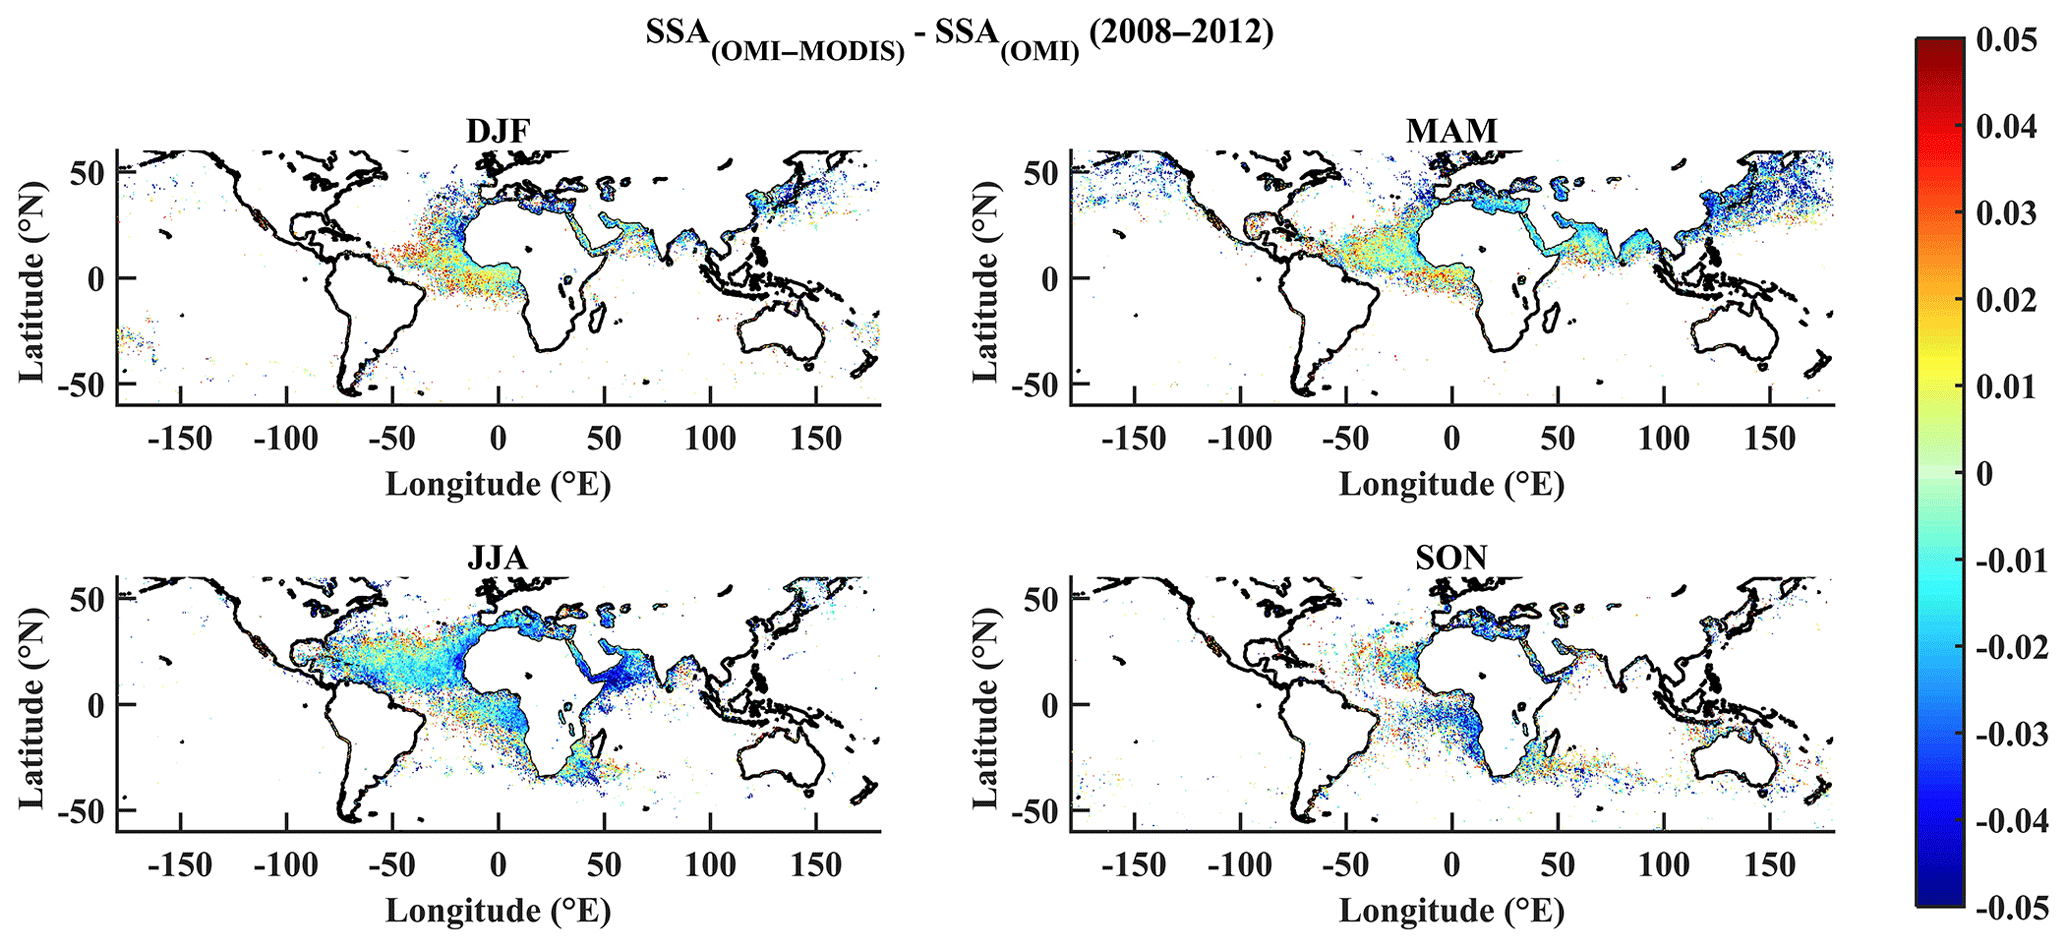
Figure 2Spatial distribution of the difference in SSA retrieved by OMI–MODIS and SSA retrieved by OMI, both at 388 nm. When the OMI–MODIS SSA value was found to be invalid, the difference was also considered to be invalid.
Two important regions over oceans influenced by a variety of aerosols are the tropical Atlantic Ocean and the oceans around the Indian subcontinent. Therefore, the new approach was used over the following regions: the Atlantic (ATL; 5–30∘ N, 60–20∘ W) and the Arabian Sea and the Bay of Bengal (ARBOB; 0–25∘ N, 55–100∘ E).
5.1 Difference in SSA retrieval algorithms during different seasons
To understand how the OMI–MODIS algorithm compares with the retrieval using the existing OMI algorithm, the difference between SSAOMI–MODIS and SSAOMI (ΔSSA) averaged over 5 years for different seasons is shown in Fig. 2.
During March–April–May (MAM) and June–July–August (JJA), there is a longitudinal gradient in ΔSSA from the coast of the Sahara towards the open Atlantic Ocean. Close to the coast of Africa, Kaufman et al. (2002a) showed that aerosols are more absorbing than those away from the coast. The difference in the type of aerosols as we move away from the coast could be one of the reasons for the gradient in ΔSSA. The difference can also be attributed to the shape of dust aerosols which are present in large numbers near the coast of Africa (Torres et al., 2018). The ΔSSA changes sign with season; this was attributed to the change in ALH and (or) aerosol physical and optical properties.
Both the ATL and ARBOB regions are influenced by the type of aerosols present which result in a complex mixture and eventually conclude in a variation in the SSA distribution over each season. While the spatial plot of ΔSSA in Fig. 2 represents the regions where maximum and minimum differences are located around the globe, a distribution plot provides the ranges of ΔSSA that dominate and those that do not. The distribution of ΔSSA for different seasons averaged over 5 years (2008–2012) is plotted in Fig. 3a and b for the ATL and ARBOB regions respectively.
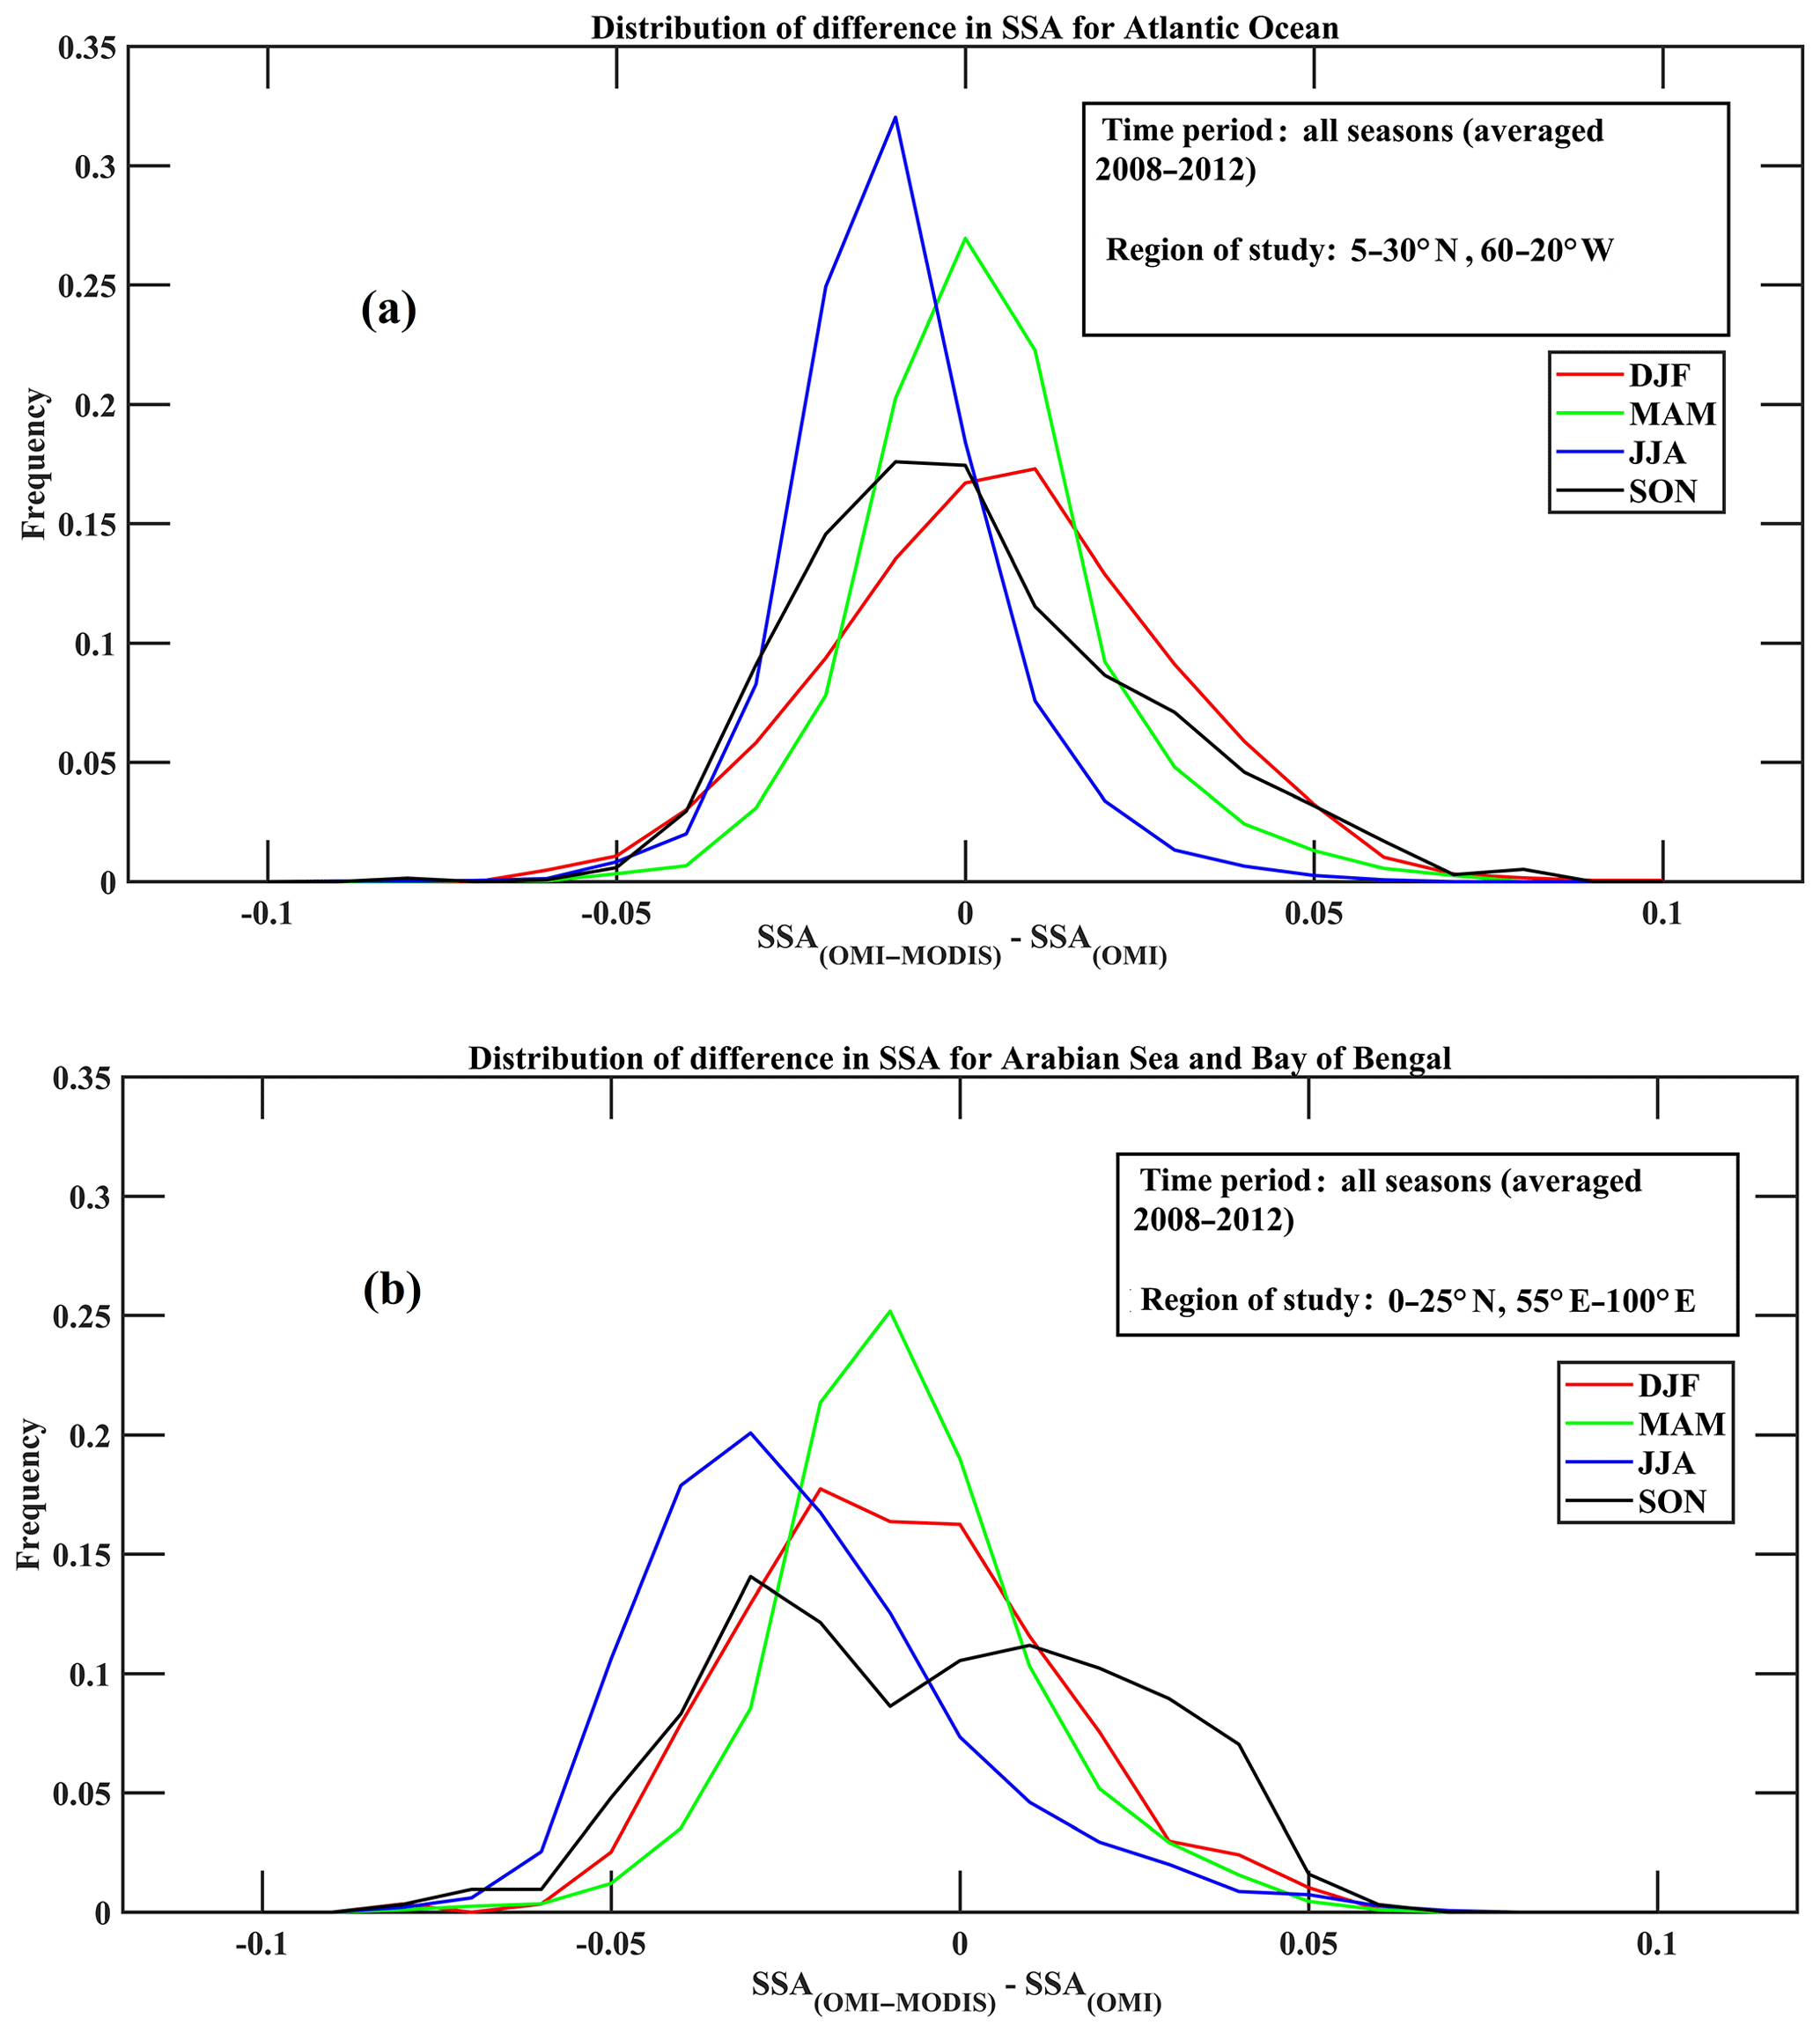
Figure 3Distribution of the difference in SSA for all seasons averaged over the period from 2008 to 2012 over (a) the Atlantic and (b) the Arabian Sea and the Bay of Bengal. It can be seen that 80 % of the difference in SSA retrievals was within the ±0.03 range over the Atlantic Ocean, whereas over the Arabian Sea and Bay of Bengal the retrievals agreed well during the MAM season when the region was influenced by dust.
Over the tropical Atlantic Ocean, ΔSSA was found within ±0.03 more than 80 % of the time during all the seasons. Over the Arabian Sea and the Bay of Bengal, the values of SSA matched within ±0.03 during MAM when dust was present in large quantities over the region. However, ΔSSA has values lower than −0.03 especially during the JJA and SON seasons. In their analysis, Satheesh et al. (2009) showed that the reason for the discrepancies during non-dust seasons could be due to the incorrect assumption of ALH or the incorrect assumption of the aerosol model. Before understanding the role of ALH in the SSA retrieval, the meteorological conditions of the ARBOB region (the Arabian Sea and the Bay of Bengal, separately), are studied for different seasons and trajectory analysis is carried out. This helps with identifying major sources of aerosols during each season.
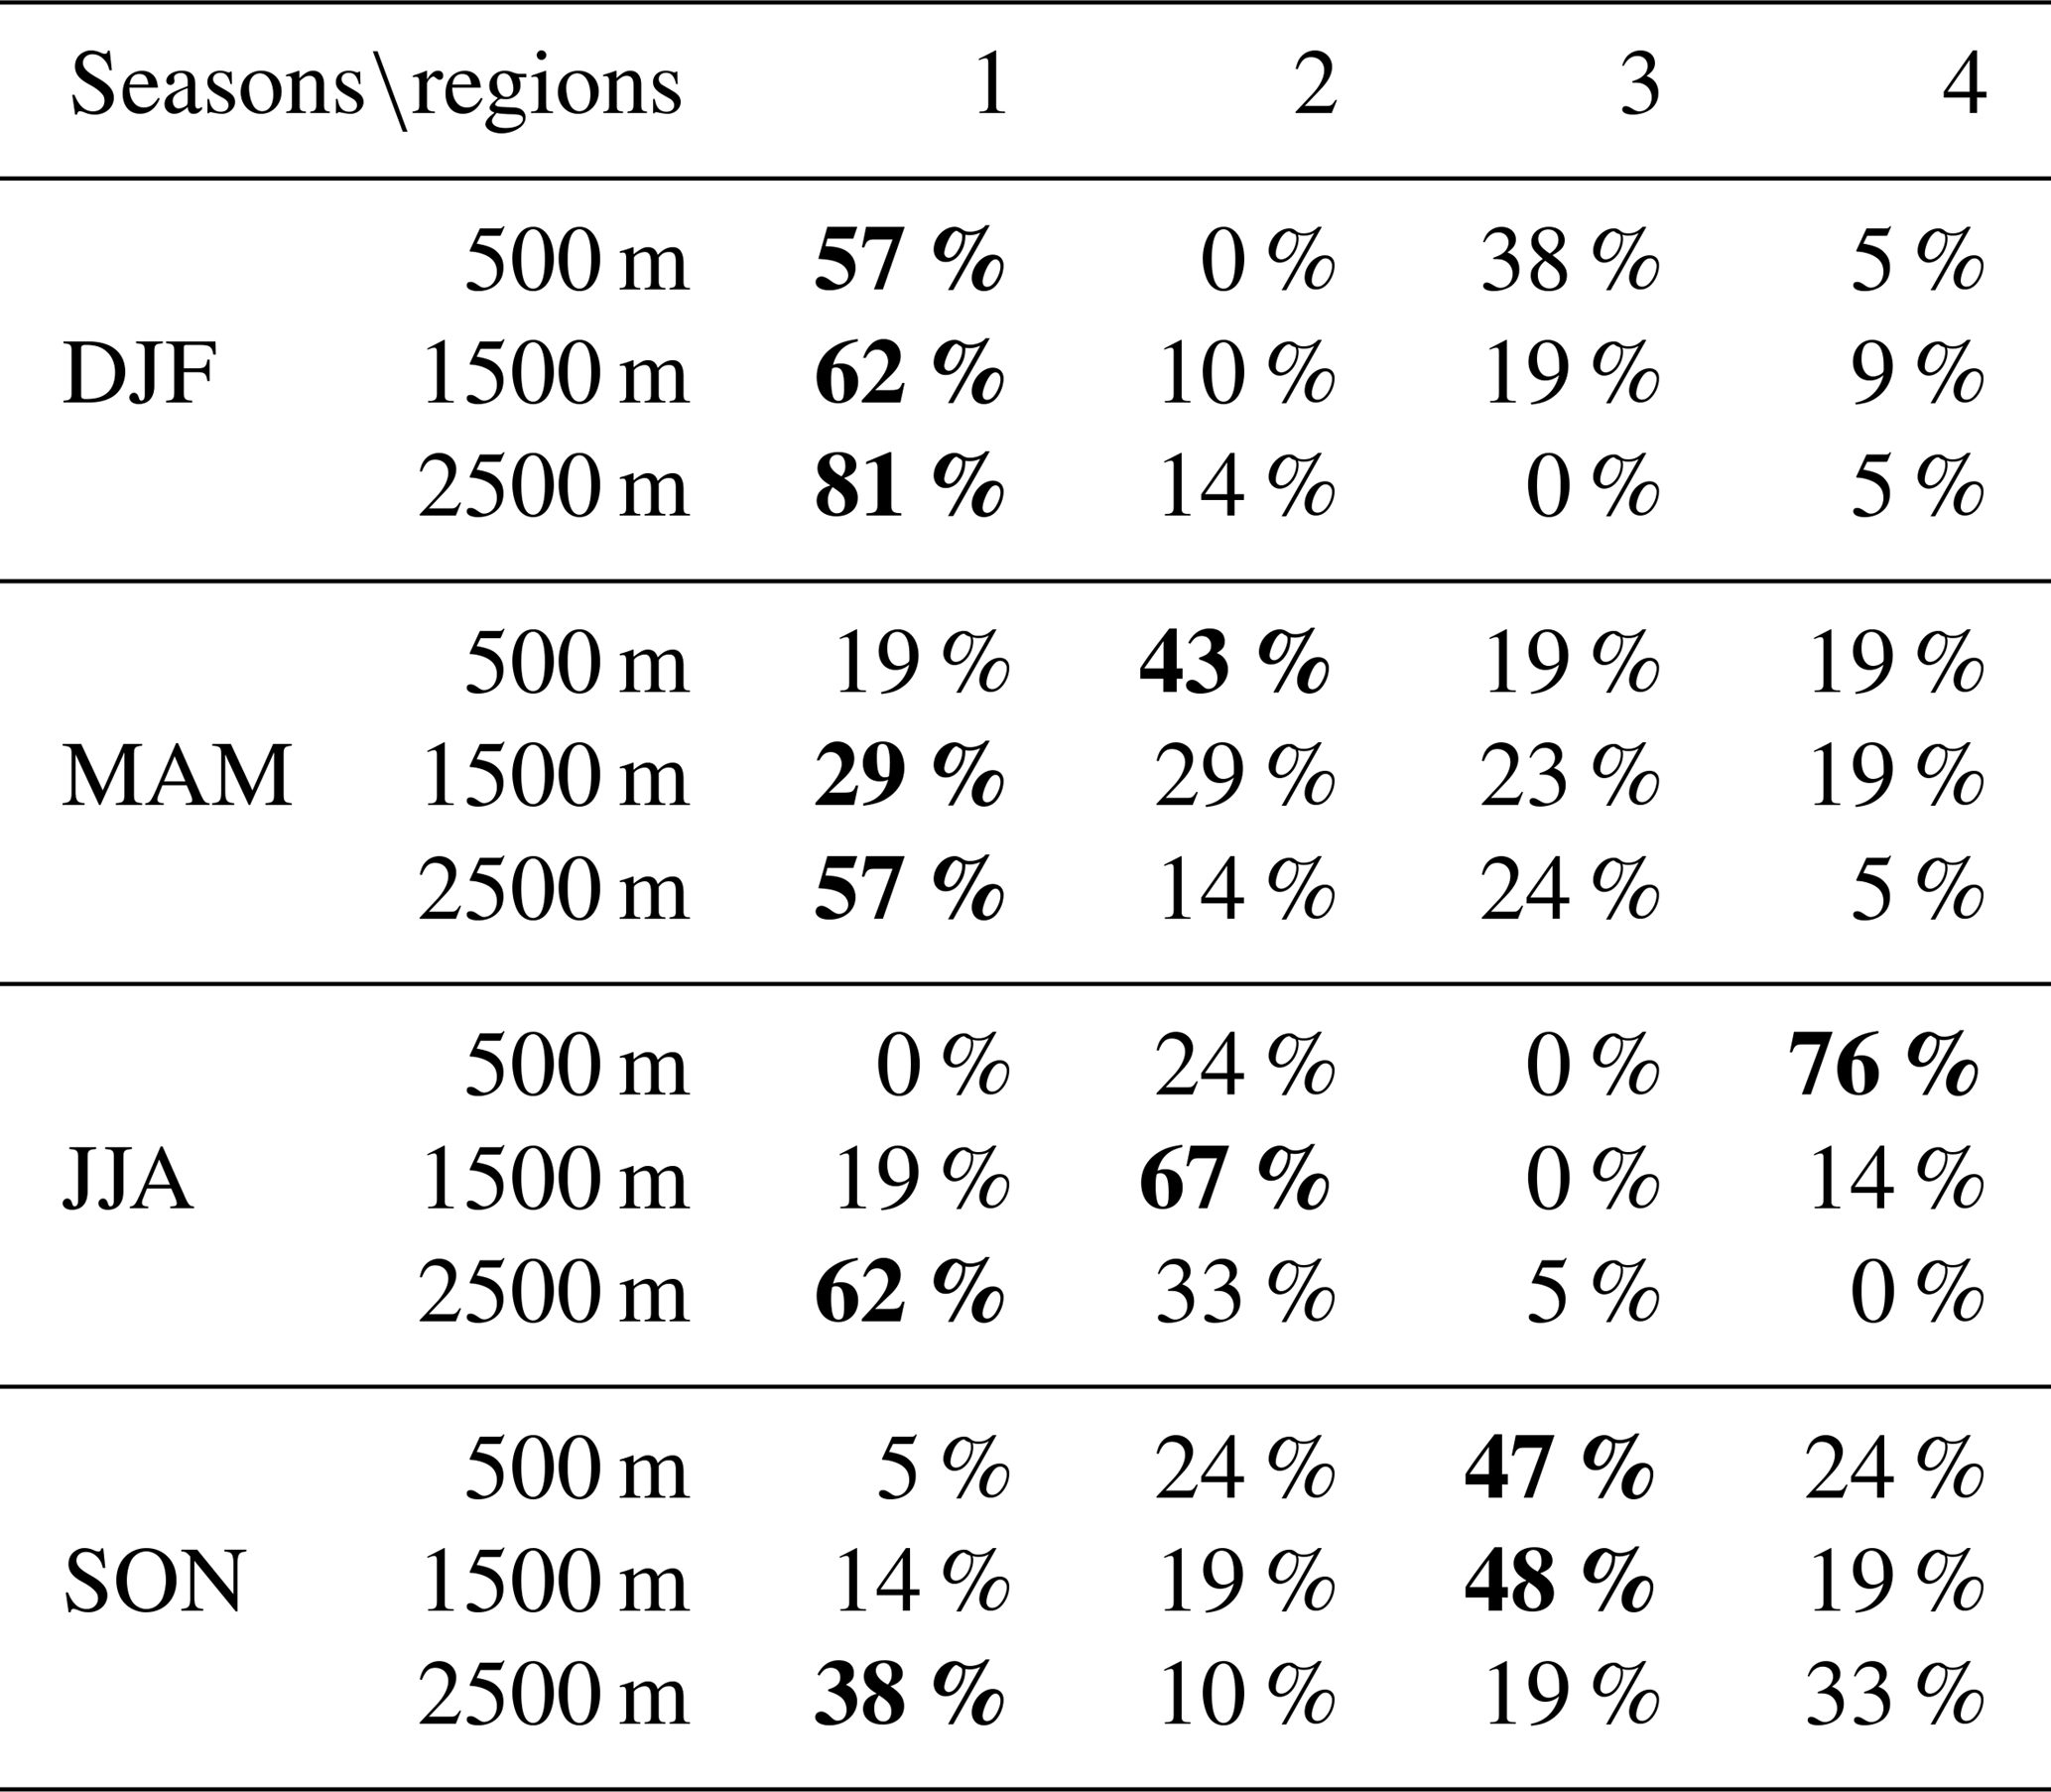
Table 2Influence of various aerosol sources over the Arabian Sea given as a percentage of trajectories originating from each source respectively. The maximum influence is given in bold. The different source regions are explained in text and in Fig. 4.
5.2 Trajectory analysis
The Arabian Sea and the Bay of Bengal (ARBOB)
The Arabian Sea and the Bay of Bengal are oceanic regions on the west and east coast of India respectively. Both regions are influenced by various types of aerosols during different seasons. The Arabian Sea has been dominated by dust aerosols and is influenced by high levels of dust during certain seasons, as seen from satellite images (Sirocko and Sarnthein, 1989). Pease et al. (1998) studied the geochemistry and the transport of various dust samples during different cruises in different seasons. During winter and summer, the pattern of aerosol transport was similar to that of the Indian monsoon pattern: north-easterly (winter) and south-westerly (summer). Thus, the major sources of aerosols were the Arabian Peninsula (including Saharan dust and the Middle East) and the Indian sub-continent in summer and winter respectively. The mean 7-day back trajectory using the HYSPLIT model from a point over the Arabian Sea (15∘ N, 65∘ E) was performed for each season of 2010 and at three different heights (500, 1500 and 2500 m a.m.s.l. – above mean sea level). The Arabian Sea region was divided into four quadrants: (1) the Arabian Peninsula and northern Africa, (2) central Africa, (3) the Indian sub-continent and (4) the Indian Ocean and Southeast Asia (Fig. 4). The influence of different aerosol source regions over the Arabian Sea is given in Table 2.
Similar to Pease et al. (1998), Tindale and Pease (1999) found that the transport of aerosols near the surface followed the surface wind currents. The dust content was low near the surface during summer due to the presence of the Findlater jet, but the general dust concentrations were higher than other oceanic regions. During winter, the winds are predominantly north and northeasterly and therefore result in the transport of aerosols from India/Pakistan/Afghanistan over the Arabian Sea. However, the presence of anticyclonic circulation over the Arabian Peninsula (20∘ N, 60∘ E) results in north-westerly winds transporting dust over the Arabian Sea (Rajeev et al., 2000). The springtime (March–April–May) is the transition between the northeast and southwest monsoon. The winds become south-westerlies which result in the advection of aerosols from the open Indian Ocean or near Somalia. At higher altitudes (above the Findlater jet) dust transport occurs from the Arabian Peninsula. During summer, the southwest monsoon wind patterns carry aerosols from the southeastern/eastern Indian Ocean (mainly sea salt). As the altitude increases, the wind patterns change a little due to aerosols coming from the southwest Indian Ocean/Somalia. Above the Findlater jet, as explained by Tindale and Pease (1999), dust transport occurs from the Arabian Peninsula (Table 2).
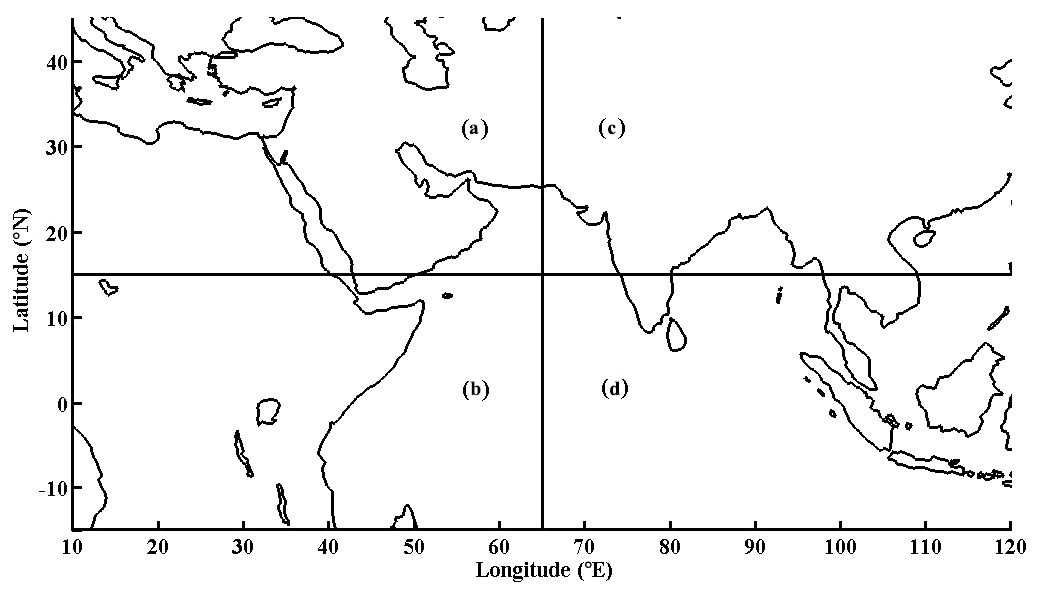
Figure 4Regions representing the various aerosol sources for a point over the Arabian Sea. (a) the Arabian Peninsula and northern Africa, (b) central Africa, (c) the Indian sub-continent and (d) the Indian Ocean and Southeast Asia.
As the area is an integral part of the Indian summer monsoon, studies over the Bay of Bengal are important especially the role of aerosols in local climate change. While the Arabian Sea is dominated by dust and oceanic aerosols, studies have shown that the Bay of Bengal is influenced by various air masses associated with the Asian monsoon system including those of anthropogenic origin (Krishnamurti et al., 1998). The synoptic meteorological conditions over the Bay of Bengal have been studied in detail by Moorthy et al. (2003) and Satheesh et al. (2006). Similar to the other two regions, mean 7-day back trajectory analysis from a point over (15∘ N, 90∘ N) was performed for each season of 2010 and at three different heights (500, 1500 and 2500 m a.m.s.l.). The four quadrants representing the various aerosol source regions are (1) the Indian/Arabian Peninsula, (2) the Indian Ocean, (3) north/northeastern India and East Asia and (4) Southeast Asia (Fig. 5). Table 3 represents the influence of aerosol source regions over the Bay of Bengal.
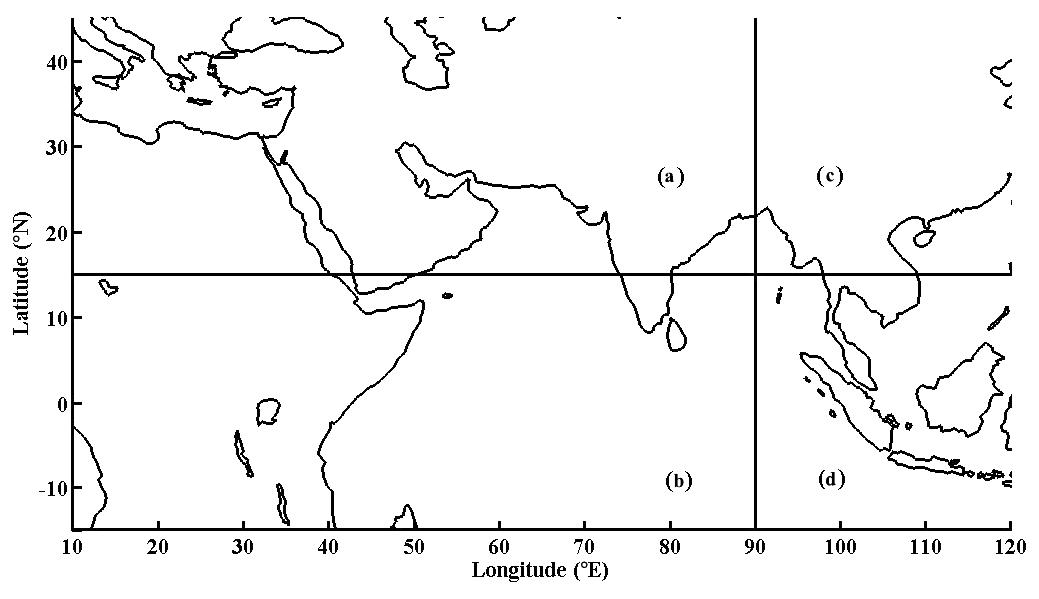
Figure 5Regions representing the various aerosol sources for a point over the Bay of Bengal. (a) the India/Arabian Peninsula, (b) the Indian Ocean, (c) northern/northeastern India and East Asia and (d) Southeast Asia.
Table 3The influence of various aerosol sources over the Bay of Bengal given as a percentage of the trajectories originating from each source respectively. The maximum influence is given in bold. The different source regions are explained in the text and in Fig. 5.
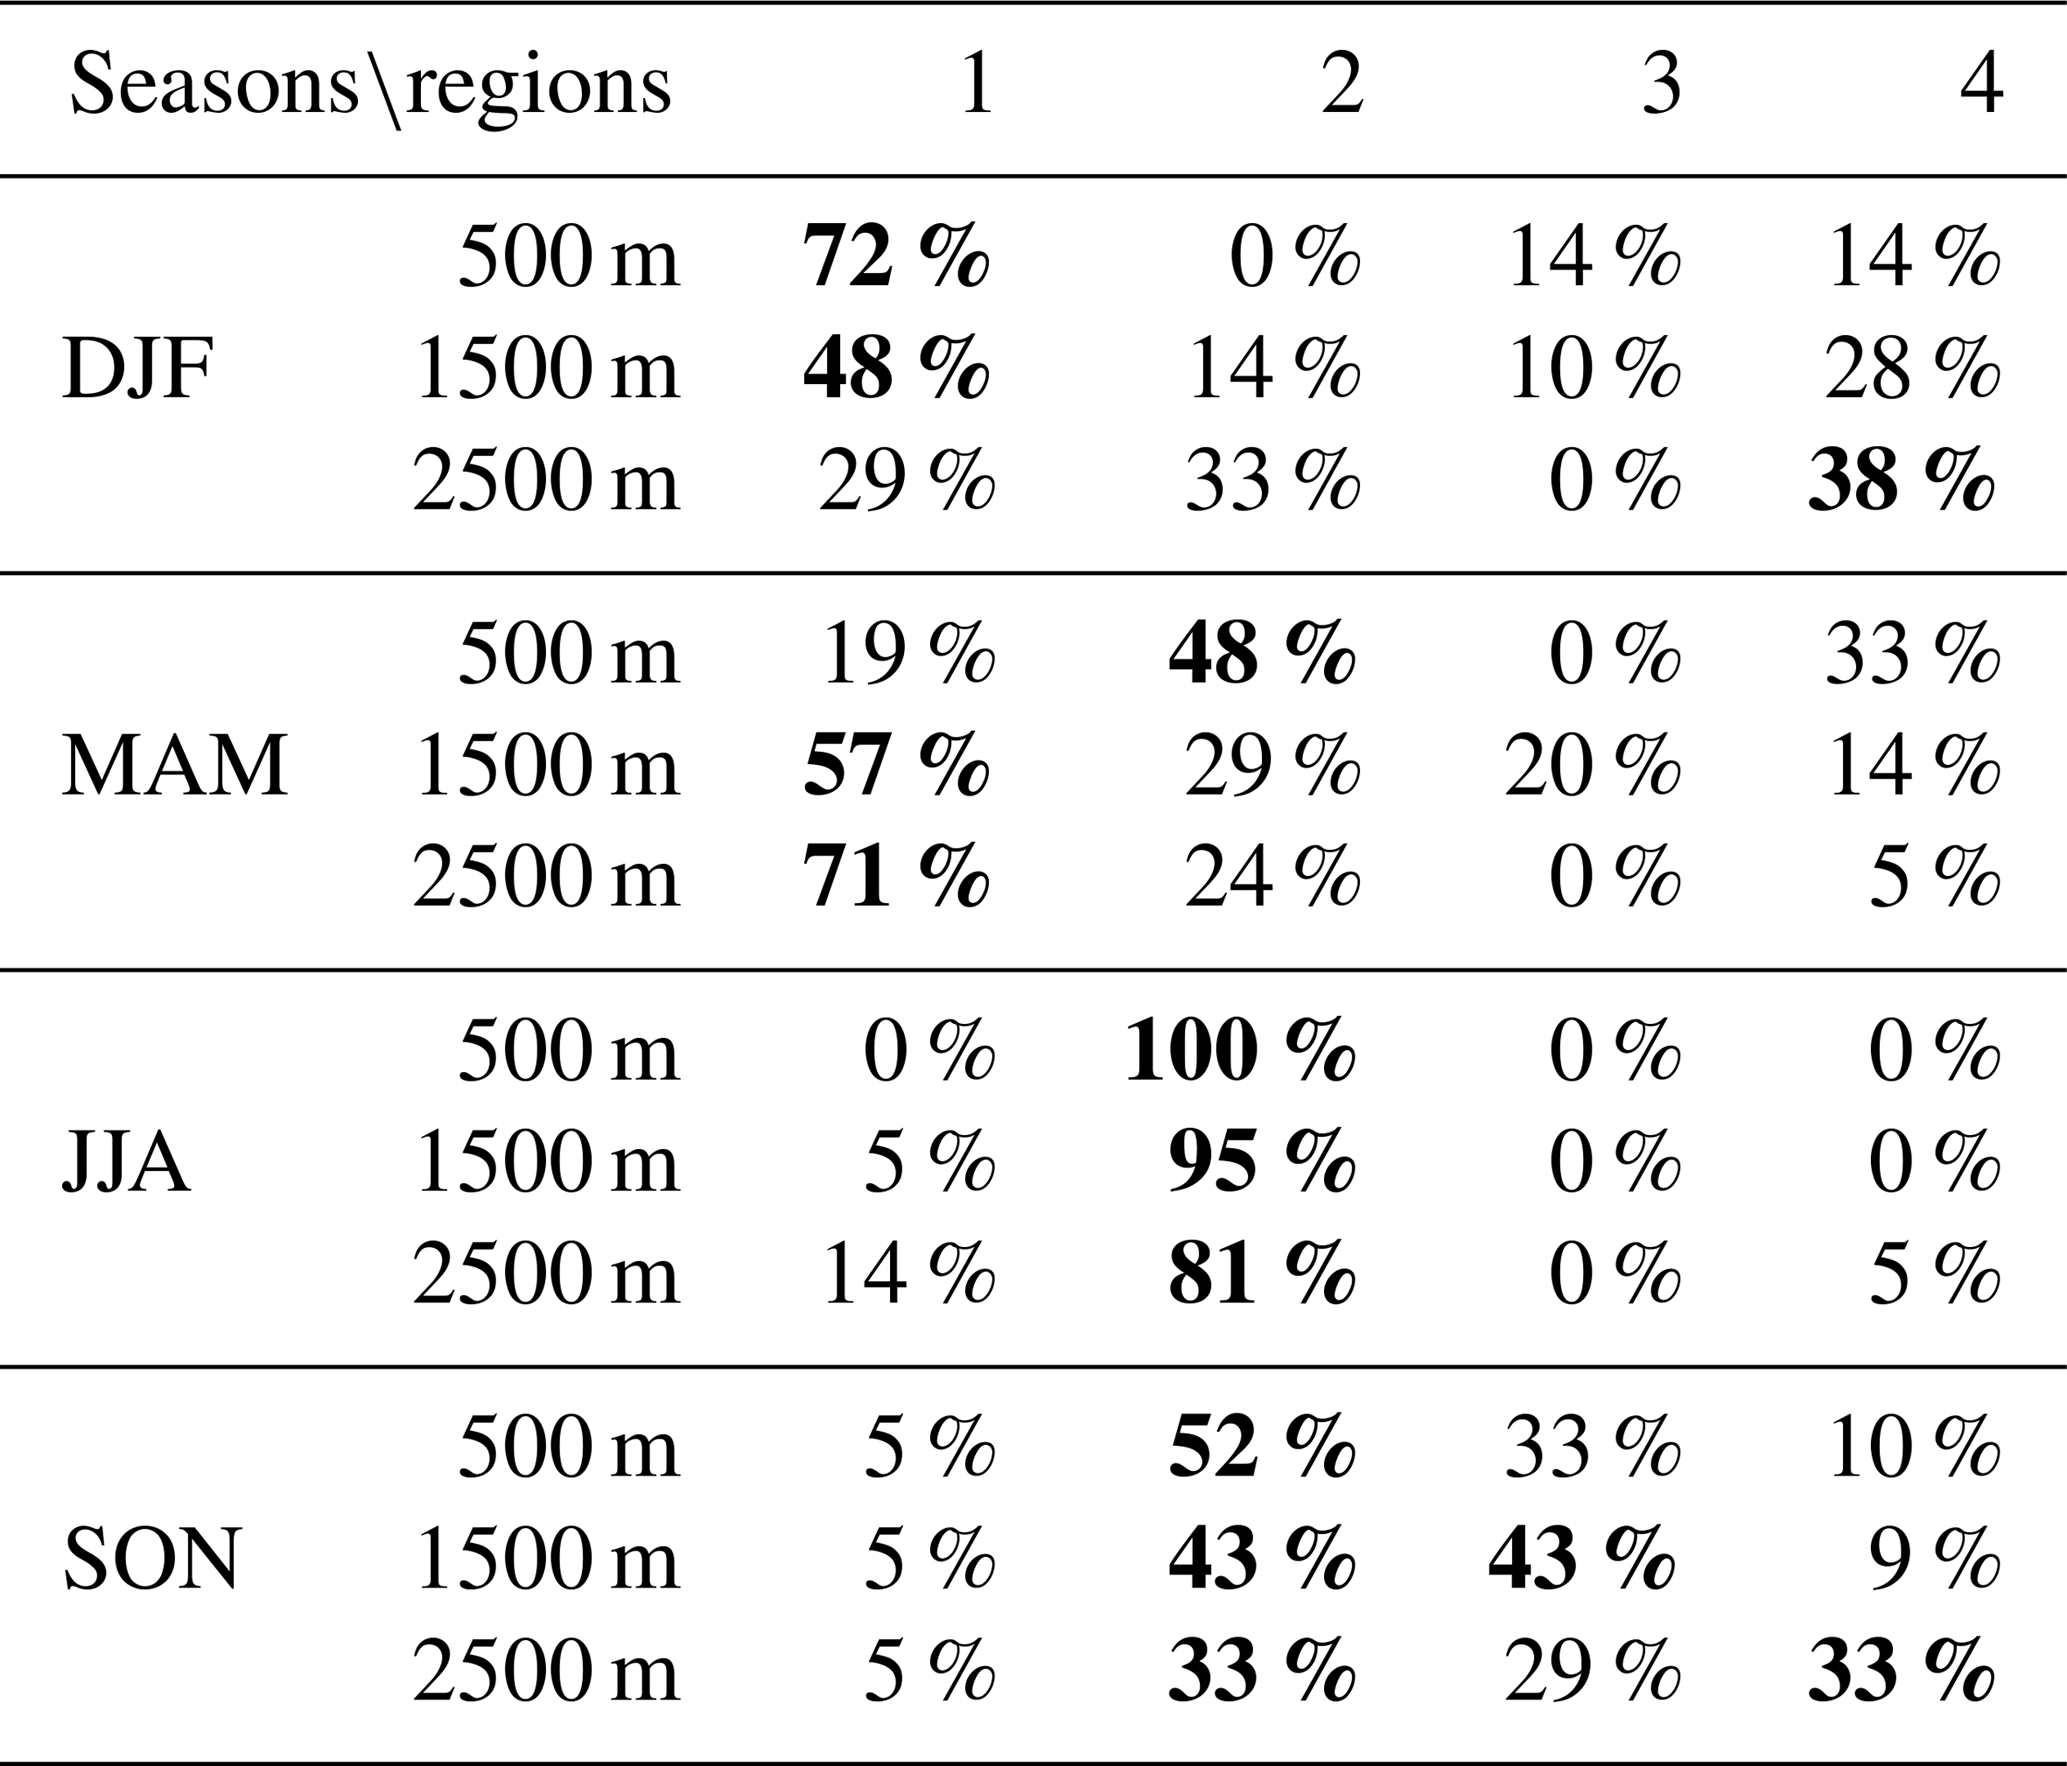
The north-westerly winds occur from west to east in the Indo-Gangetic Plain (IGP), and due to subsidence, the aerosols are trapped in the east during winter (Dey and Di Girolamo, 2010; Di Girolamo et al., 2004). The IGP, with its dense population and large number of industries, acts as a source for anthropogenic aerosols which are transported to the Bay of Bengal during winter (Kumar et al., 2013). Along with mineral dust from the Arabian Peninsula, biomass aerosols from Southeast Asia are also transported to the area. Field experiments like ICARB (Moorthy et al., 2008) during the springtime (pre-monsoon) have shown the transport of aerosols from the Arabian Peninsula in addition to the presence of elevated aerosols (anthropogenic and natural) over the Bay of Bengal (Satheesh et al., 2008). The post-monsoon season acts as a transition from the summer to the winter monsoon. The winds during September are still south-westerlies, and during October weak westerlies are present (Lawrence and Lelieveld, 2010). This results in the transportation of aerosols from the Indian Ocean and the Arabian Sea. Thus, in Table 3 it can be seen that both anthropogenic aerosols (from the IGP and Southeast Asia) and natural aerosols (marine and dust) are present over the Bay of Bengal during different seasons.
5.3 The role of the ALH in SSA retrieval
Satheesh et al. (2009) devised a new algorithm to improve the retrieval of SSA using combined OMI and MODIS data. They used MODIS-predicted UV AOD as the input to improve the original OMI algorithm, which was constrained by the assumption of ALH. Over the Atlantic, they found that the AOD values retrieved from both algorithms agreed within ±0.1 on average. However, over the Arabian Sea OMI AOD and MODIS AOD only agreed when there was a considerable loading of dust (especially during the March–April–May season); this suggests that during other seasons, the assumption of aerosol height could be wrong. Satheesh et al. (2009) also found that the ALH derived from the OMI–MODIS algorithm agreed well with aircraft measurements when compared to OMI SSA retrieval over the Arabian Sea. In the current work, the ALH provide by OMI is the mean climatological height (Sect. 2.1). For OMI–MODIS the ALH is estimated from OMI AOD values (at five different heights) by linear interpolation using AOD388 as a reference (Sect. 4). The difference in ALH between OMI–MODIS and OMI was plotted against the difference in SSA over the Arabian Sea and the Bay of Bengal (Fig. 6a). The colour bar represents the ALH estimated by the OMI–MODIS algorithm. The most important observation from this analysis was that OMI overestimated SSA when it overestimated the ALH (compared with OMI–MODIS) and vice versa. It was shown by Gassó and Torres (2016) that when the actual aerosol height measured by satellite lidar was 1.5 km more than the climatological or assumed height, OMI retrieved higher SSA; this can be seen from Fig. 6a, where the blue circles represent the height estimated by OMI–MODIS between the surface and ∼2 km. In this range, it is noted that the height assumed by OMI is >1.5 km compared to that estimated by OMI–MODIS. Thus, OMI overestimated SSA compared with the OMI–MODIS retrieval.
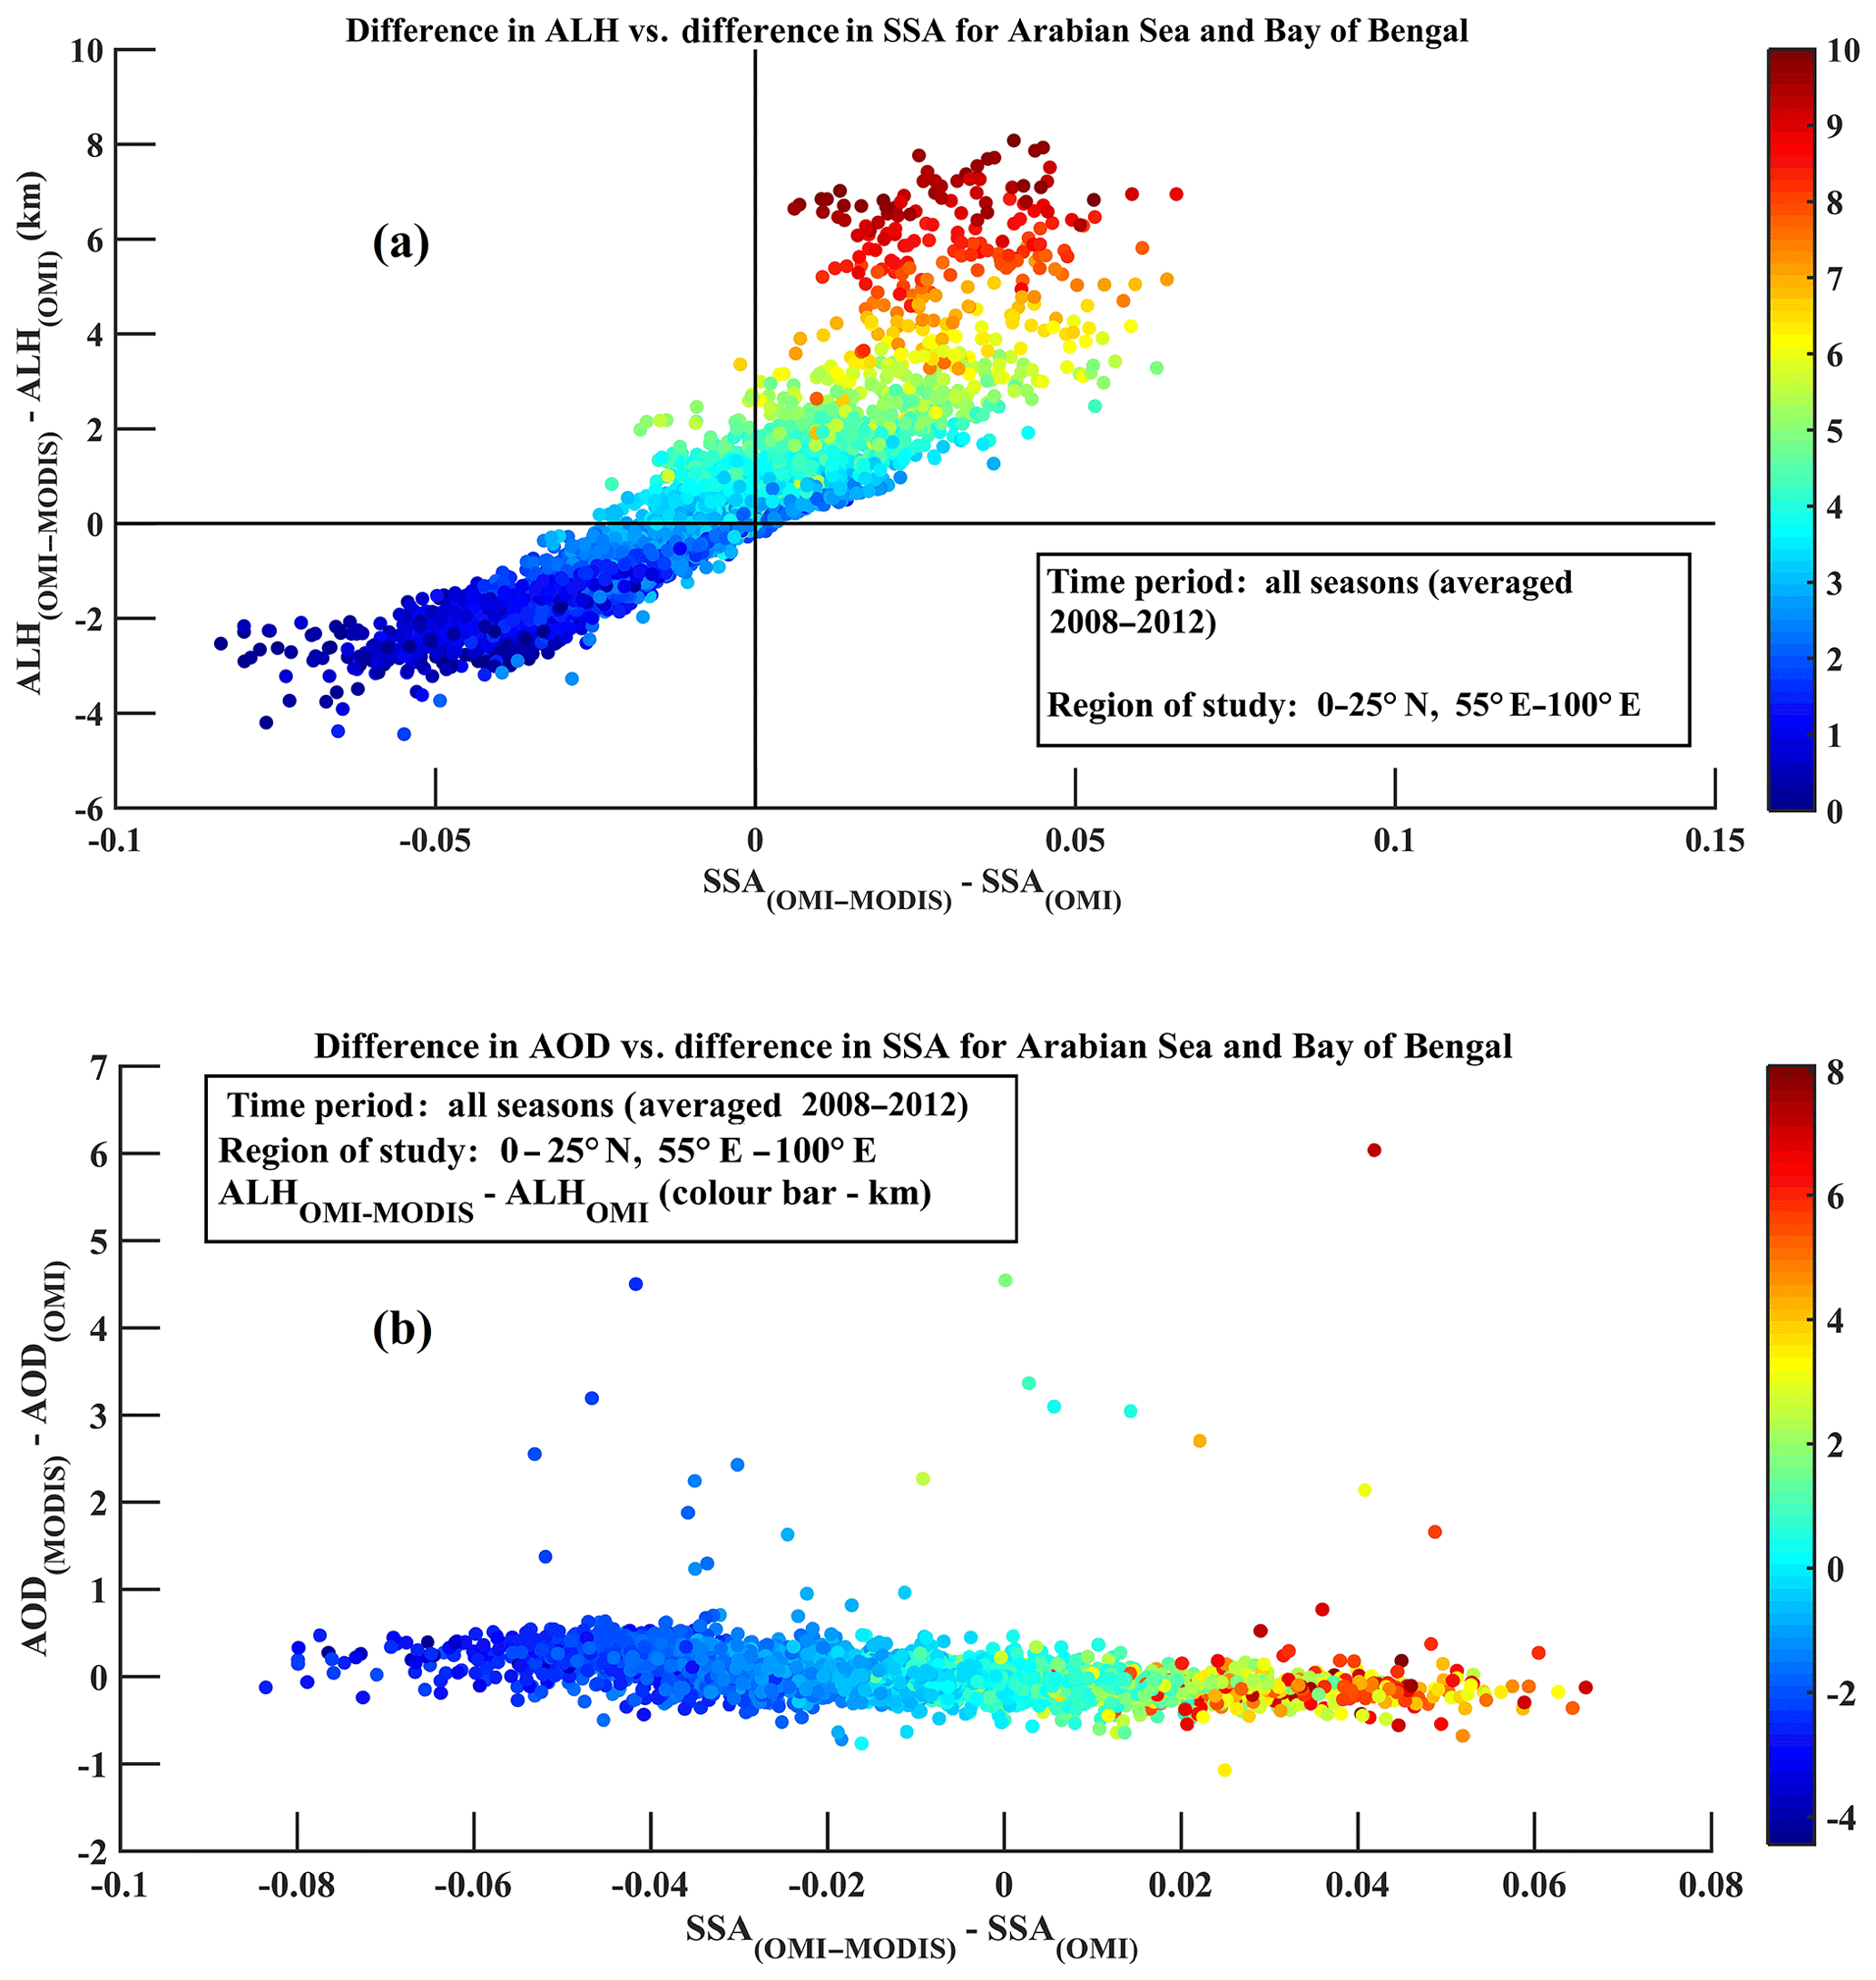
Figure 6(a) The difference in the aerosol layer height (ALH, in kilometres) between OMI–MODIS and OMI vs. the difference in SSA over the Arabian Sea and the Bay of Bengal. The colour bar represents the ALH estimated by the OMI–MODIS algorithm (in kilometres). At lower heights (dark blue circles) estimated by OMI–MODIS, OMI overestimated SSA when the ALH was overestimated and vice versa at higher heights (dark red circles) estimated by OMI–MODIS. (b) The difference in the AOD (AODMODIS–AODOMI) was plotted against the difference in SSA (SSAOMI–MODIS–SSAOMI). An inverse relationship was observed. The colour bar represents the difference in ALH (in kilometres) between OMI–MODIS and OMI.
In their detailed analysis of the OMI UV aerosol product (version 1.4.2), Gassó and Torres (2016) studied the OMI–MODIS method for two specific cases. They noted that when the extrapolated MODIS 388 nm AOD was not within the OMI LUT values, the OMI–MODIS algorithm retrieved unrealistic heights and SSA data. For the ARBOB region, the difference in the AOD (AODMODIS–AODOMI) was plotted against the difference in SSA (SSAOMI–MODIS–SSAOMI) (Fig. 6b). The colour bar represents the difference in the ALH (ALHOMI–MODIS–ALHOMI) retrieved by both of the algorithms. An inverse relation was seen, implying that when OMI underestimated AOD compared to MODIS, OMI overestimated SSA compared to OMI–MODIS. The difference in AOD was mainly within the ±0.5 range. However, there are a few points where the AOD difference was >3. Generally in such cases, the difference between the ALH and SSA estimates of both of the algorithms was high. However, there are points where the AOD difference was high and the ALH and SSA differences were within ±1 and ±0.03 respectively. Similarly, the difference between the ALH and SSA values of both of the algorithms was high when the AOD difference was within ±0.5. These discrepancies could be attributed to the AOD spectral curvature of an aerosol type assumed by MODIS which is different from the aerosol model assumed by the OMI UV aerosol product (Gassó and Torres, 2016). Whether other properties apart from AOD and shape (for dust aerosols) can affect the ALH and SSA retrievals needs to be studied in the future.
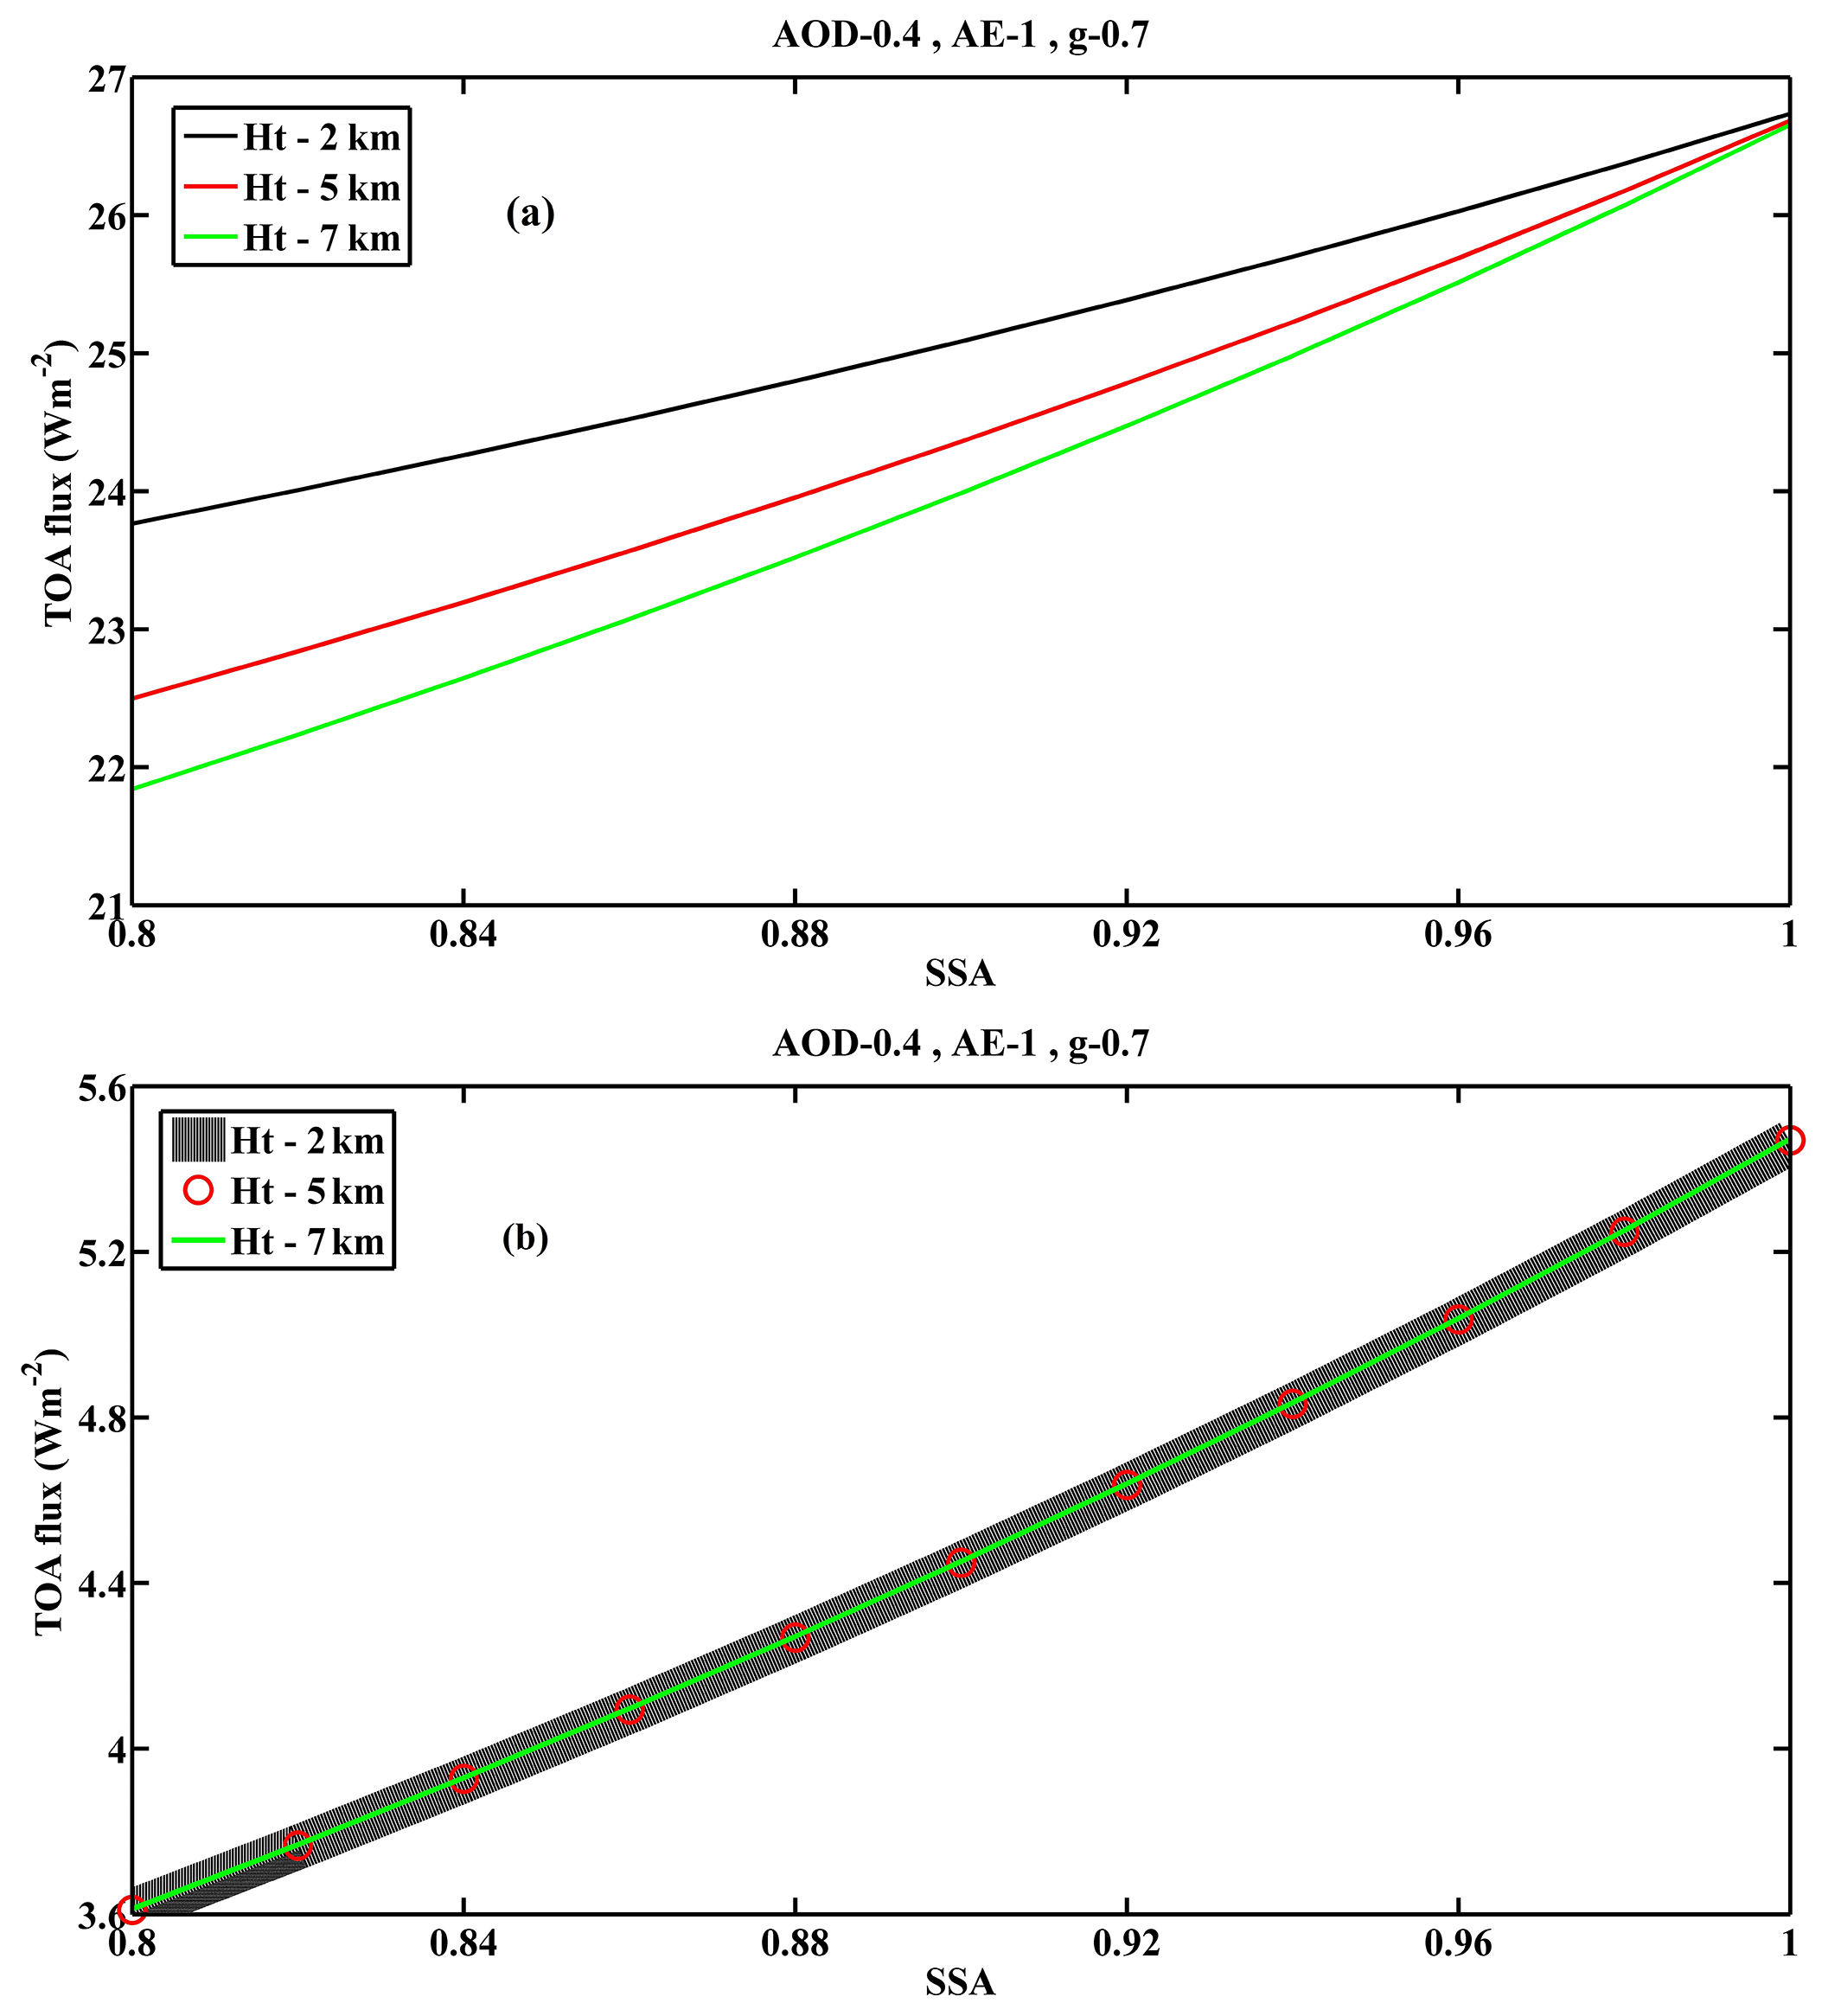
Figure 7TOA flux calculated from SBDART for different SSAs and ALHs (a) with Rayleigh scattering and (b) without Rayleigh scattering for UV wavelengths between 300 and 400 nm). Here “Ht” represents the ALH in km.
The importance of the ALH and SSA in the calculation of the TOA flux was studied using the SBDART model (Ricchiazzi et al., 1998). For the same tropical environmental variables and a surface albedo of 0.06, the SSA varied from 0.8 to 1 and the aerosol height varied from 0 to 10 km at 1 km intervals. The simulations were carried out for a narrow UV band (300–400 nm). For a constant AOD, AE (Ångström exponent) and an asymmetry factor (0.4, 1 and 0.7 respectively), the TOA flux was calculated (Fig. 7a). It can be seen that at any ALH, the TOA flux varied with SSA. The role of the ALH is important in the UV region due to the phenomena of Rayleigh scattering (Van de Hulst, 1981). The importance of Rayleigh scattering on the role of the ALH is further shown in Fig. 7b. In this particular set of simulations, the Rayleigh scattering is completely removed and all other parameters are kept the same as in Fig. 7a. It can be seen that once molecular scattering is removed, the effect of ALH is also removed and TOA flux depends only on SSA and other aerosol properties. The basis of many aerosol retrievals by satellites in the UV spectrum is the sensitivity of aerosol absorption to Rayleigh scattering which acts as a bright background and contributes to the TOA radiance (Torres et al., 1998, 2002). Change in the ALH can affect the TOA radiance as the aerosol layer will interact with the Rayleigh scattering due to molecules present in the atmosphere. However, this effect is smaller compared with the effect due to the change in AOD and SSA (Kim et al., 2018). Kim et al. (2018) also showed how the misclassification of the aerosol type and size could affect ALH retrieval. OMI SSA retrievals which are based on LUTs depend on the assumed ALH along with aerosol type. The SBDART simulations in the current work show how SSA varies with ALH for a particular TOA flux, when the other aerosol properties are kept constant.

Figure 8Comparison of SSAOMI (circles) and SSAOMI–MODIS (squares) with cruise measurements. Each point represents the mean SSA in a 2∘ box surrounding each cruise location averaged over the respective cruise time period. Due to the sparse nature of OMI–MODIS retrieval, the total number of points common to both the cruise and the satellite estimates is only 21. The solid black line is the y=x line. The dotted lines represent the ±0.03 range. The colour bar represents the cruise name and the region where the measurements were made. ICARB (Integrated Campaign for Aerosols, Gases and Radiation Budget) during the March–April–May (MAM) period in 2006; W-ICARB (winter ICARB) during the period from December to January (2008–2009); ARA (Arabian Sea); BOB (Bay of Bengal). Discrepancies between the satellite retrievals and cruise measurements were seen during the ICARB cruise when elevated aerosols were predominantly present over both of the regions and might not have been detected by the cruise measurements.
5.4 Comparison between SSA retrievals from OMI and OMI–MODIS with ship-borne estimates
To validate the new retrieval method of SSA using OMI and MODIS, both SSA values from OMI and OMI–MODIS were compared with ground-based measurements (SSA at 450 nm) during cruises in the previously mentioned 2006 and 2009 periods in the Arabian Sea and the Bay of Bengal. These cruises were part of ICARB performed from March to May 2006 and once during winter (W-ICARB) from 27 December 2008 to 30 January 2009 (Moorthy et al., 2008, 2010). During both of the cruises the aerosol sampling was carried out onboard the Oceanic Research Vessel Sagar Kanya. While the 2006 cruise covered both the Arabian Sea and the Bay of Bengal, the winter cruise of 2009 covered only the Bay of Bengal. The respective cruise tracks are provided in detail in Moorthy et al. (2008, 2010). The SSA values at different wavelengths were estimated from spectral values of the absorption coefficient and scattering coefficient measured using an Aethalometer (Magee Scientific AE-31, USA) and an integrating nephelometer (TSI 3563, USA) respectively. More details about the instruments and measuring techniques including the uncertainties are provided in Nair et al. (2008). However, neither of the cruises estimated SSA values in the UV spectrum. The closest wavelength at which SSA was calculated is 450 nm which was then used for comparison with the satellite retrievals of SSA (388 nm). Ground-based SSA estimates based on in situ measurements are seldom consistent with columnar satellite retrievals especially when elevated aerosols are present. This uncertainty along with the uncertainty that goes along with the assumption of SSA being uniform between 388 and 450 nm implies that the current comparison study cannot be used as a validation study. Instead, it is used to understand the consistency of SSA retrievals from satellites with ground-based observations. As the cruise measurements had little spacial coverage, a 2∘ box was used around each location for better coverage within which the mean SSA was calculated for the respective cruise period. These values are plotted in Fig. 8, where circle and square markers represent the OMI and OMI–MODIS comparison respectively. It can be seen that despite using a 2∘ box, the number of points with valid SSA values for the cruise and the satellite retrievals was only 21. This number increased as the size of the box around each cruise location was increased. The low number is due to the sparse nature of the OMI–MODIS retrievals over the region (Fig. 1b). The colour scale represents the cruise and the region where the aerosol sampling was undertaken.
The presence of elevated aerosols at a height of ∼1–3 km during ICARB has been shown in earlier studies (Satheesh et al., 2008; Nair et al., 2009). In such cases, comparison between a ship-based aerosol retrieval, which detects aerosols close to the surface, and the SSA retrieval from satellites, which detects these elevated aerosols, cannot be considered appropriate. This discrepancy is seen in Fig. 8, especially over the Arabian Sea (blue) and over some points over the Bay of Bengal (red). In some cases, OMI was able to retrieve SSA values that were consistent with the cruise estimated values, unlike OMI–MODIS. This could be due to the improvement of the dust model assumption in the new version of the OMI aerosol product and/or due to the incorrect spectral AOD dependence assumed by MODIS. During the winter most of the aerosols influencing the Bay of Bengal are present closer to the surface. In such cases comparing the SSA estimates can be valid. It was observed that during winter when aerosols are generally present close to the surface, OMI–MODIS retrieved SSA which was a bit more consistent with the ship estimates compared with OMI. In such cases, OMI still overestimated SSA despite the improvement in the algorithm. The respective RMSEs for the OMI and OMI–MODIS comparison with the cruise estimates were 0.05 and 0.06. Due to the lack of common points, the correlation was also poor (OMI–MODIS was 0.11 and OMI was −0.35).
The OMI–MODIS approach to SSA retrieval is one of the many combinations of sensors that can be used to retrieving aerosol properties. A better approach involving the vertical distribution of aerosols either from space- or ground-based observations is required to further reduce the uncertainty. However, with few ground-based measurements in the UV regime especially over the oceans and fewer retrievals of the vertical aerosol absorption, validation of new algorithms is still in the nascent stage.
Aerosol forcing depends on aerosol properties such as the AOD and SSA. SSA is highly sensitive to the aerosol composition, size and the wavelength at which the aerosol interacts with radiation. A slight change in the SSA value can alter the sign of the forcing. Hence, it is important to have an accurate measurement of SSA globally. OMI retrieves SSA in the UV spectrum; however, these retrievals might be affected by cloud contamination due to the coarser 13 km × 24 km pixel resolution and are also sensitive to the assumption of the ALH in the inversion procedure. In addition to these problems, uncertainty in the surface albedo is a source of error for SSA retrievals. To resolve the issue of sub-pixel cloud contamination, Satheesh et al. (2009) developed a method using the combination of OMI and MODIS retrievals at a local scale. In the present study, we used this method to retrieve SSA at much larger spatial and temporal scales. The main findings from our study are listed below:
-
Both OMI and OMI–MODIS algorithms retrieved SSA over regions influenced by large amounts of aerosols with moderate to high absorption capacity (e.g. the Atlantic Ocean – ATL; the Arabian Sea and the Bay of Bengal – ARBOB).
-
The difference in SSA retrievals of both the algorithms (ΔSSA) was found to be within ±0.03 over the ATL more than 80 % of the time during all seasons. Over the Arabian Sea, as seen in Satheesh et al. (2009), ΔSSA was within the ±0.03 range during MAM when the region was influenced by dust. The discrepancy during other seasons was due to the incorrect assumption of the ALH by OMI. The discrepancy in SSA could also be partly attributed to the sub-pixel cloud contamination during the summer monsoon season.
-
In Fig. 6a it can be seen that OMI overestimated SSA when it overestimated the ALH and vice versa. This could be attributed to the incorrect assumption of the aerosol height. Figure 6b shows that the difference in the AOD and the difference in the SSA have an inverse relationship. Further analysis on whether other factors apart from ALH and aerosol shape can affect SSA retrieval is needed.
-
Both SSA retrievals were compared with cruise data from ICARB and W-ICARB in the Arabian Sea and the Bay of Bengal.
-
While both the algorithms did not match the cruise estimate during most of the dust season due to the presence of elevated aerosols not sampled by the surface instruments, in a few cases during ICARB, OMI performed better than OMI–MODIS. This could be due to the better assumption of dust model in the algorithm and/or an incorrect model assumption by MODIS. During winter, when the aerosols were present closer to the surface, OMI–MODIS was a bit more consistent than OMI. This may be due to scenarios where the CALIPSO climatology was absent and OMI used its previous aerosol model assumptions. This could also be due to uncertainties in the ALH value even after the improvement in the OMI algorithm due to the addition of CALIPSO climatology.
OMI retrieves aerosol properties at a high cloud fraction (Gassó and Torres, 2016) implying two things, either OMI is able to detect aerosols present above clouds or the OMI pixel was prone to cloud contamination. In their study, Gassó and Torres (2016) observed that while the MODIS cloud fraction could be used to screen out cloudy pixels in OMI, it could not be the lone criterion. While they carried this out for a single case, an analysis of a larger spatial and temporal scale is required. Aerosol type and the ALH play a vital role in the retrieval of aerosol properties. Without the assumption of aerosol type or height, OMI–MODIS provided SSA retrievals which were consistent with cruise estimates during the winter when the Bay of Bengal was influenced by anthropogenic aerosols present close to the surface. This was not the case when dust aerosols were present. This discrepancy can be attributed to the difference in the aerosol model assumption by MODIS and OMI. This comparison study had very few points for a detailed analysis. Hence, an accurate comparison and validation of such retrieval algorithms will only be possible when there are more ground-based observations available in the UV spectrum on a larger spatial and temporal scale along with vertical profiles of aerosol absorption.
The MODIS Level 2 aerosol data are available for download from the Level 1 and Atmosphere Archive and Distribution System (LAADS), Distributed Active Archive Center (DAAC), at https://ladsweb.modaps.eosdis.nasa.gov/search/order/1/MYD04_L2–61 (Levy et al., 2017). The OMI Level 2 data can be download from the NASA Earthdata search at https://search.earthdata.nasa.gov/search?q=OMAERUV_003 (Torres, 2006).
KE downloaded, prepared and performed the data analysis under the supervision of SKS and JS. All the authors contributed to the interpretation and the discussion of the analysis and the results as well as to writing the paper.
The authors declare that they have no conflict of interest.
The authors gratefully acknowledge the NOAA Air Resources Laboratory (ARL)
for the provision of the HYSPLIT transport and dispersion model used in this
publication. The authors are grateful to the NASA data and services center.
Edited by: Fangqun Yu
Reviewed by: three anonymous referees
Bergstrom, R. W., Pilewskie, P., Russell, P. B., Redemann, J., Bond, T. C., Quinn, P. K., and Sierau, B.: Spectral absorption properties of atmospheric aerosols, Atmos. Chem. Phys., 7, 5937–5943, https://doi.org/10.5194/acp-7-5937-2007, 2007.
Bond, T. C. and Bergstrom, R. W.: Light absorption by carbonaceous particles: An investigative review, Aerosol Sci. Tech., 40, 27–67, https://doi.org/10.1080/02786820500421521, 2006.
Bond, T. C. and Sun, H.: Can reducing black carbon emissions counteract global warming?, Environ. Sci. Technol., 39, 5921–5926, 2005.
Bond, T. C., Doherty, S. J., Fahey, D. W., Forster, P. M., Bernsten, T., De Angelo, B. J., Flanner, M. G., Ghan, S., Karcher, B., Koch, D., Kinne, S., Kondo, Y., Quinn, P. K., Sarofim, M. C., Schultz, M., Venkataraman, C., Zhang, H., Zhang, S., Bellouin, N., Guttikunda, S. K., Hopke, P. K., Jacobson, M. Z., Kaiser, J. W., Klimont, Z., Lohmann, U., Schwarz, J. P., Shindell, D., Storelvmo, T., Warren, S. G., and Zender, C. S.: Bounding the role of black carbon in the climate system: A scientific assessment, J. Geophys. Res., 118, 5380–5552, https://doi.org/10.1002/jgrd.50171, 2013.
Chand, D., Wood, R., Anderson, T. L., Satheesh, S. K., and Charlson, R. J.: Satellite-derived direct radiative effect of aerosols dependent on cloud cover, Nat. Geosci., 2, 181–184, https://doi.org/10.1038/ngeo437, 2009.
Chung, S. H. and Seinfeld, J. H.: Global distribution and climate forcing of carbonaceous aerosols, J. Geophys. Res., 107, 4407, https://doi.org/10.1029/2001JD001397, 2002.
Cooke, W. F. and Wilson, J. J. N.: A global black carbon aerosol model, J. Geophys. Res., 101, 19395–19410, https://doi.org/10.1029/96JD00671, 1996.
Dey, S. and Di Girolamo, L.: A climatology of aerosol optical and microphysical properties over the Indian subcontinent from 9 years (2000–2008) of Multiangle Imaging Spectroradiometer (MISR) data, J. Geophys. Res., 115, D15204, https://doi.org/10.1029/2009JD013395, 2010.
Di Girolamo, L., Bond, T. C., Bramer, D., Diner, D. J., Fettinger, F., Kahn, R. A., Mrtonchik, J. V., Ramana, M. V., Ramanathan, V., and Rasch, P. J.: Analysis of Multi-angle Imaging SpectroRadiometer (MISR) aerosol optical depths over greater India during winter 2001–2004, Geophys. Res. Lett., 31, L23115, https://doi.org/10.1029/2004GL021273, 2004.
Diner, D. J., Beckert, J. C., Reilly, T. H., Bruegge, C. J., Conel, J. E., Kahn, R. A., Martonchik, J. V., Ackerman, T. P., Davies, R., Gerstl, S. A. W., Gordon, H. R., Muller, J.-P., Myneni, R. B., Sellers, P. J., Pinty, B., and Verstraete, M. M.: Multi-angle Imaging SpectroRadiometer (MISR) instrument description and experiment overview, IEEE T. Geosci. Remote, 36, 1072–1087, https://doi.org/10.1109/36.700992, 1998.
Dubovik, O. and King, M.D.: A flexible inversion algorithm for retrieval of aerosol optical properties from Sun and sky radiance measurements, J. Geophys. Res., 105, 20673–20696, https://doi.org/10.1029/2000JD900282, 2000.
Dubovik, O., Holben, B. N., Eck, F. T., Smirnov, A., Kaufman, Y. J., King, M. D., Tanré, D., and Slutsker, I.: Variability of absorption and optical properties of key aerosol types observed in worldwide locations, J. Atmos. Sci., 59, 590–608, https://doi.org/10.1175/1520-0469(2002)059<0590:VOAAOP>2.0.CO;2, 2002.
Eck, T. F., Holben, B. N., Slutsker, I., and Setzer, A.: Measurements of irradiance attenuation and estimation of aerosol single scattering albedo for biomass burning aerosols in Amazonia, J. Geophys. Res., 103, 31865–31878, https://doi.org/10.1029/98JD00399, 1998.
Gassó, S. and Torres, O.: The role of cloud contamination, aerosol layer height and aerosol model in the assessment of the OMI near-UV retrievals over the ocean, Atmos. Meas. Tech., 9, 3031–3052, https://doi.org/10.5194/amt-9-3031-2016, 2016.
Hansen, J., Sato, M., and Ruedy, R.: Radiative forcing and climate response, J. Geophys. Res.-Atmos., 102, 6831–6864, https://doi.org/10.1029/96JD03436, 1997.
Haywood, J. M., Roberts, D. L., Slingo, A., Edwards, J. M., and Shine, K. P.: General circulation model calculations of the direct radiative forcing by anthropogenic sulphate and fossil-fuel soot aerosol, J. Climate, 10, 1562–1577, https://doi.org/10.1175/1520-0442(1997)010<1562:GCMCOT>2.0.CO;2, 1997.
Heintzenberg, J., Charlson, R. J., Clarke, A. D., Liousse, C., Ramaswamy, V., Shine, K. P., Wendish, M., and Helas, G.: Measurements and modelling of aerosol single-scattering albedo: Progress, problems and prospects, Contrib. Atmos. Phys., 70, 249–263, 1997.
Herman, B. M., Browning, R. S., and De Luisi, J. J.: Determination of the effective imaginary term of the complex refractive index of atmospheric dust by remote sensing: the diffuse-direct radiation method, J. Atmos. Sci., 32, 918–925, https://doi.org/10.1175/1520-0469(1975)032<0918:DOTEIT>2.0.CO;2, 1975.
Herman, J. R., Bhartia, P. K., Torres, O., Hsu, C., Seftor, C., and Celarier, E.: Global distribution of UV-absorbing aerosols from Nimbus 7/TOMS data, J. Geophys. Res.-Atmos., 102, 16911–16922, https://doi.org/10.1029/96JD03680, 1997.
Horvath, H.: Atmospheric light absorption – a review, Atmos. Environ. A, 27, 293–317, https://doi.org/10.1016/0960-1686(93)90104-7, 1993.
IPCC – Intergovernmental Panel on Climate Change: The physical science basis: Contribution of Working Group I to the Fifth Assessment Report of the Intergovernmental Panel on Climate Change, in: Climate Change (2013), edited by: Stocker, T. F., Qin, D., Plattner, G. K., Tignor, M., Allen, S. K., Boschung, J., Nauels, A., Xia, Y., Bex, V., and Midgley, P. M., Cambridge University, Press, Cambridge, UK and New York, NY, USA, 1535 pp., https://doi.org/10.1017/CBO9781107415324, 2013.
Jethva, H., Torres, O., and Ahn, C.: Global assessment of OMI aerosol single-scattering albedo using ground-based AERONET inversion, J. Geophys. Res.-Atmos., 119, 9020–9040, https://doi.org/10.1002/2014JD021672, 2014.
Johnson, B. T., Shine, K. P., and Forster, P. M.: The semi-direct aerosol effect: Impact of absorbing aerosols on marine stratocumulus, Q. J. Roy. Meteorol. Soc., 130, 1407–1422, https://doi.org/10.1256/qj.03.61, 2003.
Kaufman, Y. J.: Satellite sensing of aerosol absorption, J. Geophys. Res., 92, 4307–4317, https://doi.org/10.1029/JD092iD04p04307, 1987.
Kaufman, Y. J., Tanré, D., and Boucher, O.: A satellite view of aerosols in the climate system, Nature, 419, 215–223, https://doi.org/10.1038/nature01091, 2002a.
Kaufman, Y. J., Martins, J. V., Remer, L. A., Schoeberl, M. R., and Yamasoe, M. A.: Satellite retrieval of aerosol absorption over the oceans using sunglint, Geophys. Res. Lett., 29, 34-1–34-4, https://doi.org/10.1029/2002GL015403, 2002b.
Kim, S.-W., Yoon, S.-C., Jefferson, A., Won, J.-G., Dutton, E. G., Ogren, J. A., and Anderson, T. L.: Observation of enhanced water vapour in Asian dust layer and its effect on atmospheric radiative heating rates, Geophys. Res. Lett., 31, L18113, https://doi.org/10.1029/2004GL020024, 2004.
Kim, M., Kim, J., Torres, O., Ahn, C., Kim, W., Jeong, U., Go, S., Liu X., Moon, K. J., and Kim, D.-R.: Optimal Estimation-Based Algorithm to Retrieve Aerosol Optical Properties for GEMS Measurements over Asia, Remote Sens., 10, 162, https://doi.org/10.3390/rs10020162, 2018.
King, M. D.: Determination of the ground albedo and the index of absorption of atmospheric particulates by remote sensing. Part II: Application, J. Atmos. Sci., 36, 1072–1083, https://doi.org/10.1175/1520-0469(1979)036<1072:DOTGAA>2.0.CO;2, 1979.
Krishnamurti, T. N., Jha, B., Prospero, J., Jayaraman, A., and Ramanathan, V.: Aerosol and pollutant transport and their impact on radiative forcing over the tropical Indian Ocean during the January–February 1996 pre-INDOEX cruise, Tellus B, 50, 521–542, https://doi.org/10.1034/j.1600-0889.1998.00009.x, 1998.
Kumar, K. R., Sivakumar, Reddy, R. R., and Gopal, K. R.: Ship-borne measurements of columnar and surface aerosol loading over the Bay of Bengal during W-ICARB campaign: role of airmass transport. Latitudinal and Longitudinal Gradients, Aerosol Air Qual. Res., 13, 818–837, https://doi.org/10.4209/aaqr.2012.08.0225, 2013.
Lawrence, M. G. and Lelieveld, J.: Atmospheric pollutant outflow from southern Asia: a review, Atmos. Chem. Phys., 10, 11017–11096, https://doi.org/10.5194/acp-10-11017-2010, 2010.
Levy, R., Hsu, C., Sayer, A., Mattoo, S., and Lee, J.: MODIS Atmosphere L2 Aerosol Product, NASA MODIS Adaptive Processing System, Goddard Space Flight Center, https://doi.org/10.5067/MODIS/MYD04_L2.061, 2017.
Levy, R. C., Remer, L. A., Tanré, D., Kaufman, Y. J., Ichoku, C., Holben, B. N., Livingston, J. M., Russell, P. B., and Maring, H.: Evaluation of the Moderate-Resolution Imaging Spectroradiometer (MODIS) retrievals of dust aerosol over the ocean during PRIDE, J. Geophys. Res., 108, 8594, https://doi.org/10.1029/2002JD002460, 2003.
Levy, R. C., Mattoo, S., Munchak, L. A., Remer, L. A., Sayer, A. M., Patadia, F., and Hsu, N. C.: The collection 6 MODIS aerosol products over land and ocean, Atmos. Meas. Tech., 6, 2989–3034, https://doi.org/10.5194/amt-6-2989-2013, 2013.
Liao, H. and Seinfeld, J. H.: Radiative forcing by mineral dust aerosols: Sensitivity to key variables, J. Geophys. Res.-Atmos., 103, 31637–31645, https://doi.org/10.1029/1998JD200036, 1998.
Loeb, N. G. and Su, W.: Direct Aerosol Radiative Forcing Uncertainty Based on a Radiative Perturbation Analysis, J. Climate, 23, 5288–5293, https://doi.org/10.1175/2010JCLI3543.1, 2010.
Meloni, D., di Sarra, A., di Lorio, T., and Fiocco, G.: Influence of the vertical profile of Saharan dust on the visible direct radiative forcing, J. Quant. Spectrosc. Ra., 93, 397–413, https://doi.org/10.1016/j.jqsrt.2004.08.035, 2005.
Menon, S., Hansen, J., Nazarenko, L., and Luo, Y.: Climate effects of black carbon aerosols in China and India, Science, 297, 2250–2253, https://doi.org/10.1126/science.1075159, 2002.
Mishra, A. K., Koren, I., and Rudich, Y.: Effect of aerosol vertical distribution on aerosol-radiation interaction: A theoretical prospect, Heliyon, 1, e00036, https://doi.org/10.1016/j.heliyon.2015.e00036, 2015.
Moorthy, K. K., Babu, S. S., and Satheesh, S. K.: Aerosol spectral optical depths over the Bay of Bengal: role of transport, Geophys. Res. Lett., 30, 1249, https://doi.org/10.1029/2002GL016520, 2003.
Moorthy, K. K., Babu, S. S., Sunilkumar, S. V., Gupta, P. K., and Gera, B. S.: Altitude profiles of aerosol BC, derived from aircraft measurements over an inland urban location in India, Geophys. Res. Lett., 31, L22103, https://doi.org/10.1029/2004GL021336, 2004.
Moorthy, K. K., Satheesh, S. K., Babu, S. S., and Dutt, C. B. S.: Integrated campaign for aerosols, gases and radiation budget (ICARB): an overview, J. Earth Syst. Sci., 117, 243–262, https://doi.org/10.1007/s12040-008-0029-7, 2008.
Moorthy, K. K., Beegum, S. N., Babu, S. S., Smirnov, A., John, S. R., Kumar, K. R., Narasimhulu, K., Dutt, C. B. S., and Nair, V. S.: Optical and physical characteristics of Bay of Bengal aerosols during W-ICARB: spatial and vertical heterogeneities in the marine atmospheric boundary layer and in the vertical column, J. Geophys. Res., 115, D24213, https://doi.org/10.1029/2010JD014094, 2010.
Moosmuller, H., Chakrabarty, R. K., and Arnott, W. P.: Aerosol light absorption and its measurement: A review, J. Quant. Spectrosc. Ra., 110, 844–878, https://doi.org/10.1016/j.jqsrt.2009.02.035, 2009.
Myhre, G., Stordal, F., Restad, K., and Isaksen, I. S. A.: Estimation of the direct radiative forcing due to sulphate and soot aerosols, Tellus B, 50, 463–477, 1998.
Nair, V. S., Babu, S. S., and Moorthy, K. K.: Spatial distribution and spectral characteristics of aerosol single scattering albedo over the Bay of Bengal inferred from shipborne measurements, Geophys. Res. Lett., 35, L10806, https://doi.org/10.1029/2008GL033687, 2008.
Nair, V. S., Moorthy, K. K., and Babu, S. S.: Optical and Physical Properties of Atmospheric Aerosols over the Bay of Bengal during ICARB, J. Atmos. Sci., 66, 2640–2658, https://doi.org/10.1175/2009JAS3032.1, 2009.
Narasimhan, D. and Satheesh, S. K.: Estimates of aerosol absorption over India using multi-satellite retrieval, Ann. Geophys., 31, 1773–1778, https://doi.org/10.5194/angeo-31-1773-2013, 2013.
Pease, P. P., Tchakerian, V. P., and Tindale, N. W.: Aerosols over the Arabian Sea: geochemistry and source areas for Aeolian desert dust, J. Arid Environ., 39, 477–496, https://doi.org/10.1006/jare.1997.0368, 1998.
Podgorny, I. A. and Ramanathan, V.: A modeling study of the direct effect of aerosols over the tropical Indian Ocean, J. Geophys. Res., 106, 24097–24105, https://doi.org/10.1029/2001JD900214, 2001.
Rajeev, K., Ramanathan, V., and Meywerk, J.: Regional aerosol distribution and its long-range transport over the Indian Ocean, J. Geophys. Res.-Atmos., 105, 2029–2043, https://doi.org/10.1029/1999JD900414, 2000.
Ramanathan, V., Crutzen, P. J., Kiehl, J. T., and Rosenfield, D.: Aerosols, climate and the hydrological cycle, Science, 294, 2119–2124, https://doi.org/10.1126/science.1064034, 2001.
Remer, L. A., Kaufman, Y. J., Tanré, D., Mattoo, S., Chu, D. A., Martins, J. V., Li, R. R., Ichoku, C., Levy, R. C., Kleidman, R. G., Eck, T. F., Vermote, E., and Holben, B. N.: The MODIS aerosol algorithm, products, and validation, J. Atmos. Sci., 62, 947–973, https://doi.org/10.1175/JAS3385.1, 2005.
Ricchiazzi, P., Yang, S., Gautier, C., and Sowle, D.: SBDART: a research and teaching software tool for plane-parallel radiative transfer in the earth's atmosphere, B. Am. Meteorol. Soc., 79, 2101–2114, https://doi.org/10.1175/1520-0477(1998)079<2101:SARATS> 2.0.CO;2, 1998.
Satheesh, S. K.: Aerosols and climate, Resonance, 7, 48–59, https://doi.org/10.1007/BF02836138, 2002.
Satheesh, S. K. and Moorthy, K. K.: Radiative effects of natural aerosols: a review, Atmos. Environ., 39, 2089–2110, https://doi.org/10.1016/j.atmosenv.2004.12.029, 2005.
Satheesh, S. K., Srinivasan, J., and Moorthy, K. K.: Spatial and temporal heterogeneity in aerosol properties and radiative forcing over Bay of Bengal: Sources and role of aerosol transport, J. Geophys. Res., 111, D08202, https://doi.org/10.1029/2005JD006374, 2006.
Satheesh, S. K., Moorthy, K. K., Babu, S. S., Vinoj, V., and Dutt, C. B. S.: Climate implications of large warming by elevated aerosol over India, Geophys. Res. Lett., 35, L19809, https://doi.org/10.1029/2008GL034944, 2008.
Satheesh, S. K., Torres, O., Remer, L. A., Babu, S. S., Vinoj, V., Eck, T. F., Kleidman, R. G., and Holben, B. N.: Improved assessment of aerosol absorption using OMI-MODIS joint retrieval, J. Geophys. Res., 114, D05209, https://doi.org/10.1029/2008JD011024, 2009.
Satheesh, S. K., Vinoj, V., and Moorthy, K. K.: Assessment of aerosol radiative impact over oceanic regions adjacent to Indian subcontinent using multi-satellite analysis, Adv. Meteorol., 2010, 139186, https://doi.org/10.1155/2010/139186, 2010.
Seinfeld, J. H. and Pandis, S. N.: Atmospheric Chemistry and Physics: From air pollution to climate change, 2nd Edn., John Wiley & Sons, Inc., Hobkoben, New Jersey, 1232 pp., 2006.
Sirocko, F. and Sarnthein, M.: Wind-borne deposits in the northwestern Indian Ocean: Record of Holocene sediments versus modern satellite data, in: Paleoclimatology and Paleometeorology: modern and past patterns of global atmospheric transport, edited by: Leinen, M. and Sarnthein, M., Kluwer Academic Publishers, Amsterdam, 401–433, 1989.
Stephens, G. L., Vane, D. G., Boain, R. J., Mace, G. G., Sassen, K., Wang, Z., Illingworth, A. J., O'Connor, E. J., Rossow, W. B., Durden, S. L., Miller, S. D., Austin, R. T., Benedetti, A., Mitrescu, C., and CloudSat Science Team: The CloudSat mission and the A-Train: A new dimension of space-based observations of clouds, precipitation, B. Am. Meteorol. Soc., 83, 1771–1790, https://doi.org/10.1175/BAMS-83-12-1771, 2002.
Tanré, D., Kaufman, Y. J., Herman, M., and Mattoo, S.: Remote sensing of aerosol properties over oceans using the MODIS/EOS spectral radiances, J. Geophys. Res., 102, 16971–16988, 1997.
Tindale, N. W. and Pease, P. P.: Aerosols over the Arabian Sea: Atmospheric transport pathways and concentrations of dust and sea salt, Deep-Sea Res. Pt. II, 46, 1577–1595, https://doi.org/10.1016/S0967-0645(99)00036-3, 1999.
Torres, O: OMI/Aura Near UV Aerosol Optical Depth and Single Scattering Albedo 1-orbit L2 Swath 13 × 24 km V003, Greenbelt, MD, USA, Goddard Earth Sciences Data and Information Services Center (GES DISC), https://doi.org/10.5067/Aura/OMI/DATA2004, 2006.
Torres, O., Bhartia, P. K., Herman, J. R., and Ahmad, Z.: Derivation of aerosol properties from satellite measurements of backscattered ultraviolet radiation. Theoretical Basis, J. Geophys. Res., 103, 17099–17110, 1998.
Torres, O., Decae, R., Veefkind, J. P., and de Leeuw, G.: OMI aerosol retrieval algorithm, in: OMI Algorithm Theoretical Basis Document: Clouds, Aerosols, and Surface UV Irradiance, 3, V2, OMIATBD-03, edited by: Stammes, P., NASA Goddard Space Flight Cent., Greenbelt, MD, 47–71, available at: https://eospso.gsfc.nasa.gov/sites/default/files/atbd/ATBD-OMI-03.pdf (last access: March 2019), 2002.
Torres, O., Bhartia, P. K., Sinyuk, A., Welton, E. J., and Holben, B.: Total Ozone Mapping Spectrometer measurements of aerosol absorption from space: Comparison to SAFARI 2000 ground-based observations, J. Geophys. Res., 110, D10S18, https://doi.org/10.1029/2004JD004611, 2005.
Torres, O., Tanskanen, A., Veihelmann, B., Ahn, C., Braak, R., Bhartia, P. K., Veefkind, P., and Levelt, P.: Aerosols and surface UV products from Ozone Monitoring Instrument observations: An overview, J. Geophys. Res., 112, D24S47, https://doi.org/10.1029/2007JD008809, 2007.
Torres, O., Ahn, C., and Chen, Z.: Improvements to the OMI near-UV aerosol algorithm using A-train CALIOP and AIRS observations, Atmos. Meas. Tech., 6, 3257–3270, https://doi.org/10.5194/amt-6-3257-2013, 2013.
Torres, O., Bhartia, P. K., Jethva, H., and Ahn, C.: Impact of the ozone monitoring instrument row anomaly on the long-term record of aerosol products, Atmos. Meas. Tech., 11, 2701–2715, https://doi.org/10.5194/amt-11-2701-2018, 2018.
Van de Hulst, H. C.: Light scattering by small particles, Dover publications, New York, 496 pp., 1981.
Wells, K. C., Martins, J. V., Remer, L. A., Kreidenweis, S. M., and Stephens, G. L.: Critical reflectance derived from MODIS: Application for the retrieval of aerosol absorption over desert regions, J. Geophys. Res., 117, D03202, https://doi.org/10.1029/2011JD016891, 2012.
Zhu, L., Martins, J. V., and Remer, L. A.: Biomass burning aerosol absorption measurements with MODIS using the critical reflectance method, J. Geophys. Res., 116, D07202, https://doi.org/10.1029/2010JD015187, 2011.