the Creative Commons Attribution 4.0 License.
the Creative Commons Attribution 4.0 License.
 | 13 Mar 2019
The two-way feedback mechanism between unfavorable meteorological conditions and cumulative aerosol pollution in various haze regions of China
Junting Zhong
Xiaoye Zhang
Yaqiang Wang
Jizhi Wang
Xiaojing Shen
Hongsheng Zhang
Tijian Wang
Zhouqing Xie
Cheng Liu
Hengde Zhang
Tianliang Zhao
Junying Sun
Shaojia Fan
Zhiqiu Gao
Yubin Li
Linlin Wang
Accompanied by unfavorable meteorological conditions with stable stratification in various haze regions of China, persistent heavy aerosol pollution episodes (HPEs) lasting more than 3 consecutive days frequently occur, particularly in winter. In the North China Plain (NCP), explosive growth of fine particulate matter smaller than 2.5 µm in diameter (PM2.5), which occurs during some HPES, is dominated by a two-way feedback mechanism between more unfavorable meteorological conditions and cumulative aerosol pollution. However, the existence of a two-way feedback mechanism such as this in other key haze regions in China is uncertain; these regions include the Guanzhong Plain (GZP), the Yangtze River Delta (YRD) region, the Two Lakes Basin (TLB; a large outflow basin connected to Hubei Province and Hunan Province), the Pearl River Delta (PRD) region, the Sichuan Basin (SB), and the Northeast China Plain (NeCP). In this study, using surface PM2.5 and radiation observations, radiosonde observations, and reanalysis data, we observed the existence of a two-way feedback mechanism in the six abovementioned regions. In the SB, this two-way feedback mechanism is weak due to the suppression of cloudy mid-upper layers. In the more polluted NCP, the GZP, and the NeCP, the feedback is more striking than that in the YRD, the TLB, and the PRD. In these regions, the feedback of worsened meteorological conditions on PM2.5 explains 60 %–70 % of the increase in PM2.5 during the cumulative stages (CSs). For each region, the low-level cooling bias becomes increasingly substantial with increasing aerosol pollution and a closer distance to the ground surface. With PM2.5 mass concentrations greater than 400 µg m−3, the near-ground bias exceeded −4 ∘C in Beijing and reached up to approximately −4 ∘C in Xi'an; this result was caused by accumulated aerosol mass to some extent. In addition to the increase in PM2.5 caused by the two-way feedback, these regions also suffer from the regional transport of pollutants, including inter-regional transport in the GZP, trans-regional transport from the NCP to the YRD and the TLB, and southwesterly transport in the NeCP.
- Article
(22586 KB) - Full-text XML
- BibTeX
- EndNote


In China, 94 % of the total population is distributed in eastern China (Yang et al., 2016), in which aerosol pollution has drawn wide attention. In the basins and plains in eastern China, aerosol pollution episodes frequently occur in winter, and these episodes cause economic loss and have adverse effects on human health (Bai et al., 2007; Matus et al., 2012; Chen et al., 2013). For example, in January 2013, persistent heavy aerosol episodes affected 600 million people over 1.4 million km2 (http://www.infzm.com/content/95493, last access: 4 March 2019), which led to hundreds of flight cancelations and an increase in the number of reported respiratory disease cases (Ji et al., 2014). During the wintertime (i.e., December, January, and February) from 2013 to 2017, more than 28 persistent heavy aerosol pollution episodes (HPEs) that lasted for more than 3 consecutive days occurred in Beijing; the peak value of particulate matter smaller than 2.5 µm in diameter (PM2.5) ranged from ∼200 to ∼800 µg m−3, with a mean duration longer than 5 days (Zhong et al., 2018a, 2019). The main cause of frequent pollution episodes is the massive emissions of air pollutants produced by intense living and industrial activities in the basins and plains (Q. Zhang et al., 2009, 2012; Zhang et al., 2013). In addition to pollutant emissions, the relatively closed terrains of basins and plains limit the diffusion of aerosols and their precursors to the surrounding areas (Su et al., 2004; Zhu et al., 2018). Under stable meteorological conditions, aerosol pollution forms and further accumulates (Zhang et al., 2013; Zhong et al., 2017).
In winter, unfavorable meteorological conditions lead to aerosol pollution formation, and after accumulating to some extent, aerosols change the atmospheric structure by interacting with solar radiation (Boucher et al., 2013b; Zhong et al., 2018b). The details of the two-way feedback mechanism between unfavorable meteorological conditions and cumulative aerosols in Beijing are as follows: (1) when upper zonal large-scale circulations unfavorable for pollution dispersion occur, the boundary layer (BL) height decreases from ∼1500 m in clean stages to 700–800 m; under the BL, the winds shift from northerly to southerly, which transport pollutants from the south of Beijing (transport stages – TSs – in Fig. 1). Abovementioned unfavorable meteorological conditions cause aerosol pollution formation. (2) When the vertical aerosols have accumulated to a certain degree, the dominant scattering aerosols will substantially backscatter solar radiation, causing a reduction in the amount of solar radiation that reaches the surface, which causes a near-ground cooling effect through atmospheric circulation and vertical mixing (i.e., the cumulative sum of hourly surface vertical and global radiant exposure decreased by 89 % and 56 %, respectively, from clean stages to cumulative stages – CSs; Fig. 1) (Zhong et al., 2017, 2018b). With less solar radiation, near-ground temperature subsequently decreases. (3) Under slight or calm winds, the temperature reduction induces or reinforces an inversion that further weakens turbulent diffusion and results in a lower BL height, which in turn worsens aerosol pollution (during CSs in Fig. 1). (4) This condition also decreases the near-ground saturation vapor pressure and suppresses water vapor diffusion which, in turn, increases the relative humidity (RH); this increase in RH further enhances aerosol hygroscopic growth and accelerates liquid-phase and heterogeneous reactions to worsen aerosol pollution (Pilinis et al., 1989; Ervens et al., 2011; Kuang et al., 2016; Zhong et al., 2018a, b). This feedback effect of progressively unfavorable meteorological conditions aggravates PM2.5 pollution (during CSs in Fig. 1) (Zhong et al., 2017).

Figure 1Temporal variations in PM2.5, surface radiation, and vertical distributions of meteorological factors from 1 December 2016 to 10 January 2017. (a) PM2.5 mass concentration, (b) winds (vectors) and wind velocity, (c) temperature, (d) RH, and (e) direct radiant exposure (of the vertical surface to the direction of solar radiation) and global radiant exposure. (Blue lines: HPEs; green lines and orange boxes: TSs; red lines and white or red boxes: CSs; blue boxes: clean periods) (adapted from Zhong et al., 2018b).
The two-way feedback mechanism between unfavorable meteorological conditions and cumulative aerosol pollution also appears in other cities in the North China Plain, including Tangshan, Xingtai, Zhengzhou, and Nanyang (Liu et al., 2018). Whether the two-way feedback mechanism exists in other basins and plains in eastern China, which have weaker aerosol pollution than that in the North China Plain, is unclear. If such feedback exists, its magnitude requires further investigation. Currently, to the best of our knowledge, studies on the existence, magnitude, and comparison of the two-way feedback in these basins and plains are insufficient. Overall, we lack a comprehensive understanding of the feedback mechanism in China. Therefore, in this study we used surface PM2.5 mass concentrations, radiosonde observations of meteorological factors, the PLAM (Parameter Linking Air-quality to Meteorological conditions/haze) index, and ERA-Interim reanalysis data from the European Centre for Medium-Range Weather Forecasts (ECMWF) to investigate the two-way feedback mechanism in the key regions of populous eastern China (Yang et al., 2016), including the Guanzhong Plain, the Yangtze River Delta, the Two Lakes Basin, the Pearl River Delta, the Sichuan Basin, and the Northeast China Plain; these regions are densely populated and economically developed areas that include massive industrial pollution sources, agricultural pollution sources, motor vehicle pollution sources, and domestic pollution sources. In the abovementioned regions, heavy aerosol episodes often occur in the regional central cities that have denser populations and stronger pollutant emissions, including Xi'an, Nanjing, Shanghai, Wuhan, Guangzhou, Chengdu, and Shenyang. In these cities, the impact of aerosol pollution episodes on the economy, society, and health is far-reaching. Therefore, we focus on the feedback mechanism in the above cities to represent the overall conditions in the five major haze regions of China, which are as follows: (I) the Northeast China Plain; (II) the North China Plain (also known as Hua Bei Plain) and the Guanzhong Plain in northern China; (III) eastern China – comprised mainly of the Yangtze River Delta area; (V) southern China – including most areas of Guangdong and the Pearl River Delta area; and (IV) the Sichuan Basin in southwestern China (X. Y. Zhang et al., 2012) (Fig. 1).
2.1 PM2.5 observations
Since January 2013, the Ministry of Environmental Protection has been monitoring the PM2.5 mass concentrations in real time at over 1000 environmental monitoring stations established in different regions of China. In this study, we used the hourly PM2.5 mass concentrations provided by the Ministry of Environmental Protection from 1 December 2016 to 10 January 2017 and the respective averaged PM2.5 mass concentrations of all the urban stations in Xi'an, Yuncheng, Shenyang, Chengdu, Wuhan, Nanjing, Shanghai, Jinan, Guangzhou, and Qingyuan. The in situ monitoring data of the hourly concentrations of PM2.5, PM10, CO, NO2, SO2, and O3 were acquired from the national air quality real-time publishing platform (http://106.37.208.233:20035, last access: 4 March 2019).
We also used an unmanned aerial vehicle to observe the PM2.5 mass concentration at different heights at 1 km intervals every 3 h in Nanjing from 3 to 4 December 2017. The data were obtained with the CEEWA X8 UAV platform (Nanjing CEEWA Intelligent Technology Co., Ltd., Nanjing, China), a six-rotor industrial UAV carrying a highly reliable, triple-redundant FC-IU3 flight control system (Zhou et al., 2018). A multiparameter atmospheric environment detector was equipped on the platform, which was developed by Shenzhen Tengwei Measurement and Control Technology Co., Ltd., Shenzhen, China (Zhou et al., 2018). The experiment was performed on the Xianlin campus of Nanjing University. This campus is located in the eastern suburb of Nanjing and is surrounded by farmland, residential areas, and small patches of forest and chemical plants. The experimental site was located on a playground which was not surrounded by any tall structures.
2.2 Meteorological radiosonde observations
In China, 120 stations observe vertical meteorological factors using L-band sounding radars. Their accurately positioned radar systems collect reliable meteorological data each second; thus, these data have high spatial and temporal resolutions (Tao, 2006). In this study, we used the L-band sounding radar data from the meteorological stations in Xi'an, Shenyang, Chengdu, Wuhan, Nanjing, Shanghai, and Qingyuan; these stations observe several meteorological factors, including wind, temperature, and RH, twice each day at 08:00 and 20:00 BJT (Beijing time) from 1 December 2016 to 10 January 2017. The meteorological factors were analyzed in detail below a height of 3 km. The heights from the surface to 1 km, from 1 to 2 km, and from 2 to 3 km are termed low-level, mid-level, and upper-level, respectively. In addition, due to the lack of meteorological radiosonde observations in Guangzhou, we supplemented related observations from an adjacent city, Qingyuan.
2.3 Surface meteorological data
Since 2001, national weather stations have been conducting automatic hourly observations. Starting in 2001, some of the stations began to record observations at 5 or 10 min intervals. This study used the hourly meteorological observation data, including temperature, pressure, RH, wind, and visibility from the national automatic weather stations (AWS) provided by the National Meteorological Information Center of China Meteorological Administration (NMICMA). The time period of the data selected is from 1 December 2016 to 10 January 2017.
We also used an hourly radiant exposure data set of national meteorological radiation factors (V2.0) provided by the NMICMA. This data set contains 104 radiation stations, including the following: primary stations with global, direct, scattered, reflected, and net radiation; secondary stations with global and net radiation; and tertiary stations with only global radiation. These radiation stations have recorded hourly basic radiant exposure data and the corresponding station information (i.e., latitude, longitude, and altitude) since 1993. In this study, we used the global, direct, and net radiant exposure from 1 December 2016 to 10 January 2017.
2.4 PLAM data
Based on the definition and calculation formula of PLAM (Parameter Linking Air-quality to Meteorological conditions/haze; X. Y. Zhang et al., 2009; Wang et al., 2012, 2013; Zhang et al., 2015), we obtained the PLAM index values in Xi'an, Nanjing, Wuhan, Qingyuan, Chengdu, and Shenyang using surface meteorological factors. PLAM includes two separate major factors: (1) the initial meteorological conditions α(m) associated with the atmospheric condensation processes, and (2) an effective dynamic parameter associated with the initial contribution of air pollution β(c′):
This calculation mainly indicates regional atmospheric stability and air condensation ability. The details of the calculation have been presented in previous studies (Wang et al., 2012, 2013).
2.5 ECMWF ERA-Interim data
ERA-Interim is the ECMWF's latest global atmospheric reanalysis, which extends back to 1979 and continuously updates in real time (Dee et al., 2011). It is produced with a four-dimensional variational data assimilation scheme and advances forward in time using 12 h analysis cycles (Thépaut et al., 1996; Dee et al., 2011). Before assimilation, all data are subject to gross, redundancy, and background quality controls, which results in a large drop between the total number of data available and the number of data used in the assimilation. The mean daily usage rate of radiosondes is no more than 50 % over the entire period (Poli et al., 2010). In addition, although the effect of aerosols on radiative transfer in the atmosphere is modeled based on prescribed climatological aerosol distributions (Dee et al., 2011), it does not consider the two-way feedback mechanism between the cumulated aerosol pollution and deteriorating meteorological conditions (Simmons, 2006). Therefore, the magnitude of the feedback mechanism could be statistically reflected by the gaps between the ERA-Interim reanalysis and the meteorological radiosonde observations. Therefore, the disparities have been used to present the observational evidence of aerosol–planetary boundary layer interactions in Beijing (Ding et al., 2016; Ding et al., 2016).
In this study, we used ERA-Interim data with a horizontal resolution of 0.125∘ × 0.125∘. Its mandatory pressure levels include 1000, 975, 950, 925, 900, 875, 850, 825, 800, 775, 750, and 700 hPa. According to these pressure layers, we interpolated the radiosonde observations and calculated the vertical temperature differences between the ERA-Interim reanalysis and the interpolated sounding data at 20:00 BJT.
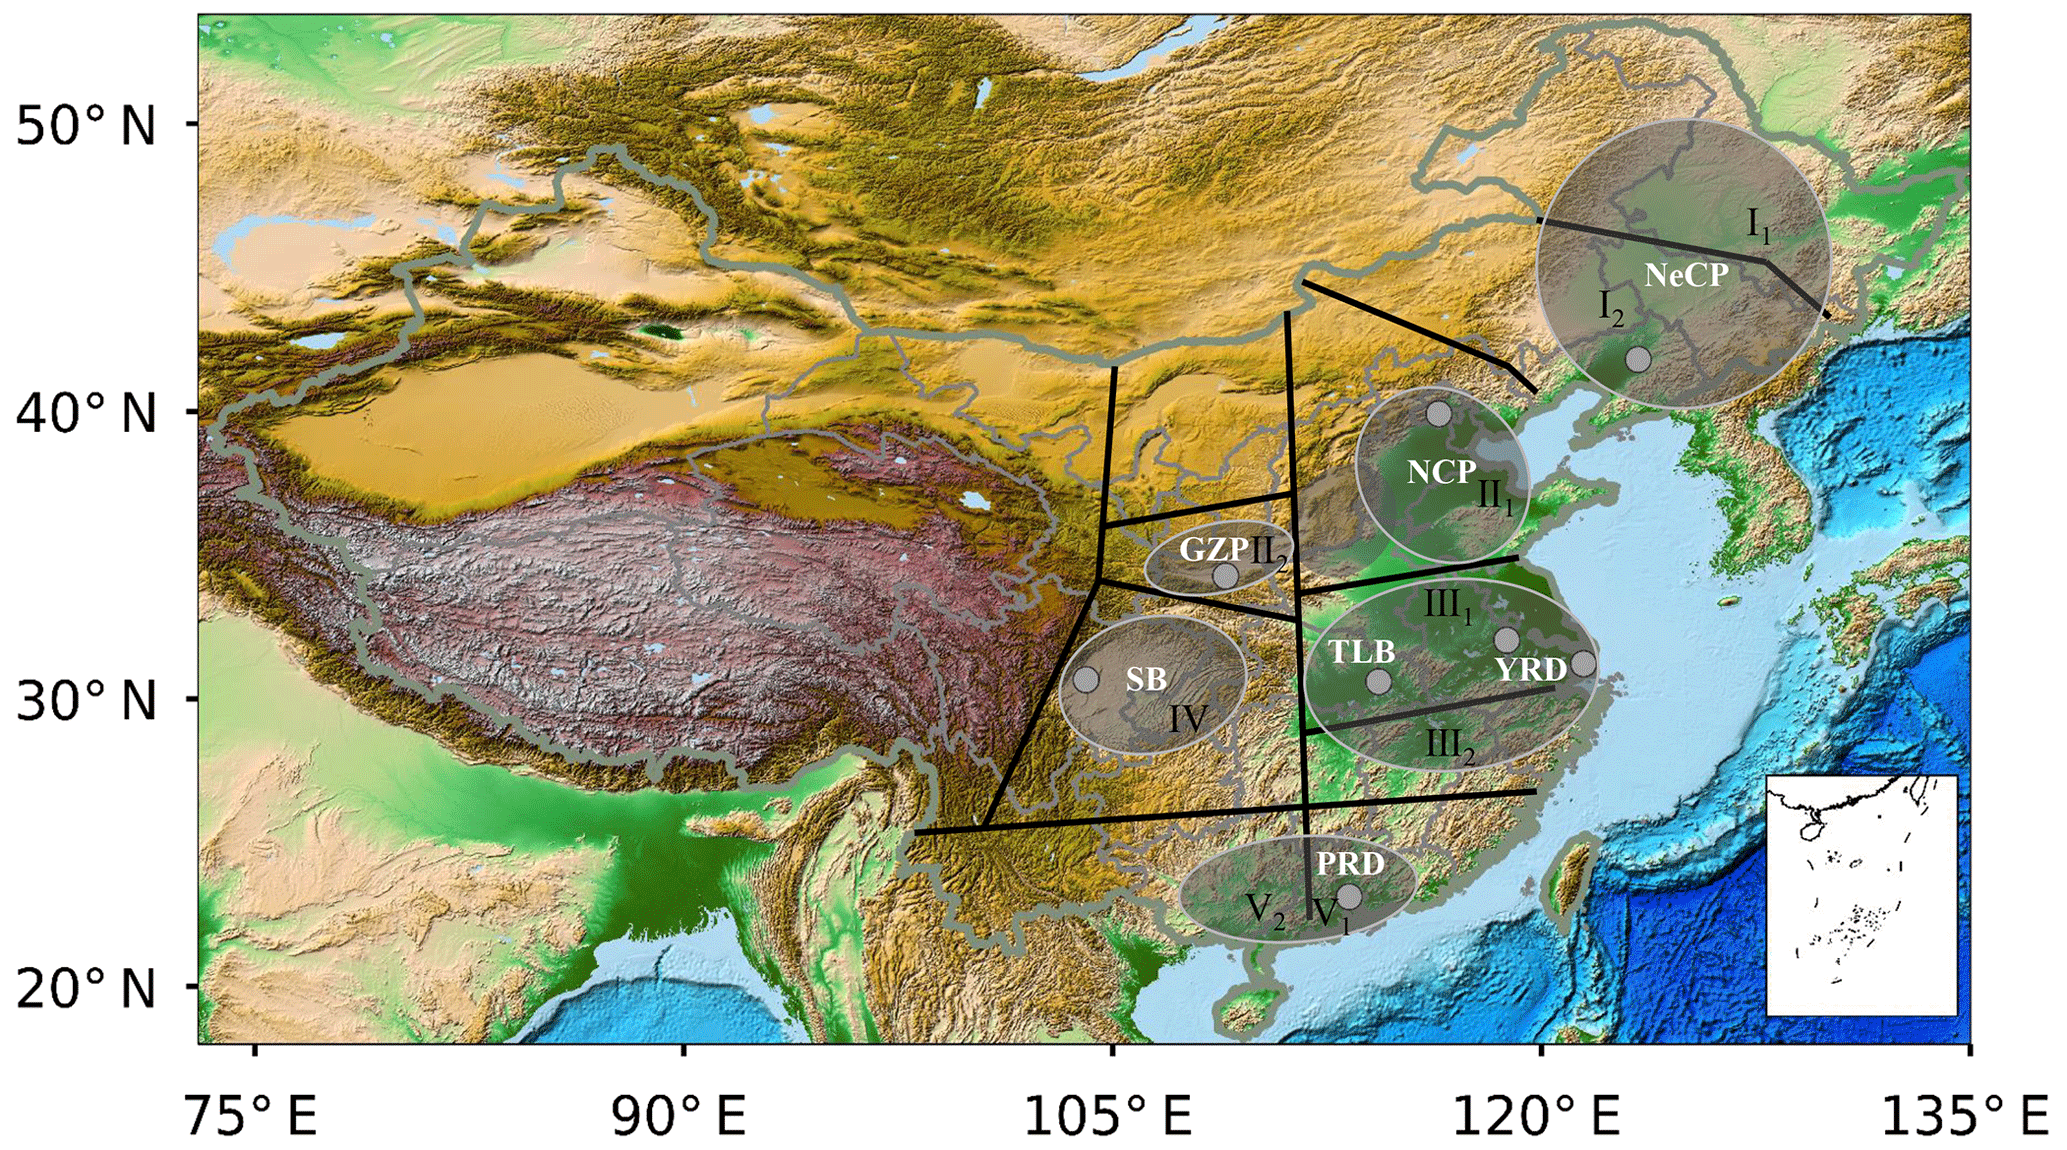
Figure 2The key haze regions in China with similar declines in visibility including the North China Plain (NCP), the Guanzhong Plain (GZP), the Yangtze River Delta (YRD) region, the Two Lakes Basin (TLB), the Pearl River Delta (PRD) region, the Sichuan Basin (SB), and the Northeast China Plain (NeCP). Grey dots represent the locations of radiosonde stations.
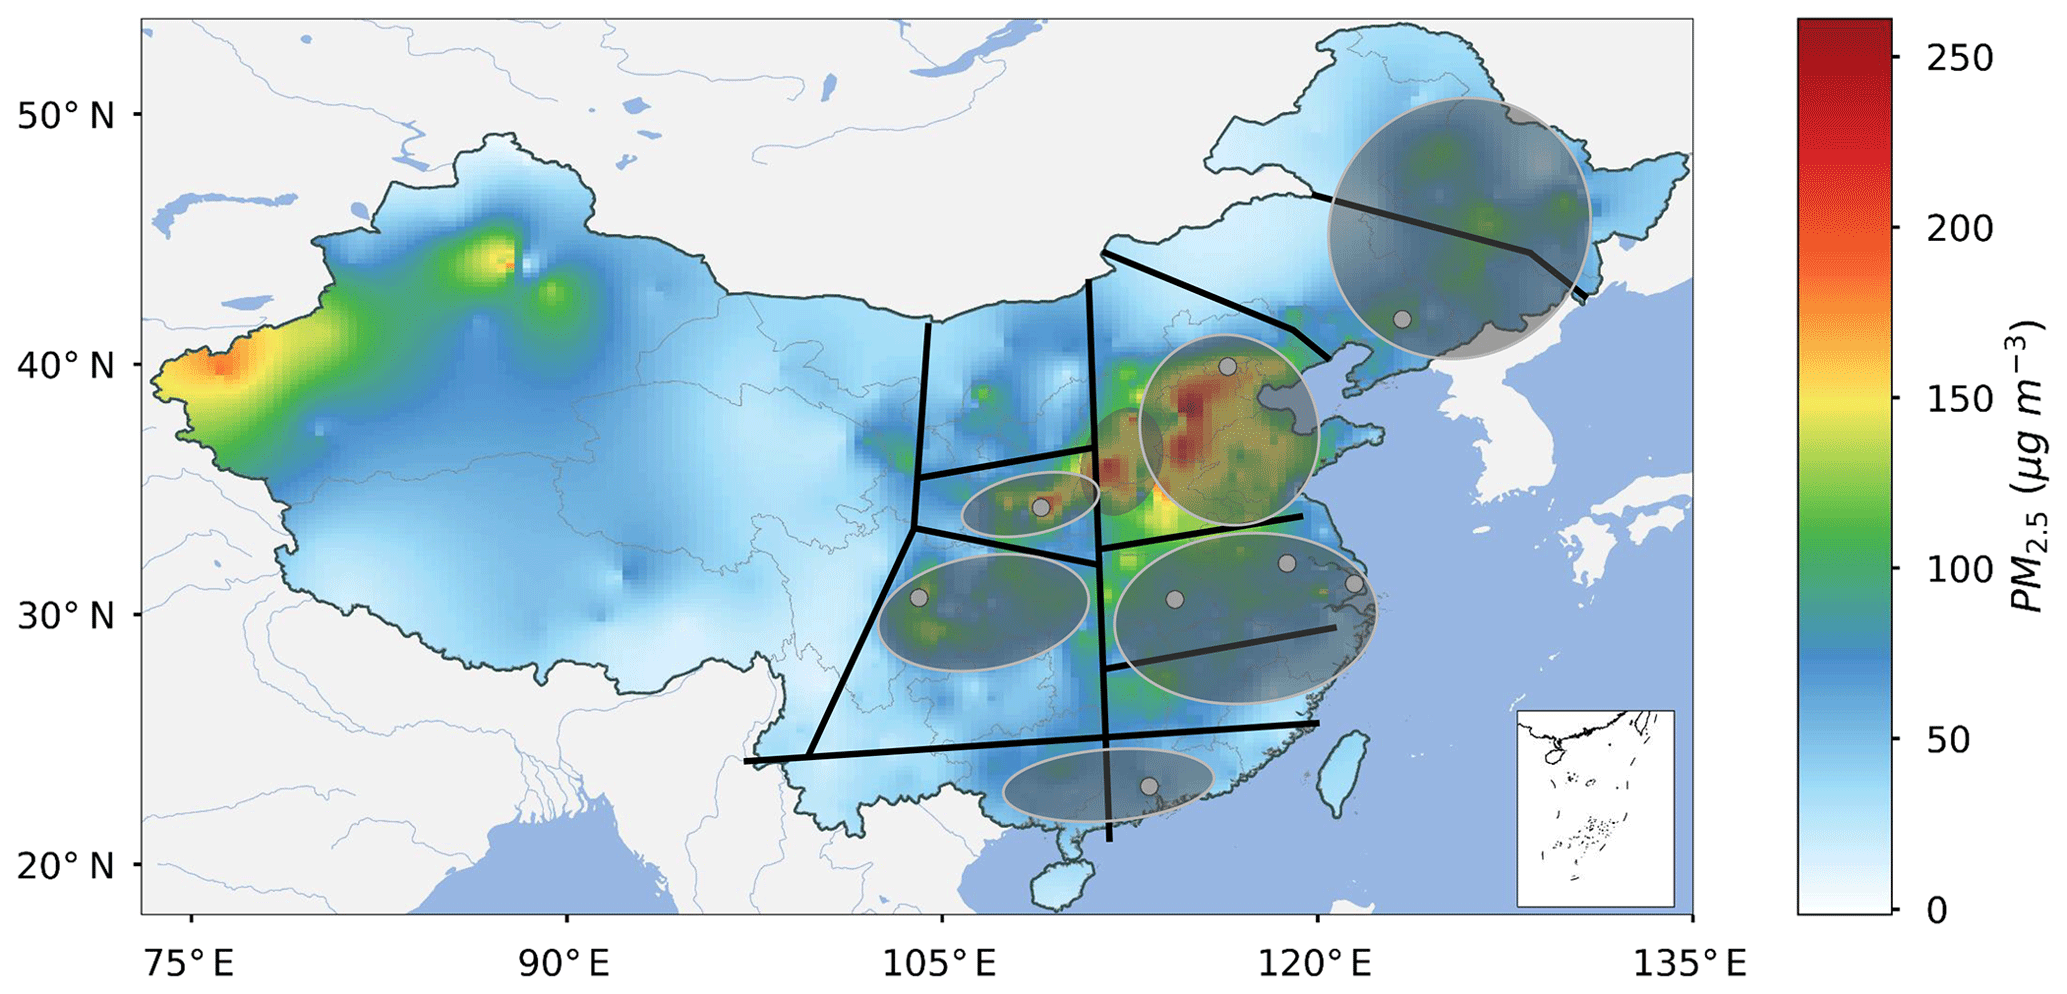
Figure 3National distribution of mean PM2.5 mass concentration from 1 December 2016 to 10 January 2017. Grey dots represent the locations of radiosonde stations.
Based on the consistent variation in visibility trends, China is classified into nine typical regions (X. Y. Zhang et al., 2012). Five of these regions have experienced striking declines in visibility in recent decades, including (1) the North China Plain and the Guanzhong Plain in northern China; (2) the Yangtze River Delta region and the Two Lakes Basin along the middle and lower reaches of the Yangtze River; (3) the Pearl River Delta region in southern China; (4) the Sichuan Basin in southwestern China; (5) and the Northeast China Plain (Fig. 2). The areas where declines in visibility are observed coincide with the basins and plains in eastern China, as these basins and plains are densely populated and topographically enclosed; additionally, these areas emit and produce massive air pollutants, including primary aerosols and secondary aerosols from gas-to-particle conversion. These aerosols accumulate locally to continuously reduce visibility. By comparing the mean PM2.5 mass concentration from 1 December 2016 with that of 10 January 2017 in the five regions that experienced declines in visibility (Fig. 3), we found that the heaviest aerosol pollution occurred in the North China Plain, and it was followed by the Guanzhong Plain. The areas with the next highest aerosol pollution were the Sichuan Basin and the Northeast China Plain. The Two Lakes Basin and the Yangtze River Delta experienced less aerosol pollution, whereas the Pearl River Delta displayed the least aerosol pollution.
3.1 Striking two-way feedback in the polluted Guanzhong Plain with inter-regional pollution transport
To the north of the Loess Plateau and the south of the Qinling Mountains, the Guanzhong Plain has a narrow and closed terrain (Fig. 2), and its climatic and meteorological conditions are distinctive from those of the surrounding areas. Compared with the plateau to the north, the Guanzhong Plain is less affected by northerly cold, clean winds, and these conditions favor the accumulation of pollutants. However, because the Loess Plateau is lower in elevation than the Hengduan Mountains and the Daba Mountains located to the northwest of the Sichuan Basin, the barrier effect of the plateau on the northerly cold air is weaker than that of the abovementioned mountains (Figs. 4b, 12b). Because the North China Plain is bordered to the west by the Taihang and the Lüliang Mountains (Fig. 2), the Guanzhong Plain is rarely affected by pollutant transport from the North China Plain; however, air pollution is highly correlated among the different cities in the Guanzhong Plain. To the west of this plain, Xi'an lies north of the Wei River and the Loess Plateau and south of the Qinling Mountains (Fig. 2). Due to its enclosed topography, Xi'an frequently experiences heavy urban aerosol pollution.
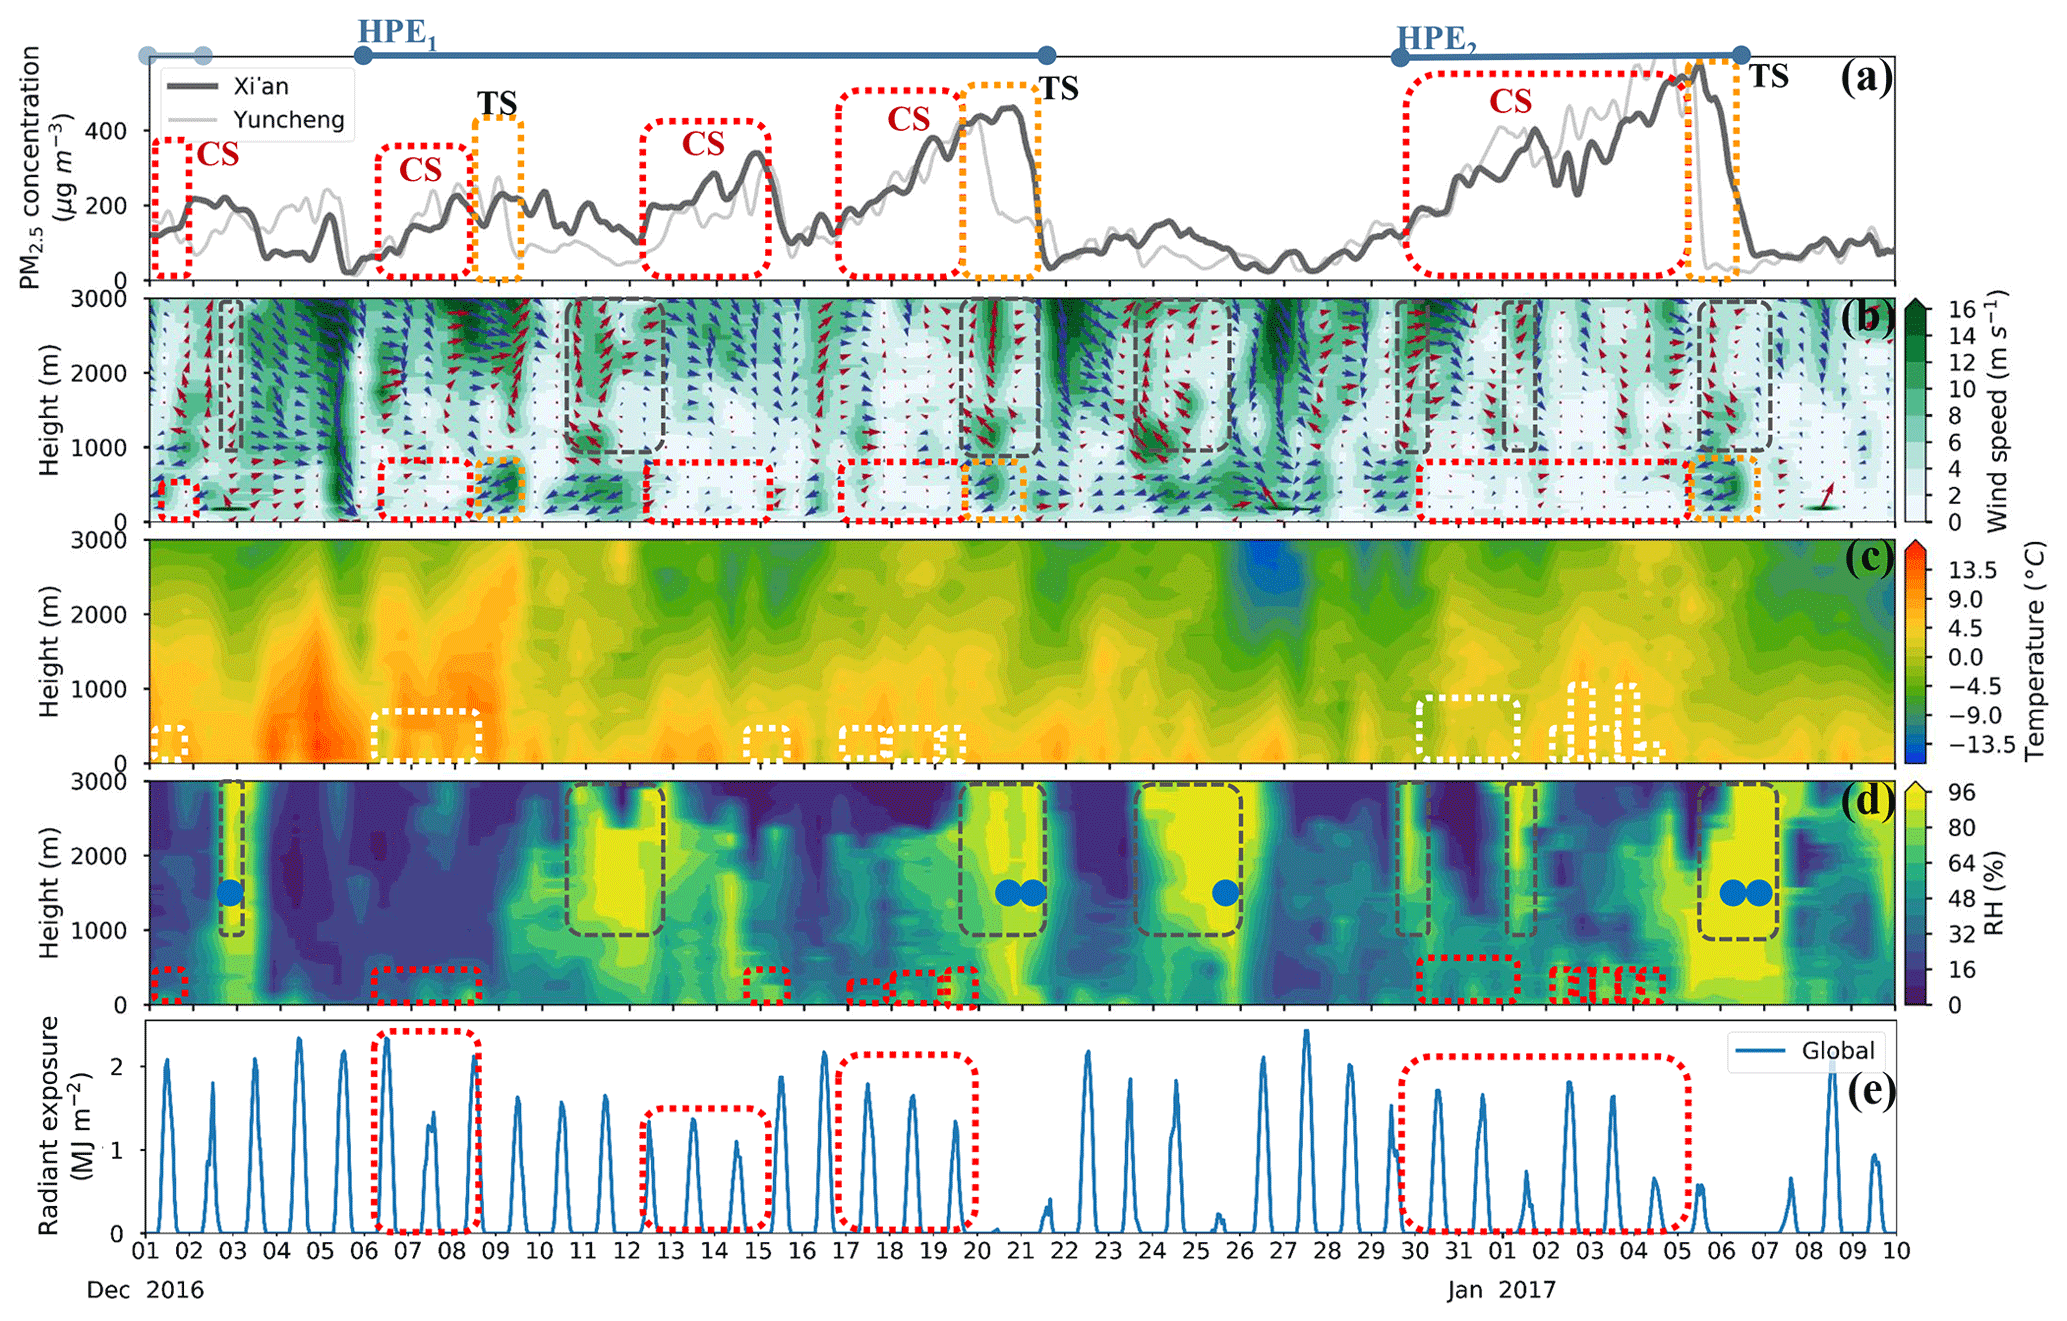
Figure 4Temporal variations in PM2.5, surface radiation, and vertical distributions of meteorological factors from 1 December 2016 to 10 January 2017. (a) PM2.5 mass concentration, (b) winds (vectors) and wind velocity, (c) temperature, (d) RH, and (e) global radiant exposure. (Blue lines: HPEs; light blue lined: PEs; white or red boxes: CSs; and brown boxes: water vapor transport.)
From 1 December 2016 to 10 January 2017, two HPEs occurred in Xi'an and persisted for more than 7 days with peak mass concentrations greater than 400 µg m−3 (Fig. 4a, dark blue lines). During HPE1−2, we observed a striking two-way feedback mechanism between the deteriorating weather conditions and the cumulated aerosol pollution (Fig. 4, red and white boxes). When the near-ground PM2.5 accumulates to a certain extent, the particles scatter more solar radiation back to space, which substantially reduces the surface radiation (Fig. 4e, red boxes) and consequently lowers the near-surface temperature (Fig. 4c, white boxes). Under slight or calm winds (Fig. 4b, red boxes), the temperature reduction induces or reinforces inversions, which further weaken turbulent diffusion and suppress the diffusion of water vapor and pollutants (Zhong et al., 2017, 2018a); these conditions also decrease the near-ground saturation vapor pressure to increase the RH (Fig. 4d, red boxes), which further enhances aerosol hygroscopic growth and accelerates liquid-phase and heterogeneous reactions (Cheng et al., 2016; Fang et al., 2016; Tie et al., 2017). This type of two-way feedback mechanism leads to declining meteorological conditions and elevated PM2.5 mass concentrations.
To quantify the magnitude of the two-way feedback during TSs and CSs in polluted Beijing and Xi'an, we obtained the air temperature difference between the radiosonde observations at 20:00 BJT affected by the two-way feedback (where the temperature profiles were more affected by aerosols blocking in solar radiation transfer compared with observations at 08:00 BJT) and the ERA-Interim reanalysis data without the feedback. We found that the temperature profile was modified by aerosols during both the TSs and the CSs in Beijing and Xi'an (Fig. 5a, b). However, a comparison of aerosol-induced temperature modification in the TSs and the CSs indicates that the lower cooling bias was more striking in the CSs, and that this bias also became increasingly substantial at distances closer to the surface. From TSs to CSs, the negative temperature difference at 1000 hPa increased from −0.8 to −4.3 ∘C and from −1.3 to −2.7 ∘C in Beijing and Xi'an, respectively. Using the near-ground temperature reduction (1000 hPa) as an index to evaluate the magnitude of the two-way feedback from TSs to CSs, we found that during TSs the aerosol-induced cooling bias was 18.6 % and 48.7 % of the difference during CSs in Beijing and Xi'an, respectively. This is expected because aerosol pollution worsened from the TSs to the CSs with increasing radiative cooling effects. Moreover, although relatively strong winds in the TSs were conducive to pollution transport, they were unfavorable for the formation and maintenance of stable stratification, in which aerosol self-induced pollution deterioration frequently occurred.
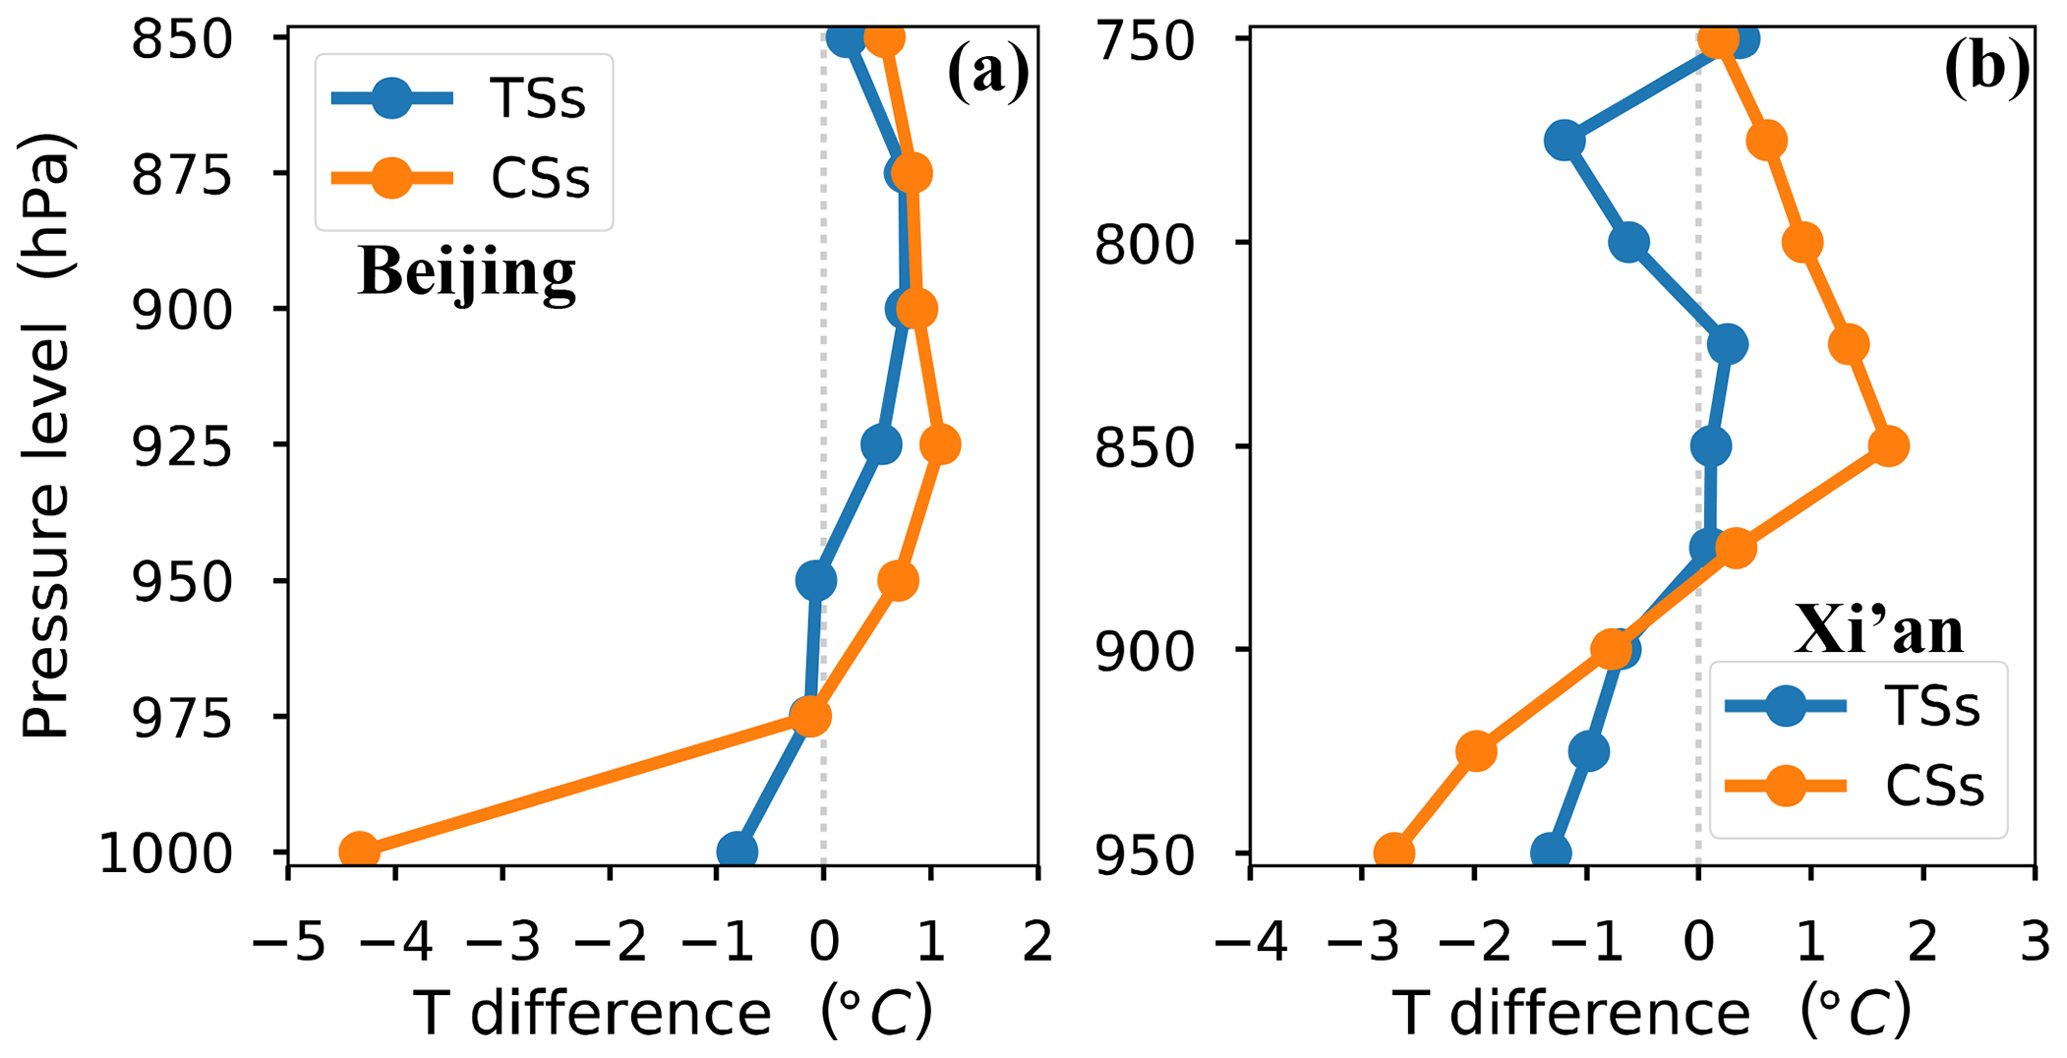
Figure 5Vertical mean temperature difference between sounding observations and ERA-Interim reanalysis data during TSs and CSs from 1 December 2016 to 10 January 2017 in (a) Beijing and (b) Xi'an.
During HPE1−2, we also observed an increase in the PM2.5 mass concentration caused by pollutant transport. The aerosol pollution in Xi'an might have been aggravated by the transport of pollutants from the eastern polluted plain area with heavily polluted cities, including Yuncheng and Linfen. To reveal the effects of air pollutant transport from the eastern plain on the aerosol pollution in Xi'an, we compared the trends in the variation of the PM2.5 mass concentrations in Xi'an and Yuncheng under lower northwesterly winds (Fig. 4a, b). We found that during TSs (Fig. 4, orange boxes), low-level northwesterly winds transported pollutants below the BL which maintained or aggravated the aerosol pollution in Xi'an when Yuncheng was heavily polluted; however, when the air quality in Yuncheng was good, the aerosol pollution in Xi'an was lighter or even eliminated.
In addition to the scavenging effect of clean northwesterly winds on aerosol pollution, pollution elimination mainly depends on lower strong northwesterly winds and mid-upper level southerly winds. Because the Loess Plateau north of Xi'an is sparsely populated with rare air pollutant emissions, lower strong and clean northwesterly winds would blow aerosol pollutants away in Xi'an, causing a subsequent rapid improvement in the air quality (Fig. 4a, b). As the mid-upper level southerly winds transport water vapor to Xi'an from the area south of the city, the mid-upper (or whole-layer) RH level is considerably enhanced (i.e., greater than 96 %; Fig. 4b, d – brown boxes), which causes the PM2.5 to enter the fog-cloud phase and possibly produces precipitation that eliminates pollutants through wet removal (Fig. 4d, blue dots represent precipitation).
3.2 Affected by trans-regional pollution transport from the North China Plain, the Yangtze River Delta region subsequently experiences the two-way feedback
Located in the lower reaches of the Yangtze River, the Yangtze River Delta is a triangle-shaped metropolitan region. It covers an area of 211 700 km−2 and is home to more than 150 million people as of 2014 (http://www.ndrc.gov.cn/zcfb/zcfbghwb/201606/t20160603_806390.html, last access: 4 March 2019). The urban buildup in this area has given rise to what may be the largest concentration of adjacent metropolitan areas in the world. The Yangtze River Delta has a marine monsoon subtropical climate with cool, dry winters. Situated in the Yangtze River Delta, Nanjing is the second largest city in the eastern China region. The southern, northern, and eastern sides of the city are surrounded by the Ningzheng Ridges (Fig. 2), whereas the Yangtze River flows west of the city and along part of the northern margin.
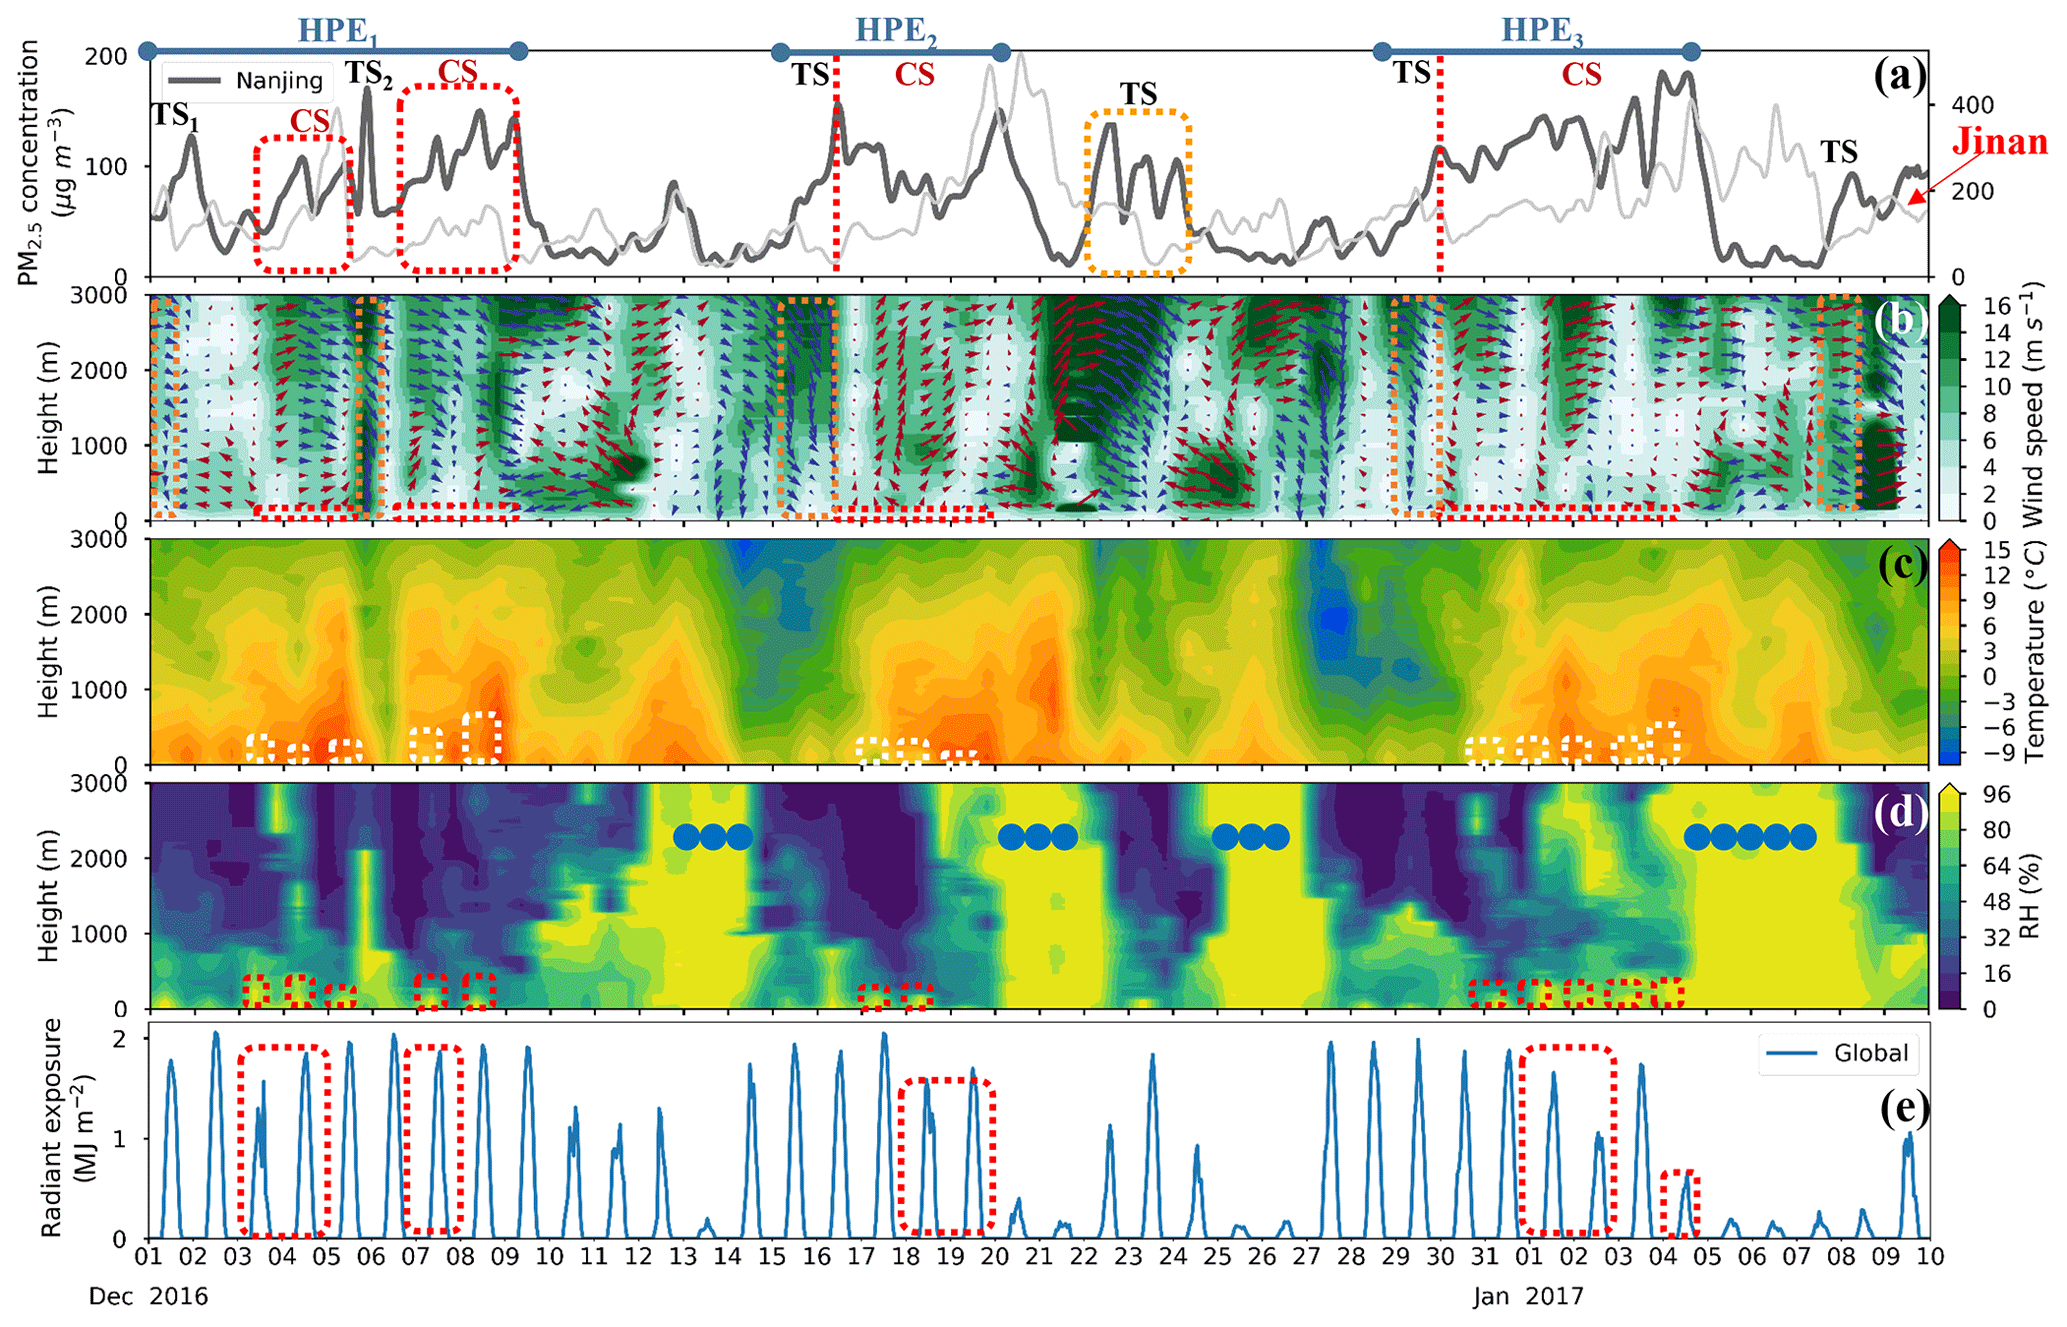
Figure 6Temporal variations in PM2.5, surface radiation, and vertical distributions of meteorological factors from 1 December 2016 to 10 January 2017. (a) PM2.5 mass concentration, (b) winds (vectors) and wind velocity, (c) temperature, (d) RH, and (e) global radiant exposure. (Blue lines: HPEs; light blue lines: PEs; white or red boxes: CSs; and blue dots: precipitation.)
From 1 December 2016 to 10 January 2017, four aerosol pollution episodes occurred in Nanjing (Fig. 6a, blue boxes). One of these episodes lasted for less than 3 days and exhibited light pollution, whereas the other three episodes persisted for more than 5 days and had peak mass concentrations greater than 150 µg m−3; thus, these three episodes were termed HPEs (Fig. 6a). During these three HPEs, although the PM2.5 mass concentration was much lower than that in Beijing, the aerosol pollution formation was similar to that in Beijing, including earlier TSs and later CSs (Zhong et al., 2017, 2018a). During the TSs in the HPEs, strong northerly winds transported aerosol pollutants from the polluted North China Plain to the Yangtze River Delta region below and above the BL (i.e., long-distance pollution transport), which induced a striking increase in the PM2.5 mass concentration in Nanjing and a reduction in the PM2.5 mass concentration in Jinan, a regional center city representative of the pollution conditions in the NCP (Fig. 6a, b). To some extent, based on the PM2.5 mass, the two-way feedback mechanism was activated during the CSs, in which we observed surface radiation reductions, near-surface inversions, low-layer RH enhancement, and increased PM2.5 mass concentrations under slight winds (Fig. 6). Due to the lighter aerosol pollution in Nanjing, the two-way feedback mechanism was weaker than that in Beijing (Figs. 1, 6a). In addition, the mechanism might have been weakened by relatively strong lower winds (compared with those in Beijing) (Figs. 1, 6b), which are unfavorable for the accumulation of aerosols.
To reveal the regional pollutant transport patterns from the North China Plain to the Yangtze River Delta region, we calculated the concentration difference in the PM2.5 mass between the start time and the end time of the TSs in HPE (Fig. 7). We found that the southern area of the North China Plain experienced a substantial reduction in its PM2.5 mass concentration, whereas an increase occurred in the middle and lower reaches of the Yangtze River, including the Two Lakes Basin and the Yangtze River Delta region; these results indicate the process of regional pollutant transport from northern China to eastern China under strong northwesterly winds. In the winter of 2017, we also observed this pollution transport (Fig. 6, orange boxes). As shown in Fig. 8, we observed mid-level pollutant transport at the beginning of the TS, after which near-surface PM2.5 reaches the highest concentration with downward mixing. Subsequently, another northerly pollutant transport reached middle layers over Nanjing. Afterward, persistent northerly winds blew pollutants away (Fig. 8, purple boxes). In addition to the “blowing effect” of persistent northerly winds, eliminating pollution in Nanjing mainly depends on strong southeasterly winds, which transport warm, humid, clean air from the Yellow Sea and the East China Sea; this air also blows the aerosol pollutants in Nanjing away (Fig. 6b–d). In addition, transported water vapor increases the RH (Fig. 6b, d), which causes the PM2.5 to enter the fog-cloud phase and possibly produces precipitation that eliminates pollutants through wet removal (Fig. 6d, blue dots represent precipitation).
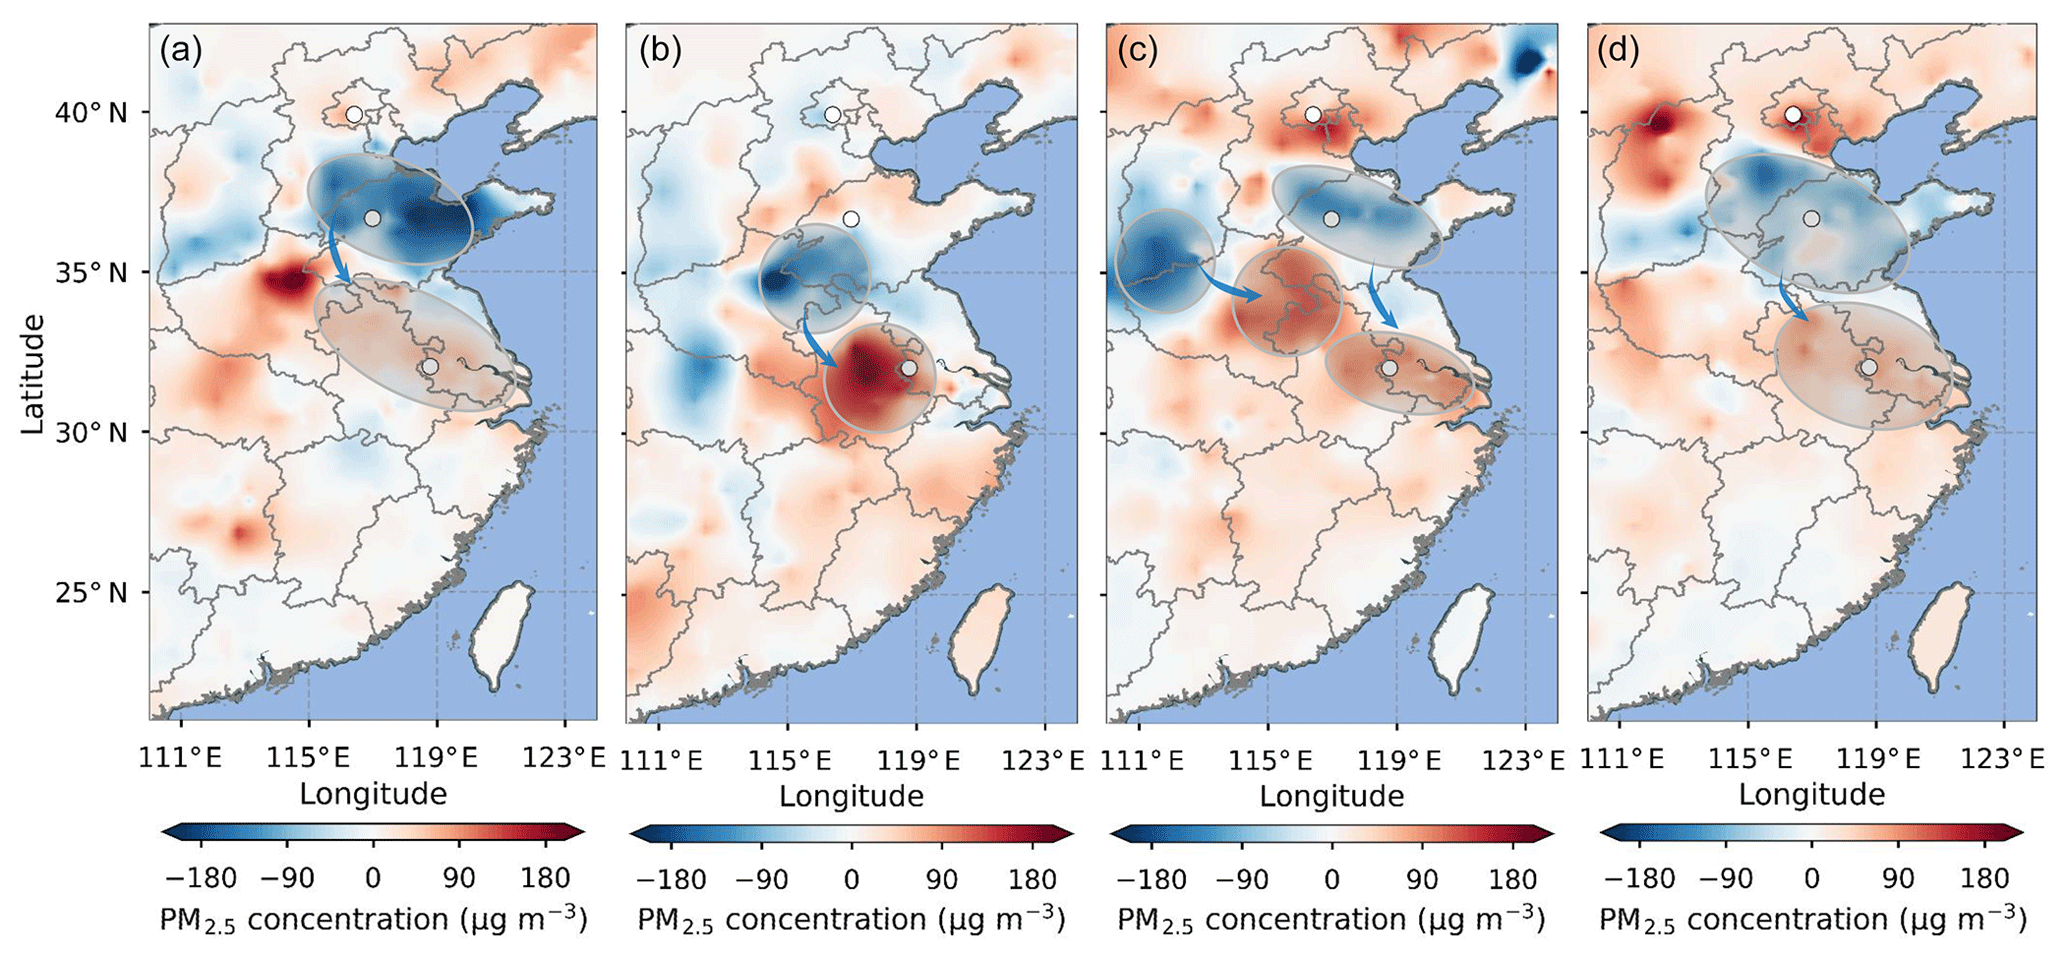
Figure 7The distribution of the concentration differences in PM2.5 mass between the start time and the end time (the end is subtracted from the start) of the TSs in Fig. 4: (a) TS1 in HPE1; (b) TS2 in HPE1; (c) TS in HPE2; and (d) TS in HPE3.
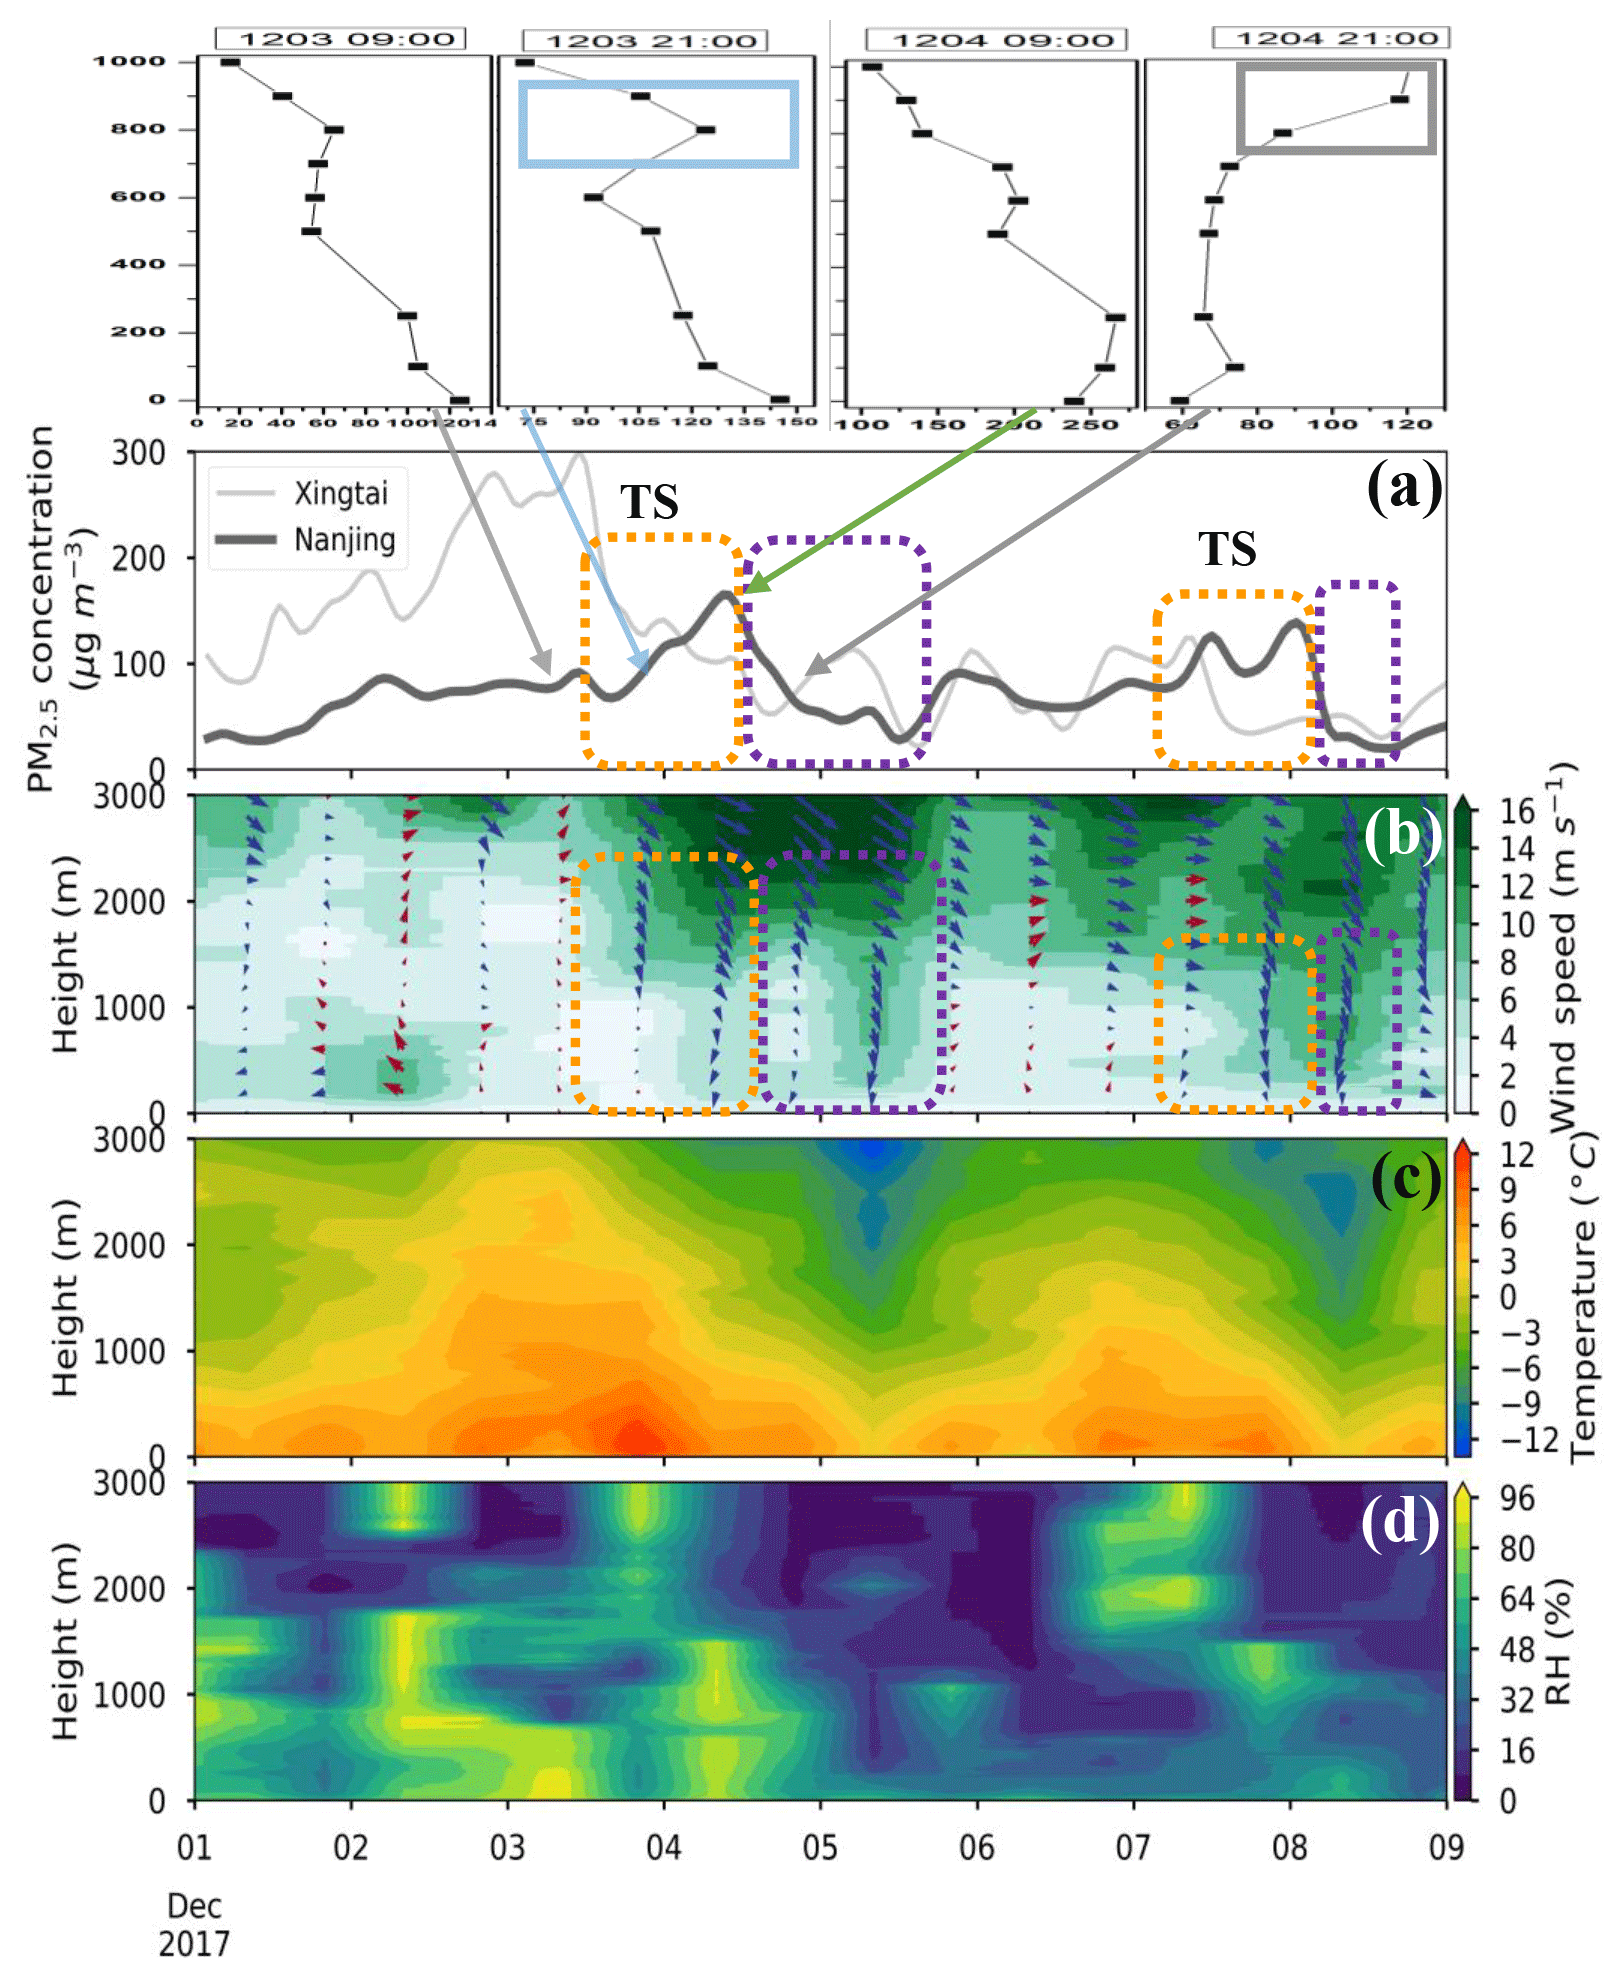
Figure 8Temporal variations in PM2.5 and vertical distributions of meteorological factors from 1 to 9 December 2017. (a) PM2.5 mass concentration, (b) winds (vectors) and wind velocity, (c) temperature, and (d) RH. (Orange boxes: TSs; purple boxes: clean periods.)
Consistent with the results observed in Nanjing, Shanghai also experienced long-distance pollution transport below and above the BL under northwesterly winds (Fig. 9a, b – orange boxes). After PM2.5 had accumulated to some extent, we observed a two-way feedback mechanism, including reduced radiation, near-surface inversions, RH enhancement in the lower parts of BL, and an increase in the PM2.5 mass concentration under slight or calm winds (Fig. 9a–e, red and white boxes); however, the magnitude of the feedback was weaker than that observed in Nanjing (Fig. 6). Because Shanghai is closer to the sea than Nanjing, it is more susceptible to warm, humid southeasterly winds from the sea, which carry more water vapor to Shanghai than to Nanjing (Figs. 6 and 9b, d).
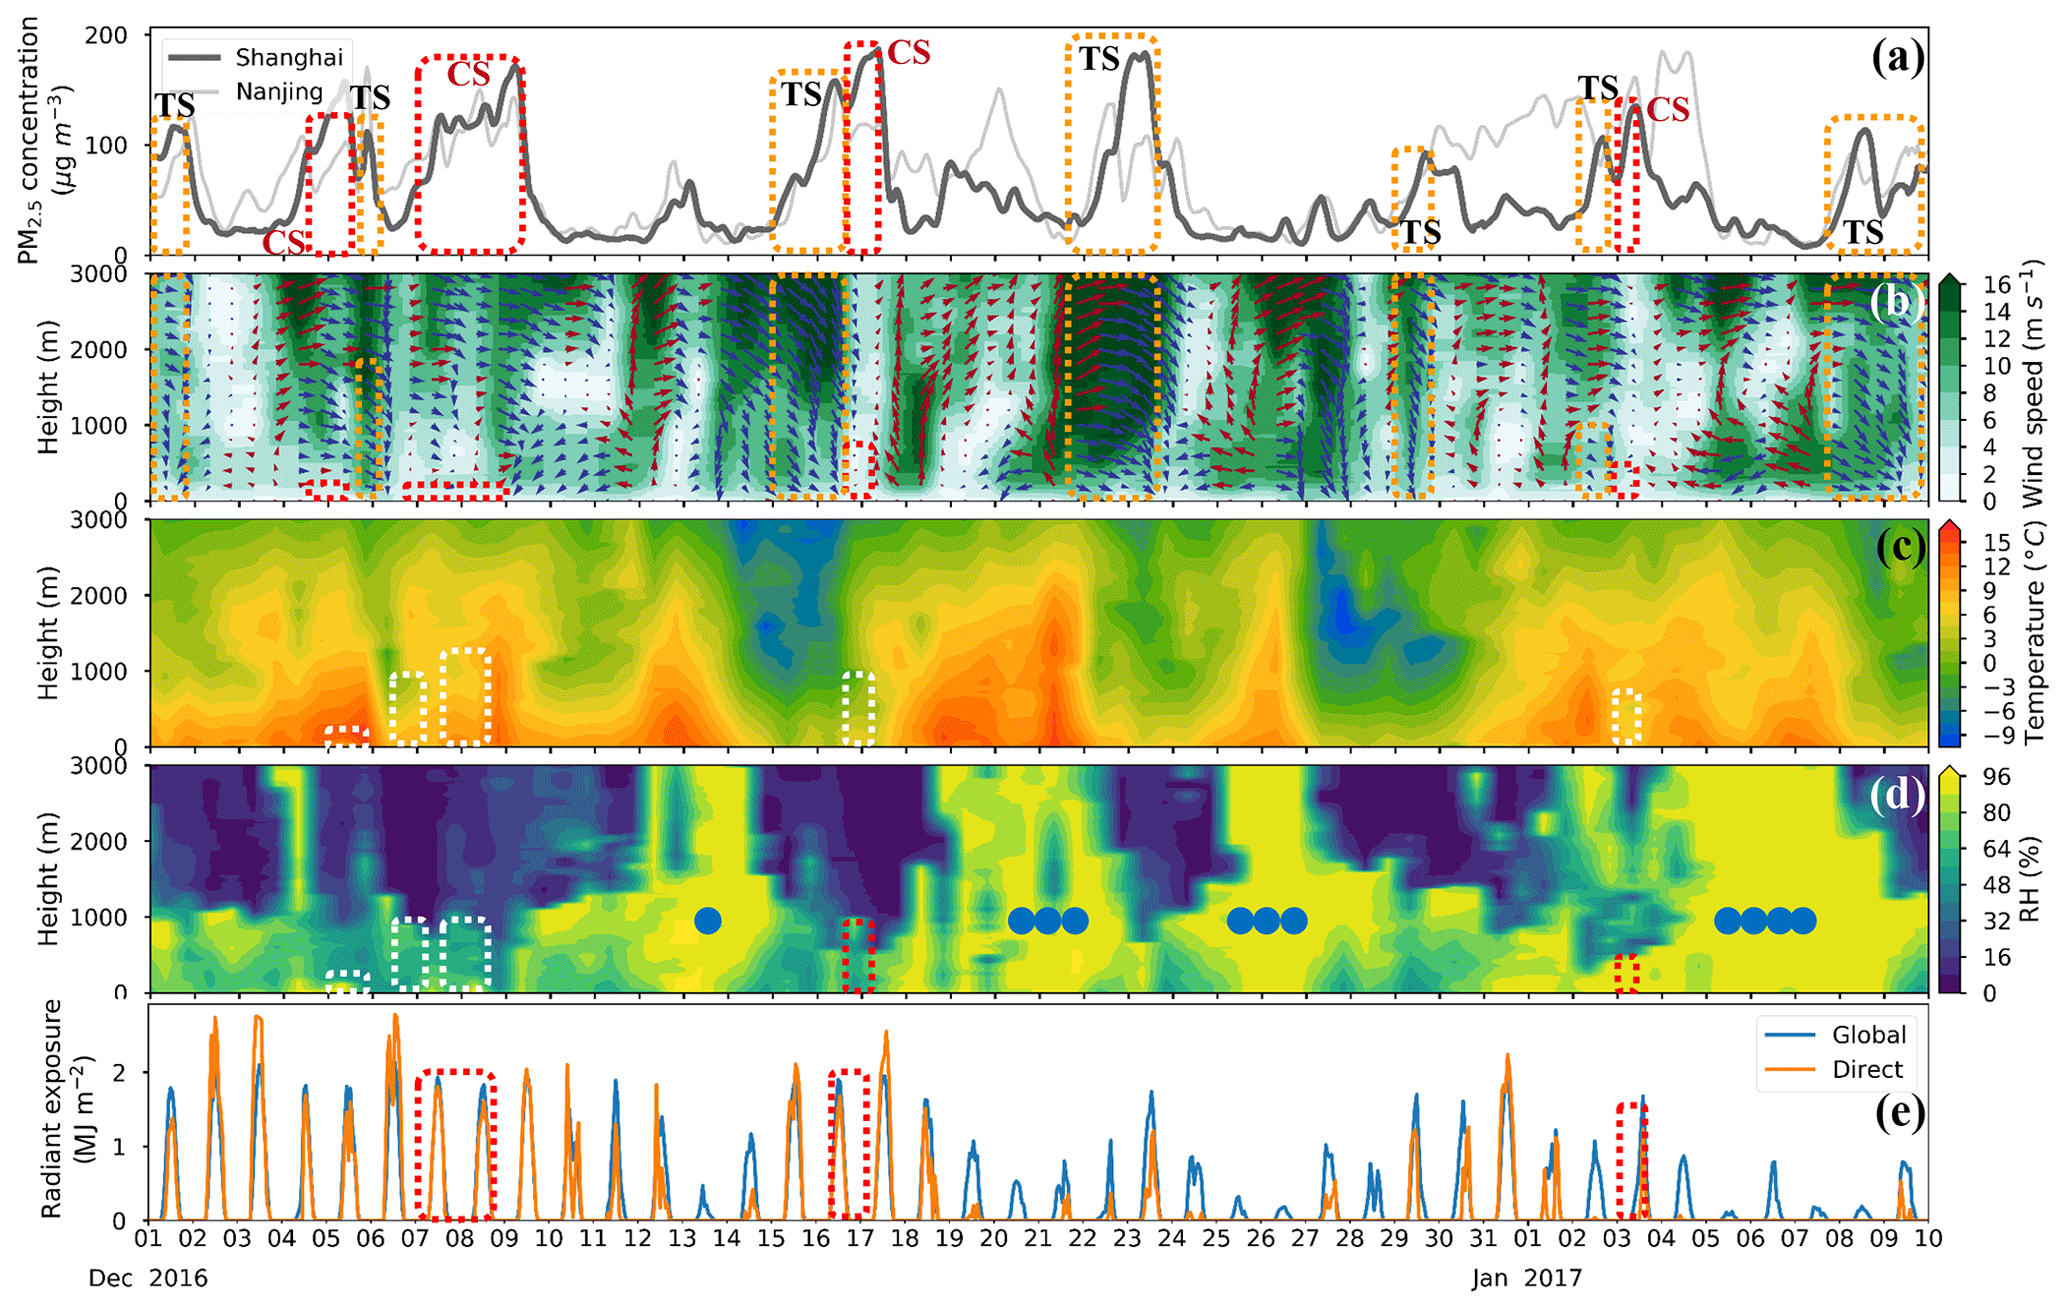
Figure 9Temporal variations in PM2.5, surface radiation, and vertical distributions of meteorological factors from 1 December 2016 to 10 January 2017. (a) PM2.5 mass concentration, (b) winds (vectors) and wind velocity, (c) temperature, (d) RH, and (e) direct radiant exposure (of the vertical surface to the direction of solar radiation) and global radiant exposure. (White or red boxes: CSs; orange boxes: TSs; and blue dots: precipitation).
3.3 The two-way feedback in the Two Lakes Basin with aerosol pollution worsened by transport
The Two Lakes Basin is in the middle reaches of the Yangtze River. With the Sichuan Basin bordered to the northwest by the Daba Mountains (Fig. 2), the Two Lakes Basin is rarely affected by pollutant transport from polluted cities in the Sichuan Basin. The north side of the Two Lakes Basin is connected to the North China Plain via the “Suizhou corridor” and the Nanyang Basin (Fig. 2); thus, the Two Lakes Basin is vulnerable to pollution transport from the North China Plain, which experiences the heaviest aerosol pollution in China (Fig. 3). As a large exorheic basin surrounded by low ridges or mountains, the Two Lakes Basin more frequently exchanges air masses with its surroundings, with wind speeds much higher than those in the Sichuan Basin. Situated in the eastern Two Lakes Basin, Wuhan is the most populous city in central China. The Yangtze and Han rivers wind through this city, which has a southern hilly and central flat terrain (Fig. 2).
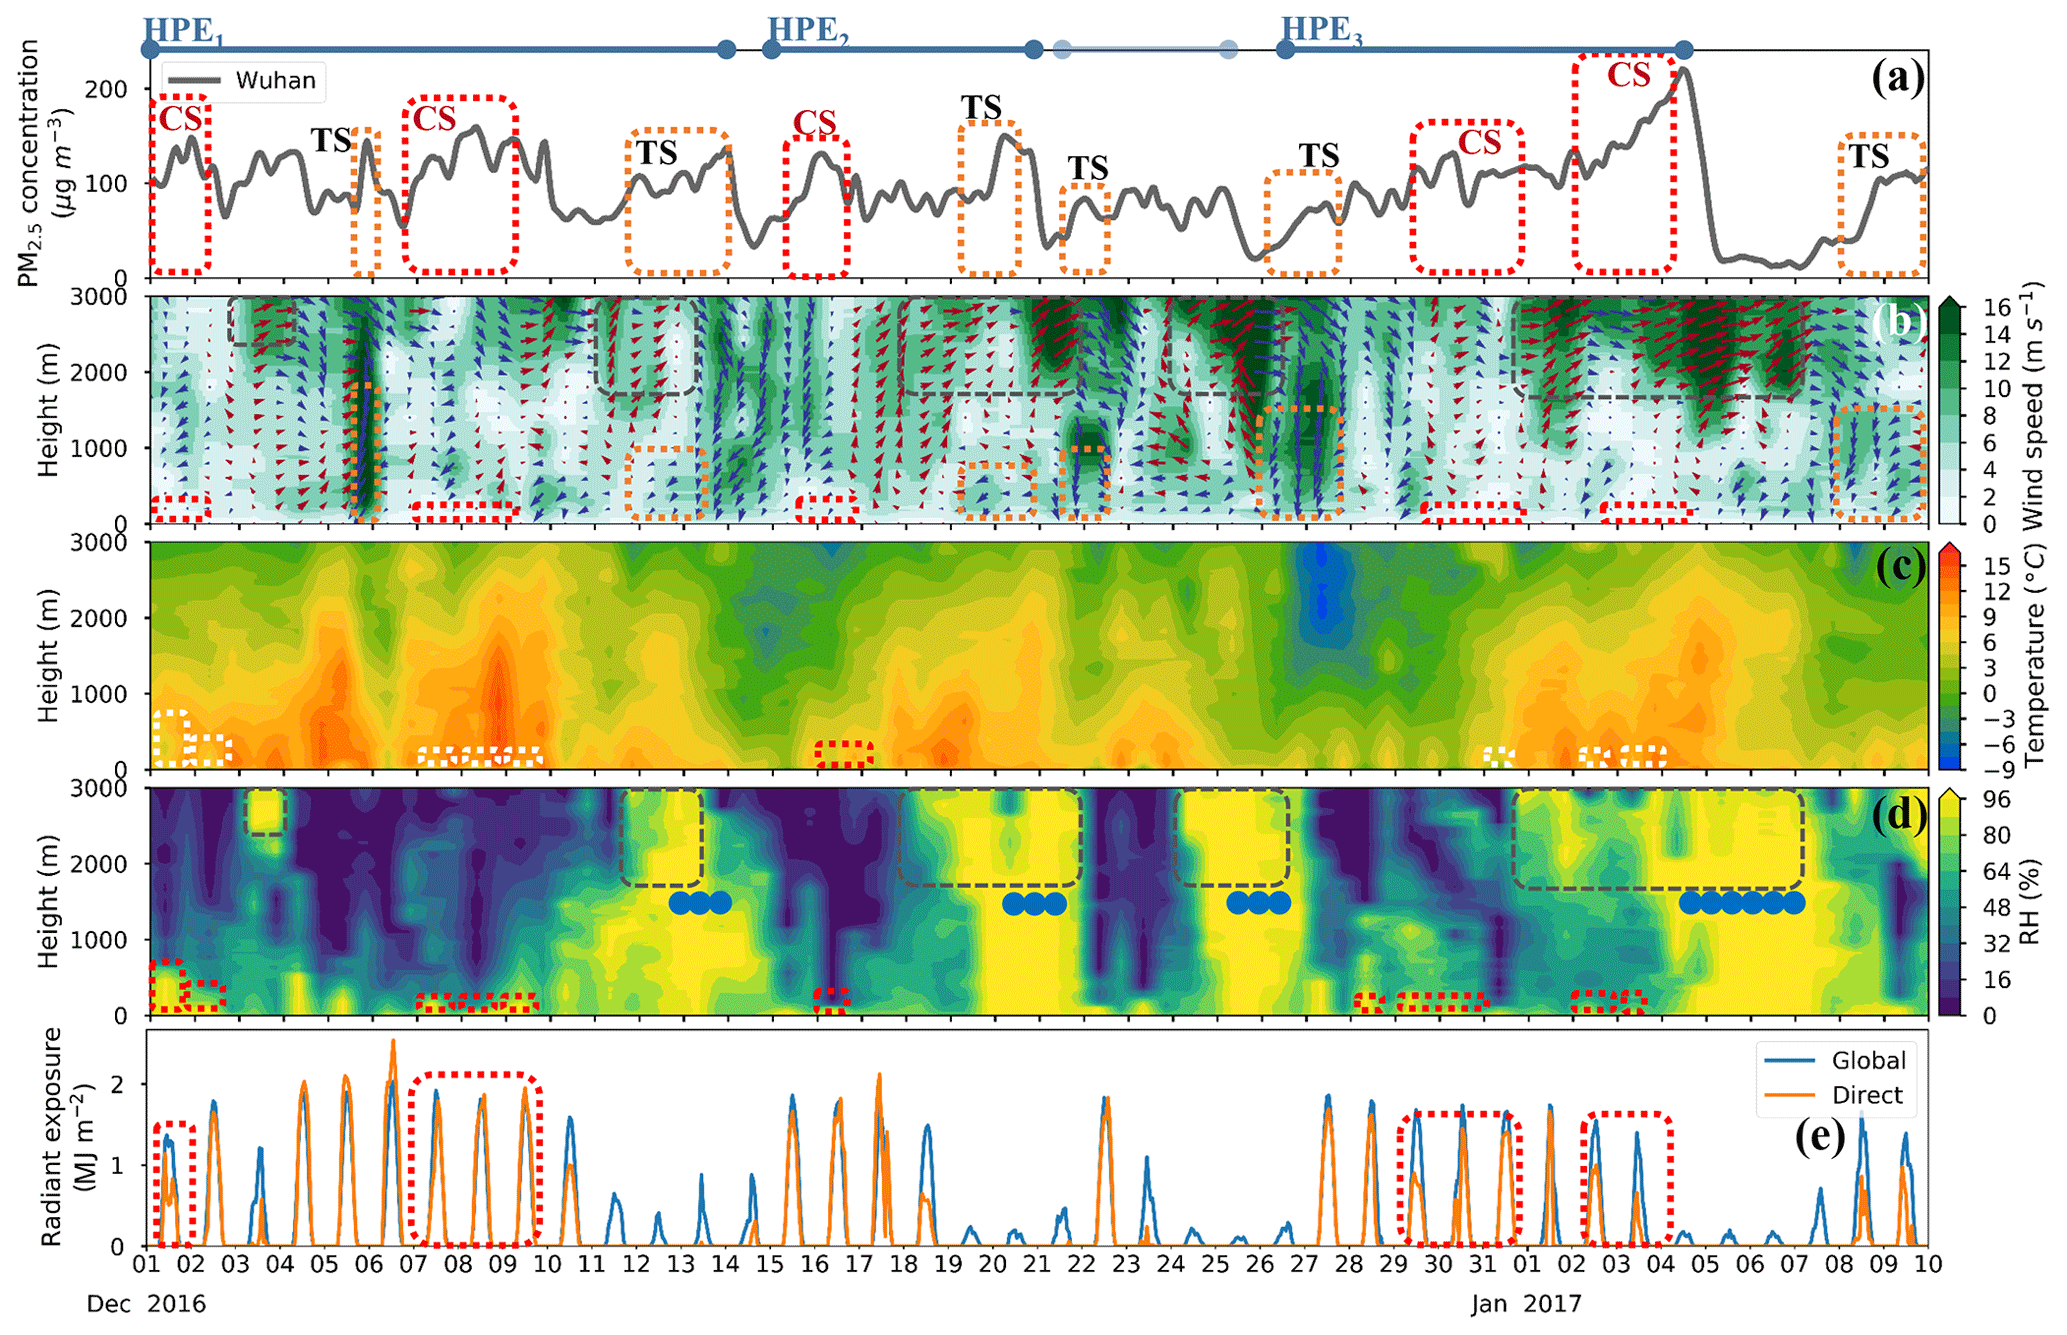
Figure 10Temporal variations in PM2.5, surface radiation, and vertical distributions of meteorological factors from 1 December 2016 to 10 January 2017. (a) PM2.5 mass concentration, (b) winds (vectors) and wind velocity, (c) temperature, (d) RH, and (e) direct radiant exposure (of the vertical surface to the direction of solar radiation) and global radiant exposure. (Blue lines: HPEs; light blue lines: PEs; white or red boxes: CSs; orange boxes: TSs; brown boxes: water vapor transport; and blue dots: precipitation.)
From 1 December 2016 to 10 January 2017, four aerosol pollution episodes occurred in Wuhan (Fig. 10a, blue boxes). Three of these episodes lasted longer than 5 days and had peak mass concentrations greater than 150 µg m−3, and are termed HPEs (Fig. 10a). During these three HPEs, we observed a two-way feedback mechanism (red boxes in Fig. 10), including surface radiation reductions, near-surface inversions, low-level RH enhancement, and increases in PM2.5 mass concentrations under slight or calm winds. Similar to the conditions observed in Nanjing, Wuhan experienced lighter aerosol pollution than Beijing (Figs. 1, 10a); thus, the two-way feedback mechanism is weaker than that observed in Beijing.
Figure 7 shows the regional pollutant transport from the North China Plain to the Two Lakes Basin, which also aggravates the PM2.5 pollution in Wuhan. As shown in the orange boxes in Fig. 10, the lower northerly winds transported pollutants from the north of Wuhan to below Wuhan and sometimes above the BL, which resulted in increasing PM2.5 mass concentrations. Therefore, favorable northerly winds establish a pollution linkage between the North China Plain and the middle and lower reaches of the Yangtze River (including the Yangtze River Delta and the Two Lakes Basin), which have low and flat terrains (Fig. 2). However, if the northerly winds are persistent and strong enough, they blow the aerosol pollutants out of the North China Plain entirely and then transport clean, cold winds to Wuhan; under these conditions, the PM2.5 mass concentration first increases and then decreases dramatically. This phenomenon was observed from 12 to 14 December 2016 and is shown in Fig. 10.
In addition to the blowing effect of the strong, persistent northerly winds, clearing the pollution in Wuhan mainly depends on the mid-upper level southerly winds, particularly the southwesterly winds, which transport water vapor to Wuhan from the south, substantially enhancing the RH (over 96 %) (Fig. 10b, d, brown boxes); these conditions cause the PM2.5 to enter the fog-cloud phase and often produce precipitation that eliminates pollutants through wet removal (Fig. 10d, blue dots represent precipitation).
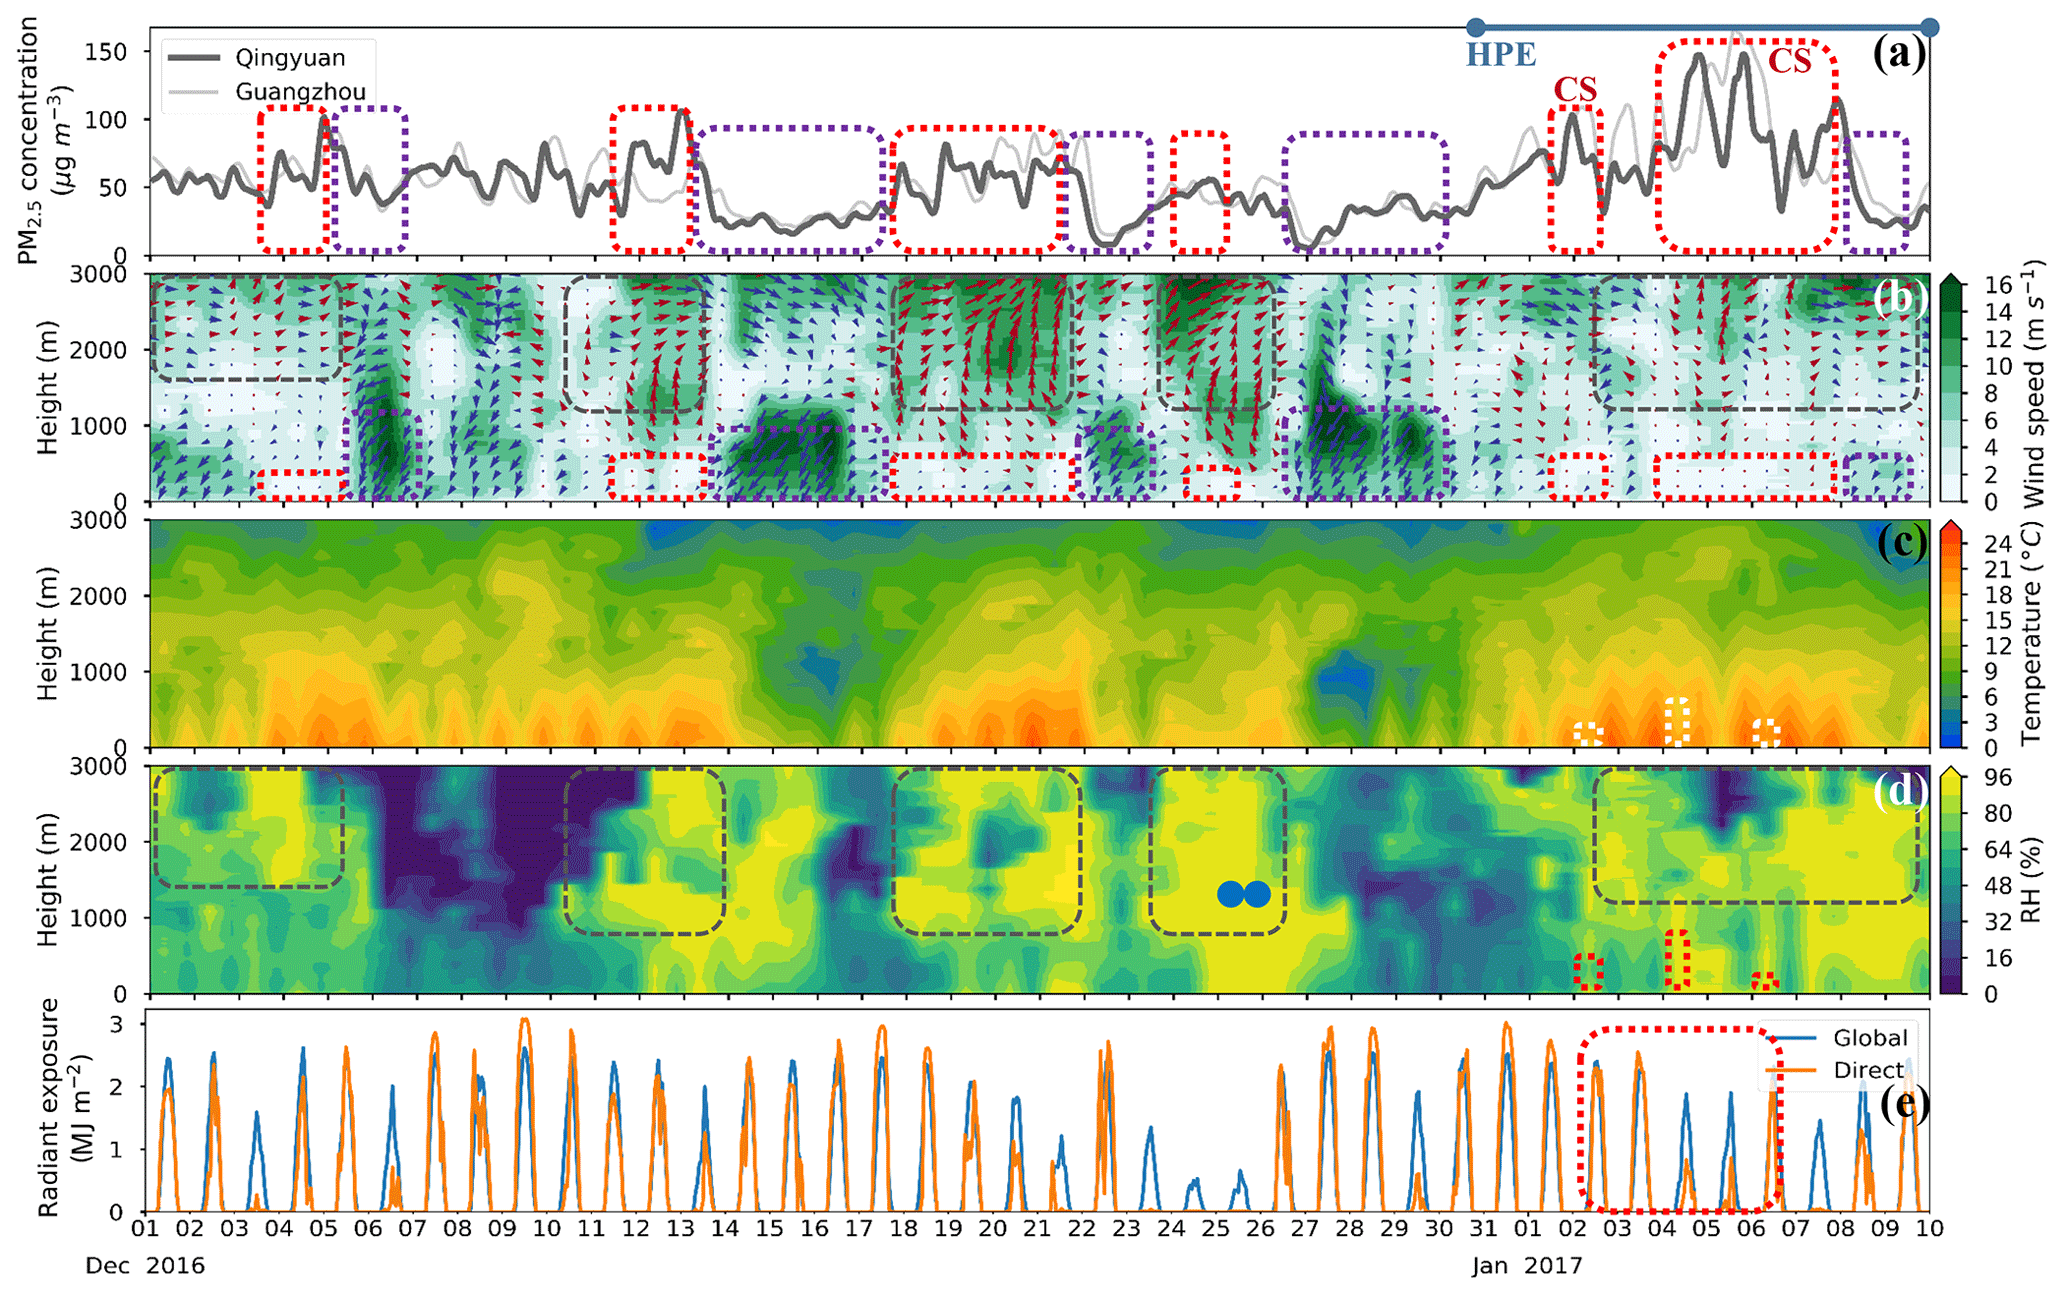
Figure 11Temporal variations in PM2.5, surface radiation, and vertical distributions of meteorological factors from 1 December 2016 to 10 January 2017. (a) PM2.5 mass concentration, (b) winds (vectors) and wind velocity, (c) temperature, (d) RH, and (e) direct radiant exposure (of the vertical surface to the direction of solar radiation) and global radiant exposure. (Blue lines: HPEs; white or red boxes: CSs; purple boxes: clearing; brown boxes: water vapor transport; and blue dots: precipitation.)
3.4 The two-way feedback in the less polluted Pearl River Delta region, which is also humidified by upper southerly winds and purified by lower clean, cold northeasterly winds
Located in southeastern Guangdong Province, the Pearl River Delta is one of the most populous and densely urbanized regions in the world. This low-lying area is surrounded by the Pearl River estuary, where the Dong, Bei, and Xi rivers converge to flow into the South China Sea. With the South China Sea to its south, the Pearl River Delta region is often influenced by southerly sea winds; however, with the mountainous area in northern Guangdong to the north (Fig. 2), the Pearl River Delta region is less affected by northerly cold, clean winds. Situated at the heart of the Pearl River Delta region (Fig. 2), Guangzhou is the most populous city of Guangdong Province. However, due to the lack of a meteorological radiosonde station in Guangzhou, we had to use the sounding observations from Qingyuan, a city with similar PM2.5 variation trends (Fig. 9a); Qingyuan is located approximately 60 km north of Guangzhou.
From 1 December 2016 to 10 January 2017, the PM2.5 mass concentration in Guangzhou and Qingyuan is ∼50 µg m−3, which is much lower than that in Xi'an, Nanjing, Wuhan, Chengdu, and Shenyang. During this period, only one HPE occurred, and it lasted for more than 8 days with a peak mass concentration of approximately 150 µg m−3 (Fig. 11, blue line). During this episode, we observed surface radiation reductions, near-surface inversions, low-level RH enhancement, and increases in the PM2.5 mass concentration under slight or calm winds (Fig. 11, red/white boxes below the blue line), which suggest that a two-way feedback mechanism exists in the region. Except for this episode, we found that the PM2.5 mass concentration increased during slight or calm winds but was still below the threshold (Fig. 11, the red boxes before 1 January 2017) (Zhong et al., 2019); thus, no inversion or increased RH occurred because the two-way feedback mechanism was not effectively activated.
Clearing pollution from Qingyuan depends on the lower strong northeasterly winds, which transport dry, cold, clean air to decrease the temperature and RH and blow aerosol pollutants away from Qingyuan (Fig. 11b, d, purple boxes). In addition to the blowing effect of the cold northeasterly winds, the aerosol pollution in Qingyuan is also affected by the mid-upper level sea flows, which enhance the atmospheric RH and cause the PM2.5 to enter the fog-cloud phase in addition to possibly producing precipitation that eliminates pollutants through wet removal (Fig. 11d, blue dots represent precipitation).
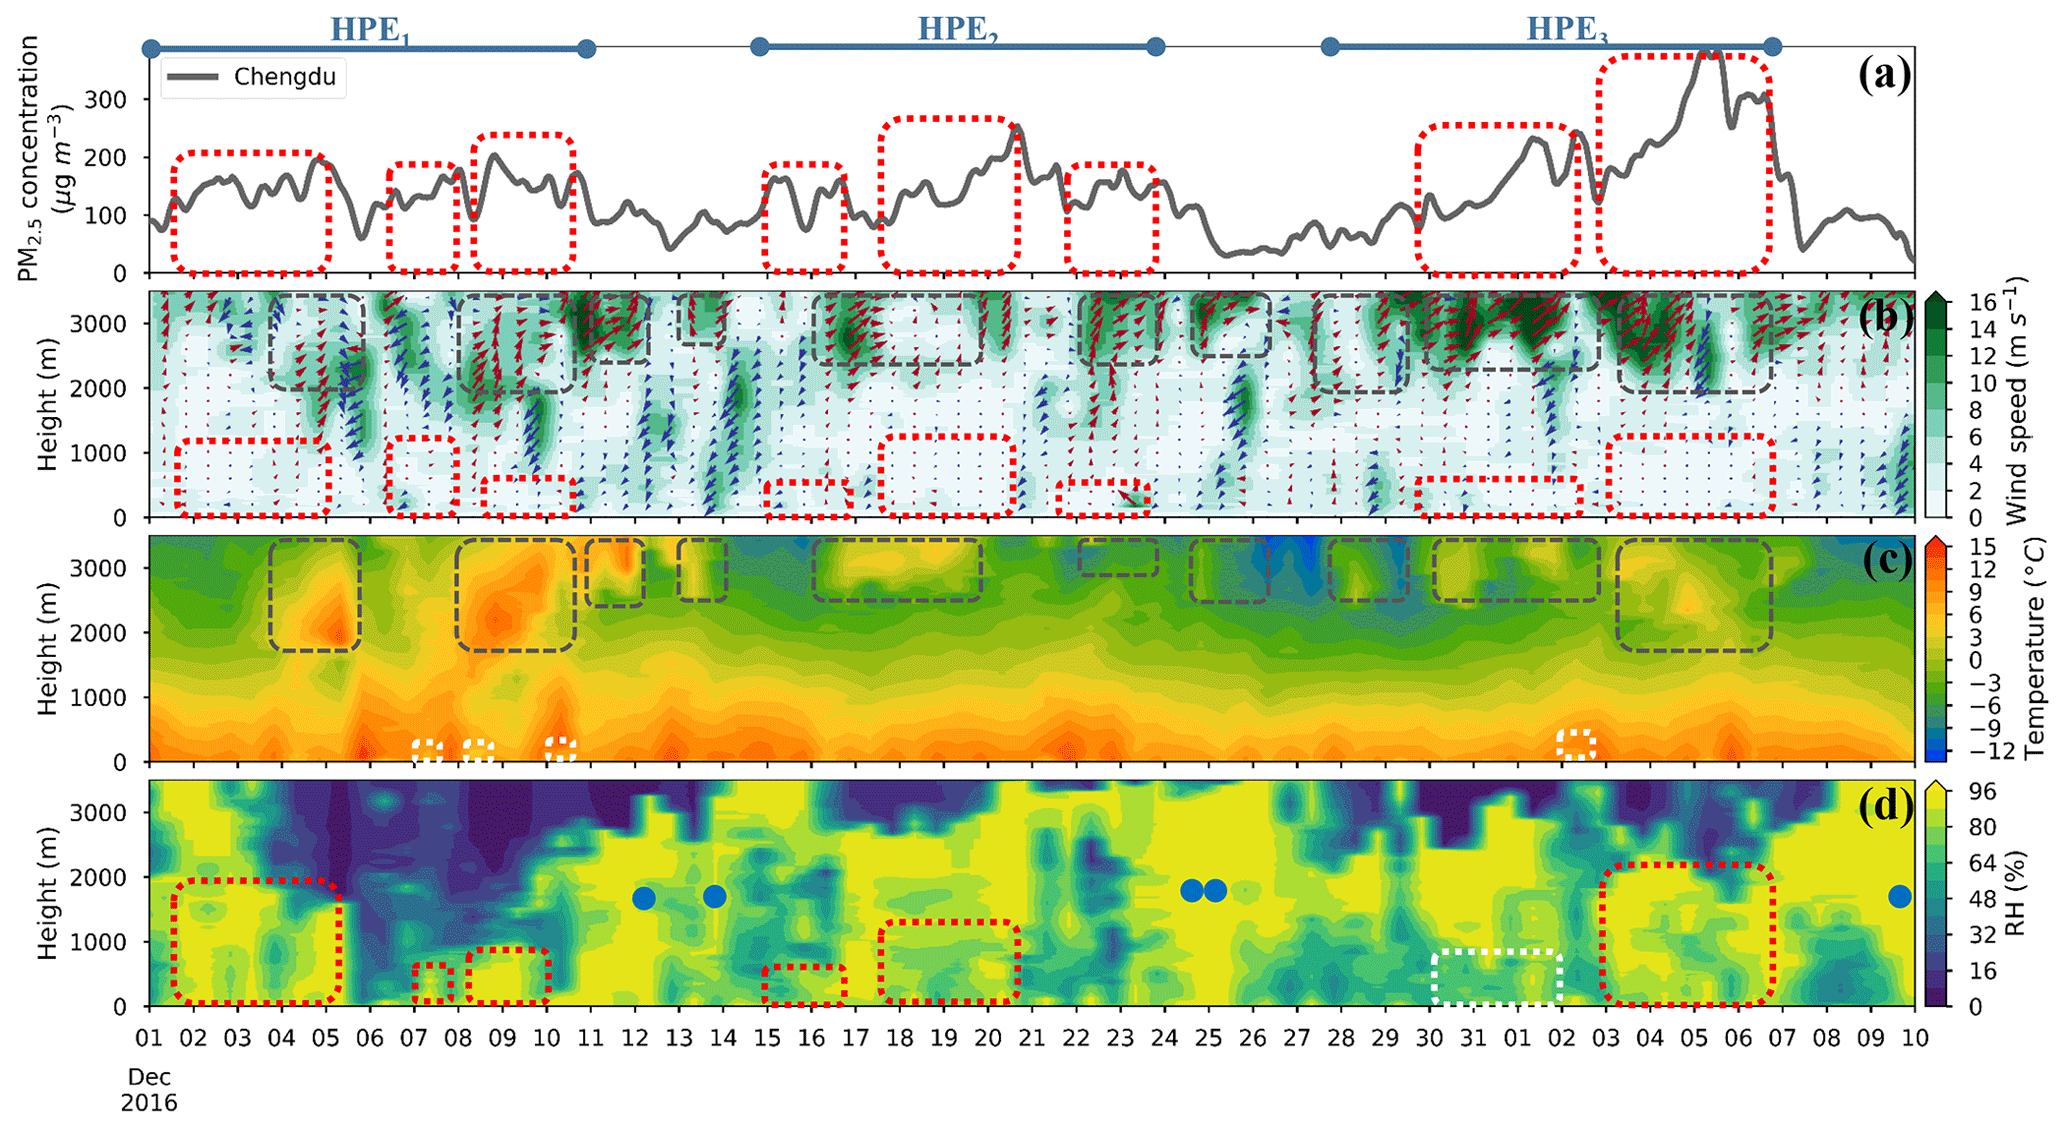
Figure 12Temporal variations in PM2.5, surface radiation and vertical distributions of meteorological factors from 1 December 2016 to 10 January 2017. (a) PM2.5 mass concentration, (b) winds (vectors) and wind velocity, (c) temperature, and (d) RH. (Blue lines: HPEs; white or red boxes: CSs; brown boxes: warm air flow or inversions; and blue dots: precipitation.)
3.5 The two-way feedback is weakened by cloudy mid-upper layers in the humid Sichuan Basin – this area is capped by upper-level inversions caused by air moving east across the Tibetan Plateau
Located in the upper reaches of the Yangtze River in southwestern China, the Sichuan Basin is a lowland region surrounded by mountains on all sides (Fig. 2). Abutting the eastern edge of the Tibetan Plateau to the west and northwest and the Daba Mountains and the Wu Mountains to the east and northeast, respectively (Fig. 2), the Sichuan Basin is rarely affected by cold northerly winds, which are blocked by the high mountains. On the southern and southeastern sides, the Sichuan Basin is flanked by the lower Yungui Plateau (Fig. 2), which is frequently affected by warm, humid southwesterly and southeasterly airflows from the Bay of Bengal and the southeastern sea. Transported water vapor from the south is blocked by the tall northern mountains and then accumulates in the Sichuan Basin. Located at the western edge of the Sichuan Basin, Chengdu is surrounded by the highlands to the south, the high and steep Longmen Mountains to the northwest, the Qionglai Mountains to the west, and the low Longquan Mountains to the east. The enclosed topographical features lead to a lower wind speed and a higher RH in Chengdu than in other parts of the Sichuan Basin.
From 1 December 2016 to 10 January 2017, three HPEs occurred in Chengdu (Fig. 12, blue boxes), and these episodes lasted for more than 10 days and had peak mass concentrations greater than 200 µg m−3 (Fig. 12a). During these three episodes, we observed thick mid-upper level fog/cloud above Chengdu (Fig. 12d), which was blocked by the surrounding mountains and upper-level inversions. The mid-upper level cloud competes with the near-surface aerosols for solar radiation, i.e., as more solar radiation is reflected by the mid-upper layer cloud, the near-surface aerosols receive less solar radiation. Therefore, with cloudy mid-upper layers, more solar radiation is reflected to cool the atmosphere below the clouds, and this condition suppresses the two-way feedback mechanism between the unfavorable weather conditions and the near-surface aerosols. Consequently, the two-way feedback was weak and nearly no near-ground temperature inversion was observed (Fig. 12c). Despite the lack of a two-way feedback mechanism to aggravate aerosol pollution, the increase in the PM2.5 mass concentration is still dominated by slight or calm winds under stable stratification(Fig. 12, red boxes). Comparing the RH variations in the two processes of increasing PM2.5 (Fig. 12 red boxes) during the HPE from 26 December 2016 to 6 January 2017, we found that the PM2.5 mass concentration increases in connection with lower RH.
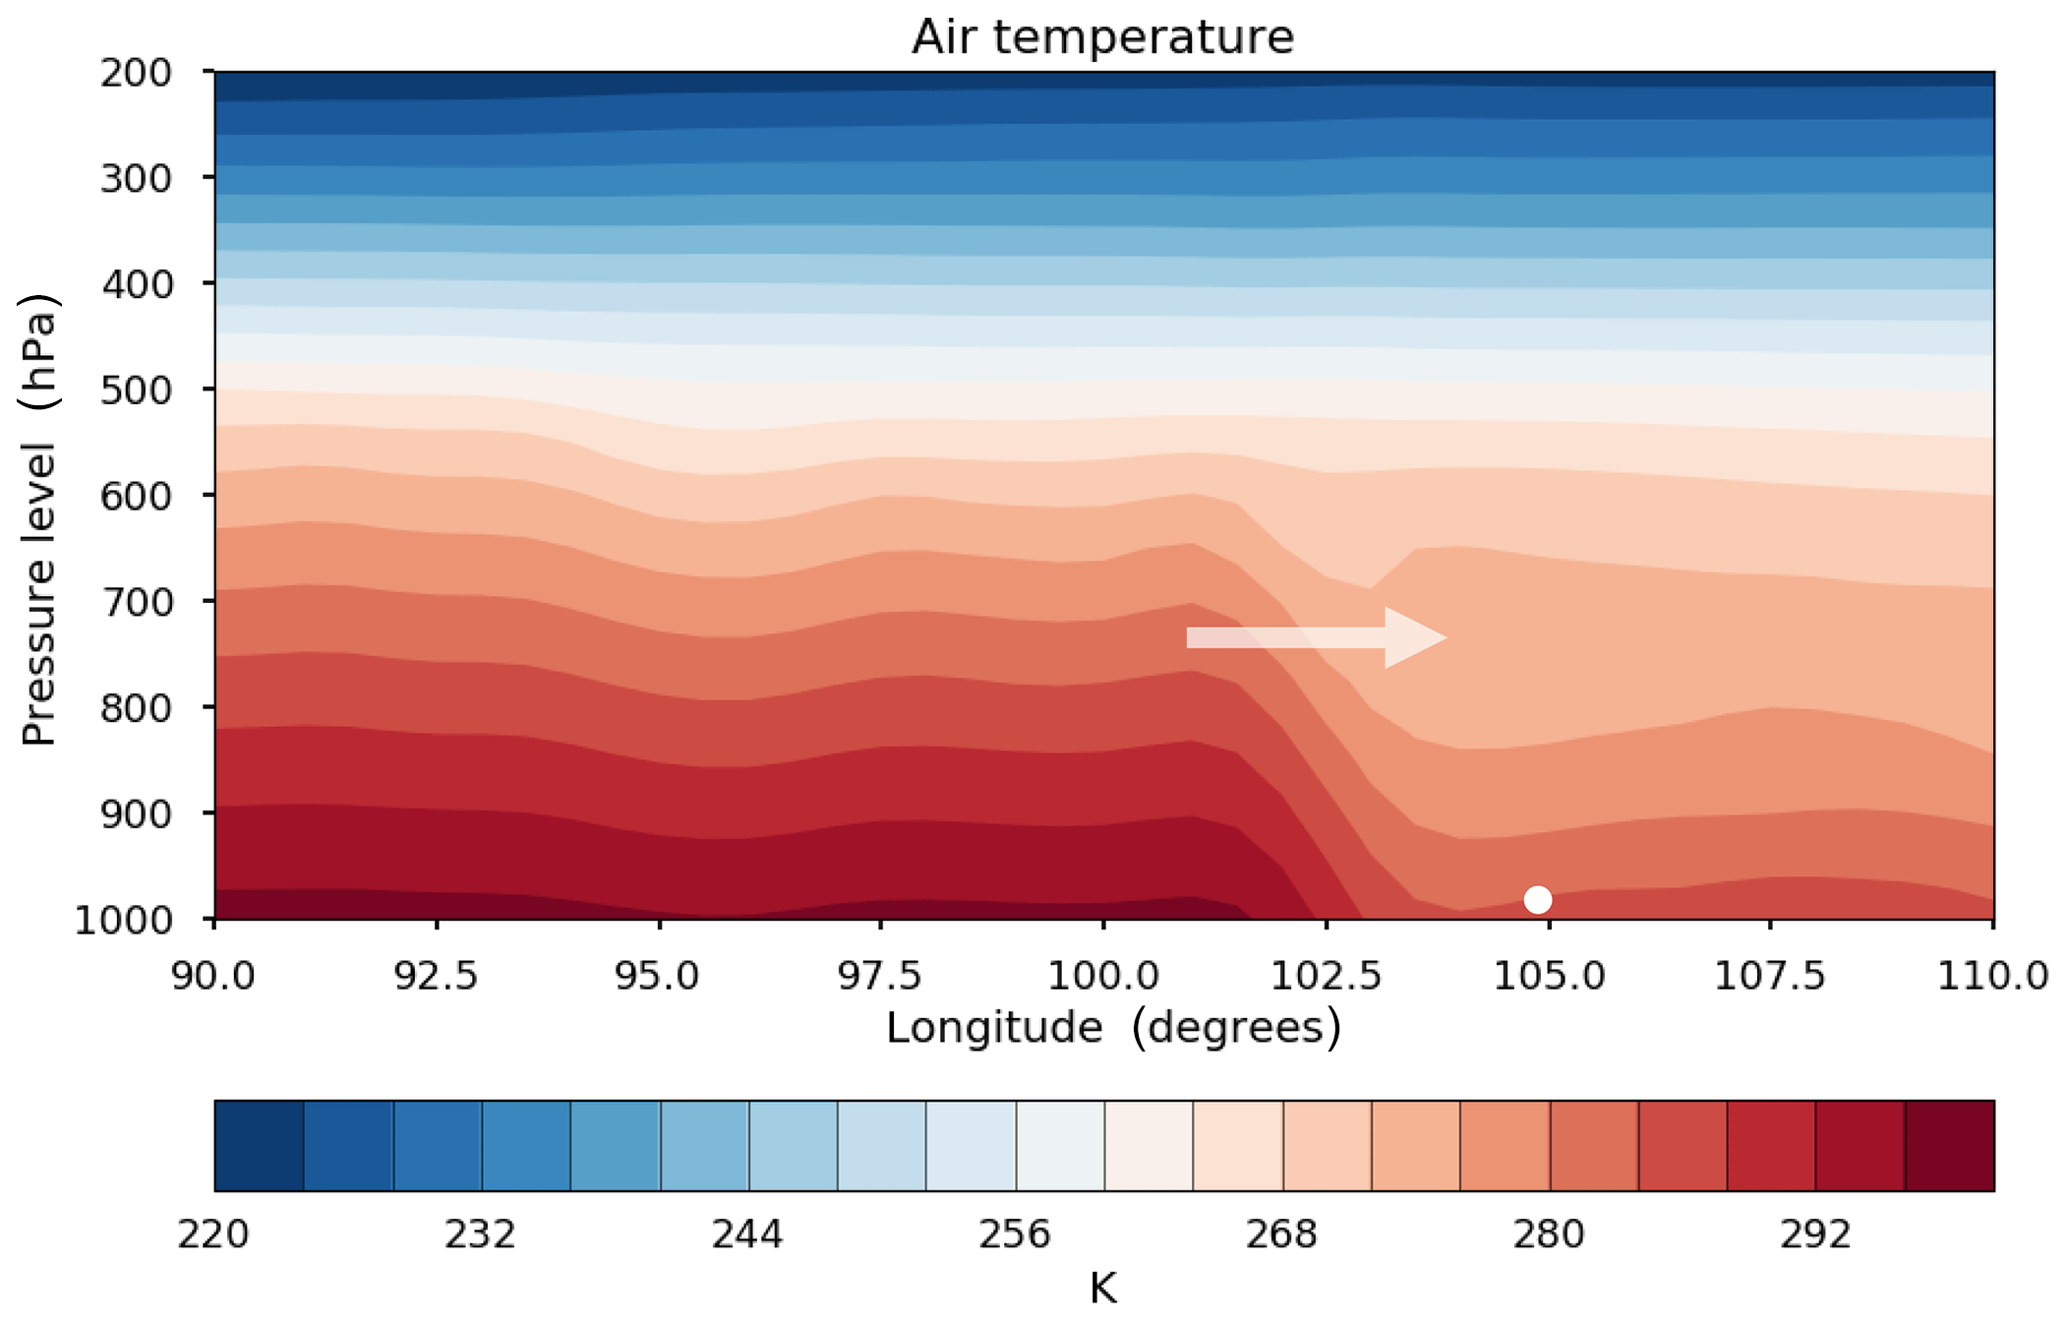
In addition to the near-surface weak winds, persistent aerosol pollution is a result of temperature inversions caused by the warm southwest advection (Fig. 12b, c, brown boxes). The ground of the Qinghai–Tibet Plateau is a heat source throughout the year (Ye and Gao, 1979); thus, it heats the near-surface ambient air (Fig. 13). When the relatively warm air moves east across the Tibet Plateau under southwesterly winds, it forms an inversion above the basin (Fig. 12c, brown boxes), which caps the convective layer and induces the accumulation of aerosols and water vapor.
Effective pollution clearing rarely occurs in Chengdu because the Sichuan Basin is less affected by the cold, clean northerly winds as a result of the surrounding high northern mountains. However, as soon as aerosol pollutants and water vapor are cleared, aerosol pollution forms again due to more longwave radiation lost from the ground. For example, during the 4–7 December 2016 period, the fog/cloud dissipated, and the PM2.5 mass concentration dropped to a low value on the 5th December (Fig. 14a, d). Due to the absence of cloud/fog blocking, more longwave radiation from the ground was emitted into space on the night of 6th December, and the surface net radiant exposure decreased from −0.58 on the 5th to −1.45 on the 6th December (2.5 times; Fig. 14e). The significant reduction in the surface radiation cooled the near-surface atmospheric temperature, which formed an inversion layer of approximately 50–100 m (Fig. 14c). Capped by the inversion layer, the PM2.5 mass concentration doubled after the night of the 6th December to form another aerosol pollution event (Fig. 14a).
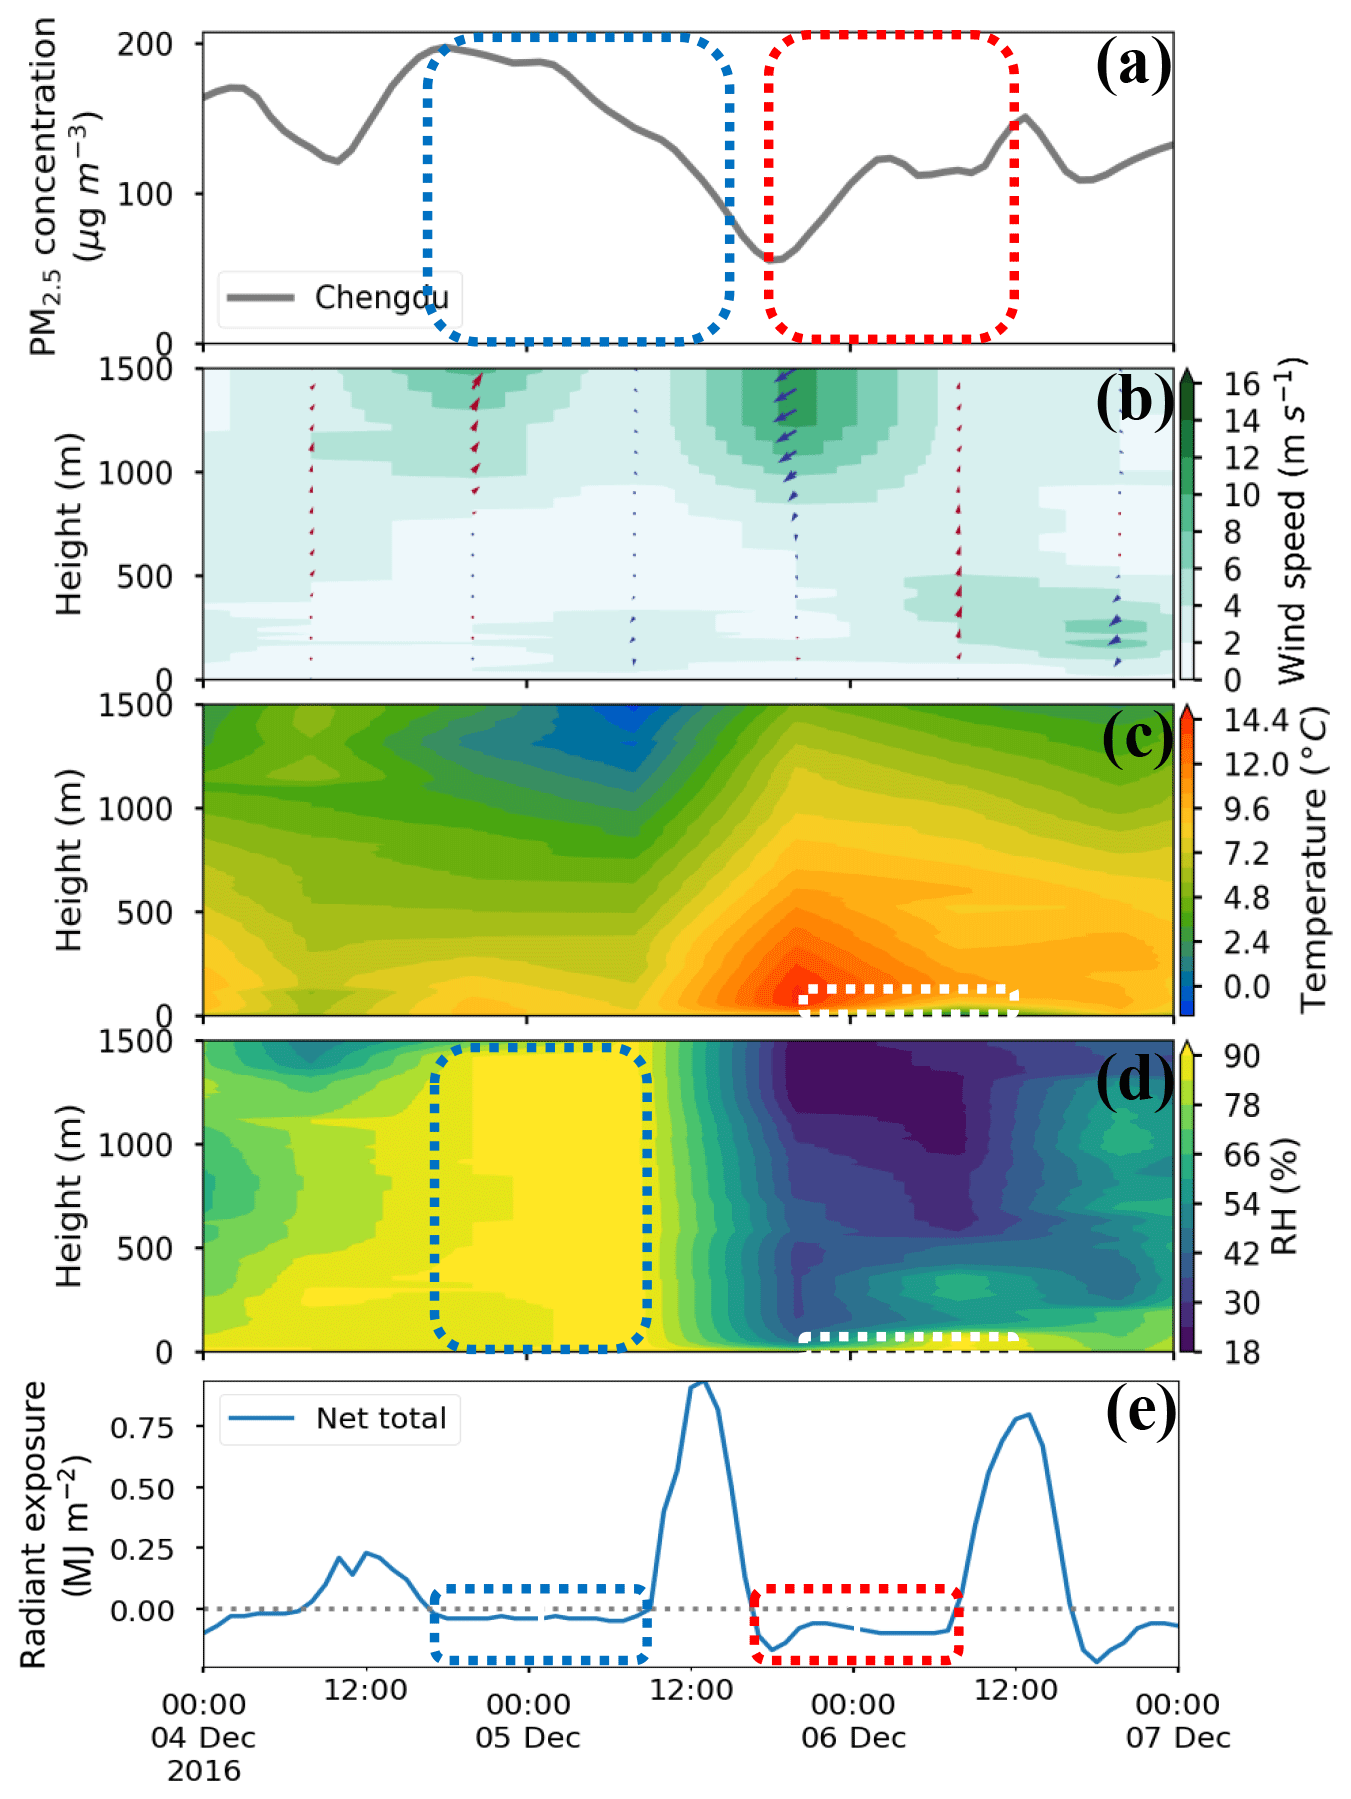
Figure 14Temporal variations in PM2.5, surface radiation and vertical distributions of meteorological factors from 4 to 7 December 2017. (a) PM2.5 mass concentration, (b) winds (vectors) and wind velocity, (c) temperature, (d) RH, and (e) global radiant exposure.
Pollution removal in Chengdu mainly relies on northeasterly winds to blow pollution away. The winds also carry water vapor to add humidity to the atmosphere above Chengdu, which converts pollutants into fog/cloud drops or produces precipitation that removes pollutants through wet removal (Fig. 12d, blue boxes).
3.6 The two-way feedback mechanism on the windy Northeast China Plain
The Northeast China Plain lies north of the Liaodong Gulf, west of the Changbai Mountains, east of the Greater Khingan Range, and south of the Lesser Khingan Range (Fig. 2). Due to the low mountains to the northwest, the Northeast China Plain is susceptible to cold, dry northerly air from Siberia in winter. As the largest city in northeastern China with respect to its urban population, Shenyang is located in the southwestern Northeast China Plain (Fig. 2), where the warm, humid southwesterly flows are transported from Bohai Bay.

Figure 15Temporal variations in PM2.5, surface radiation and vertical distributions of meteorological factors from 1 December 2016 to 10 January 2017. (a) PM2.5 mass concentration, (b) winds (vectors) and wind velocity, (c) temperature, (d) RH, and (e) global radiant exposure. (Blue lines: HPEs; light blue lines: PEs; white or red boxes: CSs; and blue dots: precipitation.)
From 1 December 2016 to 10 January 2017, six aerosol pollution episodes occurred in Shenyang (Fig. 15a, blue boxes), four of which persisted for more than 3 days with peak PM2.5 mass concentrations greater than 200 µg m−3 (Fig. 15a). During these HPEs, we observed surface radiation reductions, near-surface inversions, low-level RH enhancement, and increases in the PM2.5 mass concentration (Fig. 15a–d, red and white boxes) under slight or calm winds (Fig. 15b, red boxes); these conditions indicate the occurrence of the two-way feedback mechanism in Shenyang.
To quantify the magnitude of the two-way feedback during TSs and CSs in Shenyang, the air temperature difference between the radiosonde observations at 20:00 BJT and the ERA-Interim reanalysis data was obtained. Similar to Beijing and Xi'an, the temperature profile was also modified by aerosols during both the TSs and the CSs (Fig. 16a, b). However, the magnitude of near-ground cooling bias was lower than that in Beijing and Xi'an, which is due to relatively light aerosol pollution and windy conditions. From TSs to CSs, the negative temperature difference at 1000 hPa increased from −0.26 to −0.93 ∘C. The mean aerosol-induced cooling bias (1000 hPa) in the TSs was only 28.2 % of that in the CSs.
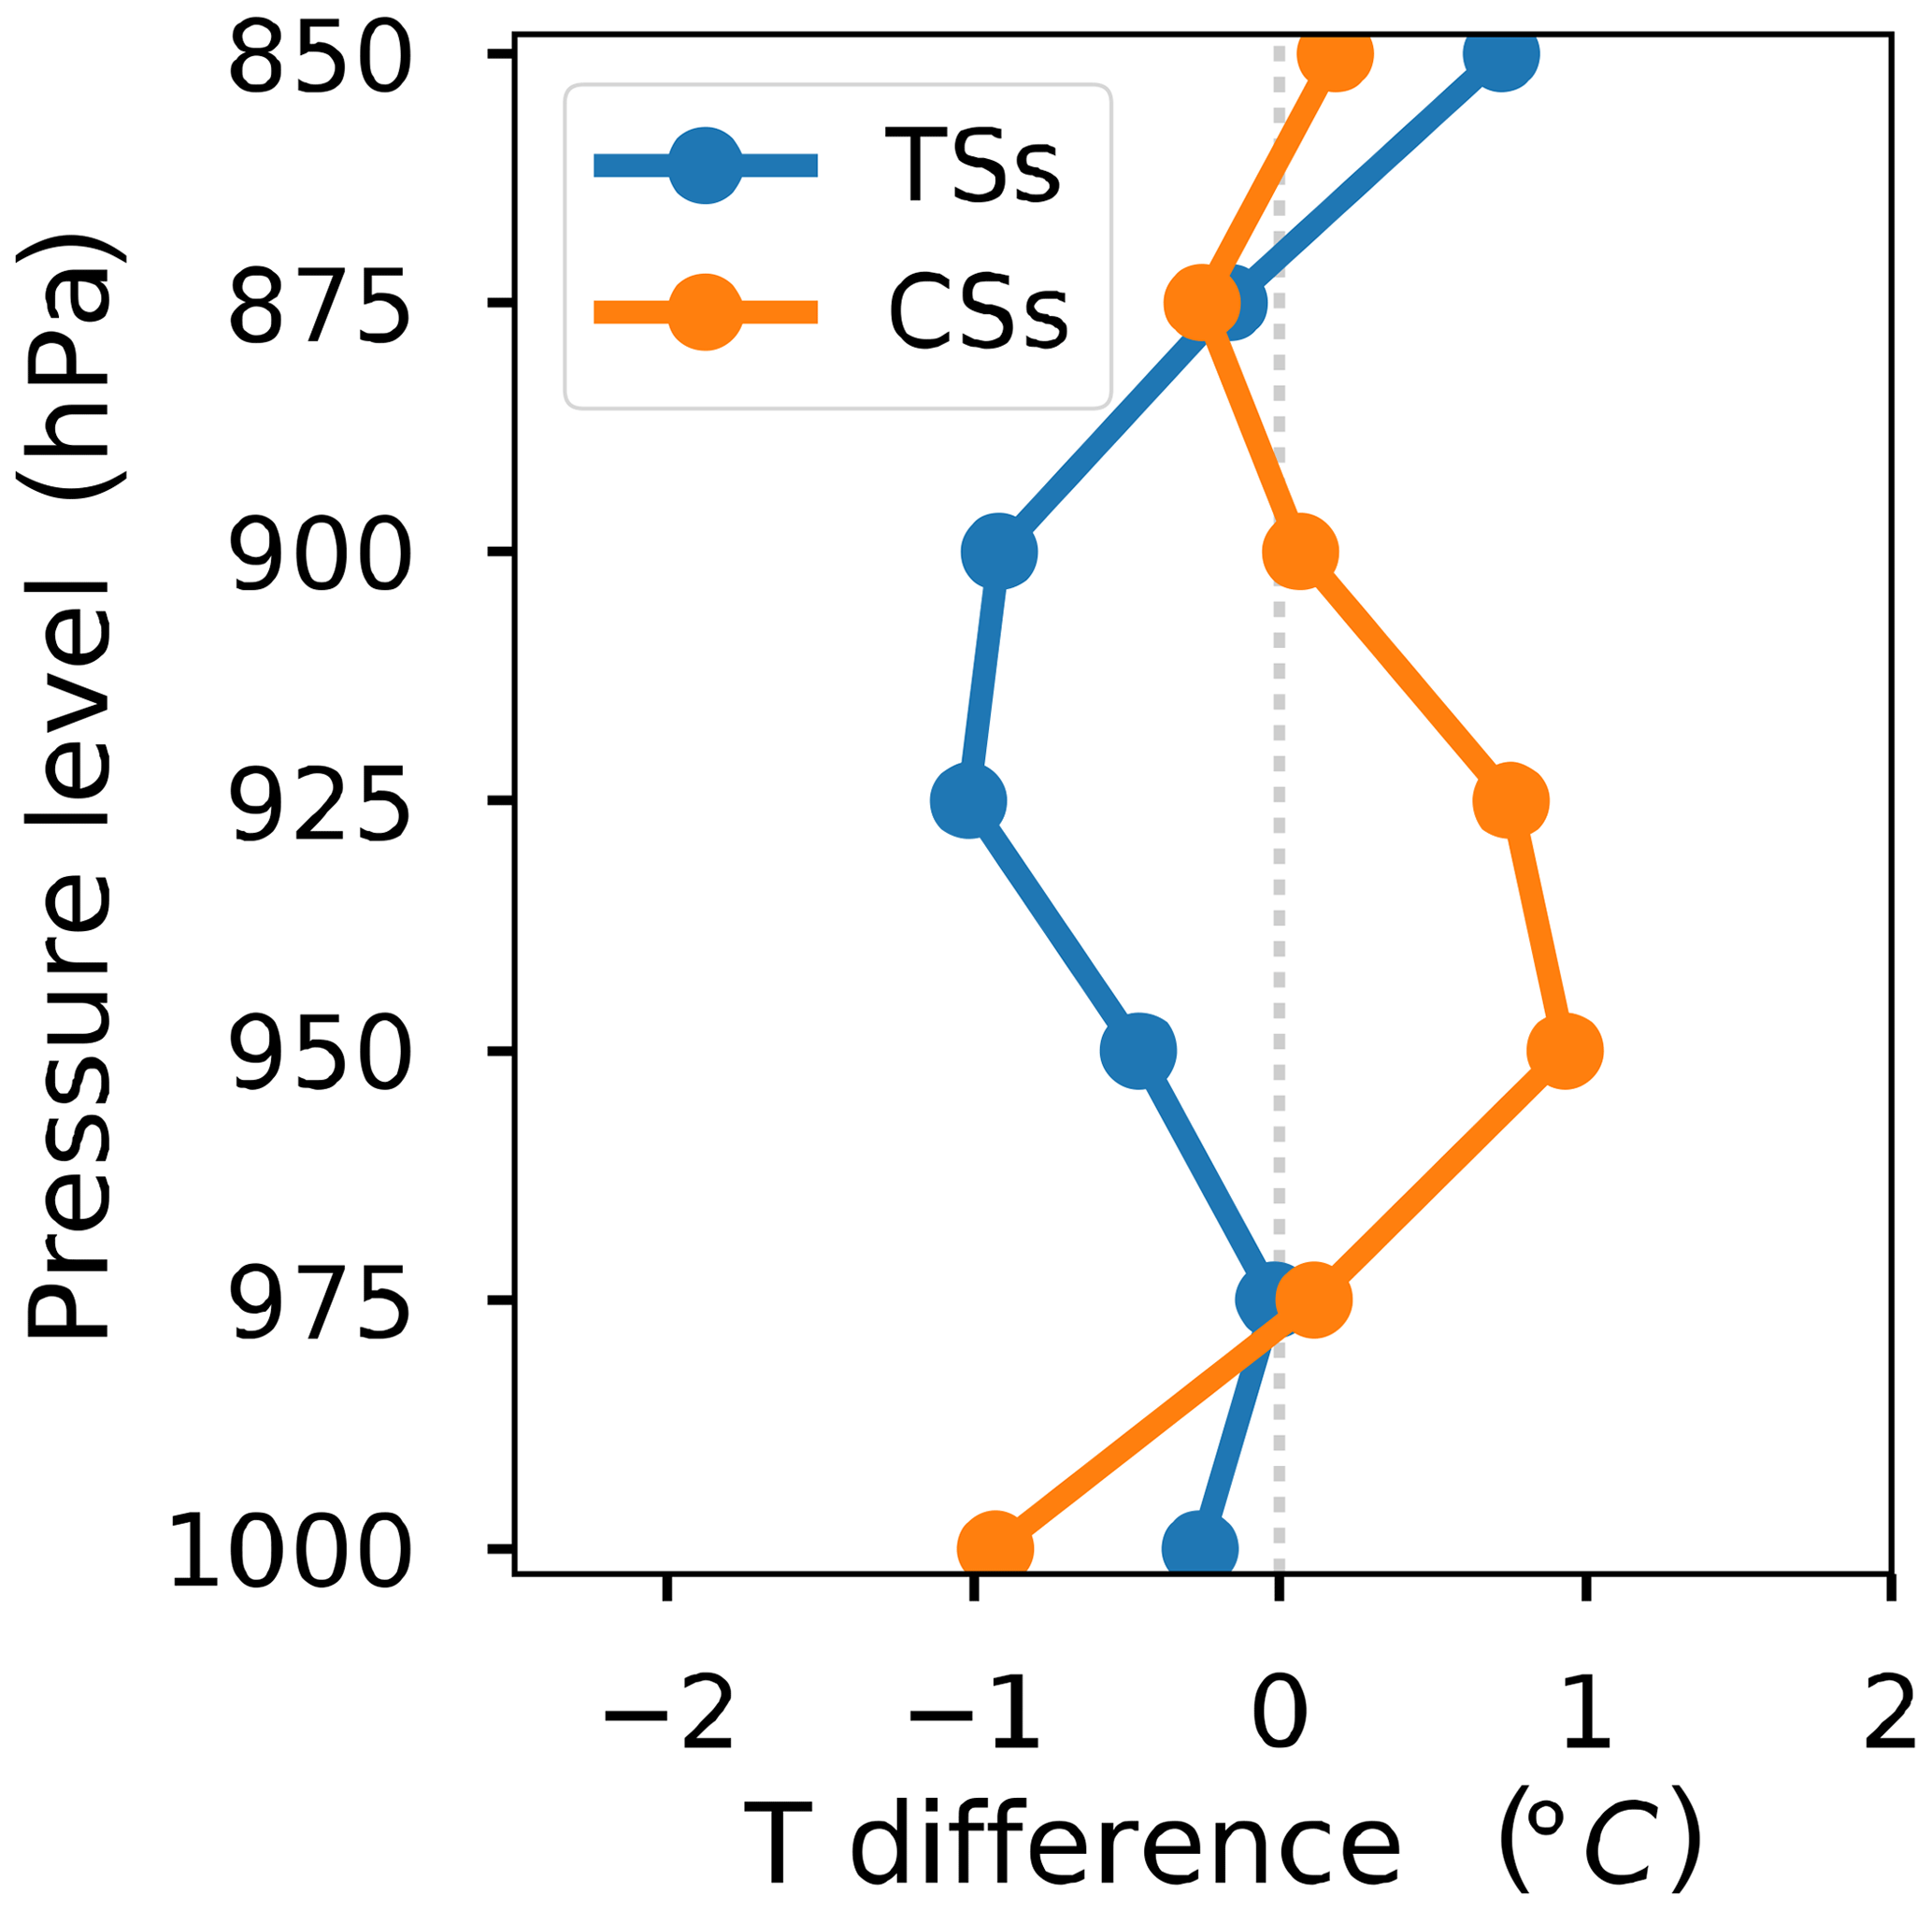
Figure 16Vertical mean temperature difference between sounding observations and ERA-Interim reanalysis data during TSs and CSs in Shenyang from 1 December 2016 to 10 January 2017.
Compared with those in Xi'an, Nanjing, Wuhan, Qingyuan, and Chengdu, the speeds of the southeasterly or northwesterly winds are strikingly higher in Shenyang. Relatively strong mid-lower southeasterly winds originate from Bohai Bay, and these winds transport warm, humid air that heats and adds humidity to the mid-upper layer above Shenyang (Fig. 15c, d). This air also transports aerosol pollutants to Shenyang because it carries pollutants from populated and polluted southwestern industrial regions, including Anshan. Lower strong northwesterly winds carry dry, cold air from Siberia to remove pollutants in Shenyang (Fig. 15a, b).
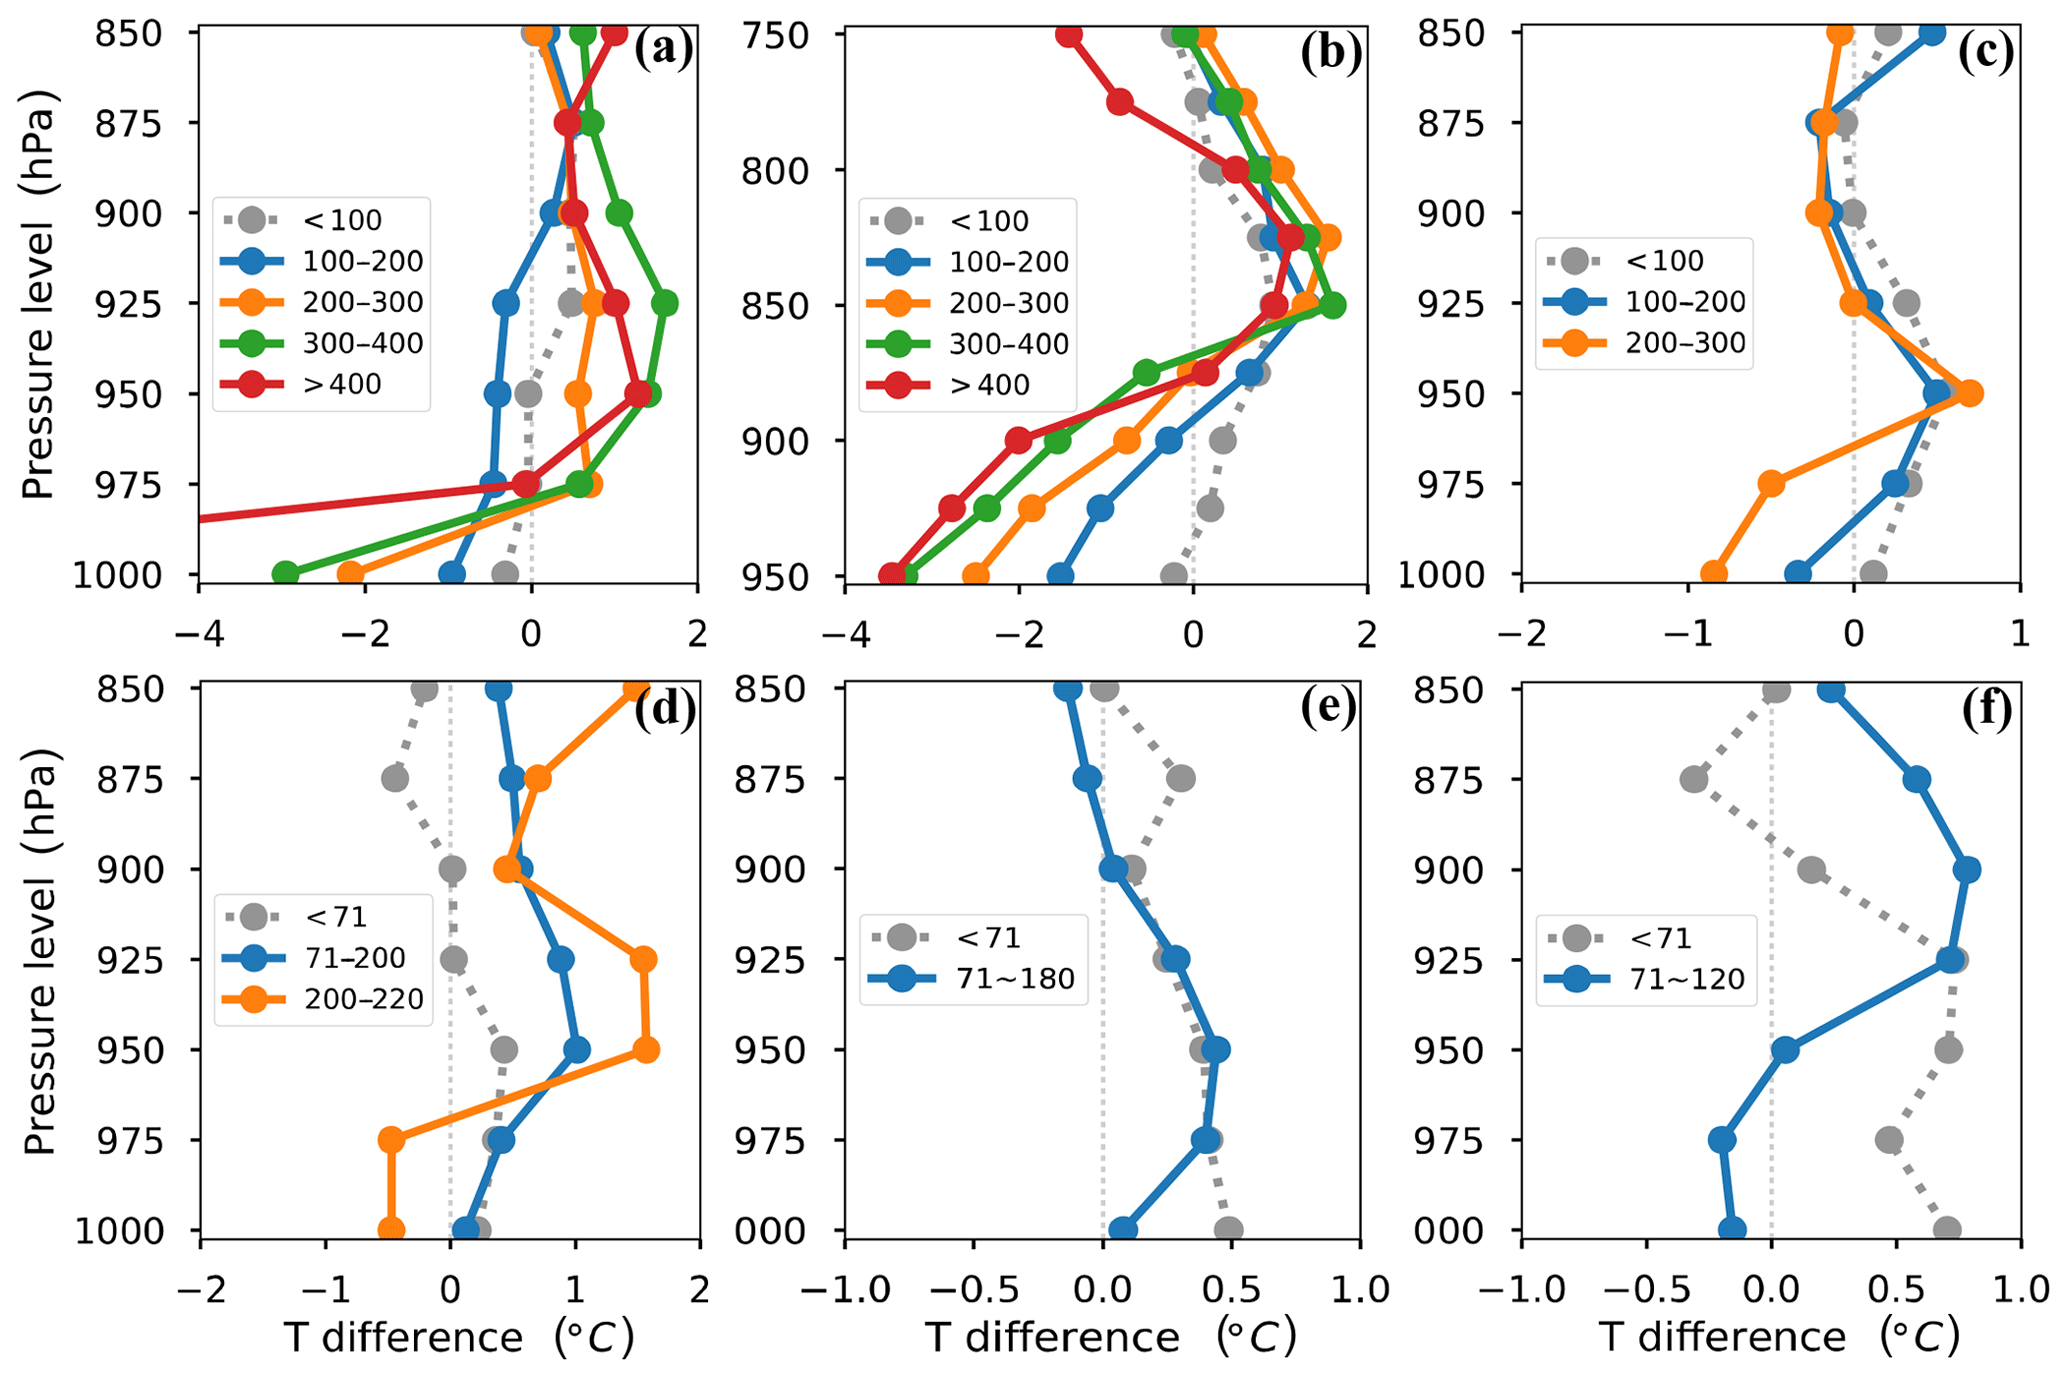
Figure 17Vertical temperature difference between sounding observations and ERA-Interim reanalysis data under different concentration bins of PM2.5 mass (µg m−3) in (a) Beijing, (b) Xi'an, (c) Shenyang, (d) Wuhan, (e) Nanjing, and (f) Qingyuan.
3.7 Quantifying the two-way feedback mechanism and comparing its magnitude
As previously mentioned, the weak two-way feedback mechanism in the Sichuan Basin is weakened by the cloudy mid-upper layers, which compete with the near-surface aerosols for solar radiation. However, the mechanism occurred in the Guanzhong Plain, the middle and lower reaches of the Yangtze River, the Pearl River Delta region, and the Northeast China Plain. Dominant scattering aerosols will scatter solar radiation to cause near-ground temperature reduction; absorbing aerosols will absorb solar radiation to heat the upper aerosol layer and subsequently cool the near-ground layer (Boucher et al., 2013a). Previous studies have found that aerosol profiles play an important role in the radiative cooling effects of aerosols, which results in vertical differences in meteorological factors (Wilcox et al., 2016; Wang et al., 2018). To quantify the magnitude of the two-way feedback in these haze regions of China, we obtained the vertical air temperature difference between the radiosonde observations affected by this two-way feedback and the ERA-Interim reanalysis data without feedback in the regional center cities, including Beijing, Xi'an, Shenyang, Wuhan, Nanjing, and Qingyuan (as a substitute for Guangzhou). A previous study established a threshold value for the PM2.5 mass concentration (100 µg m−3) that effectively activates the two-way feedback in HPEs; additionally, a lower threshold value (71 µg m−3) has been identified for lighter HPEs (Zhong et al., 2019). Therefore, based on the diurnal mean PM2.5 mass concentration (from 08:00 to 17:00 BJT), the temperature difference is further classified by the criterion of 100 µg m−3 in the more polluted North China Plain, Guanzhong Plain, and Northeast China Plain and by the criterion of 71 µg m−3 in the less polluted Two Lakes Plain, Yangtze River Delta, and Pearl River Delta.
By comparing the air temperature difference below and above these thresholds in the six cities, we found that the lower temperature profile was strikingly modified by the two-way feedback mechanism (Fig. 17). On the North China Plain, the Guanzhong Plain, and the Northeast China Plain, the lower temperature bias between the sounding observations and the ERA-Interim data was close to zero below the threshold of 100 µg m−3 but immediately became negative above the threshold (Fig. 17a–c). In the Two Lakes Plain, the Yangtze River Delta, and the Pearl River Delta, we observed a similar reduction in the temperature difference below and above the threshold of 71 µg m−3 (Fig. 17d–f). Overall, the magnitude of the two-way feedback mechanism was larger in the North China Plain, the Guanzhong Plain, and the Northeast China Plain than in the Two Lakes Plain, the Yangtze River Delta, and the Pearl River Delta.
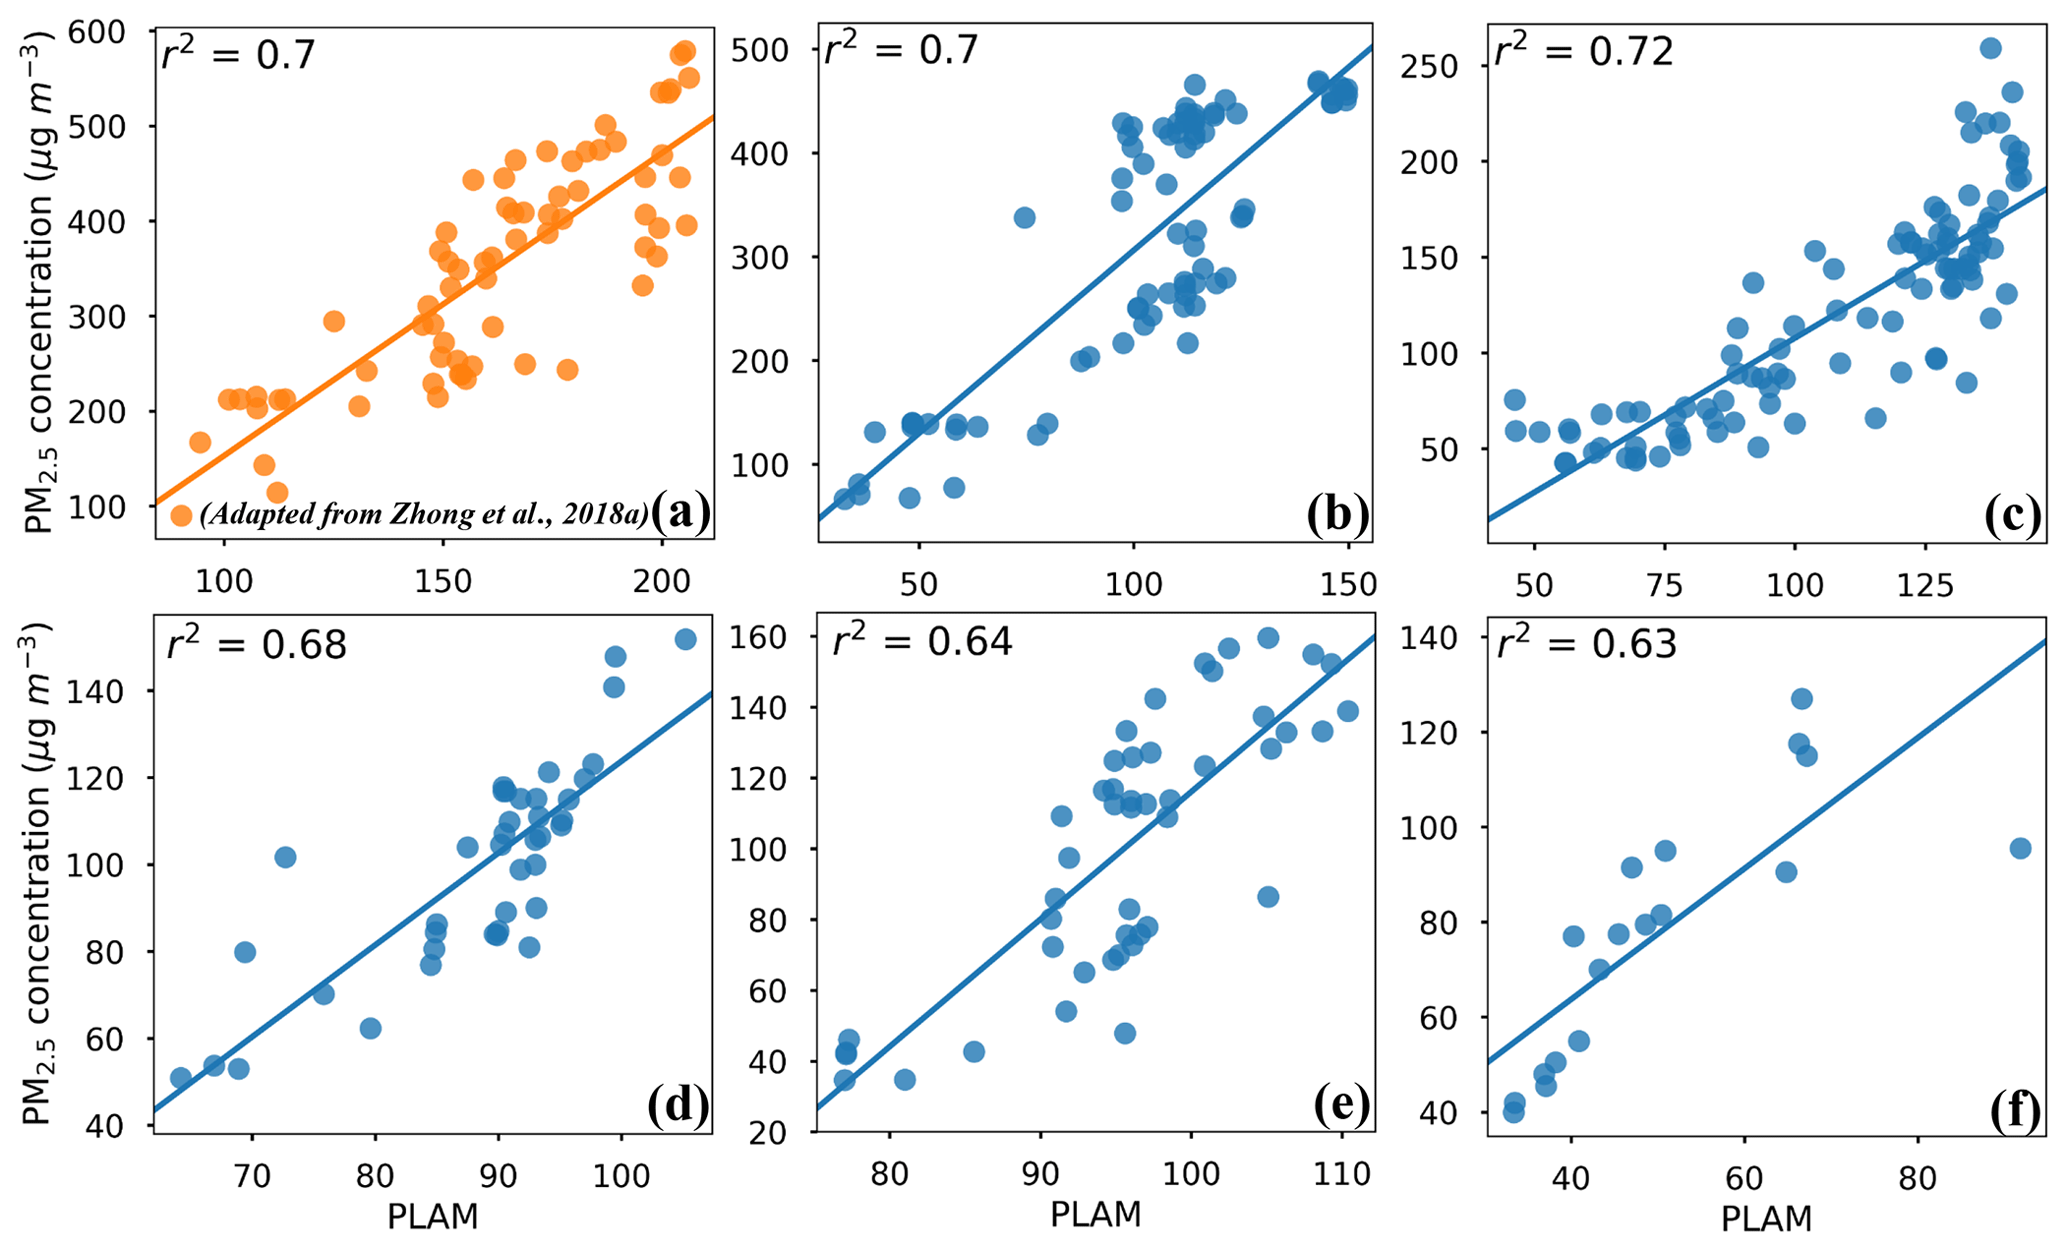
Figure 18Correlation between PLAM and PM2.5 during the typical rising processes of PM2.5 from 1 December 2016 to 10 January 2017.
For each representative site, the low-level cooling bias was more striking near the surface; additionally, as the PM2.5 mass concentration increased, the low-level cooling bias became more significant (Fig. 17). In Beijing, the negative temperature difference reached more than 2 ∘C with PM2.5 values in the range of 200–300 µg m−3 compared to approximately 1 ∘C in the range of 100–200 µg m−3. In Xi'an, the temperature difference decreased from approximately −1.5 ∘C in the range of 100–200 µg m−3 to 2.5 ∘C in the range of 200–300 µg m−3. In Shenyang, the cooling bias of approximately 0.6 ∘C occurred with the increase in PM2.5 from 100–200 to 200–300 µg m−3. Under the most polluted conditions, the near-ground cooling bias was greater than −4 ∘C, approximately −4 ∘C, and approximately −1 ∘C in Beijing, Xi'an, and Shenyang, respectively, which was substantially affected by the two-way feedback.
To quantify the feedback of deteriorating meteorological conditions on the increasing PM2.5 in the CSs, the PLAM index was used, which mainly reflects the stability of the air mass and the condensation rate of water vapor on aerosol particles. The squared correlation coefficients between the hourly PLAM and PM2.5 mass concentration in the typical processes of PM2.5 increase during the CSs were 0.71, 0.7, 0.72, 0.68, 0.64, and 0.63 in Beijing, Xi'an, Shenyang, Wuhan, Nanjing, and Qingyuan, respectively (Fig. 18a–f); these values exceeded the 0.05 significance level, which suggested that such a meteorological feedback on PM2.5 explained 60 %–70 % of the increase in the PM2.5 during the CSs.
Here, we used PM2.5 observations, surface radiation data, radiosonde observations, the PLAM index, and ERA-Interim reanalysis data to investigate the formation, accumulation, and dispersion of aerosol pollution during persistent heavy aerosol pollution episodes (HPEs) over 3 days, specifically focusing on the two-way feedback mechanism between unfavorable meteorological conditions and the cumulative PM2.5 pollution in various haze regions in China, including the Guanzhong Plain, the Yangtze River Delta region, the Two Lakes Basin, the Pearl River Delta, the Sichuan Basin, and the Northeast China Plain.
On the Guanzhong Plain, we observed a striking two-way feedback mechanism, including reduced surface radiation, near-surface inversions, RH enhancement in the lower part of the BL, and increases in PM2.5 mass concentrations under slight or calm winds in the CSs. For the representative site of Xi'an, the near-ground cooling bias caused by the two-way feedback was as high as approximately −4 ∘C, which was similar to that observed in Beijing. Bordered by the Qinling Mountains and the Loess Plateau, the Guanzhong Plain experiences inter-regional pollution transport below the BL, e.g., pollution transport to Xi'an from Yuncheng and Linfen under lower northwesterly winds in the TSs. Pollution clearing mainly depends on the lower strong northeasterly winds to blow pollutants away and the mid-upper southerly winds to transport water vapor to increase RH, which causes the PM2.5 to enter the fog-cloud phase.
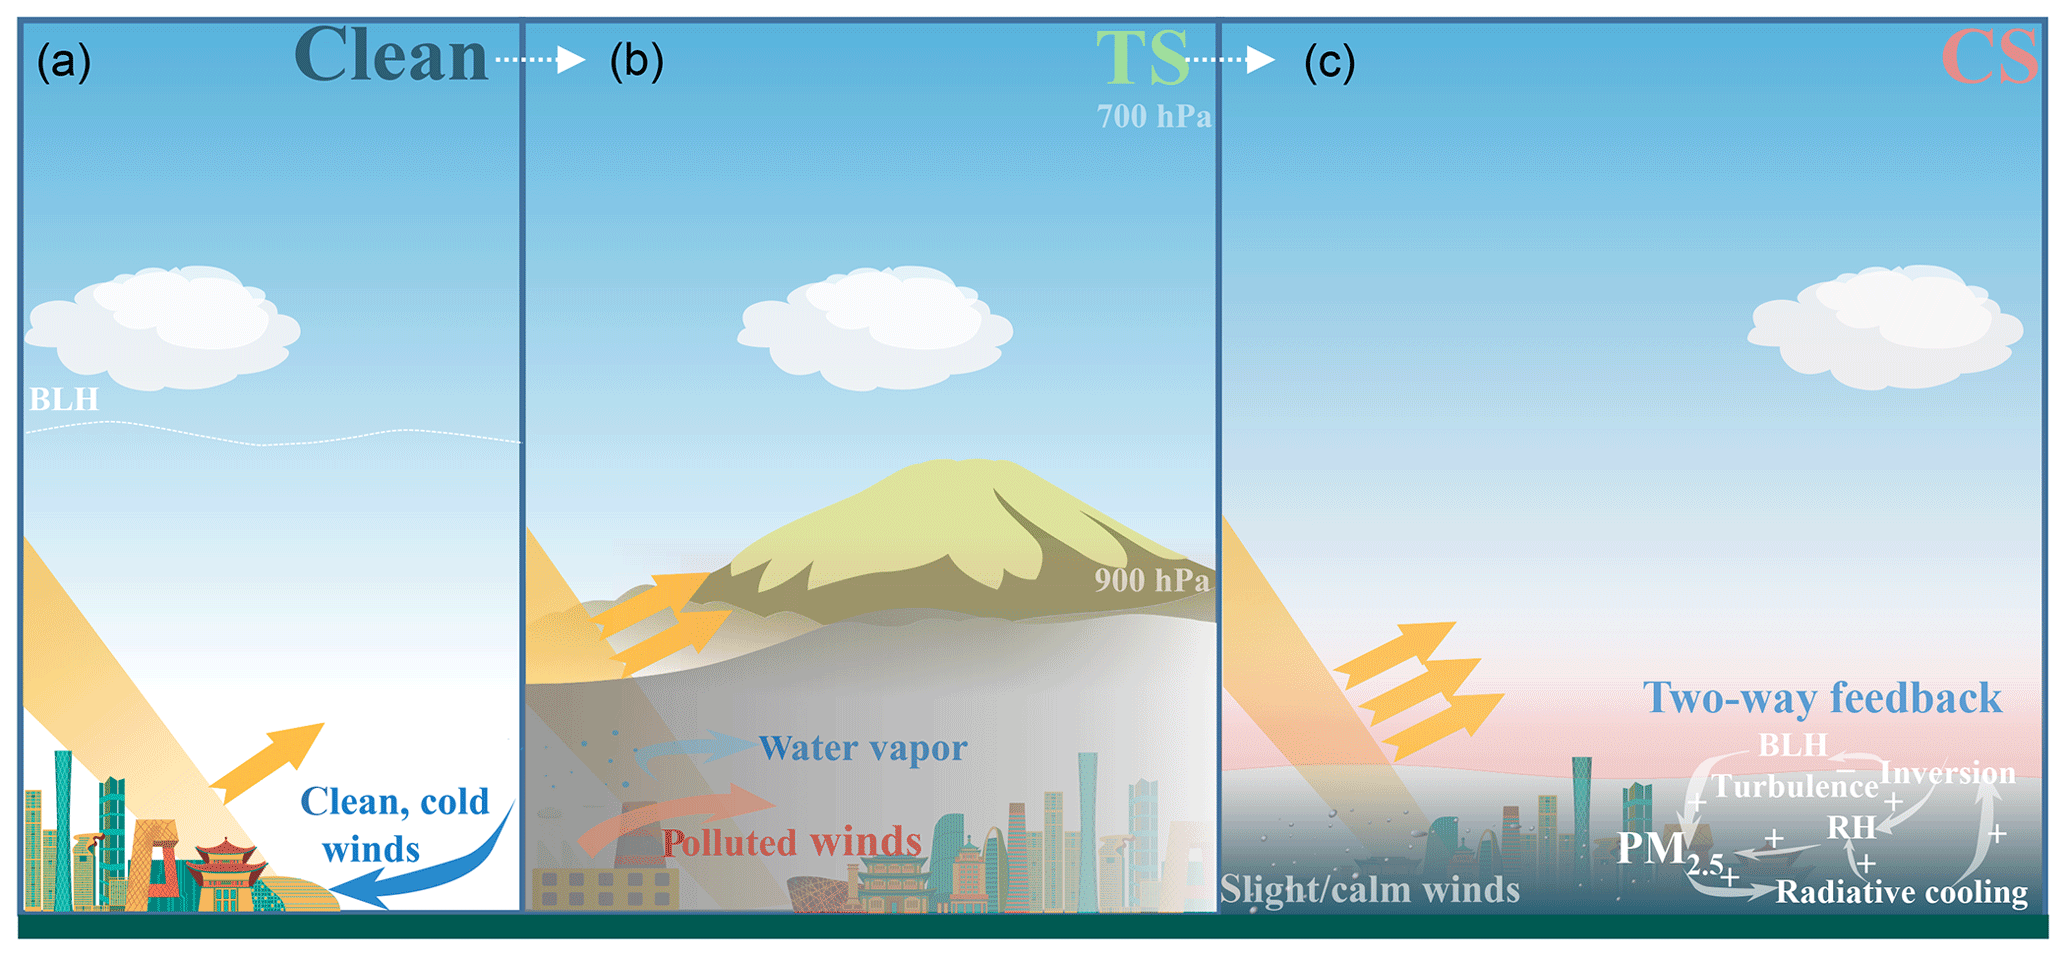
Figure 19A concept scheme of pollution removal (a), transport (b), and accumulation (c), specifically the two-way feedback mechanism between unfavorable meteorological conditions and cumulative aerosol pollution (c).
In the relatively less polluted Yangtze River Delta region, the aerosol pollution formation is similar to that in Beijing, including earlier TSs and later CSs. During the TSs, the Yangtze River Delta region is affected by trans-regional pollution transport below and above the BL from the North China Plain, which induces increases in the PM2.5 at the near-surface or in the higher atmosphere in this region, including Nanjing and Shanghai. Upper transported pollutants then move downward to increasingly worsen the near-ground aerosol pollution. During the CSs, we also observed the two-way feedback mechanism, but its magnitude was lower than that in Beijing due to the less-polluted conditions. In this region, pollution clearing relies on persistent stronger northerly winds to carry pollutants out of this area, or strong southeasterly winds, which transport clean, warm, humid air that blows pollutants away or increases ambient RH to cause the PM2.5 to enter the liquid fog-cloud phase. Similar to the Yangtze River Delta region, the Two Lakes Basin also experienced trans-regional pollution transport from the North China Plain under northerly winds below and sometimes above the BL during the TSs. During the CSs, the two-way feedback is activated, and the aerosol pollution worsens. In addition to the blowing effect of strong, persistent northerly winds, pollution clearing also depends on the mid-upper southerly winds, particularly the southwesterly winds, to transport water vapor, which enhances the RH and eliminates pollutants through fog–cloud conversion and wet removal.
In the least polluted Pearl River Delta, no feedback mechanism was observed with PM2.5 mass concentrations below the threshold. However, when the PM2.5 concentration exceeded the threshold, the two-way feedback occurred in the CSs. The delta region was purified by lower clean, cold northeasterly winds from the northern mountains and humidified by upper southerly winds from the South China Sea.
The Sichuan Basin is dominated by high RH and weak winds; thus, the two-way feedback mechanism was weakened by thick mid-upper fog/clouds that compete with the near-surface aerosols for solar radiation and consequently cool the whole atmosphere below. With the weak two-way feedback, the PM2.5 mass concentration increased under lower slight or calm winds and was capped by the upper temperature inversions caused by the upper southwesterly winds from the Tibetan Plateau. Pollution clearing mainly relies on northeasterly winds to blow pollutants away, and these winds also add humid air to the atmosphere, which converts aerosols into fog/cloud drops. Although pollutants and water vapor are cleared, aerosol pollution soon forms again due to more longwave radiation lost from the ground, which results in rare effective pollution clearing in the Sichuan Basin.
Compared with the above regions, the southerly and northerly winds are strikingly stronger in the Northeast China Plain. Strong mid-lower southeasterly winds originate from Bohai Bay, transport warm, humid air that heats and adds humidity to the inland area, and transport pollutants inter-regionally from polluted southwestern industrial regions. Lower strong northwesterly winds carry dry, cold air from Siberia to remove pollutants. At the representative site in Shenyang, a two-way feedback mechanism also exists during the CSs with slight or calm winds.
The transport, accumulation, and removal of pollution described above are visually illustrated in a conceptual scheme (Fig. 19), which particularly highlights the effect of the two-way feedback mechanism regarding its role in intensifying the HPEs. Due to the occurrence of a two-way feedback mechanism, effective pollution control could further mitigate aerosol pollution, whereas persistent worsening aerosol pollution could lead to an additional increase in PM2.5. Given the inter-regional and trans-regional pollution transport, the control of regional emissions among key haze regions in China, to reduce the transport of pollutants or permit them from reaching the threshold which triggers the two-way feedback mechanism, is essential to substantially reduce persistent heavy aerosol pollution episodes. At the same time, these results also show that, even in favorable weather conditions, aerosol pollutant emissions should not be allowed to occur without restrictions; when aerosol pollution cumulates to a certain extent, it will significantly worsen the BL meteorological conditions and “close” the “meteorological channels” available for pollution dispersion.
The data that support the findings of this study are available from the corresponding author upon reasonable request.
XZ and YW designed the research, and XZ and JZ carried out the analysis of observations. TW provided UAV observations. JW provided PLAM data. XS conducted a supplementary analysis. JZ wrote the first manuscript and XZ revised it. All authors contributed to the improvement of this manuscript and approved the final version of the paper.
The authors declare that they have no conflict of interest.
This research was supported by the National Key Project of MOST (grant no. 2016YFC0203306)
and the Atmospheric Pollution Control of the Prime Minister Fund (grant no. DQGG0104).
Edited by: Qiang Zhang
Reviewed by: two anonymous referees
Bai, N., Khazaei, M., van Eeden, S. F., and Laher, I.: The pharmacology of particulate matter air pollution-induced cardiovascular dysfunction, Pharmacol. Ther., 113, 16–29, https://doi.org/10.1016/j.pharmthera.2006.06.005, 2007.
Boucher, O., Randall, D., Artaxo, P., Bretherton, C., Feingold, G., Forster, P., Kerminen, V.-M., Kondo, Y., Liao, H., and Lohmann, U.: Clouds and aerosols, in: Climate change 2013: the physical science basis, Contribution of Working Group I to the Fifth Assessment Report of the Intergovernmental Panel on Climate Change, Cambridge University Press, Cambridge, 571–657, https://doi.org/10.1017/CBO9781107415324, 2013a.
Boucher, O., Randall, D., Artaxo, P., Bretherton, C., Feingold, G., Forster, P., Kerminen, V.-M., Kondo, Y., Liao, H., Lohmann, U., Rasch, P., Satheesh, S. K., Sherwood, S., Stevens, B., and Zhang, X. Y.: Clouds and Aerosols, in: Climate Change 2013: The Physical Science Basis. Contribution of Working Group I to the Fifth Assessment Report of the Intergovernmental Panel on Climate Change, edited by: Stocker, T. F., Qin, D., Plattner, G.-K., Tignor, M., Allen, S. K., Boschung, J., Nauels, A., Xia, Y., Bex, V., and Midgley, P. M., Cambridge University Press, Cambridge, UK and New York, NY, USA, 571–658, https://doi.org/10.1017/CBO9781107415324.016, 2013b.
Chen, Y., Ebenstein, A., Greenstone, M., and Li, H.: Evidence on the impact of sustained exposure to air pollution on life expectancy from China's Huai River policy, P. Natl. Acad. Sci. USA, 110, 12936–12941, https://doi.org/10.1073/pnas.1300018110, 2013.
Cheng, Y., Zheng, G., Chao, W., Mu, Q., Bo, Z., Wang, Z., Meng, G., Qiang, Z., He, K., and Carmichael, G.: Reactive nitrogen chemistry in aerosol water as a source of sulfate during haze events in China, Sci. Adv., 2, e1601530, https://doi.org/10.1126/sciadv.1601530, 2016.
Dee, D. P., Uppala, S. M., Simmons, A. J., Berrisford, P., Poli, P., Kobayashi, S., Andrae, U., Balmaseda, M. A., Balsamo, G., Bauer, P., Bechtold, P., Beljaars, A. C. M., van de Berg, L., Bidlot, J., Bormann, N., Delsol, C., Dragani, R., Fuentes, M., Geer, A. J., Haimberger, L., Healy, S. B., Hersbach, H., Hólm, E. V., Isaksen, L., Kållberg, P., Köhler, M., Matricardi, M., McNally, A. P., Monge-Sanz, B. M., Morcrette, J.-J., Park, B.-K., Peubey, C., de Rosnay, P., Tavolato, C., Thépaut, J.-N., and Vitart, F.: The ERA-Interim reanalysis: configuration and performance of the data assimilation system, Q. J. Roy. Meteorol. Soc., 137, 553–597, https://doi.org/10.1002/qj.828, 2011.
Ding, A. J., Huang, X., Nie, W., Sun, J. N., Kerminen, V. M., Petäjä, T., Su, H., Cheng, Y. F., Yang, X. Q., and Wang, M. H.: Enhanced haze pollution by black carbon in megacities in China, Geophys. Res. Lett., 43, 2873–2879, https://doi.org/10.1002/2016GL067745, 2016.
Ervens, B., Turpin, B. J., and Weber, R. J.: Secondary organic aerosol formation in cloud droplets and aqueous particles (aqSOA): a review of laboratory, field and model studies, Atmos. Chem. Phys., 11, 11069–11102, https://doi.org/10.5194/acp-11-11069-2011, 2011.
Fang, S., Han, Y., Chen, K., Lu, C., Yin, Y., Tan, H., and Wang, J.: Parameterization and comparative evaluation of the CCN number concentration on Mt. Huang, China, Atmos. Res., 181, 300–311, https://doi.org/10.1016/j.atmosres.2016.07.004, 2016.
Ji, D., Li, L., Wang, Y., Zhang, J., Cheng, M., Sun, Y., Liu, Z., Wang, L., Tang, G., and Hu, B.: The heaviest particulate air-pollution episodes occurred in northern China in January, 2013: insights gained from observation, Atmos. Environ., 92, 546–556, https://doi.org/10.1016/j.atmosenv.2014.04.048, 2014.
Kuang, Y., Zhao, C. S., Tao, J. C., Bian, Y. X., and Ma, N.: Impact of aerosol hygroscopic growth on the direct aerosol radiative effect in summer on North China Plain, Atmos. Environ., 147, 224–233, https://doi.org/10.1016/j.atmosenv.2016.10.013, 2016.
Liu, L., Zhang, X., Zhong, J., Wang, J., and Yang, Y.: The “two-way feedback mechanism” between unfavorable meteorological conditions and cumulative PM2.5 mass existing in polluted areas south of Beijing, submitted, 2018.
Matus, K., Nam, K.-M., Selin, N. E., Lamsal, L. N., Reilly, J. M., and Paltsev, S.: Health damages from air pollution in China, Global Environ. Change, 22, 55–66, https://doi.org/10.1016/j.gloenvcha.2011.08.006, 2012.
Pilinis, C., Seinfeld, J. H., and Grosjean, D.: Water content of atmospheric aerosols, Atmos. Environ., 23, 1601–1606, https://doi.org/10.1016/0004-6981(89)90419-8, 1989.
Poli, P., Healy, S., and Dee, D.: Assimilation of Global Positioning System radio occultation data in the ECMWF ERA-Interim reanalysis, Q. J. Roy. Meteorol. Soc., 136, 1972–1990, https://doi.org/10.1002/qj.722, 2010.
Simmons, A.: ERA-Interim: New ECMWF reanalysis products from 1989 onwards, ECMWF Newslett., 110, 25–36, https://doi.org/10.21957/pocnex23c6. 2006.
Su, F., Gao, Q., Zhang, Z., Ren, Z.-H., and Yang, X.-X.: Transport pathways of pollutants from outside in atmosphere boundary layer, Res. Environ. Sci., 1, 26–29, https://doi.org/10.13198/j.res.2004.01.28.sufq.005, 2004.
Tao, S.: Error Analyses for Temperature of L Band Radiosonde, Meteorol. Month., 32, 46–51, https://doi.org/10.7519/j.issn.1000-0526.2006.10.007, 2006.
Thépaut, J. N., Courtier, P., Belaud, G., and Lemaître, G.: Dynamical structure functions in a four-dimensional variational assimilation: A case study, Q. J. Roy. Meteorol. Soc., 122, 535–561, https://doi.org/10.1002/qj.49712253012, 1996.
Tie, X., Huang, R.-J., Cao, J., Zhang, Q., Cheng, Y., Su, H., Chang, D., Pöschl, U., Hoffmann, T., Dusek, U., Li, G., Worsnop, D. R., and O'Dowd, C. D.: Severe Pollution in China Amplified by Atmospheric Moisture, Sci. Rep., 7, 15760, https://doi.org/10.1038/s41598-017-15909-1, 2017.
Wang, J., Wang, Y., Liu, H., Yang, Y., Zhang, X., Li, Y., Zhang, Y., and Deng, G.: Diagnostic identification of the impact of meteorological conditions on PM2.5 concentrations in Beijing, Atmos. Environ., 81, 158–165, https://doi.org/10.1016/j.atmosenv.2013.08.033, 2013.
Wang, J. Z., Gong, S., Zhang, X. Y., Yang, Y. Q., Hou, Q., Zhou, C., and Wang, Y.: A parameterized method for air-quality diagnosis and its applications, Adv. Meteorol., 2012, 3181–3190, https://doi.org/10.1155/2012/238589, 2012.
Wang, Z., Huang, X., and Ding, A.: Dome effect of black carbon and its key influencing factors: a one-dimensional modelling study, Atmos. Chem. Phys., 18, 2821–2834, https://doi.org/10.5194/acp-18-2821-2018, 2018.
Wilcox, E. M., Thomas, R. M., Praveen, P. S., Pistone, K., Bender, F. A.-M., and Ramanathan, V.: Black carbon solar absorption suppresses turbulence in the atmospheric boundary layer, P. Natl. Acad. Sci. USA, 113, 11794–11799, https://doi.org/10.1073/pnas.1525746113, 2016.
Yang, Q., Li, L., Wang, Y., Wang, X., and Yingcheng, L. U.: Spatial distribution pattern of population and characteristics of its evolution in China during 1935–2010, Geogr. Res., 35, 1547–1560, https://doi.org/10.11821/dlyj201608012, 2016.
Ye, D. and Gao, Y.: Meteorology of the Tibetan Plateau, Science Publication Agency, Beijing, 1979.
Zhang, Q., Streets, D. G., Carmichael, G. R., He, K. B., Huo, H., Kannari, A., Klimont, Z., Park, I. S., Reddy, S., Fu, J. S., Chen, D., Duan, L., Lei, Y., Wang, L. T., and Yao, Z. L.: Asian emissions in 2006 for the NASA INTEX-B mission, Atmos. Chem. Phys., 9, 5131–5153, https://doi.org/10.5194/acp-9-5131-2009, 2009.
Zhang, Q., He, K., and Huo, H.: Cleaning China's air, Nature, 484, 161–162, https://doi.org/10.1038/484161a, 2012.
Zhang, X., Sun, J., Wang, Y., Li, W., Zhang, Q., Wang, W., Quan, J., Cao, G., Wang, J., Yang, Y., and Zhang, Y.: Factors contributing to haze and fog in China, Chin. Sci. Bull., 58, 1178, https://doi.org/10.1360/972013-150, 2013.
Zhang, X. Y., Wang, Y. Q., Lin, W. L., Zhang, Y. M., Zhang, X. C., Gong, S., Zhao, P., Yang, Y. Q., Wang, J. Z., and Hou, Q.: Changes of Atmospheric Composition and Optical Properties Over BEIJING – 2008 Olympic Monitoring Campaign, B. Am. Meteorol. Soc., 90, 1633–1651, https://doi.org/10.1175/2009BAMS2804.1, 2009.
Zhang, X. Y., Wang, Y. Q., Niu, T., Zhang, X. C., Gong, S. L., Zhang, Y. M., and Sun, J. Y.: Atmospheric aerosol compositions in China: spatial/temporal variability, chemical signature, regional haze distribution and comparisons with global aerosols, Atmos. Chem. Phys., 12, 779–799, https://doi.org/10.5194/acp-12-779-2012, 2012.
Zhang, X. Y., Wang, J. Z., Wang, Y. Q., Liu, H. L., Sun, J. Y., and Zhang, Y. M.: Changes in chemical components of aerosol particles in different haze regions in China from 2006 to 2013 and contribution of meteorological factors, Atmos. Chem. Phys., 15, 12935–12952, https://doi.org/10.5194/acp-15-12935-2015, 2015.
Zhong, J., Zhang, X., Wang, Y., Sun, J., Zhang, Y., Wang, J., Tan, K., Shen, X., Che, H., and Zhang, L.: Relative contributions of boundary-layer meteorological factors to the explosive growth of PM2.5 during the red-alert heavy pollution episodes in Beijing in December 2016, J. Meteorol. Res., 31, 809–819, https://doi.org/10.1007/s13351-017-7088-0, 2017.
Zhong, J., Zhang, X., Dong, Y., Wang, Y., Liu, C., Wang, J., Zhang, Y., and Che, H.: Feedback effects of boundary-layer meteorological factors on cumulative explosive growth of PM2.5 during winter heavy pollution episodes in Beijing from 2013 to 2016, Atmos. Chem. Phys., 18, 247–258, https://doi.org/10.5194/acp-18-247-2018, 2018a.
Zhong, J., Zhang, X., Wang, Y., Liu, C., and Dong, Y.: Heavy aerosol pollution episodes in winter Beijing enhanced by radiative cooling effects of aerosols, Atmos. Res., 209, 59–64, https://doi.org/10.1016/j.atmosres.2018.03.011, 2018b.
Zhong, J., Zhang, X., and Wang, Y.: Reflections on the threshold for PM2.5 explosive growth in the cumulative stage of winter heavy aerosol pollution episodes (HPEs) in Beijing, Tellus B, 71, 1–7, https://doi.org/10.1080/16000889.2018.1528134, 2019.
Zhou, S., Peng, S., Wang, M., Shen, A., and Liu, Z.: The Characteristics and Contributing Factors of Air Pollution in Nanjing: A Case Study Based on an Unmanned Aerial Vehicle Experiment and Multiple Datasets, Atmosphere, 9, 343–367, https://doi.org/10.3390/atmos9090343, 2018.
Zhu, W., Xu, X., Zheng, J., Yan, P., Wang, Y., and Cai, W.: The characteristics of abnormal wintertime pollution events in the Jing-Jin-Ji region and its relationships with meteorological factors, Sci. Total Environ., 626, 887–898, 2018.