the Creative Commons Attribution 4.0 License.
the Creative Commons Attribution 4.0 License.
 | 25 Feb 2019
Variability, timescales, and nonlinearity in climate responses to black carbon emissions
Hailong Wang
Catrin M. Mills
Philip J. Rasch
Black carbon (BC) particles exert a potentially large warming influence on the Earth system. Reductions in BC emissions have attracted attention as a possible means to moderate near-term temperature changes. For the first time, we evaluate regional climate responses, nonlinearity, and short-term transient responses to BC emission perturbations in the Arctic, midlatitudes, and globally based on a comprehensive set of emission-driven experiments using the Community Earth System Model (CESM). Surface temperature responses to BC emissions are complex, with surface warming over land from midlatitude BC perturbations partially offset by ocean cooling. Climate responses do not scale linearly with emissions. While stronger BC emission perturbations have a higher burden efficiency, their temperature sensitivity is lower. BC impacts temperature much faster than greenhouse gas forcing, with transient temperature responses in the Arctic and midlatitudes approaching a quasi-equilibrium state with a timescale of 2–3 years. We find large variability in BC-induced climate changes due to background model noise. As a result, removing present-day BC emissions results in discernible surface temperature changes for only limited regions of the globe. In order to better understand the climatic impacts of BC emissions, both the drivers of nonlinear responses and response variability need to be assessed across climate models.
- Article
(6574 KB) - Full-text XML
-
Supplement
(870 KB) - BibTeX
- EndNote


Black carbon (BC) aerosol, emitted from incomplete combustion, may be the second strongest positive anthropogenic climate forcing following carbon dioxide, which drew attention for potential climate change mitigation from reducing BC emissions (Jacobson, 2004; Shindell et al., 2012; Bond et al., 2013; Smith and Mizrahi, 2013). The relationship between forcing and surface temperature changes caused by BC is complex and forcing is not a reliable indicator of the climatic impact of BC emissions (Stjern et al., 2017). BC absorbs solar radiation within the atmospheric column thereby warming the atmosphere with an influence on surface temperature that depends on its vertical location. At high altitudes, BC cools the surface by absorbing solar radiation (i.e., blocking it from reaching the surface; Ramanathan and Carmichael, 2008), while BC at low altitudes warms the surface through diabatic heating (Ban-Weiss et al., 2012). In addition, heating the atmosphere and cooling the surface can increase atmospheric stability and therefore affect cloud formation, lifetime, and dynamical processes (Koren et al., 2004; McFarquhar and Wang, 2006; Koch and Del Genio, 2010). Through transformation from hydrophobic aggregates to hydrophilic particles coated with water-soluble substances (i.e., aging processes), BC can become cloud-nucleating particles (Oshima et al., 2009), alter cloud microphysical processes, and suppress precipitation (Boucher et al., 2013). BC-induced warming or cooling can increase or decrease surface evaporation, resulting in further changes in precipitation and cloud formation (McFarquhar and Wang, 2006; Andrews et al., 2010; Ming et al., 2010; Ban-Weiss et al., 2012; Kvalevåg et al., 2013). BC can also decrease surface albedo through deposition on snow and ice, which is especially important to the climate at high latitudes and particularly the Arctic (Flanner et al., 2007; Qian et al., 2014) as snow/ice albedo effects are strong there. Taken together, these processes result in interactions between BC and the atmosphere that can ultimately alter the net impact of BC on climate, which have been termed rapid adjustments (Stjern et al., 2017).
Studies found that increases in BC emissions may contribute to the amplification of Arctic warming directly by absorbing solar radiation in the atmosphere and indirectly by reducing surface albedo through deposition on snow and ice (Flanner et al., 2007; Qian et al., 2014). Flanner (2013) highlighted the importance of BC vertical location in Arctic climate responses, with surface warming (cooling) due to BC in the lower (upper) troposphere. In addition, BC outside the Arctic can influence the Arctic climate through changing poleward heat transport. With the BC snow/ice albedo effect excluded, Shindell and Faluvegi (2009) modeled an Arctic surface warming (cooling) due to reducing (enhancing) midlatitude BC atmospheric concentrations. Sand et al. (2013a) found that this was due to the increased northward heat transport into the Arctic. However, in another study where BC emissions were perturbed instead of concentrations, Sand et al. (2013b) reported a decrease in northward heat transport due to increases in midlatitude BC emissions and suggested that the heating effect of BC transported to the Arctic dominated the Arctic heating in the midlatitude perturbation simulation, leading to the opposite direction of atmospheric heat transport compared to the concentration-driven perturbations. They also found that increases in both BC emission and BC concentration in the Arctic atmosphere may weaken poleward heat transport due to increasing Arctic temperature driven by BC heating in the atmosphere and on snow and ice surfaces. Therefore, understanding the Arctic climate impact of regional BC emissions is important for the Arctic climate change mitigation (Sand et al., 2016).
In order to archive a statistically significant signal for Arctic surface temperature responses to BC emissions, Sand et al. (2013b) scaled present-day BC emissions within the Arctic by a factor of 150 and emissions from midlatitudes by a factor of 9 in the NorESM (Norwegian Earth System Model) model with BC snow/ice albedo effects included. They found that emissions of BC within the Arctic have an Arctic surface temperature response 5 times larger than those from midlatitudes and attributed this to BC snow/ice albedo feedbacks. The impact of BC emission perturbations on midlatitudes were not examined in that study, which we do in this work to contrast the impact of BC on the Arctic with midlatitudes.
Much of the previous work on BC has used atmosphere-only models or prescribed BC concentrations (Hansen et al., 2005; Ming et al., 2010; Ban-Weiss et al., 2012; Sand et al., 2013a), which artificially reduces variability in model results. Results qualitatively differ between prescribed BC-concentration and emission-driven simulations with coupled models (Sand et al., 2013a, b, 2015). A previous study using coupled models found that the BC response in three of these models showed high variability and inconsistency in the net sign of the responses to present-day BC emissions both between models and even between ensemble members from the same model (Baker et al., 2015). Stjern et al. (2017) investigated climate responses to a 10-fold increase in present-day anthropogenic BC concentrations or emissions using five concentration-driven and four emission-driven global climate models. They found that low-level cloud amounts increase, while higher-level clouds are diminished for all models, which is dominated by rapid adjustments. The negative rapid adjustments from changing clouds dampened positive instantaneous radiative forcing of BC at the top of the atmosphere (TOA), leading to a relatively small global surface warming. However, this study did not consider response variability or nonlinearity of responses. We note that the model used in our study contains a different aerosol treatment (see below) than the model used in Stjern et al. (2015).
To better understand the impacts of BC on climate, we present a comprehensive analysis using a set of coupled simulations that examine regional climate responses, nonlinearity, and short-term transient climate responses to BC emission perturbations. We focus in particular on the Arctic and also variability to assess if climate responses to BC emission changes are likely to be discernable. Only combustion and process-based anthropogenic BC emissions are perturbed, given that the net global climate impact of open burning emissions has been assessed to be small due to their high organic carbon fraction. A summary of key results is provided below.
2.1 Model description
Here we use the fully coupled CESM (Community Earth System Model; Hurrell et al., 2013) to simulate climate responses to BC emission perturbations. In CAM5-MAM4 (Community Atmosphere Model version 5, the atmospheric component of CESM) mass and number concentrations of aerosols are predicted within four lognormal modes (i.e., Aitken, accumulation, coarse, and primary carbon modes) of the modal aerosol module (MAM4; Liu et al., 2016). BC is emitted into the primary-carbon mode and aged into the accumulation mode when coated with sulfate or secondary organic aerosol. Particles in the accumulation mode, including BC and other species, can serve as cloud condensation nuclei and have microphysical effects on stratiform clouds and precipitation. The model physically treats aerosol–cloud interactions using two-moment stratiform cloud microphysics, which predicts number concentrations and mixing ratios of cloud water and ice (Morrison and Gettelman, 2008; Gettelman et al., 2010). Activation of stratiform cloud droplets is based on the scheme of Abdul-Razzak and Ghan (2000). In addition to the standard treatments of aerosol–cloud interactions, we also include a set of modifications that improves the simulation of aerosol wet scavenging and convective transport (Wang et al., 2013). Although aerosols have no microphysical impact on convective clouds, BC-induced atmospheric heating can affect the ambient temperature and convection. Convective precipitation can scavenge and remove aerosols. Previous studies have extensively evaluated the CAM5 model simulations of concentration, deposition, vertical profile, and optical properties of BC (Wang et al., 2013, 2015; Zhang et al., 2015a, b; Liu et al., 2016; Yang et al., 2017, 2018a, b), as well as climate variables (Hurrell et al., 2013; Yang et al., 2016a, b). The model can simulate well the BC aerosol and climate variables in most regions of the globe, but was reported to underestimate BC concentrations over China (Yang et al., 2018a) and the Arctic (Wang et al., 2013; although this earlier study used a different emissions dataset), implying a possible underestimate of climate responses to BC emissions in this study.
In our model simulations, atmospheric radiative transfer is calculated twice with BC included and excluded. The changes in direct radiative effect and cloud radiative effect induced by BC perturbation are calculated as and , respectively, where Fclear is the TOA flux calculated neglecting scattering and absorption by clouds, Fclean is the TOA flux calculated neglecting scattering and absorption by BC, Fclear,clean is the TOA flux calculated neglecting scattering and absorption by both clouds and BC, and Δ refers to the differences between the control and one of the emission perturbed simulations (Ghan, 2013). Note that these quantities include the impact of slow responses and feedbacks (e.g., changes in sea surface temperature and sea ice and feedbacks with clouds) so are not strictly comparable to the conventional definition of radiative forcing (Boucher et al., 2013). The BC snow/ice albedo effect on top of land and sea ice is included in the model (Flanner et al., 2007; Yang et al., 2017, 2018c).
2.2 Experimental configuration and emissions
The following simulations are performed in this study. All insolation, greenhouse gas concentrations, and aerosol and precursor emissions, except BC, are fixed at year 1850 levels, which include open burning emissions (van Marle et al., 2017).
The “MID7X” and “ARC150X” simulations use large emission perturbations to result in signals large enough for detailed analysis. These regions are also particularly important for BC impacts on the Arctic. The multipliers were selected following Sand et al. (2013b) with the expectation that these would result in similar radiative perturbations. This also allows a direct comparison to these previous results (Sand et al., 2013b; and also Baker et al., 2015), which are also BC-emission simulations using a coupled model with snow/ice albedo feedbacks. The “PD” (present-day) simulation then allows us to evaluate the impact of present-day anthropogenic emissions. In brief, the simulations conducted are the following.
-
PD: control simulation for BC in present-day conditions. BC emissions are fixed at year 2010 (average of 2008–2012).
-
ARC150X: perturbed simulation to quantify the climate responses to Arctic BC emissions. Same as PD except that year 2010 level anthropogenic BC emissions over the Arctic (60–90∘ N) are scaled by a factor of 150.
-
MID7X: perturbed simulation to quantify the climate responses to midlatitude BC emissions. Same as PD except that year 2010 level anthropogenic BC emissions over the midlatitudes (28–60∘ N) are scaled by a factor of 7.
-
ARC75X: perturbed simulation to quantify nonlinearity of climate responses to Arctic BC emissions. Same as ARC150X except that Arctic BC emissions are scaled by a factor of 75.
-
MID3.5X: perturbed simulation to quantify nonlinearity of climate responses to midlatitude BC emissions. Same as MID7X except that midlatitude BC emissions are scaled by a factor of 3.5.
-
MID14X: perturbed simulation to quantify nonlinearity of climate responses to midlatitudes BC emissions. Same as MID7X except that midlatitude BC emissions are scaled by a factor of 14.
-
PI: sensitivity simulation for BC in preindustrial conditions to compare results with Baker et al. (2015). BC emissions are at year 1850 levels.
Both mass and number of BC emissions are perturbed proportionally. Each simulation has one ensemble member for 100 years that are branched from year 81 of the PI simulation after 80 years spin-up, with the last 80 years used for most analysis. Another four short-term ensemble members for 30 years are conducted under both ARC150X and MID7X to examine the short-term transient climate response to BC emissions. These are branched from years 96, 112, 120, and 140 of the PI simulation.
The CEDS (Community Emissions Data System) anthropogenic emissions (Hoesly et al., 2018; version 2017-05-18) that were developed for the CMIP6 (Coupled Model Intercomparison Project Phase 6) model experiments are used in our simulations. Note that this emission dataset includes monthly BC emission seasonality, which has been shown to be important for simulating BC in the Arctic (Stohl et al., 2013). Figure S1 in the Supplement shows the spatial distribution of annual anthropogenic BC emissions for year 2010 (average of 2008–2012) and the regions for BC emission perturbation. Over 60–90∘ N, anthropogenic BC emissions are mostly over the lower latitude of the Arctic (60–70∘ N). Over the midlatitudes, high BC emissions are mainly located over eastern China. The annual total anthropogenic BC emission from the Arctic in year 2010 is 0.08 Tg C yr−1, with 70 % contributed by the energy sector. Scaled by a factor of 150, ARC150X has 12.63 Tg C yr−1 more BC emissions than the PD in the Arctic. About 3.46 Tg C yr−1 of BC is emitted from the midlatitudes, with the largest contribution from the residential sector (36 %). With a scaling factor of 7, MID7X includes an additional 20.74 Tg C yr−1 of BC emission from midlatitudes, as compared to PD. Global annual anthropogenic BC for PD is 7.72 Tg C yr−1, much higher than 0.92 Tg C yr−1 for PI.
We first examine results from simulations with large perturbations of Arctic and midlatitude BC emissions (ARC150X and MID7X). Our initial simulations focused on these regions due to the potentially high sensitivity of the Arctic to BC emissions. Figure 1 presents the increases in annual zonal-mean BC concentrations from ARC150X and MID7X simulations, as compared to PD. Both Arctic and midlatitude BC emissions lead to BC concentration increases in the entire Northern Hemisphere, with Arctic emissions mainly impacting low altitudes within the Arctic. In ARC150X, due to extremely low temperatures at the surface and therefore temperature inversions and a transport barrier (the so-called Arctic front), BC concentration increases are mainly located over low altitudes within the Arctic. In MID7X, increased midlatitude emissions produce large increases in BC concentrations between 30 and 45∘ N. BC emitted over the midlatitudes, which is lifted above the boundary layer and transported at higher altitudes into the Arctic, leading to increased concentrations of BC in the Arctic atmosphere. This spatial pattern is similar to that in Sand et al. (2013b).
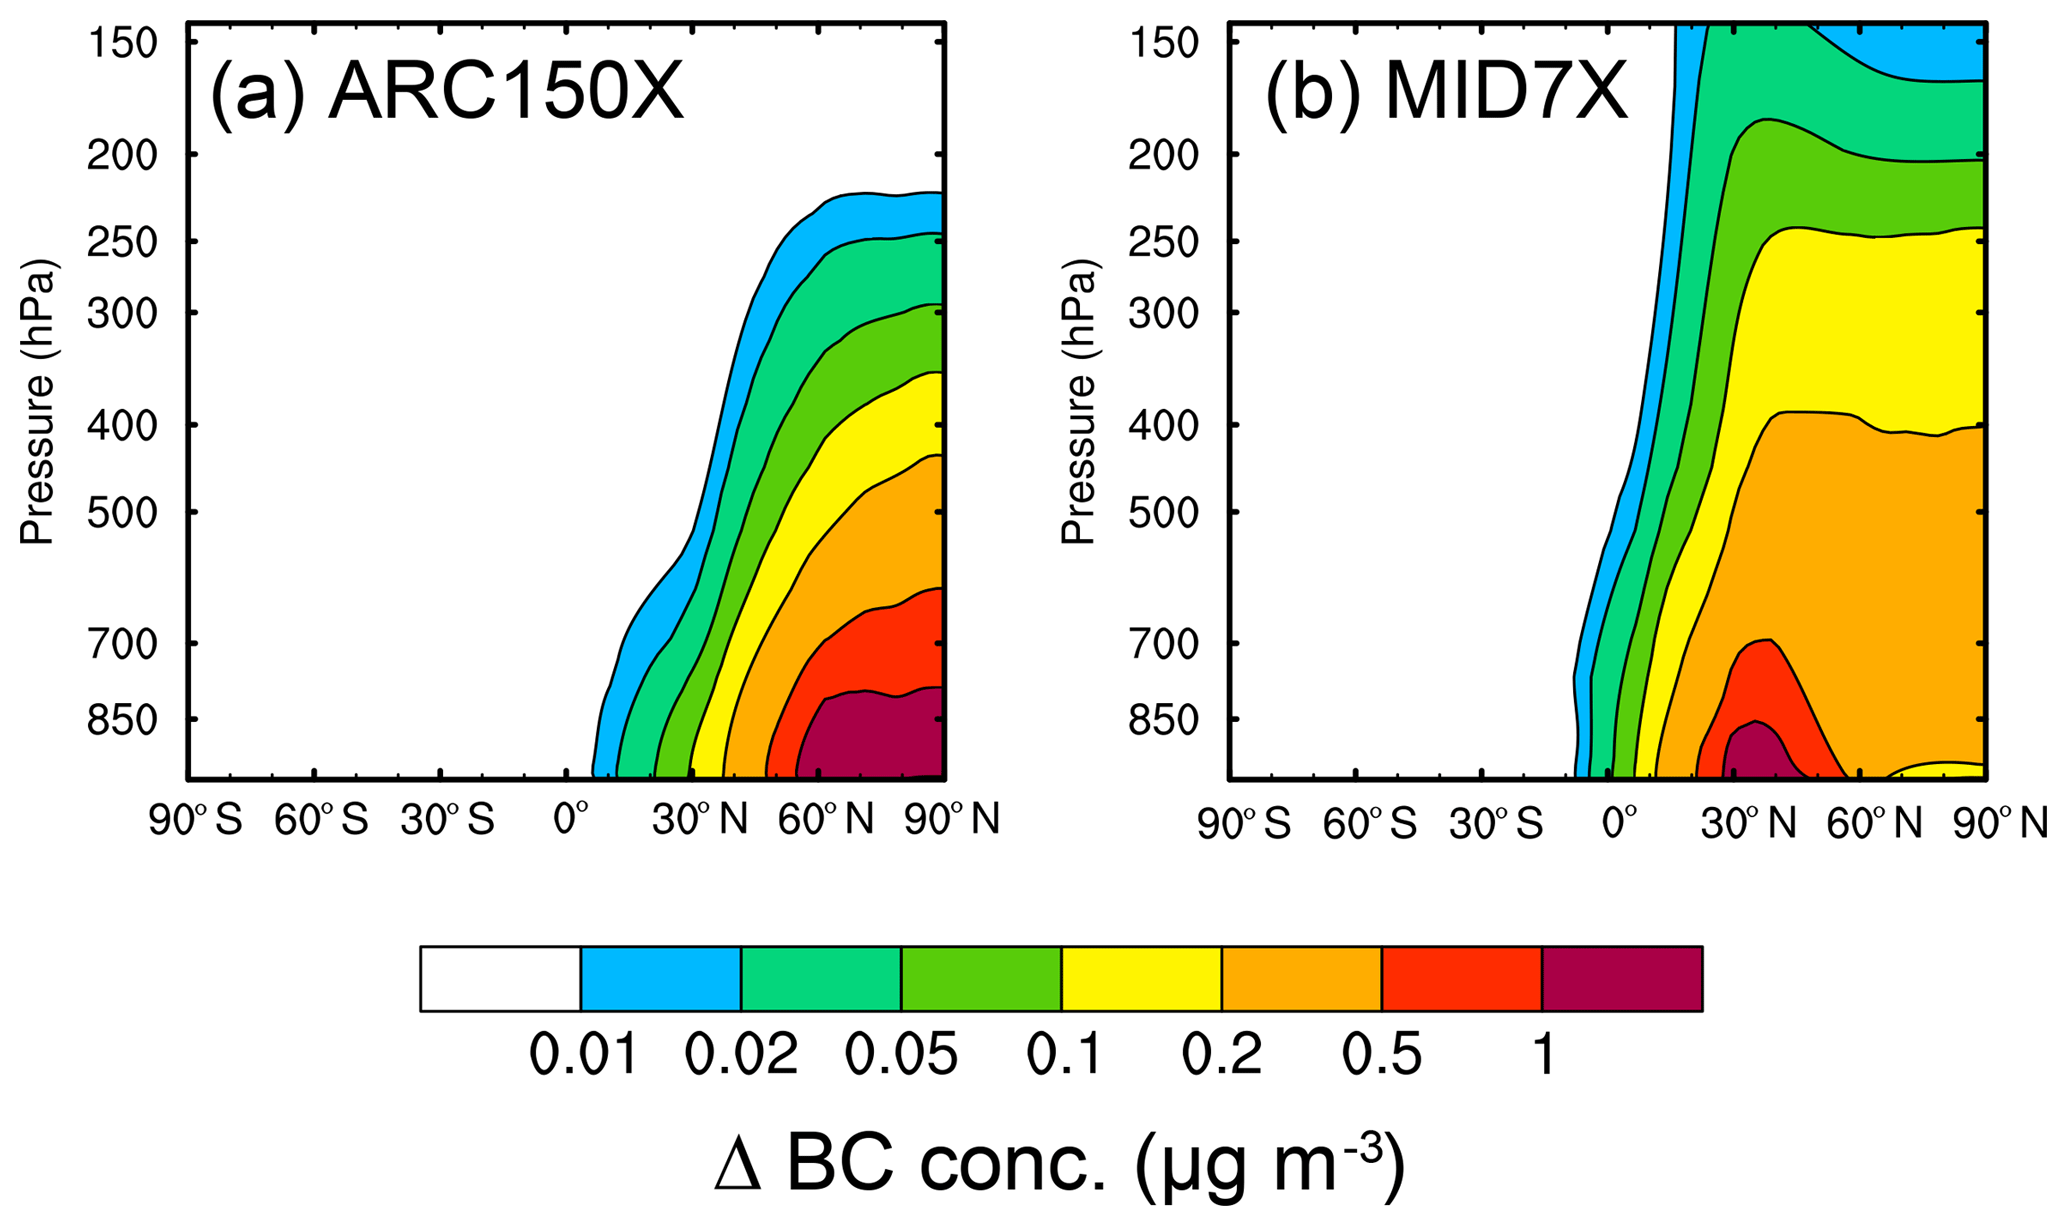
Figure 1Difference in annual and zonal-mean BC concentrations (µg m−3) between ARC150X (a), MID7X (b), and PD simulations.
To explore the importance of emissions from these source regions to BC column burdens, Table 1 summarizes BC burden efficiency, which is defined as the changes in regional mean column burden of BC produced by per unit emission change, calculated by differences between the perturbed and PD simulation. Over the Arctic, increases in Arctic local BC emissions lead to an Arctic column burden efficiency of 0.425±0.024 mg m−2 (Tg yr−1)−1. The burden efficiency of midlatitude emissions over the midlatitudes is 0.191±0.004 mg m−2 (Tg yr−1)−1, less than half of the efficiency of Arctic emission on Arctic burden due to lower precipitation and frequent temperature inversion in the Arctic compared to midlatitudes. While the relative impact of midlatitude emissions on the Arctic burden efficiency (0.106±0.004 mg m−2 (Tg yr−1)−1) is smaller than either of the above efficiencies, the 28 times larger present-day total emissions from midlatitudes (3.70 Tg yr−1) than the Arctic (0.13 Tg yr−1) dominate column burden contributions.
Table 1Changes in black carbon (BC) column burden, direct radiative effect (DRE), and cloud radiative effect (CRE) at the top of the atmosphere (TOA), surface BC snow/ice albedo forcing, surface temperature (T), and total precipitation rate (P, including rain and snow) averaged over the Arctic (60–90∘ N), midlatitudes (28–60∘ N), and the globe between perturbed (ARC150X/MID7X) and PD simulations. BC burden, DRE, CRE, and snow/ice albedo forcing efficiencies, T sensitivity and P sensitivity are calculated as changes in regional mean BC column burden, DRE, CRE, snow/ice albedo forcing, T and P divided by changes in global total BC emissions between perturbed and PD simulations. 1σ for 80 annual means is shown in the parentheses. Note that these quantities include the impact of slow responses and feedbacks (e.g., changes in sea surface temperature and sea ice and feedbacks with clouds) so are not strictly comparable to the conventional definition of radiative forcing.
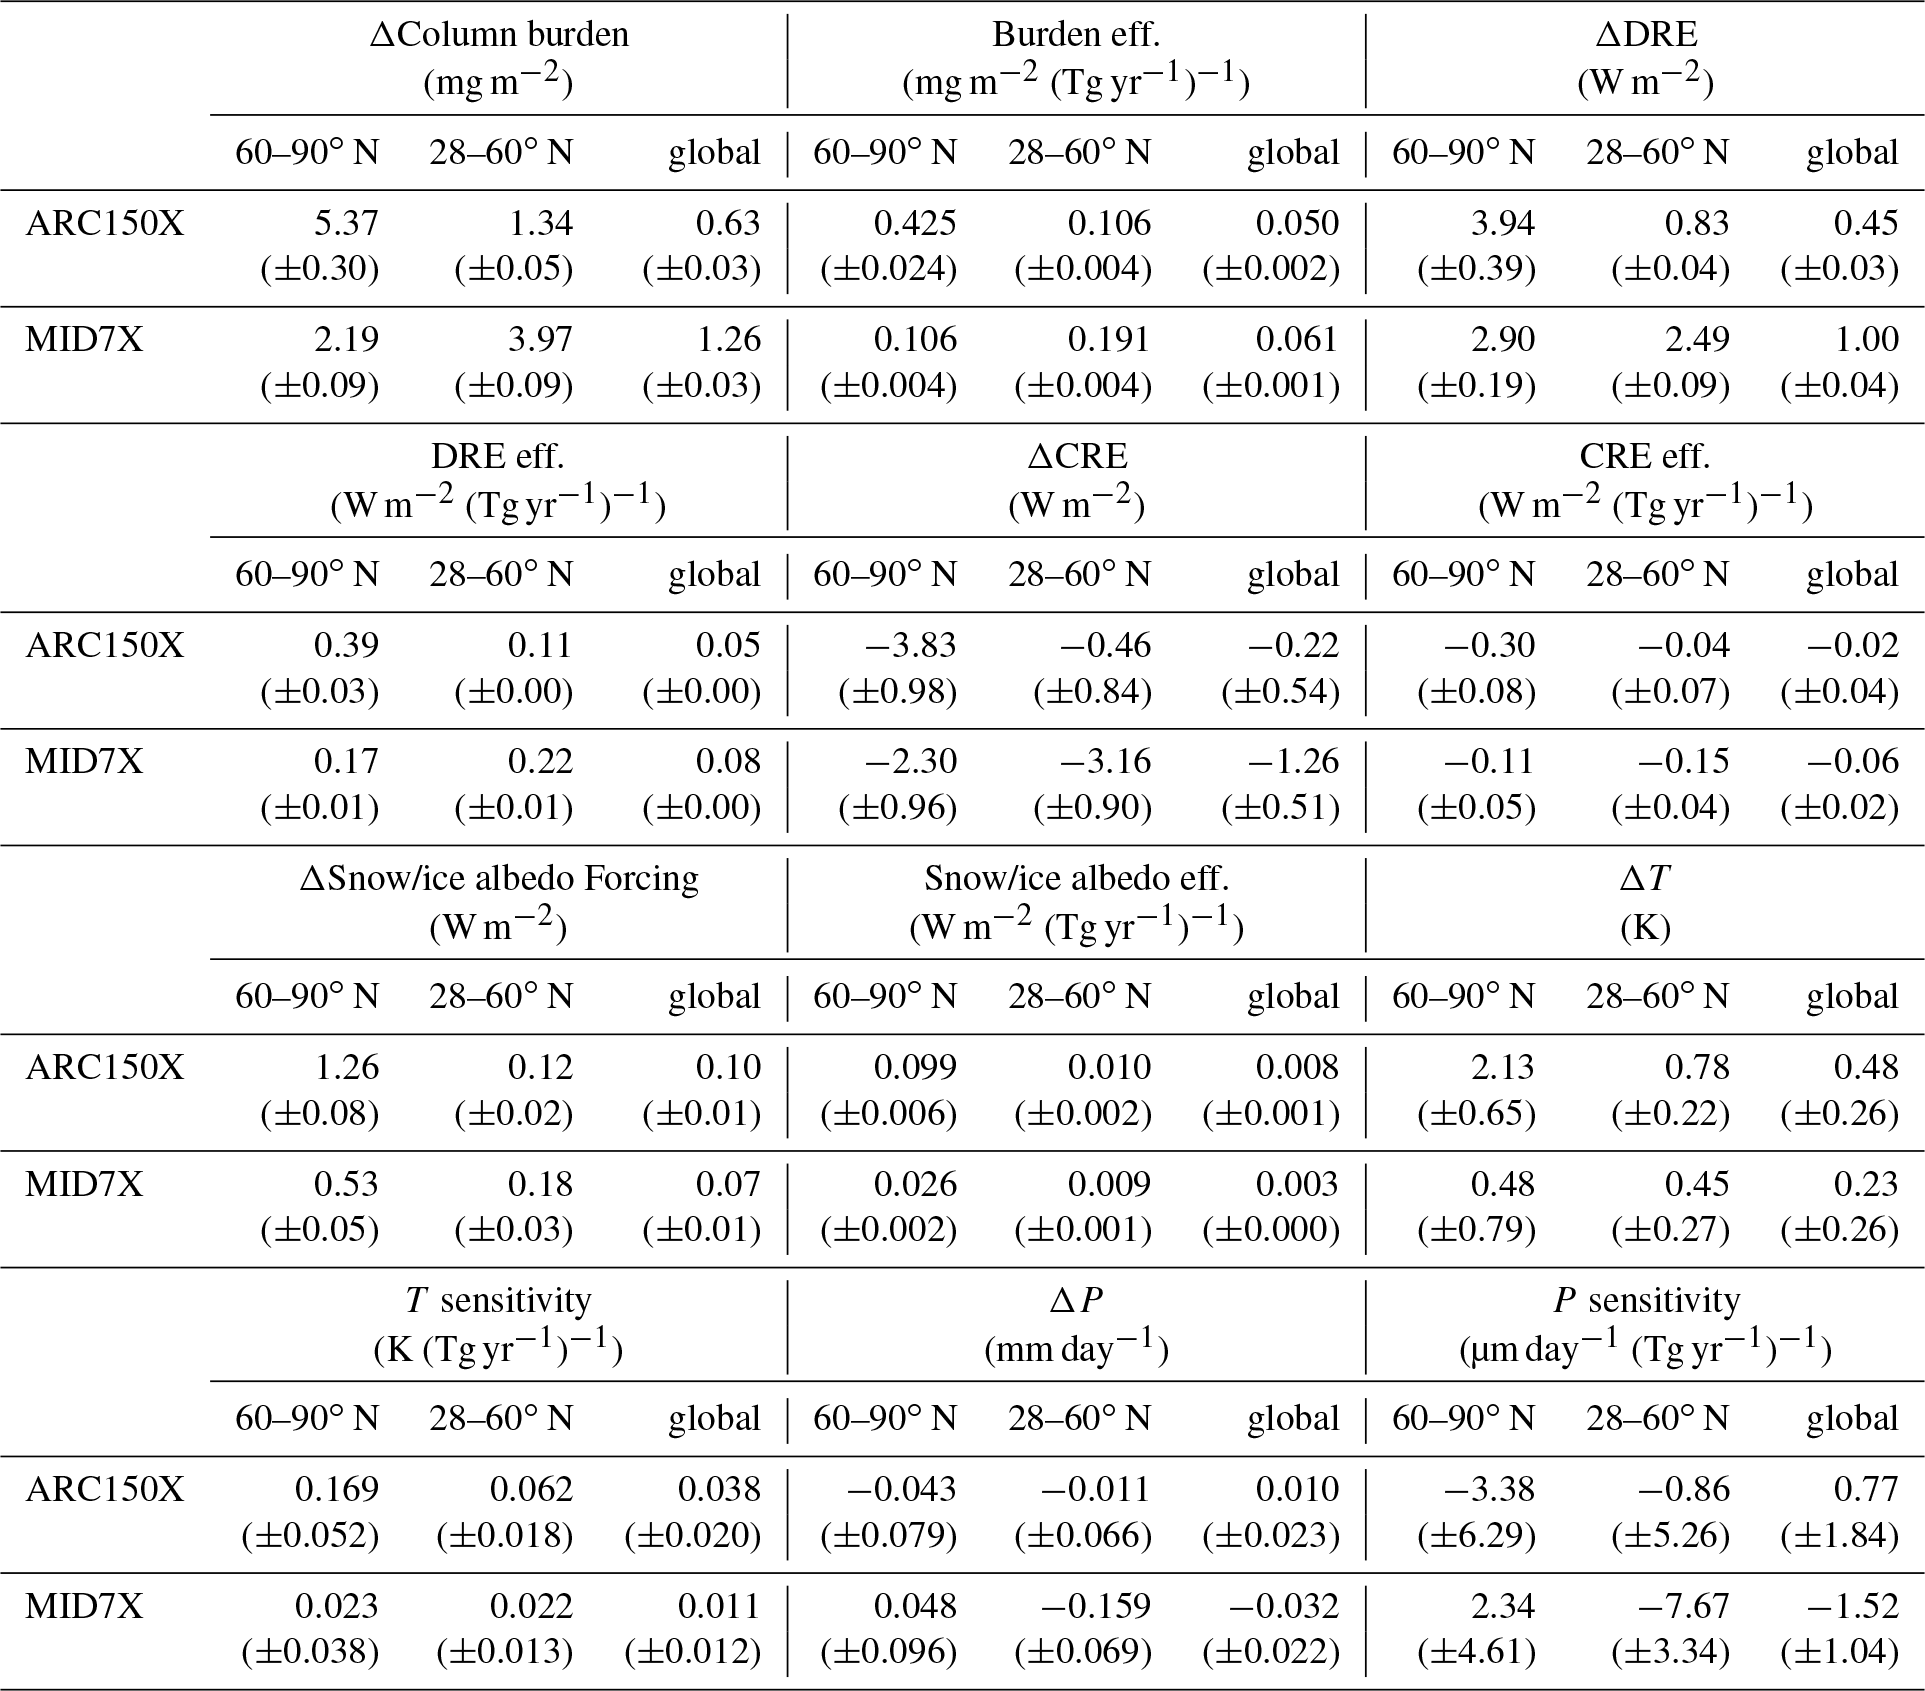
Table 1 also summarizes the changes in BC direct radiative effect, cloud radiative effect, and snow/ice albedo forcing induced by these large BC perturbations. Note that these values include feedback effects from the coupled system, so are not comparable to conventionally defined radiative forcing values. The albedo change due to BC deposition on snow and ice is responsible for a significant increase in Arctic surface forcing in both perturbations, with far smaller changes per unit emission in midlatitudes. Positive changes in direct radiative effect are offset by negative changes in cloud radiative effect from increases in low cloud in the Arctic and decreases in mid-level and high cloud over the midlatitudes, similar to previous results with a 10-fold increase in present-day anthropogenic BC emissions (Stjern et al., 2017).
Forcing efficiencies for direct radiative effect, cloud radiative effect, and snow/ice albedo forcing (i.e., forcings produced by per unit emission change) are also summarized in Table 1. Over the Arctic, local emissions from the Arctic have 2–4 times higher forcing efficiencies than emissions from the midlatitudes, suggesting higher impacts of a unit Arctic BC emission change to Arctic energy balance. Over the midlatitudes, although forcing efficiencies for direct radiative and cloud radiative effects for Arctic emissions are 2–3 times lower than midlatitude emissions, the snow/ice albedo forcing efficiencies are similar between Arctic and midlatitude emissions.
The annual mean surface air temperature response in ARC150X shows a significant warming over both the Arctic and midlatitudes (Fig. 2). MID7X shows temperature increases over the Arctic and most of the midlatitude land regions, while surface temperature decreases over some oceanic and coastal areas. The presence of areas with both surface warming and cooling decreases the net average temperature change over midlatitudes. The seasonal mean surface air temperature responses present similar spatial patterns (Fig. S2 in the Supplement), but slightly different magnitudes (Fig. S3 in the Supplement). Over the Arctic, the warming due to Arctic BC emissions is weakest in boreal summer. This is because the smaller summer sea ice and snow fraction in the Arctic weakens the BC snow/ice albedo forcing. However, in the midlatitudes, warming is strongest in boreal summer for both Arctic and midlatitude BC emissions, because of stronger summer solar insolation and, therefore, stronger BC heating in the atmosphere.
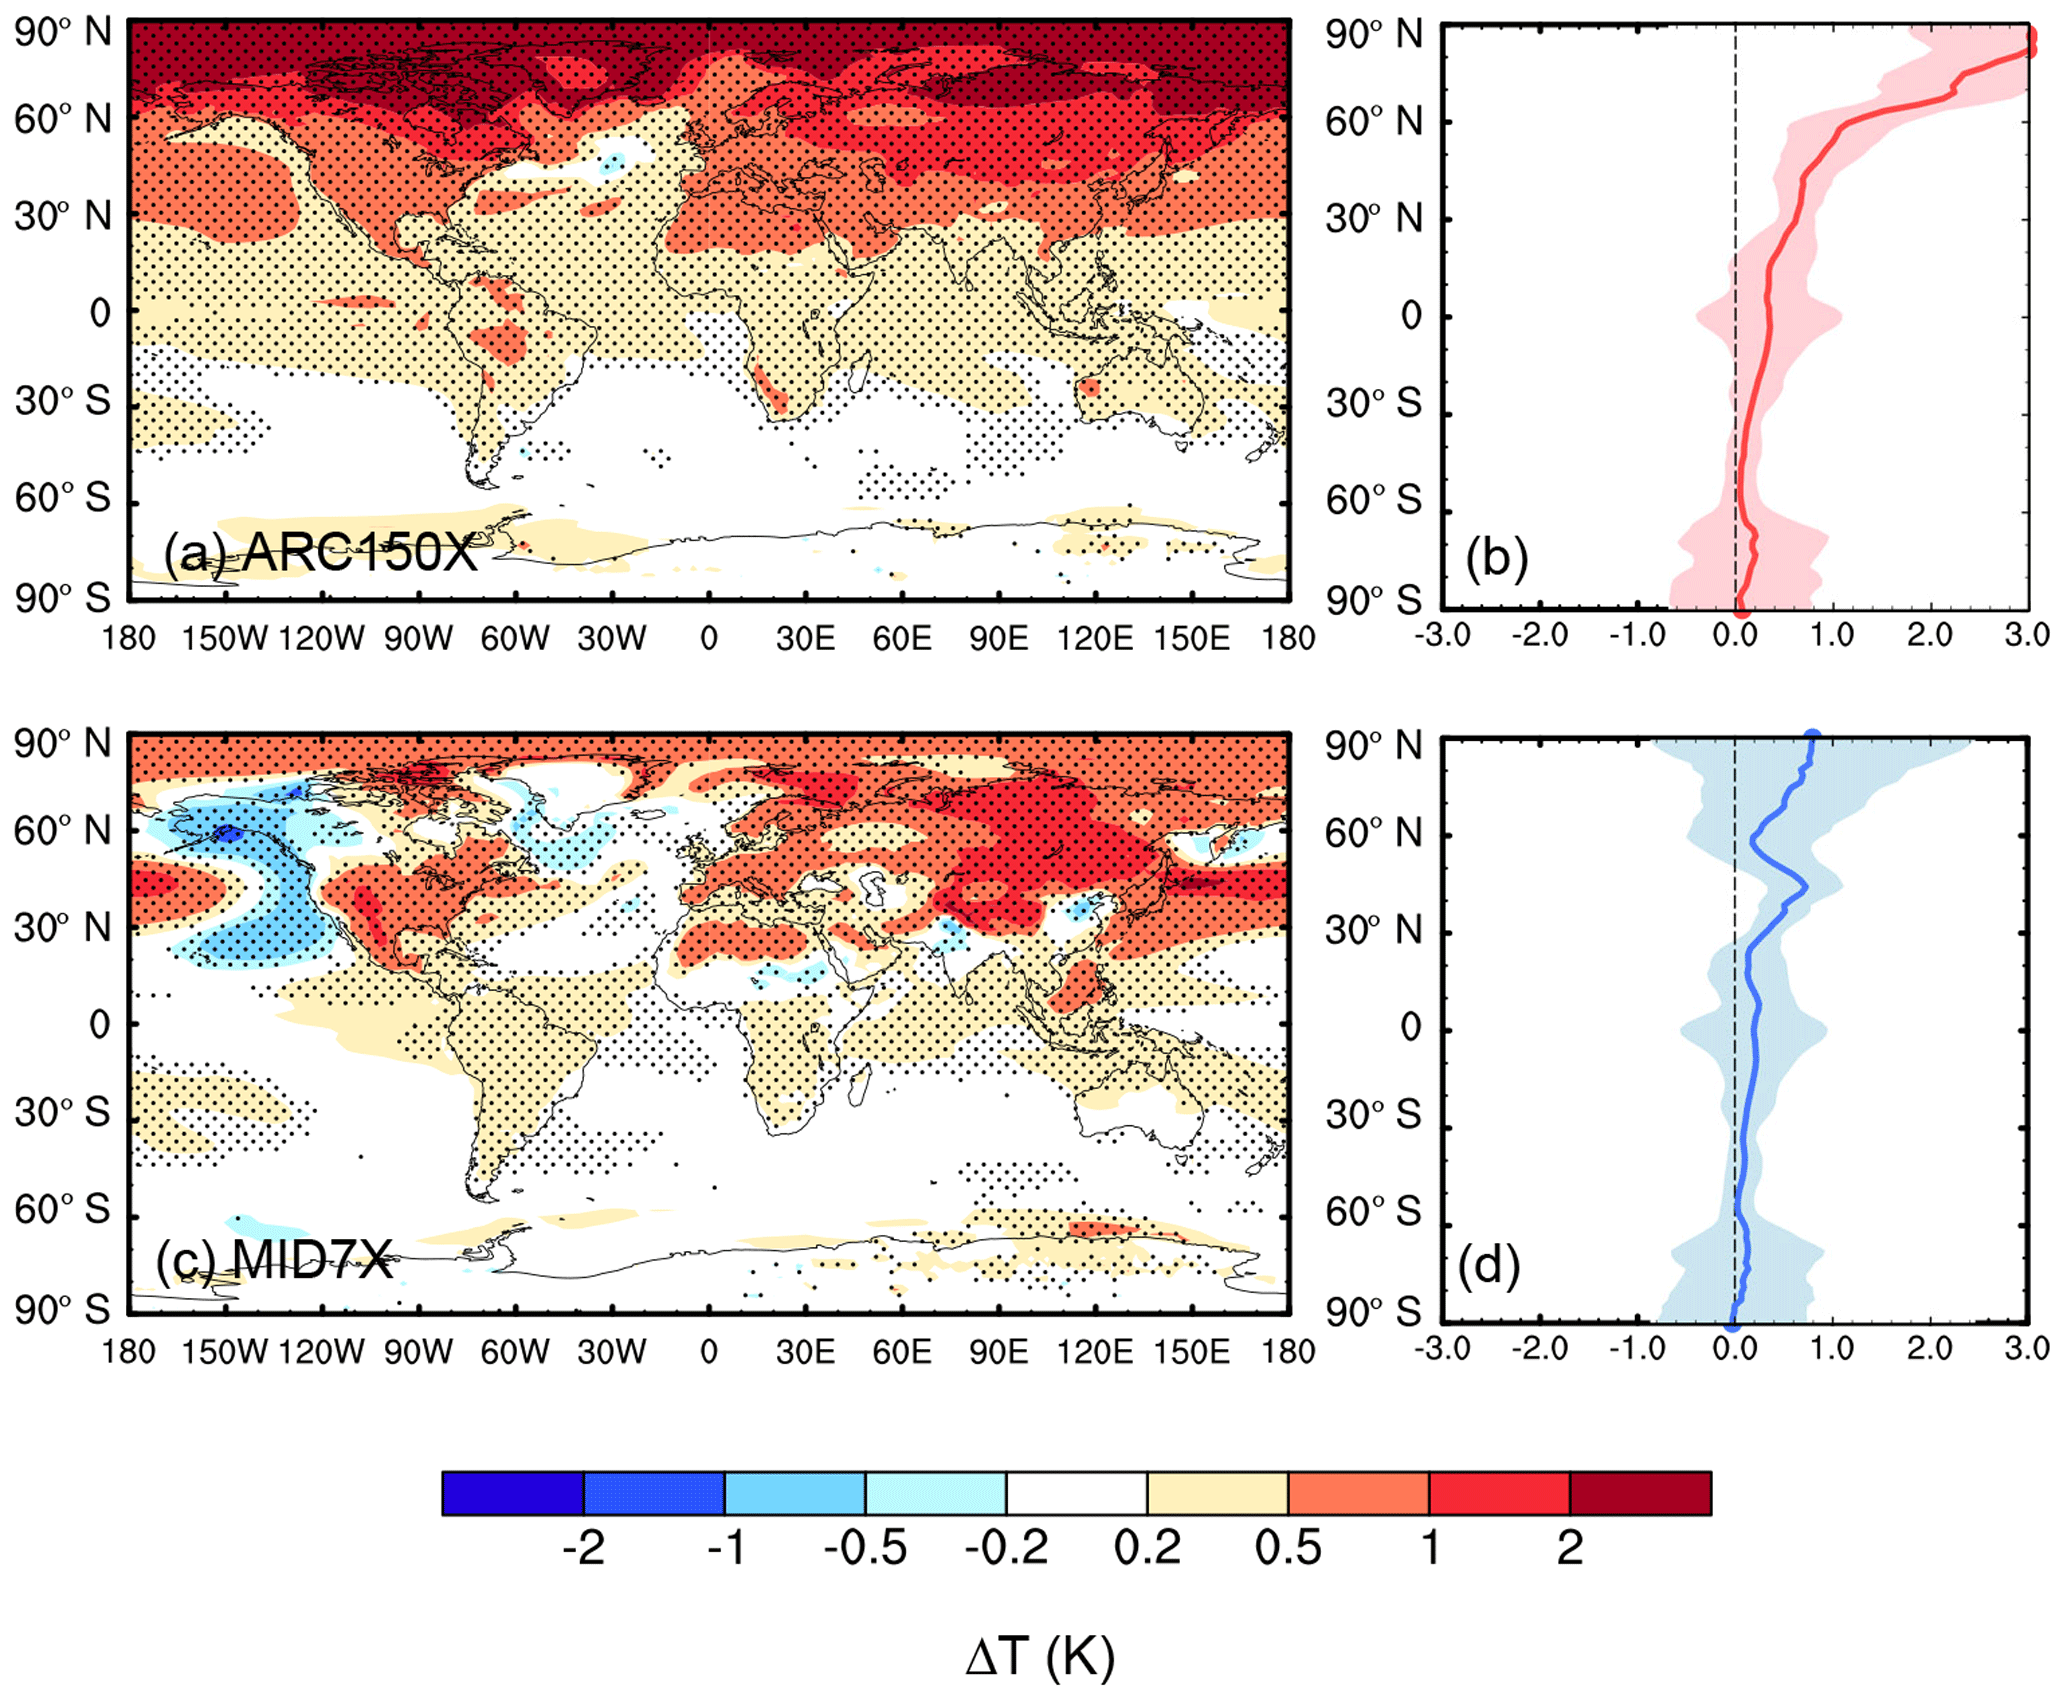
Figure 2Spatial distribution (a, c) and zonal mean (b, d) of changes in annual mean surface air temperature (K) for ARC150X (a, b) and MID7X (c, d) compared to PD. The dotted areas in (a, c) indicate statistical significance with 95 % confidence from a two-tailed Student's t test.
Due to the increased atmospheric absorption from BC, northward heat transport for both perturbations decreases (Fig. 3), consistent in sign with the results of Sand et al. (2013b). The increases in temperature but decreases in net northward heat transport indicate that the heating induced by changes in BC direct radiative effect and BC snow/ice albedo forcing dominate the overall BC-induced changes in energy balance over the Arctic and midlatitudes.
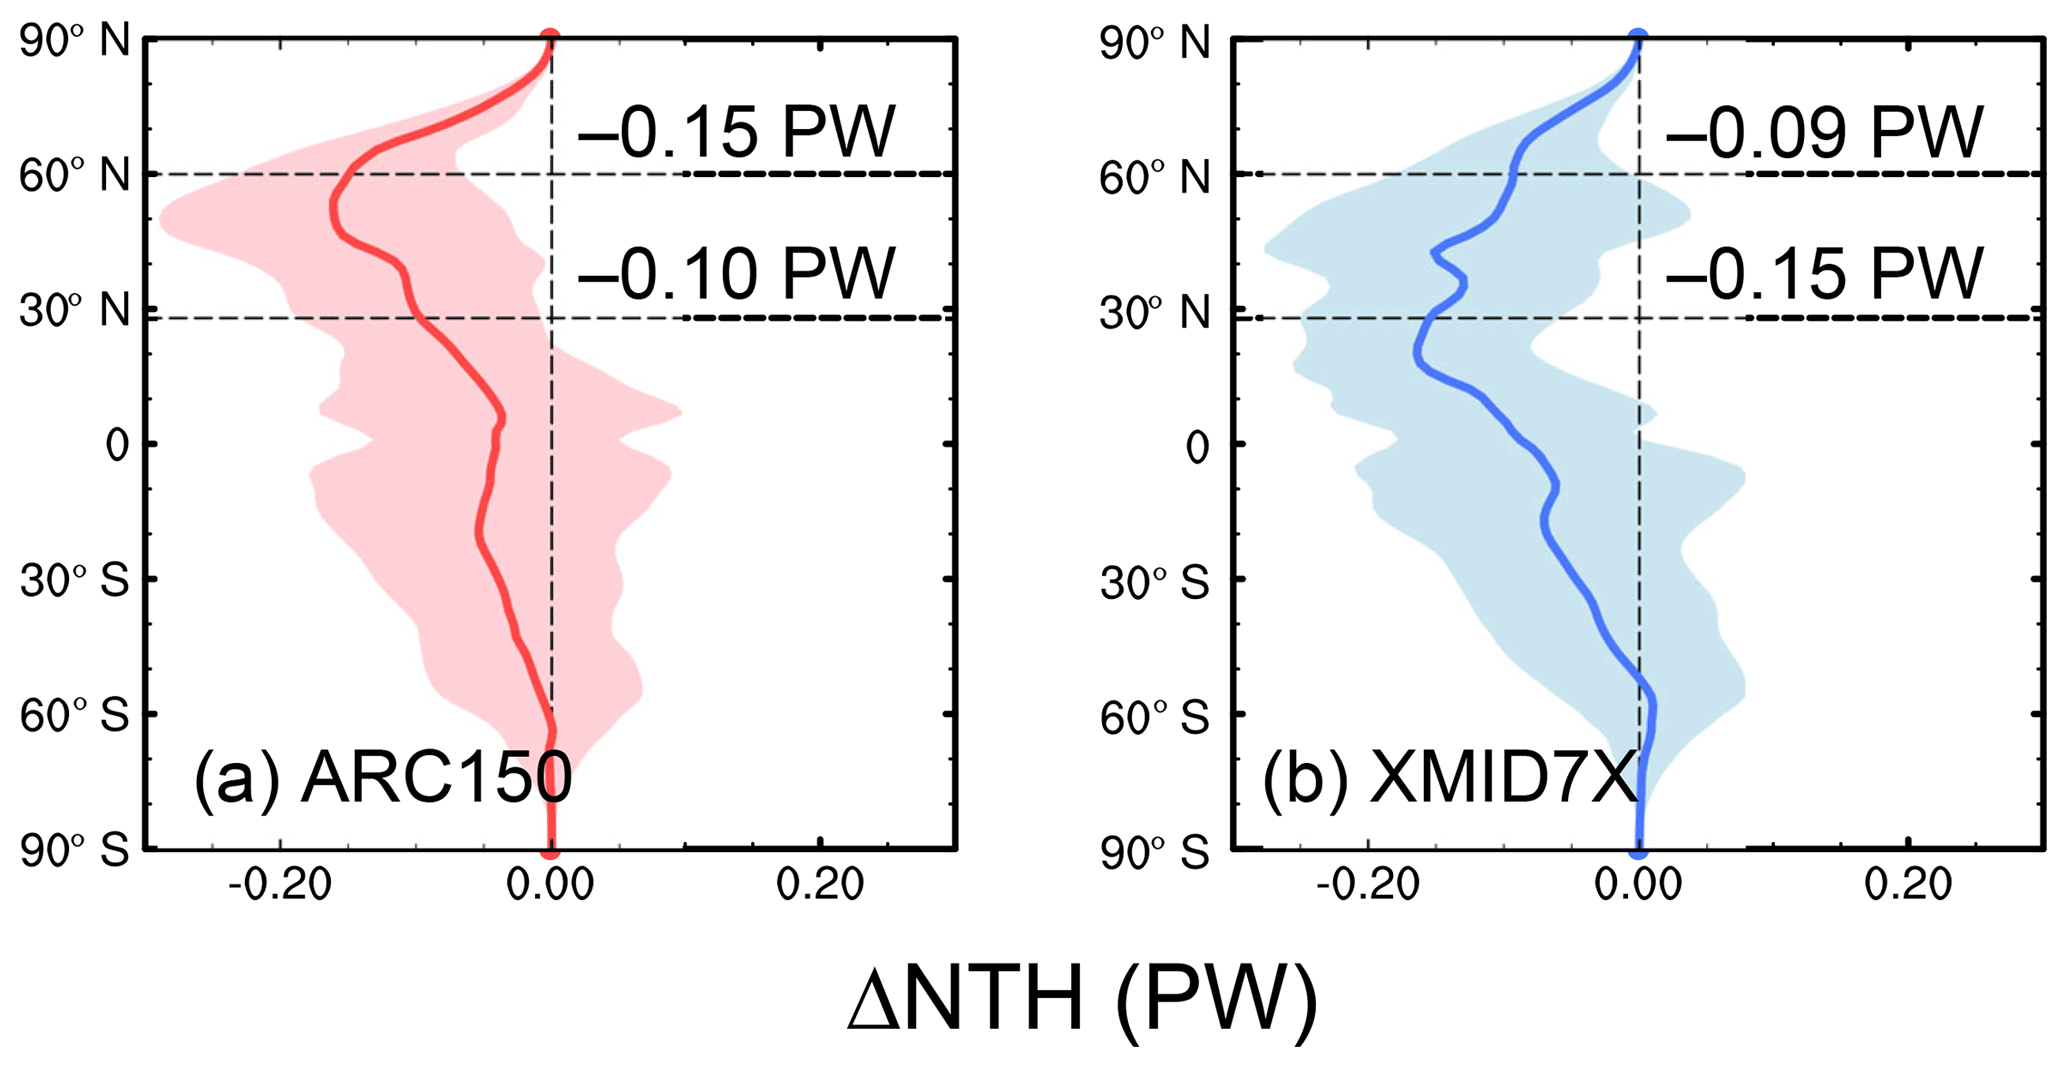
Figure 3Zonal mean of changes in annual mean northward heat transport (NHT, PW) for ARC150X (a) and MID7X (b) compared to PD. Values of changes in NHT across 60 and 28∘ N are shown in each panel. The shaded areas represent 1σ for 80 annual means.
Table 2BC burden, DRE, CRE, and snow/ice albedo forcing efficiencies, T sensitivity, and P sensitivity over the Arctic (60–90∘ N), midlatitudes (28–60∘ N), and the globe between perturbed (ARC75X, ARC150X, MID3.5X, MID7X, and MID14X) and PD simulations. 1σ for 80 annual means is shown in the parentheses. Bold values between two simulations (ARC75X, ARC150X; MID3.5X, MID7X; and MID7X, MID14X) indicates statistically significant changes with 95 % confidence from a two-tailed Student's t test.
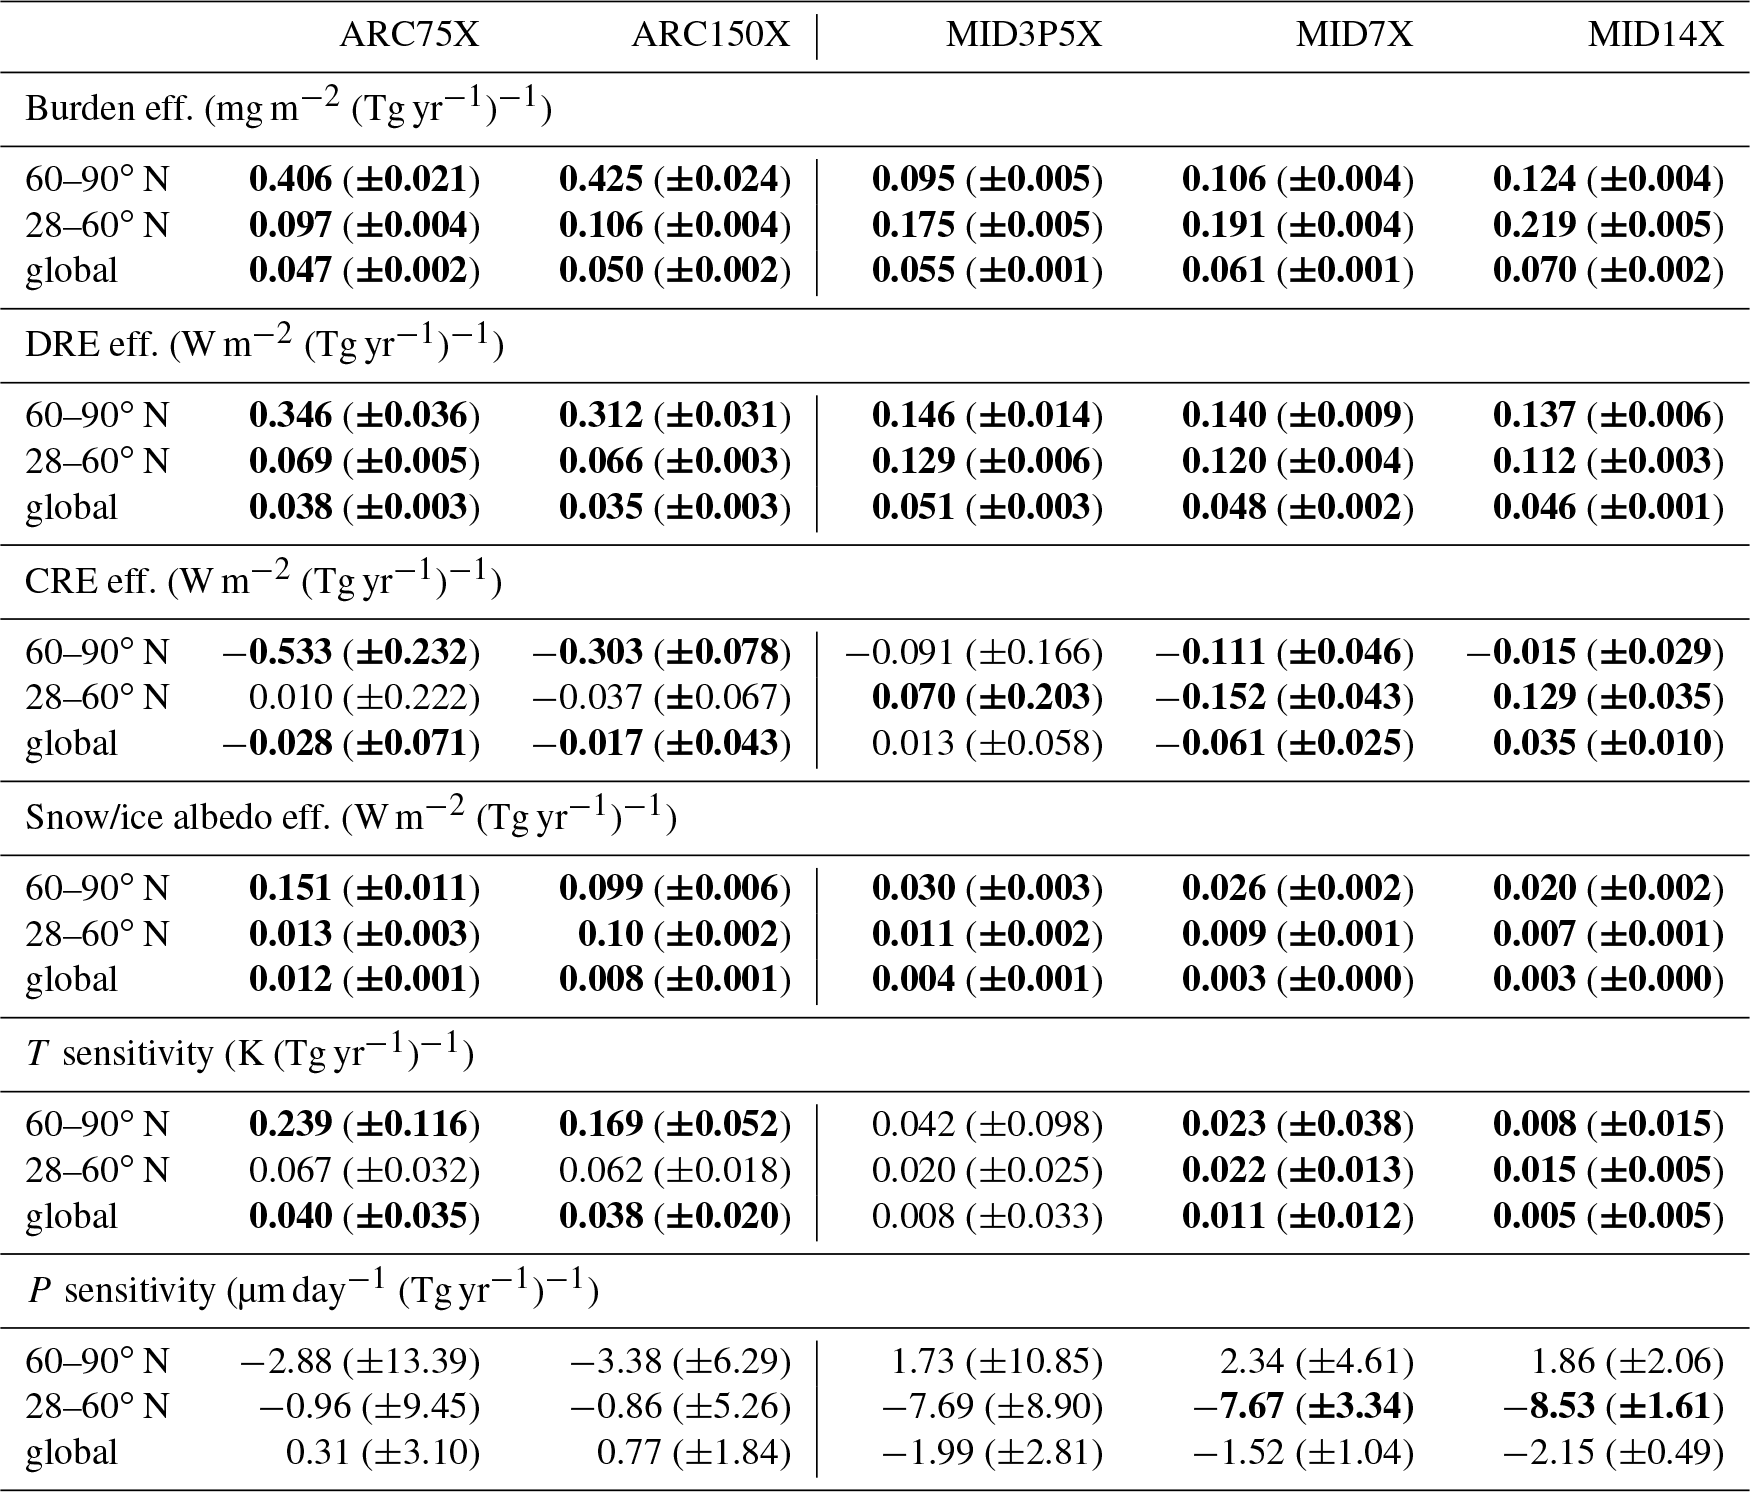
Arctic emissions are more efficient at impacting Arctic surface air temperatures with an Arctic temperature sensitivity to Arctic emissions (0.169±0.052 K (Tg yr−1)−1) 7 times as large as the Arctic temperature sensitivity to midlatitude emissions (0.023±0.038 K (Tg yr−1)−1). Midlatitude emissions, however, are likely to have a larger present-day impact overall due to their 35 times larger preindustrial to present-day emission increase (2.874 Tg yr−1) than Arctic emissions (0.082 Tg yr−1). Note that the Arctic temperature sensitivities are about 30 % and 50 % smaller than those found in the coupled NorESM model experiments of Sand et al. (2013b) for Arctic and midlatitude emission perturbation simulations, respectively, probably due to different model parameterizations and/or a different vertical profile of BC driving the net effect of BC impact on Arctic surface temperature (Flanner, 2013).
The vertical distribution of annual zonal-mean temperature responses (Fig. 4) shows that the ARC150X leads to a strong warming from the surface to 400 hPa over the Arctic and between 40 and 60∘ N. In MID7X, although the zonal-mean surface temperature response is relatively weak compared to ARC150X, a significant warming is found in midlatitudes between 500 and 200 hPa. BC transported from midlatitudes into the Arctic at high altitudes also results in Arctic temperature increases aloft, between 400 and 300 hPa.
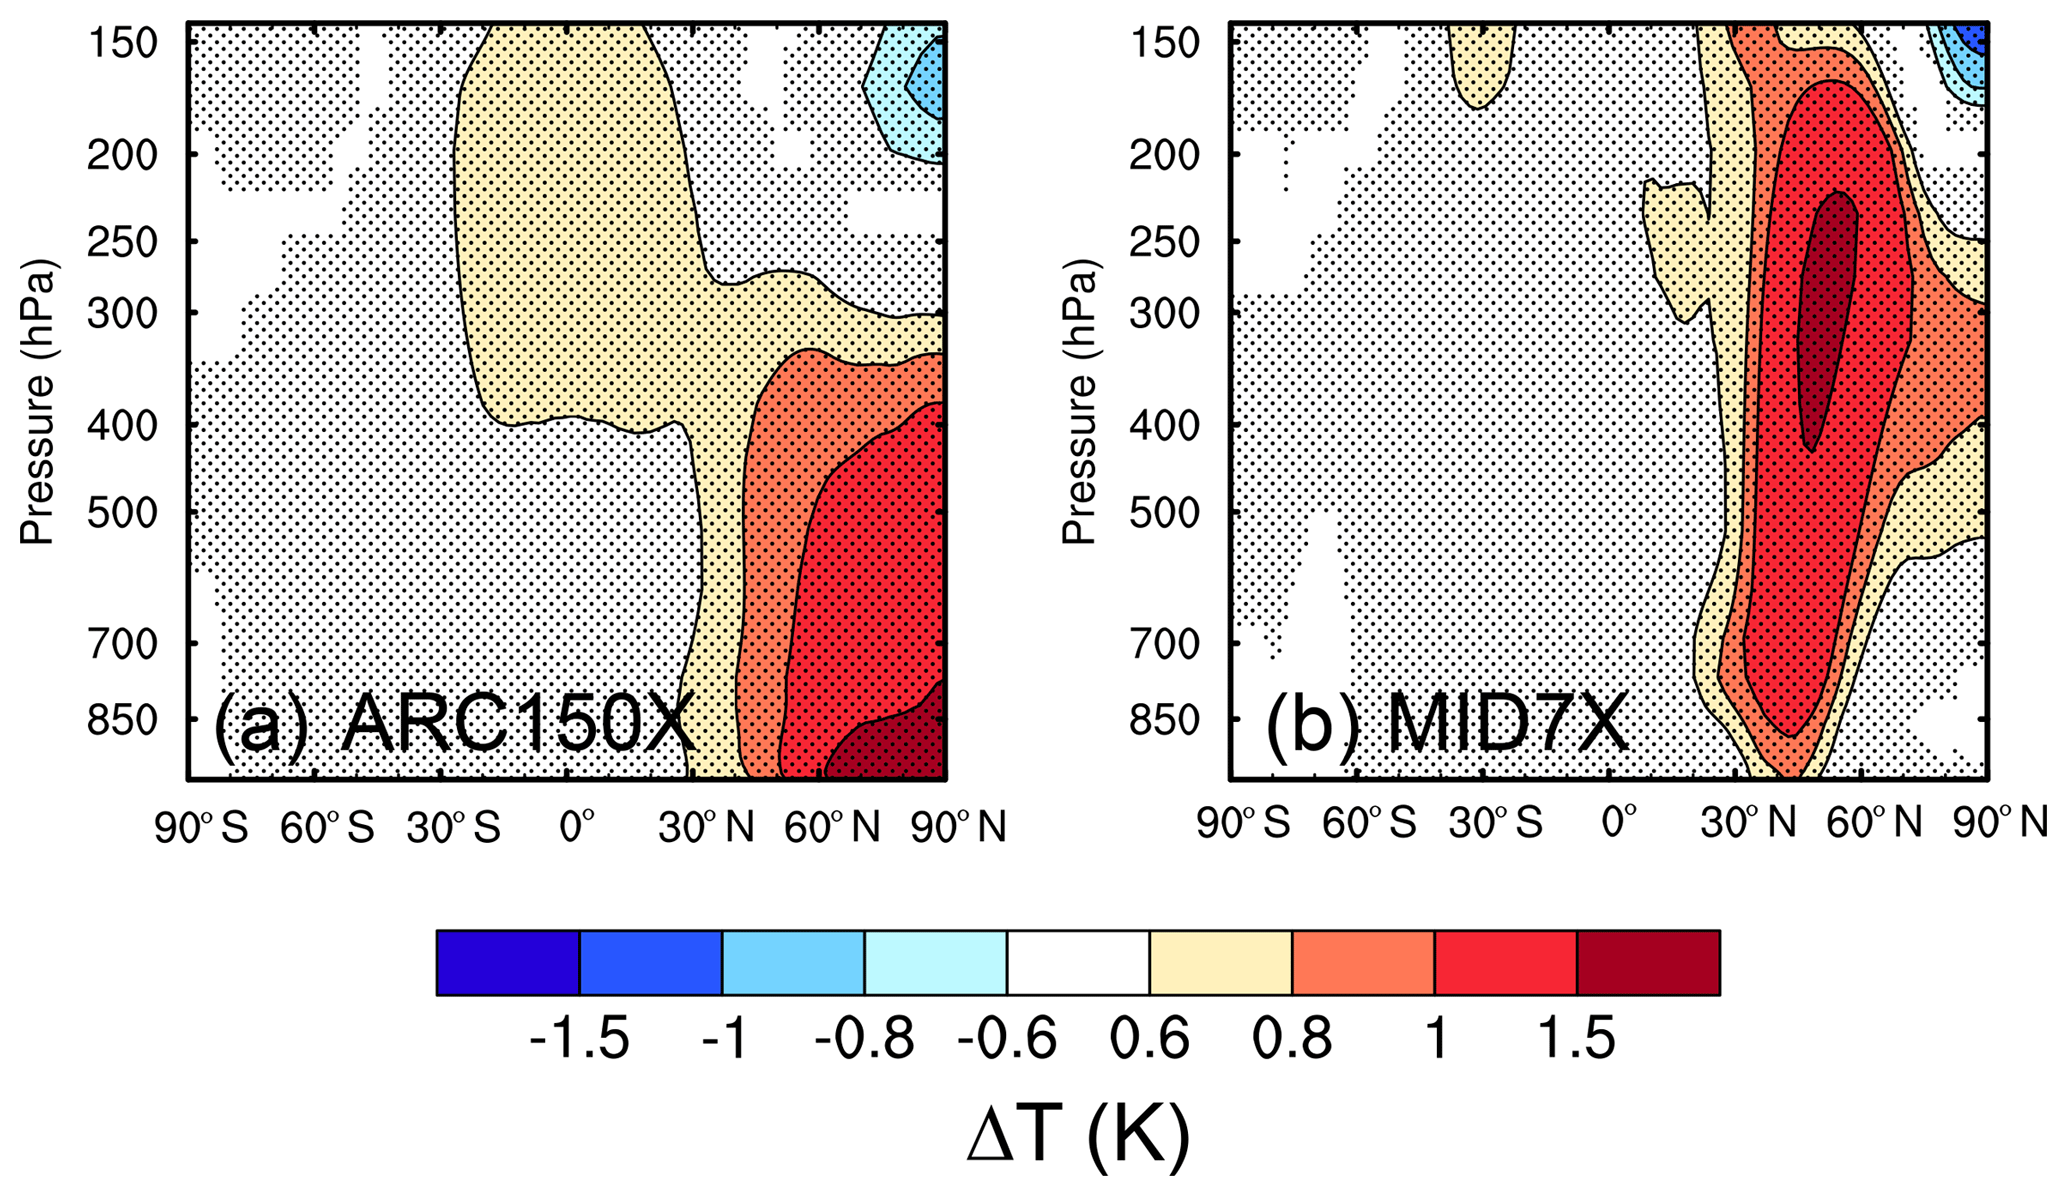
Figure 4Changes in annual and zonal-mean temperature (K) for ARC150X (a) and MID7X (b) compared to PD. The dotted areas indicate statistical significance with 95 % confidence from a two-tailed Student's t test.
These changes in temperature pattern can change the stability of the atmosphere and impact atmospheric circulation, as shown in Fig. 5. Increases in BC emissions over both the Arctic and midlatitudes exert anomalous upward motions in the Arctic and downward motions over the midlatitudes, but for different reasons. In ARC150X, stronger warming at the Arctic surface, compared to high altitudes, likely due to the BC snow/ice albedo effect produces anomalous upward motions in the Arctic and compensating downward motions between 50 and 60∘ N. In MID7X, the stronger BC warming at higher altitudes in midlatitudes increases atmospheric stability and leads to strong anomalous downward motions between 40 and 60∘ N and compensating upward motions over the Arctic and 10–30∘ N (Johnson et al., 2004). Increasing surface temperature and anomalous upward motion over the Arctic can weaken the Arctic front, and the anomalous downward motion over the midlatitudes favors air stagnation.
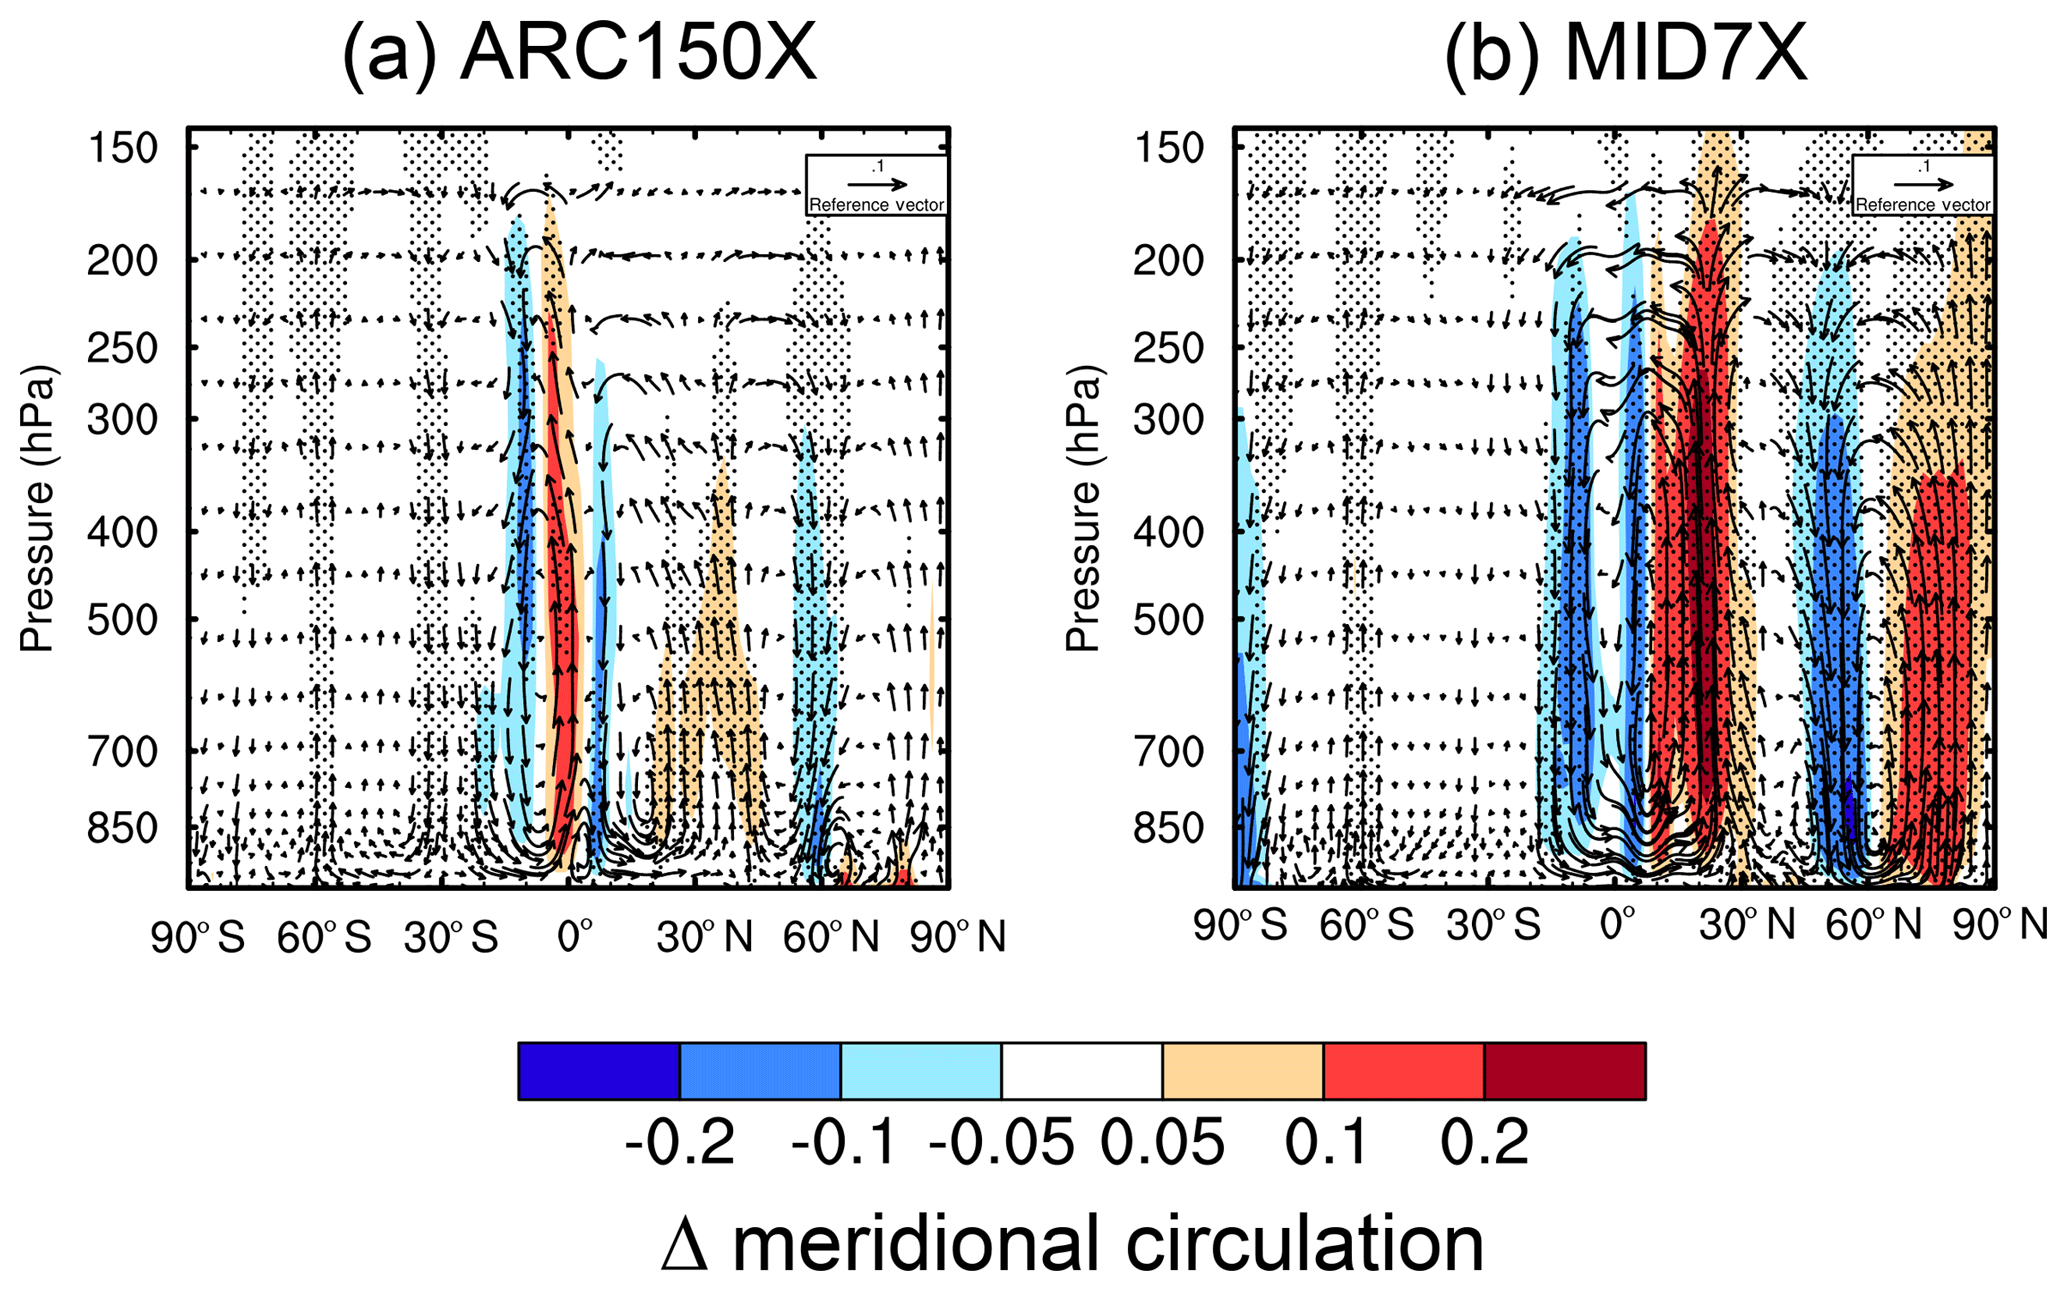
Figure 5Changes in annual and zonal-mean meridional wind vectors (m s−1) and vertical velocity (contours; Pa s−1 scaled by a factor of −100) for ARC150X (a) and MID7X (b) compared to PD. The dotted areas indicate statistical significance with 95 % confidence from a two-tailed Student's t test.
Because of the anomalous downward motions over midlatitudes in both ARC150X and MID7X, high and/or mid-level cloud fraction decrease over midlatitudes (Fig. 6). Due to slow feedbacks from increases in surface temperature in the Arctic (Fig. 2) and decreases in snow and sea ice, low cloud fraction increases in the Arctic for both ARC150X and MID7X. The increases in low cloud over midlatitude oceans, which cause the cooling noted above, are due to rapid adjustments as free-tropospheric BC heating reduces mixing with dry air above the BC layer and increases the amount of marine stratocumulus (Johnson et al., 2004; Sand et al., 2013a; Stjern et al., 2017).
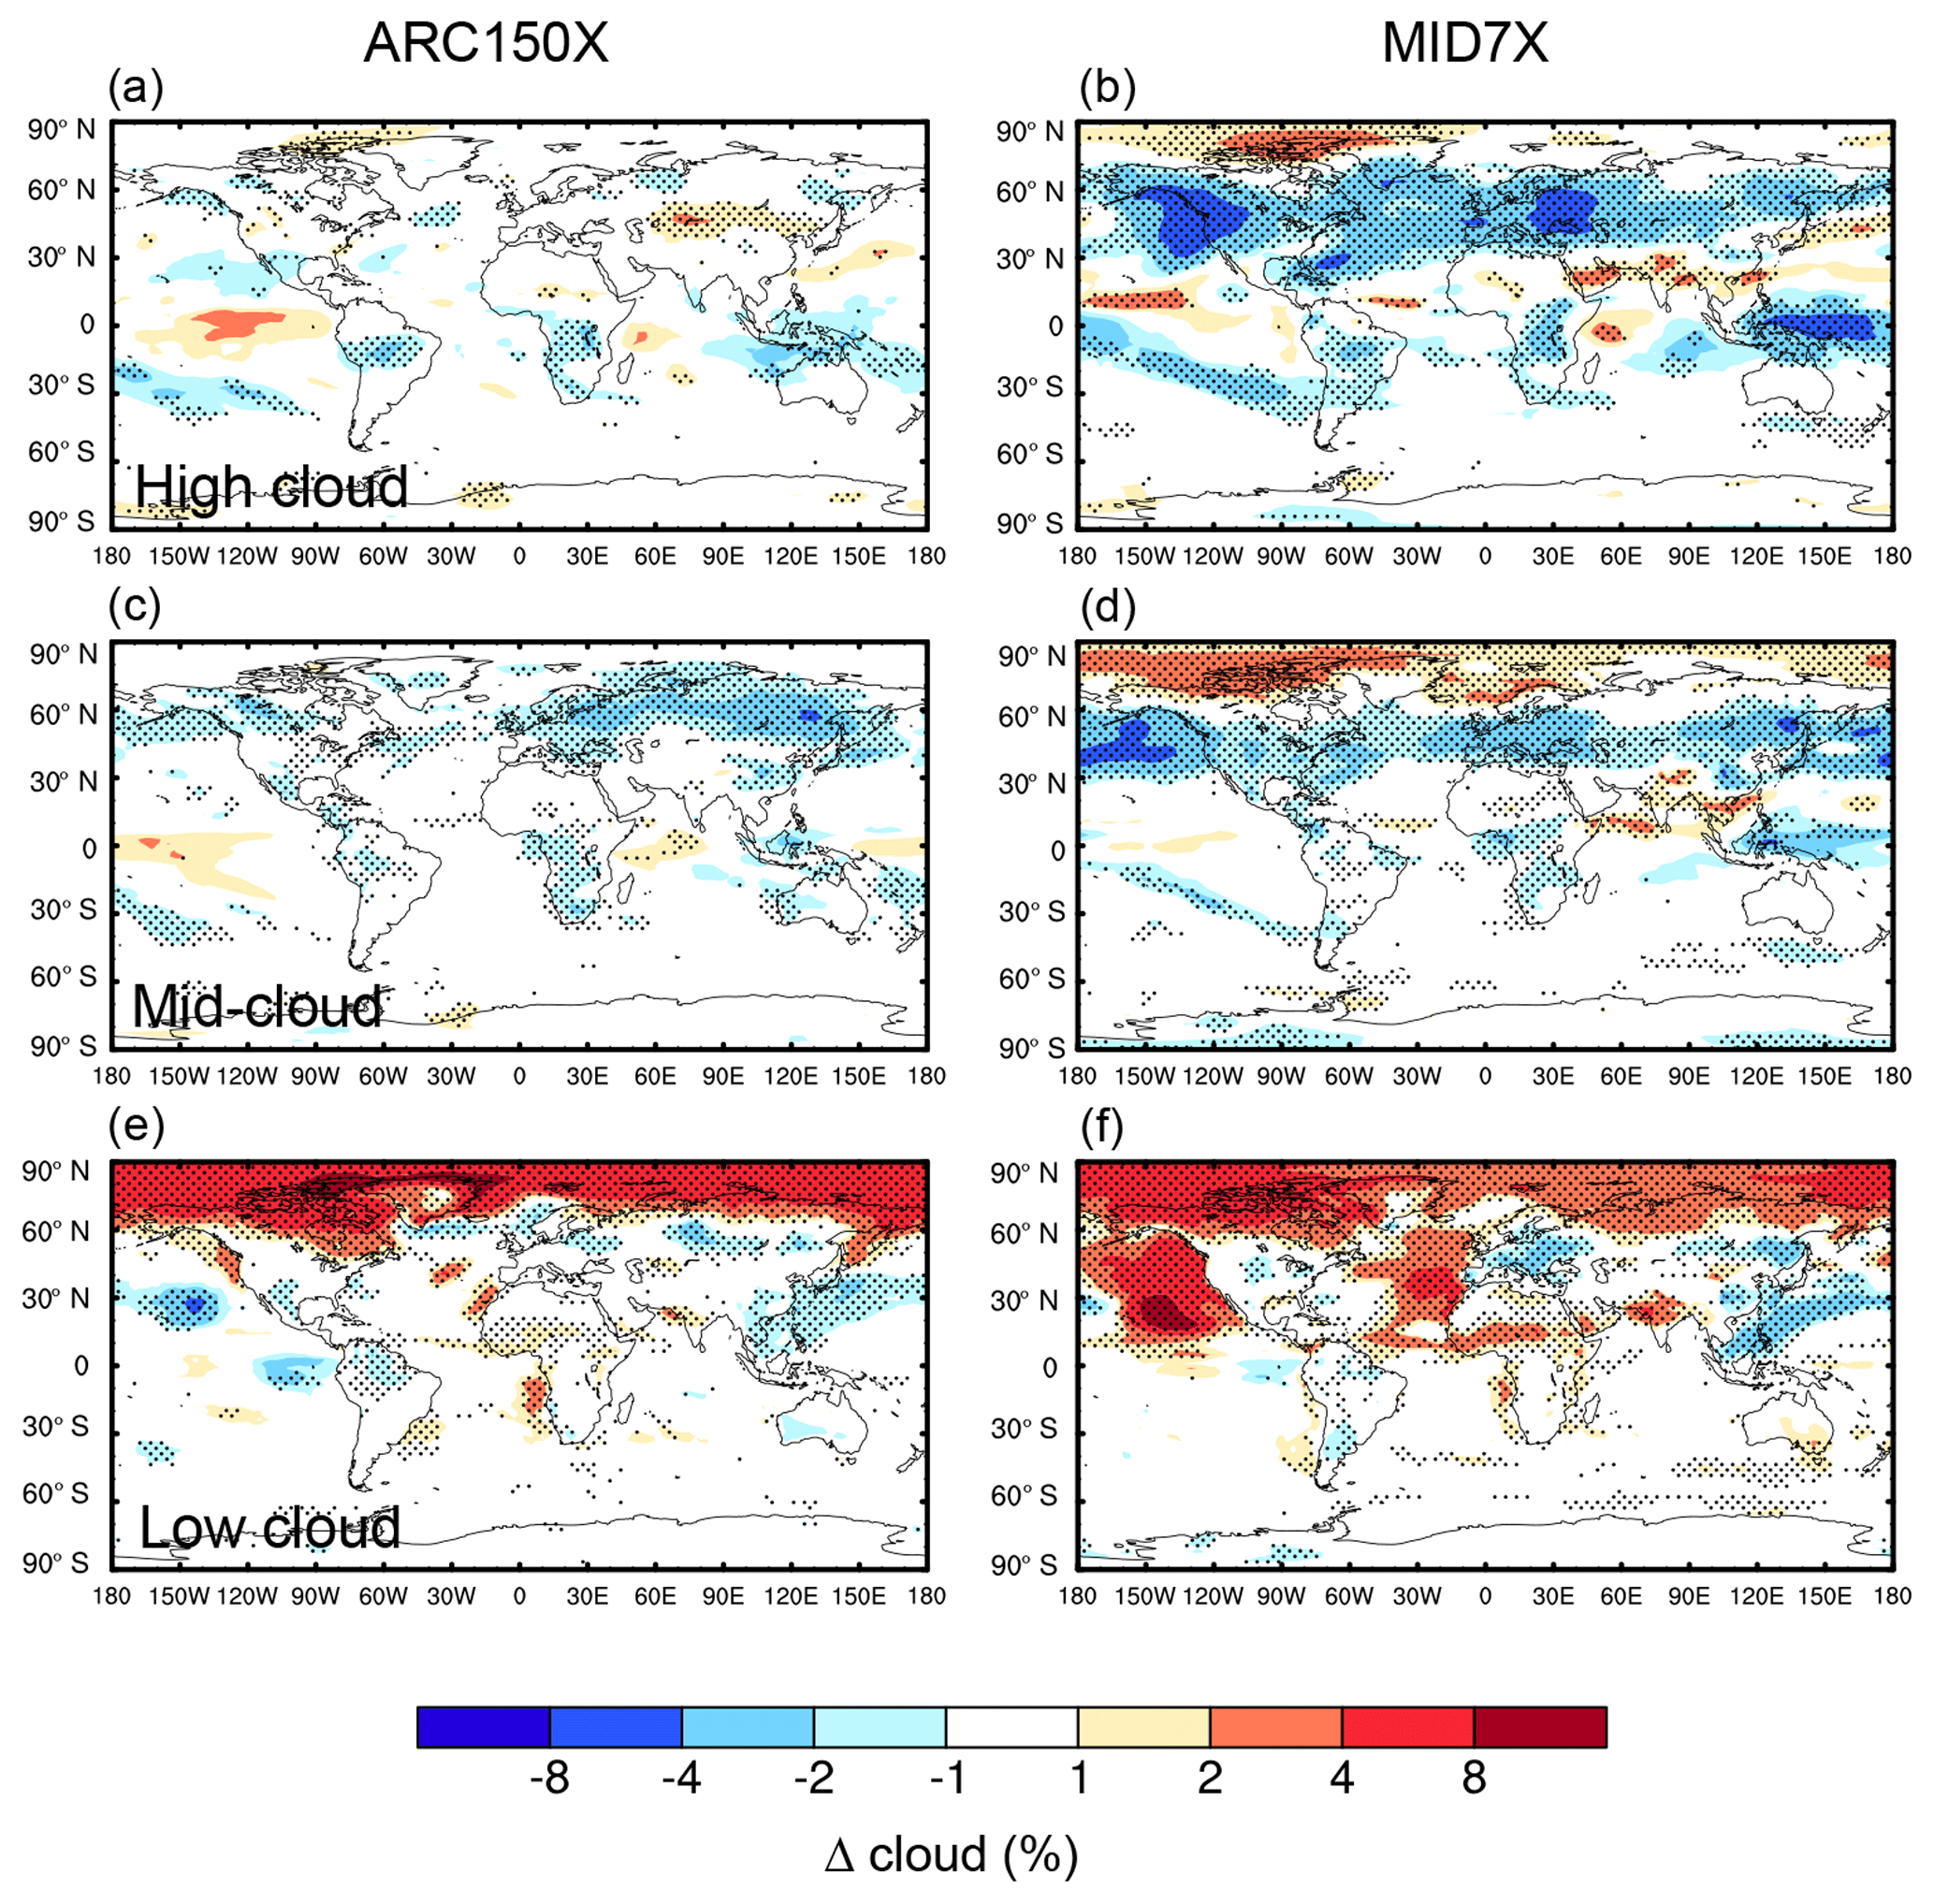
Figure 6Changes in annual mean high (a, b), mid-level (c, d), and low (e, f) cloud fraction (%) for ARC150X (a, c, e) and MID7X (b, d, f) compared to PD. The dotted areas indicate statistical significance with 95 % confidence from a two-tailed Student's t test.
Figure 7 shows changes in the total precipitation rate for the perturbed simulations. Increases in Arctic and midlatitude BC emissions lead to significant decreases in precipitation over 60∘ N and 30–50∘ N, respectively, in correspondence with anomalous downward motions (Fig. 5) and decreases in mid-level and high clouds (Fig. 6) over these regions. Averaged over the Arctic and midlatitudes, changes in precipitation are weak, compared to uncertainties, except for the midlatitude precipitation response to BC emitted from midlatitudes. The midlatitude precipitation sensitivity is −7.67 (±3.34) µm day−1 (Tg yr−1)−1 for MID7X. Another feature of the precipitation response is related to a northward shift in the ITCZ (Intertropical Convergence Zone) in MID7X, which is consistent with the hemispherically asymmetric warming pattern driven by increases in midlatitude BC emissions (Hwang et al., 2013; Baker et al., 2015).
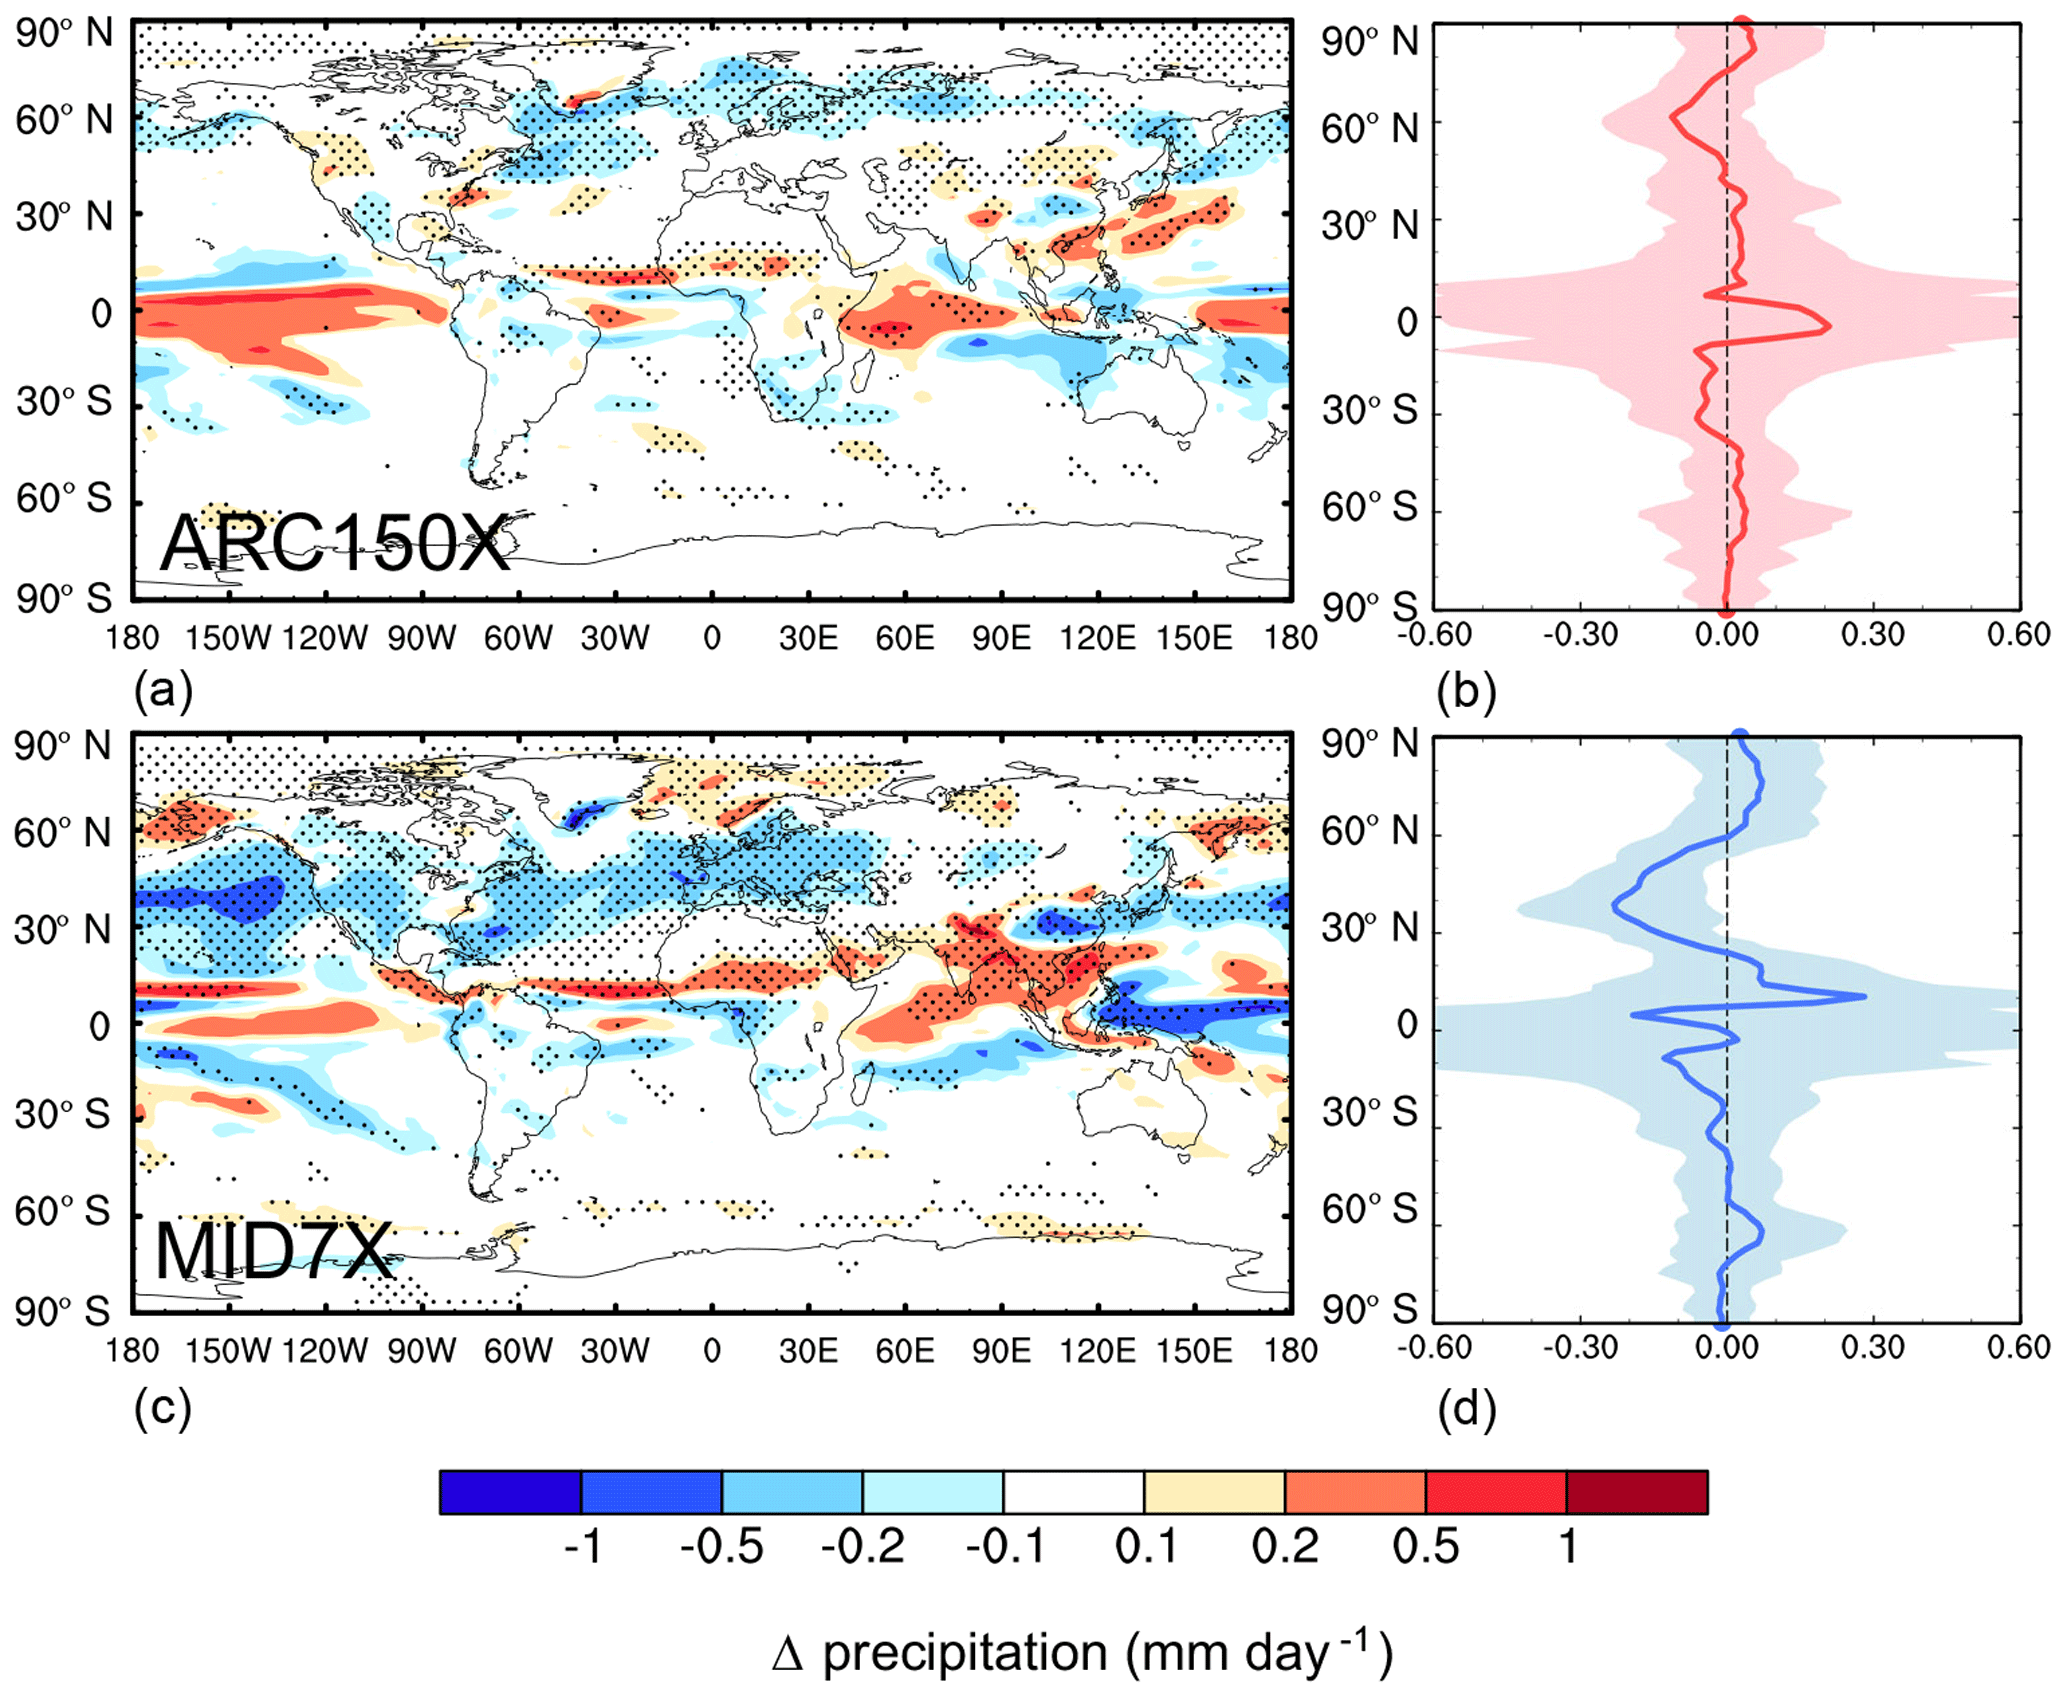
Figure 7Spatial distribution (a, c) and zonal mean (b, d) of changes in annual mean total precipitation rate (mm day−1) for ARC150X (a, b) and MID7X (c, d) compared to PD. The dotted areas in left panels indicate statistical significance with 95 % confidence from a two-tailed Student's t test.
Both ARC150X and MID7X show significant decreases by 13 % and 3 %, respectively, in fractional area covered by sea ice over the Arctic, as compared to PD (Fig. S4 in the Supplement). The snow depth over land also decreases, especially over Greenland. The water equivalent snow depth averaged over Arctic land decreases by 5.0 cm (27 % relative to PD) and 0.8 cm (4 %) for ARC150X and MID7X, respectively.
We also evaluated the linearity of these responses by testing different emission perturbation sizes. Figure 8 shows burden efficiencies, temperature sensitivities, and precipitation sensitivities from simulations with Arctic BC emissions scaled by 75 and 150, and midlatitude BC emissions scaled by 3.5, 7, and 14, with values summarized in Table 2. Stronger emission perturbations have a higher burden efficiency. Over the Arctic, this is caused by anomalous Arctic upward motions that weaken the Arctic front, lifting BC higher and leading to a longer BC lifetime together with easier transport into the Arctic (Fig. S5 in the Supplement). Over midlatitudes, anomalous midlatitude downward motions favor stagnation, which in turn accumulates more BC in the atmosphere, together with a decrease in precipitation (and wet removal rate), contributing to increases in burden efficiency. All differences in burden efficiencies between simulations with different emission perturbation sizes are statistically significant with 95 % confidence.

Figure 8Burden efficiencies, temperature, and precipitation sensitivities over the Arctic, midlatitudes, and the whole globe for ARC75X, ARC150X, MID3.5X, MID7X, and MID14X. Burden efficiencies, temperature sensitivity, and precipitation sensitivity are calculated as changes in regional mean BC column burden, surface temperature, and total precipitation rate divided by changes in global total BC emissions between perturbed and PD simulations, respectively. Error bars represent 1σ for 80 annual means. The asterisks between two bars (ARC75X/ARC150X, MID3.5X/MID7X, and MID7X/MID14X) indicate statistically significant changes with 95 % confidence from a two-tailed Student's t test.
Despite this higher burden efficiency, the efficiency (per unit emission) of the direct radiative effect decreases slightly. This is because strong BC perturbations lead to more BC suspended in the atmosphere. More BC increases the attenuation of the transmitted radiation, leading to a decrease in efficiency of BC light absorption in the lower atmosphere and leading to a lower efficiency of direct radiative effect for a stronger BC emissions perturbation.
The temperature sensitivity is lower, with 95 % significance, for stronger emission perturbations for both midlatitude and Arctic BC between ARC75X and ARC150X, as well between MID7X and MID14X (Table 2). The BC snow/ice albedo effect is found to be the most important factor in influencing Arctic temperature (Sand et al., 2013b). Larger temperature increases from stronger BC emission perturbations speed up the melting of sea ice and snow, leading to a weaker annual mean snow/ice albedo effect per unit BC emission for both the Arctic and midlatitudes. Therefore, the BC snow/ice albedo effect is more efficient for weaker emission perturbations, i.e., 0.151 (±0.011) vs. 0.099 (±0.006) (W m−2 (Tg yr−1)−1) for ARC75X and ARC150X, and 0.026 (±0.002) vs. 0.020 (±0.002) (W m−2 (Tg yr−1)−1) for MID7X and MID14X of Arctic BC snow/ice albedo forcing efficiencies. All snow/ice albedo forcing efficiency differences are statistically significant. Together with lower efficiency of the direct radiative effect, these explain the lower temperature sensitivity for stronger emission perturbation. The nonlinearity in snow–ice feedback relative to emissions size appears to be the primary driver of surface temperature response nonlinearity in these results.
Additional evidence for BC nonlinearity can be found in the literature. Sand et al. (2015) simulated climate responses to BC in NorESM with present-day emissions multiplied by 25 and reported that the changes in TOA net shortwave flux was 7.5 (±0.3) W m−2 relative to preindustrial conditions and the temperature response was 1.2 (±0.1) K. If we assume a linear emission–response relationship, present-day BC would cause an inferred shortwave flux and surface temperature change of 0.312 (±0.013) W m−2 and 0.050 (±0.004) K, respectively, in Sand et al. (2015), much lower than the 0.552 W m−2 and 0.141 K found in Baker et al. (2015) for a present-day BC emission perturbation with essentially the same model. Note that the change in shortwave flux is not proportional to the surface temperate change, further emphasizing that forcing is not a good predictor of surface temperature change for BC. This comparison is consistent with our finding that temperature sensitivity is lower for stronger BC emission perturbations. We note, however, that emission datasets with different spatial distributions and seasonality were used in those two experiments (because of this the difference in global emissions between the two experiments is about 17, not 25 times). While this might impact the magnitude of model responses, it is unlikely to change the overall conclusion of a substantially different temperature response to current-day emissions as compared to a 17–25 times larger BC perturbation.
The midlatitude shows significantly stronger precipitation sensitivity for a stronger perturbation, comparing MID7X and MID14X, which is consistent with the higher burden efficiency. This is in the opposite direction to the surface temperature sensitivity. Variability in MID3.5X is larger than the mean value for both temperature and precipitation sensitivity, which highlights the challenge of testing differences for smaller BC perturbation magnitudes. Note that the impact of BC on clouds and precipitation is uncertain, especially in the Arctic, due to the limited treatment of Arctic clouds in climate models (McFarquhar et al., 2011). These results suggest that in order to examine the climate responses to BC emissions in short-term climate model simulations, a large emission perturbation is needed to get a clear signal, but nonlinearity of the responses also needs to be evaluated.
To assess the short-term transient climate responses to BC emissions, Fig. 9 shows surface temperature responses to BC emissions from ARC150X and MID7X for the first 30 years averaged over five short ensemble members. We also show a numerical fit to the short-term transient response using a Hamiltonian Monte Carlo technique (Betancourt, 2017). We fit data to the following form:
where we have constrained the fit to converge to the long-term average temperature response (Tave) by our finding that there is no detectable long-term trend after the initial transient period over a 100-year time horizon.

Figure 9Time series of mean surface temperature response from ARC150X (a, c) and MID7X (b, d) BC emission perturbations as compared to PD. The response is shown over the Arctic (a, b) and midlatitudes (c, d). Shown are the 100-year ensemble simulation (blue lines), the average of five 30-year ensemble members (red), and a numerical fit for an exponential approach to the long-term average (green dashed line). Curve fits used the package STAN in R, which is a Bayesian inference using the “No-U-Turn” sampler. Note that MID7X Arctic temperature response does not result in a fit due to noise.
Over both the Arctic and midlatitudes, transient temperature responses quickly approach a quasi-equilibrium state. Transient timescales (τ) for the ARC150X perturbation were estimated to be 2.7 (2.0, 3.4) years, while the midlatitude timescales for the ARC150X and MID7X perturbations were 1.8 (1.1, 2.2) and 2.9 (1.2, 4.2) years, respectively, (brackets provide 10 %–90 % fitting intervals). The Arctic response to MID7X was too noisy to produce a fit. These timescales are shorter than those in a global BC perturbation experiment (Sand et al., 2015), which is expected as ocean thermal inertia would play a larger role globally as compared to the Northern Hemisphere or Arctic. The BC response timescales here are also shorter than those seen from CO2 concentration steps in general circulation models (GCMs; Geoffroy et al., 2013). There is also no long-term temperature increase, at least over a 100-year time horizon, after the initial transient period. A linear fit over years 10–100 for the perturbation responses results in no statistically significant linear trends for any of the four perturbations (see the Supplement code).
Note that the average of even five ensemble members shows oscillatory behavior due to the imposition of a step BC emission perturbation. This oscillatory behavior degrades our ability to quantify the perturbation response timescale. In future work, a linearly phased-in perturbation might result in a cleaner signal for determining the initial response timescale.
Baker et al. (2015) showed that the climate responses to BC emissions had very large uncertainties based on results from four global models. Here, we also quantified the impact of present-day anthropogenic BC emissions (Fig. 10) by comparing a present-day (PD) and pre-industrial (PI) simulation conducted with the CESM CAM5-MAM4 model used in this work. PD emissions produce statistically significant surface air temperature changes over only limited regions in the Northern Hemisphere. Decreased temperatures are found over eastern China, South Asia, North Atlantic Ocean, and the North American Arctic, partly due to cloud changes driven by BC rapid adjustments. Increased temperatures are found over the Tibetan Plateau, Greenland, and high-latitude land regions likely because of the BC snow/ice albedo effect (Fig. S6 in the Supplement).
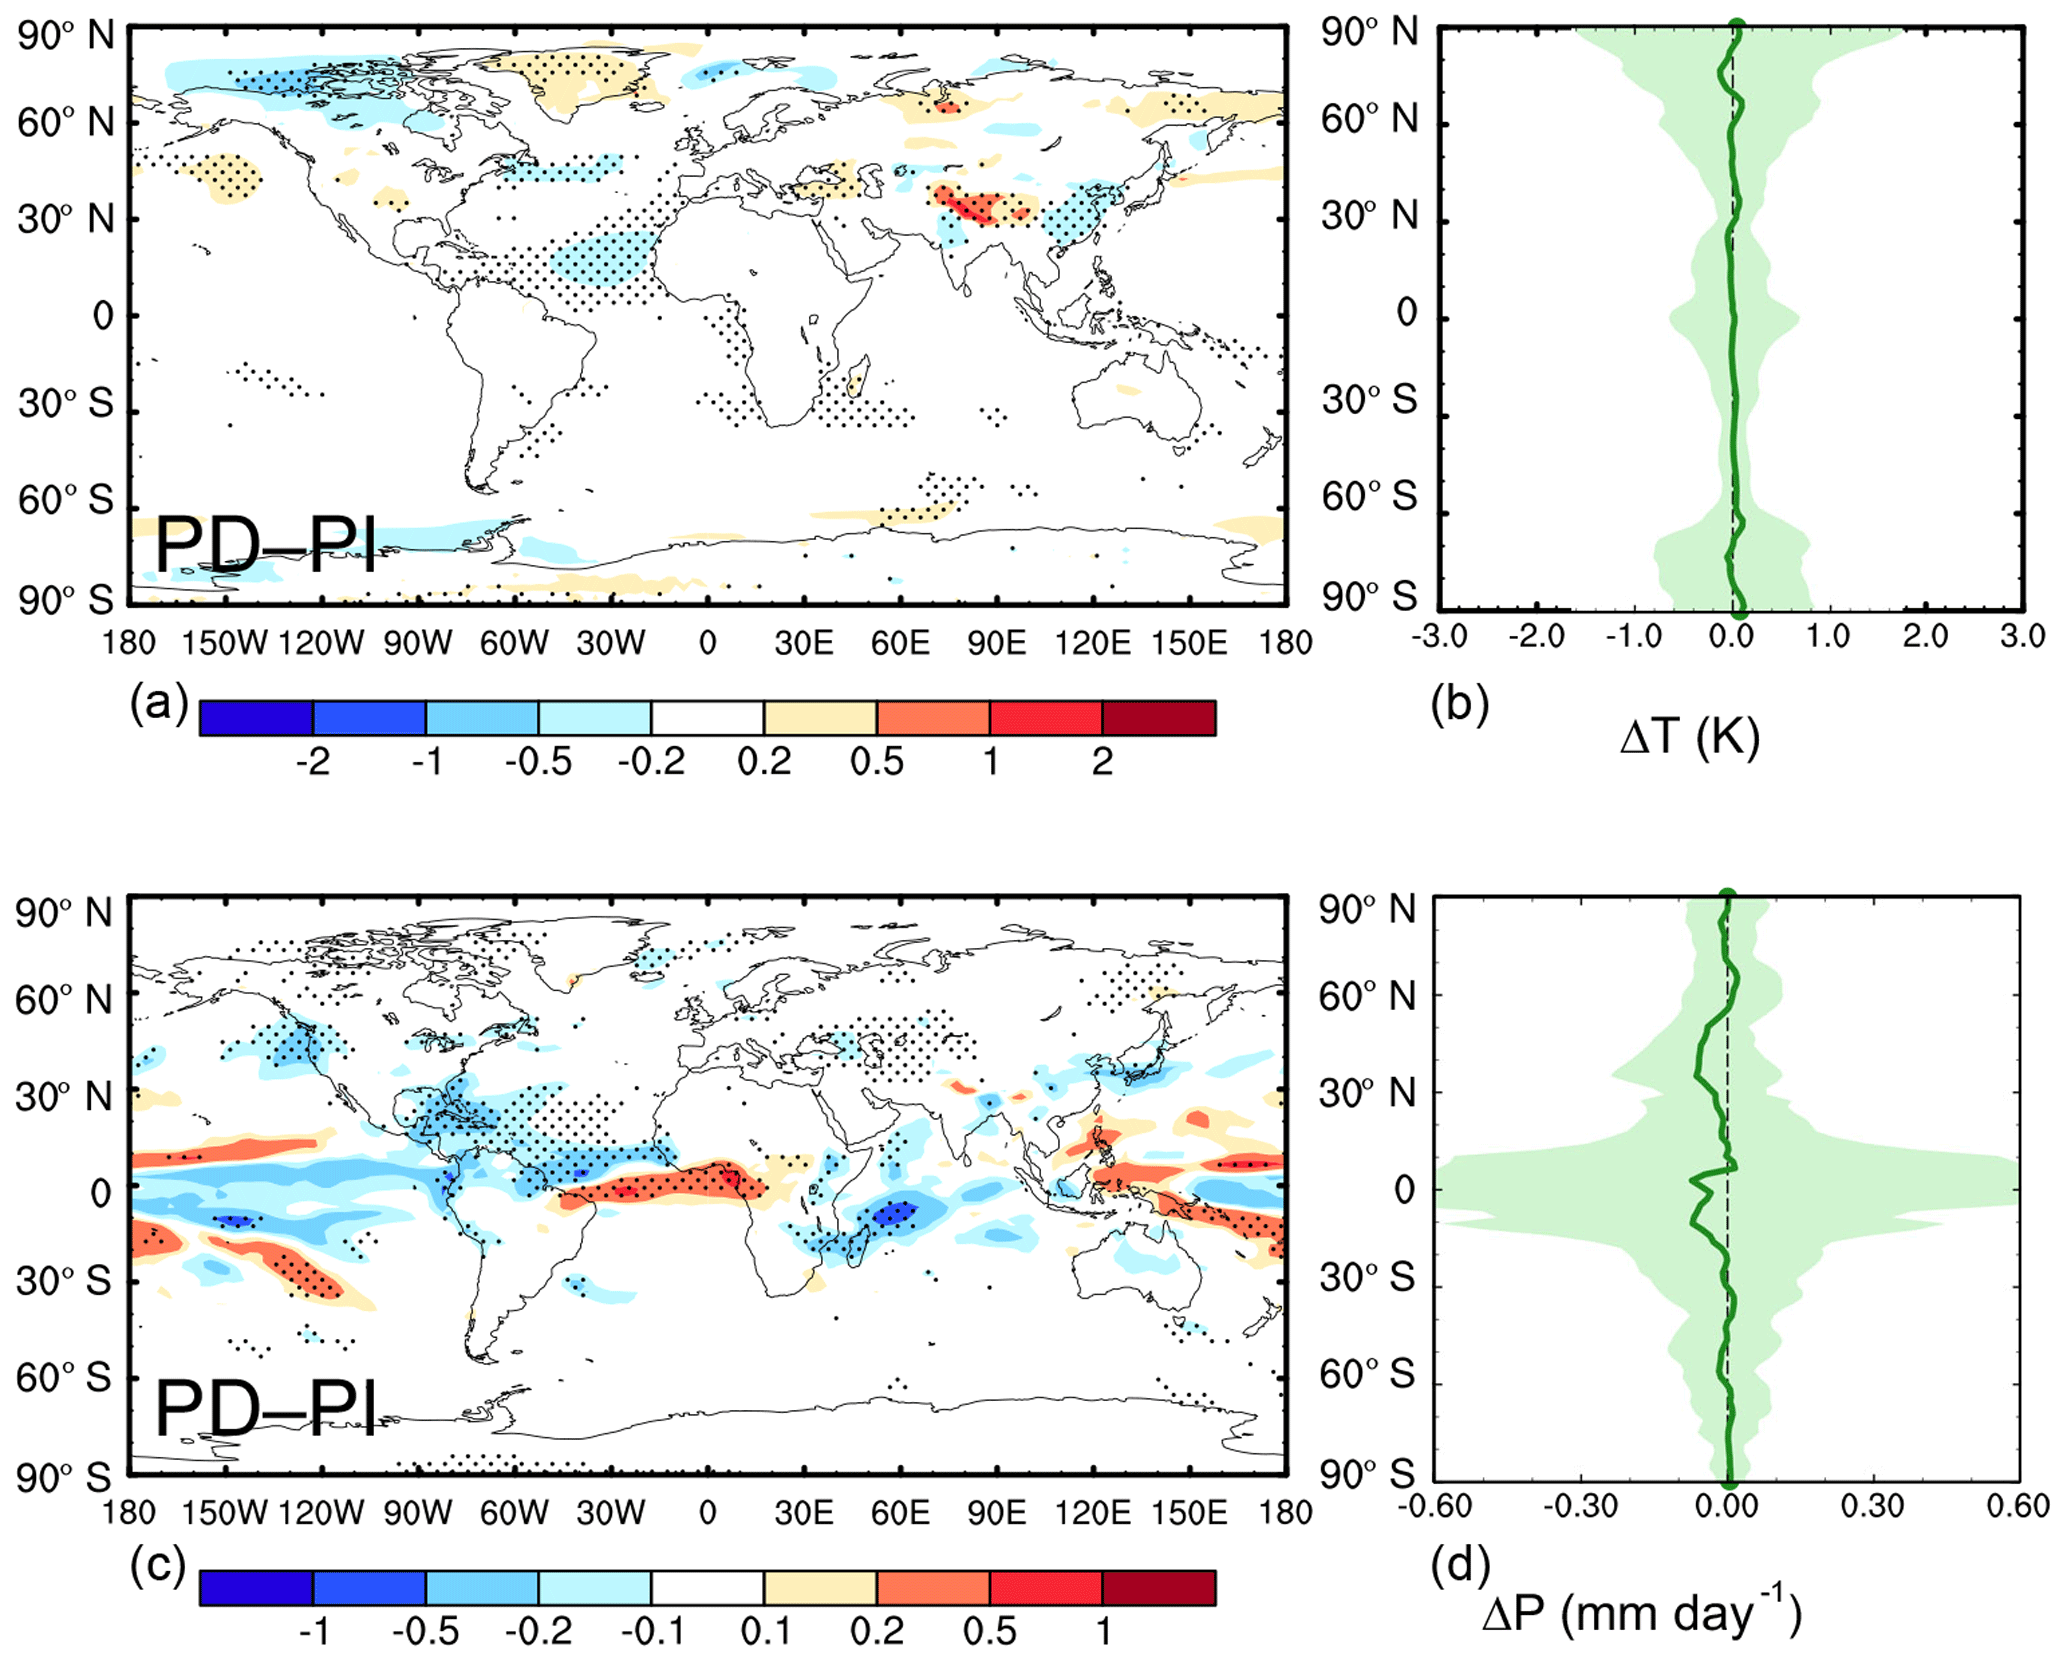
Figure 10Spatial distribution (a, c) and zonal mean (b, d) of differences in annual mean surface temperature (K, a, b) and total precipitation rate (mm day−1, c, d) between PD and PI. The dotted areas in (a, c) indicate statistical significance with 95 % confidence from a two-tailed Student's t test.
The spatial pattern is similar to that from the ECHAM6-HAM2 in Baker et al. (2015). Although CESM CAM5-MAM4 also includes the BC snow/ice albedo effect, we do not see the strong warming produced in NorESM under present-day BC emissions. In Baker et al. (2015), NorESM had a global net TOA shortwave forcing efficiency of 0.076 W m−2 (Tg yr−1)−1, nominally higher than 0.043±0.073 W m−2 (Tg yr−1)−1 calculated in this study with CESM CAM5-MAM4, although the difference is well within 1 standard deviation (SD). Longer model runs would be needed to determine if the BC snow/ice albedo effect is significantly different in CESM and NorESM. In addition, there may be a small contribution from a shorter BC lifetime (7.22 days in CESM CAM5-MAM4 vs. 7.82 days in NorESM) that might also help explain the weaker warming in CESM CAM5-MAM4 as compared to NorESM.
We find that variability is substantial in our experiments. Although statistically significant surface temperature changes are found regionally, as mentioned above, large-scale global surface temperature change from current-day BC emissions is statistically indistinguishable from zero (0.006±0.238 K globally and 0.020±0.346 K for land only). The global temperature response is within the range of −0.085 to 0.152 K from the four models in Baker et al. (2015). Even in the large MID7X perturbation, variability is still fairly large relative to the signal (0.45 ± 0.27 K for midlatitude temperate change) and would overwhelm any large-scale signal for more realistic perturbation sizes. Similarly, while the midlatitude precipitation response to midlatitude BC emissions is strong for a MID7X perturbation, this would be difficult to detect for a present-day perturbation.
BC has been estimated to potentially have one of the largest positive (warming) anthropogenic forcing influences. As a result, there has been substantial scientific and policy attention focused on the potential for BC to moderate climate change in the near-term. In this study, for the first time, we conduct a comprehensive set of emission-driven experiments using a leading coupled climate model (CESM). With a comprehensive set of experiments, we examined regional climate responses, nonlinearity, and short-term transient responses to BC emission perturbations in the Arctic, midlatitudes, and globally.
With increases in midlatitude BC emissions, surface air temperature increases over land, while it decreases over oceanic and coastal areas. Increases in Arctic BC emissions lead to warming over both the Arctic and midlatitudes. Increases in Arctic and midlatitude BC emissions also decrease precipitation over 60∘ N and 30–50∘ N, respectively. Arctic emissions are more efficient in influencing Arctic surface air temperatures compared to midlatitude emissions, with an Arctic temperature sensitivity to Arctic emissions 7 times as large as that to midlatitude emissions.
We find that climate responses do not scale linearly with emissions. While stronger BC emission perturbations have a higher burden efficiency, efficiencies of snow/ice albedo forcing and direct radiative effect are lower, leading to a lower temperature sensitivity for stronger BC emission perturbations.
BC also impacts temperature much faster than greenhouse gas forcing, with transient temperature responses in the Arctic and midlatitudes approaching a quasi-equilibrium state with a timescale of 2–3 years. While it has previously been found that, globally, aerosols have a faster impact on temperature as compared to greenhouse gases (Shindell., 2014), termed a “geometric effect” (Meinshausen et al., 2011), we find here that BC perturbations have a very short response time, particularly for Arctic and midlatitude perturbations. This means that previous studies that have implicitly assumed that the temperature response timescales of BC and greenhouse gases are the same (Boucher and Reddy, 2008; Stohl et al., 2015) have likely underestimated the short-term impact of BC emission changes.
We find a large variability in BC-induced climate changes. Baker et al. (2015) provided error bars of global temperature response for different models in their Fig. 4a. We note, however, that the error bars in Baker et al. (2015) are underestimated because of their assumption of independence of all annual data points (note their use of 1 σ∕sqrt(N) in their error bars for Fig. 4). Climate model surface temperatures are strongly correlated over short timescales, which means that instead of the number of data points, a more appropriate measure is the effective number of independent data points (Neff). The 100-year model runs examined here do not provide enough data for this calculation. (Note that we were able to estimate Neff for the 300-year CESM control run from CMIP5, which indicates that runs around 3 times as long as those presented here may be necessary.) We, therefore, present SD as a metric of variance.
The SD of global mean surface temperature in PI, PD, and in all of our perturbed simulations is around 0.17–0.19 K, indicating that the dominant source of temperature variability is probably due to internal climate variability or model noise. The SD for temperature responses in perturbed simulations relative to PD are in ranges of 0.24–0.26, roughly 1.4 times the control run temperature variability. This is the expectation from subtracting two independent Gaussian noise distributions. While there could be an additional contribution to variability from BC–climate interactions, this appears to be small in this case given the relatively small surface temperature response to BC. We also observe large variability in cloud radiative effects, which we note may be impacted by interactions with BC.
While we have demonstrated nonlinear responses at high emission levels, this non-linearity is not sufficient to produce statistically significant global temperature changes from present-day BC emissions in this model. Such nonlinearities mean that the implications of large BC emission perturbation experiments, such as recent 10-fold BC experiments (Stjern et al., 2017), for present-day conditions are unclear. While snow/ice albedo feedbacks appear to dominate the nonlinear relationship in these results, this may not be the case in other models.
Our results point to the importance of better quantifying the variability in BC responses in the Earth system. We note that in the one model with a consistent PD–PI signal in a set of recent PD–PI BC experiments (NorESM1-M), the size of that signal is still smaller than the variability found here, based on a similar SD in Arctic temperature change for the ARC150X simulations in the two models (compare Fig. S3 in the Supplement here with Fig. 9 in Sand et al., 2013b). If the global variability of BC response in NorESM is also similar to that in CESM, then the global average temperature change from NorESM (0.141 K; Baker et al., 2015) is also smaller than the SD in CESM of 0.238 K. However, we do note that there was a fair degree of consistency in temperature change signal in NorESM between two ensemble members (0.129 and 0.152 K). This may mean that variability in the global BC response in the NorESM model could be smaller than seen in our results due to the stronger NorESM BC temperature response. Longer simulations would likely be required to assess this. While – compared to temperature or precipitation – aerosol burdens, BC direct radiative effects, and snow/ice albedo forcings have much larger signal to noise ratios, i.e., ratio of mean response to SD (Table 1), and can be useful as diagnostics, BC forcing does not provide a reliable indicator of surface temperature changes across models.
These results indicate that even substantial BC emissions reductions from current levels may lead to detectable surface temperature changes for only limited regions of the globe. Our results have significant implications for near-term climate change mitigation associated with BC as well as global and regional climate attribution. We note that regional climate sensitivities, used as an approximate approach to represent the impact of BC (Collins et al., 2013; Sand et al., 2016), are generally evaluated using model simulations with prescribed forcing or burdens (Shindell and Faluvegi, 2009), which artificially reduce response variability and imply a certainty in BC responses that may not exist in reality. Variability within any given model run, which has generally not been reported in current literature, is large relative to BC responses. It is, therefore, not clear if current BC emission levels result in statistically significant large-scale climatic changes. We suggest that impacts of BC on climate should be expressed directly in terms of impacts per unit emissions (e.g., Table 1) and not only relative to forcing given the complex relationship between BC climatic impacts and TOA forcing. In addition, BC impacts should be re-evaluated using coupled models, and provided with measures of response variability, such as SD. In order to better assess the potential impact of changes in BC emissions, it is critical to quantify the nonlinearity of BC response efficiencies with respect to emission perturbation size in other models, as well as the causes of those nonlinearities.
All the emissions datasets used in this study can be obtained from https://esgf-node.llnl.gov/search/input4mips/ (last access: 18 February 2019) (Hoesly et al., 2018; van Marle et al., 2017). The CESM model is publicly available at http://www.cesm.ucar.edu/models/cesm1.2/ (last access: 18 February 2019) (Hurrell et al., 2013). Our model results can be made available through the National Energy Research Scientific Computing Center (NERSC) servers upon request.
The supplement related to this article is available online at: https://doi.org/10.5194/acp-19-2405-2019-supplement.
YY, SJS, HW, and PJR designed the research; CMM did initial model setup; YY performed the model simulations; and YY and SJS analyzed the data. All the authors discussed the results and wrote the paper.
The authors declare that they have no conflict of interest.
This research is based on work that was supported by the US Environmental
Protection Agency, and the US Department of Energy (DOE), Office of
Science, Biological and Environmental Research as part of the Regional and
Global Climate Modeling program. The Pacific Northwest National Laboratory is
operated for DOE by Battelle Memorial Institute under contract
DE-AC05-76RLO1830. The National Energy Research Scientific Computing
Center (NERSC) provided computational support.
Edited by: Qiang Zhang
Reviewed by: two anonymous referees
Abdul-Razzak, H. and Ghan, S. J.: A parameterization of aerosol activation 2. Multiple aerosol types, J. Geophys. Res., 105, 6837–6844, https://doi.org/10.1029/1999JD901161, 2000.
Andrews, T., Forster, P. M., Boucher, O., Bellouin, N., and Jones, A.: Precipitation, radiative forcing and global temperature change, Geophys. Res. Lett., 37, L14701, https://doi.org/10.1029/2010GL043991, 2010.
Baker, L. H., Collins, W. J., Olivié, D. J. L., Cherian, R., Hodnebrog, Ø., Myhre, G., and Quaas, J.: Climate responses to anthropogenic emissions of short-lived climate pollutants, Atmos. Chem. Phys., 15, 8201–8216, https://doi.org/10.5194/acp-15-8201-2015, 2015.
Ban-Weiss, G. A., Cao, L., Bala, G., and Caldeira, K.: Dependence of climate forcing and response on the altitude of black carbon aerosols, Clim. Dynam., 38, 897–911, https://doi.org/10.1007/s00382-011-1052-y, 2012.
Betancourt, M.: A conceptual introduction to Hamiltonian Monte Carlo, arXiv preprint, arXiv:1701.02434, 2017.
Bond, T. C., Doherty, S. J., Fahey, D. W., Forster, P. M., Berntsen, T., DeAngelo,B. J., Flanner, M. G., Ghan, S., Kärcher, B., Koch, D., Kinne, S., Kondo, Y., Quinn, P. K., Sarofim, M. C., Schultz, M. G., Schulz, M., Venkataraman, C., Zhang, H., Zhang, S., Bellouin, N., Guttikunda, S. K., Hopke, P. K., Jacobson, M. Z., Kaiser, J. W., Klimont, Z., Lohmann, U., Schwarz, J. P., Shindell, D., Storelvmo, T., Warren, S. G., and Zender, C. S.: Bounding the role of black carbon in the climate system: A scientific assessment, J. Geophys. Res., 118, 5380–5552, https://doi.org/10.1002/jgrd.50171, 2013.
Boucher, O. and Reddy, M. S.: Climate trade-off between black carbon and carbon dioxide emissions, Energ. Policy, 36, 193–200, https://doi.org/10.1016/j.enpol.2007.08.039, 2008.
Boucher, O., Randall, D., Artaxo, P., Bretherton, C., Feingold, G., Forster, P., Kerminen, V.-M., Kondo, Y., Liao, H., Lohmann, U., Rasch, P., Satheesh, S. K., Sherwood, S., Stevens, B., and Zhang, X. Y.: Clouds and Aerosols, in: Climate Change 2013: The Physical Science Basis, Contribution of Working Group I to the Fifth Assessment Report of the Intergovernmental Panel on Climate Change, edited by: Stocker, T. F., Qin, D., Plattner, G.-K., Tignor, M., Allen, S. K., Boschung, J., Nauels, A., Xia, Y., Bex, V., and Midgley, P. M., Cambridge University Press, Cambridge, UK and New York, NY, USA, 571–658, https://doi.org/10.1017/CBO9781107415324.016, 2013.
Collins, W. J., Fry, M. M., Yu, H., Fuglestvedt, J. S., Shindell, D. T., and West, J. J.: Global and regional temperature-change potentials for near-term climate forcers, Atmos. Chem. Phys., 13, 2471–2485, https://doi.org/10.5194/acp-13-2471-2013, 2013.
Flanner, M. G.: Arctic climate sensitivity to local black carbon, J. Geophys. Res.-Atmos., 118, 1840–1851, https://doi.org/10.1002/jgrd.50176, 2013.
Flanner, M. G., Zender, C. S., Randerson, J. T., and Rasch, P. J.: Present day climate forcing and response from black carbon in snow, J. Geophys. Res., 112, D11202, https://doi.org/10.1029/2006JD008003, 2007.
Geoffroy, O., Saint-Martin, D., Bellon, G., and Voldoire, A.: Transient climate response in a two-layer energy-balance model. Part II: Representation of the efficacy of deep-ocean heat uptake and validation for CMIP5 AOGCMs, J. Climate, 26, 1859–1876, https://doi.org/10.1175/JCLI-D-12-00196.1, 2013.
Gettelman, A., Liu, X., Ghan, S. J., Morrison, H., Park, S., Conley, A. J., Klein, S. A., Boyle, J., Mitchell, D. L., and Li, J. L. F.: Global simulations of ice nucleation and ice supersaturation with an improved cloud scheme in the Community Atmosphere Model, J. Geophys. Res., 115, D18216, https://doi.org/10.1029/2009jd013797, 2010.
Ghan, S. J.: Technical Note: Estimating aerosol effects on cloud radiative forcing, Atmos. Chem. Phys., 13, 9971–9974, https://doi.org/10.5194/acp-13-9971-2013, 2013.
Hansen, J., Sato, M., Ruedy, R., Nazarenko, L., Lacis, A., Schmidt, G. A., Russell, G., Aleinov, I., Bauer, M., Bauer, S., Bell, N., Cairns, B., Canuto, V., Chandler, M., Cheng, Y., Del Genio, A., Faluvegi, G., Fleming, E., Friend, A., Hall, T., Jackman, C., Kel- ley, M., Kiang, N., Koch, D., Lean, J., Lerner, J., Lo, K., Menon, S., Miller, R., Minnis, P., Novakov, T., Oinas, V., Perlwitz, Ja., Perlwitz, Ju., Rind, D., Romanou, A., Shindell, D., Stone, P., Sun, S., Tausnev, N., Thresher, D., Wielicki, B., Wong, T., Yao, M., and Zhang, S.: Efficacy of climate forcings, J. Geophys. Res., 110, D18104, https://doi.org/10.1029/2005JD005776, 2005.
Hoesly, R. M., Smith, S. J., Feng, L., Klimont, Z., Janssens-Maenhout, G., Pitkanen, T., Seibert, J. J., Vu, L., Andres, R. J., Bolt, R. M., Bond, T. C., Dawidowski, L., Kholod, N., Kurokawa, J.-I., Li, M., Liu, L., Lu, Z., Moura, M. C. P., O'Rourke, P. R., and Zhang, Q.: Historical (1750–2014) anthropogenic emissions of reactive gases and aerosols from the Community Emissions Data System (CEDS), Geosci. Model Dev., 11, 369–408, https://doi.org/10.5194/gmd-11-369-2018, 2018.
Hurrell, J. W., Holland, M. M., Gent, P. R., Ghan, S., Kay, J. E., Kushner, P. J., Lamarque, J. F., Large, W. G., Lawrence, D., Lindsay, K., Lipscomb, W. H., Long, M. C., Mahowald, N., Marsh, D. R., Neale, R. B., Rasch, P., Vavrus, S., Vertenstein, M., Bader, D., Collins, W. D., Hack, J. J., Kiehl, J., and Marshall, S.: The Community Earth System Model A Framework for Collaborative Research, B. Am. Meteorol. Soc., 94, 1339–1360, https://doi.org/10.1175/BAMS-D-12-00121.1, 2013.
Hwang, Y.-T., Frierson, D. M. W., and Kang, S. M.: Anthropogenic sulfate aerosol and the southward shift of tropical precipitation in the late 20th century, Geophys. Res. Lett., 40, 2845–2850, https://doi.org/10.1002/grl.50502, 2013.
Jacobson, M. Z.: Climate response of fossil fuel and biofuel soot, accounting for soot's feedback to snow and sea ice albedo and emissivity, J. Geophys. Res., 109, D21201, https://doi.org/10.1029/2004JD004945, 2004.
Johnson, B. T., Shine, K. P., and Forster, P. M.: The semi-direct aerosol effect: Impact of absorbing aerosols on marine stratocumulus, Q. J. Roy. Meteor. Soc., 130, 1407–1422, https://doi.org/10.1256/qj.03.61, 2004.
Koch, D. and Del Genio, A. D.: Black carbon semi-direct effects on cloud cover: review and synthesis, Atmos. Chem. Phys., 10, 7685–7696, https://doi.org/10.5194/acp-10-7685-2010, 2010.
Koren, I., Kaufman, Y. J., Remer, L. A., and Martins, J. V.: Measurement of the effect of Amazon smoke on inhibition of cloud formation, Science, 303, 1342–1345, https://doi.org/10.1126/science.1089424, 2004.
Kvalevåg, M. M., Samset, B. H., and Myhre, G.: Hydrological sensitivity to greenhouse gases and aerosols in a global climate model, Geophys. Res. Lett., 40, 1432–1438, https://doi.org/10.1002/grl.50318, 2013.
Liu, X., Ma, P.-L., Wang, H., Tilmes, S., Singh, B., Easter, R. C., Ghan, S. J., and Rasch, P. J.: Description and evaluation of a new four-mode version of the Modal Aerosol Module (MAM4) within version 5.3 of the Community Atmosphere Model, Geosci. Model Dev., 9, 505–522, https://doi.org/10.5194/gmd-9-505-2016, 2016.
McFarquhar, G. M. and Wang, H.: Effects of Aerosols on Trade Wind Cumuli over the Indian Ocean: Model Simulations, Q. J. Roy. Meteor. Soc., 132, 821–843, https://doi.org/10.1256/qj.04.179, 2006.
McFarquhar, G. M., Ghan, S., Verlinde, J., Korolev, A., Strapp, J. W., Schmid, B., Tomlinson, J. M., Wolde, M., Brooks, S. D., Cziczo, D., Dubey, M. K., Fan, J., Flynn, C., Gultepe, I., Hubbe, J., Gilles, M. K., Laskin, A., Lawson, P., Leaitch, W. R., Liu, P., Liu, X., Lubin, D., Mazzoleni, C., Macdonald, A.-M., Moffet, R. C., Morrison, H., Ovchinnikov, M., Shupe, M. D., Turner, D. D., Xie, S., Zelenyuk, A., Bae, K., Freer, M., and Glen, A.: Indirect and Semi-Direct Aerosol Campaign (ISDAC): The Impact of Arctic Aerosols on Clouds, B. Am. Meteorol. Soc., 92, 183–201, https://doi.org/10.1175/2010BAMS2935.1, 2011.
Meinshausen, M., Smith, S. J., Calvin, K., Daniel, J. S., Kainuma, M. L. T., Lamarque, J.-F., Matsumoto, K., Montzka, S. A., Raper, S. C. B., Riahi, K., Thomson, A., Velders, G. J. M., and van Vuuren, D. P. P.: The RCP greenhouse gas concentrations and their extensions from 1765 to 2300, Clim. Chang. Manag., 109, 213–241, https://doi.org/10.1007/s10584-011-0156-z, 2011.
Ming, Y., Ramaswamy, V., and Persad, G.: Two opposing effects of absorbing aerosols on global-mean precipitation, Geophys. Res. Lett., 37, L13701, https://doi.org/10.1029/2010GL042895, 2010.
Morrison, H. and Gettelman, A.: A new two-moment bulk stratiform cloud microphysics scheme in the Community Atmosphere Model, version 3 (CAM3), Part I: Description and numerical tests, J. Clim., 21, 3642–3659, https://doi.org/10.1175/2008JCLI2105.1, 2008.
Oshima, N., Koike, M., Zhang, Y., Kondo, Y., Moteki, N., Takegawa, N., and Miyazaki, Y.: Aging of black carbon in outflow from anthropogenic sources using a mixing state resolved model: Model development and evaluation, J. Geophys. Res., 114, D06210, https://doi.org/10.1029/2008JD010680, 2009.
Qian, Y., Wang, H., Zhang, R., Flanner, M. G., and Rasch, P. J.: A sensitivity study on modeling black carbon in snow and its radiative forcing over the Arctic and Northern China, Environ. Res. Lett., 9, 064001, https://doi.org/10.1088/1748-9326/9/6/064001, 2014.
Ramanathan, V. and Carmichael, G.: Global and regional climate changes due to black carbon, Nat. Geosci., 1, 221–227, https://doi.org/10.1038/ngeo156, 2008.
Sand, M., Berntsen, T. K., Kay, J. E., Lamarque, J. F., Seland, Ø., and Kirkevåg, A.: The Arctic response to remote and local forcing of black carbon, Atmos. Chem. Phys., 13, 211–224, https://doi.org/10.5194/acp-13-211-2013, 2013a.
Sand, M., Berntsen, T. K., Seland, Ø., and Kristjánsson, J. E.: Arctic surface temperature change to emissions of black carbon within Arctic or midlatitudes, J. Geophys. Res.-Atmos., 118, 7788–7798, https://doi.org/10.1002/jgrd.50613, 2013b.
Sand, M., Iversen, T., Bohlinger, P., Kirkevåg, A., Seierstad, I., Seland, Ø., and Sorteberg, A: A standardized global climate model study showing unique properties for the climate response to black carbon aerosols, J. Climate., 28, 2512–2526, https://doi.org/10.1175/JCLI-D-14-00050.1, 2015.
Sand, M., Berntsen, T. K., von Salzen, K., Flanner, M. G., Langner, J., and Victor, D. G.: Response of Arctic temperature to changes in emissions of short-lived climate forcers, Nat. Clim. Change, 6, 286–289, https://doi.org/10.1038/nclimate2880, 2016.
Shindell, D.: Inhomogeneous forcing and transient climate sensitivity, Nat. Clim. Change, 4, 274–277, https://doi.org/10.1038/nclimate2136, 2014.
Shindell, D. and Faluvegi, G.: Climate response to regional radiative forcing during the twentieth century, Nat. Geosci., 2, 294–300, https://doi.org/10.1038/ngeo473, 2009.
Shindell, D., Kuylenstierna, J. C. I., Vignati, E., van Dingenen, R., Amann, M., Klimont, Z., Anenberg, S. C., Muller, N., Janssens-Maenhout, G., Raes, F., Schwartz, J., Faluvegi, G., Pozzoli, L., Kupiainen, K., Höglund-Isaksson, L., Emberson, L., Streets, D., Ramanathan, V., Hicks, K., Oanh, N. T. K., Milly, G., Williams, M., Demkine, V., and Fowler, D.: Simultaneously Mitigating Near-Term Climate Change and Improving Human Health and Food Security, Science, 335, 183–189, https://doi.org/10.1126/science.1210026, 2012.
Smith, S. J. and Mizrahi, A.: Near-term climate mitigation by short-lived forcers, P. Natl. Acad. Sci. USA, 110, 14202–14206, https://doi.org/10.1073/pnas.1308470110, 2013.
Stjern, C. W., Samset, B. H., Myhre, G., Forster, P. M., Hodnebrog, Ø., Andrews, T., Boucher, O., Faluvegi, G., Iversen, T., Kasoar, M., Kharin, V., Kirkevåg, A., Lamarque, J.-F., Olivié, D., Richardson, T., Shawki, D., Shindell, D., Smith, C., Takemura, T., and Voulgarakis, A.: Rapid adjustments cause weak surface temperature response to increased black carbon concentrations, J. Geophys. Res.-Atmos., 122, 11462–11481, https://doi.org/10.1002/2017JD027326, 2017.
Stohl, A., Klimont, Z., Eckhardt, S., Kupiainen, K., Shevchenko, V. P., Kopeikin, V. M., and Novigatsky, A. N.: Black carbon in the Arctic: the underestimated role of gas flaring and residential combustion emissions, Atmos. Chem. Phys., 13, 8833–8855, https://doi.org/10.5194/acp-13-8833-2013, 2013.
Stohl, A., Aamaas, B., Amann, M., Baker, L. H., Bellouin, N., Berntsen, T. K., Boucher, O., Cherian, R., Collins, W., Daskalakis, N., Dusinska, M., Eckhardt, S., Fuglestvedt, J. S., Harju, M., Heyes, C., Hodnebrog, Ø., Hao, J., Im, U., Kanakidou, M., Klimont, Z., Kupiainen, K., Law, K. S., Lund, M. T., Maas, R., MacIntosh, C. R., Myhre, G., Myriokefalitakis, S., Olivié, D., Quaas, J., Quennehen, B., Raut, J.-C., Rumbold, S. T., Samset, B. H., Schulz, M., Seland, Ø., Shine, K. P., Skeie, R. B., Wang, S., Yttri, K. E., and Zhu, T.: Evaluating the climate and air quality impacts of short-lived pollutants, Atmos. Chem. Phys., 15, 10529–10566, https://doi.org/10.5194/acp-15-10529-2015, 2015.
van Marle, M. J. E., Kloster, S., Magi, B. I., Marlon, J. R., Daniau, A.-L., Field, R. D., Arneth, A., Forrest, M., Hantson, S., Kehrwald, N. M., Knorr, W., Lasslop, G., Li, F., Mangeon, S., Yue, C., Kaiser, J. W., and van der Werf, G. R.: Historic global biomass burning emissions for CMIP6 (BB4CMIP) based on merging satellite observations with proxies and fire models (1750–2015), Geosci. Model Dev., 10, 3329–3357, https://doi.org/10.5194/gmd-10-3329-2017, 2017.
Wang, H., Easter, R. C., Rasch, P. J., Wang, M., Liu, X., Ghan, S. J., Qian, Y., Yoon, J.-H., Ma, P.-L., and Vinoj, V.: Sensitivity of remote aerosol distributions to representation of cloud–aerosol interactions in a global climate model, Geosci. Model Dev., 6, 765–782, https://doi.org/10.5194/gmd-6-765-2013, 2013.
Wang, M., Larson, V., Ghan, S., Ovchinnikov, M., Schanen, D., Xiao, H., Liu, X., Guo, Z., and Rasch, P.: A multiscale modeling framework model (superparameterized CAM5) with a higher-order turbulence closure: Model description and low-cloud simulations, J. Adv. Model. Earth Syst., 7, 484–509, https://doi.org/10.1002/2014MS000375, 2015.
Yang, Y., Russell, L. M., Xu, L., Lou, S., Lamjiri, M. A., Somerville, R. C. J., Miller, A. J., Cayan, D. R., DeFlorio, M. J., Ghan, S. J., Liu, Y., Singh, B., Wang, H., Yoon, J.-H., and Rasch, P. J.: Impacts of ENSO events on cloud radiative effects in preindustrial conditions: Changes in cloud fraction and their dependence on interactive aerosol emissions and concentrations, J. Geophys. Res.-Atmos., 121, 6321–6335, https://doi.org/10.1002/2015JD024503, 2016a.
Yang, Y., Russell, L. M., Lou, S., Lamjiri, M. A., Liu, Y., Singh, B., and Ghan, S. J.: Changes in Sea Salt Emissions Enhance ENSO Variability, J. Climate, 29, 8575–8588, https://doi.org/10.1175/JCLI-D-16-0237.1, 2016b.
Yang, Y., Wang, H., Smith, S. J., Ma, P.-L., and Rasch, P. J.: Source attribution of black carbon and its direct radiative forcing in China, Atmos. Chem. Phys., 17, 4319–4336, https://doi.org/10.5194/acp-17-4319-2017, 2017.
Yang, Y., Wang, H., Smith, S. J., Zhang, R., Lou, S., Qian, Y., Ma, P.-L., and Rasch, P. J.: Recent intensification of winter haze in China linked to foreign emissions and meteorology, Sci. Rep., 8, 2107, https://doi.org/10.1038/s41598-018-20437-7, 2018a.
Yang, Y., Wang, H., Smith, S. J., Zhang, R., Lou, S., Yu, H., Li, C., and Rasch, P. J.: Source apportionments of aerosols and their direct radiative forcing and long-term trends over continental United States, Earth's Future, 6, 793–808, https://doi.org/10.1029/2018EF000859, 2018b.
Yang, Y., Wang, H., Smith, S. J., Easter, R. C., and Rasch, P. J.: Sulfate aerosol in the Arctic: Source attribution and radiative forcing, J. Geophys. Res.-Atmos., 123, 1899–1918, https://doi.org/10.1002/2017JD027298, 2018c.
Zhang, R., Wang, H., Hegg, D. A., Qian, Y., Doherty, S. J., Dang, C., Ma, P.-L., Rasch, P. J., and Fu, Q.: Quantifying sources of black carbon in western North America using observationally based analysis and an emission tagging technique in the Community Atmosphere Model, Atmos. Chem. Phys., 15, 12805–12822, https://doi.org/10.5194/acp-15-12805-2015, 2015a.
Zhang, R., Wang, H., Qian, Y., Rasch, P. J., Easter, R. C., Ma, P.-L., Singh, B., Huang, J., and Fu, Q.: Quantifying sources, transport, deposition, and radiative forcing of black carbon over the Himalayas and Tibetan Plateau, Atmos. Chem. Phys., 15, 6205–6223, https://doi.org/10.5194/acp-15-6205-2015, 2015b.
- Abstract
- Introduction
- Methods
- Regional climate responses to increases in Arctic and midlatitude BC emissions
- Nonlinearity of climate responses.
- Short-term transient climate responses
- Climate responses to present-day anthropogenic BC emissions
- Conclusions and discussions
- Data availability
- Author contributions
- Competing interests
- Acknowledgements
- References
- Supplement