the Creative Commons Attribution 4.0 License.
the Creative Commons Attribution 4.0 License.
 | 22 Feb 2019
Quantifying primary and secondary humic-like substances in urban aerosol based on emission source characterization and a source-oriented air quality model
Xinghua Li
Junzan Han
Philip K. Hopke
Jingnan Hu
Qi Shu
Qing Chang
Humic-like substances (HULIS) are a mixture of high-molecular-weight, water-soluble organic compounds that are widely distributed in atmospheric aerosol. Their sources are rarely studied quantitatively. Biomass burning is generally accepted as a major primary source of ambient humic-like substances (HULIS) with additional secondary material formed in the atmosphere. However, the present study provides direct evidence that residential coal burning is also a significant source of ambient HULIS, especially in the heating season in northern China based on source measurements, ambient sampling and analysis, and apportionment with source-oriented CMAQ modeling. Emission tests show that residential coal combustion produces 5 % to 24 % of the emitted organic carbon (OC) as HULIS carbon (HULISc). Estimation of primary emissions of HULIS in Beijing indicated that residential biofuel and coal burning contribute about 70 % and 25 % of annual primary HULIS, respectively. Vehicle exhaust, industry, and power plant contributions are negligible. The average concentration of ambient HULIS in PM2.5 was 7.5 µg m−3 in urban Beijing and HULIS exhibited obvious seasonal variations with the highest concentrations in winter. HULISc accounts for 7.2 % of PM2.5 mass, 24.5 % of OC, and 59.5 % of water-soluble organic carbon. HULIS are found to correlate well with K+, Cl−, sulfate, and secondary organic aerosol, suggesting its sources include biomass burning, coal combustion, and secondary aerosol formation. Source apportionment based on CMAQ modeling shows residential biofuel and coal burning and secondary formation are important sources of ambient HULIS, contributing 47.1 %, 15.1 %, and 38.9 %, respectively.
- Article
(3003 KB) - Full-text XML
-
Supplement
(869 KB) - BibTeX
- EndNote


Humic-like substances (HULIS) are a mixture of higher-molecular-weight organic compounds that resemble terrestrial and aquatic humic and fulvic acids with similar structures and properties (Graber and Rudich, 2006). HULIS are widely distributed in atmospheric aerosol, rain, and cloud and fog droplets and account for a significant proportion of organic carbon and water-soluble organic carbon (WSOC). For example, Zheng et al. (2013) reported that 9 % to 72 % of WSOC is HULIS. Because of their water-soluble and strong surface-active properties, HULIS may play an important role in the formation of clouds as condensation nuclei and ice nuclei and through aerosol hygroscopic growth (Dinar et al., 2006; Wang and Knopf, 2011; Gysel et al., 2004). Due to their strong light absorption in the UV range, HULIS can play an active role as brown carbon in radiative transfer and photochemical processes (Hoffer et al., 2006). HULIS deposition can also lead to a decrease in the albedo of ice and snow surfaces (Beine et al., 2011; France et al., 2011, 2012). Owing to their redox-active characteristics, HULIS were also suggested to induce adverse health effects (Lin and Yu, 2011; Ghio et al., 1996; Verma et al., 2012).
In recent years, studies focusing on the spatial and temporal variations, sources, and formation of HULIS have been reported. A summary of these studies is provided in Table S1 in the Supplement. Previous studies have identified primary emissions and atmospheric secondary formation as important sources of HULIS. Among the primary emission sources, biomass burning is generally accepted as a major source of HULIS, with evidence from ambient and source sampling as well as source apportionment studies (Lin et al., 2010a, b; Kuang et al., 2015; Park and Yu, 2016; Schmidl et al., 2008a, b; Goncalves et al., 2010). Recently, residential coal burning was suggested as an important primary HULIS source during winter (Tan et al., 2016; Voliotis et al., 2017). However, direct evidence of HULIS emissions from coal combustion is limited. Only one study on HULIS emitted from residential coal combustion was reported and the results showed that HULIS accounted for 5.3 % of smoke PM2.5 (Fan et al., 2016). Unfortunately, only a light coal in the shape of honeycomb briquette that did not reflect the variety of coal types and forms actually being used for residential heating and cooking in China was tested. Another possible primary HULIS source is vehicle exhaust, although there is uncertainty in the importance of this source (El Haddad et al., 2009; Salma et al., 2007; Lin et al., 2010b; Kuang et al., 2015). No direct evidence of primary HULIS in vehicle exhaust has been reported. Secondary processes, including formation in cloud droplets and heterogeneous or aerosol-phase reactions, can be important sources of HULIS (Lin et al., 2010b; Zheng et al., 2013).
Previous studies of HULIS source identification were generally based on the relationship between HULIS and the tracers for specific sources (such as K, levoglucosan, Cl−, etc.) (Voliotis et al., 2017; Tan et al., 2016; Lin et al., 2010a; Park and Son, 2016; Baduel et al., 2010). Those correlation analyses between HULIS and some species may provide some information regarding possible sources and formation of HULIS. However, they do not provide quantitative source apportionments. To date, studies that quantitatively identify HULIS sources are limited (Kuang et al., 2015; Srivastava et al., 2018). Kuang et al. (2015) applied positive matrix factorization (PMF) to apportion sources of ambient HULIS in the Pearl River Delta (PRD) in southern China. Their study showed that secondary formation was the most important source of HULIS throughout the year with an annual average contribution of 69 % at an urban site. Biomass burning also contributed significantly to ambient HULIS.
Thus, information on the quantitative apportionment of HULIS sources is scarce in the more polluted regions in northern China, especially in the winter when large quantities of coal are consumed for indoor heating. Moreover, a considerable proportion of coal is burned in residential household stoves in rural, suburban, and even some urban areas under poor combustion conditions and without any emission controls. This coal combustion results in high air pollutant emissions and high ambient concentrations. Wang et al. (2016) estimated that more than 30 million tons of coal are burned per year in households in just the Beijing, Tianjin, and Hebei (BTH) region in northern China. Residential sources in the BTH region contributed to 32 % and 50 % of primary PM2.5 emissions over the whole year and in winter, respectively (Liu et al., 2016).
The primary goals of this study are to determine whether residential coal combustion is a significant source of ambient HULIS and quantify its contributions to HULIS in Beijing. Given the large vehicle population in Beijing (up to 5.2 million in 2012), this study also provides a chance to examine the vehicular emissions' contribution to ambient HULIS. Studies included (1) characterization of the HULIS emitted from residential coal stoves, vehicle exhaust, and residential biofuel burning; (2) estimation of anthropogenic primary emissions of HULIS based on these source measurements; (3) Measurement of HULIS concentrations and other major species in the ambient urban Beijing PM2.5 from June 2012 to April 2013; and (4) application of the source-oriented Community Multiscale Air Quality (CMAQ) model to quantitatively determine the source contributions to HULIS. The information obtained in this study improves our understanding of the characteristics and sources of primary HULIS and the impact of those sources on HULIS in ambient PM2.5.
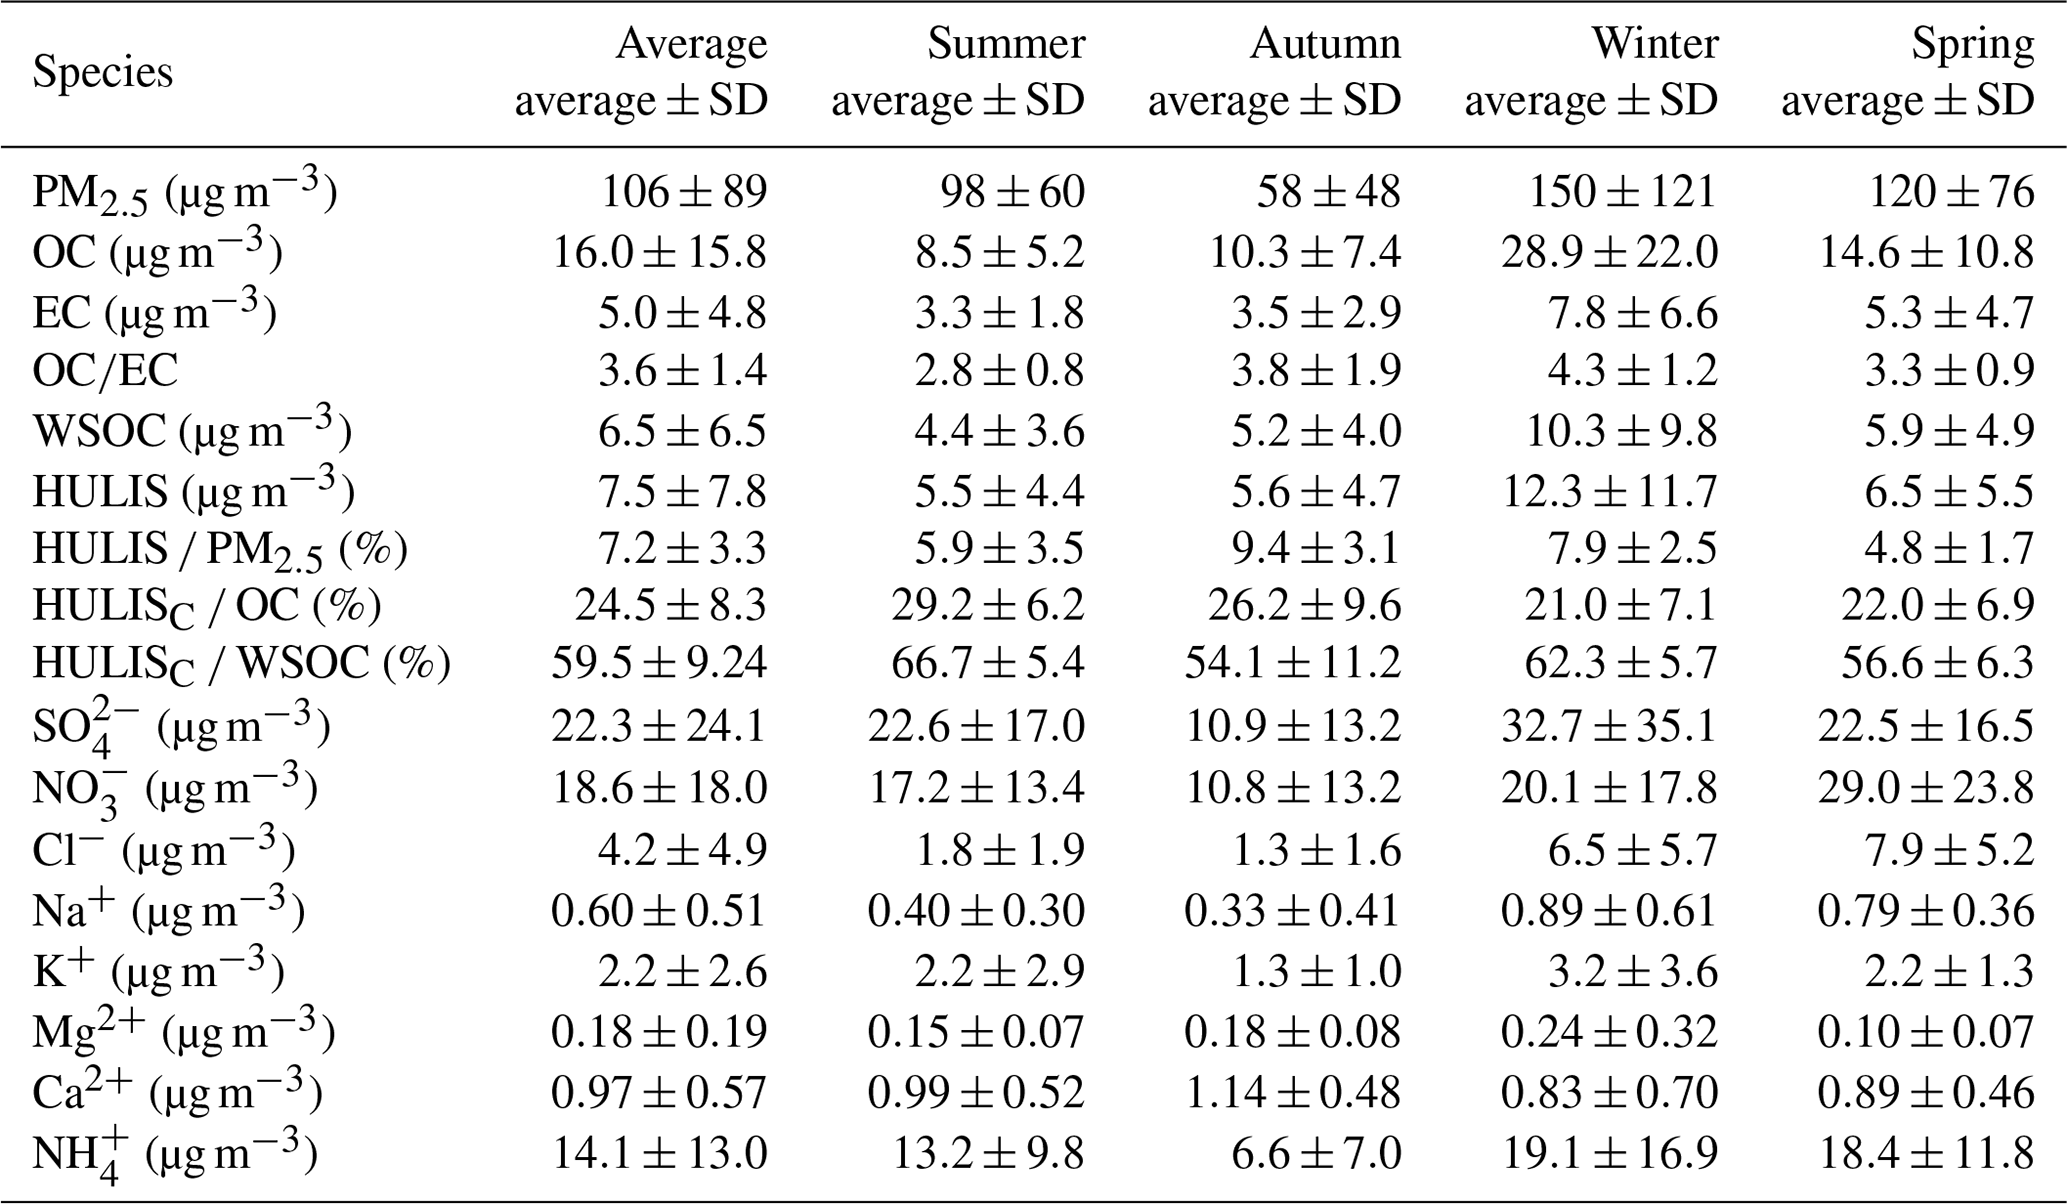
Table 1Summary of the concentrations of PM2.5, carbon species, water-soluble ions, and ratios between compounds.
2.1 Ambient sampling
Beijing is surrounded by mountains to the west, north, and northeast and is adjacent to the northwest portion of the North China Plain. It has a warm and semi-humid continental monsoon climate with four distinctive seasons, characterized by strong windy and dusty weather in spring, high temperatures and humidity with extensive rain in summer, cool and pleasant weather in autumn, and cold and dry weather in winter. The annual average wind speed is 2.5 m s−1 with mostly northerly or northwesterly winds in winter and southerly or southeasterly winds in summer.
From 14 June 2012 to 2 April 2013, 24 h ambient PM2.5 samples were collected noncontinuously on the campus of Beihang University (BHU, N, E) (Fig. S1 in the Supplement). The sampling period covered four seasons with 132 samples being collected for HULIS analysis. The site is surrounded by educational and residential districts without major industrial sources. Major nearby roads are the North Fourth Ring Road about 900 m to the north, North Third Ring Road about 1.2 km to the south, and Xueyuan Road about 350 m to the east. Ambient PM2.5 sampling instruments were installed on the roof of a building approximately 25 m above ground level at Beihang University. A high-volume aerosol sampler (RFPS-1287-063, Thermo Fisher Scientfic, USA) was operated at a flow rate of 1.13 m3 min−1 to collect PM2.5 samples on prebaked quartz filters (with an area of 417.6 cm2) for the determination of WSOC and HULIS. PM2.5 samples were also collected using a five-channel spiral ambient speciation sampler (SASS, Met One Inc., USA) with a flow rate of 6.7 L min−1. Wang et al. (2015) provided the details of the sample collection.
Meteorological data including wind speed (WS), temperature, relative humidity (RH), and precipitation were obtained from the China Meteorological Data Sharing Service System (http://cdc.cma.gov.cn/home.do, last access: 17 June 2017).
2.2 Source sampling
Residential biofuel and coal combustion emissions and vehicle exhaust, which are representative of typical emission sources around Beijing, were sampled in this study.
2.2.1 Residential biofuel and coal combustion
Three typical types of biofuel, i.e., wheat straw, corn stover, and wood, were burned in an improved stove, which has an enclosed combustion chamber and a bottom grate and a chimney. The sampling procedures are described by Li et al. (2007, 2009) and are briefly summarized here. The water boiling test was used to simulate a common cooking procedure. The burning cycle included heating a specific amount of water from room temperature to its boiling point and then letting it simmer for a few minutes. Both the high-power and low-power phases were included in the burn cycle to simulate cooking practices of a typical household. The sampling period covered the entire cycle and lasted 20–30 min.
Five coal types were selected for source testing covering a wide range of maturity with volatile matter content varying from 9.6 % to 32.4 %. Two coal stoves were tested, including a high-efficiency heating stove that employs under-fire combustion technology and a traditional cooking and heating stove that employs over-fire combustion technology (Li et al., 2016). Four chunk coals and one briquette coal were burned in the high-efficiency stove and three chunk coals were burned in the traditional stove. Coal–stove combinations are presented in Table 2. To reduce the interference from igniting the fire, coal was ignited with a propane gas flame from a torch. Emission sampling covered from fire start to fire extinction and lasted 2 to 3 h.
Table 2HULISC ∕ OC and HULISC ∕ WSOC values in the source samples.
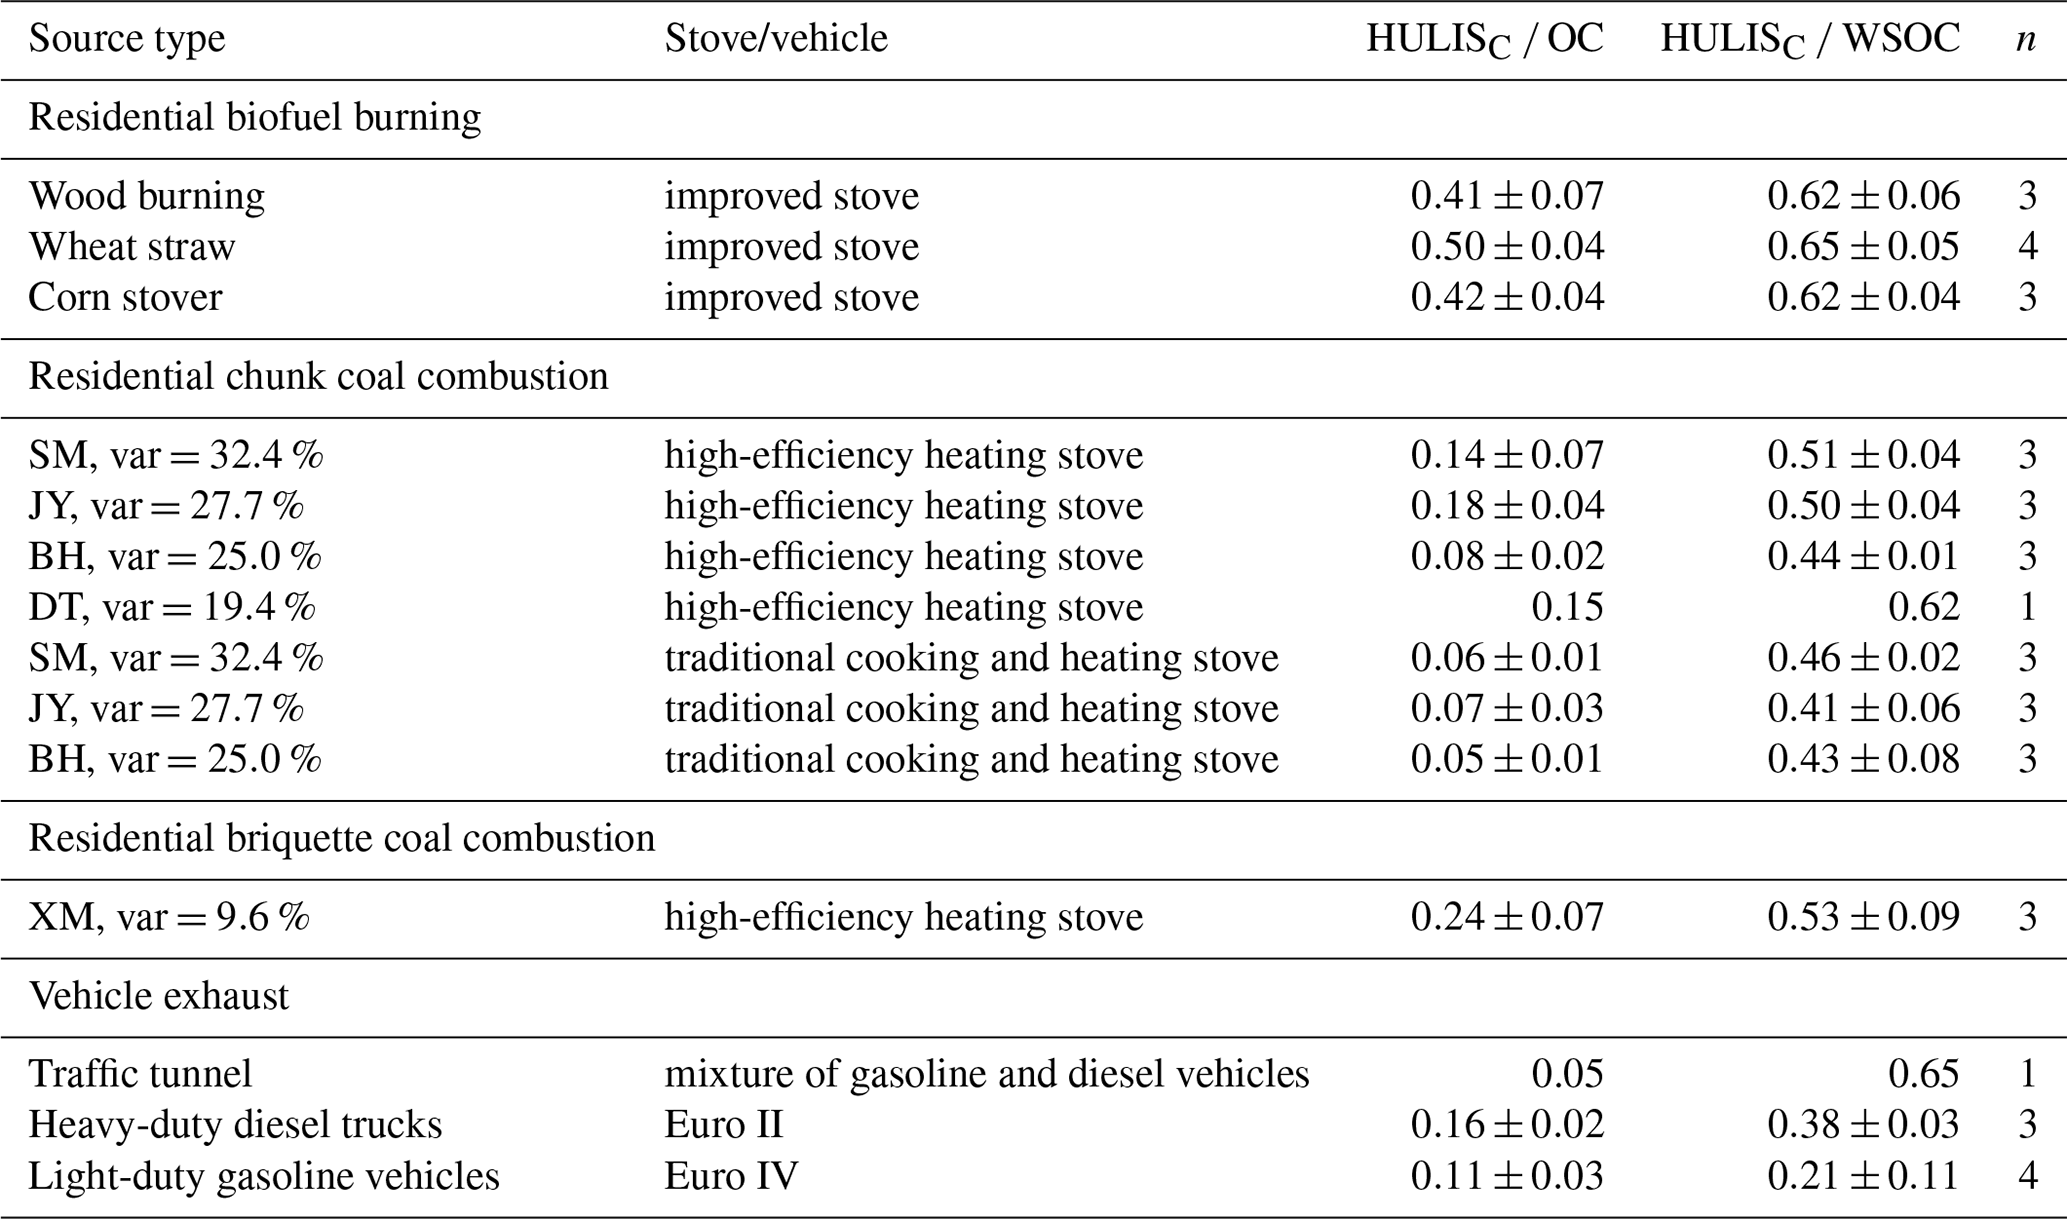
Note that SM and DT indicate that coals come from the coal mines in Shenmu of Shaanxi Province and Datong of Shanxi Province in China, respectively. JY and BH were supplied by two companies, JiuYang and BeiHua, respectively, and no production areas of coal were available. XM indicates briquette coal, which is the abbreviation of briquette coal in Chinese (XingMei).
Source testing of residential biofuel and coal combustion was performed at Beihang University. The test fuels were air-dried, and the results of their proximate and ultimate analyses are listed in Table S2 in the Supplement. An outline of the sampling system is shown in Fig. S2. The stove was placed into a chamber. Purified air was introduced into the chamber with a fan to provide dilution air. Emissions were extracted from the chimney with an exhaust hood and were diluted with purified air, cooled to no more than 5∘ C at ambient temperature, and then drawn through a sampling duct and exhausted from the laboratory. Both air flows were adjusted using frequency modulators to change fan speeds. The gas flow velocity in the sampling duct was measured by a pitot tube to be over 5 m s−1. Flow was isokinetically withdrawn from the sampling duct with a probe and directed into the residence chamber. PM2.5 samples were collected from the end of the residence chamber onto prebaked quartz filters with a diameter of 47 mm through PM2.5 cyclones at a flow rate of 16.7 L min−1.
2.2.2 Vehicle exhaust
Four light-duty gasoline vehicles certified as meeting the China 4 emission regulations were tested for their emissions on a chassis dynamometer. The tests were conducted using the New European Driving Cycle (Marotta et al., 2015) and lasted 1180 s, including four repeated urban driving cycles and one extra-urban driving cycle. The emission testing and sampling systems are described in detail by Li et al. (2016) and are briefly summarized here. The vehicle exhaust was directed into a critical flow venturi constant volume sampler in a full flow dilution tunnel. The PM2.5 samples were collected on prebaked quartz filters with a diameter of 47 mm through PM2.5 cyclones at a flow rate of 80 L min−1.
Three heavy-duty diesel trucks were selected to perform on-road emission tests. The tests were conducted on both highway and city roads. The emission testing and sampling systems are described in detail elsewhere (He et al., 2015) and are briefly summarized here. A micro proportional sampling system (SEMTECH-MPS; Sensors Inc., MI, USA) was used to draw a constant ratio of sample flow to exhaust flow and dilute the sample flow. PM2.5 samples were collected onto prebaked quartz filters with a diameter of 47 mm through PM2.5 cyclones at a flow rate of 10 L min−1.
Tunnel measurements were also conducted to collect vehicle exhaust at the Badaling Tunnel in Beijing. The length of the tunnel is 1085 m. The ventilation in the tunnel was achieved by the flow of traffic into the tunnel during the sampling period. PM2.5 samplers with prebaked 47 mm quartz filters were operated at a flow rate of 16.7 L min−1 at the inlet and the outlet of the tunnel simultaneously. The sampling period was 2 h and the samples represent the mixed exhaust of gasoline-fueled vehicles and diesel-fueled vehicles.
All source samples collected on the quartz filters were analyzed for HULIS, WSOC, and OC∕EC (organic carbon and elemental carbon) according the methods described in Sect. 2.3.
2.3 Chemical characterization
HULIS isolation was based on the extraction method developed by Varga et al. (2001) and used in many other studies (Nguyen et al., 2014; Lin et al., 2010b; Lin and Yu, 2011; Fan et al., 2012; Song et al., 2012; Salma et al., 2013; Feczko et al., 2007; Krivácsy et al., 2008). The separation procedure is provided in Text S1 of the Supplement. WSOC and HULISC were determined using a total organic carbon (TOC) analyzer (Shimadzu TOC-VCPH, Japan) based on a combustion–oxidation, nondispersive infrared absorption method. The TOC was determined by subtracting inorganic carbonate (IC) from total carbon (TC): TOC = TC – IC. The reported data were the average results of three replicate measurements. Mass concentrations of HULIS were obtained from HULISC by multiplying a scaling factor of 1.9 as suggested by Lin et al. (2012), Kiss et al. (2002), and Zheng et al. (2013).
A 0.5 cm2 punch from each quartz filter was analyzed for OC and EC using a DRI model 2001 thermal–optical carbon analyzer (Atmoslytic Inc., Calabasas, USA) following the IMPROVE-A thermal optical reflectance (TOR) protocol (Chow et al., 2007).
The PM2.5 samples from SASS were also analyzed for mass and water-soluble inorganic ion analysis as described by Wang et al. (2015).
2.4 CMAQ modeling of primary HULISc
A source-oriented version of the Community Multiscale Air Quality (CMAQ) model (version 5.0.1) was used in this study to track primary PM2.5 (PPM2.5) from different emission sectors and determine the resulting concentrations of primary HULIS. The model was used in a previous study to determine source contributions to PPM2.5 mass, EC, and primary OC (POC) in China. Details of the source apportionment technique can be found in Hu et al. (2015). In summary, source contributions to PPM2.5 mass were directly determined using nonreactive source-specific tracers to track the emissions of PPM2.5 from different sources. These nonreactive tracers were treated identically to the other PPM components when simulating their emissions, transport, and removal. A constant scaling factor (typically 10−4 or 10−5) was used to scale the actual emission rate of these tracers to ensure that their concentrations are sufficiently low that they do not alter the removal rates of other PM components. The concentrations and source contributions to EC and POC were determined during post-processing by using source-specific emission factors as well as the model-predicted source contributions to PPM2.5 mass concentrations. This technique can be used to determine source contributions to primary HULIS. For example, contributions of the ith emission source to primary HULISc concentration (HULISc,i) can be calculated using Eq. (1):
where fHULIS,i is the mass fraction of HULIS per unit of emission of POC from the ith source (see Sect. 3.3 below for estimation of HULIS primary emissions), fOC,i is the mass fraction of POC per unit of emission of PPM2.5,i from the ith source, and PPM2.5,i is the calculated source contribution to PPM2.5 from the ith source based on the nonreactive tracer. The total concentration of primary HULIS can be determined by adding the primary HULIS contributions from the different sources.
In this study, the model uses a 36 km × 36 km horizontal resolution to cover a rectangular domain that includes all of China and neighboring countries. Source contributions to HULIS were calculated for the periods when observations of HULIS are available. Emissions from anthropogenic source sectors (residential sources, power plants, industries, and transportation) are based on the Multi-resolution Emission Inventory of China (MEIC) 2012 (http://www.meicmodel.org, last access: 7 May 2018). Open biomass burning was estimated using the FINN dataset from the National Center for Atmospheric Research (NCAR) (Wiedinmyer et al., 2011). Natural emissions from soil erosion and sea spray were modeled within the CMAQ model (Appel et al., 2013; Kelly et al., 2010). Biogenic emissions were estimated using the Model for Emissions of Gases and Aerosol from Nature (MEGAN) version 2.10. Meteorological fields were calculated using the Weather Research and Forecasting (WRF) model. Details of the model setup, input data preparation, and model evaluation for PPM2.5 mass are documented by Hu et al. (2015). In this study, a comparison of predicted daily PPM2.5 concentrations with observations was performed and only those predictions with fractional errors of less than 0.6 were included in the calculation of primary HULIS. The values of fOC for different source sectors used in the calculation are included in Table S4 of the Supplement. These values were used in Ying et al. (2018), and the predicted daily average POC and EC concentrations generally agree with predictions for both daily and annual average concentrations.
3.1 General characteristics of ambient aerosol
The concentrations of PM2.5, carbonaceous species (OC, EC, WSOC, and HULIS), and inorganic ions such as , , , and K+ are summarized in Table 1. The 24 h average PM2.5 concentration for the sample set was 106±89 µg m−3, about 3 times the national annual air quality standard (35 µg m−3). The highest concentration (∼600 µg m−3) appeared on 12–13 January 2013 as reported in other studies (Quan et al., 2014; Tian et al., 2014; Zheng et al., 2015). The severe pollution events were always accompanied by high relative humidity and low wind speeds (Fig. 1). During the entire sampling period, severely polluted days (PM2.5 concentrations ≥150 µg m−3) constituted about 22 %, while fair days (PM2.5 concentrations ≤75 µg m−3) approached 50 %. The average PM2.5 concentrations in summer, autumn, winter, and spring were 98±60, 58±48, 150±121, and 120±76 µg m−3, respectively.
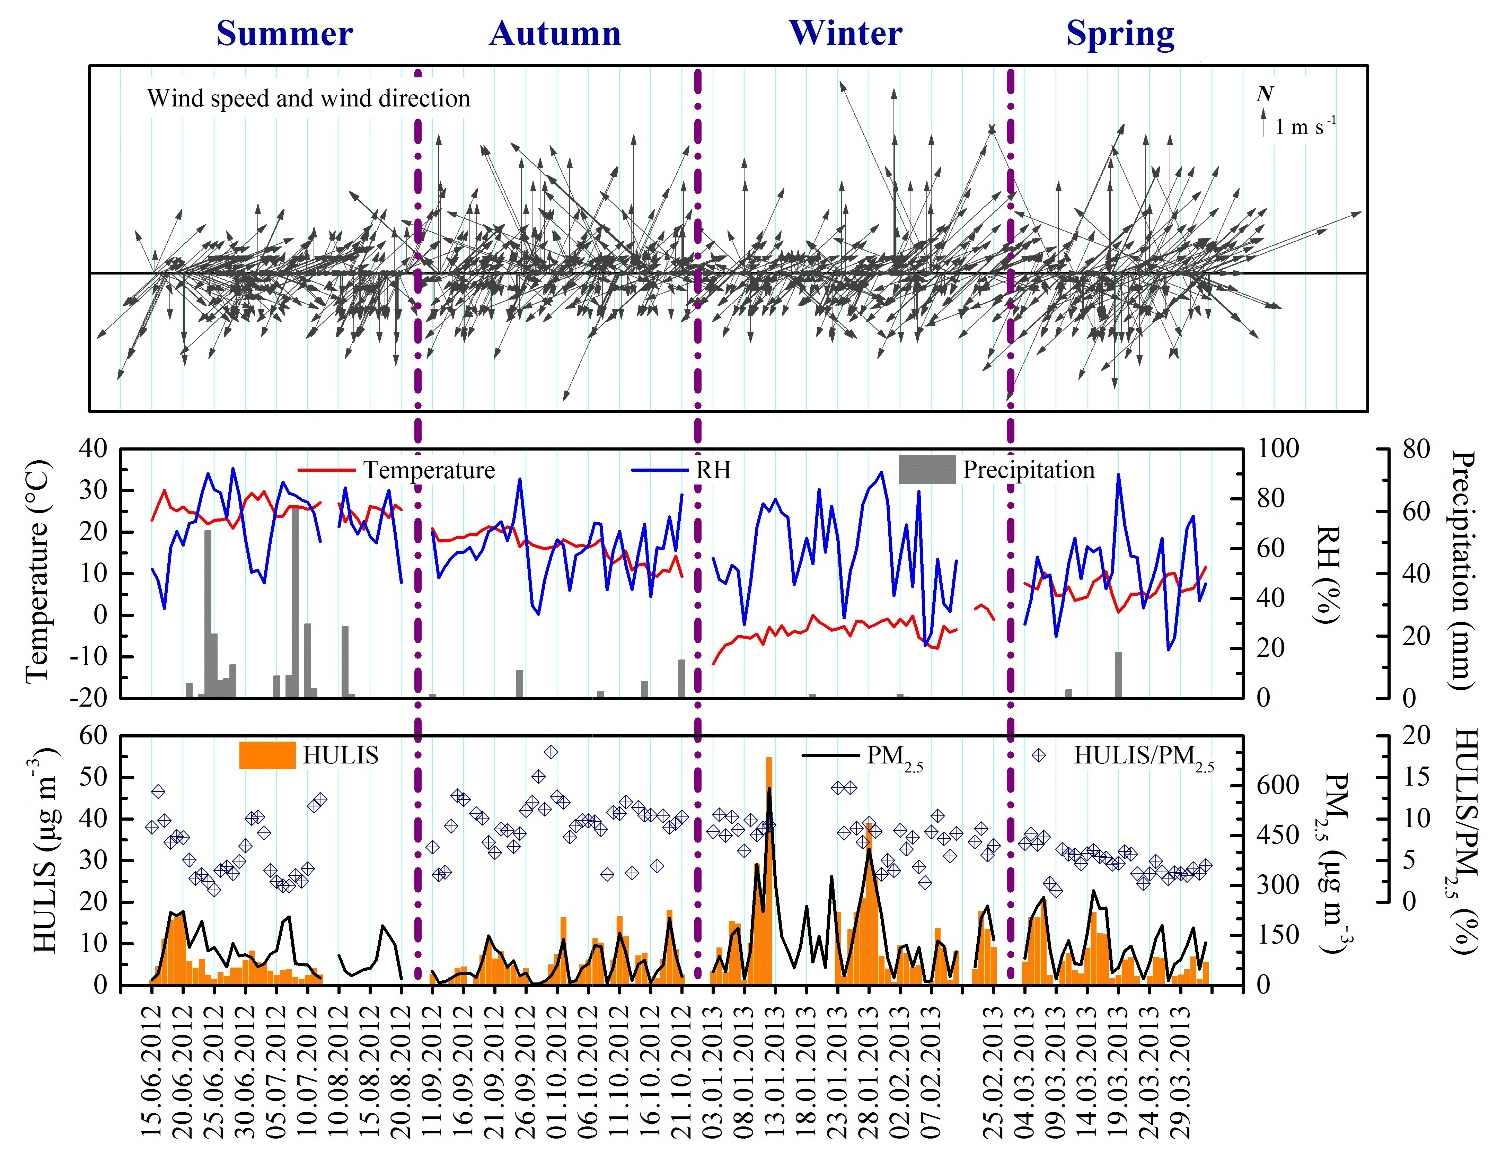
Figure 1Time series of meteorological data (wind speed, wind direction, temperature, relative humidity, and precipitation), HULIS, PM2.5, and HULIS ∕ PM2.5 for the sampling period.
The average HULIS concentration for the study period was 7.5±7.8 µg m−3. This value is lower than the average value of 11.8 µg m−3 measured at a rural site in the PRD region that was heavily influenced by biomass burning (Lin et al., 2010b). However, it is higher than those measurements in the urban areas (about 5 µg m−3 in the PRD; Lin et al., 2010a; Kuang et al., 2015), urban Shanghai (about 4 µg m−3; Zhao et al., 2015), and urban Lanzhou (about 4.7 µg m−3; Tan et al., 2016). HULIS exhibited obvious seasonal variations as shown in Fig. 1 and Table 1. The seasonal average concentrations were 5.5±4.4, 5.6±4.7, 12.3±11.7, and 6.5±5.5 µg m−3 in summer, autumn, winter, and spring, respectively. The winter mean was about twice the value in any other season, and the highest concentration (54.96 µg m−3) of HULIS was observed on the same day that the highest concentration of PM2.5 was observed. The mean HULIS concentrations were very similar between summer and autumn in contrast with PM2.5, which has much higher concentrations in the summer (Table 1). These seasonal variations were similar to those observed in Aveiro and K-puszta (Feckzo et al., 2007), but those annual average concentrations (about 2.4 and 3.2 µg m−3, respectively) were much lower than in Beijing. The concentrations of HULIS in previously reported studies are summarized in Table S1 of the Supplement.
HULIS and PM2.5 had a significant correlation with the annual r2=0.90 (r2=0.77, 0.96, 0.96, and 0.94 in summer, autumn, winter, and spring, respectively) (Fig. S4a). The seasonal average of HULIS ∕ PM2.5 was 5.9 %, 9.4 %, 7.9 %, and 4.8 % in summer, autumn, winter, and spring, respectively. The annual average of HULIS ∕ PM2.5 was 7.2 %±3.3 % and was approximately 10 % lower than that in the PRD region (Lin et al., 2010a).
Strong correlations of HULISC with OC were observed, with the annual r2=0.87 (r2=0.94, 0.82, 0.89, and 0.84 in summer, autumn, winter, and spring, respectively) (Fig. S4c). The percentages of HULISC in OC for summer, autumn, winter, and spring, respectively, were 29.2 %±6.2 %, 26.2 %±9.6 %, 21.0 %±7.1 %, and 22.0 %±6.9 % with an annual average of 24.5 %±8.3 %.
Strong correlations of HULISC with WSOC were also observed, with the annual r2=0.98 (r2=0.99, 0.96, 0.99, and 0.98 in summer, autumn, winter, and spring, respectively) (Fig. S4b). The percentages of HULISC in WSOC for summer, autumn, winter, and spring, respectively, were 66.7 %±5.4 %, 54.1 %±11.2 %, 62.3 %±5.7 %, and 56.6 %±6.3 %, with an annual average of 59.5 %±9.2 %, suggesting that HULISC was the major constituent of WSOC. This value is comparable to the results (about 60 %) at urban sites in the PRD region (Lin et al., 2010b; Fan et al., 2012), Shanghai (Zhao et al., 2015), South Korea (Park et al., 2012), Budapest (Salma et al., 2007, 2008, 2010), and high-alpine areas of Jungfraujoch, Switzerland (Krivácsy et al., 2001). However, it is higher than the rural areas in K-puszta, Hungary (Salma et al., 2010), and the northeastern US (Pavlovic and Hopke, 2012). The ratios of HULISC ∕ WSOC reported by previous studies are listed in Table S1 of the Supplement.
3.2 HULIS emission characteristics from various sources
The measured HULISC ∕ OC (i.e., fHULIS,i) and HULISC ∕ WSOC ratios from the source samples are presented in Table 2. Biomass combustion produces a significant fraction of HULIS in OC (0.41–0.50) whether burning wood or crop straw. Those values are high compared to previous studies (see Table S3 of the Supplement). The HULISC ∕ OC values obtained by Lin et al. (2010a, b) were 0.14 to 0.34 from rice straw and sugarcane open burning in the PRD region in south China. Park and Yu (2016) found the ratios from open-burning rice straw, pine needles, and sesame stems in South Korea were in the range of 0.15 to 0.29. Schmidl et al. (2018a, b) reported ratios of 0.01–0.12 for wood burned in the stove and 0.33–0.35 for leaves burning in the open in the mid-European Alpine region. Goncalves et al. (2010) obtained ratios of 0.04 to 0.11 from wood burned in the stove in Portugal. HULIS are an important component of water-soluble organic matter (WSOM). High HULISC ∕ WSOC ratios (0.62 to 0.65) were observed for three types of biomass burning in this study. These results are comparable with two previous studies. Fan et al. (2016) reported the ratios from open-burning rice straw, corn straw, and pine branch were in the range of 0.57 to 0.66. Park and Yu (2016) obtained ratios in the range of 0.36 to 0.63 from open-burning three types of biomass. However, Lin et al. (2010a) reported relatively low values ranging from 0.30 to 0.33 from open-burning rice straw and sugarcane. Possible factors influencing HULISC ∕ OC ratios were summarized in Table S3 of the Supplement. Combustion conditions have much influence on the HULIS-to-OC ratios. For biomass open burning, HULIS-to-OC ratios varied less (from 0.14 to 0.35), while for biomass burned in the stove, ratios varied a lot (from 0.01–0.50). For those advanced stoves used in Europe (with secondary air), combustion is relatively complete; thus HULIS were generated less often (0.01–0.12). However, for the stoves used in Chinese rural households, combustion is relatively inadequate; thus HULIS were generated more often (0.41–0.50). Dilution ratio (DR) and residence time (RT) could affect gas–particle partitioning and thus have an effect on the HULIS-to-OC ratios (Lipsky and Robinson, 2006; May et al., 2013). Moisture content of fuels was not found to be correlated with HULIS-to-OC ratios.
Residential coal combustion produces 5 % to 24 % of the OC as HULIS for all the coal–stove combinations in this study. Only one prior study measured HULIS emitted from residential honeycomb coal briquette combustion (Fan et al., 2016). However, the HULIS-to-OC ratio was not reported in that study. HULIS ∕ WSOM ratios (0.46) in that study are comparable with our HULISC ∕ WSOC data (0.41–0.62).
Light-duty gasoline and heavy-duty diesel vehicles also produced primary HULIS on the order of 5 % to 16 % of the emitted OC. The HULIS content detected in the vehicle exhaust samples was generally less than the detection limit for these measurements. Thus, these reported ratios of HULISC to OC for vehicle emissions have high uncertainties. Ratios of HULISC to OC for vehicle emissions obtained in this study are much higher than prior tunnel measurements (2 %–5 %) (El Haddad et al., 2009). However, they are comparable with those from residential coal combustion. Due to more complete combustion or more advance emission controls in vehicles than residential solid fuel combustion, OC emission factors for vehicles are normally around 2 orders of magnitude less than those for residential coal combustion (MEP of China, 2014), so HULIS emissions from vehicles can be neglected as described in Sect. 3.3.
3.3 Estimation of HULIS primary emissions
The average values of fHULIS,i for residential biofuel and coal combustion and vehicle exhaust obtained from our measurements were used to assess the extent of primary emissions. Due to the lack of information on fHULIS,i for the other sectors, such as power plants and industries, considering combustion/production technology and emission control technology, we assumed values for these two sectors to be 0.01 and 0.05, respectively.
Based on OC emissions for different sources in the MEIC inventory and the fHULIS,i for the various sources described above, the annual anthropogenic primary emissions of HULIS in Beijing are estimated to be approximately 6.3 Gg with over 60 % of this primary HULIS being emitted during the heating season. Residential biomass and coal burning contribute about 70 % and 25 % of the annual primary HULIS emissions, respectively. Vehicle exhaust contributions to annual primary HULIS emissions are negligible (less than 2 %). Meanwhile the industry sector and power plants contribute about 3 % and close to zero of the annual primary HULIS emissions, respectively. In winter, residential biomass and coal burning contribute close to 98 % of primary HULIS (Table S5 of the Supplement).
Terrestrial and marine emissions were not included in these estimations of primary HULIS emissions since they were considered to be negligible for inland cities, such as Beijing (Graber and Rudich, 2006; Zheng et al., 2013). Cooking contributes about 20 % of ambient fine organic aerosols in Beijing (Wang et al., 2009; Zhang et al., 2018; Sun et al., 2016). Since cooking emissions were not included in MEIC, and no HULIS emission information about cooking is available, cooking is not considered in the current model. Cooking emissions might contribute to ambient HULIS and need to be explored in the future.
3.4 Possible primary sources of HULIS
Ambient HULIS sources include primary sources and atmospheric secondary processes that convert gaseous precursors to HULIS. The correlation between HULIS and other measured constituents provides information regarding possible sources and formation mechanisms of HULIS.
Correlations between HULIS and primary species in PM2.5 are shown in Fig. 2. POC and secondary organic carbon (SOC) were estimated using the EC tracer method (Lim and Turpin, 2002; Turpin and Huntzicker, 1995). The details of the method and evaluation are provided in Text S2. Figure 2a and b show that there are strong correlations between HULIS and POC and HULIS and EC throughout the year, indicating that HULIS have sources and/or transport processes similar to those of POC and EC. Both POC and EC are co-emitted by the incomplete combustion of carbon-containing fuels. Thus, the correlation of HULISc with POC would be expected given its correlation with EC and the correlation between EC and POC. According to the 2010 MEIC data for Beijing 2010, biomass and residential coal burning contribute more than 80 % of the POC emissions, the industrial sector contributes over 10 %, and vehicular exhaust contributions are negligible. For EC emissions, residential coal burning contributes more than 50 %; biomass burning, industry, and vehicles contribute the rest.
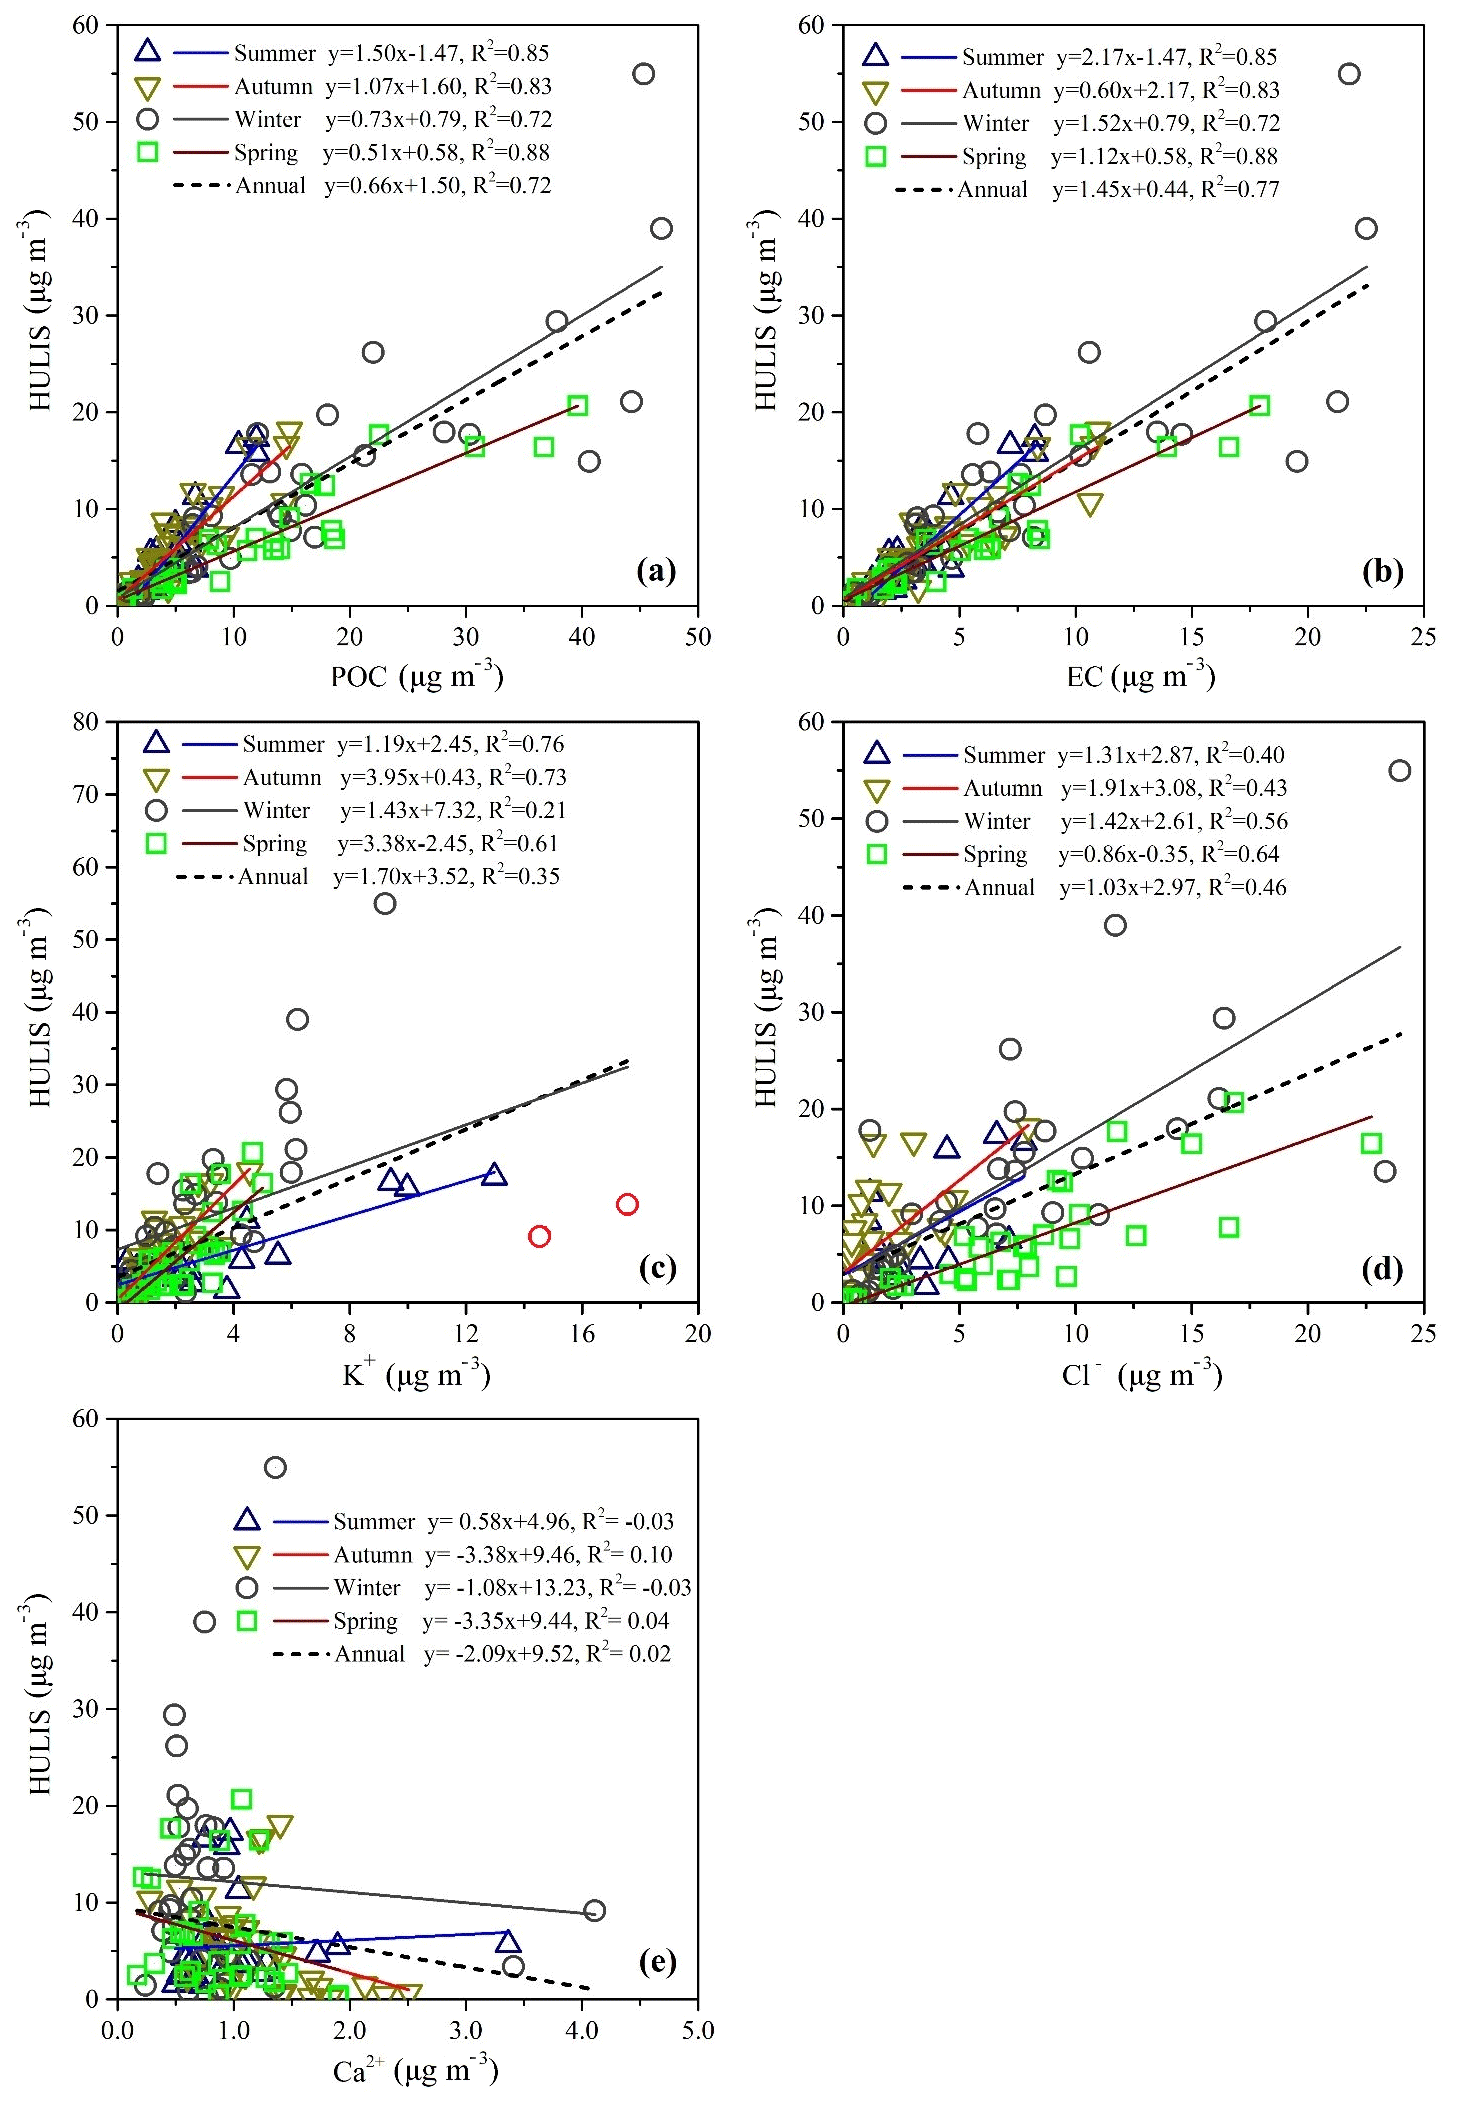
Figure 2Correlations between HULIS and POC (a), HULIS and EC (b), HULIS and K+ (c), HULIS and Cl− (d), and HULIS and Ca2+ (e). Concentrations in four seasons are represented by different shapes with different colors. Linear regressions are also given with corresponding equations.
K+ generally originates from biomass burning with lesser contributions from coal burning and dust. However, biomass burning is regarded as the most important source for K+ and it is often used as an indicator of biomass burning (Kuang et al., 2015; Zhang et al., 2013; Park et al., 2015; Pio et al., 2008; Wang et al., 2011, 2012; Cheng et al., 2013). In northern China, biomass burning including residential cooking, heating, and open biomass burning occurred in all seasons (Cheng et al., 2013; Zheng et al., 2015). High K+ concentrations in this study were observed with mean values of 2.2±2.9, 1.3±1.0, 3.2±3.6, and 2.2±1.3 µg m−3 in summer, autumn, winter, and spring, respectively, and an annual average of 2.2±2.6 µg m−3. As shown in Fig. 3c, HULIS and K+ exhibited a strong correlation with r2=0.76, 0.73, and 0.61 in summer, autumn, and spring, respectively, suggesting the contribution of biomass burning to HULIS. During the winter sampling period, a low correlation was initially obtained (r2=0.21). However, two extreme values of K+ were observed on New Year's Eve (9 February 2013, 14.6 µg m−3) and during the Lantern Festival (24 February 2013, 17.6 µg m−3). Prior studies had suggested that fireworks during the Spring Festival and Lantern Festival produce very high K+ concentrations (Shen et al., 2009; Jing et al., 2014; Jiang et al., 2015). Excluding these two days (red points in Fig. 2c), the correlation between HULIS and K+ increased to r2=0.73, indicating the contribution of biomass burning to HULIS in winter. The strong correlation coefficient between HULIS and K+ across all the seasons also confirmed that biomass burning was a significant primary HULIS emission source as presented in Sect. 3.3.
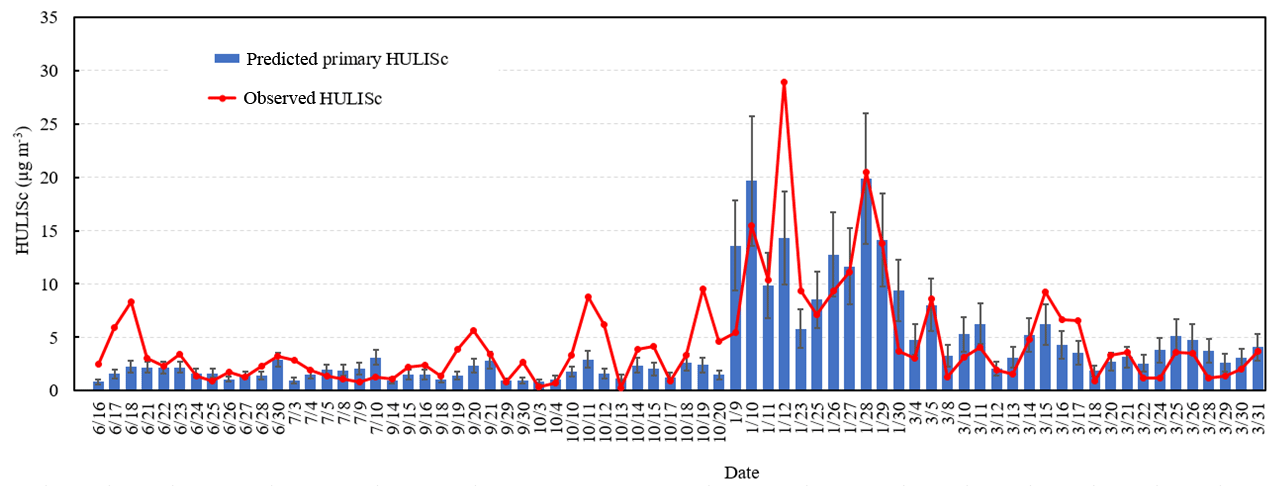
Figure 3Predicted primary HULISc and observed HULISc concentrations on the days with relatively good primary PM2.5 model performance. The error bar is the standard deviation of prediction, which is calculated as described in Text S3.1 in the Supplement.
Table 3Average and seasonal contribution percentages of various sources to ambient HULIS concentrations in Beijing (%).

Note that only the sources with an average contribution of over 1 % were provided. Uncertainty estimation for the seasonal and annual primary and secondary HULISc contributions was determined using a bootstrap sampling technique, which is described in Text S3.2. These uncertainties are based on the assumption that the uncertainty of the PPM2.5 and fOC values is 30 % and 15 %, respectively. Uncertainty calculations based on larger uncertainties (50 % for both PPM2.5 and fOC) show 5 %–10 % higher relative uncertainties for the residential biofuel and secondary process but small changes for other primary sectors (see Table S5).
Cl− is usually believed to be associated with coal combustion and biomass burning (Yu et al., 2013; Gao et al., 2015; Yao et al., 2002; Li et al., 2007, 2009). A significant contribution from sea-salt particles for Cl− in PM2.5 can be excluded since the average mole ratios of Cl− to Na+ across four seasons in this study is 5.0, much higher than the ratio in seawater of 1.17. Moreover, the sampling site in Beijing is about 200 km from the sea. The correlation of HULIS and Cl− is shown in Fig. 2d. In winter and spring, HULIS are moderately correlated with Cl− with r2=0.56 and r2=0.64, respectively. Weaker correlations between HULIS and Cl− were observed in summer and autumn with r2=0.40 and r2=0.43, respectively. This result reflects the different amounts of coal burned in specific seasons. In winter and spring in northern China, coal combustion for heating was quite prevalent and more coal was burned compared to the other two seasons, resulting in the substantial emissions of gaseous and particulate pollutants, including HULIS and Cl−. The correlation coefficient between HULIS and Cl− in winter and spring provides additional support for coal burning being an important primary HULIS emission source as discussed in Sect. 3.3. The strong correlation between HULIS and Cl− in winter (r2=0.89) and weak correlation in summer (r2=0.17) were also revealed in Lanzhou, another city in northern China (Tan et al., 2016). Significant correlations between HULIS and Cl− in wintertime urban aerosols from central and southern Europe were also found (Voliotis et al., 2017). The authors suggest the high concentration of HULIS during winter was probably related to residential coal burning (Tan et al., 2016; Voliotis et al., 2017).
Ca2+ would more likely originate from the re-suspended road dust and long-range-transported dust (Gao et al., 2014). The poor correlation between HULIS and Ca2+ (as shown in Fig. 2e) indicated dust was not likely to be an important source of HULIS.
3.5 HULIS source apportionment based on CMAQ modeling
CMAQ-predicted concentrations of PPM2.5 from different sources were used to calculate HULISc from these sources using Eq. (1). The total concentration of primary HULIS can be determined by adding up primary HULIS from different sources. Figure 3 shows the predicted primary HULISc and observed HULISc concentrations with the prediction uncertainty. Only days with acceptable PPM2.5 performance were shown in Fig. 3. Primary HULISc in January and March 2013 accounts for almost all observed HULISc in these two months. In summer and autumn 2012, predicted primary HULISc concentrations are approximately 1–2 µg m−3. There were days when the observed HULISc concentrations were much higher than the predicted primary HULISc concentrations, indicating potential contributions of secondary HULISc.
Table 3 shows the seasonal contributions for each source as well as average source contributions for the whole sampling period to ambient HULIS in Beijing based on the observed total HULISc and CMAQ-predicted primary HULISc on the days with acceptable PPM2.5 performance. Contributions of HULISc from secondary processes were determined by subtracting predicted primary HULISc from observed HULISc. For those days when the predicted primary HULISc concentrations are greater than the observed HULISc, the predicted primary HULISc concentrations were set to equal the observed HULISc and the secondary HULISc was set to zero. Based on the HULIS emissions from residential biofuel and coal burning described in Sect. 3.3, the contributions of biofuel and coal burning in the residential sector to ambient HULIS were estimated separately.
Overall, residential biofuel burning was the most important source of ambient HULIS, contributing nearly half of the ambient HULIS concentrations, much higher than those results from the PRD in southern China (less than 20 %) (Kuang et al., 2015). This difference is likely with greater biofuel burning during the heating seasons in the Beijing area. Residential coal burning contributes 15.1 %±2.9 % to ambient HULIS and is also a significant source of ambient HULIS. Great contribution from the residential sector to ambient HULIS is consistent with the estimation of HULIS primary emissions and the correlations between HULIS and primary species previously presented. Vehicle emissions and other primary sources, such as industries, contribute negligible amounts to the ambient HULIS. Contributions from the residential sector display strong seasonal variations. In winter and spring, residential biofuel and coal burning accounted for about 80 % of the total HULISc while their contributions were reduced to approximately 40 % in summer and autumn. The seasonal variations were a reflection of the seasonal pattern of those activities in this region.
Secondary formation is estimated to have contributed an average of 38.9 %±9.1 % to the HULIS concentrations and was another major source of ambient HULIS. However, our result is much lower than those results from the PRD in southern China (55 % to 69 %) (Kuang et al., 2015). The difference is driven by the differences in sources and climatological patterns between these two sites. There is much greater combustion for space heating in the colder north and atmospheric reaction rates will be higher in the warmer south. The contribution from secondary processes also shows obvious seasonal variations. In winter and spring, secondary processes accounted for 25 % to 30 % of the total HULISc with large uncertainties while their contributions were increased to 50.2 %±19.3 % and 63.2 %±18.3 % in summer and autumn. Higher secondary contributions were also found during warm seasons in the PRD region (Kuang et al., 2015). In addition to the proposed heterogeneous secondary formation pathways for HULISc, oxidation reactions initiated by chlorine (Cl) radicals can form SOA (Wang and Ruiz, 2017; Riva et al., 2015). Thus, Cl release by coal combustion may have the potential to contribute to HULISc, especially during winter when OH radical concentrations are much lower (monthly average ppt for winter vs. ppt for summer based on CMAQ calculations for Beijing). However, the concentrations of secondary HULISc for winter estimated in this study are uncertain (1.8±2.2 µg m−3) compared to the summertime average concentration (1.0±0.4 µg m−3). Therefore, the role of Cl-initiated reactions producing HULISc cannot be definitively determined.
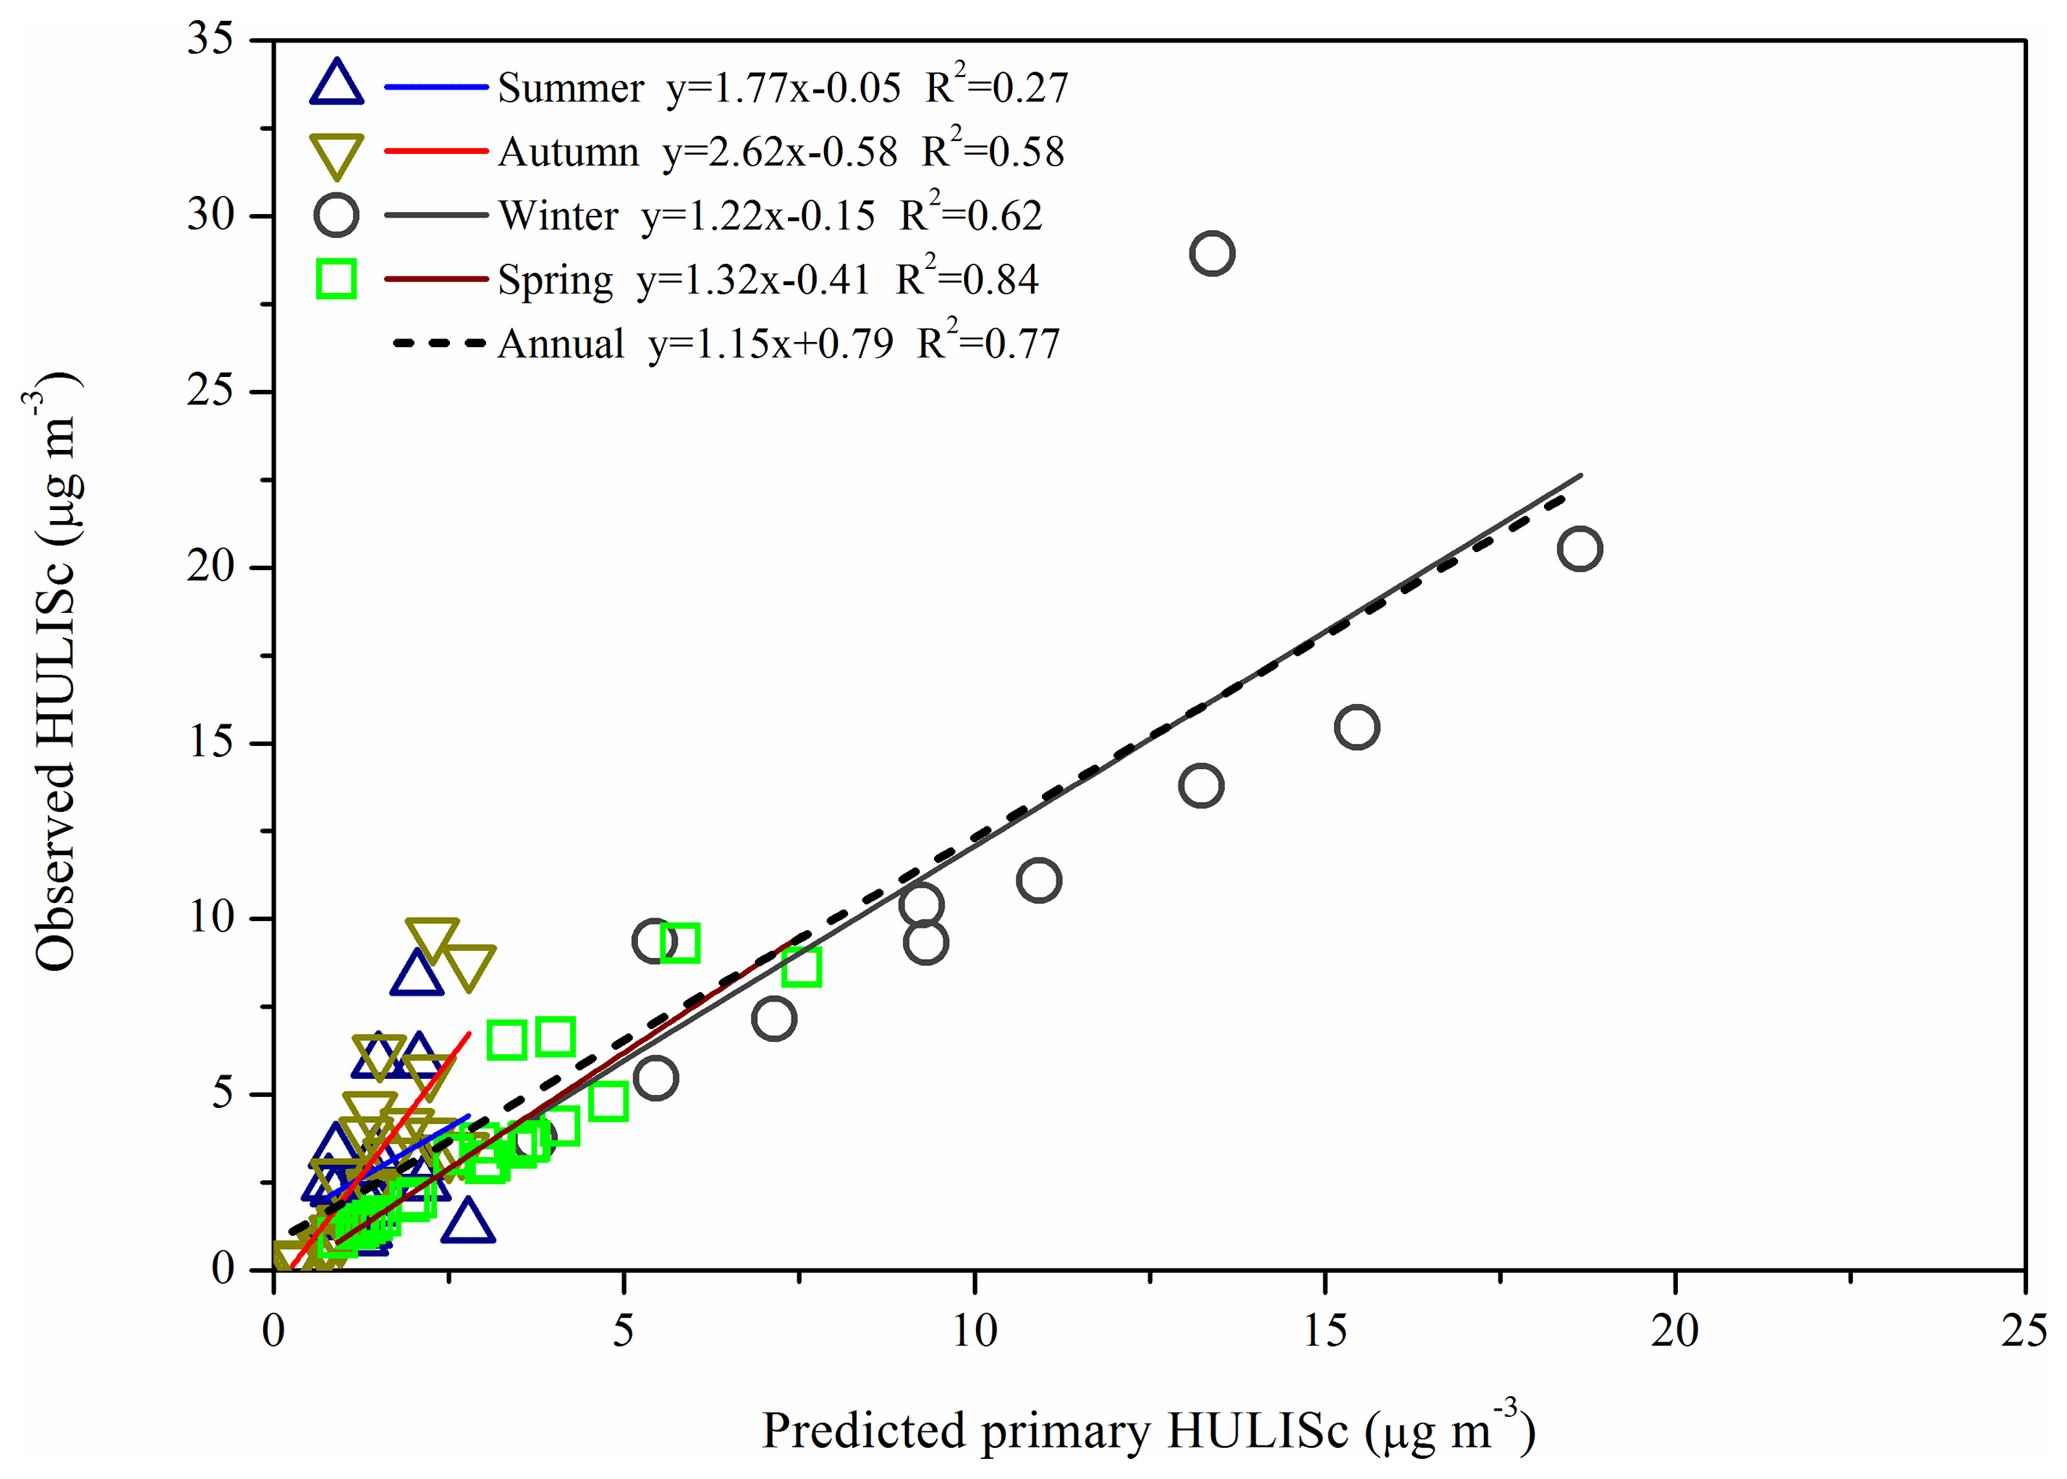
Figure 4Scatter plot of predicted primary HULISc and observed HULISc concentrations. Concentrations of different seasons are represented by different shapes with different colors. Linear regressions are also given with corresponding equations.
Figure 4 shows the scatter plot of predicted primary HULISc vs. observed HULISc concentrations. Moderate to strong correlations between predicted primary HULISc and observed HULISc were observed in winter and spring, while relatively weaker correlations were found in autumn. Moreover, low correlations were observed in summer. The variation of correlations between predicted primary HULISc and observed HULISc in different seasons also provides additional support for the relative importance of primary and secondary HULIS as shown in Table 3.
Meteorological data are downloaded from http://cdc.cma.gov.cn/home.do (last access: 17 June 2017). Emissions from anthropogenic source sectors are downloaded from http://www.meicmodel.org (last access: 7 May 2018).
The supporting information file for this paper provides the details of HULIS analytical procedures and prior literature regarding HULIS in the ambient aerosol. It also provides some additional figures and descriptions that help to support the analyses and discussion presented in the paper. The supplement related to this article is available online at: https://doi.org/10.5194/acp-19-2327-2019-supplement.
XL designed the experiments, analyzed the data, and wrote the paper. JH collected and analyzed the samples. PKH provided advice, supervision, and feedback throughout the drafting and submission process. JH provided samples from vehicle emissions. QS analyzed the samples. QC collected the samples. QY conducted the CMAQ modeling and wrote the paper.
The authors declare that they have no conflict of interest.
This work was supported by the National Nature Science Foundation of China
(grant nos. 41575119, 41275121) and the National Key Research and Development
Program of China (no. 2017YFC0211404). The authors also want to acknowledge
the Texas A&M Supercomputing Facility
(http://sc.tamu.edu, last access: 10 May 2018) for
providing computing resources useful in conducting the CMAQ simulations
reported in this paper.
Edited by: Urs
Baltensperger
Reviewed by: two anonymous referees
Appel, K. W., Pouliot, G. A., Simon, H., Sarwar, G., Pye, H. O. T., Napelenok, S. L., Akhtar, F., and Roselle, S. J.: Evaluation of dust and trace metal estimates from the Community Multiscale Air Quality (CMAQ) model version 5.0, Geosci. Model Dev., 6, 883–899, https://doi.org/10.5194/gmd-6-883-2013, 2013.
Baduel, C., Voisin, D., and Jaffrezo, J.-L.: Seasonal variations of concentrations and optical properties of water soluble HULIS collected in urban environments, Atmos. Chem. Phys., 10, 4085–4095, https://doi.org/10.5194/acp-10-4085-2010, 2010.
Beine, H., Anastasio, C., Esposito, G., Patten, K., Wilkening, E., Domine, F., Voisin, D., Barret, M., Houdier, S., and Hall, S.: Soluble, light absorbing species in snow at Barrow, Alaska, J. Geophys. Res., 116, D00R05, https://doi.org/10.1029/2011JD016181, 2011.
Cheng, Y., Engling, G., He, K.-B., Duan, F.-K., Ma, Y.-L., Du, Z.-Y., Liu, J.-M., Zheng, M., and Weber, R. J.: Biomass burning contribution to Beijing aerosol, Atmos. Chem. Phys., 13, 7765–7781, https://doi.org/10.5194/acp-13-7765-2013, 2013.
Chow, J. C., Watson, J. G., Chen, L. W. A., Chang, M. C. O., Robinson, N. F., Trimble D., and Kohl, S.: The IMPROVE-A temperature protocol for thermal/optical carbon analysis: maintaining consistency with a long-term database, J. Air Waste Manage., 57, 1014–1023, 2007.
Dinar, E., Taraniuk, I., Graber, E. R., Katsman, S., Moise, T., Anttila, T., Mentel, T. F., and Rudich, Y.: Cloud Condensation Nuclei properties of model and atmospheric HULIS, Atmos. Chem. Phys., 6, 2465–2482, https://doi.org/10.5194/acp-6-2465-2006, 2006.
El Haddad, I., Marchand, N., Dron, J., Temime-Roussel, B., Quivet, E., Wortham, H., Jaffrezo, J.-L., Baduel, C., Voisin, D., Besombes, J., and Gille, G.: Comprehensive primary particulate organic characterization of vehicular exhaust emissions in France, Atmos. Environ., 43, 6190–6198, 2009.
Fan, X., Wei, S., Zhu, M., Song, J., and Peng, P.: Comprehensive characterization of humic-like substances in smoke PM2.5 emitted from the combustion of biomass materials and fossil fuels, Atmos. Chem. Phys., 16, 13321–13340, https://doi.org/10.5194/acp-16-13321-2016, 2016.
Fan, X. J., Song, J. Z., and Peng, P. A.: Comparison of isolation and quantification methods to measure humic-like substances (HULIS) in atmospheric particles, Atmos. Environ., 60, 366–374, 2012.
Feczko, T., Puxbaum, H., Kasper-Giebl, A., Handler, M., Limbeck, A., Gelencsér, A., Pio, C., Preunkert, S., and Legrand, M.: Determination of water and alkaline extractable atmospheric humic-like substances with the TU Vienna HULIS analyzer in samples from six background sites in Europe, J. Geophys. Res., 112, D23S10, https://doi.org/10.1029/2006JD008331, 2007.
France, J. L., King, M. D., Frey, M. M., Erbland, J., Picard, G., Preunkert, S., MacArthur, A., and Savarino, J.: Snow optical properties at Dome C (Concordia), Antarctica; implications for snow emissions and snow chemistry of reactive nitrogen, Atmos. Chem. Phys., 11, 9787–9801, https://doi.org/10.5194/acp-11-9787-2011, 2011.
France, J. L., Reay, H. J., King, M. D., Voisin, D., Jacobi, H. W., Domine, F., Beine, H., Anastasio, C., MacArthur, A., and Lee-Taylor, J.: Hydroxyl radical and NOx production rates, black carbon concentrations and light-absorbing impurities in snow from field measurements of light penetration and nadir reflectivity of onshore and offshore coastal Alaskan snow, J. Geophys. Res., 117, D00R12, https://doi.org/10.1029/2011JD016639, 2012.
Gao, J., Tian, H., Cheng, K., Lu, L., Zheng, M., Wang, S., Hao, J., Wang, K., Hua, S., Zhu, C., and Wang, Y.: The variation of chemical characteristics of PM2.5 and PM10 and formation causes during two haze pollution events in urban Beijing, China, Atmos. Environ., 107, 1–8, 2015.
Gao, J. J., Tian, H. Z., Chen, K., Wang, Y. X., Wu., Y. and Zhu, C. Y.: Seasonal and spatial variation of trace elements in multi-size airborne particulate matters of Beijing, China: Mass concentration, enrichment characteristics, source apportionment, chemical speciation and bioavailability, Atmos. Environ., 99, 257–265, 2014.
Ghio, A. J., Stonehuerner, J., Pritchard, R. J., Piantadosi, C. A., Quigley, D. R., Dreher, K. L., and Costa, D. L.: Humic-like substances in air pollution particulates correlate with concentrations of transition metals and oxidant generation, Inhal. Toxicol., 8, 479–494, 1996.
Goncalves, C., Alves, C., Evtyugina, M., Mirante, F., Pio, C., Caseiro, A., Schmidl, C., Bauer, H., and Carvalho F.: Characterisation of PM10 emissions from woodstove combustion of common woods grown in Portugal, Atmos. Environ., 44, 4474–4480, 2010.
Graber, E. R. and Rudich, Y.: Atmospheric HULIS: How humic-like are they? A comprehensive and critical review, Atmos. Chem. Phys., 6, 729–753, https://doi.org/10.5194/acp-6-729-2006, 2006.
Gysel, M., Weingartner, E., Nyeki, S., Paulsen, D., Baltensperger, U., Galambos, I., and Kiss, G.: Hygroscopic properties of water-soluble matter and humic-like organics in atmospheric fine aerosol, Atmos. Chem. Phys., 4, 35–50, https://doi.org/10.5194/acp-4-35-2004, 2004.
He, L. Q., Hu, J. N., and Zu, L.: Emission characteristics of exhaust PM2.5 and its carbonaceous components from China to China heavy-duty diesel vehicles, Acta Scientiae Circumstantiae, 35, 656–662, 2015 (in Chinese).
Hoffer, A., Gelencsér, A., Guyon, P., Kiss, G., Schmid, O., Frank, G. P., Artaxo, P., and Andreae, M. O.: Optical properties of humic-like substances (HULIS) in biomass-burning aerosols, Atmos. Chem. Phys., 6, 3563–3570, https://doi.org/10.5194/acp-6-3563-2006, 2006.
Hu, J., Wu, L., Zheng, B., Zhang, Q., He, K., Zhang, Q., Li, X., Yang, F., Ying, Q., and Zhang, H.: Source contributions and regional transport of primary particulate matter in China, Environ. Pollut., 207, 31–42, 2015.
Jiang, Q., Sun, Y. L., Wang, Z., and Yin, Y.: Aerosol composition and sources during the Chinese Spring Festival: fireworks, secondary aerosol, and holiday effects, Atmos. Chem. Phys., 15, 6023–6034, https://doi.org/10.5194/acp-15-6023-2015, 2015.
Jing, H., Li, Y. F., Zhao, J. T., Li, B., Sun, J. L., Chen, R., Gao, Y. X., and Chen, C. Y.: Wide-range particle characterization and elemental concentration in Beijing aerosol during the 2013 Spring Festival, Environ. Pollut., 192, 204–211, 2014.
Kelly, J. T., Bhave, P. V., Nolte, C. G., Shankar, U., and Foley, K. M.: Simulating emission and chemical evolution of coarse sea-salt particles in the Community Multiscale Air Quality (CMAQ) model, Geosci. Model Dev., 3, 257–273, https://doi.org/10.5194/gmd-3-257-2010, 2010.
Kiss, G., Varga, B., Galambos, I., and Ganszky, I.: Characterization of water-soluble organic matter isolated from atmospheric fine aerosol, J. Geophys. Res., 107, 8339, https://doi.org/10.1029/2001JD000603, 2002.
Krivácsy, Z., Gelencsér, A., Kiss, G., Mészáros, E., Molnár, Á., Hoffer, A., Mészáros, T., Sárvári, Z., Temesi, D., Varga, B., Baltensperger, U., Nyeki, S., and Weingartner, E.: Study on the chemical character of water soluble organic compounds in fine atmospheric aerosol at the Jungfraujoch, J. Atmos. Chem., 39, 235–259, 2001.
Krivácsy, Z., Kiss, G., Ceburnis, D., Jennings, G., Maenhaut, W., Salma, I., and Shooter, D.: Study of water-soluble atmospheric humic matter in urban and marine environments, Atmos. Res., 87, 1–12, 2008.
Kuang, B. Y., Lin, P., Huang, X. H. H., and Yu, J. Z.: Sources of humic-like substances in the Pearl River Delta, China: positive matrix factorization analysis of PM2.5 major components and source markers, Atmos. Chem. Phys., 15, 1995–2008, https://doi.org/10.5194/acp-15-1995-2015, 2015.
Li, Q., Jiang, J., Qi, J., Deng, J., Yang, D., Wu, J., Duan, L., and Hao, J.: Improving the energy effiency of stoves to reduce pollutant emissions from household solid fuel combustion in China, Environ. Sci. Tech. Let., 3, 369–374, 2016.
Li, X., Wang, S., Duan, L., Hao, J., Li, C., Chen, Y., and Yang, L.: Particulate and trace gas emissions from open burning of wheat straw and corn stover in China, Environ. Sci. Technol., 41, 6052–6058, 2007.
Li, X., Wang, S., Duan, L., Hao, J., and Nie, J.: Carbonaceous aerosol emissions from household biofuel combustion in China, Environ. Sci. Technol., 43, 6076–6081, 2009.
Li, Y., Li, Z., and Hu, J.: Emission profile of exhaust PM2.5 from light-duty gasoline vehicles, Research of Environmental Sciences, 29, 503–508, 2016 (in Chinese).
Lim, H. J. and Turpin, B. J.: Origins of primary and secondary organic aerosol in Atlanta: Results' of time-resolved measurements during the Atlanta supersite experiment, Environ. Sci. Technol., 36, 4489–4496, 2002.
Lin, P. and Yu, J. Z.: Generation of reactive oxygen species mediated by humic-like substances in atmospheric aerosols, Environ. Sci. Technol., 45, 10362–10368, 2011.
Lin, P., Engling, G., and Yu, J. Z.: Humic-like substances in fresh emissions of rice straw burning and in ambient aerosols in the Pearl River Delta Region, China, Atmos. Chem. Phys., 10, 6487–6500, https://doi.org/10.5194/acp-10-6487-2010, 2010a.
Lin, P., Huang, X. F., He, L. Y., and Yu, J. Z.: Abundance and size distribution of HULIS in ambient aerosols at a rural site in South China, J. Aerosol Sci., 41, 74–87, 2010b.
Lin, P., Rincon, A. G., Kalberer, M., and Yu, J. Z.: Elemental Composition of HULIS in the Pearl River Delta Region, China: Results inferred from positive and negative electrospray high resolution mass spectrometric data, Environ. Sci. Technol., 46, 7454–7462, 2012.
Lipsky, E. M. and Robinson, A. L.: Effects of dilution on fine particle mass and partitioning of semivolatile organics in diesel exhaust and wood smoke, Environ. Sci. Technol., 40, 155–162, 2006.
Liu, J., Mauzerall, D. L., Chen, Q., Zhang, Q., Song, Y., Peng, W., Klimont, Z., Qiu, X., Zhang, S., Hu, M., Lin, W., Smith, K. R., and Zhu, T.: Air pollutant emissions from Chinese households: A major and underappreciated ambient pollution source, P. Natl. Acad. Sci. USA, 113, 7756–7761, 2016.
Marotta, A., Pavlovic J., Ciuffo, B., Serra, S., and Fontaras, G.: Gaseous emissions from light-duty vehicles: moving from NEDC to the new WLTP test procedure, Environ. Sci. Technol., 49, 8315–8322, 2015.
May, A. A., Levin, E. J. T., Hennigan, C. J., Riipinen, I., Lee, T., Collett, J. L., Jimenez, J. L., Kreidenweis, S. M., and Robinson, A. L.: Gas-particle partitioning of primary organic aerosol emissions: 3. Biomass burning, J. Geophys. Res.-Atmos., 118, 11327–11338, 2013.
MEP of China (Ministry of Environment Protection of China): Technical guide for the compilation of emission inventory for atmospheric fine particulates, available at: http://www.mee.gov.cn/gkml/hbb/bgg/201408/t20140828_288364.htm (last access: 7 May 2018), 2014 (in Chinese).
Nguyen, Q. T., Kristensen, T. B., Hansen, A. M. K., Skov, H., Bossi, R., Massling, A., Sørensen, L. L., Bilde, M., Glasius, M., and Nøjgaard, J. K.: Characterization of humic-like substances in Arctic aerosols, J. Geophys. Res., 119, 5011–5027, 2014.
Park, S. and Son, S.: Size distribution and sources of humic-like substances in particulate matter at an urban site during winter, Environ. Sci.-Proc. Imp., 18, 32–41, 2016.
Park, S. S. and Yu, J.: Chemical and light absorption properties of humic-like substances from biomass burning emissions under controlled combustion experiments, Atmos. Environ., 136, 114–122, 2016.
Park, S. S., Cho, S. Y., Kim, K. W., Lee, K. H., and Jung, K.: Investigation of organic aerosol sources using fractionated water-soluble organic carbon measured at an urban site, Atmos. Environ., 55, 64–72, 2012.
Park, S. S., Cho, S. Y., and Bae, M. S.: Source identification of water-soluble organic aerosols at a roadway site using a positive matrix factorization analysis, Sci. Total Environ., 533, 410–421, 2015.
Pavlovic, J. and Hopke, P. K.: Chemical nature and molecular weight distribution of the water-soluble fine and ultrafine PM fractions collected in a rural environment, Atmos. Environ., 59, 264–271, 2012.
Pio, C. A., Legrand, M., Alves, C. V., Oliveira, T., Afonso, J., Caseiro, A., Puxbaum, H., Sanchez-Ochoa, A., and Gelencseŕ, A.: Chemical composition of atmospheric aerosols during the 2003 summer intense forest fire period, Atmos. Environ., 42, 7530–7543, 2008.
Quan, J., Tie, X., Zhang, Q., Liu, Q., Li, X., Gao, Y., and Zhao, D.: Characteristics of heavy aerosol pollution during the 2012–2013 winter in Beijing, China, Atmos. Environ., 88, 83–89, https://doi.org/10.1016/j.atmosenv.2014.01.058, 2014.
Riva, M., Healy, R. M., Flaud, P.-M., Perraudin, E., Wenger, J. C., and Villenave, E.: Gas- and particle-phase products from the chlorine-initiated oxidation of polycyclic aromatic hydrocarbons, J. Phys. Chem. A, 119, 11170–11181, 2015.
Salma, I., Ocskay, R., Chi, X. G., and Maenhaut, W.: Sampling artefacts, concentration and chemical composition of fine water-soluble organic carbon and humic-like substances in a continental urban atmospheric environment, Atmos. Environ., 41, 4106–4118, 2007.
Salma, I., Ocskay, R., and Láng, G. G.: Properties of atmospheric humic-like substances – water system, Atmos. Chem. Phys., 8, 2243–2254, https://doi.org/10.5194/acp-8-2243-2008, 2008.
Salma, I., Mészáros, T., Maenhaut, W., Vass, E., and Majer, Z.: Chirality and the origin of atmospheric humic-like substances, Atmos. Chem. Phys., 10, 1315–1327, https://doi.org/10.5194/acp-10-1315-2010, 2010.
Salma, I., Mészáros, T., and Maenhaut, W.: Mass size distribution of carbon in atmospheric humic-like substances and water soluble organic carbon for an urban environment, J. Aerosol Sci., 56, 53–60, 2013.
Schmidl, C., Bauer, H., Dattler, A., Hitzenberger, R., Weissenboeck, G., Marr, I. L., and Puxbaum, H.: Chemical characterisation of particle emissions from burning leaves, Atmos. Environ., 42, 9070–9079, 2008a.
Schmidl, C., Marr, L. L., Caseiro, A., Kotianova, P., Berner, A., Bauer, H., Kasper-Giebl, A., and Puxbaum, H.: Chemical characterisation of fine particle emissions from wood stove combustion of common woods growing in mid-European Alpine regions, Atmos. Environ., 42, 126–141, 2008b.
Shen, Z. X., Cao, J. J., Arimoto, R., Han, Z. W., Zhang, R. J., Han, Y. M., Liu, S. X., Okuda, T., Nakao, S., and Tanaka, S.: Ionic composition of TSP and PM2.5 during dust storms and air pollution episodes at Xi'an, China, Atmos. Environ., 43, 2911–2918, 2009.
Song, J. Z., He, L. L., Peng, P. A., Zhao, J. P., and Ma, S. X.: Chemical and isotopic composition of humic-like substances (HULIS) in ambient aerosols in Guangzhou, South China, Aerosol Sci. Tech., 46, 533–546, 2012.
Srivastava, D., Tomaz, S., Favez, O., Lanzafame, G. M., Golly, B., Besombes, J.-L., Alleman, L. Y., Jaffrezo, J.-L., Jacob, V., Perraudin, E., Villenave E., and Albinet, A.: Speciation of organic fraction does matter for source apportionment. Part 1: A one-year campaign in Grenoble (France), Sci. Total Environ., 624, 1598–1611, 2018.
Sun, Y., Du, W., Fu, P., Wang, Q., Li, J., Ge, X., Zhang, Q., Zhu, C., Ren, L., Xu, W., Zhao, J., Han, T., Worsnop, D. R., and Wang, Z.: Primary and secondary aerosols in Beijing in winter: sources, variations and processes, Atmos. Chem. Phys., 16, 8309–8329, https://doi.org/10.5194/acp-16-8309-2016, 2016.
Tan, J., Xiang, P., Zhou, X., Duan, J., Ma, Y., He, K., Cheng, Y., Yu, J., and Querol, X.: Chemical characterization of humic-like substances (HULIS) in PM2.5 in Lanzhou, China, Sci. Total Environ., 573, 1481–1490, 2016.
Tian, S., Pan, Y., Liu, Z., Wen, T., and Wang, Y.: Size-resolved aerosol chemical analysis of extreme haze pollution events during early 2013 in urban Beijing, China, J. Hazard. Mater., 279, 452–460, https://doi.org/10.1016/j.jhazmat.2014.07.023, 2014.
Turpin, B. J. and Huntzicker, J. J.: Identification of Secondary Organic Aerosol Episodes and Quantitation of Primary and Secondary Organic Aerosol Concentrations during SCAQS, Atmos. Environ., 29, 3527–3544, 1995.
Varga, B., Kiss, G., Ganszky, I., Gelencser, A., and Krivacsy, Z.: Isolation of water-soluble organic matter from atmospheric aerosol, Talanta, 55, 561–572, 2001.
Verma, V., Rico-Martinez, R., Kotra, N., King, L., Liu, J. M., Snell, T. W., and Weber, R. J.: Contribution of water-soluble and in-soluble components and their hydrophobic/hydrophilic sub-fractions to the reactive oxygen species-generating potential of fine ambient aerosols, Environ. Sci. Technol., 46, 11384–11392, 2012.
Voliotis, A., Prokes R., Lammel, G., and Samara, C.: New insights on humic-like substances associated with wintertime urban aerosols from central and southern Europe: Size-resolved chemical characterization and optical properties, Atmos. Environ., 166, 286–299, 2017.
Wang, B. and Knopf D. A.: Heterogeneous ice nucleation on particles composed of humic-like substances impacted by O3, J. Geophys. Res., 116, D03205, https://doi.org/10.1029/2010JD014964, 2011.
Wang, D. S. and Ruiz, L. H.: Secondary organic aerosol from chlorine-initiated oxidation of isoprene, Atmos. Chem. Phys., 17, 13491–13508, https://doi.org/10.5194/acp-17-13491-2017, 2017.
Wang, D. S., Liu, M. R., Bai, X. F., and Ding, H.: The situation analysis of civil coal in the Beijing-Tianjin-Hebei Region, Technology of Coal, 3, 47–50, 2016 (in Chinese).
Wang, H., Tian, M., Li, X., Chang, Q., Cao, J., Yang, F., Ma, Y., and He, K.: Chemical composition and light extinction contribution of PM2.5 in urban Beijing for a 1-year period, Aerosol Air Qual. Res., 15, 2200–2211, 2015.
Wang, Q., Shao, M., Zhang, Y., Wei, Y., Hu, M., and Guo, S.: Source apportionment of fine organic aerosols in Beijing, Atmos. Chem. Phys., 9, 8573–8585, https://doi.org/10.5194/acp-9-8573-2009, 2009.
Wang, Y., Hopke, P. K., Rattigan, O. V., Xia, X., Chalupa, D. C., and Utell, M. J.: Characterization of residential wood combustion particles using the two-wavelength aethalometer, Environ Sci. Technol., 45, 7387–7393, 2011.
Wang, Y., Hopke, P. K., Rattigan, O. V., Chalupa, D. C., and Utell, M. J.: Source apportionment of airborne particulate matter using inorganic and organic species as tracers, Atmos. Environ., 55, 525–532, 2012.
Wiedinmyer, C., Akagi, S. K., Yokelson, R. J., Emmons, L. K., Al-Saadi, J. A., Orlando, J. J., and Soja, A. J.: The Fire INventory from NCAR (FINN): a high resolution global model to estimate the emissions from open burning, Geosci. Model Dev., 4, 625–641, https://doi.org/10.5194/gmd-4-625-2011, 2011.
Yao, X., Chan, C. K., Fang, M., Cadle, S., Chan, T., Mulawac, P., He K., and Ye, B.: The water-soluble ionic composition of PM2.5 in Shanghai and Beijing, China, Atmos. Environ., 36, 4223–4234, 2002.
Ying, Q., Feng, M., Song, D., Wu, L., Hu, J., Zhang, H., Kleeman, M. J., and Li, X.: Improve regional distribution and source apportionment of PM2.5 trace elements in China using inventory-observation constrained emission factors, Sci. Total Environ., 624, 355–365, 2018.
Yu, L., Wang, G., Zhang, R., Zhang, L., Song, Y., Wu, B., Li, X., An, K., and Chu, J.: Characterization and source apportionment of PM2.5 in an urban environment in Beijing, Aerosol Air Qual. Res., 13, 574–583, 2013.
Zhang, R., Jing, J., Tao, J., Hsu, S.-C., Wang, G., Cao, J., Lee, C. S. L., Zhu, L., Chen, Z., Zhao, Y., and Shen, Z.: Chemical characterization and source apportionment of PM2.5 in Beijing: seasonal perspective, Atmos. Chem. Phys., 13, 7053–7074, https://doi.org/10.5194/acp-13-7053-2013, 2013.
Zhang, Y. M., Wang, Y. Q., Zhang, X. Y., Shen, X. J., Sun, J. Y., Wu, L. Y., Zhang, Z. X., and Che, H. C.: Chemical components, variation, and source identification of PM1 during the heavy air pollution episodes in Beijing in December 2016, J. Meteorol. Res., 32, 1–13, https://doi.org/10.1007/s13351-018-7051-8, 2018.
Zhao, M. F., Huang, Z. S., Qiao, T., Zhang, Y. K., Xiu, G. L., and Yu, J. Z.: Chemical characterization, the transport pathways and potential sources of PM2.5 in Shanghai: Seasonal variations, Atmos. Res., 158–159, 66–78, 2015.
Zheng, G. J., He, K. B., Duan, F. K., Cheng, Y., and Ma, Y. L.: Measurement of humic-like substances in aerosols: A review, Environ. Pollut., 181, 301–314, 2013.
Zheng, G. J., Duan, F. K., Su, H., Ma, Y. L., Cheng, Y., Zheng, B., Zhang, Q., Huang, T., Kimoto, T., Chang, D., Pöschl, U., Cheng, Y. F., and He, K. B.: Exploring the severe winter haze in Beijing: the impact of synoptic weather, regional transport and heterogeneous reactions, Atmos. Chem. Phys., 15, 2969–2983, https://doi.org/10.5194/acp-15-2969-2015, 2015.