the Creative Commons Attribution 4.0 License.
the Creative Commons Attribution 4.0 License.
 | 20 Feb 2019
Aliphatic carbonyl compounds (C8–C26) in wintertime atmospheric aerosol in London, UK
Ruihe Lyu
Mohammed S. Alam
Christopher Stark
Ruixin Xu
Zongbo Shi
Yinchang Feng
Three groups of aliphatic carbonyl compounds, the n-alkanals (C8–C20), n-alkan-2-ones (C8–C26), and n-alkan-3-ones (C8–C19), were measured in both particulate and vapour phases in air samples collected in London from January to April 2017. Four sites were sampled including two rooftop background sites, one ground-level urban background site, and a street canyon location on Marylebone Road in central London. The n-alkanals showed the highest concentrations, followed by the n-alkan-2-ones and the n-alkan-3-ones, the latter having appreciably lower concentrations. It seems likely that all compound groups have both primary and secondary sources and these are considered in light of published laboratory work on the oxidation products of high-molecular-weight n-alkanes. All compound groups show a relatively low correlation with black carbon and NOx in the background air of London, but in street canyon air heavily impacted by vehicle emissions, stronger correlations emerge, especially for the n-alkanals. It appears that vehicle exhaust is likely to be a major contributor for concentrations of the n-alkanals, whereas it is a much smaller contributor to the n-alkan-2-ones and n-alkan-3-ones. Other primary sources such as cooking or wood burning may be contributors for the ketones but were not directly evaluated. It seems likely that there is also a significant contribution from the photo-oxidation of n-alkanes and this would be consistent with the much higher abundance of n-alkan-2-ones relative to n-alkan-3-ones if the formation mechanism were through the oxidation of condensed-phase alkanes. Vapour–particle partitioning fitted the Pankow model well for the n-alkan-2-ones but less well for the other compound groups, although somewhat stronger relationships were seen at the Marylebone Road site than at the background sites. The former observation gives support to the n-alkane-2-ones being a predominantly secondary product, whereas primary sources of the other groups are more prominent.
- Article
(4518 KB) - Full-text XML
-
Supplement
(400 KB) - BibTeX
- EndNote


Carbonyl compounds are classified as polar organic compounds, constituting a portion of the oxygenated organic compounds in atmospheric particulate matter (PM). Aliphatic carbonyl compounds are directly emitted into the atmosphere from primary biogenic and anthropogenic sources (Schauer et al., 2001, 2002a, b), as well as being secondary products of the atmospheric oxidation of hydrocarbons (Chacon-Madrid et al., 2010; Zhang et al., 2015; Han et al., 2016).
The most abundant atmospheric carbonyls are methanal (formaldehyde) and ethanal (acetaldehyde), and many studies have described their emission sources and chemical formation in urban and rural samples (Duan et al., 2016). Long-chain aliphatic carbonyl compounds have been identified in PM and reported in a few published papers (Gogou et al., 1996; Andreou and Rapsomanikis, 2009), and these compounds are considered to be formed from atmospheric oxidation processes affecting the biogenic emission of alkanes. Anthropogenic activity is also considered to be a significant contributor to the aliphatic carbonyls. Appreciable concentrations of aliphatic carbonyl compounds have been identified in emissions from road vehicles (Schauer et al., 1999a, 2002b), coal combustion (Oros and Simoneit, 2000), wood burning (Rogge et al., 1998), and cooking processes (Zhao et al., 2007a, b) spanning a wide range of molecular weights. Furthermore, chamber studies (Chacon-Madrid and Donahue, 2011; Algrim and Ziemann, 2016) have demonstrated that the aliphatic carbonyl compounds are very important precursors of secondary organic aerosol (SOA) when they react with OH radicals in the presence of NOx.
The oxidation of n-alkanes by the hydroxyl radical is considered to be an important source of aliphatic carbonyl compounds. It was concluded that the n-alkanals with fewer than 20 carbon atoms indicated the oxidation of alkanes, whereas the higher compounds were usually considered to be of direct biogenic origin (Rogge et al., 1998). The homologues and isomers of n-alkanals and n-alkanones have been identified as OH oxidation products of n-alkanes in many chamber and flow tube studies (Zhang et al., 2015; Schilling Fahnestock et al., 2015; Ruehl et al., 2013; Yee et al., 2012), although not all studies identified the position of the carbonyl group. The commonly accepted oxidation pathways of n-alkanes are generally divided into functionalization and fragmentation. Functionalization occurs when an oxygenated functional group (−ONO2, −OH, , and −OOH) is added to a molecule, leaving the carbon skeleton intact. Alternatively, fragmentation involves C−C bond cleavage and produces two oxidation products with smaller carbon numbers than the reactant. Chamber studies of dodecane oxidation include observations of aldehydes and ketones as oxidation products (Schilling Fahnestock et al., 2015; Yee et al., 2012).
In London, with a high population density and a large number of diesel engine vehicles, the aliphatic hydrocarbons constitute an important fraction of ambient aerosols. Anthropogenic activities and secondary formation contribute to the emission and production of carbonyl compounds within the city. The objectives of the present study were the identification and quantification of aliphatic carbonyl compounds in particle and vapour samples collected in London from January to April 2017. This work has aided an understanding of the concentrations and secondary formation of carbonyls in the London atmosphere. Spatial and temporal variations in the studied carbonyl compounds were assessed and used to infer sources. One of the main objectives was to provide gas–particle partitioning coefficients of identified carbonyls under realistic conditions. Diagnostic criteria were used to estimate the sources of identifiable atmospheric carbonyl compounds. Additionally, for the first time, concentrations of particulate and gaseous n-alkan-3-ones are reported.
2.1 Sampling method and site characteristics
Three sampling campaigns were carried out between 23 January and 18 April 2017 at four sampling sites (Fig. 1) in London. The first campaign used two sampling sites, one located on the roof of a building (15 m above ground) at Regent's University (51∘31′ N, −0∘9′ W), hereafter referred to as RU, sampled from 23 January to 19 February 2017, and the other located on the roof (20 m above ground) of a building which belongs to the University of Westminster on the southern side of Marylebone Road (hereafter referred to as WM), sampled from 24 January to 20 February 2017. The third sampling site was located at ground level at Eltham (51∘27′ N, 0∘4′ E), hereafter referred to as EL, sampled from 23 February to 21 March 2017, which is located in suburban south London, and the fourth sampling site was located at ground level on the southern side of Marylebone Road (51∘31′ N, −0∘9′ W), hereafter referred to as MR, sampled from 22 March to 18 April 2017. Marylebone Road is in London's commercial centre and is an important thoroughfare carrying 80 000–90 000 vehicles per day through central London. The Regent's University site is within Regent's Park to the north of Marylebone Road. The Eltham site is in a typical residential neighbourhood 22 km from the MR site. Earlier work at the Marylebone Road and a separate Regent's Park site is described by Harrison et al. (2012).

Figure 1Map of the sampling sites. RU – Regents University (15 m above ground); WM – University of Westminster (20 m above ground); EL – Eltham; MR – Marylebone Road (south side).
The particle samples were collected on polypropylene-backed PTFE filters (47 mm, Whatman), which were preceded by stainless-steel sorbent tubes packed with 1 cm quartz wool and 300 mg Carbograph 2TD 40/60 (Markes International, Llantrisant, UK), and sealed with stainless-steel caps before and after sampling. Sampling took place for sequential 24 h periods at a flow rate of 1.5 L min−1 using an in-house-developed automated sampler. Field blank filters and sorbent tubes were prepared for each site, and recovery efficiencies were evaluated. Adsorption tube breakthrough was tested in the field with six replicates of two tubes in series, and for compounds of ≥ C11 recovery exceeded 95 % on the first tube. It was 85 % for the C10 compounds, and lower for C9 and C8 for which data are not reported. After the sampling, each filter was placed in a clean sealed petri dish, wrapped in aluminium foil, and stored in the freezer at −18 ∘C prior to analysis. Black carbon (BC) was simultaneously monitored during the sampling period at the RU and WM sites using an aethalometer (model AE22, Magee Science). Measurements of BC and NOx at MR and NOx at EL were provided by the national network sites of Marylebone Road and Eltham (https://uk-air.defra.gov.uk/, last access 29 November 2017).
2.2 Analytical instrumentation
The particle samples were analysed using a 2-D gas chromatograph (GC 7890A; Agilent Technologies, Wilmington, DE, USA) equipped with a Zoex ZX2 cryogenic modulator (Houston, TX, USA). The first dimension was equipped with an SGE DBX5 non-polar capillary column (30.0 m, 0.25 mm ID, 0.25 mm, −5.00 % phenyl polysilphenylene-siloxane), and the second-dimension column was equipped with an SGE DBX50 (4.00 m, 0.10 mm ID, 0.10 mm – 50.0 % phenyl polysilphenylene-siloxane). The GC × GC was interfaced with a BenchTOF-Select time-of-flight mass spectrometer (ToF-MS; Markes International, Llantrisant, UK). The acquisition speed was 50.0 Hz with a mass resolution of > 1200 FWHM at 70.0 eV, and the mass range was 35.0 to 600 m∕z. All data produced were processed using GC Image v2.5 (Zoex Corporation, Houston, US).
2.3 Analysis of samples
Standards used in these experiments included the following: 19 alkanes, C8 to C26 (Sigma-Aldrich, UK; purity > 99.2 %); 12 n-aldehydes, C8 to C13 (Sigma-Aldrich, UK; purity ≥ 95.0 %), C14 to C18 (Tokyo Chemical Industry UK Ltd; purity > 95.0 %); and 10 2-ketones, C8 to C13, C15 to C18 (Sigma-Aldrich, UK; purity ≥ 98.0 %), and C14 (Tokyo Chemical Industry UK Ltd; purity 97.0 %).
The filters were spiked with 30.0 µL of 30.0 µg mL−1 deuterated internal standards (dodecane-d26, pentadecane-d32, eicosane-d42, pentacosane-d52, triacontane-d62, butylbenzene-d14, nonylbenzene-2,3,4,5,6-d5, biphenyl-d10, p-terphenyl-d14; Sigma-Aldrich, UK) for quantification, immersed in dichloromethane (DCM), and ultra-sonicated for 20.0 min at 20.0 ∘C. The extract was filtered using a clean glass pipette column packed with glass wool and anhydrous Na2SO4 and concentrated to 50.0 µL under a gentle flow of nitrogen for analysis using GC × GC-ToF-MS. 1 µL of the extracted sample was injected in a split ratio 100 : 1 at 300 ∘C. The initial temperature of the primary oven (80.0 ∘C) was held for 2.0 min and then increased at 2.0 ∘C min−1 to 210 ∘C, followed by 1.5 ∘C min−1 to 325 ∘C. The initial temperature of the secondary oven (120 ∘C) was held for 2.0 min and then increased at 3.0 ∘C min−1 to 200 ∘C, followed by 2.00 ∘C min−1 to 300 ∘C and a final increase of 1.0 ∘C min−1 to 330 ∘C to ensure all species passed through the column. The transfer line temperature was 330 ∘C and the ion source temperature was 280 ∘C. Helium was used as the carrier gas at a constant flow rate of 1.0 mL min−1. Further details on the instrumentation and data processing methods are given by Alam et al. (2016a, b).
The sorbent tubes were analysed by an injection port thermal desorption unit (Unity 2; Markes International, Llantrisant, UK) and subsequently analysed using GC × GC-ToF-MS. Briefly, the tubes were spiked with 1 ng of deuterated internal standard for quantification and desorbed onto the cold trap at 350 ∘C for 15.0 min (trap held at 20.0 ∘C). The trap was then purged onto the column in a split ratio of 100 : 1 at 350 ∘C and held for 4.0 min. The initial temperature of the primary oven (90.0 ∘C) was held for 2.0 min and then increased to 2.0 ∘C min−1 to 240 ∘C, followed by 3.0 ∘C min−1 to 310 ∘C and held for 5.0 min. The initial temperature of the secondary oven (40.0 ∘C) was held for 2.0 min and then increased at 3.0 ∘C min−1 to 250 ∘C, followed by an increase of 1.5 ∘C min−1 to 315 ∘C and held for 5.0 min. Helium was used as a carrier gas for the thermally desorbed organic compounds with a gas flow rate of 1.0 mL min−1.
Qualitative analysis
Compound identification was based on the GC × GC-TOFMS spectra library, NIST mass spectral library, and in conjunction with authentic standards. Compounds within the homologous series for which standards were not available were identified by comparing their retention time interval between their homologues, by comparison of mass spectra to the standards for similar compounds within the series, by comparison to the NIST mass spectral library, and by the analysis of fragmentation patterns.
Quantitative analysis
An internal standard solution (outlined above) was added to the samples to extract prior to instrumental analysis. Five internal standards (pentadecane-d32, eicosane-d42, pentacosane-d52, triacontane-d62, nonylbenzene-2,3,4,5,6-d5) were used in the calculation of carbonyl compound concentrations.
The quantification for alkanes, aldehydes, and 2-ketones was performed by the linear regression method using seven-point calibration curves (0.05, 0.10, 0.25, 0.50, 1.00, 2.00, 3.00 ng µL−1) established between the authentic standards–internal standard concentration ratios and the corresponding peak area ratios. The calibration curves for all target compounds were highly linear (r2>0.99, from 0.990 to 0.997), demonstrating the consistency and reproducibility of this method. The limits of detection for individual compounds were typically in the range 0.04–0.12 ng m−3. The 3-ketones were quantified using the calibration curves for 2-ketones. The applicability of quantification for individual compounds using isomers of the same compound functionality (which have authentic standards) has been discussed elsewhere and has a reported uncertainty of 24 % (Alam et al., 2018). Alkan-2-ones and alkan-3-ones were not well separated by the chromatography. These were separated manually using the peak cutting tool, attributing fragments at m∕z 58 and 71 to 2-ketones and m∕z 72 and 85 to 3-ketones.
Field and laboratory blanks were routinely analysed to evaluate analytical bias and precision. Blank levels of individual analytes were normally very low. Recovery efficiencies were determined by analysing the blank samples spiked with standard compounds. Mean recoveries ranged between 78.0 % and 102 %. All quantities reported here have been corrected according to their recovery efficiencies. Detection limits are reported in Table S1 in the Supplement.
3.1 Mass concentration of particle-bound carbonyl compounds
The study of temporal and spatial variations in air pollutants can provide valuable information about their sources and atmospheric processing. The time series of particle-bound n-alkanals, n-alkan-2-ones, and n-alkan-3-ones are plotted in Fig. 2. It is clear that the concentrations of n-alkanals varied substantially by date and were always higher than n-alkanones at the four sites. It is also clear from Fig. 3 that concentrations were broadly similar at the background sites RU, WM, and EL, but are elevated, especially for the n-alkanals, at MR. This is strongly indicative of a road traffic source.
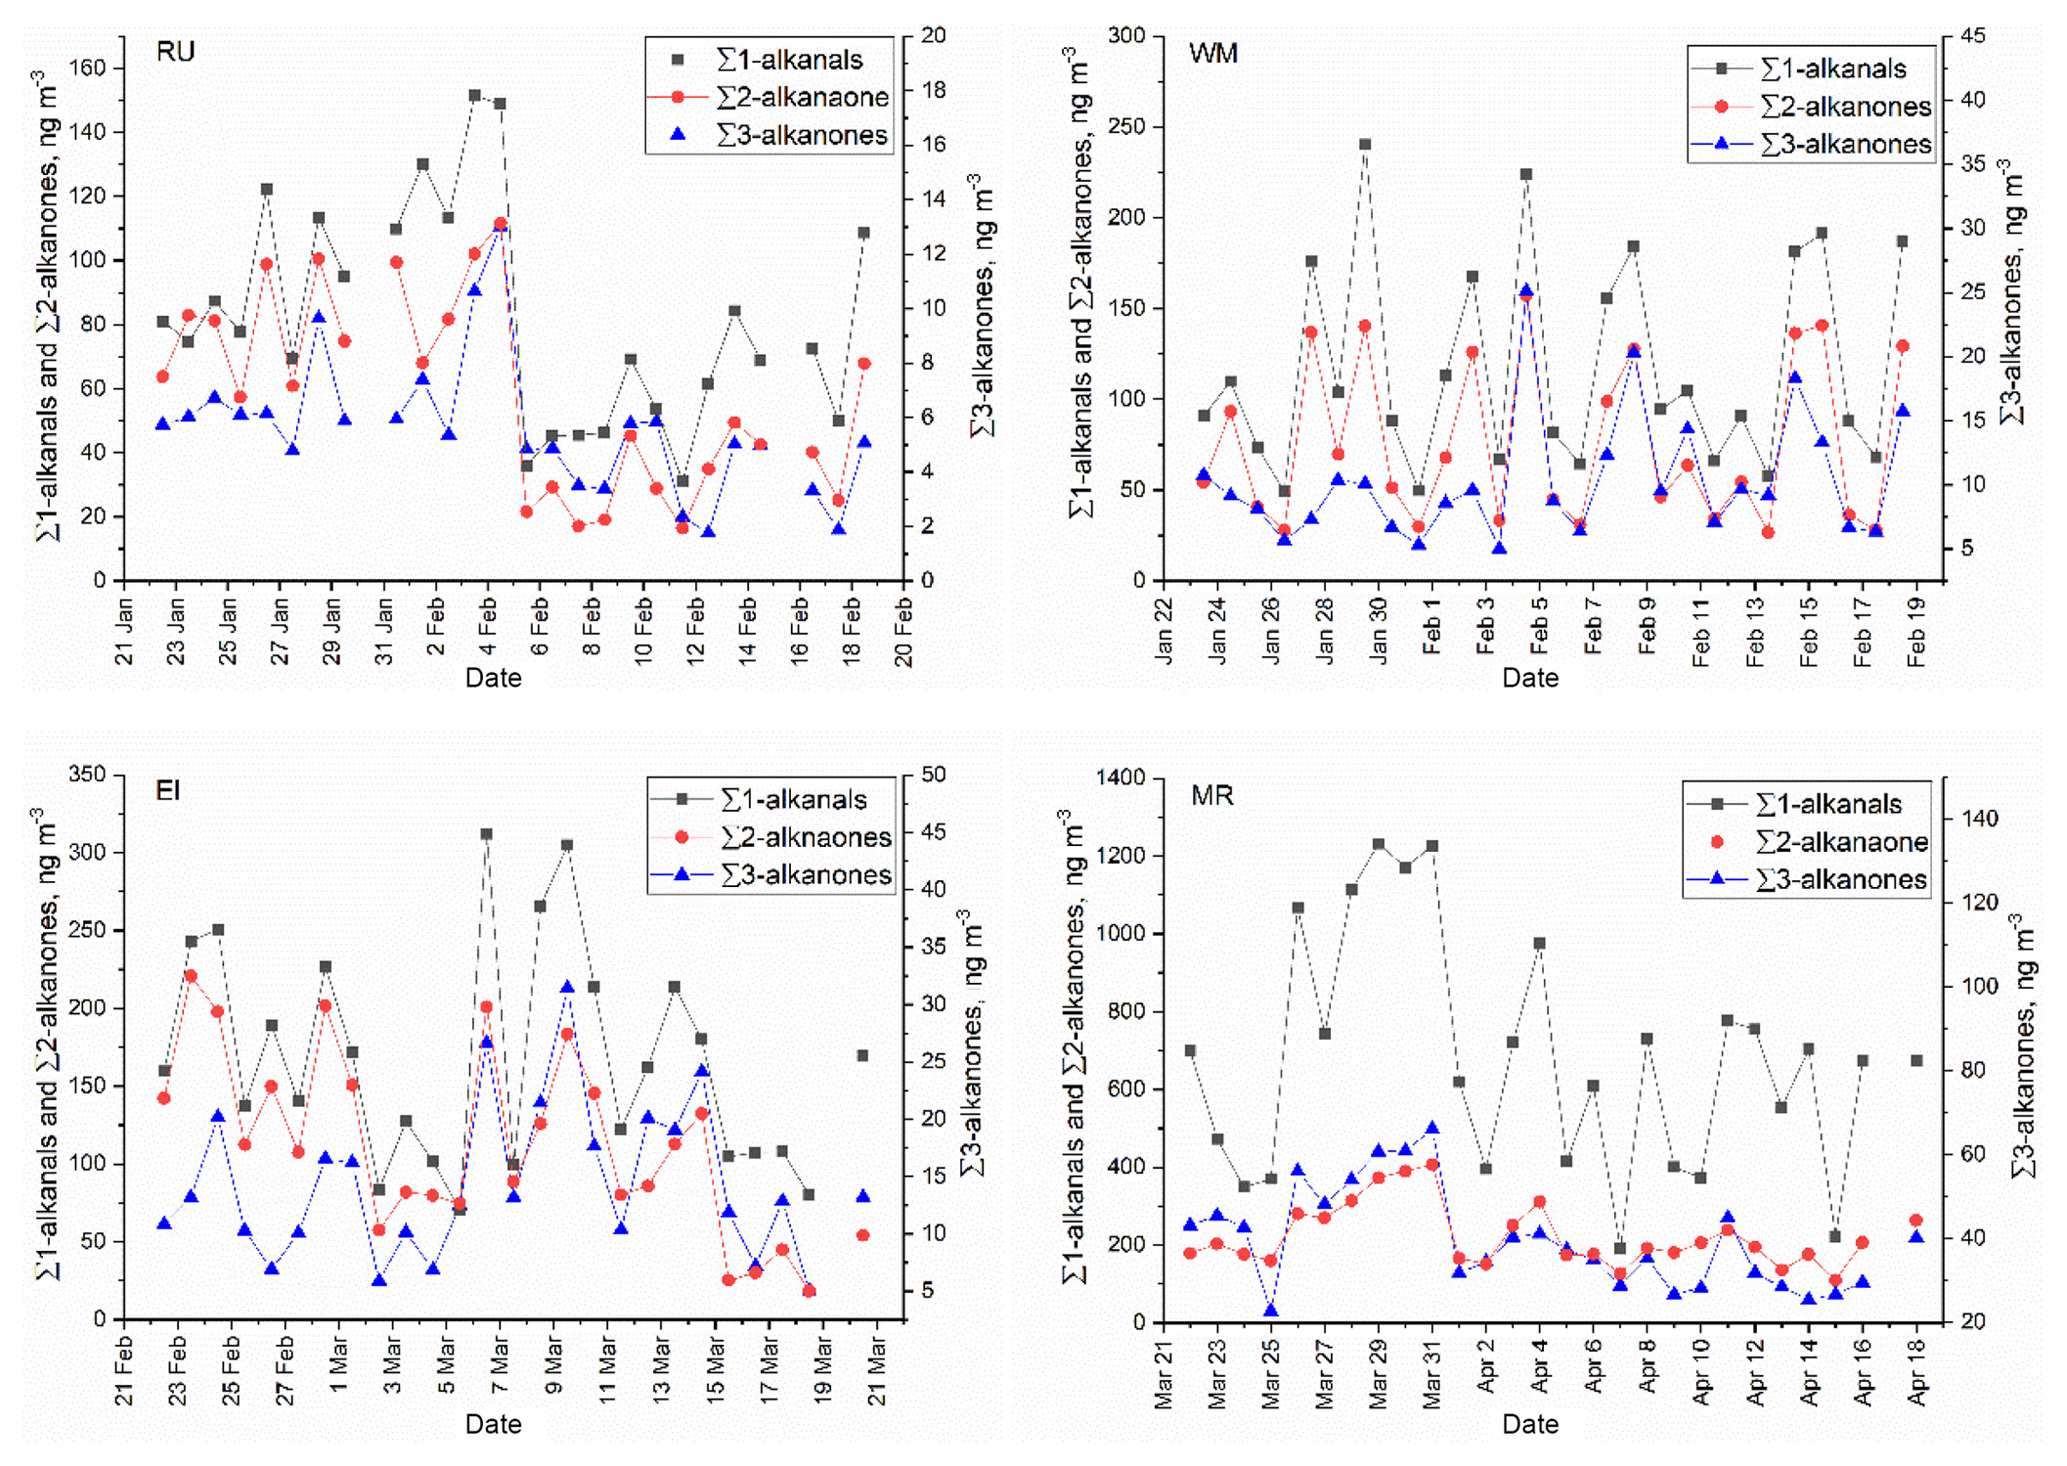
Figure 2Time series of particle-bound ∑n-alkanals, ∑n-alkan-2-ones, and ∑n-alkan-3-ones at the RU, WM, EL, and MR sites.
Carbonyls, including n-alkanone homologues, could result as fragmentation products from larger alkane precursors during gas-phase oxidation (Yee et al., 2012; Schilling Fahnestock et al., 2015) or as functionalized products from the heterogeneous oxidation of particle-bound alkanes (Ruehl et al., 2013; Zhang et al., 2015). While carbonyl compounds are expected to be amongst the first-generation oxidation products of alkanes, product yields are not well known and are highly dependent upon the chemical environment in which oxidation occurs. Yee et al. (2012) show substantial yields of mono-carbonyl product, with the position of substitution undefined, in the low-NOx oxidation of n-dodecane. Ruehl et al. (2013) report the production of 2- through 14-octacosanone from the oxidation of octacosane, giving relative but not absolute yields. Schilling Fahnestock et al. (2014) report oxidation products of dodecane formed in both low-NO and high-NO environments (< d.l. and NO = 97.5 ppb, respectively). A singly substituted unfragmented ketone product is reported only from low-NO oxidation and in relatively low yield amongst many products. Lim and Ziemann (2009) propose a reaction scheme for the OH-initiated oxidation of alkanes in the presence of NOx. They express the view that first-generation carbonyl formation is negligible at high NO concentrations for linear alkanes with Cn>6 since reactions of an alkoxy radical with O2 are too slow to compete with isomerization, which ultimately leads to hydroxynitrate and hydroxycarbonyl products. Ziemann (2011) also shows a substantial yield of alkylnitrates from the OH-initiated oxidation of n-alkanes from C10–C25 in the presence of NO. The NO concentrations in the background air of London are typically < 12 ppb (UK-Air, 2018) and hence lie between the low- and high-NO environments of experiments in the literature, therefore most probably permitting some oxidation to proceed through pathways leading to first-generation carbonyl products.
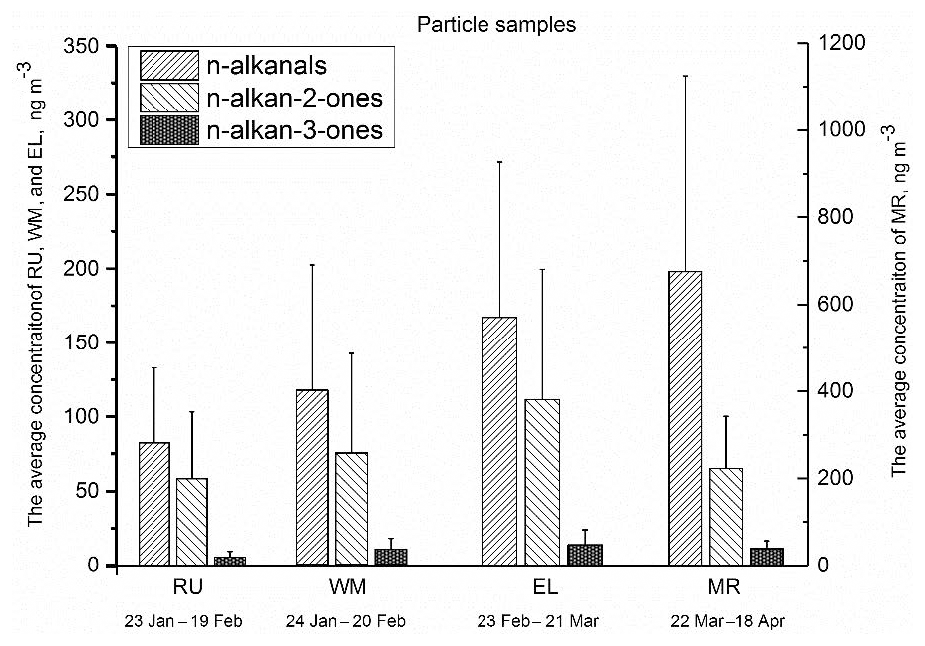
Figure 3The average total concentration of particle-bound n-alkanals (C8–C20), n-alkan-2-ones (C8–C26), and n-alkan-3-ones (C8–C19) for each sampling period and site. The error bars indicate 1 standard deviation.
Figure 3 shows the average total concentrations of particle-bound n-alkanals, n-alkan-2-ones, and n-alkan-3-ones from January to April at the four measurement sites, and the particle- and gaseous-phase concentrations are detailed in Table S2. Total n-alkanals was defined as the sum of particle-bound n-alkanals ranging from C8 to C20. The particulate n-alkanals at the MR site accounted for 75.2 % of the measured particle carbonyls with an average total concentration of 682 ng m−3, and concentrations at the other sites were 167 ng m−3 at EL, 117 ng m−3 at WM, and 82.6 ng m−3 at RU, accounting for 57.0 %, 57.9 %, and 56.3 % of the measured particulate carbonyls, respectively. The n-alkanals identified in this study differed substantially from those previously reported in samples collected from Crete (Gogou et al., 1996) and Athens (Andreou and Rapsomanikis, 2009) in Greece. The n-alkanals from London presented narrower ranges of carbon numbers and a higher concentration than rural and urban samples from Crete. The concentrations of n-alkanal homologues (C8–C20) ranged from 5.50 to 141 ng m−3 (average 52.0 ng m−3) at MR, which were far higher than 1.48–28.6 ng m−3 (average 6.44 ng m−3) at RU, 1.42–50.3 ng m−3 (average 9.03 ng m−3) at WM, and 3.29–53.0 ng m−3 (average 13.0 ng m−3) at EL (Table S1), unlike Crete where the concentrations were 0.9–3.7 ng m−3 in rural (C15–C30) and 5.4–6.7 ng m−3 in urban (C9–C22) samples. The average concentration of all four sites was much higher than the 0.91 ng m−3 measured in Athens (Andreou and Rapsomanikis, 2009) (C13–C20). This is a clear indication of a road traffic influence, most probably from diesel sources, which are more numerous in London. Earlier work has clearly demonstrated a substantial elevation in traffic-generated pollutants at the Marylebone Road site relative to background sites within London (Harrison and Beddows, 2017).
As part of the CARBOSOL project (Oliveira et al., 2007), air samples were collected in summer and winter at six rural sites across Europe. The particulate n-alkanals ranged from C11 to C30, with average total concentrations between 1.0 and 19.0 ng m−3 and higher concentrations in summer than winter at all but one site. Maximum concentrations at all sites were in compounds > C22, indicating a source from leaf surface abrasion products and biomass burning (Simoneit et al., 1967; Gogou et al., 1996). This far exceeds the Cmax (carbon number of the most abundant homologue) values seen in the particulate fraction at our sites.
The n-alkan-2-one homologues measured in London ranged from C8 to C26, and the average total particulate fraction concentration was 58.5 ng m−3 at RU, 75.1 ng m−3 at WM, 112 ng m−3 at EL, and 186 ng m−3 at MR, approximately accounting for 39.9 % (RU), 37.0 % (WM), 38.1 % (EL), and 20.5 % (MR) of the total particulate carbonyls, respectively (Fig. 3). The published data from Greece indicated that the concentrations of n-alkan-2-ones were independent of the seasons, and an average of 5.40 ng m−3 (C13–C29) was measured in August and 5.44 ng m−3 in March at Athinas Street, but 12.88 ng m−3 was measured in March at the elevated (20 m) AEDA site in Athens (Gogou et al., 1996). Concentrations in Crete for alkan-2-ones (C10–C31) were 0.4–2.1 ng m−3 at the rural site and 1.9–2.6 ng m−3 at the urban site (Andreou and Rapsomanikis, 2009). The CARBOSOL project also determined concentrations of n-alkan-2-ones between C14 and C31 with a Cmax at C28 or C29 at all but one site. Average concentrations ranged from 0.15 ng m−3 (C17−29) to 3.35 (C14−31), very much below the concentrations at our London sampling site. Cheng et al. (2006) measured concentrations of n-alkan-2-ones in the Lower Fraser Valley, Canada, in PM2.5. Samples collected in a road tunnel showed the highest concentrations, with a total of 1.8–12.6 ng m−3 for C10–C31, and were higher in daytime than nighttime. Concentrations at a forest site were 1.1–7.2 ng m−3 without a diurnal pattern. Values of Cmax ranged from C16−17 at the road tunnel to C27 (secondary maximum) at the forest site. Carbon preference index (CPI, defined in Sect. 3.2.1) values averaged across sites were from 1.00 to 1.34, giving little evidence for a substantial biogenic input from higher plant waxes. These data clearly suggest a road traffic source in London, but less influential than for the n-alkanals for which the increment at the roadside MR site is much greater.
The n-alkan-3-one homologues identified in the samples ranged from C8 to C19, and the average of individual compound concentrations was 0.52 ng m−3 at RU, 0.94 ng m−3 at WM, 1.37 ng m−3 at EL, and 3.34 ng m−3 at MR. The concentrations of n-alkan-3-ones at the four sites were lower than the n-alkanals and n-alkan-2-ones, and MR had the highest average total mass concentration of 39.4 ng m−3, followed by 14.3 ng m−3 at EL, 10.4 ng m−3 at WM, and 5.65 ng m−3 at RU.
The isomeric carbonyls formed via OH-initiated heterogeneous reactions of n-octacosane (C28) exhibit a pronounced preference at position 2 in the molecule chain (Ruehl et al., 2013). The n-octacosan-2-ones have the highest relative yield (1.00), followed by n-octacosan-3-ones (0.50), while other isomeric carbonyl yields were lower than 0.20. The same results were found in subsequent chamber studies of n-alkanes (Zhang et al., 2015) (C20, C22, C24 but not C18). The main probable reason was that a large fraction of C18 evaporated into the gas phase, and OH oxidation happened in the gas phase (homogeneous reaction). This may be supported by evidence from previous studies (Kwok and Atkinson, 1995; Ruehl et al., 2013), which found that the isomeric distribution of oxidation products of n-alkanes depends upon whether the reaction occurs in the gas phase or at the particle surface (Kwok and Atkinson, 1995; Ruehl et al., 2013). Homogeneous gas-phase oxidation occurs fast, and H abstraction by OH radicals occurs at all carbon sites. The fractions of the OH radical reaction by H atom abstraction from n-decane at positions 1, 2, 3, 4, and 5 are 3.10 %, 20.7 %, 25.4 %, 25.4 %, and 25.4 %, respectively, and the products from gas-phase (homogeneous) reaction were generally in accordance with structure–reactivity relationship (SRR) predictions (Kwok and Atkinson, 1995; Aschmann et al., 2001). Zhang et al. (2015) report on the competition between the homogeneous and heterogeneous oxidation of medium- to high-molecular-weight alkanes. They express the view that in the atmosphere, compounds typically classified as semi-volatile evaporate sufficiently rapidly that homogeneous gas-phase oxidation is more rapid than oxidation in the condensed phase.
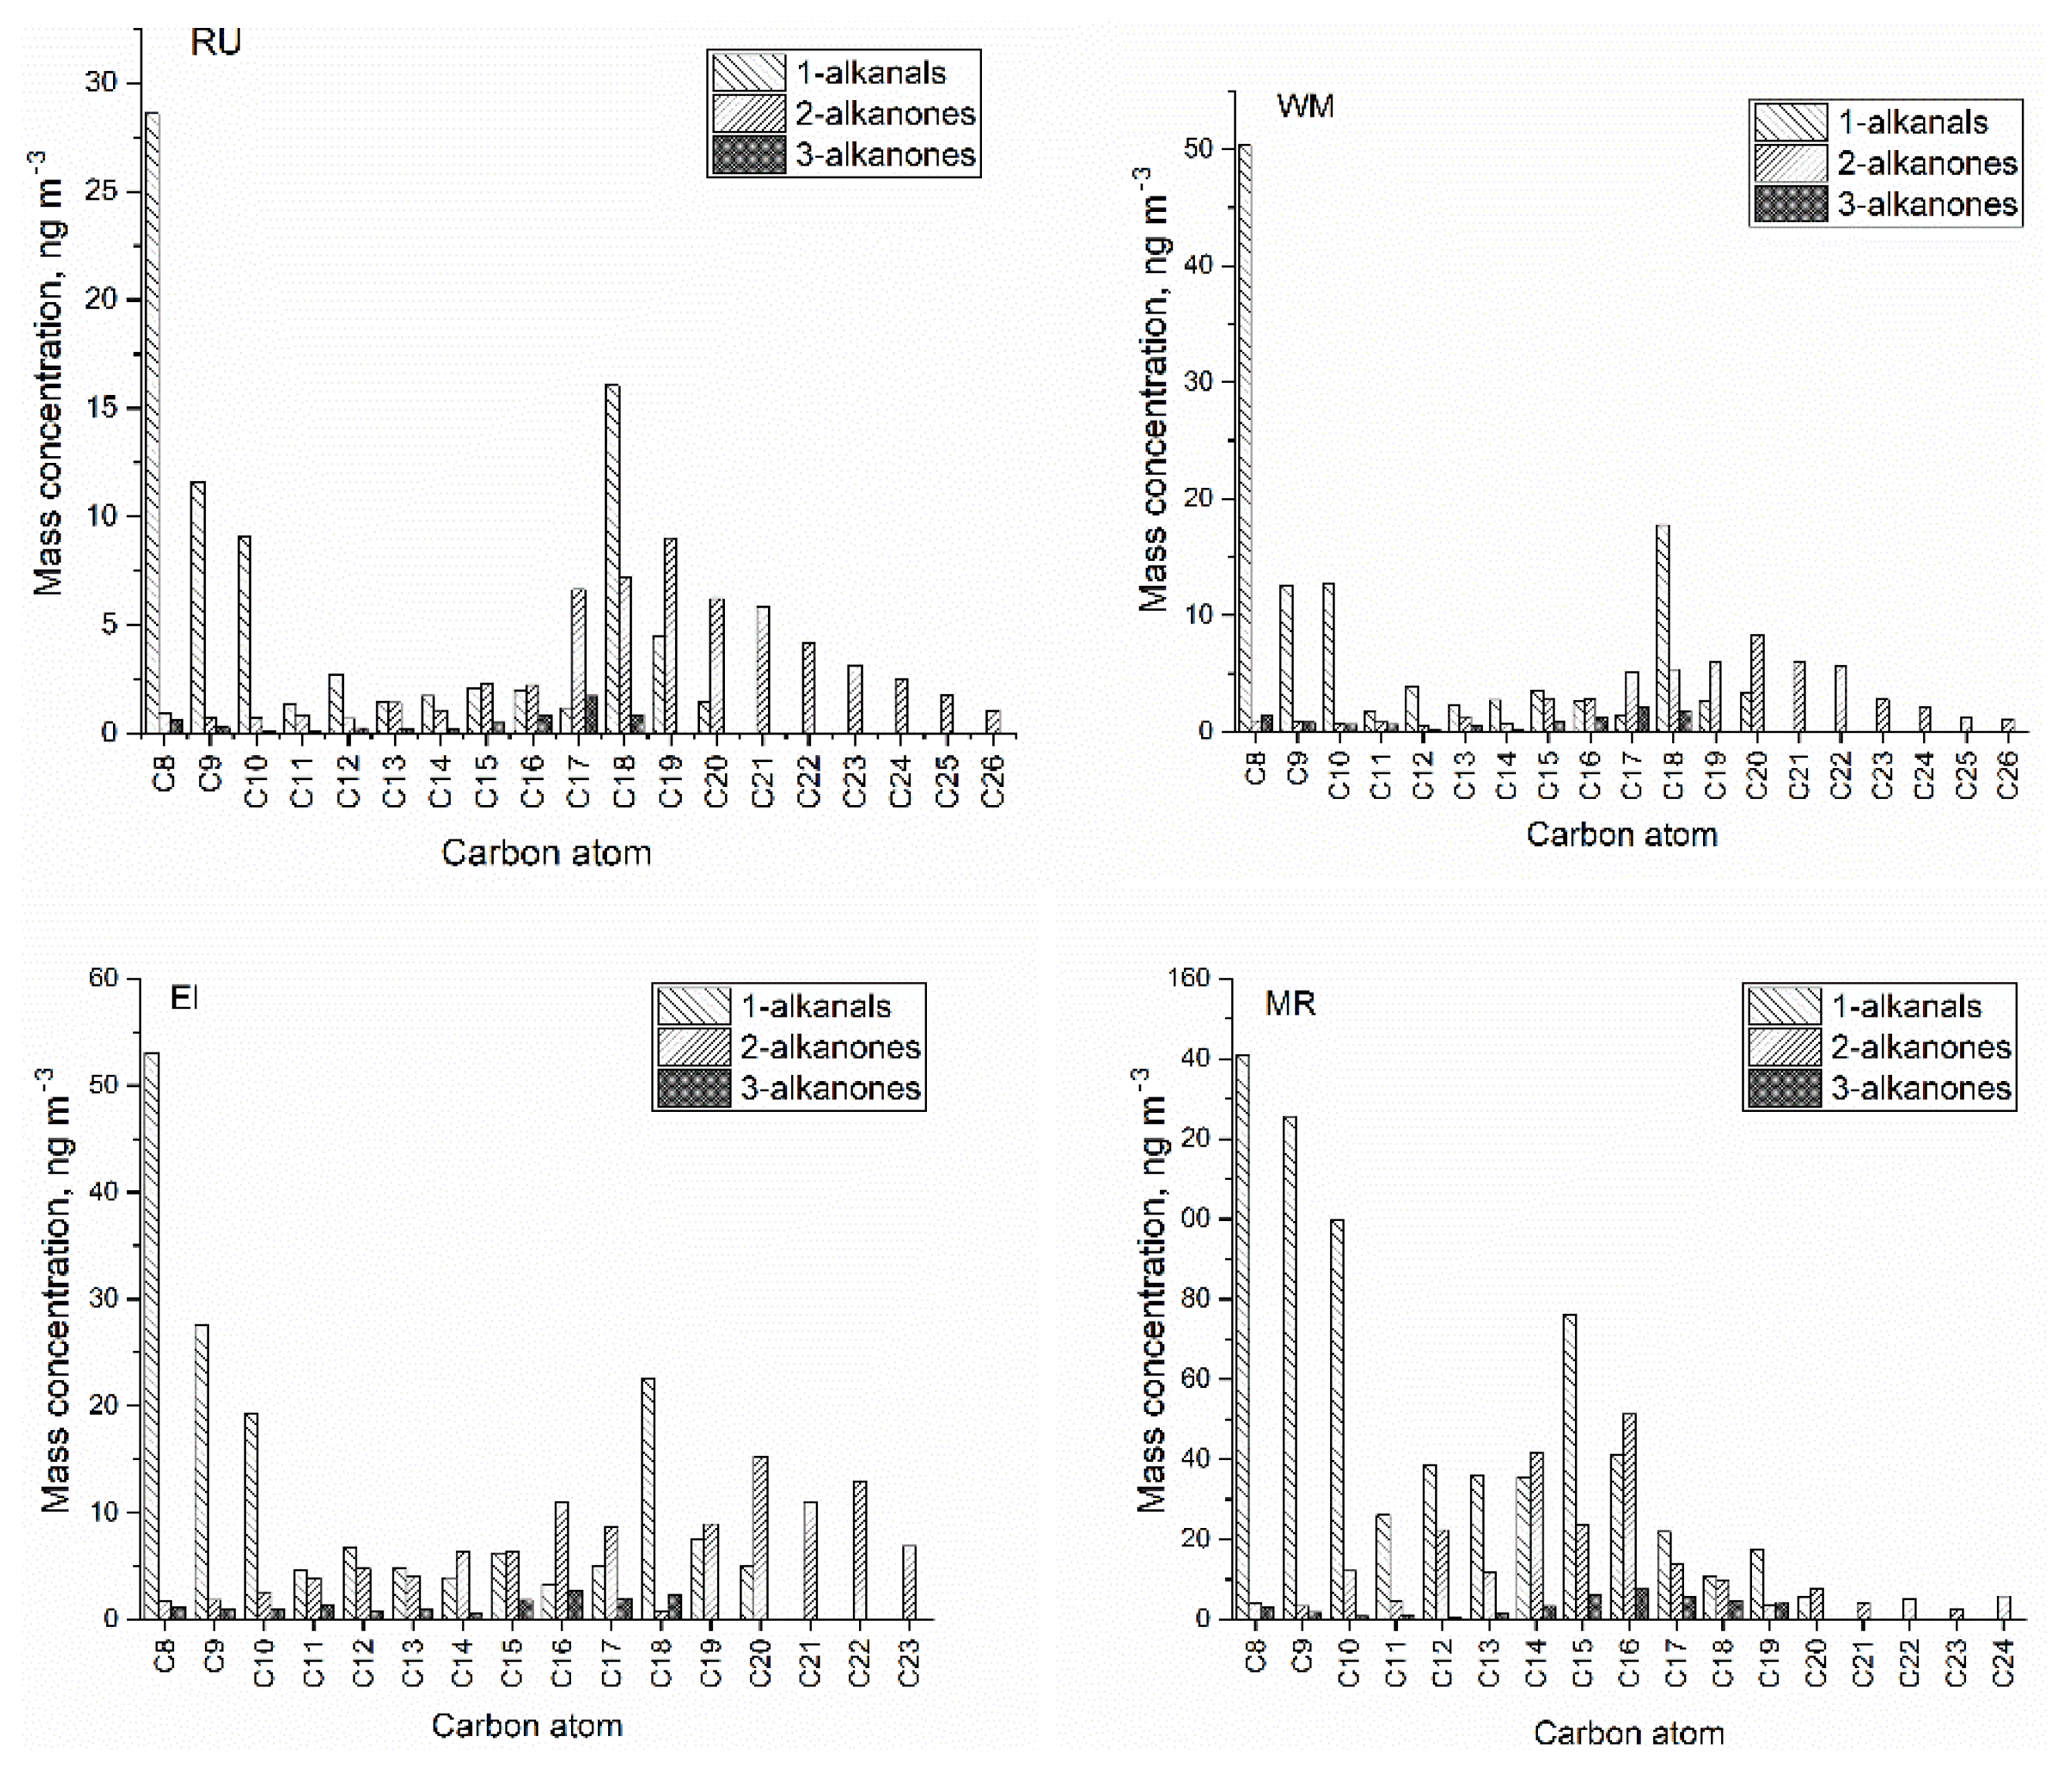
Figure 4The molecular distribution of particle-bound carbonyl compounds at four sites (RU, WM, EL, and MR).
During the field experiment, the n-alkanal homologues were abundant in all samples, and this is probably attributable to primary emission sources, including diesel vehicles (Schauer et al., 1999a), gasoline cars (Schauer et al., 2002b), wood burning (Rogge et al., 1998), and cooking aerosol (Schauer et al., 1999b). Correlations with other largely vehicle-generated pollutants (see discussion below) support this interpretation. The particulate form of the n-alkane homologues (C14–C36) identified in the samples dominated for > C25 and there was a significant particulate fraction (> 60 %) for all but the low-MW n-alkanes (C14–C18) (unpublished data). H abstraction by OH radicals may therefore have been dominated by heterogeneous reactions, generating the higher concentrations of n-alkan-2-ones than n-alkan-3-ones that were found in all samples. The ratio of n-alkan-2-ones ∕ n-alkan-3-ones (C11–C18) with the same carbon atom number ranged from 2.35 to 11.3 at the four measurement sites. Surprisingly, although n-alkane (C11–C13) oxidation was expected to be dominated by homogeneous gas-phase reactions, the n-alkan-2-one ∕ n-alkan-3-one ratios were still greater than 2.00. The probable reason was that the lower-molecular-weight n-alkan-2-ones were significantly impacted by primary emission sources such as cooking (Zhao et al., 2007a, b). Another possible reason is that the n-alkan-2-one and n-alkan-3-one homologues with lower carbon atom numbers originated in part from the fragmental products of higher n-alkanes (Yee et al., 2012; Schilling Fahnestock et al., 2015), although fragmentation reactions would result mainly in the formation of alkanals and are less likely to occur than isomerization, leading mostly to multifunctional products.
The ratios of n-alkan-2-ones ∕ n-alkanes and n-alkan-3-ones ∕ n-alkanes (with same carbon numbers) were calculated and are reported in Table S3. The n-alkan-3-ones with carbon numbers higher than C20 were not identified in the samples, indicating that both gas-phase and heterogeneous reactions of higher-molecular-weight n-alkanes were slow, the former probably due to the low vapour-phase presence of n-alkanes. The ratios of n-alkan-3-ones ∕ n-alkanes at the four measurement sites gradually increased from C11 and then decreased from C17, while higher ratios of n-alkan-2-ones ∕ n-alkanes were observed in the range from C17 to C22, probably indicating a shift from homogeneous gas-phase reactions to heterogeneous reactions with the increase in carbon numbers. The low ratios of n-alkan-2-ones ∕ n-alkanes with carbon numbers from C23 to C26 might be explained by the low diffusion rate from the inner particle to the surface with the increasing carbon number of n-alkanes, even though heterogeneous reactions would be the expected dominant pathway.
Table 1The carbon preference index (CPI) and Cmax for n-alkanals, n-alkan-2-ones, and n-alkan-3-ones in this study and published data.

3.2 Sources of carbonyl compounds
3.2.1 Homologue distribution and CPI
Figure 4 shows the average concentrations and molecular distributions of particle-bound carbonyl compounds at the four sites. CPI values were calculated to estimate the origin of carbonyl compounds according to Bray and Evans (1961):
For n-alkanals and n-alkan-3-ones (m=9):
For n-alkan-2-ones (m=12):
Here, i takes values between 4 and m and between 5 and m as in the equation, with m= 9 for n-alkanal and n-alkan-3-ones and m= 12 for n-alkan-2-ones.
The carbon number of the homologue of highest concentration (Cmax) can be indicative of the source. Table 1 presents the CPI and Cmax of particle-bound carbonyl compounds calculated in the current and other studies. A CPI of ≤1 is an indication of an anthropogenic source, while a CPI of 1–5 shows a mixture of anthropogenic and biogenic sources, and a CPI > 5 suggests a biogenic (plant wax) source.
Table 2Percentages of particle-phase form and the partitioning coefficient Kp (m3 µg−1).
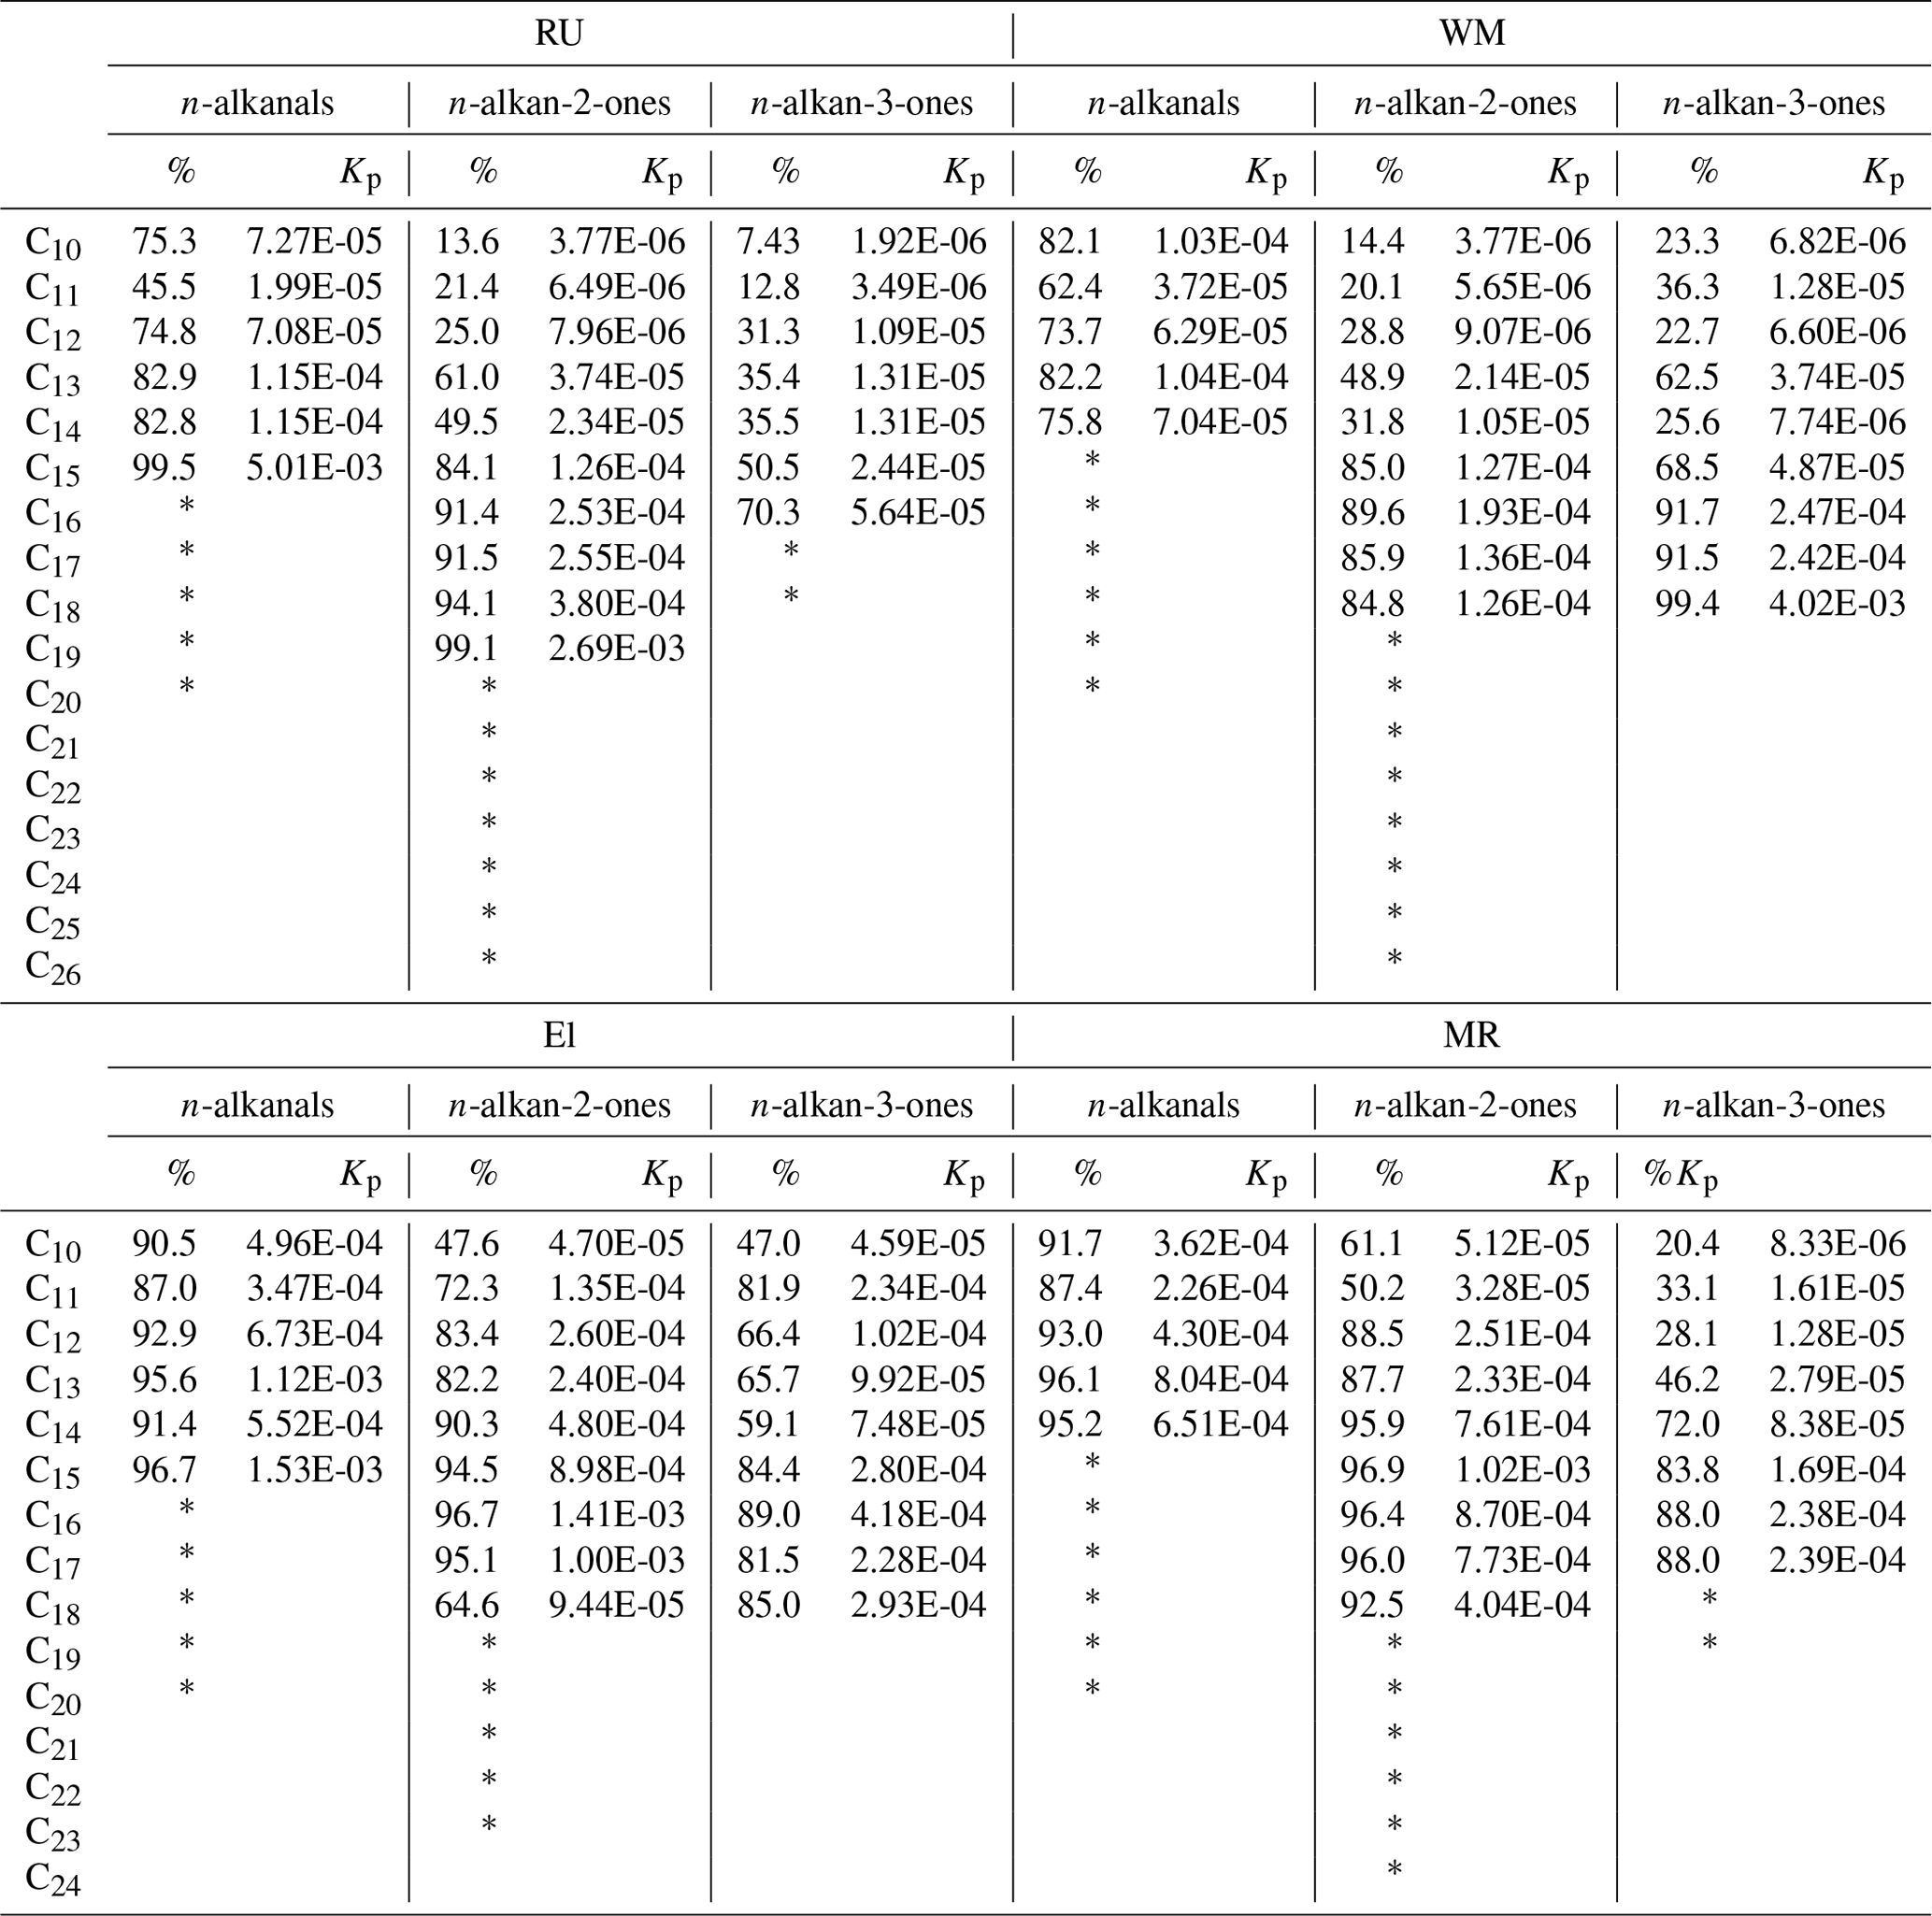
* For compounds marked with an asterisk, the particulate phase was quantified, but the vapour was below the detection limit, and hence Kp is undefined.
The n-alkanes, which are potential precursors of the oxygenates described, typically showed two Cmax values, at C13 (the lowest-MW compound measured) and at C23. The CPI values for the n-alkanes were between 0.97 and 1.02 at the four measurements sites (unpublished data).
According to the low CPI (0.41–1.07) at the four sites, the n-alkanal homologues with carbon numbers from C8 to C20 mainly originate from anthropogenic emissions or the OH oxidation of fossil-derived hydrocarbons. The particle-bound n-alkanals exhibited a similar distribution of carbon number from January to April at the four sites, and they had the same Cmax at C8 with concentrations of 28.6 ng m−3 at RU, 50.3 ng m−3 at WM, 53.0 ng m−3 at EL, and 141 ng m−3 at MR. This compound may be a fragmentation product, oxidation product, or primary emission. In addition, the distribution of n-alkanals had a second concentration peak at C15 (MR) and C18 (RU, WM, and EL). The C18 compound was observed to account for the highest percentage of the total mass of n-alkanals in some rural aerosol samples (Gogou et al., 1996) in Crete. Andreou and Rapsomanikis reported the Cmax as C15 or C17 in Athens (Andreou and Rapsomanikis, 2009) and attributed this to the oxidation of n-alkanes. However, a Cmax at C26 or C28 in urban Crete (Gogou et al., 1996) was observed, suggesting biogenic input. The homologue distribution and CPI of n-alkanals in this study differed from those of previous reports and demonstrated weak biogenic input with a strong impact of anthropogenic activities in the London samples.
In this study, n-alkan-2-ones have similar homologue distributions and Cmax (C19 or C20) (Table 2) at the RU, WM, and EL sites, and the total concentration from C16 to C23 accounts for 76.0 %, 76.1 %, and 68.0 % of ∑n-alkan-2-ones, respectively. The CPI values for n-alkan-2-ones ranged from 0.57 to 1.23 at the RU, MR, and WM sites, not indicative of major biogenic input, and were considered to mainly originate from anthropogenic activities and the OH oxidation of anthropogenic n-alkanes. It is, however, notable that the CPI values for both the 2-ketones and 3-ketones exceed those for the alkanals (see Table 1), suggesting a contribution from contemporary biogenic sources, possibly woodsmoke and cooking. At EL, the CPI of 1.57 is clearly indicative of a biogenic contribution in suburban south London. A difference was observed at the MR site: the n-alkan-2-ones with carbon atoms C12 to C18 accounted for 72.0 % of ∑n-alkan-2-ones, with the Cmax at C16. These data suggest a contribution of primary emissions from traffic at MR, but a dominant background, probably substantially secondary, at the other sites. The Cmax of n-alkan-3-ones was at C16 at the MR site, Cmax=C16 at EL, Cmax=C17 at WM, and Cmax=C17 at RU.
3.2.2 The ratios of n-alkanes ∕ n-alkanals
Diesel engine emission studies have been conducted previously in our group; details on the engine set-up and exhaust sampling system are given elsewhere (Alam et al., 2016b). Briefly, the steady-state diesel engine operating conditions were at a load of 5.90 bar of mean effective pressure (BMEP) and a speed of 1800 revolutions per minute (RPM). Samples (n=14) were collected both before a diesel oxidation catalyst (DOC) and after a diesel particulate filter (DPF). The n-alkanes (C12–C37) and n-alkanals (C9–C18) were quantified in the particle samples, while n-alkanones were not identified because their concentrations were lower than the limits of detection (0.01–0.15 ng m−3). The emission concentrations of n-alkanals ranged from 7.10 to 53.2 µg m−3 (before DOC) and 1.20 to 11.5 µg m−3 (after DPF), and the ratios of alkanes ∕ alkanals (C13–C18) with the same carbon atom numbers ranged from 0.15 to 0.23 (before DOC) and 0.52 to 7.60 (after DPF). The n-alkane ∕ n-alkanal (C13–C18) ratio at MR ranged from 0.30 to 5.7, while average ratios of 14.9 (RU), 11.5 (WM), and 14.7 (EL) were obtained. The similarity of the n-alkanes ∕ n-alkanal ratio between MR and the engine studies (after DPF) strongly suggests that diesel vehicle emissions were the main source of alkanals at MR. The higher ratios at the other sites may be due to greater air mass ageing and loss of alkanals due to their higher reactivity (Chacon-Madrid and Donahue, 2011; Chacon-Madrid et al., 2010).
The emission factors of total alkanes from diesel engines are reported to be 7 times greater than gasoline engines (Perrone et al., 2014), with n-alkanals with carbon atoms lower than C11 being quantified in the exhaust from gasoline engines (Schauer et al., 2002b; Gentner et al., 2013). The n-alkane ∕ n-alkanal (C8–C10) ratio with the same carbon numbers ranged from 5.60 to 14.3 (Schauer et al., 2002b), suggesting that gasoline combustion may be another potential source of atmospheric n-alkanals.
3.2.3 Correlation analysis
Insights into the sources of carbonyls can be gained from intra-site correlation analysis with BC and NOx. This is more informative than comparisons between sites when sampling did not take place simultaneously, as concentrations are strongly affected by weather conditions, making inter-site comparisons difficult to interpret. In London, both black carbon and NOx arise very substantially from diesel vehicle emissions (Liu et al., 2014; Harrison et al., 2012; Harrison and Beddows, 2017), and hence these are good measures of road traffic activity. The concentrations of BC were simultaneously determined by online instruments during the sampling periods, with average concentrations of 1.34, 1.94, and 3.58 µg m−3 at the RU, WM, and MR sites, respectively. The data for NOx were provided by the national network sites, with average concentrations of 23.4 and 202 µg m−3 at the EL and MR sites, respectively. At the MR site, the concentrations of BC and NOx averaged 5.00 and 281 µg m−3 when southerly winds were dominant compared to 2.60 and 128 µg m−3 for northerly winds. All correlations were carried out with the sum of particle and vapour phases for the carbonyl compounds, and strong (r2=0.87) and weak (r2=0.12) correlations between BC and NOx were obtained when the southerly and northerly winds were prevalent at MR, respectively. Marylebone Road is a street canyon site where a vortex circulation is established by the wind. The effect is that in northerly wind sectors the sampling site on the southern side of the road collects near-background air, while in southerly wind sectors, the traffic pollution is carried to the sampling site, leading to elevated pollution levels heavily affected by traffic emissions. The strong correlation between BC and NOx with southerly wind sectors is a reflection of their emission from road traffic. In addition, the correlations between n-alkanals (C8–C20) and BC and between n-alkanals (C8–C20) and NOx were calculated to assess the contribution of vehicular emissions (Table S4). The results showed that the correlations (r2) between n-alkanals and BC gradually decreased from 0.61 (C9) to 0.34 (C20) at MR when the southerly winds were prevalent, indicating that the distribution of n-alkanals, especially the lower-MW compounds, was significantly impacted by vehicular exhaust emissions. The average correlations at MR (southerly winds) between n-alkanals and BC and between n-alkanals and NOx were r2=0.47 and r2=0.32, respectively. These moderate correlations demonstrated that vehicular emissions were a source of n-alkanals at MR and contribute to the high background concentrations of n-alkanals in London. The other probable sources of n-alkanals include cooking emissions, wood burning, photo-oxidation of hydrocarbons, and industrial emissions. Poorer correlations between n-alkanals and BC (average r2=0.15) and between n-alkanals and NOx (average r2=0.15) were observed at MR in the north London background air sampled when northerly winds were prevalent. There were very weak correlations (average r2<0.10) between n-alkanals and BC and between n-alkanals and NOx at the RU, WM, and EL sites, which may be attributable to the high chemical reactivity of n-alkanals. High concentrations of furanones (γ-lactones) are generated via the photo-oxidation reaction of n-alkanals (Alves et al., 2001), and the total concentrations (particle and gas) were up to 376, 279, 347, and 318 ng m−3 at RU, WM, WL, and MR, respectively, for the sum of furanone homologues (from 5-propyldihydro-2(3H)-furanone to 5-tetradecyldihydro-2(3H)-furanone).
The relationships (r2 values) between BC and NOx and the n-alkan-2-ones were low at all sites, but notably higher with southerly winds at MR (average r2=0.33 and 0.35 for BC and NOx, respectively) than for northerly winds (r2=0.16 and 0.03, respectively). This is strongly suggestive of a contribution from vehicle exhaust to n-alkan-2-one concentrations, but smaller than that for n-alkanals. In the case of the n-alkan-3-ones, correlations averaged r2=0.25 with BC and r2=0.21 for NOx in southerly winds compared to r2=0.08 and r2=0.05, respectively, for northerly winds. This is also suggestive of a small, but not negligible, contribution of vehicle emissions to n-alkan-3-ones. The very low correlations observed in background air for both n-alkan-2-ones and n-alkan-3-ones with BC and NOx are suggestive of the importance of non-traffic sources, probably including the oxidation of n-alkanes. Both compound groups were below the detection limit in the analyses of diesel exhaust. The considerable predominance of n-alkan-2-one over n-alkan-3-one concentrations may be indicative of a formation pathway from the oxidation of condensed-phase n-alkanes, but this is speculative as primary emissions may be dominant.
3.3 Gas- and particle-phase partitioning
The partitioning coefficient Kp between particles and vapour (≥ C10) was calculated in this study according to the following equation defined by Pankow (1994):
where Cp and Cg (µg m−3) are the concentration of the compounds in the particulate phase and gaseous phase, respectively. TSP is the concentration of total suspended particulate matter (µg m−3), which was estimated from the PM10 concentration (PM10 ∕ TSP = 0.80), and daily average PM10 concentrations were taken from the national network sites (see Table S5). The partitioning coefficients Kp calculated from our data and the percentages in the particulate form are presented in Table 2. For the three types of carbonyls, the n-alkanals > C16, n-alkan-2-ones > C19, and n-alkan-3-ones > C18, the vapour concentrations were below the detection limit, and the partitioning into the particulate phase gradually increased from C8 to high-molecular-weight compounds.
Log Kp was regressed against vapour pressure (VPT) for the relevant temperature derived from UManSysProp (http://umansysprop.seaes.manchester.ac.uk/, last access: 11 January 2019) according to the following equation:
The calculated log Kp versus log (VPT) for the three types of carbonyls was calculated for each day, and the results appear in the Table S6. Data from the four sites were over the temperature range 0.4–15.3 ∘C. A good fit to the data for n-alkan-2-ones (r2=0.55–0.94 at RU, 0.64-0.93 at WM, 0.45–0.94 EL, and 0.36–0.88 at MR) was obtained. It is notable that the fit to the regression equation as indicated by the r2 value is appreciably higher at the MR site than at the other sites, especially in the case of the alkan-3-ones (Table S6). This is not easily explained, except perhaps by an increased particle surface area at the MR site which may enhance the kinetics of gas–particle exchange, leading to partitioning which is closer to equilibrium.
According to theory, the gradient of the plot of log KP versus log (VPT) should be −1 (Pankow, 1994). However, many measurement datasets for a number of semi-volatile compound groups, including n-alkanes (Cincinelli et al., 2007; Karanasiou et al., 2007; Mandalakis et al., 2002) and PAH (Callen et al., 2008; Wang et al., 2011; Ma et al., 2011; Mandalakis et al., 2002), show a range of values often around −0.5, but ranging to below −1 and in some cases positive. Callen et al. (2008) discuss the reasons for deviation from a value of −1, which include a lack of equilibrium, absorption into the organic matter (shallower than −0.6), adsorption processes (steeper than −1), and the averaging of conditions across a range of temperatures during a sampling period.
Our data for alkan-2-ones show high r2 values and values of gradient (m) in the range of the literature for other groups of semi-volatile compounds. Average gradients at the four sites ranged from −0.46 to −0.26. The alkan-3-ones generally show considerably lower values of r2 and average values of gradient at the four sites of −0.43 to −0.23. This poorer correlation could be the result of lower analytical precision. The n-alkanals show still lower values of r2 and more variable and shallower values of slope. Mean slopes for the four sites ranged from −0.23 to −0.16. There were no positive daily values. The lower r2 may be a result of disequilibrium for the alkanals, which are dominated by primary emissions and are also more reactive. It might also reflect a role for aqueous aerosol as an absorbing medium for these compounds containing a significant polar moiety, which would lead to deviations from the Pankow (1994) theory and more variable behaviour as the availability of aqueous particles into which to partition would depend upon relative humidity, which is itself highly variable.
Samples were collected over 24 h periods and hence the diurnal variation of temperature may be relevant. Temperature data were taken from Heathrow Airport to the west of London and did not show large diurnal fluctuations, so this should not be a major factor. The average diurnal temperature range based upon hourly data was 6.9 ∘C.
The lower-molecular-weight n-alkanals show a much higher percentage in the condensed phase than the ketone groups (Table 2).
This greater propensity to partition into particles is unexpected, as the vapour pressures of the alkanals are very similar to those of the ketones. It might possibly reflect a greater affinity of the alkanals for solvation by water molecules, leading to increased partitioning into aqueous aerosol.
Three groups of carbonyl compounds were determined in the particle and gaseous phase in London and concentrations are reported for n-alkanals (C8–C20), n-alkan-2-ones (C8–C26), and n-alkan-3-ones (C8–C19). The Marylebone Road site has the highest concentration of particle-bound n-alkanals, and the average total concentration was up to 682 ng m−3, followed by 167 ng m−3 at EL, 117 ng m−3 at WM, and 82.6 ng m−3 at RU. The particulate n-alkanals were abundant in all samples at all four measurement sites, accounting for more than 56.3 % of total particle carbonyls. In addition, the average total particle concentrations of n-alkan-2-ones and n-alkan-3-ones at the four measurement sites were in the range of 58.5–186 ng m−3 and 5.65–39.4 ng m−3, respectively. Diagnostic criteria, including molecular distribution, CPI, Cmax, ratios, and correlations, were used to assess the sources and their contributions to carbonyl compounds. The three groups of carbonyls have similar molecular distributions and Cmax values at the four measurement sites, and their low CPI values (0.41–1.57) at the four sites indicate a weak biogenic input during sampling campaigns. Heavily traffic-influenced air and urban background air were measured at the MR site when southerly and northerly winds were prevalent, respectively; correlations of r2=0.47 and r2=0.32 were obtained between n-alkanals and BC and between n-alkanals and NOx, respectively, in southerly winds. Vehicle emissions appear to be an important source of n-alkanals, which is confirmed by the similar ratios of n-alkanes ∕ n-alkanals measured at MR (0.30–5.75) and in diesel engine exhaust studies (0.52–7.6), resulting in a high background concentration in London. In addition, OH-initiated heterogeneous reactions of n-alkanes appear to be important sources of n-alkanones, even though weak contributions from vehicular exhaust emissions were suggested by correlation analysis with BC and NOx in southerly winds at MR. Anthropogenic primary sources such as cooking (Abdullahi et al., 2013) may account for a proportion of the alkan-2-one and alkan-3-one concentrations measured in London, in addition to the secondary contribution from alkane oxidation. Any contribution from cooking or wood combustion is likely to be small, or the CPI would be greater.
In addition, the partitioning coefficients of carbonyls were determined from the relative proportions of the particle and gaseous phases of individual compounds; they generally showed a better fit at MR than at the other three sites. Fits to the Pankow (1994) model were best for alkan-2-ones and this most likely reflects the slow formation of alkan-2-ones as secondary constituents closer to phase equilibrium than the predominantly emitted and more reactive alkanals, which would be more spatially variable.
Data supporting this publication are openly available from the UBIRA eData repository at https://doi.org/10.25500/edata.bham.00000302 (Lyu and Harrison, 2019).
The supplement related to this article is available online at: https://doi.org/10.5194/acp-19-2233-2019-supplement.
RL performed the carbonyl compound calibrations, analysed the chromatograms and prepared a first draft of the paper. MSA and CS managed the analytical facility, ran the air sample analyses and provided preliminary interpretation. RX contributed alkane data. ZS and YF co-supervised the project which was conceived and led by RH who prepared final versions of the manuscript.
The authors declare that they have no conflict of interest.
Primary collection of samples took place during the FASTER project, which was
funded by the European Research Council (ERC-2012-AdG, proposal no. 320821).
The authors would also like to thank the China Scholarship Council (CSC) for
support to Ruihe Lyu and the Natural Environment Research Council for
support under the Air Pollution and Human Health (APHH) programme
(NE/N007190/1).
Edited by: Eleanor
Browne
Reviewed by: two anonymous referees
Abdullahi, K. L., Delgado-Saborit, J. M., and Harrison, R. M.: Emissions and indoor concentrations of particulate matter and its specific chemical components from cooking: A review, Atmos. Environ., 71, 260–294, https://doi.org/10.1016/j.atmosenv.2013.01.061, 2013.
Alam, M. S., Stark, C., and Harrison, R. M.: Using variable ionization energy time-of-flight mass spectrometry with comprehensive GC × GC to identify isomeric species, Anal. Chem., 88, 4211–4220, https://doi.org/10.1021/acs.analchem.5b03122, 2016a.
Alam, M. S., Zeraati-Rezaei, S., Stark, C. P., Liang, Z., Xu, H., and Harrison, R. M.: The characterisation of diesel exhaust particles – composition, size distribution and partitioning, Faraday. Discuss., 189, 69–84, https://doi.org/10.1039/C5FD00185D, 2016b.
Alam, M. S., Zeraati-Rezaei, S., Liang, Z., Stark, C., Xu, H., MacKenzie, A. R., and Harrison, R. M.: Mapping and quantifying isomer sets of hydrocarbons (≥ C12) in diesel exhaust, lubricating oil and diesel fuel samples using GC × GC-ToF-MS, Atmos. Meas. Tech., 11, 3047–3058, https://doi.org/10.5194/amt-11-3047-2018, 2018.
Algrim, L. B. and Ziemann, P. J.: Effect of the Keto Group on yields and composition of organic aerosol formed from OH radical-initiated reactions of ketones in the presence of NOx, J. Phys. Chem. A., 120, 6978–6989, https://doi.org/10.1021/acs.jpca.6b05839, 2016.
Alves, C., Pio, C., and Duarte, A.: Composition of extractable organic matter of air particles from rural and urban Portuguese areas, Atmos. Environ., 35, 5485–5496, https://doi.org/10.1016/S1352-2310(01)00243-6, 2001.
Andreou, G. and Rapsomanikis, S.: Origins of n-alkanes, carbonyl compounds and molecular biomarkers in atmospheric fine and coarse particles of Athens, Greece, Sci. Total Environ., 407, 5750–5760, https://doi.org/10.1016/j.scitotenv.2009.07.019, 2009.
Aschmann, S. M., Arey, J., and Atkinson, R.: Atmospheric chemistry of three C10 alkanes, J. Phys. Chem. A., 105, 7598–7606, https://doi.org/10.1021/jp010909j, 2001.
Bray, E. and Evans, E.: Distribution of n-paraffins as a clue to recognition of source beds, Geochim. Cosmochim. Ac., 22, 2–15, https://doi.org/10.1016/0016-7037(61)90069-2, 1961.
Callen, M. S., de la Cruz, M. T., opez, J. M., Murillo, R., Navarro, M. V., and Mastral, A. M.: Some inferences on the mechanism of atmospheric gas/particle partitioning of polycyclic aromatic hydrocarbons (PAH) at Zaragoza (Spain), Chemosphere, 73, 1357–1365, 2008.
Chacon-Madrid, H. J. and Donahue, N. M.: Fragmentation vs. functionalization: chemical aging and organic aerosol formation, Atmos. Chem. Phys., 11, 10553–10563, https://doi.org/10.5194/acp-11-10553-2011, 2011.
Chacon-Madrid, H. J., Presto, A. A., and Donahue, N. M.: Functionalization vs. fragmentation: n-aldehyde oxidation mechanisms and secondary organic aerosol formation, Phys. Chem. Chem. Phys., 12, 13975–13982, https://doi.org/10.1039/C0CP00200C, 2010.
Cheng, Y., Li, S.-M., Leithead, A., and Brook, J. R.: Spatial and diurnal distributions of n-alkanes and n-alkan-2-ones on PM2.5 aerosols in the Lower Fraser Valley, Canada, Atmos. Environ., 40, 2706–2720, https://doi.org/10.1016/j.atmosenv.2005.11.066, 2006.
Cincinelli, A., Del Bubba, M., Martellini, T., Gambaro, A., and Lepri, L.: Gas-particle concentration and distribution of n-alkanes and polycyclic aromatic hydrocarbons in the atmosphere of Prato (Italy), Chemosphere, 68, 472–478, 2007.
Duan, H., Liu, X., Yan, M., Wu, Y., and Liu, Z.: Characteristics of carbonyls and volatile organic compounds (VOCs) in residences in Beijing, China, Front. Env. Sci. Eng., 10, 73–84, https://doi.org/10.1007/s11783-014-0743-0, 2016.
Gentner, D. R., Worton, D. R., Isaacman, G., Davis, L. C., Dallmann, T. R., Wood, E. C., Herndon, S. C., Goldstein, A. H., and Harley, R. A.: Chemical composition of gas-phase organic carbon emissions from motor vehicles and implications for ozone production, Environ. Sci. Technol., 47, 11837–11848, https://doi.org/10.1021/es401470e, 2013.
Gogou, A., Stratigakis, N., Kanakidou, M., and Stephanou, E. G.: Organic aerosols in Eastern Mediterranean: components source reconciliation by using molecular markers and atmospheric back trajectories, Org. Geochem., 25, 79–96, https://doi.org/10.1016/S0146-6380(96)00105-2, 1996.
Han, Y., Kawamura, K., Chen, Q., and Mochida, M.: Formation of high-molecular-weight compounds via the heterogeneous reactions of gaseous C8–C10 n-aldehydes in the presence of atmospheric aerosol components, Atmos. Environ., 126, 290–297, https://doi.org/10.1016/j.atmosenv.2015.11.050, 2016.
Harrison, R. M. and Beddows, D. C.: Efficacy of recent emissions controls on road vehicles in Europe and implications for public health, Sci. Rep-UK., 7, 1152, https://doi.org/10.1038/s41598-017-01135-2, 2017.
Harrison, R. M., Dall'Osto, M., Beddows, D. C. S., Thorpe, A. J., Bloss, W. J., Allan, J. D., Coe, H., Dorsey, J. R., Gallagher, M., Martin, C., Whitehead, J., Williams, P. I., Jones, R. L., Langridge, J. M., Benton, A. K., Ball, S. M., Langford, B., Hewitt, C. N., Davison, B., Martin, D., Petersson, K. F., Henshaw, S. J., White, I. R., Shallcross, D. E., Barlow, J. F., Dunbar, T., Davies, F., Nemitz, E., Phillips, G. J., Helfter, C., Di Marco, C. F., and Smith, S.: Atmospheric chemistry and physics in the atmosphere of a developed megacity (London): an overview of the REPARTEE experiment and its conclusions, Atmos. Chem. Phys., 12, 3065–3114, https://doi.org/10.5194/acp-12-3065-2012, 2012.
Karanasiou, A. A., Sitaras, I. E., Siskos, P. A., and Eleftheriadis, K.: Size distribution and sources of trace metals and n-alkanes in the Athens urban aerosol during summer, Atmos. Environ., 41, 2368–2381, 2007.
Kwok, E. S. and Atkinson, R.: Estimation of hydroxyl radical reaction rate constants for gas-phase organic compounds using a structure-reactivity relationship: an update, Atmos. Environ., 29, 1685–1695, https://doi.org/10.1016/1352-2310(95)00069-B, 1995.
Lim, Y. B. and Ziemann, P.J.: Chemistry of secondary organic aerosol formation from OH radical-initiated reactions of linear, branched, and cyclic alkanes in the presence of NOx, Aerosol Sci. Technol., 43, 604–619, https://doi.org/10.1080/02786820902802567, 2009.
Liu, D., Allan, J. D., Young, D. E., Coe, H., Beddows, D., Fleming, Z. L., Flynn, M. J., Gallagher, M. W., Harrison, R. M., Lee, J., Prevot, A. S. H., Taylor, J. W., Yin, J., Williams, P. I., and Zotter, P.: Size distribution, mixing state and source apportionment of black carbon aerosol in London during wintertime, Atmos. Chem. Phys., 14, 10061–10084, https://doi.org/10.5194/acp-14-10061-2014, 2014.
Lyu, R. and Harrison, R.: Datasets C8–C26-London, University of Birmingham, Dataset, https://doi.org/10.25500/edata.bham.00000302, 2019.
Ma, W.-L., Sun, D.-Z., Shen, W.-G., Yang, M., Qi, H., Liu, L.-Y., Shen, J.-M., and Li, Y.-F.: Atmospheric concentrations, sources and gas-particle partitioning of PAHs in Beijing after the 29th Olympic Games, Environ. Pollut., 159, 1794–1801, 2011.
Mandalakis, M., Tsapakis, M., Tsoga, A., and Stephanou, E. G.: Gas-particle concentrations and distribution of aliphatic hydrocarbons, PAHs, PCBs and PCDD/Fs in the atmosphere of Athens (Greece), Atmos. Environ., 36, 4023–4034, 2002.
Oliveira, T. S., Pio, C., Alves, C. A., Silvestre, A. J., Evtyugina, M., Afonso, J., Fialho, P., Legrand, M., Puxbaum, H., and Gelencsér, A.: Seasonal variation of particulate lipophilic organic compounds at nonurban sites in Europe, J. Geophys. Res-Atmos., 112, D23S09, https://doi.org/10.1029/2007JD008504, 2007.
Oros, D. R. and Simoneit, B. R. T.: Identification and emission rates of molecular tracers in coal smoke particulate matter, Fuel, 79, 515–536, https://doi.org/10.1016/S0016-2361(99)00153-2, 2000.
Pankow, J. F.: An absorption model of gas/particle partitioning of organic compounds in the atmosphere, Atmos. Environ., 28, 185–188, https://doi.org/10.1016/1352-2310(94)90093-0, 1994.
Perrone, M. G., Carbone, C., Faedo, D., Ferrero, L., Maggioni, A., Sangiorgi, G., and Bolzacchini, E.: Exhaust emissions of polycyclic aromatic hydrocarbons, n-alkanes and phenols from vehicles coming within different European classes, Atmos. Environ., 82, 391–400, https://doi.org/10.1016/j.atmosenv.2013.10.040, 2014.
Rogge, W. F., Hildemann, L. M., Mazurek, M. A., and Cass, G. R.: Sources of fine organic aerosol. 9. Pine, oak, and synthetic log combustion in residential fireplaces, Environ. Sci. Technol., 32, 13–22, https://doi.org/10.1021/es960930b, 1998.
Ruehl, C. R., Nah, T., Isaacman, G., Worton, D. R., Chan, A. W. H., Kolesar, K. R., Cappa, C. D., Goldstein, A. H., and Wilson, K. R.: The influence of molecular structure and aerosol phase on the heterogeneous oxidation of normal and branched alkanes by OH, J. Phys. Chem. A., 117, 3990–4000, https://doi.org/10.1021/jp401888q, 2013.
Schauer, J. J., Kleemanm M. J., Cass, G. R., and Simoneit, B. R. T.: Measurement of emissions from air pollution sources. 2. C1 through C30 organic compounds from medium duty diesel trucks, Environ. Sci.Technol., 33, 1578–1587, https://doi.org/10.1021/es980081n, 1999a.
Schauer, J. J., Kleeman, M. J., Cass, G. R., and Simoneit, B. R. T.: Measurement of emissions from air pollution sources. 1. C1 through C29 organic compounds from meat charbroiling, Environ. Sci. Technol., 33, 1566–1577, https://doi.org/10.1021/es980076j, 1999b.
Schauer, J. J., Kleeman, M. J., Cass, G. R., and Simoneit, B. R. T.: Measurement of emissions from air pollution sources. 3. C1−C29 organic compounds from fireplace combustion of wood, Environ. Sci. Technol., 35, 1716–1728, https://doi.org/10.1021/es001331e, 2001.
Schauer, J. J., Kleeman, M. J., Cass, G. R., and Simoneit, B. R. T.: Measurement of emissions from air pollution sources. 4. C1−C27 organic compounds from cooking with seed oils, Environ. Sci. Technol., 36, 567–575, https://doi.org/10.1021/es002053m, 2002a.
Schauer, J. J., Kleeman, M. J., Cass, G. R., and Simoneit, B. R. T.: Measurement of emissions from air pollution sources. 5. C1−C32 organic compounds from gasoline-powered motor vehicles, Environ. Sci. Technol., 36, 1169–1180, https://doi.org/10.1021/es0108077, 2002b.
Schilling Fahnestock, K. A., Yee, L. D., Loza, C. L., Coggon, M. M., Schwantes, R., Zhang, X., Dalleska, N. F., and Seinfeld, J. H.: Secondary organic aerosol composition from C12 alkanes, J. Phys. Chem. A., 119, 4281–4297, https://doi.org/10.1021/jp501779w, 2015.
Simoneit, B. R. T., Cox, R. E., and Standley, L. J.: Organic matter of the troposphere – IV. Lipids in harmattan aerosols of Nigeria, Atmos. Environ., 22, 983–1004, https://doi.org/10.1016/0004-6981(88)90276-4, 1967.
UK-Air: Air information Resource, available at: https://uk-air.defra.gov.uk, last access: 16 December 2018.
Wang, W., Massey Simonich, S. L., Wang, W., Giri, B., Zhao, J., Xue, M., Cao, J., Lu, X., and Tao, S.: Atmospheric polycyclic aromatic hydrocarbon concentrations and gas/paticle partitioning at background, rural village and urban sites in the North China Plain, Atmos. Res., 99, 197–206, 2011.
Yee, L. D., Craven, J. S., Loza, C. L., Schilling, K. A., Ng, N. L., Canagaratna, M. R., Ziemann, P. J., Flagan, R. C., and Seinfeld, J. H.: Secondary organic aerosol formation from low-NOx photooxidation of dodecane: Evolution of multigeneration gas-phase chemistry and aerosol composition, J. Phys. Chem. A., 116, 6211–6230, https://doi.org/10.1021/jp211531h, 2012.
Zhang, H., Worton, D. R., Shen, S., Nah, T., Isaacman-VanWertz, G., Wilson, K. R., and Goldstein, A. H.: Fundamental time scales governing organic aerosol multiphase partitioning and oxidative aging, Environ. Sci. Technol., 49, 9768–9777, https://doi.org/10.1021/acs.est.5b02115, 2015.
Zhao, Y., Hu, M., Slanina, S., and Zhang, Y.: The molecular distribution of fine particulate organic matter emitted from Western-style fast food cooking, Atmos. Environ., 41, 8163–8171, https://doi.org/10.1016/j.atmosenv.2007.06.029, 2007a.
Zhao, Y., Hu, M., Slanina, S., and Zhang, Y.: Chemical compositions of fine particulate organic matter emitted from Chinese cooking, Environ. Sci. Technol., 41, 99–105, https://doi.org/10.1021/es0614518, 2007b.
Ziemann, P. J.: Effects of molecular structure on the chemistry of aerosols formation from the OH-radical-initiated oxidation of alkanes and alkenes, Intl. Rev. Phys. Chem., 30, 161–195, https://doi.org/10.1080/0144235X.2010.550728, 2011.