the Creative Commons Attribution 4.0 License.
the Creative Commons Attribution 4.0 License.
 | 20 Feb 2019
Physicochemical uptake and release of volatile organic compounds by soil in coated-wall flow tube experiments with ambient air
Guo Li
Yafang Cheng
Uwe Kuhn
Rongjuan Xu
Yudong Yang
Hannah Meusel
Zhibin Wang
Nan Ma
Yusheng Wu
Jonathan Williams
Thorsten Hoffmann
Markus Ammann
Ulrich Pöschl
Min Shao
Volatile organic compounds (VOCs) play a key role in atmospheric chemistry. Emission and deposition on soil have been suggested as important sources and sinks of atmospheric trace gases. The exchange characteristics and heterogeneous chemistry of VOCs on soil, however, are not well understood. We used a newly designed differential coated-wall flow tube system to investigate the long-term variability of bidirectional air–soil exchange of 13 VOCs under ambient air conditions of an urban background site in Beijing. Sterilized soil was investigated to address physicochemical processes and heterogeneous/multiphase reactions independently from biological activity. Most VOCs revealed net deposition with average uptake coefficients (γ) in the range of 10−7–10−6 (referring to the geometric soil surface area), corresponding to deposition velocities (Vd) of 0.0013–0.01 cm s−1 and soil surface resistances (Rc) of 98–745 s cm−1, respectively. Formic acid, however, was emitted at a long-term average rate of nmol m−2 s−1, suggesting that it was formed and released upon heterogeneous oxidation of other VOCs. The soil–atmosphere exchange of one individual VOC species can be affected by both its surface degradation/depletion caused by surface reactions and by competitive uptake or heterogeneous formation/accommodation of other VOC species. Overall, the results show that physicochemical processing and heterogeneous oxidation on soil and soil-derived dust can act as a sink or as a source of atmospheric VOCs, depending on molecular properties and environmental conditions.
- Article
(6966 KB) - Full-text XML
-
Supplement
(1853 KB) - BibTeX
- EndNote


Volatile organic compounds (VOCs) are widely recognized as playing a critical role in atmospheric chemistry and climate, because of their important impact on the atmospheric oxidation capacity and contribution to the formation of secondary organic aerosols (SOAs) (Andreae and Crutzen, 1997; Atkinson, 2000; Fuentes et al., 2000; Williams, 2004; Tunved et al., 2006; Lelieveld et al., 2008; Zhang et al., 2008; Pöschl et al., 2010), and VOCs adsorbed on aerosol particles can have severe health implications (Glikson et al., 1995; Pöschl, 2005). The main sources of VOCs include the biosphere, biomass burning and anthropogenic activities, with emissions from the biosphere accounting for ∼90 % of global total atmospheric VOCs (Guenther et al., 1995). Once VOCs are emitted, they can be removed from the atmosphere by either direct wet or dry deposition to various surfaces including vegetation and soil (130–270 Tg C yr−1), or be transformed into SOAs (510–910 Tg C yr−1), or be oxidized ultimately leading to the formation of CO2 and H2O (310–720 Tg C yr−1) (Goldstein and Galbally, 2007). The reported discrepancies between field observations and model calculations, however, indicate that many potential sources and sinks still need to be identified and quantified (Di Carlo et al., 2004; Heald et al., 2005; Volkamer et al., 2006; Goldstein and Galbally, 2007; Warneck and Williams, 2012).
Biogenic VOC emission from vegetation has long been the major focus of VOC exchange studies (e.g., Guenther et al., 1994; Gershenzon, 1994; Fuentes et al., 1996; Fall et al., 1999; Schade and Goldstein, 2002). Early studies presumed that vegetation only emitted VOCs to the air. However, more recent studies have demonstrated that VOC exchange is bidirectional, and uptake of VOCs and their oxidation products are the rule rather than the exception in many cases (Kesselmeier, 2001; Fares et al., 2015; Guenther, 2015; Cappellin et al., 2017; Karl et al., 2005, 2010; Seco et al., 2007; Park et al., 2013; Gordon et al., 2014a; Niinemets et al., 2014), similar to other trace gases such as NH3 or HONO (Su et al., 2011, 2013). In fact, Park et al. (2013) expanded the number of measured VOC species to an extremely large range, covering 555 ions (with mass to charge ratios between 31 to 1263) using high-mass-resolution proton-transfer-reaction mass spectrometry over an orange plantation and found that 494 of the VOC species showed bidirectional fluxes and 186 even exhibited net deposition.
Compared to the research effort dedicated to atmosphere–vegetation interactions involving VOCs, the exchange between the atmosphere and soils has received relatively little attention (Lamb et al., 1987; Guenther et al., 1995; Asensio et al., 2008). Soils have been characterized as both a source and a sink for VOCs. Soil emissions of short-chain oxygenated VOCs (e.g., methanol, acetaldehyde and acetone) and terpenes have been observed in previous studies (Warneke et al., 1999; Schade and Goldstein, 2001; Hayward et al., 2001; Schade and Custer, 2004; Lin et al., 2007; Gray et al., 2014; Bourtsoukidis et al., 2018). In contrast, some species including alcohols, aldehydes, ketones, aromatic hydrocarbons, isoprene, monoterpenes and hexenal, etc. have been reported to be deposited on various types of soil in other studies (Asensio et al., 2007a, b, 2008; Aaltonen et al., 2013; Gray et al., 2014). Previous laboratory measurements have also indicated that soil could serve as a temporary reservoir for formaldehyde, i.e., a large fraction (∼70 %) of formaldehyde adsorbed by soil at high mixing ratios could be re-emitted into the atmosphere at low ambient conditions; hence formaldehyde could cycle between the atmosphere and soil (Li et al., 2016). VOC emission from ground level can originate from the overlying soil litter (Gray et al., 2010; Warneke et al., 1999; Hayward et al., 2001; Schade and Goldstein, 2001), roots (Janson, 1993; Chen et al., 2004; Lin et al., 2007) and soil-dwelling microorganisms (Scholler et al., 2002), for which the relative contributions depend on the soil type and various environmental parameters such as ambient relative humidity (RH), soil water content, temperature (T), and VOC mixing ratio, etc. Therefore, VOC formation from soils involves both biotic and abiotic mechanisms. The biotic processes include root exudation and degradation of soil organic matter and leaf litter by soil microorganisms. The abiotic mechanisms involve purely physicochemical reactions (e.g., heterogeneous and multiphase transformation, evaporation, desorption) and UV-light-enhanced emission from soil vegetation or decomposition of leaf litter (Niemi et al., 2002; Rinnan et al., 2003; Zepp et al., 2007; Derendorp et al., 2011). The main mechanisms contributing to the uptake of VOCs were reported to include adsorption and degradation by roots (Simonich and Hites, 1995; Newman et al., 1997; Cho et al., 2005), biodegradation by microorganisms (van Roon et al., 2005) and physical/chemical adsorption by soil particles (Pignatello and Xing, 1996; Li et al., 2016).
Thus, both biotic and abiotic mechanisms can contribute to the exchange of VOCs on soils. Under real-world conditions, the biotic and abiotic processes on soil are highly coupled and the net flux is the result of many complex multiphase interactions that are difficult to resolve. Furthermore, emissions from the soil may be taken up or transformed in overlying leaf litter. Resolving the key processes requires the system to be examined in separate components. Here, by applying a new reactor system, we examine the physicochemical effects of soil on VOC exchange in isolation, but under real-world conditions. From the perspective of soil physicochemistry, VOCs can undergo reversible adsorption and irreversible surface reactions on soils and aerosol particles, coupling gas–surface transport (adsorption), surface-bulk transport (absorption/solvation), and chemical reactions in bulk (Pöschl et al., 2007); and VOC oxidation/decomposition products can desorb immediately or further interfere with other reactants (Ammann and Pöschl, 2007). Heterogeneous processes at the gas–surface interface can be highly complex, and the individual steps controlling the reaction rates of heterogeneous processes are rarely known (Crowley et al., 2010; Chapleski et al., 2016). Parameterizations of heterogeneous processes still tend to be empirical and most are untested in natural outdoor settings, where surfaces are prone to interference from competitively co-adsorbing trace gas species and radicals, which is specifically crucial in the case of reactive trace gases like VOCs. While laboratory-based trace gas uptake studies normally apply individual VOC species separately, only little attention is given to interfering effects. However, laboratory studies on binary organic compound mixtures in the parts-per-million (ppm) level have shown that the photocatalytic oxidation on catalytic surfaces (TiO2) of one VOC species may promote or inhibit the oxidation rate of another (Lichtin et al., 1996). In contrast to laboratory conditions, ambient air is a complex composite of a vast variety of gases, aerosols and radicals, and some components may exert synergistic effects on the heterogeneous chemistry of individual or categories of VOC species. Neglecting these synergistic effects may cause misleading results when extrapolating laboratory work to real-world conditions.
This study aims to investigate the uptake, potential heterogeneous conversion and emission of VOCs on soil under real-world ambient conditions. A flow tube system coated with pretreated sterilized soil was used to investigate the physicochemical background of VOC exchange on soil independently from biological activity. Recently, the flow tube technique has been adopted to study the kinetics and mechanisms of reactive trace gas uptake onto soils (Wang et al., 2012; Donaldson et al., 2014a, b; VandenBoer et al., 2015; Li et al., 2016). These investigations, however, have focused on laboratory experiments under controlled environmental conditions, where the dependence on individual relevant parameters was investigated while all others were kept constant. Here, the coated-wall flow tube system was deployed at an urban field site, which allowed ambient air to pass through the flow tube and the coated soil sample to interact directly with ambient VOC species. VOC uptake coefficients (γ), which indicate the fraction of trace gas kinetic collisions with a reactive surface that lead to uptake by the surface (Ammann et al., 2013), are determined, and their dependencies on various environmental parameters are discussed. To the best of our knowledge, this is the first trial to deploy the flow tube technique for field observations to investigate uptake/emission kinetics of VOCs on soil under ambient conditions.
2.1 Soil sample preparation
Soil samples were collected from a scrubland site near Weiminghu Lake in Peking University, Beijing, China (39∘59′ N, 116∘18′ E). Before collection, leaf litter was removed from the ground surface and soil particles were only obtained at a depth of 0–5 cm. The collected samples were air-dried in a shaded place prior to grinding and sieving with a 120 mesh soil sieve. The soil pH was ∼6.8 (1:2 soil∕water (v∕v), Thermo Scientific, OrionStar A211 pH meter). The soil texture comprised of 49 % sand, 35 % silt and 16 % clay (wet sieving method) and the soil humus content was 8.8 % (loss on ignition method) as analyzed by Guangdong Institute of Eco-environmental and Soil Sciences (Guangzhou, China). Since the purpose of this study was to investigate the physicochemical interactions between VOCs and soil, the sieved soil was autoclaved for 20 min at 394 K (repeated twice with an incubation time of 1 day) right before the flow tube coating procedure as in the work of Li et al. (2016). Autoclaving has been reported as the most effective sterilization method for eliminating soil microorganisms compared with other methods such as fumigation, UV and microwave irradiation (Razavi darbar and Lakzian, 2007). The sterilization procedure and the autoclave time eliminated primary microbial impact on VOC exchange at the atmosphere–soil interface and minimized potential influence on soil physicochemical properties caused by the sterilization method itself (Berns et al., 2008). Moreover, a PTFE membrane filter installed upstream of the flow tube system could prevent the bacteria in the ambient air from inhabiting the soil sample during the field measurement (see Sect. 2.2).
Soil slurry was prepared by mixing dry soil with sterilized deionized water (18.2 MΩ cm; Millipore Corporation, Darmstadt, Germany). The slurry was uniformly injected into a glass tube with a sandblasted inner surface (100 mm length, 17 mm ID), which was then installed into an air-dried continuously rotating coating tool (ACRO). The design and performance of ACRO for soil coating had been described in the work of Li et al. (2016). The coated tube was rotated with a speed of 14 rpm and flushed overnight with pure N2 at a flow rate of ∼0.5 L min−1 (purity ≥ 99.999 %, RH = 0 %). Note that the drying process with N2, to some extent, purges VOCs off the soil sample. The coating mass has been shown to affect the gas uptake (Donaldson et al., 2014a; Li et al., 2016). A relatively large coating mass of ∼95 mg cm−2 (corresponding to a geometric coating thickness ∼500 µm) was chosen for our experiments. The coating procedure and mass has been experimentally shown to guarantee fair homogeneity and reproducibility of the coating in our previous study (Li et al., 2016).
Prior to the VOC exchange experiment under ambient conditions, the freshly coated tube was flushed with N2 (purity ≥ 99.999 %, RH = 0 %) for 40 min to scrub potential VOC impurities from the soil which were either adsorbed onto or absorbed into the soil during the coating preparation procedure or from the soil coating itself. Note that during flushing with VOC-free N2, many VOC species were indeed emitted (Fig. S1 in the Supplement). These emitted VOC species might originate from the soil surface and/or the soil bulk (including soil particles and residues of the autoclaved microorganisms) through pore diffusion. To quantify the soil layer depth contributing to these observed emissions, the desorption curves (in Fig. S1 in the Supplement) were fitted using the function derived in our previous study (the first function in Table 1 in Li et al., 2016) assuming that the emissions were a first-order decay process. The determined desorption rate coefficient and desorption lifetime of the detected VOCs are listed in Table S1 in the Supplement. The longest desorption lifetime is found for formaldehyde as ∼22 min. Moreover, we estimated the timescale t for a VOC molecule diffusing through the entire soil coating thickness δg (∼500 µm) using equation , where Da is the macroscopic diffusion coefficient of VOCs within soil pores. Adopting the lower limit of a macroscopic diffusion coefficient which typically ranges 10−4–10−2 cm2 min−1 for clay minerals reported by Morrissey and Grismer (1999), a VOC diffusion time of ∼25 min was obtained. This timescale is less than or comparable to our flushing time of 40 min, suggesting that the entire soil layer could contribute to the VOC emissions by means of soil surface desorption/reaction and soil bulk pore diffusion. In addition, the amount of soil-emitted VOCs was estimated by integration of the desorption curve of methanol (which shows the highest emission signals, an order of magnitude higher than the others in Fig. S1 in the Supplement) using the fitting functions derived by Li et al. (2016). The emitted methanol mass is ∼1.71 µg, which is far from being able to account for a monolayer coverage on the specific soil layer surface (see Sect. 2.3) when assuming an effective diameter of the methanol molecule of 4.2 Å according to Perera et al. (2007). Thus, the flushing procedure could provide adsorption sites devoid of reversibly absorbed VOCs on the soil surface as well as within the soil pores and therefore allow a focus on uptake kinetics from the initial phase (VOC-free soil) of the exchange experiment.
2.2 Measurement site, experimental setup and operation
VOC exchange measurements were conducted within the campus of Tsinghua University, Beijing, China (40∘ N, 116∘12′ E), from 25 August to 26 September 2015. This urban background site was 200 m east of a four-lane highway and 100 m west of a garbage station. There was a small mound nearby which was covered by grassland mixed with trees (mainly white poplars) on its northern side.
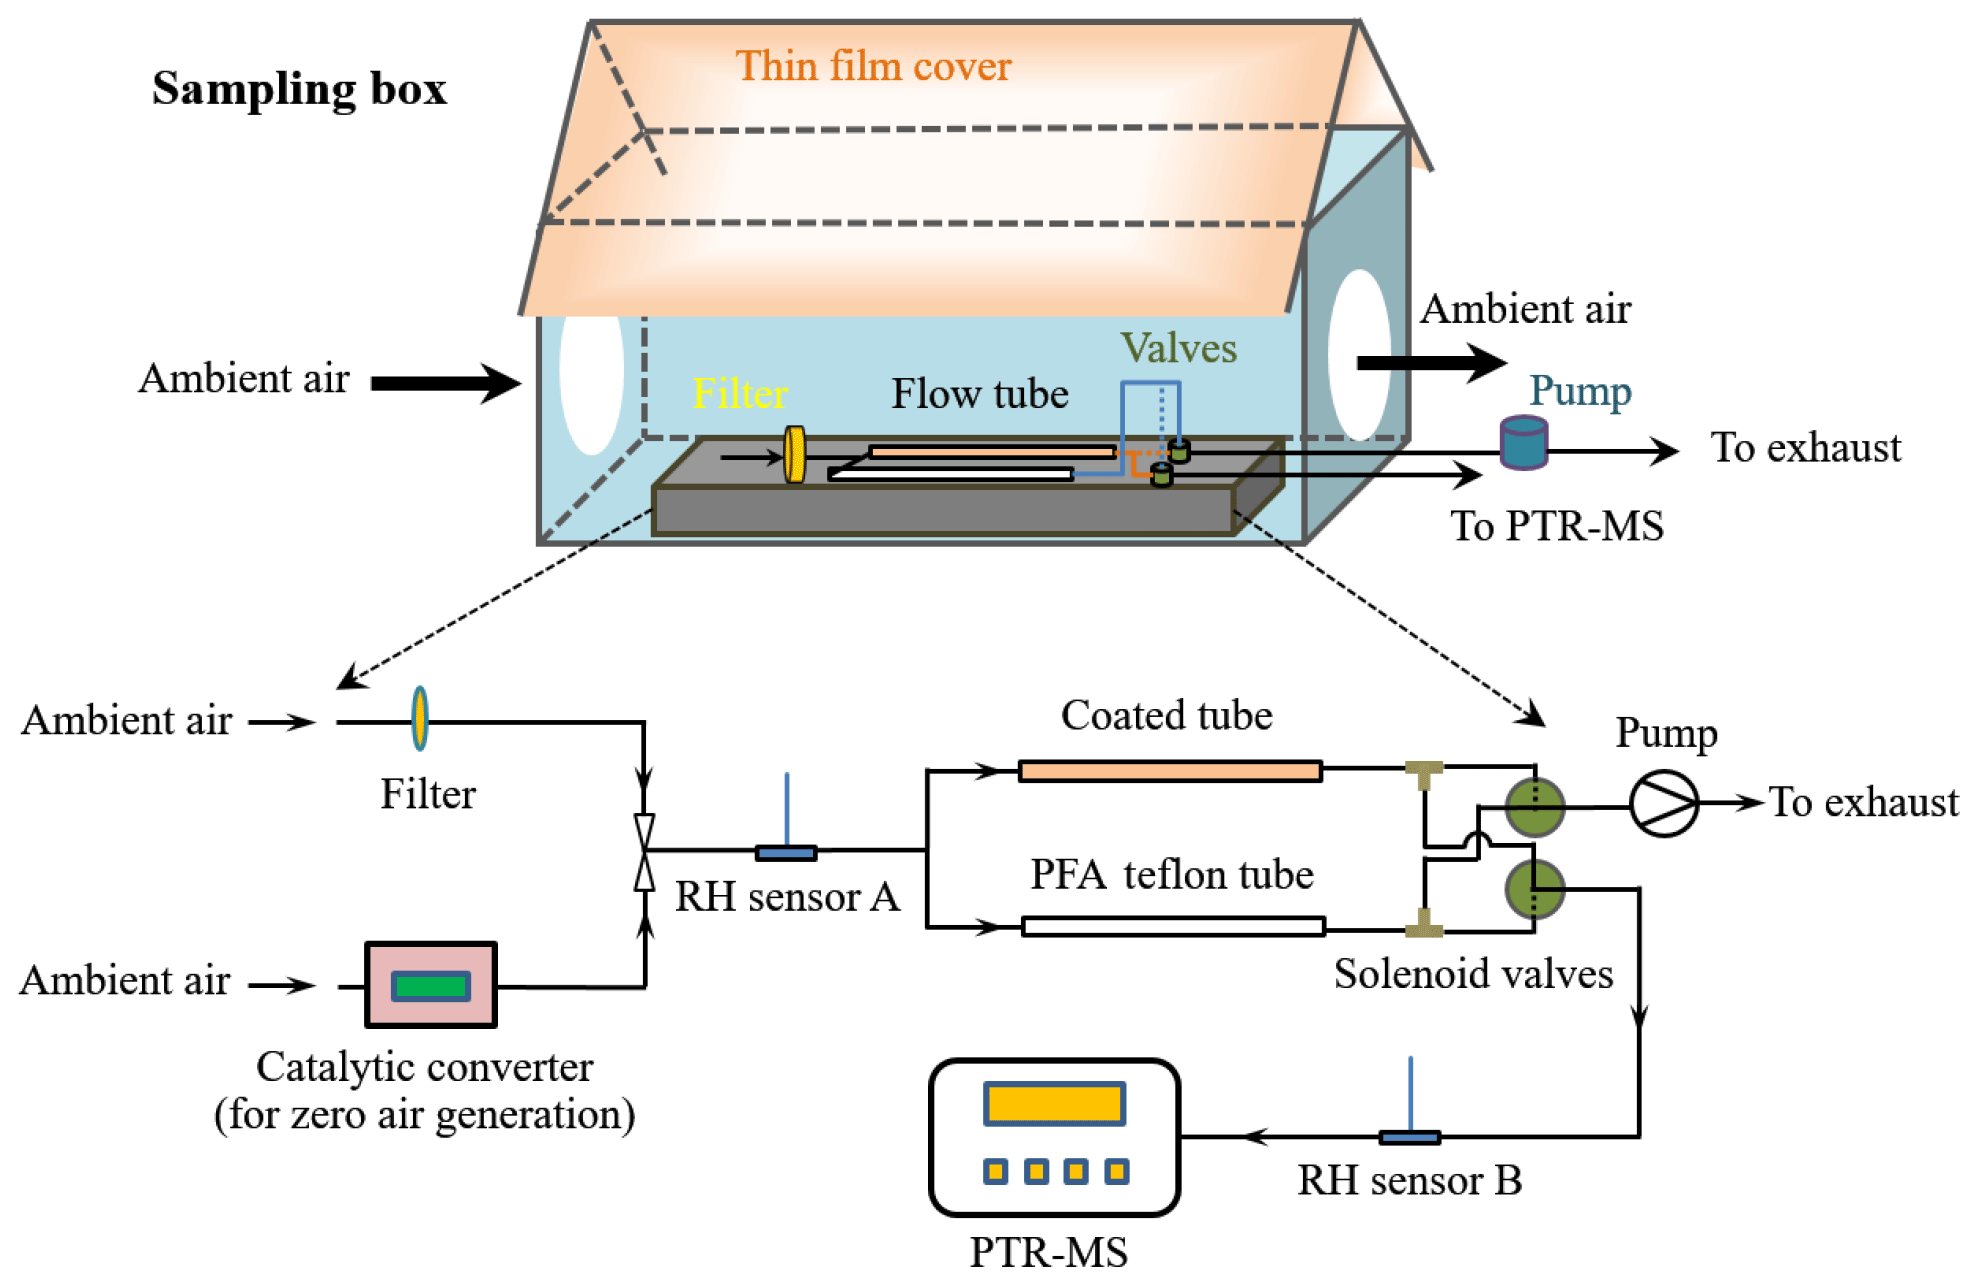
The aim of this study was to investigate VOC exchange at the atmosphere–soil interface under ambient conditions, where air temperature, relative humidity and VOC mixing ratio, etc. all change in concert. A flow tube system was installed in a self-built sampling box, which was located on the roof of a 2.35 m high storage container. Two openings on the sampling box allowed for direct access of ambient air into the flow tube system. The sampling box was covered with a thin nontransparent PTFE film (coated with an aluminium foil and with a total thickness of ∼0.5 mm) that functioned as both a reflector for sunlight and a shelter from rainwater. The flow tube system consisted of a sample channel and a reference channel. The sample channel was equipped with a soil-coated tube in front of which a pretube or entrance region (with the same dimensions as the soil-coated tube, i.e., 100 mm length, 17 mm ID, but without soil coating) was installed to ensure well-developed laminar flow in the soil-coated part (Li et al., 2018). The reference channel used a 0.25 in. (i.e., 6.35 mm OD) PFA Teflon tube (200 mm length) without coated soil. As shown in Fig. 1, ambient air was introduced into the flow tube system prior to being analyzed by a proton-transfer-reaction mass spectrometer (PTR-MS). By using solenoid valves, VOCs from the sample and reference channels were alternately analyzed by the PTR-MS (with 60 min for each channel). While one channel was connected with the PTR-MS, the other was simultaneously flushed by ambient air with the same flow rate as that of the PTR-MS (∼0.1 L min−1) to prevent potential accumulation/depletion of VOCs under otherwise static conditions. PTR-MS analysis was paused on 4–8 September 2015, but the flow tube was continuously flushed with ambient air to ensure uninterrupted exposure of the soil sample to dynamic ambient conditions.
When the reference channel was connected to the PTR-MS, the detected VOC signals represented their mixing ratios in ambient air (VOC depletion within the PFA Teflon tube was negligible), denoted as Cr, which was also equal to the VOC mixing ratios at the sample tube inlet. When the sample channel was connected, the detected signals represented the VOC mixing ratios subject to interactions with the coated soil, designated as Cs. Considering the short residence time (∼24 s) within the sample tube volume, gas-phase-reaction-induced depletion of VOCs only accounted for a small fraction (∼3 % for very reactive species like isoprene and much less for the others, estimated based on the measured gas oxidants mixing ratios (see Sect. 3.1) and assuming a background mixing ratio level of 1 ppt for OH radicals). Thus, the VOC mixing ratio difference between the reference channel and the sample channel, Cr–Cs, can be assumed to be mainly due to exchange of VOCs on soil. Note that the PTR-MS could not detect Cr and Cs simultaneously; when one channel was connected to the PTR-MS the corresponding VOC mixing ratios of the other were determined afterwards by interpolating the adjacent measured values. Before the start of field measurements, a PTFE membrane filter (Φ: 50 mm, pore size: 0.2 µm; Millipore Corporation, USA) was installed at the air inlet of the VOC exchange system to filter bacteria as well as other particles in the ambient air. Filters were replaced every 3 or 4 days.
A commercial high-sensitivity PTR-MS (Ionicon Analytik, Innsbruck, Austria), located in the aforementioned container, was used for the detection of a broad range of VOCs including isoprene, oxygenated VOCs, acetonitrile and C6–C7 aromatics with a time resolution of ∼30 s (Table 1). PTR-MS is an analytical mass spectrometry technique that uses gas-phase hydronium ions (H3O+) as ion source reagents (Lindinger et al., 1998; Yuan et al., 2017). Inside the PTR-MS drift tube, VOC species with greater proton affinity than that of water are soft-ionized by reactions with H3O+ and then detected by a quadruple mass spectrometer (Lindinger et al., 1998). This PTR-MS has been validated and utilized in previous field campaigns (Yuan et al., 2012, 2013; Chen et al., 2014). During the field measurement, the system was running in multiple-ion mode, where the quadruple switched between the selected masses. Most of the masses were recorded for 1 s in every cycle, except for (0.2 s). Background signals were measured for 30 min every 4 h by diverting the ambient air into a platinum catalytic converter at 370 ∘C (Shimadzu Inc., Japan). Aromatics, oxygenated VOCs, isoprene and acetonitrile were calibrated by a pressurized gas standard (Spectra Gases Inc., USA). Formaldehyde (), formic acid () and acetic acid () were calibrated by permeation tubes (VICI Inc., USA). Calibrations were conducted before and after the measurement period, and a single-spot calibration was conducted every 3 or 4 days with response factors varying within 15 %. Uncertainties of measured species were about 5 %–15 %, with the notable exception of formaldehyde, formic acid and acetic acid. Limits of detection (LODs) for the measured species were in the level below parts per billion listed in Table 1.
Table 1List of reported VOC species along with their protonated m∕z, and 5 min limits of detection (LODs).

MVK: methyl vinyl ketone; MACR: methacrolein; MEK: methyl ethyl ketone.
Formaldehyde detection is found to be significantly influenced by RH (Vlasenko et al., 2010; Warneke et al., 2011; Baasandorj et al., 2015). Calibrations were conducted within a range of RH (0–30 mmol mol−1) to fit the response curve, which was then applied in ambient measurement calculations, and this procedure resulted in a measurement uncertainty within ±20 %. Measurements of formic acid by PTR-MS can potentially suffer interference from ethanol and dimethyl ether when they are present in significantly higher abundance than formic acid (Baasandorj et al., 2015). At the background urban site, however, the atmospheric abundance of ethanol and dimethyl ether in similar urban sites has previously been found to be low (Good et al., 1998; Monod et al., 2003; Jia et al., 2012), giving rise to a measurement uncertainty within ±30 %. Influences from ethyl acetate on acetic acid have been found in field campaigns (Fortner et al., 2009; Baasandorj et al., 2015; Derstroff et al., 2017). Therefore, during calculations of acetic acid concentration the (attributed to ethyl acetate) was introduced to correct for the influences (Yuan et al., 2013). However, this introduced a measurement uncertainty up to > 40 %.
In addition to measurements of VOC species by the PTR-MS, several common air pollutants were also monitored by Thermo Scientific analyzers: O3 (Model 49i, UV photometric O3 analyzer), CO (Model 48i, trace-level-enhanced gas filter correlation CO analyzer), NOx (Model 42i, trace level chemiluminescence NO-NO2-NOx analyzer) and SO2 (Model 43i, trace-level-enhanced pulsed fluorescence SO2 analyzer). These analyzers were calibrated every 3 days and uncertainties of these measured air pollutants were less than 5 %.
2.3 Uptake coefficient and deposition velocity
The uptake coefficients (γ) of measured VOC species under ambient conditions were determined using a Cooney–Kim–Davis (CKD) method (CKD-B in Li et al., 2016). This CKD-B method is based on the commonly used CKD solution for correction of the radial diffusion effect (Murphy and Fahey, 1987) and has been shown to have a much better accuracy than the CKD interpolation method, as CKD-B directly solves a governing differential equation with numerical methods. The CKD-B can establish the relation between the sample tube penetration (i.e., Cs∕Cr) and γ of the measured VOC species, which is shown in Fig. 2 derived at an average ambient temperature of 25 ∘C as an example. For details of the CKD-B method, see our previous study (Li et al., 2016). Note that the uncertainty of the determined γ depends on the uncertainty in Cs∕Cr as well as the relation between Cs∕Cr and γ (as in Fig. 2), here with the derived γ range of 10−7–10−6 (see Sects. 3.3 and 3.4); the estimated uncertainty of γ for each VOC species was within 1 order of magnitude. The Reynolds number (Re) in our experiment was ∼10, which ensured laminar flow conditions requiring Re < ∼2000 (Murphy and Fahey, 1987; Knopf et al., 2015; Li et al., 2018). The pretube/entrance region length was 10 cm, and full development of laminar flow was achieved within the first ∼1 cm for our setup. When a geometric coating thickness δg is larger than a critical height δc, the coating surface roughness may potentially distort the well-developed laminar flow and introduce uncertainties in the calculated uptake coefficients corrected for molecular diffusion effects using conventional diffusion correction methods (Li et al., 2018). According to this δc criterion, the geometric coating thickness of our soil sample (∼500 µm) was much smaller than the calculated δc (∼2400 µm) based on our experimental configuration, ensuring that the soil coating surface roughness effect was negligible. The uptake coefficients reported here are based on the geometric surface area of the soil sample, considering that in atmospheric models soil microstructure is likewise not taken into account (Donaldson et al., 2014a). The specific surface area of the soil, however, was also measured using a water vapor adsorption method based on the Brunauer–Emmett–Teller (BET) adsorption theory (Brunauer et al., 1938) and found to be 15±1.5 m2 g−1. To calculate the BET surface area, the mass of the adsorbed water in the soil sample after equilibrium with predefined RH levels was determined by a nondispersive infrared (NDIR) gas analyzer (type: Li-6262, LI-COR Biosciences Inc.) operated in differential mode. This BET surface area is comparable to that in other reports on similar soil types, e.g., 12–15 m2 g−1 (Kahle et al., 2002) and 8–19 m2 g−1 (Punrattanasin and Sariem, 2015). Accounting for the BET results, the specific surface area would reduce γ by a factor of 104 in our case.
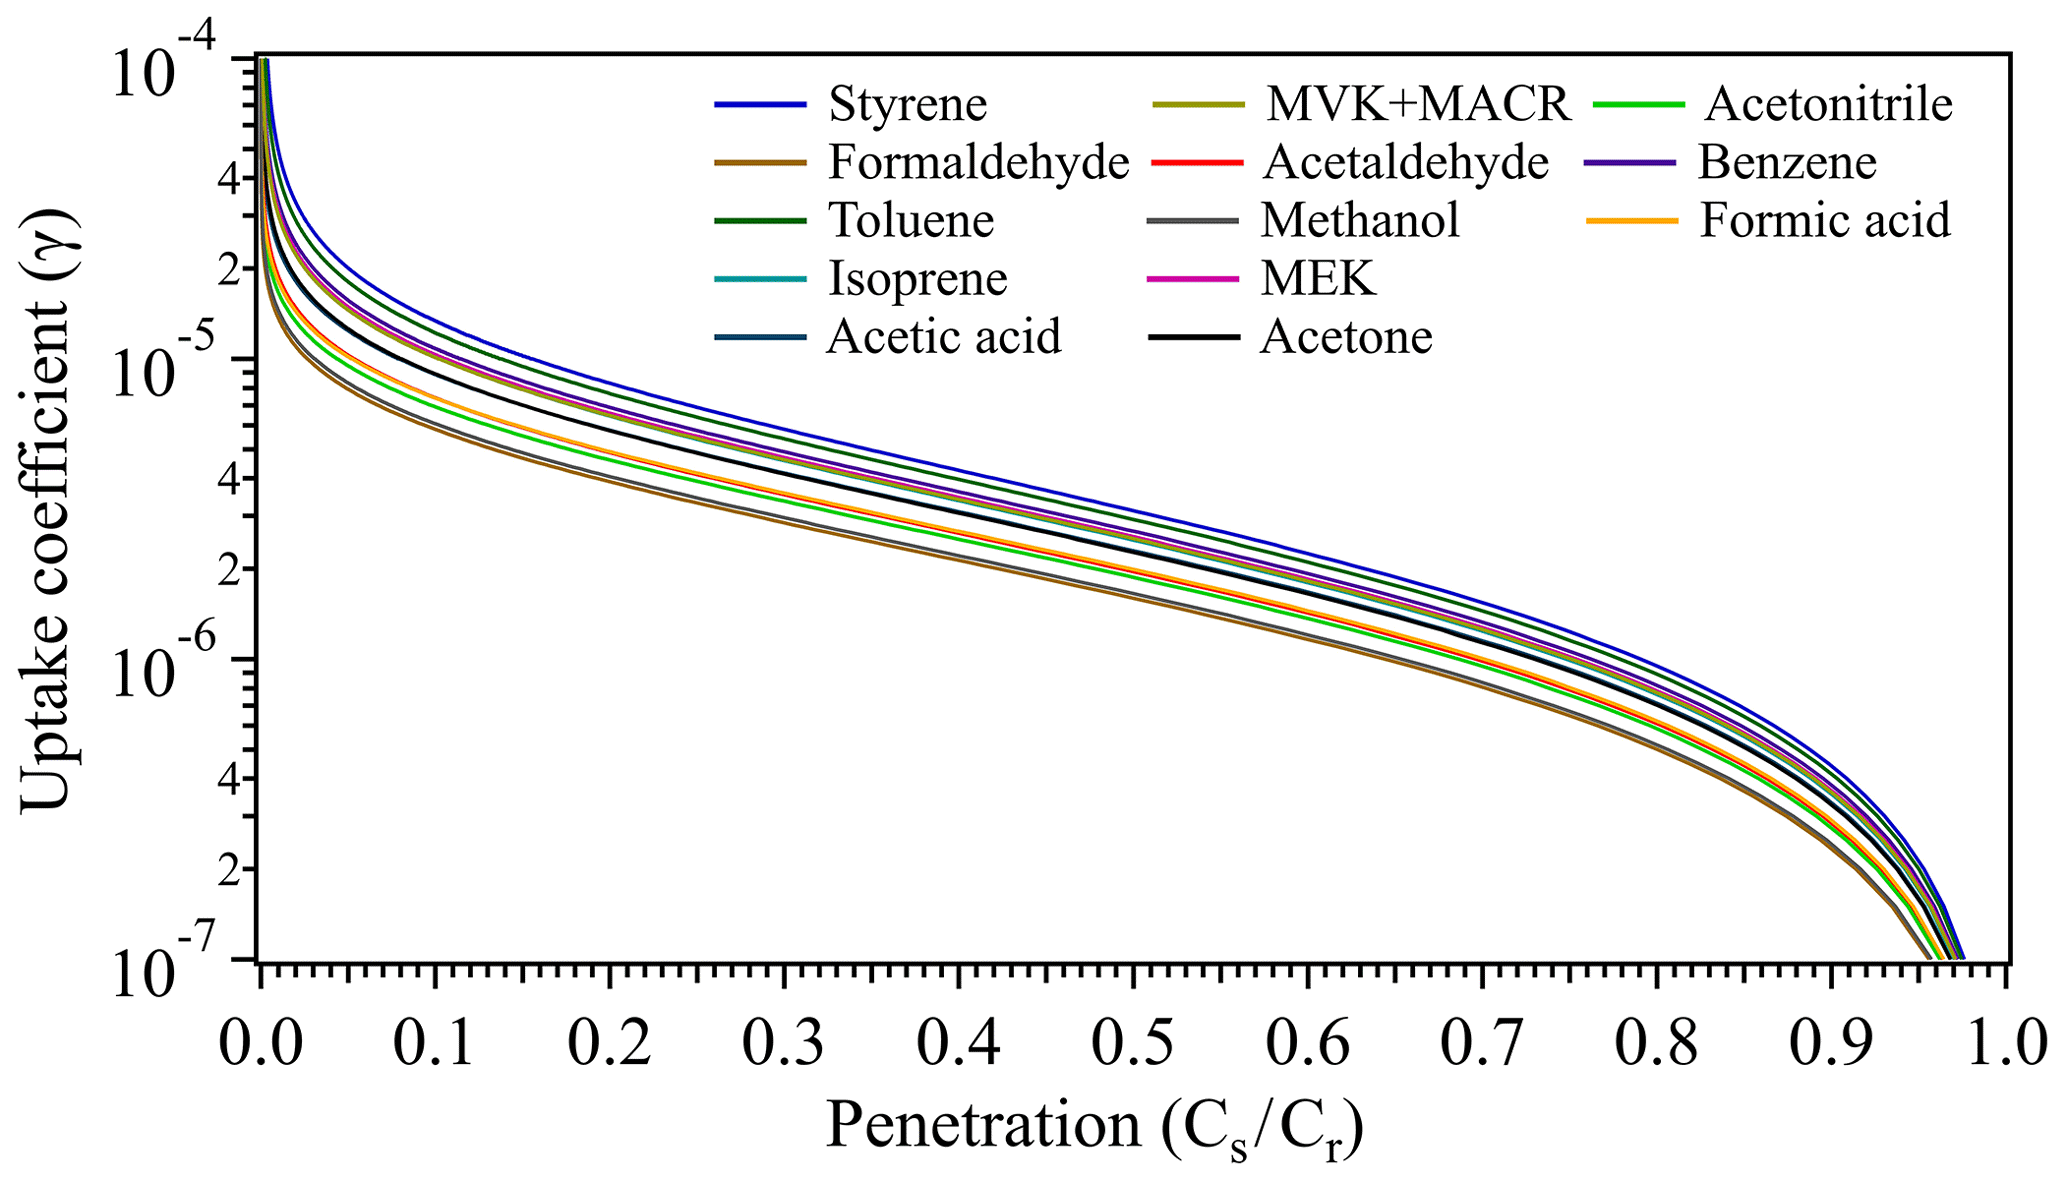
Figure 2Schematic of the uptake coefficients versus the penetrations of measured VOC species. Derivation of the uptake coefficients are based on the experimental parameters: volumetric flow rate F=0.1 L min−1 at 1 atm and 298 K; coated-wall flow tube dimension, d=1.6 cm, L=10 cm.
The primary controlling factors of VOC exchange at the soil–atmosphere interface include gas transport and the concentration gradient between the soil surface and the atmosphere. As depicted in Fig. 3, the transport of a gas species to soil surfaces is governed by three resistances in series: the aerodynamic resistance Ra, the quasi-laminar layer resistance Rb and the soil surface resistance Rc (Seinfeld and Pandis, 2016). The deposition or transfer velocity Vd is the inverse of the sum of these three resistances (Seinfeld and Pandis, 2016). With the coated-wall flow tube technique employed in this study, the derived γ reflects the reaction kinetics on soil and thus relates to Rc rather than Ra and Rb. Based on the calculated γ, Rc can be further derived according to the equation (Donaldson et al., 2014b; Dentener et al., 1996), where ω denotes the mean molecular speed of the VOC species. Approximations of Ra and Rb can be achieved using the methodology developed by Seinfeld and Pandis (2016), i.e., Ra and Rb can be derived based on Eqs. (1) and (2), respectively.
where κ is the von Karman constant, u∗ is the friction velocity, z is the height above the ground, z0 is the roughness length and Sc is the dimensionless Schmidt number.
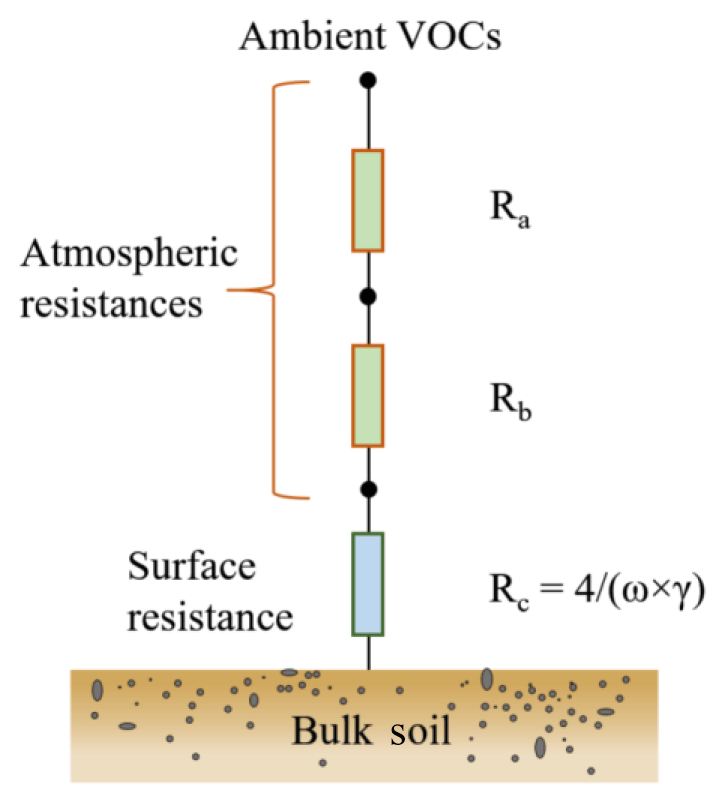
Figure 3Schematic of the resistance model for VOC species dry deposition on soil. Ra: aerodynamic resistance; Rb: quasi-laminar layer resistance; Rc: soil surface resistance.
For the basic assumptions and utilized parameters during derivations of Ra and Rb, see Sect. 3.2. Finally, Vd can be estimated as .
3.1 Site-specific characteristics of selected air quality indicators
Figure 4 shows the time series of site-specific ambient air pollutant mixing ratios observed during the whole measurement period (Fig. 4a) and respective mean diel courses (Fig. 4b). The range of mixing ratios of selected air quality indicators like ozone (O3), carbon monoxide (CO), nitrogen oxide (NO), nitrogen dioxide (NO2) and sulfur dioxide (SO2) are representative of polluted urban conditions (Bigi and Harrison, 2010). O3 reveals peak mixing ratios in the afternoon (13:00–17:00 local time), which corresponds to high sunlight intensities and temperatures at this time of the day. Coincident with this maximum in O3, reactive nitrogen species (NO2 and NO) show decreasing trends, which may be due to decreased local NOx emissions and/or rapid photochemical oxidation or strong dilution in the boundary layer in the afternoon. Even though most of the selected air quality indicators reveal a significant diel cycle, CO, NO and NO2 do not show a typical urban rush-hour pattern with traffic-associated peaks during morning and late afternoon. Rather, the site represents an urban background site without direct influences from strong nearby point sources. The relatively weak diel course of SO2 mixing ratios with maxima during daytime can also be assumed to stem from long-range advection or midday entrainment of high-concentration air masses from aloft, instead of the nearby presence of ground-level emission sources (Bigi and Harrison, 2010).
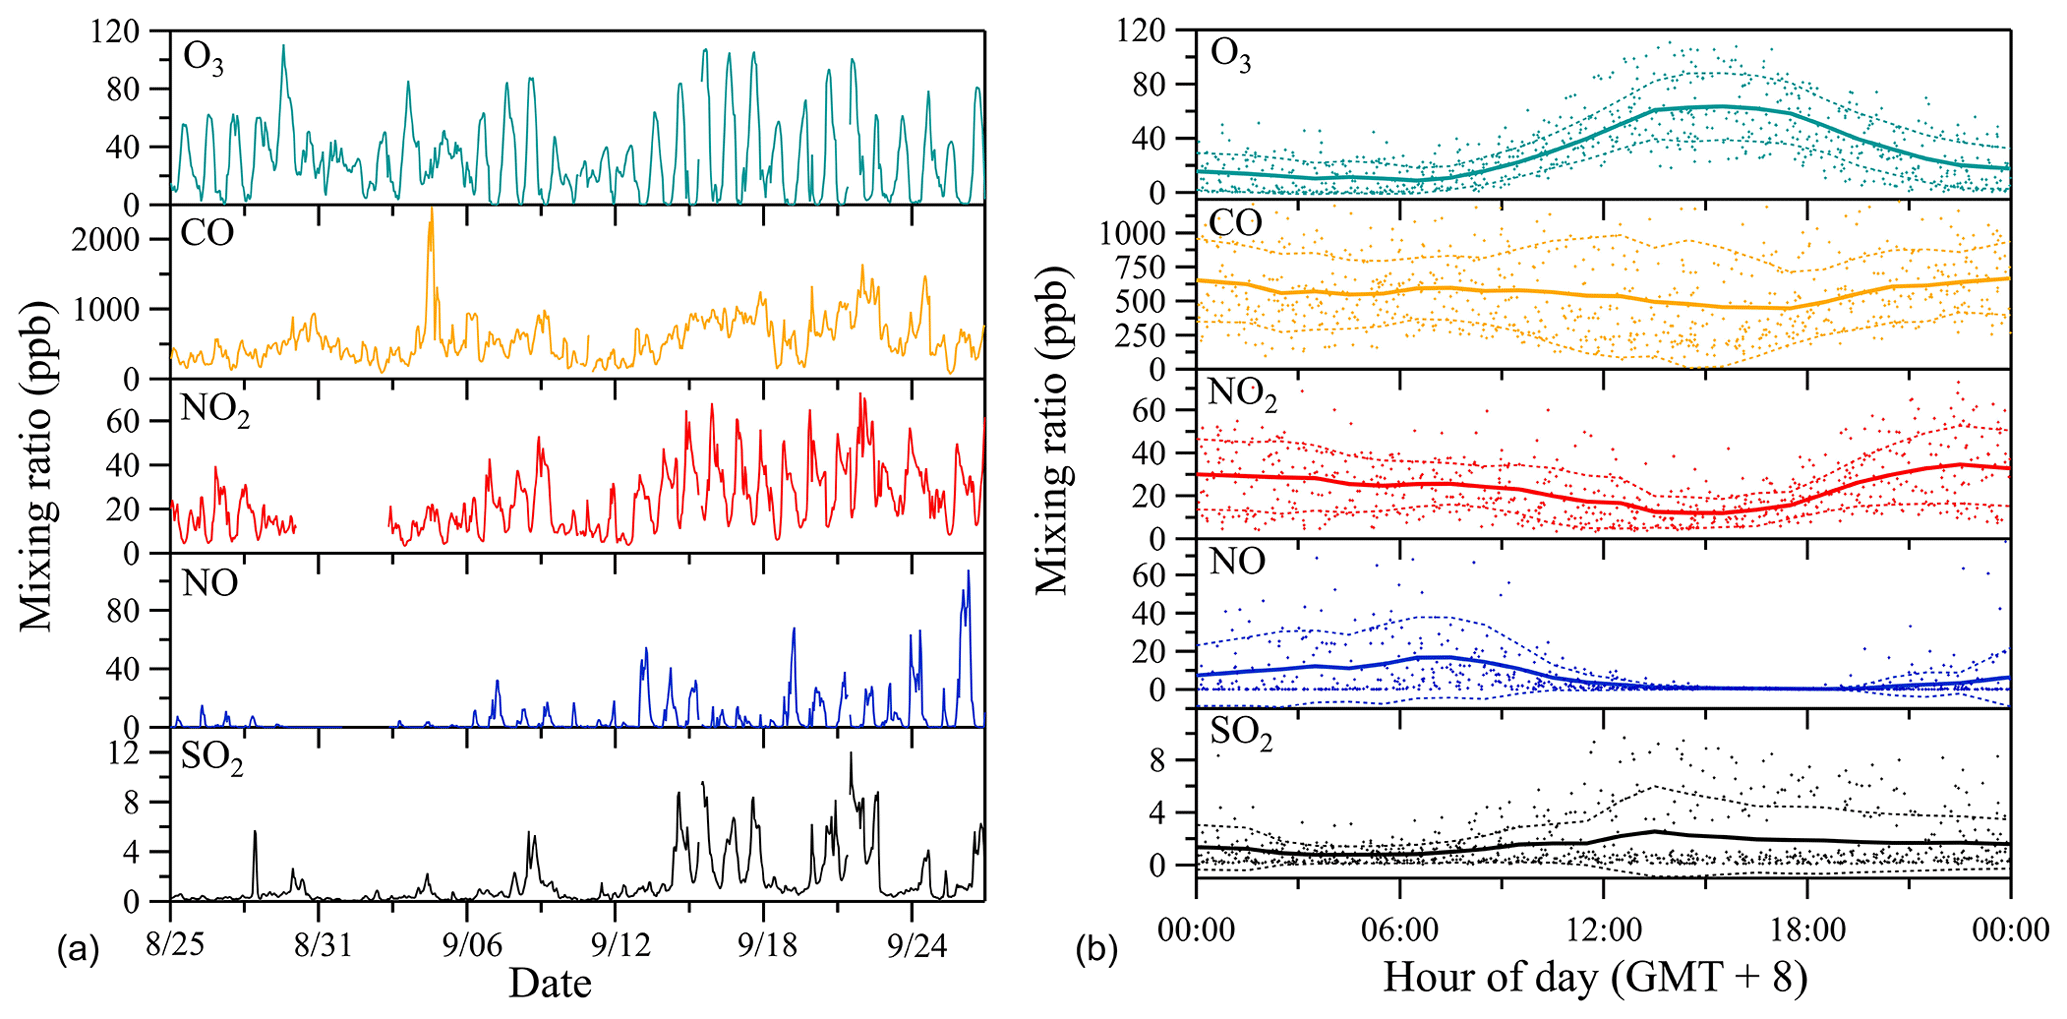
Figure 4Time series of observed ambient air mixing ratios of prominent gas-phase pollutants (a) and respective mean diel courses (b). In (b), symbols denote individual hourly averaged data, and the thick solid lines respective mean diel profile. Thin dashed lines represent 1 standard deviation (±1 SD) from the mean value.
3.2 Site-specific characteristics and exchange of VOCs
Figure 5 displays the time series of site-specific ambient air mixing ratios of VOCs, temperature, relative humidity during the whole measurement period (Fig. 5a) and respective mean diel courses (Fig. 5b). Among the measured VOC species, methanol has the highest mixing ratios (Fig. 5a). Methanol is ubiquitous in the lower atmosphere with mixing ratios in remote regions reported to be ∼1 ppb (Galbally and Kirstine, 2002; Jordan et al., 2009). The high mean daytime mixing ratios of 10–20 ppb at this urban background site suggest a strong impact of anthropogenic emissions on the local methanol budget. High mixing ratios are also found for its oxidation products formaldehyde (∼10 ppb) and formic acid (∼5 ppb), respectively. Formaldehyde is a key reaction intermediate of the atmospheric oxidation cycle (Li et al., 2016), and hence an indicator of the total amount of oxygenated VOCs. Its increasing trend during daytime (Fig. 5b) is indicative of strong photochemical formation. In contrast, formic acid, which can be formed from ozonization of all terminal double-bonded molecules (Osamu et al., 1994), shows lower mixing ratios during daytime than during nighttime, and similar diel trends are also found for other species including toluene, methanol, acetonitrile and benzene. The daytime decrease in the latter may be due to dilution effects by increased daytime boundary layer mixing height and/or lower atmospheric photochemical formation rates during daytime, even though some of them (e.g., formic acid) have smaller photolysis and oxidation loss rates than those of formaldehyde. On the other hand, the most significant diel profile is observed for isoprene, with mixing ratios peaking in the midafternoon (around 15:00, local time) followed by a decline in the late afternoon stabilizing at ∼0.5 ppb during the night. Isoprene can have an important impact on the atmospheric oxidation capacity due to its high OH reactivity both in pristine and in polluted urban regions (Williams et al., 2016). Besides anthropogenic sources like gasoline and diesel traffic exhaust (Borbon et al., 2001; Wang et al., 2013; Wagner and Kuttler, 2014), the major summertime source of isoprene can be assumed to be biogenic, i.e., being emitted from vegetation in a light- and temperature-dependent manner (Guenther et al., 1993). Thus, during daytime, high mixing ratios of biogenic isoprene are anticipated at our measurement site, which was surrounded by different types of vegetation cover (see Sect. 2.2). Following the diel trend of isoprene, the two primary photochemical oxidation products of isoprene, methyl vinyl ketone (MVK) and methacrolein (MACR), also exhibit higher mixing ratios during daytime than during nighttime.
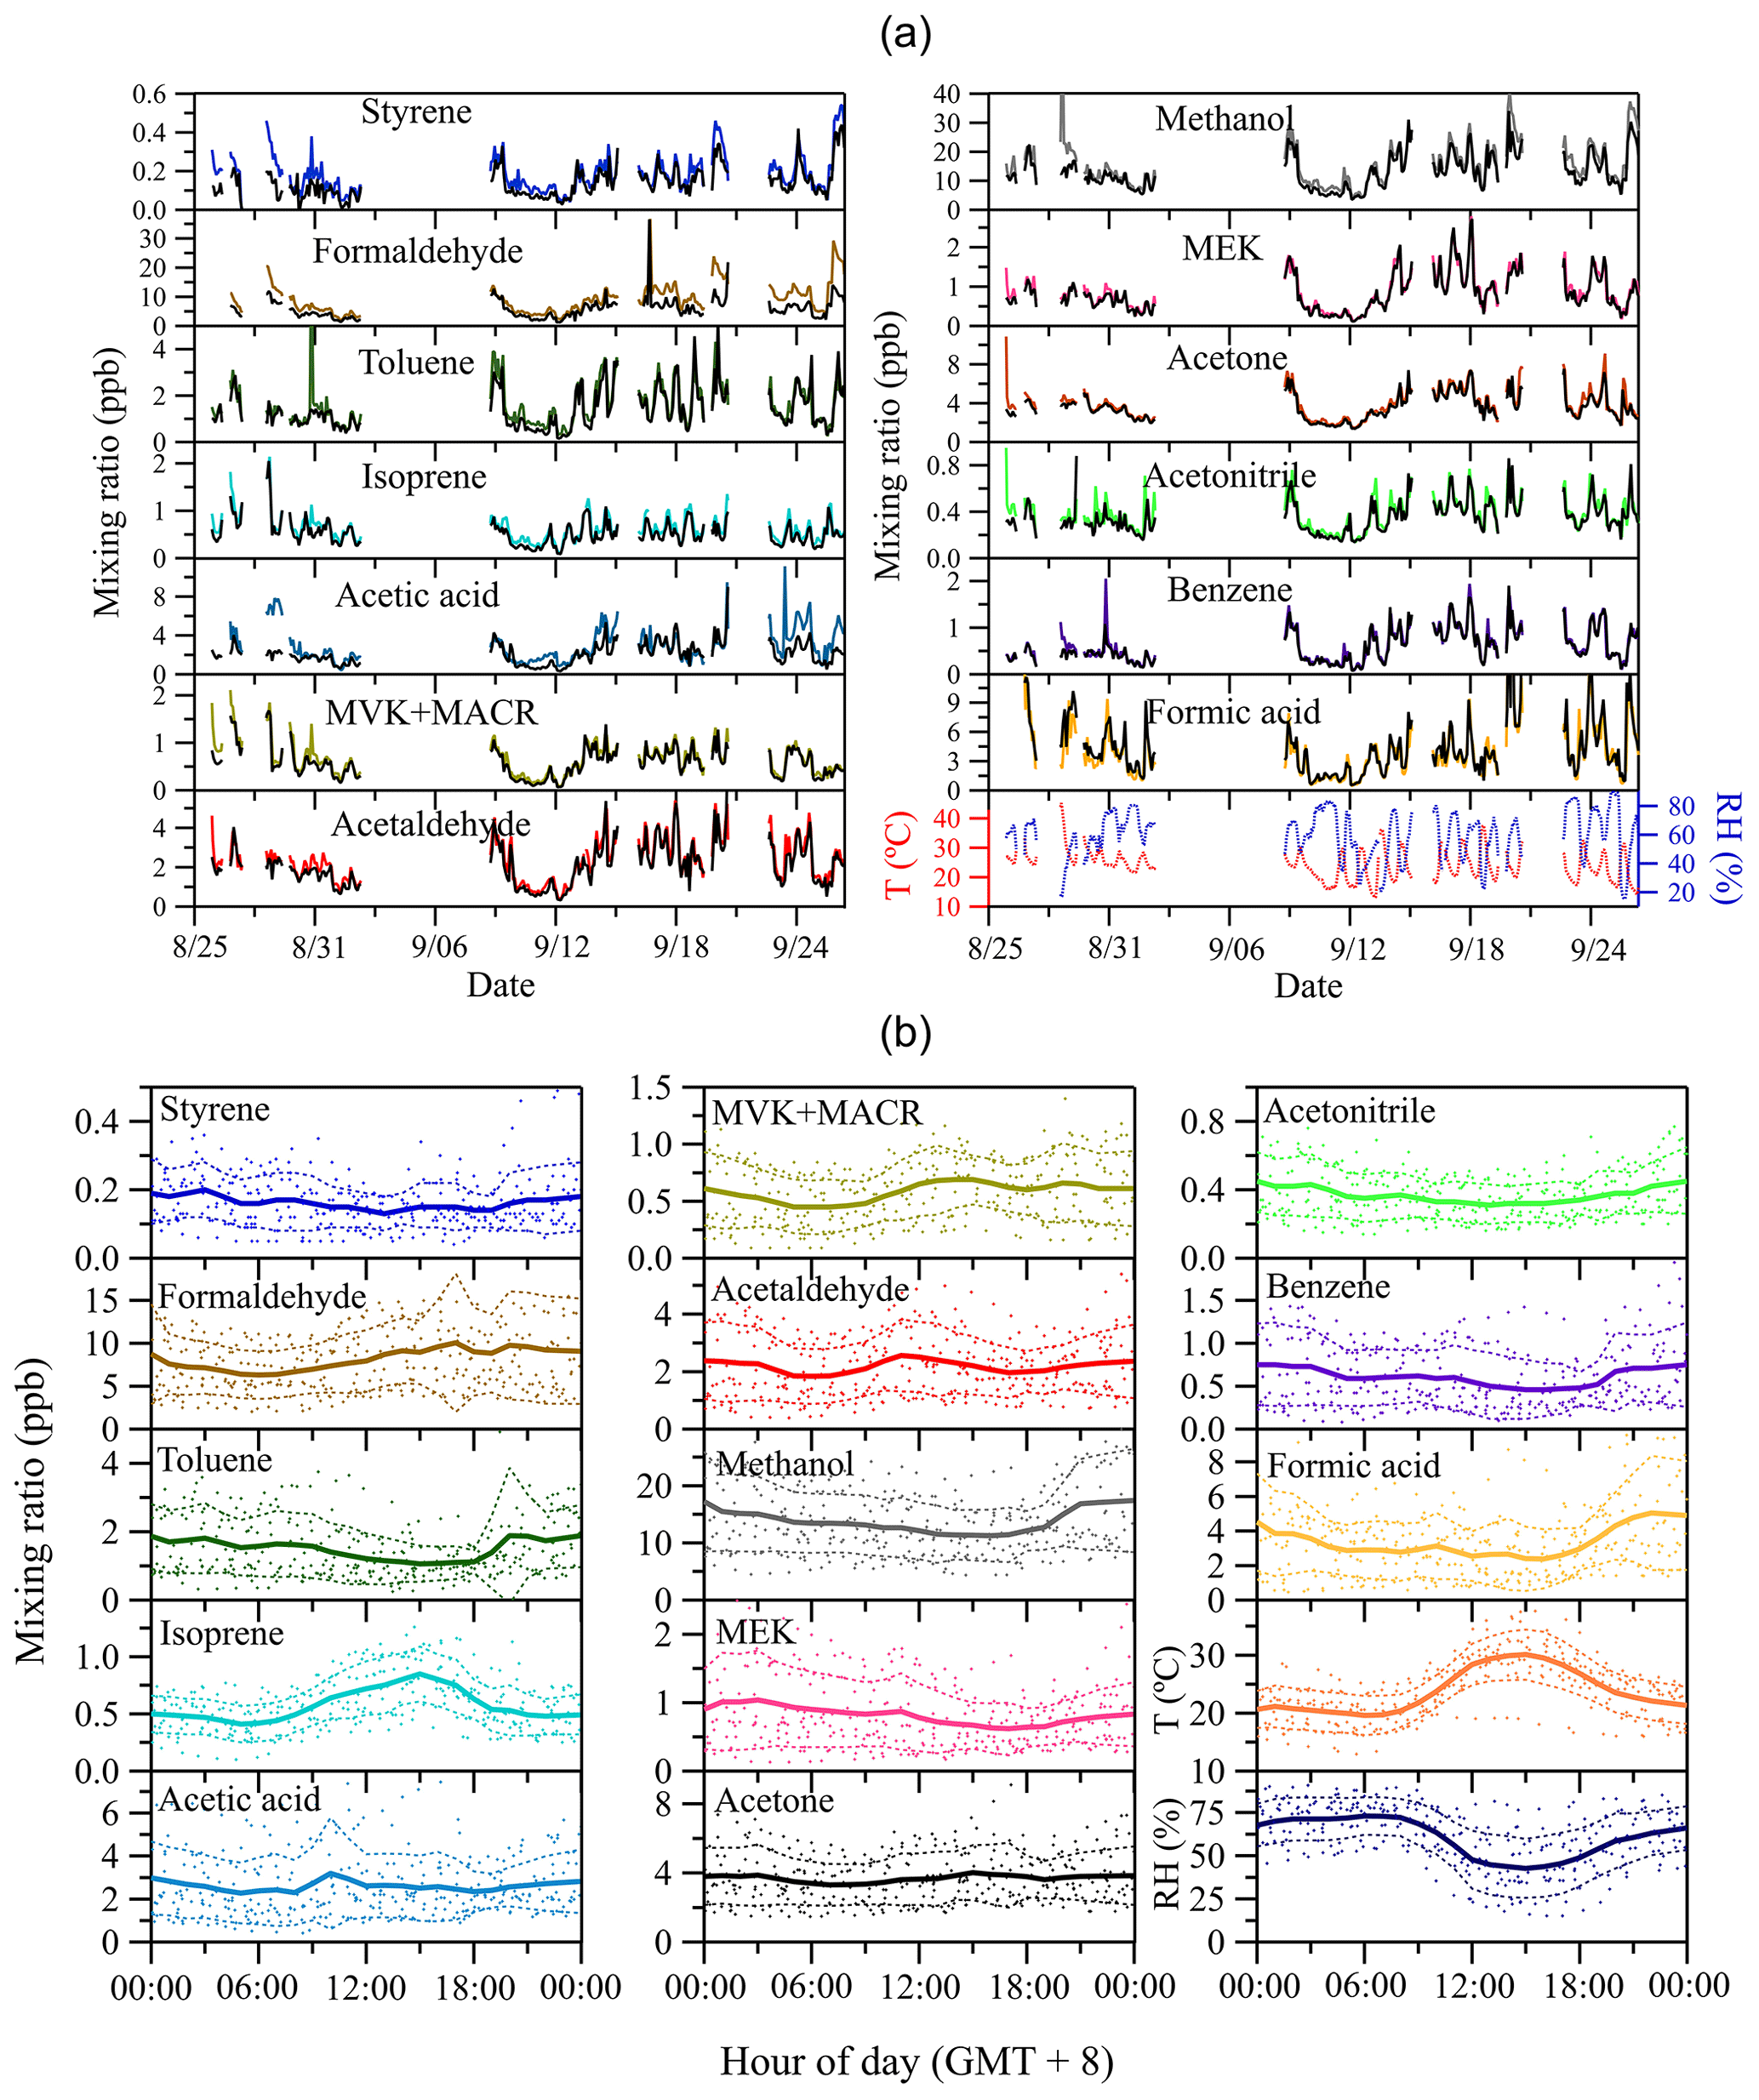
Figure 5Time series of observed ambient air mixing ratios of VOCs and air temperature and relative humidity (a), and respective mean diel courses (b). Colorful lines in (a) denote ambient air mixing ratios at the outlet of the reference tube Cr, and black lines represent mixing ratios at the outlet of the sample tube Cs. In (b), symbols denote individual hourly averaged data, and the thick solid lines respective mean diel profile. Thin dashed lines represent 1 standard deviation (±1 SD) from the mean value.
Besides primary or secondary surface sources and sinks, the near-ground nighttime increase (or decrease) of atmospheric trace gas mixing ratios is favored by the development of a stable and shallow nocturnal boundary layer (NBL). Any nighttime emission (or deposition) of trace constituents is confined to the relatively small volume of the NBL where they accumulate (or get depleted). The growth of the atmospheric boundary layer (ABL) in the morning hours due to the influx of sensible and latent heat, as well as the resulting upcoming convection and the respective re-entrainment of air from the residual boundary layer aloft, being enriched with (or depleted of) atmospheric trace constituents, may confer a reasonable explanation for any increased (or reduced) daytime mixing ratios (Kuhn et al., 2002).
The exchange properties of VOCs on soil can be reflected by comparing Cr (colorful lines in Fig. 5a) and Cs (black lines in Fig. 5a). The confidence bands (best estimate ± measurement uncertainties) of Cr and Cs for each species can be found in Fig. S2 in the Supplement. As shown in Fig. 5a, during the whole measurement period most of the VOC species are taken up by the soil, especially for styrene, formaldehyde, toluene and acetic acid, indicated by the discernable differences between their Cr and Cs. Only formic acid shows a slightly higher Cs than Cr, suggesting this compound is likely emitted by the soil. The time series of the mixing ratio difference Cr–Cs of measured VOCs are further displayed in Fig. S3 in the Supplement. The integrated total amount and average surface flux of each absorbed or emitted VOC species on soil for the whole measurement period is listed in Table S1 in the Supplement.
3.3 Time series and mean diel courses of VOC exchange
Based on the measured Cr and Cs, the uptake coefficients of examined VOC species can be derived (see Sect. 2.3). To minimize potential impacts of measurement uncertainties (e.g., random noise of the instrument) on small Cr–Cs (or large Cs∕Cr) and further on the derived uptake coefficients, the calculated hourly uptake coefficients (based on the measured hourly mixing ratio data) were averaged to a daily basis (i.e., daily mean uptake coefficients). Figure 6a shows the time series of daily mean VOC uptake coefficients, together with those of ambient temperature and relative humidity. Eight species (i.e., styrene, toluene, isoprene, MVK+MACR, acetaldehyde, MEK, acetone and acetonitrile) exhibit a relatively high initial uptake coefficient, followed by a significant decrease in the first few days, indicative of progressive saturation of absorption sites on the pretreated soil sample. For styrene and acetonitrile, this decrease prevails for the whole 1-month measurement period. Occasionally, some species show short-term swaps between deposition and emission (see Fig. S4 in the Supplement for the complete time series of hourly averaged data). This bidirectional exchange can be caused by fast dynamics in ambient air conditions like temperature, relative humidity and trace gas mixing ratio, as well as the respective status of soil saturation. Interestingly, formaldehyde only rarely shows emission from soil, suggesting a strong capacity of the soil sample for absorption under ambient conditions. This result to some extent challenges our previous laboratory-based observation that soil could also act as a source for formaldehyde, when it had been saturated with formaldehyde prior to back-flushing with pure N2, i.e., the uptake of formaldehyde by soil was shown to be reversible (Li et al., 2016). Indeed, the range of formaldehyde mixing ratios observed in Beijing was rather high for most of the time, and extremely rapid changes in the mixing ratio to below a compensation point, as applied in the laboratory study, hardly occurred in the field. On the other hand, the anticipated high levels of oxidants for heterogeneous reactions on the soil under field conditions may foster the chemical conversion/oxidation of formaldehyde, which could prevent its accumulation, saturation and subsequent release (see below). Given the poor understanding of formaldehyde's budget (Jacob, 2000; Wagner et al., 2002), more research is needed to elucidate the exchange behavior of formaldehyde on various types of soils under ambient conditions. In addition, the variability of uptake coefficients of some species (e.g., isoprene, MVK+MACR, acetaldehyde and formic acid) closely follow the trend of ambient relative humidity and temperature, suggesting that these environmental parameters influence the exchange of respective VOC species.
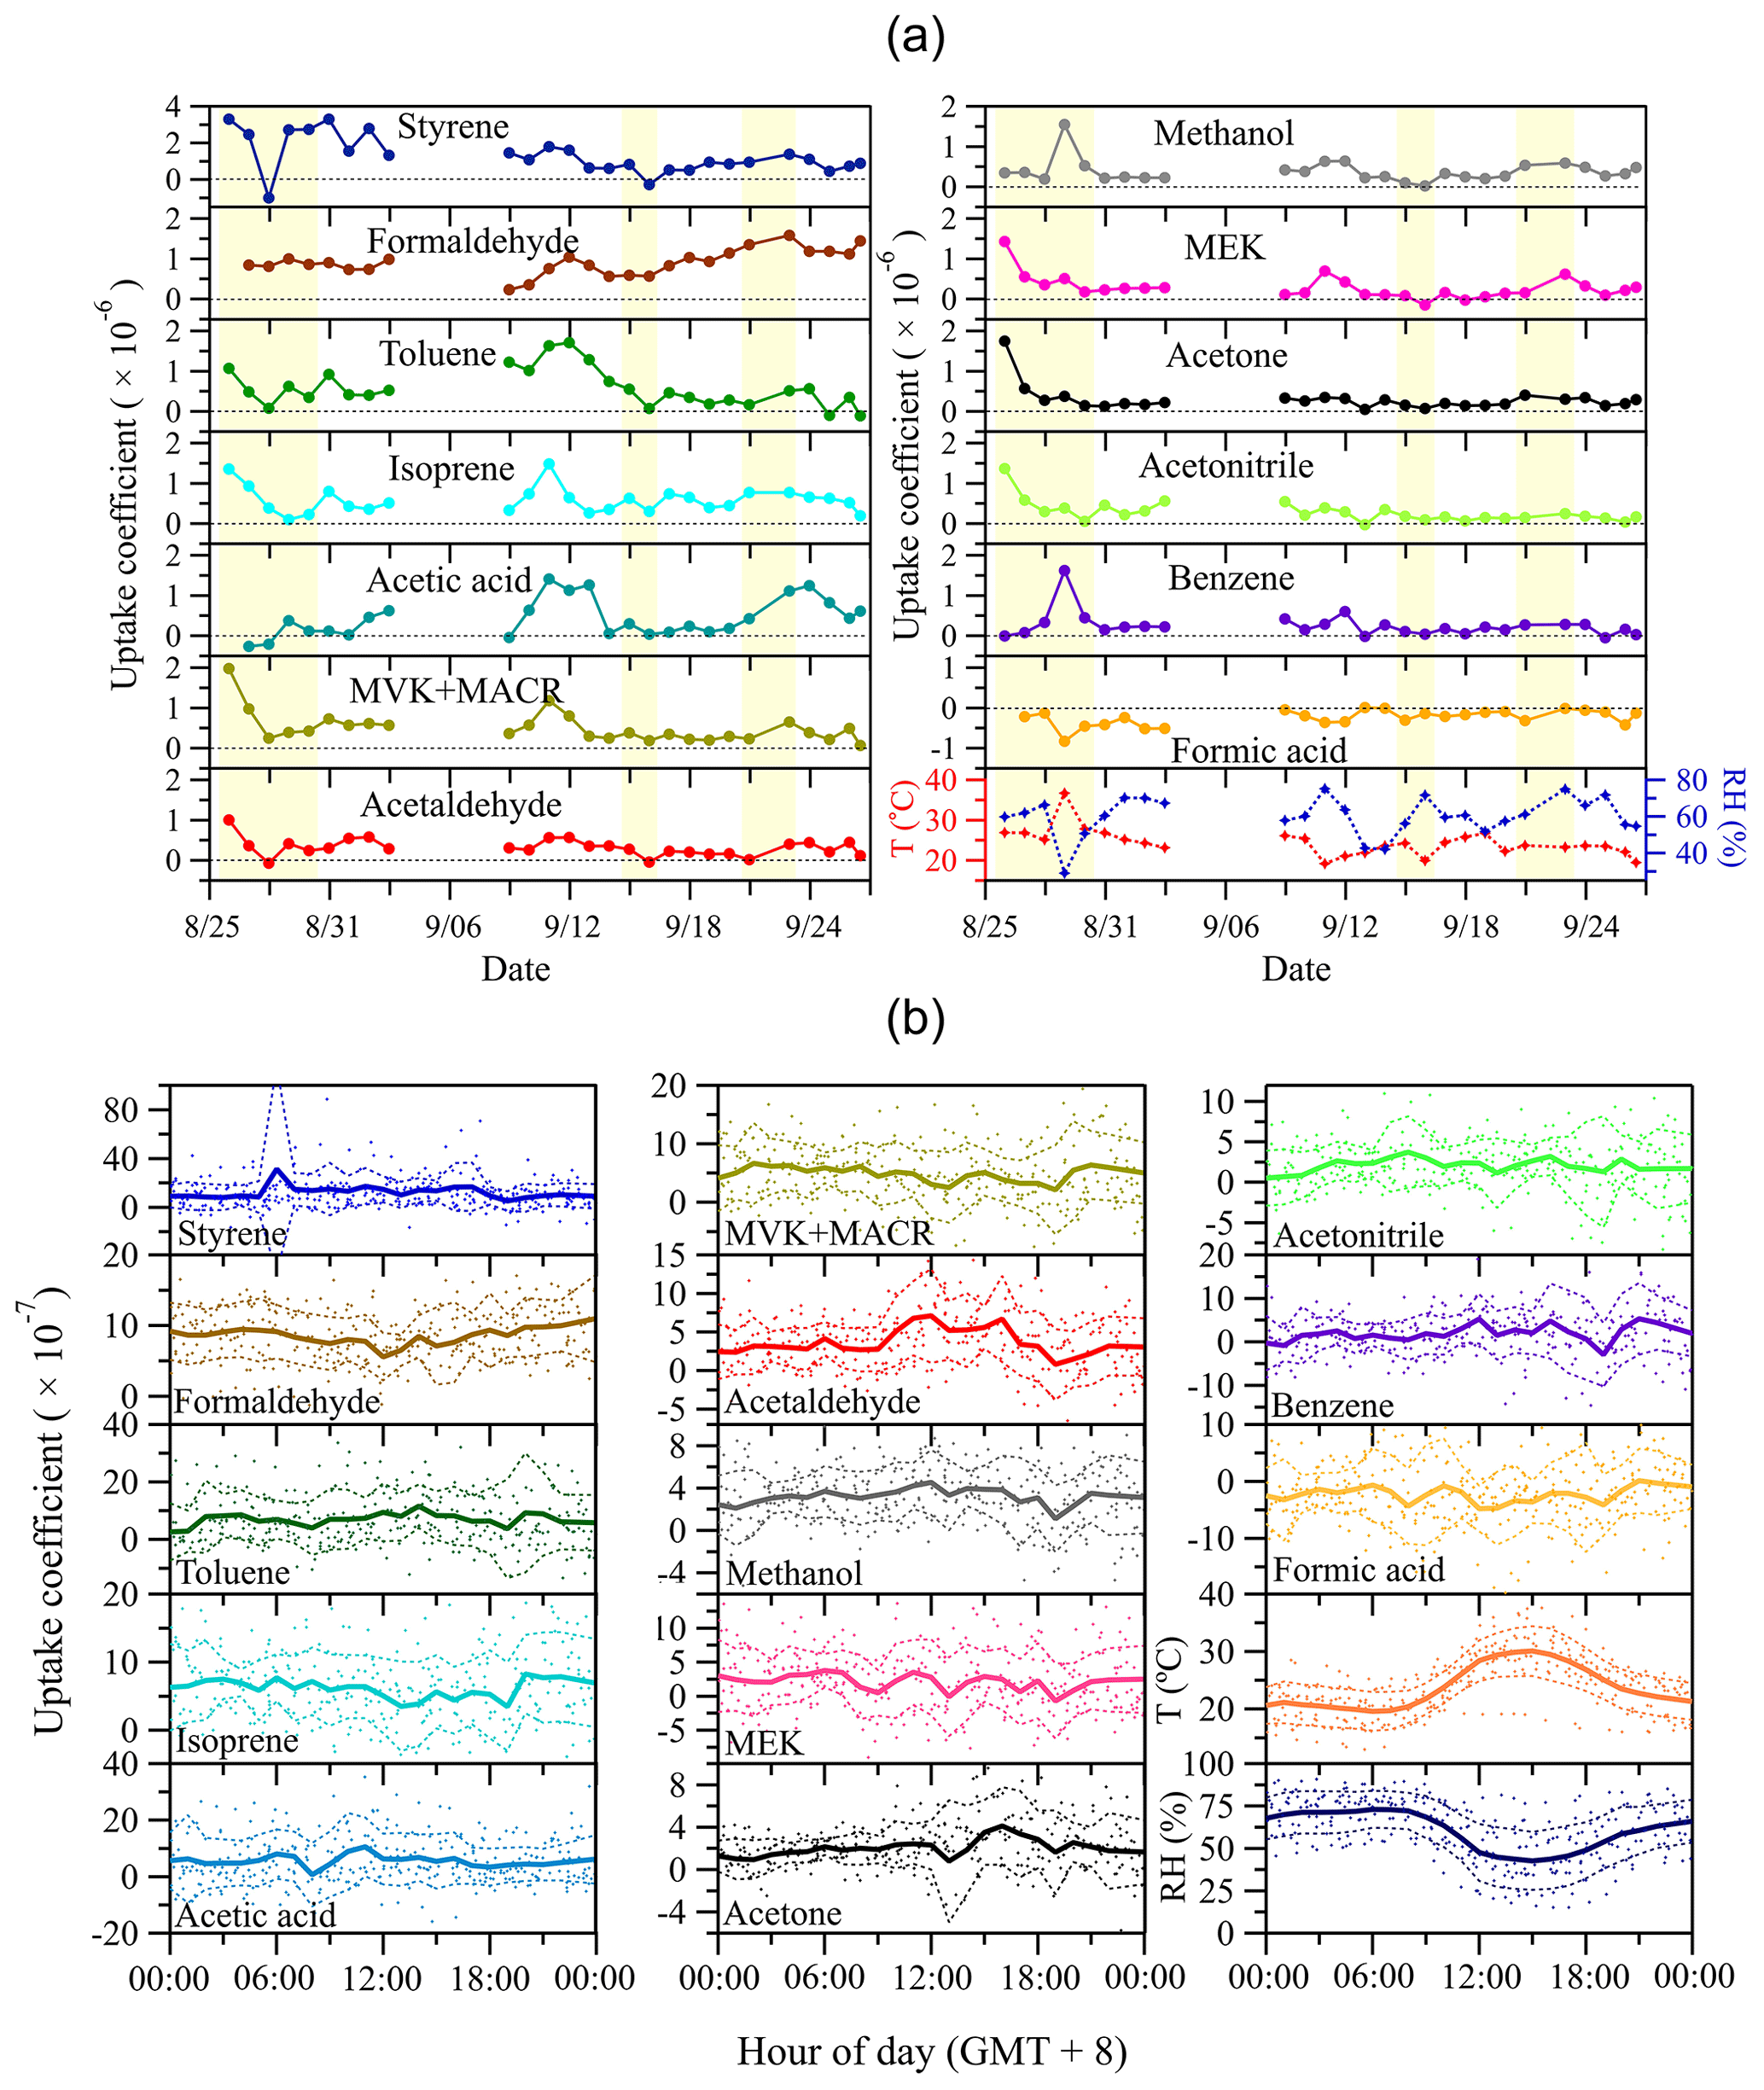
Figure 6Time series of the uptake coefficients of measured VOC species and air temperature and relative humidity (a), and respective mean diel courses (b). In (a), each symbol represents daily averaged data and the yellow shaded areas indicate the days when measurements were not continuously running all day long. In (b), symbols denote individual hourly averaged data, and the thick solid lines respective mean diel profiles. Thin dashed lines represent 1 standard deviation (±1 SD) from mean values.
Mean diel variations of VOC uptake coefficients as well as those of ambient relative humidity and temperature are presented in Fig. 6b. In general, uptake coefficients are quite stable over the whole day.
The observed uptake/emission in Fig. 6 can be caused by pore diffusion and soil surface processes (i.e., adsorption/desorption equilibrium and chemical reactions). As aforementioned, the timescale of VOC diffusion through soil pores is around 25 min. This timescale is several orders less than our whole field campaign time period (i.e., 1 month), suggesting that pore diffusion is not the limiting factor of the uptake/emission found here. After the significant absorption saturation on soil in the first few days (see Fig. 6a), the subsequent relatively stable uptake for most of the VOC species could be due to chemical reactions on soil surfaces. Our previous laboratory study of formaldehyde uptake on soil has proved that the observed uptake is a combination of adsorption/desorption equilibrium and chemical reactions (Li et al., 2016). From a perspective of kinetic gas theory, the derived uptake coefficients can be further used to determine VOC surface reaction rates on soil which are only caused by reactions on soil surfaces instead of diffusion into soil pores under steady-state conditions (i.e., after significant absorption saturation of the soil sample in the first few measurement days in Fig. 6a). The soil surface reaction rate is described as . γ and ω are the daily average uptake coefficients and mean molecular speed (at an average temperature of 298 K) of each VOC species, respectively. [VOC(g)] is the VOC mixing ratio in ambient air (i.e., Cr). Accordingly, the corresponding surface reaction (or wall loss) rate coefficient kw is , equivalent to the inverse of Rc. Note that only formic acid shows negative uptake coefficients for most of the measurement time period, and its emission rate cannot be described by the above reaction rate expression accounting for surface uptake processes. Instead, the soil surface emission rate of formic acid is calculated from a flux point of view, which equates to . F is the volumetric flow rate in the sample tube and S is the geometric surface area of the soil sample. The time series of surface reaction rates are shown in Fig. S5 in the Supplement. kw is shown in Table S3 in the Supplement and further discussed in the following section.
3.4 Exchange of VOCs interpreted in terms of long-term mean uptake coefficients and deposition velocities
Figure 7 shows the averaged uptake coefficients for days with continuous instrumental operation (16 days within the 1-month field measurement) for each VOC species. The vast majority of VOC species reveal positive uptake coefficients, indicating that these species tend to be absorbed and retained or converted into other products in the soil (net soil influx). Highest uptake coefficients are found for styrene and formaldehyde, with mean values on the order of 10−6. The uptake coefficient of formaldehyde is in the same range as reported earlier for laboratory experiments, where sterilized agricultural soil was flushed by pure N2 containing different mixing ratio levels of formaldehyde under varying RH conditions (Li et al., 2016).

Figure 7Box-and-whisker plots of the uptake coefficients of measured VOC species, based on daily averaged data. The 25th, 50th and 75th percentiles and minimum and maximum are indicated by bars, and mean values by squares.
In Fig. 7, only formic acid reveals a negative mean uptake coefficient, which is indicative of emissions from soil (Li et al., 2018). This short-chain organic acid is regarded as one of the terminal products in the oxidation processes of many VOC species present in the atmosphere (Charbouillot et al., 2012). Therefore, the heterogeneous formation from previously adsorbed/absorbed VOCs may confer a reasonable explanation for its accumulation and subsequent release, as is further discussed in the following sections.
As mentioned previously, the long-term mean uptake coefficients can be used to derive the soil surface reaction (or wall loss) rate coefficient kw of each VOC species, which reflects the soil surface exchange properties. Here kw has a unit of centimeters per second (cm s−1) and can be interpreted as a deposition velocity without gas transport resistance (i.e., Ra+Rb) effects (Pöschl et al., 1998). As the initial soil sterilization procedure eliminates potential impacts from soil bacteria, the observed exchange of these VOC species is primarily influenced by physicochemical factors. To have a general understanding of how different physicochemical factors may affect kw, the calculated kw values of each VOC species are listed in Table S3 in the Supplement, together with the basic physicochemical parameters possibly related to the trace gas exchange (i.e., gas-phase reaction rate coefficients with OH radicals and O3, Henry's law constant, vapor pressure and octanol–water partition coefficient). In general, differences in kw found among these species cannot be explained by any of the physicochemical factors alone, which suggests that VOC exchange at the atmosphere–soil interface is a complex multifunctional process.
Deposition velocity Vd is a key parameter used in models to describe trace gas uptake by soils and is the inverse of the sum of three resistances in series: the aerodynamic resistance Ra, the quasi-laminar layer resistance Rb and the soil surface resistance Rc (Fig. 3). As described in Sect. 2.4, only Rc can directly be derived from the calculated uptake coefficients. Ra and Rb are calculated adopting the approach proposed by Seinfeld and Pandis (2016): in Table 2, the case of neutral stable temperature profiles is adopted for Ra calculation (Eq. 19.14 in Seinfeld and Pandis 2016). The season is set to autumn (cropland before harvest). To assess the impact of Ra and Rb on derived Vd, three types of land use categories including shrubs (category 1 in Table 2), urban land (category 2) and barren land (category 3) are selected mimicking our field environmental conditions and soil type characteristics. The detailed parameters adopted for Ra and Rb derivation and the calculated Ra, Rb, Rc and Vd are shown in Table 2. As , the VOC uptake is not limited by atmospheric gas-phase transport (Ra+Rb) or by land use type. Rather the uptake on the soil surface (Rc) is the primary rate-limiting step for dry deposition of these VOC species, even for the largest γ observed in our study. Note that Vd of formic acid intrinsically reveals negative values, as this organic acid is released from the soil.
Table 2Parameters used for resistance calculations to infer the relative importance of Rc versus Ra and Rb, and the resulting deposition velocities (Vd) of measured VOC species.
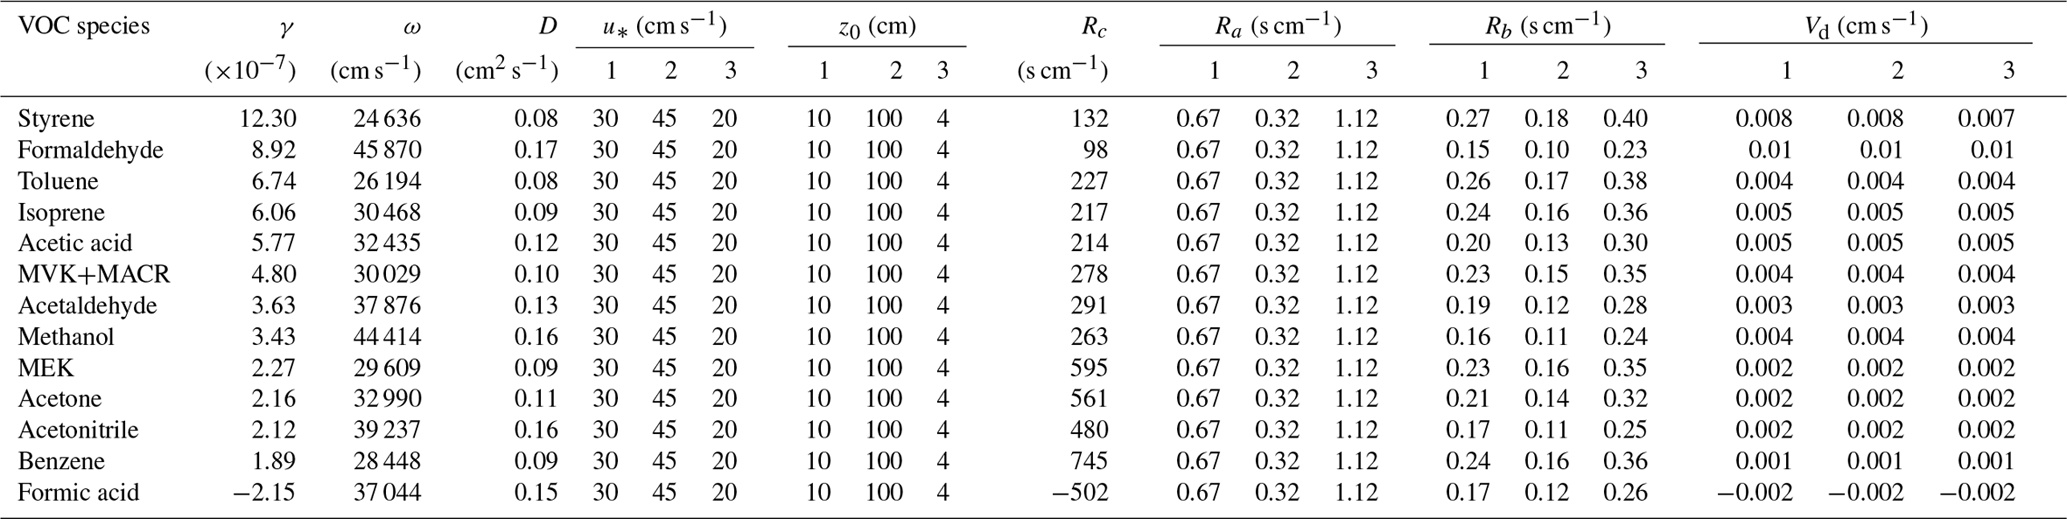
γ: uptake coefficient; ω: mean molecular speed at 25 ∘C; D: molecular diffusion coefficient at 25 ∘C; u*: friction velocity, the listed values are averaged between the day and night cases by Zhang et al. (2003); z0: aerodynamic surface roughness length, the listed values are referred to Zhang et al. (2002); Rc: soil surface resistance; Ra: aerodynamic resistance, calculated using the equation (19.14) in Seinfeld and Pandis (2016), where the reference height z is set to 300 m; Rb: quasi-laminar layer resistance, calculated using the Eq. (19.17) in Seinfeld and Pandis (2016), where the air kinematic viscosity ν is 0.16 cm2 s−1; Vd: deposition velocity. The numbers in the table header denote different land use categories adopted from Zhang et al. (2002, 2003): 1: shrubs; 2: urban; 3: barren land (mostly desert).
Previous VOC exchange studies on various soil types such as agricultural soil, tropical soil, plantation floor and forest understory, etc., have spanned a huge range of Vd with 3 orders of magnitude (0.01–1 cm s−1) for the VOC species investigated here (Hartmann et al., 1991; Karl et al., 2005; Sanhueza et al., 2004; Schade and Custer, 2004; Stickler et al., 2007; Jordan et al., 2009; Schade et al., 2011; Gordon et al., 2014b; Cleveland and Yavitt, 1997). Our calculated Vd (0.001–0.01 cm s−1) is at the very low end of previous studies. This could be due to a variety of reasons:
-
Our soil sample is bare soil without any vegetation cover while previous flux studies included different types of vegetation covers (grass, leaf litter, agricultural crops, etc.), which might significantly alter the measured deposition velocity.
-
Our soil sample is sterilized in order to investigate the physicochemical processes on soil, yet the soil bacteria can significantly modify the VOC exchange, as can be expected based on the previous studies. In fact, several studies have demonstrated that soil bacteria can consume atmospheric VOCs (Misra et al., 1996; Cleveland and Yavitt, 1998; Stacheter et al., 2013; Lynch et al., 2014).
From the physicochemical point of view, low Vd may also arise from competition among different VOC species for surface absorption sites, as has been observed in controlled laboratory studies by Lichtin et al. (1996) for photocatalytic reactions of binary VOC mixtures on TiO2 surfaces. Likewise, interfering effects of O3, OH and NO3 radicals on VOC photocatalytic TiO2 surface reactions were demonstrated (Ao et al., 2004). We assume that this phenomenon is universal for catalytic surfaces and also applies for soil.
To further validate the plausibility of our calculated γ and derived Vd, we calculate the surface resistance, Rc, using a regional-scale numerical model developed by Wesely (Seinfeld and Pandis, 2016; Wesely, 1989), which considered only physicochemical factors affecting gas deposition on ground surface for formaldehyde, acetic acid and acetaldehyde as typical VOC representatives. As a proxy for bare soil properties in the present study, the land use type is set to barren land (mostly desert), and the seasonal category is chosen as autumn (cropland before harvest). All other input parameters are the same as used in the original literature (Wesely, 1989). The model outputs a Rc for formaldehyde of 167 s cm−1, which is in fair agreement with our results (98 s cm−1). Due to a very small effective Henry's law constant adopted in the model (15 M atm−1 for water with near-neutral pH) the derived Rc for acetaldehyde is much higher than that based on our measurements (66 667 vs. 291 s cm−1), corroborating our relatively low range of observed VOC uptake. In contrast, acetic acid bears a much higher effective Henry's law constant (4×10⁶ M atm−1), revealing a much smaller Rc than that based on our measurements (0.3 vs. 214 s cm−1), underpinning the intense impact of VOC physicochemical characteristics on modeled uptake resistances.
3.5 VOC exchange dependence on environmental parameters
In order to explore potential effects of environmental factors on the exchange of these VOC species at the atmosphere–soil interface, the relation between uptake coefficients and ambient relative humidity, temperature and mixing ratio (C) is further examined, and those VOC species showing relatively significant dependencies are shown in Fig. 8. To interpret the uptake coefficient dependence on a single parameter, the others should remain constant. Under ambient conditions, however, all the environmental parameters change simultaneously and some of them are even closely related (e.g., between RH and T; see Fig. 5). Therefore in Fig. 8 we present the RH∕T dependence as the C varies within a narrow range (i.e., this range can be considered constant when compared with the whole variation scope of C during the entire measurement time period). The C range for the species in Fig. 8 is 0.5–0.6 for isoprene, 0.8–1.0 for MVK+MACR, 2.0–6.0 for formic acid, 8.0–12.0 for formaldehyde and 1.5–2.5 for acetaldehyde. These ranges are determined following the criterion of A±B, where A means the 1-month average of the ambient mixing ratios of each species and B is determined by using two criteria.
-
It should be as small as possible.
-
The selected range can provide a data set large enough for plotting the RH∕T dependence box chart. Regarding the C dependence in Fig. 8, the data are only adopted when RH equals 50 %.
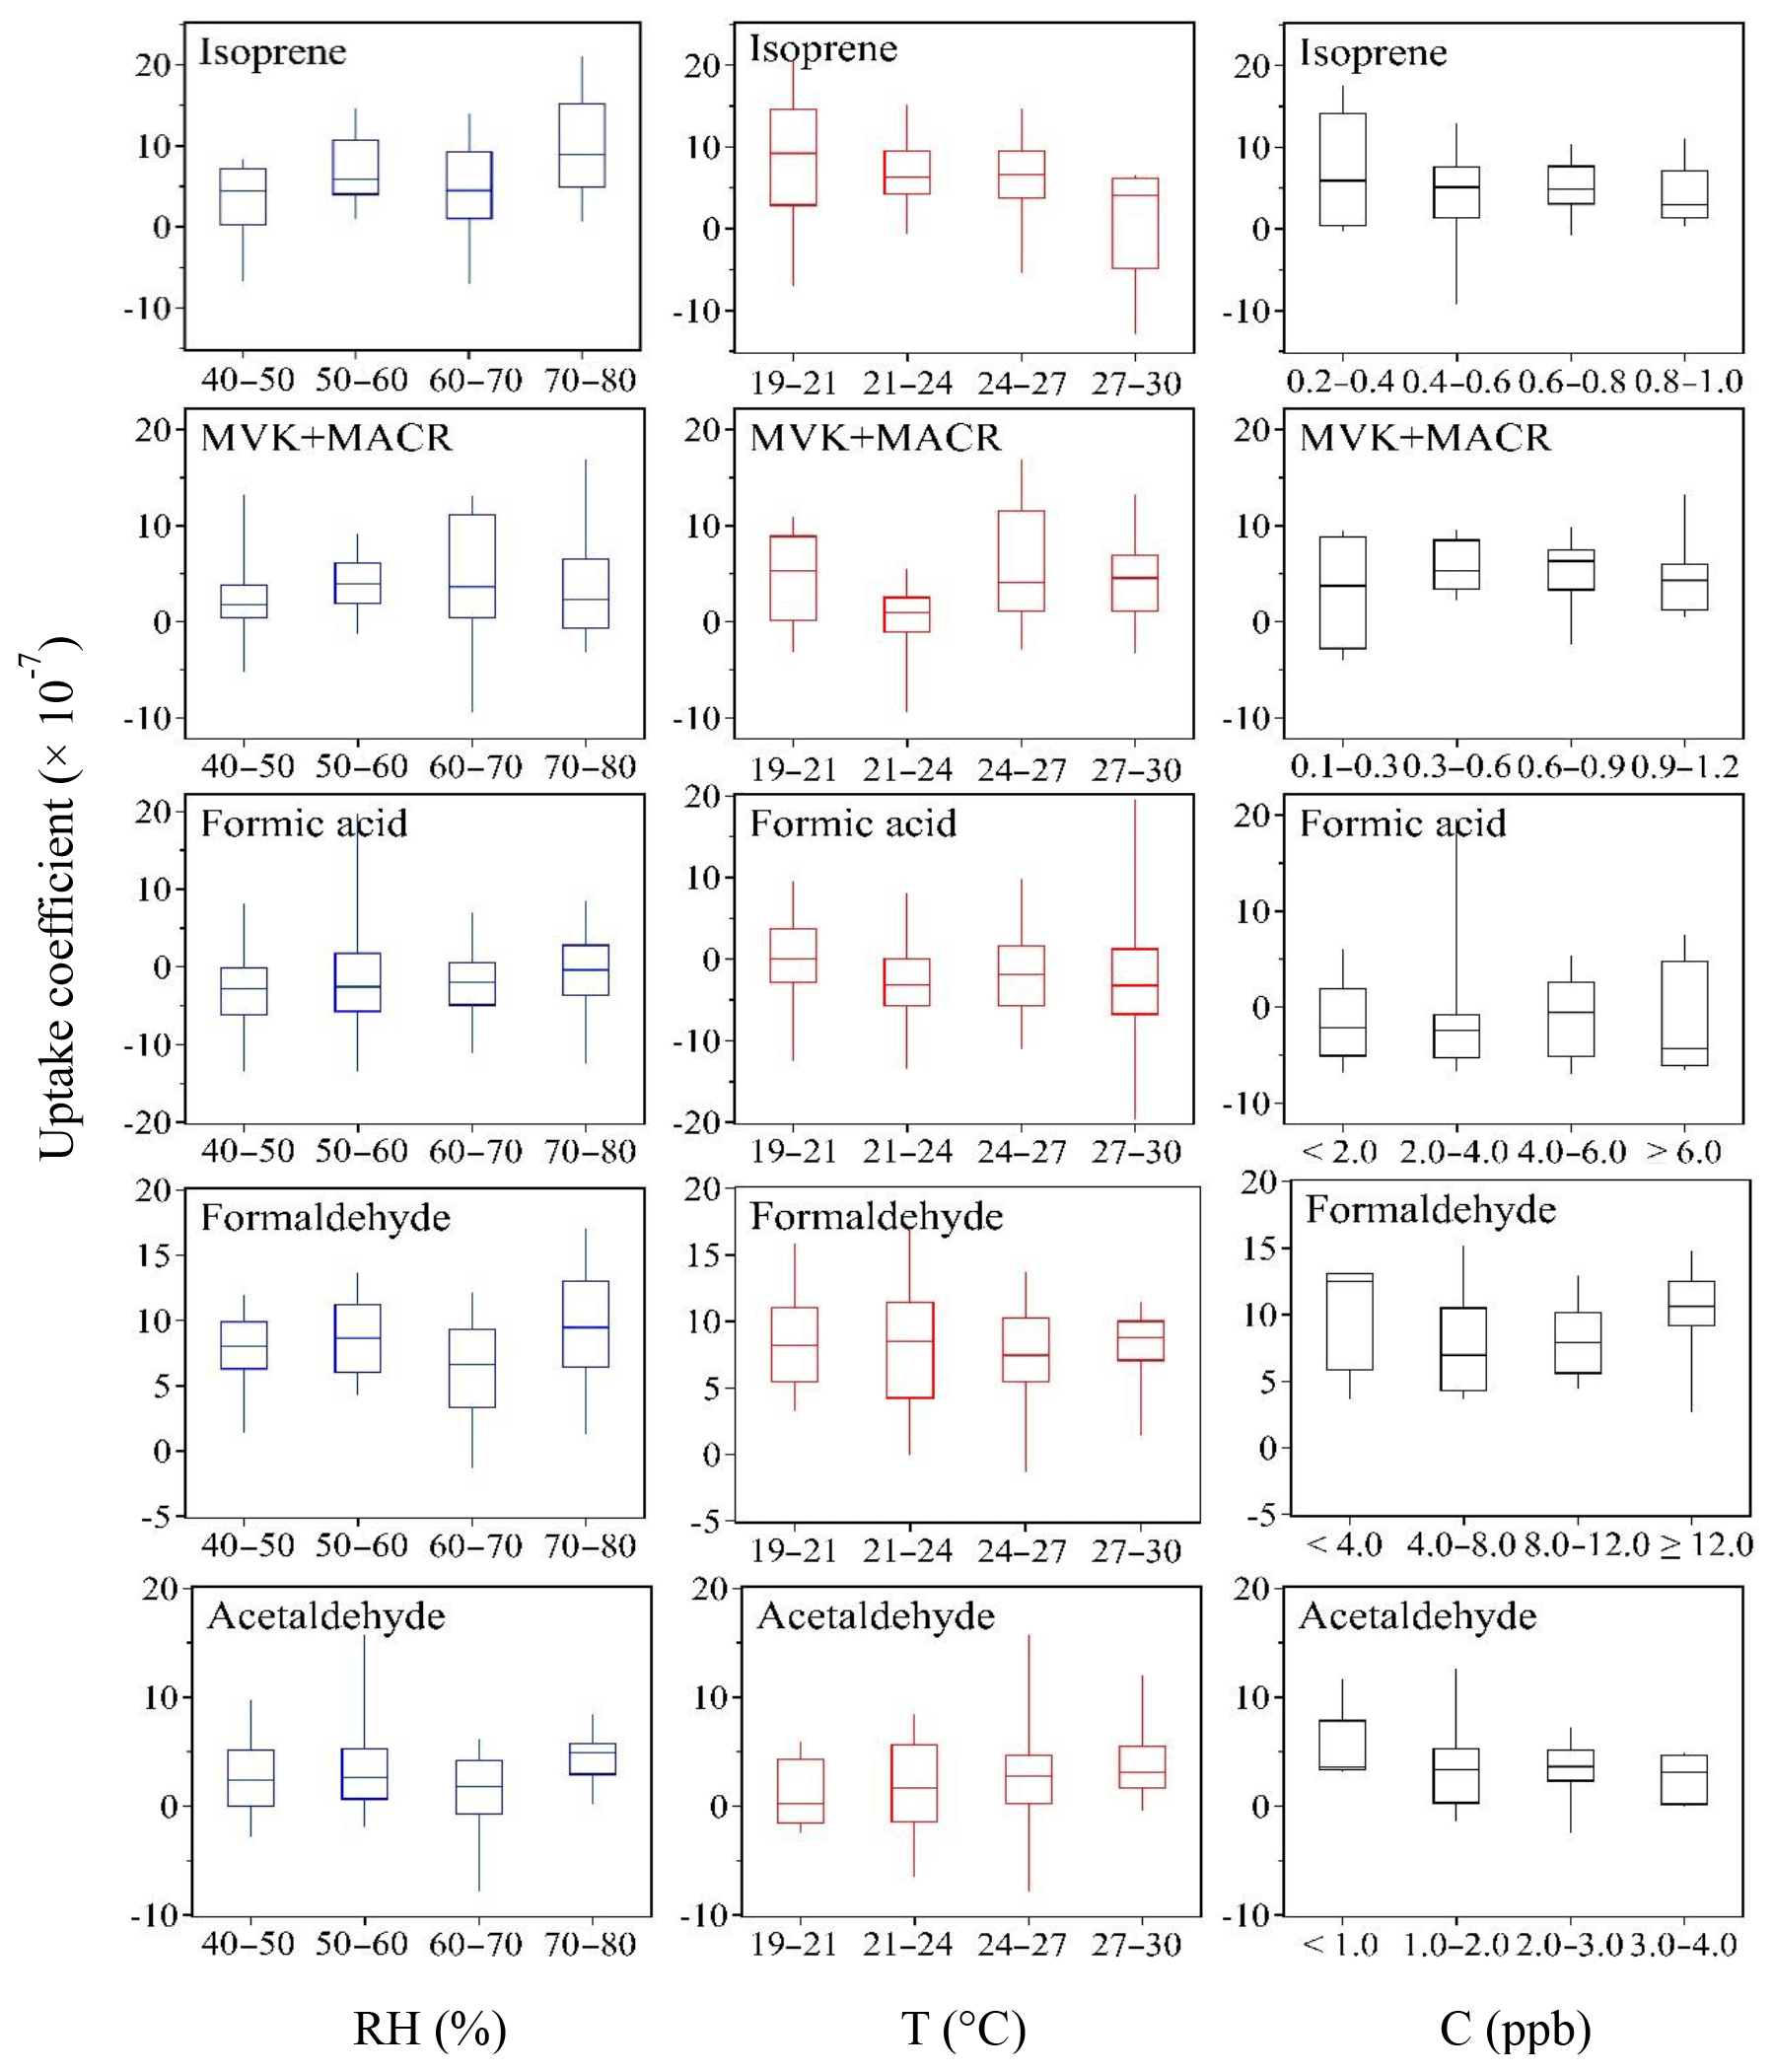
Figure 8Dependence of uptake coefficients on ambient relative humidity (RH), temperature (T) and mixing ratios (C). The 25th, 50th and 75th percentiles and minimum and maximum of the box-and-whisker plots are indicated by bars. The uptake coefficient dependence is based on the hourly averaged data, and the RH and T dependences are plotted when C is varied within a very narrow range (nearly constant) and C dependence is plotted when RH equals 50 %. Note that negative uptake coefficients indicate emission. For details see text.
RH affects the amount of surface-adsorbed water and can accelerate or slow down trace gas uptake rates (Crowley et al., 2010). High-RH-induced condensed water may attract water-soluble or hydrophilic gas species and hence enhance their uptake (Pei and Zhang, 2011), or decrease their net emission. This mechanism applies, for example, to hydrophilic formaldehyde and formic acid (see Table S3 for respective Henry's law constants). On the other hand, more water molecules on soil surfaces tend to repel the hydrophobic species more strongly or reduce gas uptake by means of competitive adsorption effects between water molecules and gas species (Ruiz et al., 1998; Goss et al., 2004; Donaldson et al., 2014a; Li et al., 2016). However, the uptake coefficients of hydrophobic isoprene and its primary degradation products (i.e., MVK+MACR) also increase at high RH. This counterintuitive dependence may also be explained in another way: more water molecules can push more hydrophobic species into the soil bulk, leaving additional adsorption sites on soil surfaces and thereby increasing its uptake; as the soil becomes dry, the VOC molecules in the soil bulk will remain in situ considering that the timescales of soil bulk diffusion are considerably longer than on soil surfaces. From the physical perspective of vapor pressure, increased temperature leads to decreased trace gas uptake and increased emission. This is in line with the decreased uptake of isoprene at higher temperatures shown in Fig. 8. However, the uptake coefficients of acetaldehyde show a slight increasing trend as a function of T.
Even though the calculation of uptake coefficients intrinsically accounts for the gas-phase mixing ratios, higher mixing ratios have been shown to reduce uptake coefficients (Sassine et al., 2010; Wang et al., 2012). A negative effect of increased mixing ratios on uptake coefficients is also observed for isoprene and acetaldehyde in Fig. 8. The negative effect of mixing ratios on uptake coefficients can be understood as competition among the individual VOC molecules for reactive uptake sites, or with other VOCs whose mixing ratios show a simultaneous increase (Li et al., 2016). Our previous laboratory experiments on formaldehyde (Li et al., 2016) showed that this trend was more pronounced under dry conditions (RH = 0 %) than under humid conditions (RH = 40 %), in agreement with the formaldehyde pattern shown here.
3.6 VOC exchange correlation analysis
As discussed above, the uptake dynamics of one individual VOC species may be biased, either (i) by competitive co-absorption of other VOCs or trace gases from ambient air (Lichtin et al., 1996; Ao et al., 2004), (ii) by formation on the soil through heterogeneous conversion of precursor compounds that have been absorbed earlier (Ammann and Pöschl, 2007; Pöschl et al., 2007), or (iii) by depletion of the individual VOC species due to heterogeneous degradation. To explore potential interactions/interference of VOC species among each other, correlation analyses of the exchange rates (i.e., the concentration difference between the reference channel and the sample channel Cr–Cs times the volumetric flow rate F) of measured VOC species are conducted for each pair of species. The results are presented in Fig. 9 in terms of Pearson correlation coefficients, together with the molecular structure of each investigated species. The interplay of sorption, heterogeneous reactions and desorption kinetics of VOCs is complex, and heterogeneous reactions may require time periods from milliseconds to weeks or even months to reach equilibrium (Xing and Pignatello, 1996; Ammann and Pöschl, 2007). Hence, to also account for slow kinetics, the correlation analysis in Fig. 9 is based on daily integrals. VOC exchange rates instead of uptake coefficients are used to allow for a budget approach. Positive correlations are indicated in red colors, and some pairs of VOC species show high positive correlation (deep red color code in Fig. 9), suggesting they have similar exchange characteristics. For example, MVK and MACR are the first-generation oxidation products of isoprene (Jordan et al., 2009). Thus, the observed high correlation coefficient between MVK+MACR and isoprene can be explained by their similar molecular structures, shown in Fig. 9. The same holds for the strong correlation between methanol and formaldehyde, between methanol and acetone, and for MEK and acetone: similar molecular structures and functional groups result in analogous exchange and reaction mechanisms on soil.
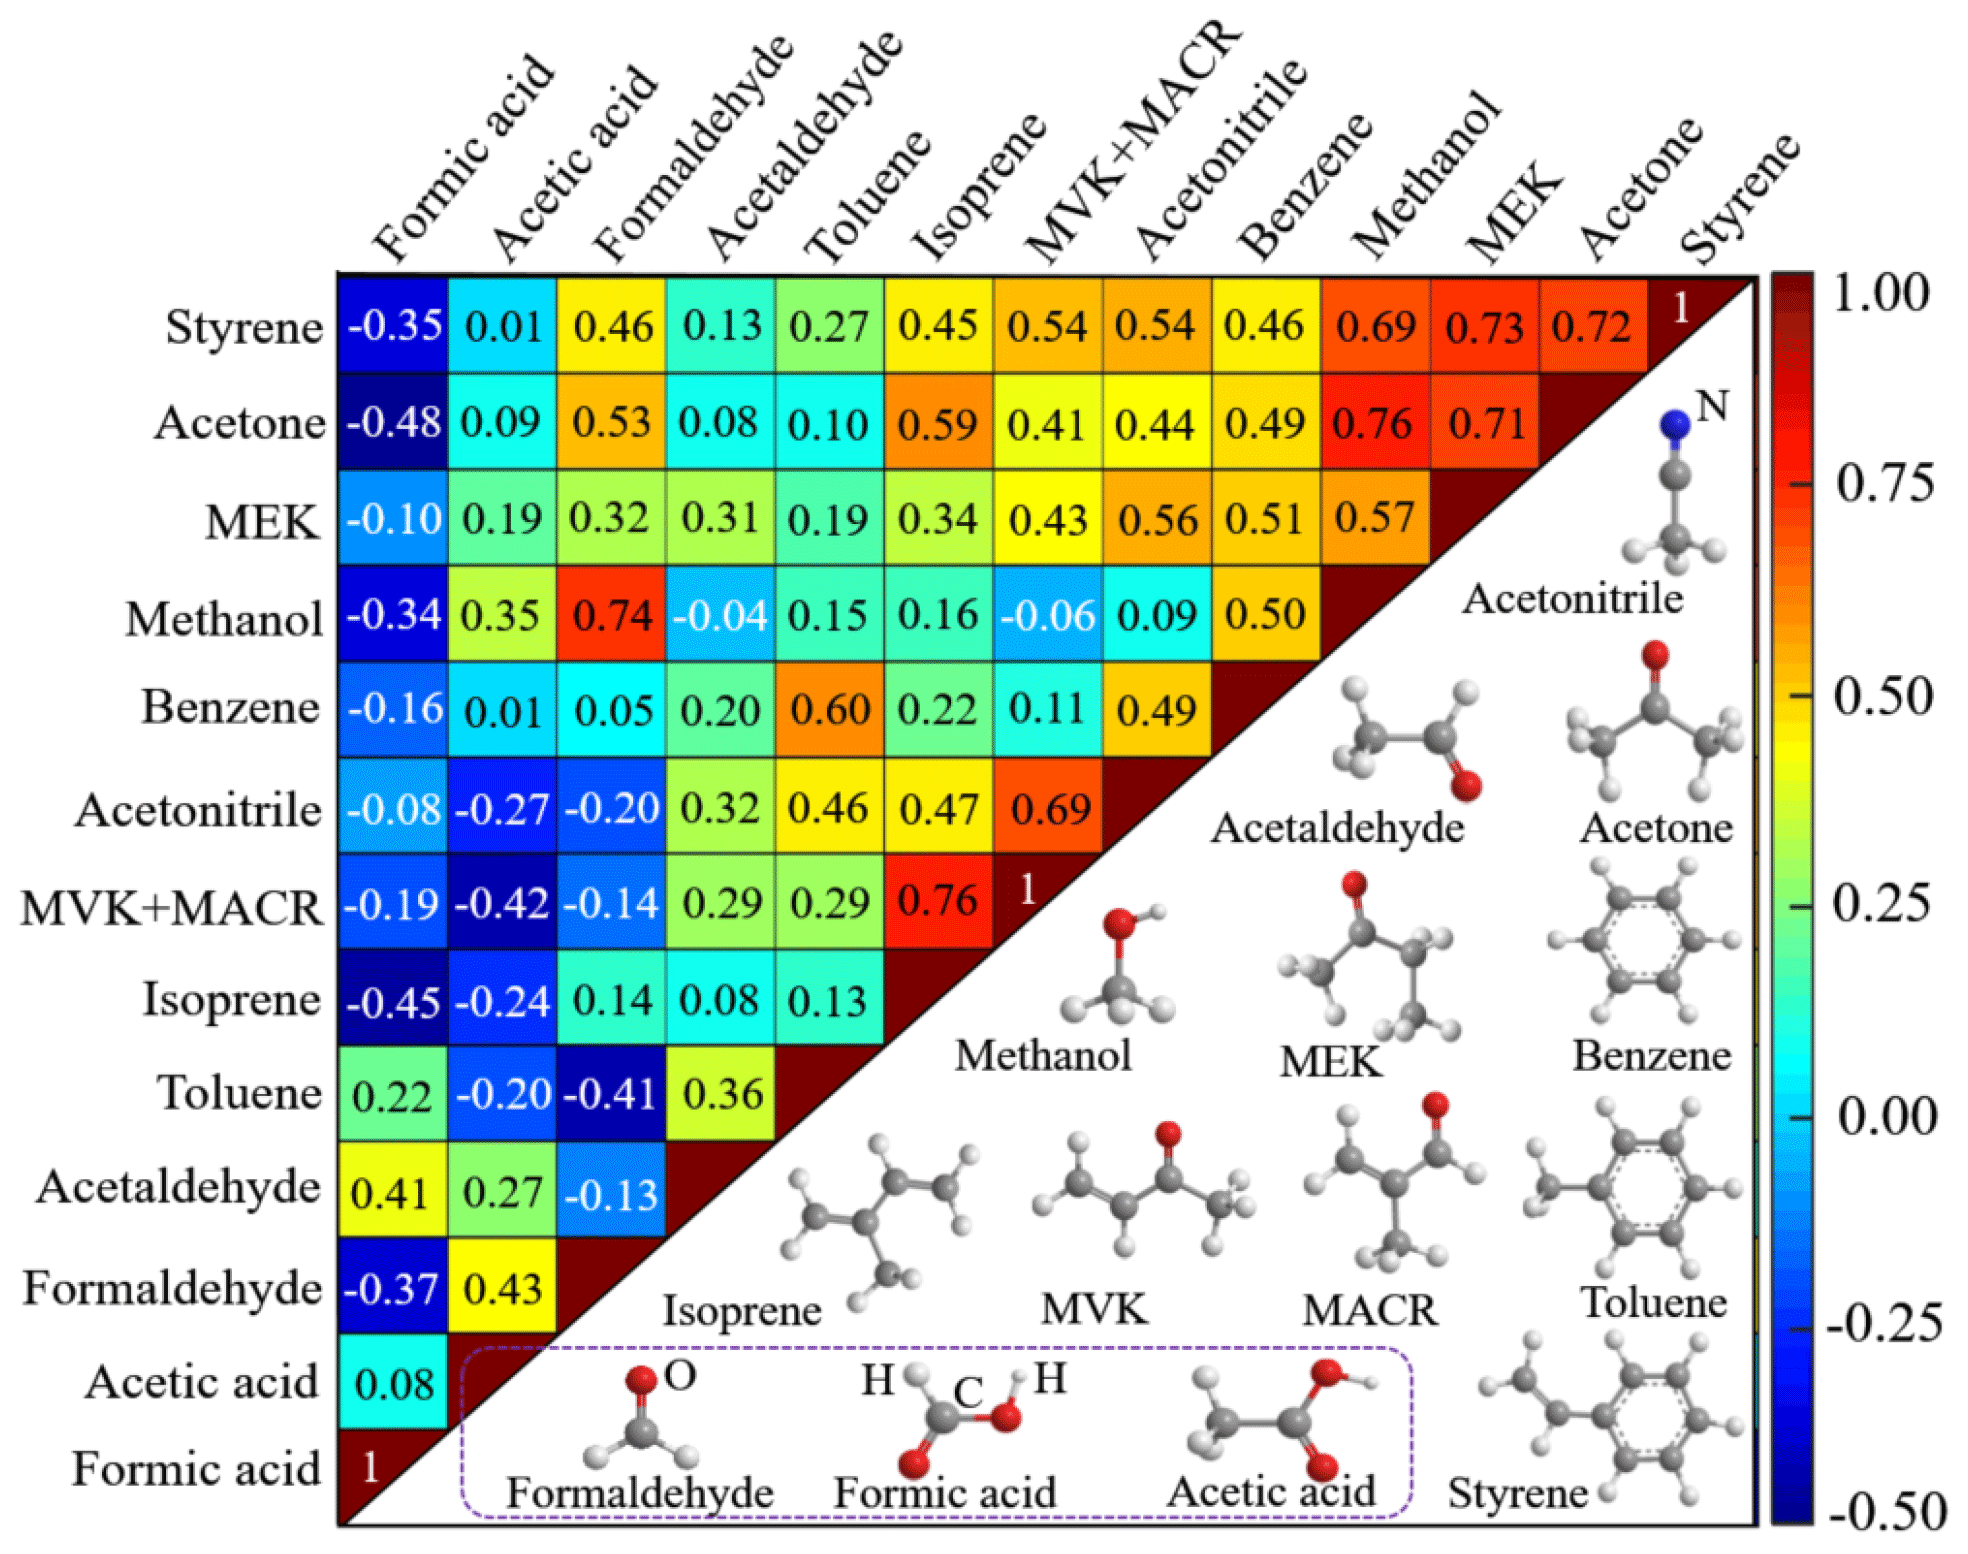
Figure 9Correlation of the exchange of measured VOC species (upper left) and their molecular structures (lower right). Correlation between each pair of VOCs is reflected by the correlation coefficient, shown in the plot. The correlation coefficient between each individual species itself is 1, a correlation coefficient of 0 means no correlation, and −1 implies complete anti-correlation.
Negative correlations in Fig. 9 are indicated in blue colors. As aforementioned, formic acid is at the very end of the VOC oxidation chain and is exclusively emitted from the soil sample while all other VOCs tend to be taken up. Thus, correlations of formic acid with other VOCs are negative as such (blue in Fig. 9). High negative correlation coefficients are obtained between formic acid and some species (i.e., acetone, isoprene, formaldehyde, styrene and methanol), indicative of possible generation and emission of formic acid due to heterogeneous transformation of these deposited compounds.
4.1 Formic acid formation through heterogeneous transformation of deposited VOCs
We know from the above discussions that several VOC species including acetone, isoprene, formaldehyde, styrene and methanol show high anti-correlation with formic acid, suggesting the existence of one or several pathways for formic acid formation through heterogeneous reactions of these VOC precursors.
In the atmosphere, photo-oxidation of acetone contributes to the abundance of formic acid, and the dominant pathway for formic acid formation via acetone photo-oxidation is the reaction of OH radicals with acetone-derived formaldehyde (Chattopadhyay et al., 2015). Formic acid production through photo-oxidation of isoprene has been found under high NOx circumstances (Paulot et al., 2009). Under ambient conditions, gas-phase reactions of styrene with both OH radicals and O3 can occur, with formaldehyde and benzaldehyde as major products and formic acid as the minor (Tuazon et al., 1993). Methanol has been reported to play an important role in upper tropospheric photo-oxidation chemistry via its contribution to the HOx budget after its oxidation to formaldehyde (Tie et al., 2003; Singh et al., 1995, 2000, 2004; Colomb et al., 2006). Notably, formaldehyde is an important intermediate of VOC oxidation and a direct precursor of formic acid (Adewuyi et al., 1984; Chameides, 1984). Moreover, the results in Sect. 3.2 and 3.3 tell us that formaldehyde shows continuous and even increasing uptake during the whole field measurement (see Figs. 5a and 6a). All these results suggest formaldehyde may act as the best candidate for heterogeneous formation of formic acid on soil.
In terms of physicochemistry, formaldehyde is much less stable than formic acid (∼1 day versus ∼25 days of mean atmospheric chemical lifetime; see Millet et al., 2015), indicating its faster turnover rates on soil surfaces. Moreover, the mean retention coefficient of formaldehyde has been shown to be considerably higher than for formic acid in cloud/ice water (Jost et al., 2017), inferring a reasonable explanation for the preferential release of the organic acid from the soil. Furthermore, aldehydes in general undergo accretion reactions (i.e., aldol condensation-type reactions) in acidic media and similar chemistry has been shown to occur on mineral oxides (Li et al., 2001); therefore mineral-rich bare soils can serve as a sink for these compounds. According to our results, formaldehyde is a relatively reactive short-term intermediate for formic acid production, rather than being directly released to the atmosphere under authentic ambient air oxidizing conditions in Beijing city. In general, a catalytic effect of soil can be anticipated by its composition of a variety of mineral oxides (silicon oxide, iron oxide and titanium oxide, etc.). Therefore, our soil sample may serve as a catalytic surface for degradation of the deposited precursors with formaldehyde as the most important intermediate, which can be further oxidized to build up formic acid by heterogeneous reactions on the soil, followed by formic acid emission. This catalytic effect may be further enhanced by the co-existence of other deposited oxidants (O3, OH radical, NO2 and peroxides, etc.) on the soil surfaces. More research is needed to confirm the speculation made here.
4.2 Physicochemical reactions on bare soil and soil-derived dust may act as a potential source of formic acid
The only VOCs that have been observed to be released from the soil sample investigated here is formic aid, which represents a final organic product of the VOC oxidation cascade. Formic acid is one of the most abundant organic acids in the atmosphere, existing in the gas phase, cloud and rain water as well as snow and even polar ice (Chebbi and Carlier, 1996; Sanhueza and Andreae, 1991; Maupetit and Delmas, 1994; Sempére and Kawamura, 1994; Löflund et al., 2002; van Pinxteren et al., 2005; Mungall et al., 2018). In remote regions like the Amazon forest, short-chain organic acids have been shown to be responsible for 60 %–80 % of rainwater acidity (Galloway et al., 1982; Stavrakou et al., 2012), and also over boreal forests and in urban areas they contribute significantly to the free acidity in precipitation (Khare et al., 1999; Stavrakou et al., 2012) and hence can regulate pH dependence of aqueous reactions in clouds (Vet et al., 2014) and can contribute to acidification of soil.
Gas-phase photochemical oxidation of biogenic VOCs is considered to be the dominant global atmospheric source of formic acid. Modeled budget analyses implicate the existence of one or more large missing sources for formic acid, i.e., the annually produced formic acid (100–120 Tg yr−1) is 2 to 3 times higher than can be explained based on the current understanding of primary and secondary (gas-phase) atmospheric processes and aqueous-phase cloud/rain chemistry (Barth et al., 2007; Paulot et al., 2011; Veres et al., 2011; Le Breton et al., 2012; Stavrakou et al., 2012; Cady-Pereira et al., 2014; Schobesberger et al., 2016; Millet et al., 2015). This is the case even when using a master chemical mechanism (MCM) that was updated with recently proposed additional photochemical formation pathways for formic acid, like OH oxidation of isoprene and aromatics (Yuan et al., 2015). This suggests the existence of either a key gap in current understanding of hydrocarbon oxidation or large and widespread, yet unidentified sources for formic acid (Millet et al., 2015).
Previous model estimations of soil emissions of formic acid were based on a few available field measurements (Paulot et al., 2011; Millet et al., 2015). These ambient studies found formic acid emissions from dry savanna soil (Sanhueza and Andreae, 1991) and coniferous forest soil (Enders et al., 1992), respectively, to be an important source of the local formic acid budget. The former study reported a daily average emission rate of nmol m−2 s−1, which is much larger than the estimated long-term mean emission rate of nmol m−2 s−1 (see Table S2 in the Supplement) in the present study. This large discrepancy could be due to different emission/formation mechanisms of formic acid. For the dry savanna soil, emissions of formic acid may be caused by soil bacteria or physicochemical partitioning between the soil reservoir and the atmosphere. In our case, emissions are rather attributed to physicochemical processes on soil (more specifically, heterogeneous oxidation processes) instead of microbial activities and reservoir of the soil itself, due to the applied sterilization and flushing procedures on the soil sample prior to the field experiment. To the best of our knowledge, this study is the first trial to evaluate the potential contribution of physicochemical processes on soil under real ambient conditions to the atmospheric budget of formic acid. Assuming the heterogeneous formation of formic acid also applies to other bare soil types around the globe, a global formic acid source strength of ∼0.24 Tg yr−1 can be estimated using the average emission rate obtained here and a global barren land (i.e., bare soil and land with very sparse vegetation) surface area of km2 (Roser and Ritchie, 2018). This source strength due to heterogeneous reactions on bare soils is comparable to that from anthropogenic and biofuel emissions (0.4 Tg yr−1 by Millet et al., 2015) but still much less than the missing source strength. Note that the magnitude of the emission rate here used for calculation also depends on the mixing ratio levels of ambient VOC precursors and other environmental parameters such as temperature, relative humidity and photochemistry on soil surfaces. Due to the design of our experimental setup, no sunlight reaches the soil surfaces (see Sect. 2.2). But one can imagine that the existence of sunlight would enhance the catalytic effect of soil minerals (e.g., titanium oxide), and the soil surface will become hotter and thus make soil dry out faster. These changes may influence the exchange rates of the examined VOCs in the following ways:
-
High catalytic efficiencies may accelerate transformations of deposited VOC precursors and the formation/emission of formic acid.
-
High temperatures of soil may let more adsorbed VOC molecules escape from soil surfaces through evaporation and decrease their uptake.
-
Low amounts of water in soil may increase the uptake of some hydrophobic VOC species and decrease the uptake of some hydrophilic VOCs.
The combined effect of these three aspects may even tell another different story, which deserves further studies. In a real soil situation, the physicochemical (i.e., abiotic) processes are often combined with biotic processes. The dominance of one over the other is influenced/controlled by changing environmental factors (i.e., temperature, relative humidity and photochemistry) and/or soil types. However, here we assume that physicochemical processes on soil surfaces (more likely on the soil solid phase through heterogeneous chemistry) can be a common phenomenon, which is occurring in parallel with biotic processes. This is because the solid phase of soil, which includes minerals and organic matter (with minerals' content much higher than organic matter), is generally stable in nature (https://www.ctahr.hawaii.edu/mauisoil/a_comp.aspx, last access: 25 June 2018). We think the results obtained in our study can provide a helpful reference regarding the potential contribution of soil particles to formic acid budget from a physicochemical (heterogeneous chemistry) point of view, especially when the soil is dry and the microbial activities are low under some specific situations. Considering the still poorly understood budget of formic acid (Millet, 2012; Paulot et al., 2011), more investigations are needed to quantify the contributions of different types of soil as a potential source of formic acid under different environmental conditions.
Wind erosion is an important process in generating mineral dust aerosols (Zender et al., 2011). Thus, our soil-based formic acid formation mechanism may also apply to soil-derived dust. Indeed, field measurements have identified formic acid to be among the most abundant carboxylic acids in collected mineral dust (Falkovich et al., 2004; Khare et al., 1998). However, dust was treated as a sink of gaseous formic acid in recent model simulations (with a simulated dust uptake of 1.2 Tg yr−1 in Millet et al., 2015; Paulot et al., 2011) based on laboratory-observed uptake of formic acid on clay minerals followed by fast surface saturation (Hatch et al., 2007). Here, we may predict heterogeneous transformations of other co-adsorbed VOCs in the ambient air (e.g., formaldehyde) followed by emission of formic acid on dust, preferentially under low relative humidity conditions (Fig. 8). Based on our observed emission rate, a global emission strength can be roughly estimated by assuming that dust particles have a mean diameter of 2 µm and a density of 2.2 g cm−3 as adopted by Hatch et al. (2007). Using an average atmospheric dust loading of 18 Tg (Kok et al., 2017) would result in a formic acid source of Tg yr−1. Note that estimating the emission of dust aerosol particles, a emission rate for formic acid that is 10 000 times lower should be applied to account for the real available surface (versus the geometric surface used here for soil, to reflect common model input needs). Clearly, this additional formic acid source on dust is much smaller and can be considered negligible. However, our observed formic acid emission to some extent challenges model applications of high initial uptake coefficients on clay minerals derived from laboratory experiments, and previous model simulation may need to be re-constrained.
Aging of organic aerosols by heterogeneous reactions with OH radicals has been proposed as an important secondary source of formic acid (Molina et al., 2004; Paulot et al., 2011), and formic acid heterogeneous production was indeed observed during organic aerosol aging in the laboratory (Eliason et al., 2003; Molina et al., 2004; Walser et al., 2007; Vlasenko et al., 2008; Malecha and Nizkorodov, 2016). Stavrakou et al. (2012) modeled the heterogeneous oxidation of organic aerosols as a source of formic acid assuming that one molecule of formic acid is formed per molecule of OH lost. They calculated an extra global annual formic acid flux of 27 Tg, which is still less than the missing source invoked to explain their remote sensing total column observations (see also Millet et al., 2015). However, based on high concentrations of reactive oxygen species prevailing in atmospheric aerosol particles (Chung et al., 2006; Verma et al., 2015; Tong et al., 2016), we may consider more VOC precursors being oxidized to formic acid than has been adopted in the model.
VOC heterogeneous chemistry at the gas–surface interface of soils play a central role in regulating atmospheric trace gas mixing ratios. In the present study, a coated-wall flow tube system coupled with a PTR-MS analysis was adopted to investigate the exchange of common VOC species at the atmosphere–soil interface at real-world ambient air conditions of an urban background site in Beijing. Almost all VOCs show an average net deposition on the pretreated sterilized soil, examined over an extended exposure of one month. The derived deposition velocities are found to be at the lower end of ranges reported for natural soil habitats, but were in fair agreement with models based on pure physicochemistry. Only formic acid displays a long-term emission. The net emission of formic acid is solely due to physicochemical processes (i.e., heterogeneous transformations of absorbed VOC precursors) on soil, which represents an additional ground-based source of this organic acid.
At ambient atmospheric conditions, both the relatively low uptake coefficients derived for the majority of VOC species and the emission of formic acid from the soil to some extent challenge the applicability of models using uptake coefficients derived from laboratory-based uptake measurements, where single VOC species or simple mixtures are supplied using purging air devoid of oxidizing agents. Field measurements as presented here, with all relevant parameters changing in concert, may call attention to the existence of yet unknown interference or synergetic effects.
As our soil sample is sterilized, the uptake and emission characteristics observed in this study can reflect the contribution of abiotic processes on soil regarding VOC exchange at the atmosphere–soil interface. However, natural soils are a complex ecosystem including leaf litter, plant roots, microorganisms and soil particles. Taking the biotic processes and different soil types into account may produce different results from what we observed here. Previous studies have shown that soil can be a source of short-chain oxygenated VOCs and terpenes due to emissions of soil vegetation (e.g., grass and crops), degradation of leaf litter and other activities of soil living organisms (Schade and Goldstein, 2001; Hayward et al., 2001; Gray et al., 2010; Chen et al., 2004; Lin et al., 2007; Scholler et al., 2002; Rossabi et al., 2018). For example, Leff and Fierer (2008) found that litter samples could produce more types of VOCs than the soil samples without litter covers, indicating degradation of soil litter can be an important source of VOC emission. On the other hand, other studies have observed deposition of several categories of VOCs (e.g., alcohols, aldehydes and monoterpenes) on various types of soils (Asensio et al., 2007a, 2008; Aaltonen et al., 2013; Gray et al., 2014). Considering that the results obtained in the present study can only address the effects of physicochemical processes on VOC exchange, follow-up studies are needed to explore the contribution of soil living organisms (e.g., bacteria, fungi) to VOC exchange at the soil–atmosphere interface.
The underlying research data can be accessed by contacting Hang Su (h.su@mpic.de), Yafang Cheng (yafang.cheng@mpic.de), or Guo Li (guo.li@mpic.de).
The supplement related to this article is available online at: https://doi.org/10.5194/acp-19-2209-2019-supplement.
HS, YC and GL designed the research. GL, RX, YY and ZW performed the experimental study. YW provided supplementary measurement data. GL, YC, HS, UK, HM, ZW, NM, ML, JW, TH, MA, UP and MS discussed the results. GL wrote the paper with inputs from all coauthors.
The authors declare that they have no conflict of interest.
This study
was supported by the National Natural Science Foundation of China (grant nos.
91644218 and 41330635); the “Pearl River Talents Program” of Guangdong
Province, China (grant no. 2016ZT06N263); the National Key Research and
Development Program of China (grant no. 2017YFC0210104); and the Max Planck
Society (MPG). Guo Li acknowledges the financial support from the China
Scholarship Council (CSC).
The article
processing charges for this open-access
publication were
covered by the Max Planck Society.
Edited by:
Nga Lee Ng
Reviewed by: two anonymous referees
Aaltonen, H., Aalto, J., Kolari, P., Pihlatie, M., Pumpanen, J., Kulmala, M., Nikinmaa, E., Vesala, T., and Bäck, J.: Continuous VOC flux measurements on boreal forest floor, Plant Soil, 369, 241–256, https://doi.org/10.1007/s11104-012-1553-4, 2013.
Adewuyi, Y. G., Cho, S.-Y., Tsay, R.-P., and Carmichael, G. R.: Importance of formaldehyde in cloud chemistry, Atmos. Environ., 18, 2413–2420, https://doi.org/10.1016/0004-6981(84)90011-8, 1984.
Ammann, M. and Pöschl, U.: Kinetic model framework for aerosol and cloud surface chemistry and gas-particle interactions – Part 2: Exemplary practical applications and numerical simulations, Atmos. Chem. Phys., 7, 6025–6045, https://doi.org/10.5194/acp-7-6025-2007, 2007.
Ammann, M., Cox, R. A., Crowley, J. N., Jenkin, M. E., Mellouki, A., Rossi, M. J., Troe, J., and Wallington, T. J.: Evaluated kinetic and photochemical data for atmospheric chemistry: Volume VI – heterogeneous reactions with liquid substrates, Atmos. Chem. Phys., 13, 8045–8228, https://doi.org/10.5194/acp-13-8045-2013, 2013.
Andreae, M. O. and Crutzen, P. J.: Atmospheric aerosols: Biogeochemical sources and role in atmospheric chemistry, Science, 276, 1052–1058, 1997.
Ao, C. H., Lee, S. C., Zou, S. C., and Mak, C. L.: Inhibition effect of SO2 on NOx and VOCs during the photodegradation of synchronous indoor air pollutants at parts per billion (ppb) level by TiO2, Appl. Catalys., 49, 187–193, https://doi.org/10.1016/j.apcatb.2003.12.011, 2004.
Asensio, D., Penuelas, J., Filella, I., and Llusia, J.: On-line screening of soil VOCs exchange responses to moisture, temperature and root presence, Plant Soil, 291, 249–261, 2007a.
Asensio, D., Peñuelas, J., Llusià, J., Ogaya, R., and Filella, I.: Interannual and interseasonal soil CO2 efflux and VOC exchange rates in a Mediterranean holm oak forest in response to experimental drought, Soil Biol. Biochem., 39, 2471–2484, https://doi.org/10.1016/j.soilbio.2007.04.019, 2007b.
Asensio, D., Penuelas, J., Prieto, P., Estiarte, M., Filella, I., and Llusia, J.: Interannual and seasonal changes in the soil exchange rates of monoterpenes and other VOCs in a Mediterranean shrubland, Eur. J. Soil Sci., 59, 878–891, 2008.
Atkinson, R.: Atmospheric chemistry of VOCs and NOx, Atmos. Environ., 34, 2063–2101, 2000.
Baasandorj, M., Millet, D. B., Hu, L., Mitroo, D., and Williams, B. J.: Measuring acetic and formic acid by proton-transfer-reaction mass spectrometry: sensitivity, humidity dependence, and quantifying interferences, Atmos. Meas. Tech., 8, 1303–1321, https://doi.org/10.5194/amt-8-1303-2015, 2015.
Barth, M. C., Kim, S. W., Skamarock, W. C., Stuart, A. L., Pickering, K. E., and Ott, L. E.: Simulations of the redistribution of formaldehyde, formic acid, and peroxides in the 10 July 1996 Stratospheric-Tropospheric Experiment: Radiation, Aerosols, and Ozone deep convection storm, J. Geophys. Res.-Atmos., 112, D13310, https://doi.org/10.1029/2006JD008046, 2007.
Berns, A. E., Philipp., H., Narres, H. D., Burauel, P., Vereecken, H., and Tappe, W.: Effect of gamma-sterilization and autoclaving on soil organic matter structure as studied by solid state NMR, UV and fluorescence spectroscopy, Eur. J. Soil Sci., 59, 540–550, https://doi.org/10.1111/j.1365-2389.2008.01016.x, 2008.
Bigi, A. and Harrison, R. M.: Analysis of the air pollution climate at a central urban background site, Atmos. Environ., 44, 2004–2012, https://doi.org/10.1016/j.atmosenv.2010.02.028, 2010.
Borbon, A., Fontaine, H., Veillerot, M., Locoge, N., Galloo, J. C., and Guillermo, R.: An investigation into the traffic-related fraction of isoprene at an urban location, Atmos. Environ., 35, 3749–3760, https://doi.org/10.1016/S1352-2310(01)00170-4, 2001.
Bourtsoukidis, E., Behrendt, T., Yañez-Serrano, A. M., Hellén, H., Diamantopoulos, E., Catão, E., Ashworth, K., Pozzer, A., Quesada, C. A., Martins, D., Sá, M., Araujo, A., Brito, J., Artaxo, P., Kesselmeier, J., Lelieveld, J., and Williams, J.: Strong sesquiterpene emissions from Amazonian soils, Nat. Commun., 9, 2226, https://doi.org/10.1038/s41467-018-04658-y, 2018.
Brunauer, S., Emmett, P. H., and Teller, E.: Adsorption of Gases in Multimolecular Layers, J. Am. Chem. Soc., 60, 309–319, https://doi.org/10.1021/ja01269a023, 1938.
Cady-Pereira, K. E., Chaliyakunnel, S., Shephard, M. W., Millet, D. B., Luo, M., and Wells, K. C.: HCOOH measurements from space: TES retrieval algorithm and observed global distribution, Atmos. Meas. Tech., 7, 2297–2311, https://doi.org/10.5194/amt-7-2297-2014, 2014.
Cappellin, L., Algarra Alarcon, A., Herdlinger-Blatt, I., Sanchez, J., Biasioli, F., Martin, S. T., Loreto, F., and McKinney, K. A.: Field observations of volatile organic compound (VOC) exchange in red oaks, Atmos. Chem. Phys., 17, 4189–4207, https://doi.org/10.5194/acp-17-4189-2017, 2017.
Chameides, W. L.: The photochemistry of a remote marine stratiform cloud, J. Geophys. Res.-Atmos., 89, 4739–4755, https://doi.org/10.1029/JD089iD03p04739, 1984.
Chapleski, R. C., Zhang, Y., Troya, D., and Morris, J. R.: Heterogeneous chemistry and reaction dynamics of the atmospheric oxidants, O3, NO3, and OH, on organic surfaces, Chem. Soc. Rev., 45, 3731–3746, https://doi.org/10.1039/C5CS00375J, 2016.
Charbouillot, T., Gorini, S., Voyard, G., Parazols, M., Brigante, M., Deguillaume, L., Delort, A.-M., and Mailhot, G.: Mechanism of carboxylic acid photooxidation in atmospheric aqueous phase: Formation, fate and reactivity, Atmos. Environ., 56, 1–8, https://doi.org/10.1016/j.atmosenv.2012.03.079, 2012.
Chattopadhyay, A., Chatterjee, P., and Chakraborty, T.: Photo-oxidation of Acetone to Formic Acid in Synthetic Air and Its Atmospheric Implication, J. Phys. Chem. A, 119, 8146–8155, https://doi.org/10.1021/acs.jpca.5b04905, 2015.
Chebbi, A. and Carlier, P.: Carboxylic acids in the troposphere, occurrence, sources, and sinks: A review, Atmos. Environ., 30, 4233–4249, https://doi.org/10.1016/1352-2310(96)00102-1, 1996.
Chen, F., Ro, D. K., Petri, J., Gershenzon, J., Bohlmann, J., Pichersky, E., and Tholl, D.: Characterization of a root-specific Arabidopsis terpene synthase responsible for the formation of the volatile monoterpene 1,8-cineole, Plant Physiol., 135, 1956–1966, 2004.
Chen, W. T., Shao, M., Lu, S. H., Wang, M., Zeng, L. M., Yuan, B., and Liu, Y.: Understanding primary and secondary sources of ambient carbonyl compounds in Beijing using the PMF model, Atmos. Chem. Phys., 14, 3047–3062, https://doi.org/10.5194/acp-14-3047-2014, 2014.
Cho, C. W., Sung, K., Coapcioglu, M. Y., and Drew, M.: Influence of water content and plants on the dissipation of chlorinated volatile organic compounds in soil, Water Air Soil Poll., 167, 259–271, 2005.
Chung, M. Y., Lazaro, R. A., Lim, D., Jackson, J., Lyon, J., Rendulic, D., and Hasson, A. S.: Aerosol-Borne Quinones and Reactive Oxygen Species Generation by Particulate Matter Extracts, Environ. Sci. Technol., 40, 4880–4886, https://doi.org/10.1021/es0515957, 2006.
Cleveland, C. C. and Yavitt, J. B.: Consumption of atmospheric isoprene in soil, Geophys. Res. Lett., 24, 2379–2382, https://doi.org/10.1029/97GL02451, 1997.
Cleveland, C. C. and Yavitt, J. B.: Microbial Consumption of Atmospheric Isoprene in a Temperate Forest Soil, Appl. Environ. Microbiol., 64, 172–177, 1998.
Colomb, A., Williams, J., Crowley, J., Gros, V., Hofmann, R., Salisbury, G., Klüpfel, T., Kormann, R., Stickler, A., Forster, C., and Lelieveld, J.: Airborne Measurements of Trace Organic Species in the Upper Troposphere Over Europe: the Impact of Deep Convection, Environ. Chem., 3, 244–259, https://doi.org/10.1071/EN06020, 2006.
Crowley, J. N., Ammann, M., Cox, R. A., Hynes, R. G., Jenkin, M. E., Mellouki, A., Rossi, M. J., Troe, J., and Wallington, T. J.: Evaluated kinetic and photochemical data for atmospheric chemistry: Volume V – heterogeneous reactions on solid substrates, Atmos. Chem. Phys., 10, 9059–9223, https://doi.org/10.5194/acp-10-9059-2010, 2010.
Dentener, F. J., Carmichael, G. R., Zhang, Y., Lelieveld, J., and Crutzen, P. J.: Role of mineral aerosol as a reactive surface in the global troposphere, J. Geophys. Res., 101, 22869–22889, 1996.
Derendorp, L., Holzinger, R., and Röckmann, T.: UV-induced emissions of C2–C5 hydrocarbons from leaf litter, Environ. Chem., 8, 602–611, https://doi.org/10.1071/EN11024, 2011.
Derstroff, B., Hüser, I., Bourtsoukidis, E., Crowley, J. N., Fischer, H., Gromov, S., Harder, H., Janssen, R. H. H., Kesselmeier, J., Lelieveld, J., Mallik, C., Martinez, M., Novelli, A., Parchatka, U., Phillips, G. J., Sander, R., Sauvage, C., Schuladen, J., Stönner, C., Tomsche, L., and Williams, J.: Volatile organic compounds (VOCs) in photochemically aged air from the eastern and western Mediterranean, Atmos. Chem. Phys., 17, 9547–9566, https://doi.org/10.5194/acp-17-9547-2017, 2017.
Di Carlo, P., Brune, W. H., Martinez, M., Harder, H., Lesher, R., Ren, X., Thornberry, T., Carroll, M. A., Young, V., Shepson, P. B., Riemer, D., Apel, E., and Campbell, C.: Missing OH Reactivity in a Forest: Evidence for Unknown Reactive Biogenic VOCs, Science, 304, 722–725, https://doi.org/10.1126/science.1094392, 2004.
Donaldson, M. A., Berke, A. E., and Raff, J. D.: Uptake of Gas Phase Nitrous Acid onto Boundary Layer Soil Surfaces, Environ. Sci. Technol., 48, 375–383, 2014a.
Donaldson, M. A., Bish, D. L., and Raff, J. D.: Soil surface acidity plays a determining role in the atmospheric-terrestrial exchange of nitrous acid, P. Natl. Acad. Sci. USA, 111, 18472–18477, 2014b.
Eliason, T. L., Aloisio, S., Donaldson, D. J., Cziczo, D. J., and Vaida, V.: Processing of unsaturated organic acid films and aerosols by ozone, Atmos. Environ., 37, 2207–2219, https://doi.org/10.1016/S1352-2310(03)00149-3, 2003.
Enders, G., Dlugi, R., Steinbrecher, R., Clement, B., Daiber, R., Eijk, J. v., Gäb, S., Haziza, M., Helas, G., Herrmann, U., Kessel, M., Kesselmeier, J., Kotzias, D., Kourtidis, K., Kurth, H. H., McMillen, R. T., Roider, G., Schürmann, W., Teichmann, U., and Torres, L.: Biosphere/Atmosphere interactions: Integrated research in a European coniferous forest ecosystem, Atmos Environ., 26, 171–189, https://doi.org/10.1016/0960-1686(92)90269-Q, 1992.
Falkovich, A. H., Schkolnik, G., Ganor, E., and Rudich, Y.: Adsorption of organic compounds pertinent to urban environments onto mineral dust particles, J. Geophys. Res.-Atmos., 109, D02208, https://doi.org/10.1029/2003JD003919, 2004.
Fall, R., Karl, T., Hansel, A., Jordan, A., and Lindinger, W.: Volatile organic compounds emitted after leaf wounding: On-line analysis by proton-transfer-reaction mass spectrometry, J. Geophys. Res.-Atmos., 104, 15963–15974, 1999.
Fares, S., Paoletti, E., Loreto, F., and Brilli, F.: Bidirectional Flux of Methyl Vinyl Ketone and Methacrolein in Trees with Different Isoprenoid Emission under Realistic Ambient Concentrations, Environ. Sci. Technol., 49, 7735–7742, https://doi.org/10.1021/acs.est.5b00673, 2015.
Fortner, E. C., Zheng, J., Zhang, R., Berk Knighton, W., Volkamer, R. M., Sheehy, P., Molina, L., and André, M.: Measurements of Volatile Organic Compounds Using Proton Transfer Reaction – Mass Spectrometry during the MILAGRO 2006 Campaign, Atmos. Chem. Phys., 9, 467–481, https://doi.org/10.5194/acp-9-467-2009, 2009.
Fuentes, J. D., Wang, D., Neumann, H. H., Gillespie, T. J., DenHartog, G., and Dann, T. F.: Ambient biogenic hydrocarbons and isoprene emissions from a mixed deciduous forest, J. Atmos. Chem., 25, 67–95, 1996.
Fuentes, J. D., Lerdau, M., Atkinson, R., Baldocchi, D., Bottenheim, J. W., Ciccioli, P., Lamb, B., Geron, C., Gu, L., Guenther, A., Sharkey, T. D., and Stockwell, W.: Biogenic hydrocarbons in the atmospheric boundary layer: A review, B. Am. Meteorol. Soc., 81, 1537–1575, 2000.
Galbally, I. E. and Kirstine, W.: The Production of Methanol by Flowering Plants and the Global Cycle of Methanol, J. Atmos. Chem., 43, 195–229, https://doi.org/10.1023/a:1020684815474, 2002.
Galloway, J. N., Likens, G. E., Keene, W. C., and Miller, J. M.: The composition of precipitation in remote areas of the world, J. Geophys. Res.-Oceans, 87, 8771–8786, https://doi.org/10.1029/JC087iC11p08771, 1982.
Gershenzon, J.: Metabolic Costs of Terpenoid Accumulation in Higher-Plants, J. Chem. Ecol., 20, 1281–1328, 1994.
Glikson, M., Rutherford, S., Simpson, R. W., Mitchell, C. A., and Yago, A.: Microscopic and submicron components of atmospheric particulate matter during high asthma periods in Brisbane, Queensland, Australia, Atmos. Environ., 29, 549–562, https://doi.org/10.1016/1352-2310(94)00278-S, 1995.
Goldstein, A. H. and Galbally, I. E.: Known and unexplored organic constituents in the earth's atmosphere, Environ. Sci. Technol., 41, 1514–1521, 2007.
Good, D. A., Francisco, J. S., Jain, A. K., and Wuebbles, D. J.: Lifetimes and global warming potentials for dimethyl ether and for fluorinated ethers: CH3OCF3 (E143a), CHF2OCHF2 (E134), CHF2OCF3 (E125), J. Geophys. Res.-Atmos., 103, 28181–28186, https://doi.org/10.1029/98JD01880, 1998.
Gordon, M., Vlasenko, A., Staebler, R. M., Stroud, C., Makar, P. A., Liggio, J., Li, S.-M., and Brown, S.: Uptake and emission of VOCs near ground level below a mixed forest at Borden, Ontario, Atmos. Chem. Phys., 14, 9087–9097, https://doi.org/10.5194/acp-14-9087-2014, 2014a.
Gordon, M., Vlasenko, A., Staebler, R. M., Stroud, C., Makar, P. A., Liggio, J., Li, S.-M., and Brown, S.: Uptake and emission of VOCs near ground level below a mixed forest at Borden, Ontario, Atmos. Chem. Phys., 14, 9087–9097, https://doi.org/10.5194/acp-14-9087-2014, 2014b.
Goss, K. U., Buschmann, J., and Schwarzenbach, R. P.: Adsorption of organic vapors to air-dry soils: Model predictions and experimental validation, Environ. Sci. Technol., 38, 3667–3673, 2004.
Gray, C. M., Monson, R. K., and Fierer, N.: Emissions of volatile organic compounds during the decomposition of plant litter, J. Geophys. Res.-Biogeosci., 115, G03015, https://doi.org/10.1029/2010JG001291, 2010.
Gray, C. M., Monson, R. K., and Fierer, N.: Biotic and abiotic controls on biogenic volatile organic compound fluxes from a subalpine forest floor, J. Geophys. Res.-Biogeosci., 119, 547–556, 2014.
Guenther, A., Zimmerman, P., and Wildermuth, M.: Natural Volatile Organic-Compound Emission Rate Estimates for United-States Woodland Landscapes, Atmos. Environ., 28, 1197–1210, 1994.
Guenther, A., Hewitt, C. N., Erickson, D., Fall, R., Geron, C., Graedel, T., Harley, P., Klinger, L., Lerdau, M., Mckay, W. A., Pierce, T., Scholes, B., Steinbrecher, R., Tallamraju, R., Taylor, J., and Zimmerman, P.: A Global-Model of Natural Volatile Organic-Compound Emissions, J. Geophys. Res.-Atmos., 100, 8873–8892, 1995.
Guenther, A.: Bidirectional Exchange of Volatile Organic Compounds, in: Review and Integration of Biosphere-Atmosphere Modelling of Reactive Trace Gases and Volatile Aerosols, edited by: Massad, R.-S. and Loubet, B., Springer Netherlands, Dordrecht, 107–113, 2015.
Guenther, A. B., Zimmerman, P. R., Harley, P. C., Monson, R. K., and Fall, R.: Isoprene and monoterpene emission rate variability: Model evaluations and sensitivity analyses, J. Geophys. Res.-Atmos., 98, 12609–12617, https://doi.org/10.1029/93JD00527, 1993.
Hartmann, W. R., Santana, M., Hermoso, M., Andreae, M. O., and Sanhueza, E.: Diurnal cycles of formic and acetic acids in the northern part of the Guayana shield, Venezuela, J. Atmos. Chem., 13, 63–72, https://doi.org/10.1007/bf00048100, 1991.
Hatch, C. D., Gough, R. V., and Tolbert, M. A.: Heterogeneous uptake of the C1 to C4 organic acids on a swelling clay mineral, Atmos. Chem. Phys., 7, 4445–4458, https://doi.org/10.5194/acp-7-4445-2007, 2007.
Hayward, S., Muncey, R. J., James, A. E., Halsall, C. J., and Hewitt, C. N.: Monoterpene emissions from soil in a Sitka spruce forest, Atmos. Environ., 35, 4081–4087, 2001.
Heald, C. L., Jacob, D. J., Park, R. J., Russell, L. M., Huebert, B. J., Seinfeld, J. H., Liao, H., and Weber, R. J.: A large organic aerosol source in the free troposphere missing from current models, Geophys. Res. Lett., 32, L18809, https://doi.org/10.1029/2005GL023831, 2005.
Jacob, D. J.: Heterogeneous chemistry and tropospheric ozone, Atmos. Environ., 34, 2131–2159, https://doi.org/10.1016/S1352-2310(99)00462-8, 2000.
Janson, R. W.: Monoterpene Emissions from Scots Pine and Norwegian Spruce, J. Geophys. Res.-Atmos., 98, 2839–2850, 1993.
Jia, L., Xu, Y., and Shi, Y.: Investigation of the ozone formation potential for ethanol using a smog chamber, Chinese Sci. Bull., 57, 4472–4481, https://doi.org/10.1007/s11434-012-5375-9, 2012.
Jordan, C., Fitz, E., Hagan, T., Sive, B., Frinak, E., Haase, K., Cottrell, L., Buckley, S., and Talbot, R.: Long-term study of VOCs measured with PTR-MS at a rural site in New Hampshire with urban influences, Atmos. Chem. Phys., 9, 4677–4697, https://doi.org/10.5194/acp-9-4677-2009, 2009.
Jost, A., Szakáll, M., Diehl, K., Mitra, S. K., and Borrmann, S.: Chemistry of riming: the retention of organic and inorganic atmospheric trace constituents, Atmos. Chem. Phys., 17, 9717–9732, https://doi.org/10.5194/acp-17-9717-2017, 2017.
Kahle, M., Kleber, M., and Jahn, R.: Carbon storage in loess derived surface soils from Central Germany: Influence of mineral phase variables, J. Plant Nutr. Soil Sc., 165, 141–149, 2002.
Karl, T., Harley, P., Guenther, A., Rasmussen, R., Baker, B., Jardine, K., and Nemitz, E.: The bi-directional exchange of oxygenated VOCs between a loblolly pine (Pinus taeda) plantation and the atmosphere, Atmos. Chem. Phys., 5, 3015–3031, https://doi.org/10.5194/acp-5-3015-2005, 2005.
Karl, T., Harley, P., Emmons, L., Thornton, B., Guenther, A., Basu, C., Turnipseed, A., and Jardine, K.: Efficient Atmospheric Cleansing of Oxidized Organic Trace Gases by Vegetation, Science, 330, 816–819, 2010.
Kesselmeier, J.: Exchange of short-chain oxygenated volatile organic compounds (VOCs) between plants and the atmosphere: A compilation of field and laboratory studies, J. Atmos. Chem., 39, 219–233, 2001.
Khare, P., Kumar, N., Satsangi, G. S., Kumari, K. M., and Srivastava, S. S.: Formate and acetate in particulate matter and dust fall at Dayalbagh, Agra (India), Chemosphere, 36, 2993–3002, https://doi.org/10.1016/S0045-6535(97)10096-0, 1998.
Khare, P., Kumar, N., Kumari, K. M., and Srivastava, S. S.: Atmospheric formic and acetic acids: An overview, Rev. Geophys., 37, 227–248, https://doi.org/10.1029/1998RG900005, 1999.
Knopf, D. A., Pöschl, U., and Shiraiwa, M.: Radial Diffusion and Penetration of Gas Molecules and Aerosol Particles through Laminar Flow Reactors, Denuders, and Sampling Tubes, Anal. Chem., 87, 3746–3754, 2015.
Kok, J. F., Ridley, D. A., Zhou, Q., Miller, R. L., Zhao, C., Heald, C. L., Ward, D. S., Albani, S., and Haustein, K.: Smaller desert dust cooling effect estimated from analysis of dust size and abundance, Nat. Geosci., 10, 274–278, https://doi.org/10.1038/ngeo2912, 2017.
Kuhn, U., Rottenberger, S., Biesenthal, T., Ammann, C., Wolf, A., Schebeske, G., Oliva, S. T., Tavares, T. M., and Kesselmeier, J.: Exchange of short-chain monocarboxylic acids by vegetation at a remote tropical forest site in Amazonia, J. Geophys. Res.-Atmos., 107, 8069, https://doi.org/10.1029/2000JD000303, 2002.
Lamb, B., Guenther, A., Gay, D., and Westberg, H.: A National Inventory of Biogenic Hydrocarbon Emissions, Atmos. Environ., 21, 1695–1705, 1987.
Le Breton, M., McGillen, M. R., Muller, J. B. A., Bacak, A., Shallcross, D. E., Xiao, P., Huey, L. G., Tanner, D., Coe, H., and Percival, C. J.: Airborne observations of formic acid using a chemical ionization mass spectrometer, Atmos. Meas. Tech., 5, 3029–3039, https://doi.org/10.5194/amt-5-3029-2012, 2012.
Leff, J. W. and Fierer, N.: Volatile organic compound (VOC) emissions from soil and litter samples, Soil Biol. Biochem., 40, 1629–1636, https://doi.org/10.1016/j.soilbio.2008.01.018, 2008.
Lelieveld, J., Butler, T. M., Crowley, J. N., Dillon, T. J., Fischer, H., Ganzeveld, L., Harder, H., Lawrence, M. G., Martinez, M., Taraborrelli, D., and Williams, J.: Atmospheric oxidation capacity sustained by a tropical forest, Nature, 452, 737–740, https://doi.org/10.1038/nature06870, 2008.
Li, G., Su, H., Li, X., Kuhn, U., Meusel, H., Hoffmann, T., Ammann, M., Pöschl, U., Shao, M., and Cheng, Y.: Uptake of gaseous formaldehyde by soil surfaces: a combination of adsorption/desorption equilibrium and chemical reactions, Atmos. Chem. Phys., 16, 10299–10311, https://doi.org/10.5194/acp-16-10299-2016, 2016.
Li, G., Su, H., Kuhn, U., Meusel, H., Ammann, M., Shao, M., Pöschl, U., and Cheng, Y.: Technical note: Influence of surface roughness and local turbulence on coated-wall flow tube experiments for gas uptake and kinetic studies, Atmos. Chem. Phys., 18, 2669–2686, https://doi.org/10.5194/acp-18-2669-2018, 2018.
Li, P., K. A. Perreau, E. Covington, C. H. Song, G. R. Carmichael, and Grassian, V. H.: Heterogeneous reactions of volatile organic compounds on oxide particles of the most abundant crustal elements: Surface reactions of acetaldehyde, acetone, and propionaldehyde on SiO2, Al2O3, Fe2O3, TiO2, and CaO, J. Geophys. Res.-Atmos., 106, 5517–5529, https://doi.org/10.1029/2000JD900573, 2001.
Lichtin, N. N., Avudaithai, M., Berman, E., and Grayfer, A.: TiO2-photocatalyzed oxidative degradation of binary mixtures of vaporized organic compounds, Sol. Energy, 56, 377–385, https://doi.org/10.1016/0038-092X(96)00014-X, 1996.
Lin, C., Owen, S. M., and Penuelas, J.: Volatile organic compounds in the roots and rhizosphere of Pinus spp., Soil Biol. Biochem., 39, 951–960, 2007.
Lindinger, W., Hansel, A., and Jordan, A.: Proton-transfer-reaction mass spectrometry (PTR-MS): on-line monitoring of volatile organic compounds at pptv levels, Chem. Soc. Rev., 27, 347–354, 1998.
Löflund, M., Kasper-Giebl, A., Schuster, B., Giebl, H., Hitzenberger, R., and Puxbaum, H.: Formic, acetic, oxalic, malonic and succinic acid concentrations and their contribution to organic carbon in cloud water, Atmos. Environ., 36, 1553–1558, https://doi.org/10.1016/S1352-2310(01)00573-8, 2002.
Lynch, R. C., Darcy, J. L., Kane, N. C., Nemergut, D. R., and Schmidt, S. K.: Metagenomic evidence for metabolism of trace atmospheric gases by high-elevation desert Actinobacteria, Front. Microbiol., 5, 698, https://doi.org/10.3389/fmicb.2014.00698, 2014.
Malecha, K. T. and Nizkorodov, S. A.: Photodegradation of Secondary Organic Aerosol Particles as a Source of Small, Oxygenated Volatile Organic Compounds, Environ. Sci. Technol., 50, 9990–9997, https://doi.org/10.1021/acs.est.6b02313, 2016.
Maupetit, F. and Delmas, R. J.: Carboxylic acids in high-elevation Alpine glacier snow, J. Geophys. Res.-Atmos., 99, 16491–16500, https://doi.org/10.1029/94JD03315, 1994.
Millet, D. B.: Atmospheric chemistry: Natural atmospheric acidity, Nat. Geosci., 5, 8–9, 2012.
Millet, D. B., Baasandorj, M., Farmer, D. K., Thornton, J. A., Baumann, K., Brophy, P., Chaliyakunnel, S., de Gouw, J. A., Graus, M., Hu, L., Koss, A., Lee, B. H., Lopez-Hilfiker, F. D., Neuman, J. A., Paulot, F., Peischl, J., Pollack, I. B., Ryerson, T. B., Warneke, C., Williams, B. J., and Xu, J.: A large and ubiquitous source of atmospheric formic acid, Atmos. Chem. Phys., 15, 6283–6304, https://doi.org/10.5194/acp-15-6283-2015, 2015.
Misra, G., Pavlostathis, S. G., Perdue, E. M., and Araujo, R.: Aerobic biodegradation of selected monoterpenes, Appl. Microbiol. Biotechnol., 45, 831–838, https://doi.org/10.1007/s002530050770, 1996.
Molina, M. J., Ivanov, A. V., Trakhtenberg, S., and Molina, L. T.: Atmospheric evolution of organic aerosol, Geophys. Res. Lett., 31, L22104, https://doi.org/10.1029/2004GL020910, 2004.
Monod, A., Bonnefoy, N., Kaluzny, P., Denis, I., Foster, P., and Carlier, P.: Methods for sampling and analysis of tropospheric ethanol in gaseous and aqueous phases, Chemosphere, 52, 1307–1319, https://doi.org/10.1016/S0045-6535(03)00327-8, 2003.
Morrissey, F. A. and Grismer, M. E.: Kinetics of volatile organic compound sorption/desorption on clay minerals, J. Contam. Hydrol., 36, 291–312, https://doi.org/10.1016/S0169-7722(98)00150-8, 1999.
Mungall, E. L., Abbatt, J. P. D., Wentzell, J. J. B., Wentworth, G. R., Murphy, J. G., Kunkel, D., Gute, E., Tarasick, D. W., Sharma, S., Cox, C. J., Uttal, T., and Liggio, J.: High gas-phase mixing ratios of formic and acetic acid in the High Arctic, Atmos. Chem. Phys., 18, 10237–10254, https://doi.org/10.5194/acp-18-10237-2018, 2018.
Murphy, D. M. and Fahey, D. W.: Mathematical Treatment of the Wall Loss of a Trace Species in Denuder and Catalytic-Converter Tubes, Anal. Chem., 59, 2753–2759, 1987.
Newman, L. A., Strand, S. E., Choe, N., Duffy, J., Ekuan, G., Ruszaj, M., Shurtleff, B. B., Wilmoth, J., Heilman, P., and Gordon, M. P.: Uptake and biotransformation of trichloroethylene by hybrid poplars, Environ. Sci. Technol., 31, 1062–1067, 1997.
Niemi, R., Martikainen, P. J., Silvola, J., Wulff, A., Turtola, S., and Holopainen, T.: Elevated UV-B radiation alters fluxes of methane and carbon dioxide in peatland microcosms, Global Chang. Biol., 8, 361–371, https://doi.org/10.1046/j.1354-1013.2002.00478.x, 2002.
Niinemets, Ü., Fares, S., Harley, P., and Jardine, K. J.: Bidirectional exchange of biogenic volatiles with vegetation: emission sources, reactions, breakdown and deposition, Plant Cell Environ., 37, 1790–1809, https://doi.org/10.1111/pce.12322, 2014.
Osamu, H., Peter, N., Stefan, L., and Moortgat, G. K.: Formation of formic acid and organic peroxides in the ozonolysis of ethene with added water vapour, Geophys. Res. Lett., 21, 1523–1526, https://doi.org/10.1029/94GL01174, 1994.
Park, J. H., Goldstein, A. H., Timkovsky, J., Fares, S., Weber, R., Karlik, J., and Holzinger, R.: Active Atmosphere-Ecosystem Exchange of the Vast Majority of Detected Volatile Organic Compounds, Science, 341, 643–647, 2013.
Paulot, F., Crounse, J. D., Kjaergaard, H. G., Kroll, J. H., Seinfeld, J. H., and Wennberg, P. O.: Isoprene photooxidation: new insights into the production of acids and organic nitrates, Atmos. Chem. Phys., 9, 1479–1501, https://doi.org/10.5194/acp-9-1479-2009, 2009.
Paulot, F., Wunch, D., Crounse, J. D., Toon, G. C., Millet, D. B., DeCarlo, P. F., Vigouroux, C., Deutscher, N. M., González Abad, G., Notholt, J., Warneke, T., Hannigan, J. W., Warneke, C., de Gouw, J. A., Dunlea, E. J., De Mazière, M., Griffith, D. W. T., Bernath, P., Jimenez, J. L., and Wennberg, P. O.: Importance of secondary sources in the atmospheric budgets of formic and acetic acids, Atmos. Chem. Phys., 11, 1989–2013, https://doi.org/10.5194/acp-11-1989-2011, 2011.
Pei, J. J. and Zhang, J. S. S.: On the performance and mechanisms of formaldehyde removal by chemi-sorbents, Chem. Eng. J., 167, 59–66, 2011.
Perera, A., Sokolić, F., and Zoranić, L.: Microstructure of neat alcohols, Phys. Rev. E, 75, 060502, https://doi.org/10.1103/PhysRevE.75.060502, 2007.
Pignatello, J. J. and Xing, B. S.: Mechanisms of slow sorption of organic chemicals to natural particles, Environ. Sci. Technol., 30, 1–11, 1996.
Pöschl, U., Canagaratna, M., Jayne, J. T., Molina, L. T., Worsnop, D. R., Kolb, C. E., and Molina, M. J.: Mass Accommodation Coefficient of H2SO4 Vapor on Aqueous Sulfuric Acid Surfaces and Gaseous Diffusion Coefficient of H2SO4 in N2∕H2O, J. Phys. Chem. A, 102, 10082–10089, https://doi.org/10.1021/jp982809s, 1998.
Pöschl, U.: Atmospheric Aerosols: Composition, Transformation, Climate and Health Effects, Angew. Chem. Int. Edit., 44, 7520–7540, https://doi.org/10.1002/anie.200501122, 2005.
Pöschl, U., Rudich, Y., and Ammann, M.: Kinetic model framework for aerosol and cloud surface chemistry and gas-particle interactions – Part 1: General equations, parameters, and terminology, Atmos. Chem. Phys., 7, 5989–6023, https://doi.org/10.5194/acp-7-5989-2007, 2007.
Pöschl, U., Martin, S. T., Sinha, B., Chen, Q., Gunthe, S. S., Huffman, J. A., Borrmann, S., Farmer, D. K., Garland, R. M., Helas, G., Jimenez, J. L., King, S. M., Manzi, A., Mikhailov, E., Pauliquevis, T., Petters, M. D., Prenni, A. J., Roldin, P., Rose, D., Schneider, J., Su, H., Zorn, S. R., Artaxo, P., and Andreae, M. O.: Rainforest Aerosols as Biogenic Nuclei of Clouds and Precipitation in the Amazon, Science, 329, 1513–1516, https://doi.org/10.1126/science.1191056, 2010.
Punrattanasin, P. and Sariem, P.: Adsorption of Copper, Zinc, and Nickel Using Loess as Adsorbents, Pol. J. Environ. Stud., 24, 1259–1266, https://doi.org/10.15244/pjoes/30264, 2015.
Razavi darbar, S. and Lakzian, A.: Evaluation of chemical and biological consequences of soil sterilization methods, Caspian J. Environ. Sci., 5, 87–91, 2007.
Rinnan, R., Impiö, M., Silvola, J., Holopainen, T., and Martikainen, P. J.: Carbon dioxide and methane fluxes in boreal peatland microcosms with different vegetation cover-effects of ozone or ultraviolet-B exposure, Oecologia, 137, 475–483, https://doi.org/10.1007/s00442-003-1366-5, 2003.
Roser, M. and Ritchie, H.: Yields and Land Use in Agriculture, OurWorldInData.org, available at: https://ourworldindata.org/yields-and-land-use-in-agriculture (25 June 2018), 2018.
Rossabi, S., Choudoir, M., Helmig, D., Hueber, J., and Fierer, N.: Volatile Organic Compound Emissions From Soil Following Wetting Events, J. Geophys. Res.-Biogeosci., 123, 1988–2001, https://doi.org/10.1029/2018JG004514, 2018.
Ruiz, J., Bilbao, R., and Murillo, M. B.: Adsorption of different VOC onto soil minerals from gas phase: Influence of mineral, type of VOC, and air humidity, Environ. Sci. Technol., 32, 1079–1084, 1998.
Sanhueza, E. and Andreae, M. O.: Emission of Formic and Acetic-Acids from Tropical Savanna Soils, Geophys. Res. Lett., 18, 1707–1710, 1991.
Sanhueza, E., Holzinger, R., Kleiss, B., Donoso, L., and Crutzen, P. J.: New insights in the global cycle of acetonitrile: release from theocean and dry deposition in the tropical savanna of Venezuela, Atmos. Chem. Phys., 4, 275–280, https://doi.org/10.5194/acp-4-275-2004, 2004.
Sassine, M., Burel, L., D'Anna, B., and George, C.: Kinetics of the tropospheric formaldehyde loss onto mineral dust and urban surfaces, Atmos. Environ., 44, 5468–5475, 2010.
Schade, G. W. and Goldstein, A. H.: Fluxes of oxygenated volatile organic compounds from a ponderosa pine plantation, J. Geophys. Res.-Atmos., 106, 3111–3123, 2001.
Schade, G. W. and Goldstein, A. H.: Plant physiological influences on the fluxes of oxygenated volatile organic compounds from ponderosa pine trees, J. Geophys. Res.-Atmos., 107, 408, https://doi.org/10.1029/2001JD000532, 2002.
Schade, G. W. and Custer, T. G.: OVOC emissions from agricultural soil in northern Germany during the 2003 European heat wave, Atmos. Environ., 38, 6105–6114, 2004.
Schade, G. W., Solomon, S. J., Dellwik, E., Pilegaard, K., and Ladstatter-Weissenmayer, A.: Methanol and other VOC fluxes from a Danish beech forest during late springtime, Biogeochemistry, 106, 337–355, 2011.
Schobesberger, S., Lopez-Hilfiker, F. D., Taipale, D., Millet, D. B., D'Ambro, E. L., Rantala, P., Mammarella, I., Zhou, P., Wolfe, G. M., Lee, B. H., Boy, M., and Thornton, J. A.: High upward fluxes of formic acid from a boreal forest canopy, Geophys. Res. Lett., 43, 9342–9351, https://doi.org/10.1002/2016GL069599, 2016.
Scholler, C. E. G., Gurtler, H., Pedersen, R., Molin, S., and Wilkins, K.: Volatile metabolites from actinomycetes, J. Agr. Food Chem., 50, 2615–2621, 2002.
Seco, R., Penuelas, J., and Filella, I.: Short-chain oxygenated VOCs: Emission and uptake by plants and atmospheric sources, sinks, and concentrations, Atmos. Environ., 41, 2477–2499, 2007.
Seinfeld, J. H. and Pandis, S. N.: Dry Deposition, in: Atmospheric Chemistry and Physics: from Air Pollution to Climate Change, 3rd ed., John Wiley & Sons, Inc., Hoboken, New Jersey, 900–931, 2016.
Sempére, R. and Kawamura, K.: Comparative distributions of dicarboxylic acids and related polar compounds in snow, rain and aerosols from urban atmosphere, Atmos. Environ., 28, 449–459, https://doi.org/10.1016/1352-2310(94)90123-6, 1994.
Simonich, S. L. and Hites, R. A.: Organic Pollutant Accumulation in Vegetation, Environ. Sci. Technol., 29, 2905–2914, 1995.
Singh, H., Chen, Y., Tabazadeh, A., Fukui, Y., Bey, I., Yantosca, R., Jacob, D., Arnold, F., Wohlfrom, K., Atlas, E., Flocke, F., Blake, D., Blake, N., Heikes, B., Snow, J., Talbot, R., Gregory, G., Sachse, G., Vay, S., and Kondo, Y.: Distribution and fate of selected oxygenated organic species in the troposphere and lower stratosphere over the Atlantic, J. Geophys. Res.-Atmos., 105, 3795–3805, https://doi.org/10.1029/1999JD900779, 2000.
Singh, H. B., Kanakidou, M., Crutzen, P. J., and Jacob, D. J.: High concentrations and photochemical fate of oxygenated hydrocarbons in the global troposphere, Nature, 378, 50–54, https://doi.org/10.1038/378050a0, 1995.
Singh, H. B., Salas, L. J., Chatfield, R. B., Czech, E., Fried, A., Walega, J., Evans, M. J., Field, B. D., Jacob, D. J., Blake, D., Heikes, B., Talbot, R., Sachse, G., Crawford, J. H., Avery, M. A., Sandholm, S., and Fuelberg, H.: Analysis of the atmospheric distribution, sources, and sinks of oxygenated volatile organic chemicals based on measurements over the Pacific during TRACE-P, J. Geophys. Res.-Atmos., 109, D15S07, https://doi.org/10.1029/2003JD003883, 2004.
Stacheter, A., Noll, M., Lee, C. K., Selzer, M., Glowik, B., Ebertsch, L., Mertel, R., Schulz, D., Lampert, N., Drake, H. L., and Kolb, S.: Methanol oxidation by temperate soils and environmental determinants of associated methylotrophs, The ISME Journal, 7, 1051–1064, https://doi.org/10.1038/ismej.2012.167, 2013.
Stavrakou, T., Muller, J. F., Peeters, J., Razavi, A., Clarisse, L., Clerbaux, C., Coheur, P. F., Hurtmans, D., De Maziere, M., Vigouroux, C., Deutscher, N. M., Griffith, D. W. T., Jones, N., and Paton-Walsh, C.: Satellite evidence for a large source of formic acid from boreal and tropical forests, Nat. Geosci., 5, 26–30, 2012.
Stickler, A., Fischer, H., Bozem, H., Gurk, C., Schiller, C., Martinez-Harder, M., Kubistin, D., Harder, H., Williams, J., Eerdekens, G., Yassaa, N., Ganzeveld, L., Sander, R., and Lelieveld, J.: Chemistry, transport and dry deposition of trace gases in the boundary layer over the tropical Atlantic Ocean and the Guyanas during the GABRIEL field campaign, Atmos. Chem. Phys., 7, 3933–3956, https://doi.org/10.5194/acp-7-3933-2007, 2007.
Su, H., Cheng, Y., Oswald, R., Behrendt, T., Trebs, I., Meixner, F. X., Andreae, M. O., Cheng, P., Zhang, Y., and Pöschl, U.: Soil Nitrite as a Source of Atmospheric HONO and OH Radicals, Science, 333, 1616–1618, https://doi.org/10.1126/science.1207687, 2011.
Su, H., Cheng, Y., and Pöschl, U.: The Exchange of Soil Nitrite and Atmospheric HONO: A Missing Process in the Nitrogen Cycle and Atmospheric Chemistry, in: Disposal of Dangerous Chemicals in Urban Areas and Mega Cities: Role of Oxides and Acids of Nitrogen in Atmospheric Chemistry, edited by: Barnes, I. and Rudziński, K. J., Springer Netherlands, Dordrecht, 93–99, 2013.
Tie, X., Guenther, A., and Holland, E.: Biogenic methanol and its impacts on tropospheric oxidants, Geophys. Res. Lett., 30, 1881, https://doi.org/10.1029/2003GL017167, 2003.
Tong, H., Arangio, A. M., Lakey, P. S. J., Berkemeier, T., Liu, F., Kampf, C. J., Brune, W. H., Pöschl, U., and Shiraiwa, M.: Hydroxyl radicals from secondary organic aerosol decomposition in water, Atmos. Chem. Phys., 16, 1761–1771, https://doi.org/10.5194/acp-16-1761-2016, 2016.
Tuazon, E. C., Arey, J., Atkinson, R., and Aschmann, S. M.: Gas-phase reactions of 2-vinylpyridine and styrene with hydroxyl and NO3 radicals and ozone, Environ. Sci. Technol., 27, 1832–1841, https://doi.org/10.1021/es00046a011, 1993.
Tunved, P., Hansson, H. C., Kerminen, V. M., Strom, J., Dal Maso, M., Lihavainen, H., Viisanen, Y., Aalto, P. P., Komppula, M., and Kulmala, M.: High natural aerosol loading over boreal forests, Science, 312, 261–263, 2006.
VandenBoer, T. C., Young, C. J., Talukdar, R. K., Markovic, M. Z., Brown, S. S., Roberts, J. M., and Murphy, J. G.: Nocturnal loss and daytime source of nitrous acid through reactive uptake and displacement, Nat. Geosci., 8, 55–60, 2015.
van Pinxteren, D., Plewka, A., Hofmann, D., Müller, K., Kramberger, H., Svrcina, B., Bächmann, K., Jaeschke, W., Mertes, S., Collett, J. L., and Herrmann, H.: Schmücke hill cap cloud and valley stations aerosol characterisation during FEBUKO (II): Organic compounds, Atmos. Environ., 39, 4305–4320, https://doi.org/10.1016/j.atmosenv.2005.02.014, 2005.
van Roon, A., Parsons, J. R., Krap, L., and Govers, H. A. J.: Fate and transport of monoterpenes through soils. Part II: Calculation of the effect of soil temperature, water saturation and organic carbon content, Chemosphere, 61, 129–138, 2005.
Veres, P. R., Roberts, J. M., Cochran, A. K., Gilman, J. B., Kuster, W. C., Holloway, J. S., Graus, M., Flynn, J., Lefer, B., Warneke, C., and de Gouw, J.: Evidence of rapid production of organic acids in an urban air mass, Geophys. Res. Lett., 38, L17807, https://doi.org/10.1029/2011GL048420, 2011.
Verma, V., Fang, T., Xu, L., Peltier, R. E., Russell, A. G., Ng, N. L., and Weber, R. J.: Organic Aerosols Associated with the Generation of Reactive Oxygen Species (ROS) by Water-Soluble PM2.5, Environ. Sci. Technol., 49, 4646–4656, https://doi.org/10.1021/es505577w, 2015.
Vet, R., Artz, R. S., Carou, S., Shaw, M., Ro, C.-U., Aas, W., Baker, A., Bowersox, V. C., Dentener, F., Galy-Lacaux, C., Hou, A., Pienaar, J. J., Gillett, R., Forti, M. C., Gromov, S., Hara, H., Khodzher, T., Mahowald, N. M., Nickovic, S., Rao, P. S. P., and Reid, N. W.: A global assessment of precipitation chemistry and deposition of sulfur, nitrogen, sea salt, base cations, organic acids, acidity and pH, and phosphorus, Atmos. Environ., 93, 3–100, https://doi.org/10.1016/j.atmosenv.2013.10.060, 2014.
Vlasenko, A., George, I. J., and Abbatt, J. P. D.: Formation of Volatile Organic Compounds in the Heterogeneous Oxidation of Condensed-Phase Organic Films by Gas-Phase OH, J. Phys. Chem. A, 112, 1552–1560, https://doi.org/10.1021/jp0772979, 2008.
Vlasenko, A., Macdonald, A. M., Sjostedt, S. J., and Abbatt, J. P. D.: Formaldehyde measurements by Proton transfer reaction – Mass Spectrometry (PTR-MS): correction for humidity effects, Atmos. Meas. Tech., 3, 1055–1062, https://doi.org/10.5194/amt-3-1055-2010, 2010.
Volkamer, R., Jimenez, J. L., San Martini, F., Dzepina, K., Zhang, Q., Salcedo, D., Molina, L. T., Worsnop, D. R., and Molina, M. J.: Secondary organic aerosol formation from anthropogenic air pollution: Rapid and higher than expected, Geophys. Res. Lett., 33, L17811, https://doi.org/10.1029/2006GL026899, 2006.
Wagner, P. and Kuttler, W.: Biogenic and anthropogenic isoprene in the near-surface urban atmosphere – A case study in Essen, Germany, Sci. Total Environ., 475, 104–115, https://doi.org/10.1016/j.scitotenv.2013.12.026, 2014.
Wagner, V., von Glasow, R., Fischer, H., and Crutzen, P. J.: Are CH2O measurements in the marine boundary layer suitable for testing the current understanding of CH4 photooxidation?: A model study, J. Geophys. Res.-Atmos., 107, ACH 3-1–ACH 3-14, https://doi.org/10.1029/2001JD000722, 2002.
Walser, M. L., Park, J., Gomez, A. L., Russell, A. R., and Nizkorodov, S. A.: Photochemical Aging of Secondary Organic Aerosol Particles Generated from the Oxidation of d-Limonene, J. Phys. Chem. A, 111, 1907–1913, https://doi.org/10.1021/jp066293l, 2007.
Wang, J.-L., Chew, C., Chang, C.-Y., Liao, W.-C., Lung, S.-C. C., Chen, W.-N., Lee, P.-J., Lin, P.-H., and Chang, C.-C.: Biogenic isoprene in subtropical urban settings and implications for air quality, Atmos. Environ., 79, 369–379, https://doi.org/10.1016/j.atmosenv.2013.06.055, 2013.
Wang, L., Wang, W. G., and Ge, M. F.: Heterogeneous uptake of NO2 on soils under variable temperature and relative humidity conditions, J. Environ. Sci.-China, 24, 1759–1766, https://doi.org/10.1016/S1001-0742(11)61015-2, 2012.
Warneck, P. and Williams, J.: Trace Gases, in: The Atmospheric Chemist's Companion: Numerical Data for Use in the Atmospheric Sciences, Springer Netherlands, Dordrecht, 69–125, 2012.
Warneke, C., Karl, T., Judmaier, H., Hansel, A., Jordan, A., Lindinger, W., and Crutzen, P. J.: Acetone, methanol, and other partially oxidized volatile organic emissions from dead plant matter by abiological processes: Significance for atmospheric HOx chemistry, Global Biogeochem. Cy., 13, 9–17, 1999.
Warneke, C., Veres, P., Holloway, J. S., Stutz, J., Tsai, C., Alvarez, S., Rappenglueck, B., Fehsenfeld, F. C., Graus, M., Gilman, J. B., and de Gouw, J. A.: Airborne formaldehyde measurements using PTR-MS: calibration, humidity dependence, inter-comparison and initial results, Atmos. Meas. Tech., 4, 2345–2358, https://doi.org/10.5194/amt-4-2345-2011, 2011.
Wesely, M. L.: Parameterization of Surface Resistances to Gaseous Dry Deposition in Regional-Scale Numerical Models, Atmos. Environ., 23, 1293–1304, 1989.
Williams, J.: Organic Trace Gases in the Atmosphere: An Overview, Environ. Chem., 1, 125–136, https://doi.org/10.1071/EN04057, 2004.
Williams, J., Keßel, S. U., Nölscher, A. C., Yang, Y., Lee, Y., Yáñez-Serrano, A. M., Wolff, S., Kesselmeier, J., Klüpfel, T., Lelieveld, J., and Shao, M.: Opposite OH reactivity and ozone cycles in the Amazon rainforest and megacity Beijing: Subversion of biospheric oxidant control by anthropogenic emissions, Atmos. Environ., 125, 112–118, https://doi.org/10.1016/j.atmosenv.2015.11.007, 2016.
Xing, B. and Pignatello, J. J.: Time-dependent isotherm shape of organic compounds in soil organic matter: Implications for sorption mechanism, Environ. Toxicol. Chem., 15, 1282–1288, https://doi.org/10.1002/etc.5620150805, 1996.
Yuan, B., Shao, M., de Gouw, J., Parrish, D. D., Lu, S. H., Wang, M., Zeng, L. M., Zhang, Q., Song, Y., Zhang, J. B., and Hu, M.: Volatile organic compounds (VOCs) in urban air: How chemistry affects the interpretation of positive matrix factorization (PMF) analysis, J. Geophys. Res.-Atmos., 117, D24302, 2012.
Yuan, B., Hu, W. W., Shao, M., Wang, M., Chen, W. T., Lu, S. H., Zeng, L. M., and Hu, M.: VOC emissions, evolutions and contributions to SOA formation at a receptor site in eastern China, Atmos. Chem. Phys., 13, 8815–8832, https://doi.org/10.5194/acp-13-8815-2013, 2013.
Yuan, B., Veres, P. R., Warneke, C., Roberts, J. M., Gilman, J. B., Koss, A., Edwards, P. M., Graus, M., Kuster, W. C., Li, S.-M., Wild, R. J., Brown, S. S., Dubé, W. P., Lerner, B. M., Williams, E. J., Johnson, J. E., Quinn, P. K., Bates, T. S., Lefer, B., Hayes, P. L., Jimenez, J. L., Weber, R. J., Zamora, R., Ervens, B., Millet, D. B., Rappenglück, B., and de Gouw, J. A.: Investigation of secondary formation of formic acid: urban environment vs. oil and gas producing region, Atmos. Chem. Phys., 15, 1975–1993, https://doi.org/10.5194/acp-15-1975-2015, 2015.
Yuan, B., Koss, A. R., Warneke, C., Coggon, M., Sekimoto, K., and de Gouw, J. A.: Proton-Transfer-Reaction Mass Spectrometry: Applications in Atmospheric Sciences, Chem. Rev., 117, 13187–13229, https://doi.org/10.1021/acs.chemrev.7b00325, 2017.
Zender, C. S., Miller, R. L. L., and Tegen, I.: Quantifying mineral dust mass budgets:Terminology, constraints, and current estimates, Eos, Transactions American Geophysical Union, 85, 509–512, https://doi.org/10.1029/2004EO480002, 2011.
Zepp, R. G., Erickson Iii, D. J., Paul, N. D., and Sulzberger, B.: Interactive effects of solar UV radiation and climate change on biogeochemical cycling, Photochem. Photobiol. Sci., 6, 286–300, https://doi.org/10.1039/B700021A, 2007.
Zhang, L., Moran, M. D., Makar, P. A., Brook, J. R., and Gong, S.: Modelling gaseous dry deposition in AURAMS: a unified regional air-quality modelling system, Atmos. Environ., 36, 537–560, https://doi.org/10.1016/S1352-2310(01)00447-2, 2002.
Zhang, L., Brook, J. R., and Vet, R.: A revised parameterization for gaseous dry deposition in air-quality models, Atmos. Chem. Phys., 3, 2067–2082, https://doi.org/10.5194/acp-3-2067-2003, 2003.
Zhang, Y. H., Su, H., Zhong, L. J., Cheng, Y. F., Zeng, L. M., Wang, X. S., Xiang, Y. R., Wang, J. L., Gao, D. F., Shao, M., Fan, S. J., and Liu, S. C.: Regional ozone pollution and observation-based approach for analyzing ozone–precursor relationship during the PRIDE-PRD2004 campaign, Atmos. Environ., 42, 6203–6218, https://doi.org/10.1016/j.atmosenv.2008.05.002, 2008.