the Creative Commons Attribution 4.0 License.
the Creative Commons Attribution 4.0 License.
Estimating cloud condensation nuclei number concentrations using aerosol optical properties: role of particle number size distribution and parameterization
Yicheng Shen
Krista Luoma
Helmi Keskinen
Pasi P. Aalto
Xuguang Chi
Ximeng Qi
Xin Huang
Tuukka Petäjä
Markku Kulmala
Veli-Matti Kerminen
The concentration of cloud condensation nuclei (CCN) is an essential parameter affecting aerosol–cloud interactions within warm clouds. Long-term CCN number concentration (NCCN) data are scarce; there are a lot more data on aerosol optical properties (AOPs). It is therefore valuable to derive parameterizations for estimating NCCN from AOP measurements. Such parameterizations have already been made, and in the present work a new parameterization is presented. The relationships between NCCN, AOPs, and size distributions were investigated based on in situ measurement data from six stations in very different environments around the world. The relationships were used for deriving a parameterization that depends on the scattering Ångström exponent (SAE), backscatter fraction (BSF), and total scattering coefficient (σsp) of PM10 particles. The analysis first showed that the dependence of NCCN on supersaturation (SS) can be described by a logarithmic fit in the range SS <1.1 %, without any theoretical reasoning. The relationship between NCCN and AOPs was parameterized as SAE ln(SS/(0.093±0.006))(BSF − BSFmin) + (5.2±3.3))σsp, where BSFmin is the minimum BSF, in practice the 1st percentile of BSF data at a site to be analyzed. At the lowest supersaturations of each site (SS ≈0.1 %), the average bias, defined as the ratio of the AOP-derived and measured NCCN, varied from ∼0.7 to ∼1.9 at most sites except at a Himalayan site where the bias was >4. At SS >0.4 % the average bias ranged from ∼0.7 to ∼1.3 at most sites. For the marine-aerosol-dominated site Ascension Island the bias was higher, ∼1.4–1.9. In other words, at SS >0.4 % NCCN was estimated with an average uncertainty of approximately 30 % by using nephelometer data. The biases were mainly due to the biases in the parameterization related to the scattering Ångström exponent (SAE). The squared correlation coefficients between the AOP-derived and measured NCCN varied from ∼0.5 to ∼0.8. To study the physical explanation of the relationships between NCCN and AOPs, lognormal unimodal particle size distributions were generated and NCCN and AOPs were calculated. The simulation showed that the relationships of NCCN and AOPs are affected by the geometric mean diameter and width of the size distribution and the activation diameter. The relationships of NCCN and AOPs were similar to those of the observed ones.
- Article
(1905 KB) - Full-text XML
-
Supplement
(1435 KB) - BibTeX
- EndNote
Aerosol–cloud interactions (ACIs) are the most significant sources of uncertainty in estimating the radiative forcing of the Earth's climate system (e.g., Forster et al., 2007; Kerminen et al., 2012), which makes it more challenging to predict future climate change (Schwartz et al., 2010). An essential parameter affecting ACI within warm clouds is the concentration of cloud condensation nuclei (CCN), i.e., the number concentration of particles capable of initiating cloud droplet formation at a given supersaturation. Determining CCN concentrations and their temporal and spatial variations is one of the critical aspects to reduce such uncertainty.
CCN number concentrations (NCCN) have been measured at different locations worldwide (e.g., Twomey, 1959; Hudson, 1993; Kulmala et al., 1993; Hämeri et al., 2001; Sihto et al., 2011; Pöhlker et al., 2016; Ma et al., 2014). However, the accessible data, especially for long-term measurements, are still limited in the past and today due to the relatively high cost of instrumentation and the complexity of long-term operating. As an alternative to direct measurement, NCCN can also be estimated from particle number size distributions and chemical composition using the Köhler equation. Several studies have investigated the relative importance of the chemical composition and particle number distributions for the estimation of NCCN (Dusek et al., 2006a; Ervens et al., 2007; Hudson, 2007; Crosbie et al., 2015). For the best of our understanding, particle number size distributions are more important in determining NCCN than aerosol chemical composition. This makes particle number size distribution measurements capable of serving as a supplement to direct CCN measurements.
Considering the tremendous spatiotemporal heterogeneity of atmospheric aerosol, neither direct measurements of NCCN nor the concentrations estimated from particle size distributions are adequate for climate research. In order to overcome the limitation of current measurements, many studies have attempted to estimate NCCN using aerosol optical properties (AOPs) (e.g., Ghan et al., 2006; Shinozuka et al., 2009; Andreae, 2009; Jefferson, 2010; Liu and Li, 2014; Shinozuka et al., 2015; Tao et al., 2018). This approach would give both geographically wider and temporally longer estimates of NCCN than the available particle number size distribution and direct CCN measurement data. For instance, on 20 June 2019 the WMO Global Atmosphere Watch World Data Centre for Aerosols (GAW WDCA) (http://ebas.nilu.no/, last access: 20 June 2019) contained particle number size distribution datasets from 22 countries altogether from 58 stations, but only five of them were outside Europe. The CCN counter (CCNC) data were from three European sites. On the other hand, in the same database, the light-scattering coefficients measured with a nephelometer were from 31 countries and 103 stations located on all continents and also on some islands. The temporal coverage data in the GAW WDCA database is such that the oldest nephelometer data, those from Mauna Loa, start in 1974, whereas the oldest particle number size distribution data, those from the SMEAR II station in Finland, start in 1993. Another easily available source for data is the US Department of Energy Atmospheric Radiation Measurement (ARM) user facility (https://www.arm.gov/data, last access: 2 December 2019). On 20 June 2019 we found that the ARM research facility data contained particle size distribution data from seven permanent sites and light-scattering coefficients measured with a nephelometer from 20 sites. It is clear that there are other datasets of these parameters measured around the world, but those that can be found either from the GAW WDCA or the ARM databases are quality controlled and readily available.
Most of the abovementioned studies attempted to link NCCN with extensive AOPs, such as the aerosol extinction coefficient (σext), aerosol scattering coefficient (σsp), and aerosol optical depth (AOD). Both NCCN and σsp are extensive properties that vary with a varying aerosol loading. The most straightforward approach to estimate CCN is to utilize the ratio between CCN and one of the extensive AOPs (e.g., AOD, σext, σsp). However, the ratio is not a constant. Previous studies have also pointed out that the relationship between NCCN and extensive AOPs is nonlinear. On the one hand, Andreae (2009) reported that the relationship between AOD at the wavelength λ=500 nm (AOD500) and CCN number concentration at the supersaturation of 0.4 % (CCN0.4) can be written as AOD (CCN0.4)0.640, which indicates that AOD and CCN depend in a nonlinear way on each other: for a larger AOD there are more CCN per unit change in AOD. On the other hand, Shinozuka et al. (2015) indicated that the larger the extinction coefficient σext was, the fewer CCN there were per unit change of σext.
Some studies have also involved intensive aerosol optical properties, such as the scattering Ångström exponent (SAE), hemispheric backscattering fraction (BSF), and single-scattering albedo (SSA) to build up a bridge between the NCCN and AOPs. Jefferson (2010) used BSF and SSA to parameterize the coefficients C and k in the relation NCCN(SS) = C× (SS)k, where SS is the supersaturation percent (Twomey, 1959) and the exponent k is a function of SSA, which means it depends on both the scattering and absorption coefficients. Liu and Li (2014) discussed how different aerosol properties affect the ratio of NCCN to σsp, i.e., RCCN/σsp based on in situ and remote-sensing data. Shinozuka et al. (2015) used SAE and aerosol extinction coefficient to estimate NCCN. Tao et al. (2018) used a novel method to derive the ratio RCCN∕σsp, which they named ARsp, based on SAE and aerosol hygroscopicity using a humidified nephelometer. All the studies mentioned above noted that the particle number size distribution (PNSD) plays an important role in estimating NCCN from aerosol optical properties.
In this paper we will analyze the relationships between NCCN, aerosol optical properties, and size distributions at six different types of sites around the world. The relationships obtained from the field sites will be used for developing a parameterization for calculating NCCN using AOPs. We will also study the physical explanations of the relationships between NCCN and AOPs by simulations.
2.1 Sites and measurements
In situ measurements of AOPs, particle number size distributions (PNSDs), and NCCN were conducted at SMEAR II in Finland, SORPES in China, and four ARM Climate Research Facility (ACRF) sites (Mather and Voyles, 2013). The locations and measurement periods are listed in Table 1.
Table 1Site and data description. NA denotes “not available”.
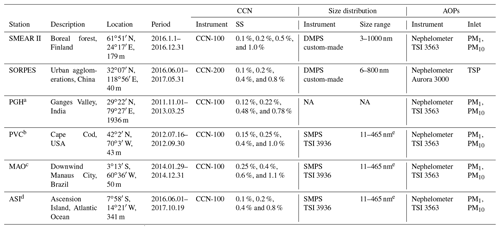
a Used products: aipavg1ogrenM1.c1. and aosccnavgM1.c2. b Used products: aipavg1ogrenM1.s1., noaaaosccn100M1.b1., and aossmpsS1.a1. c Used products: aip1ogrenM1.c1., aosccn1colM1.b1., and aossmpsS1.a1. d Used products: aosnephdryM1.b1., aosccn2colaavgM1.b1., and aossmpsM1.a1. e Vary slightly.
The Station for Measuring Forest Ecosystem-Atmosphere Relations (SMEAR II) is located at the Hyytiälä Forestry Field Station (61∘51′ N, 24∘17′ E, 181 m above sea level) of the University of Helsinki, 60 km northeast of the nearest city. The station represents boreal coniferous forest, which covers ∼8 % of the Earth's surface. Total scattering coefficient (σsp) and hemispheric backscattering coefficient (σbsp) of sub-1 µm and sub-10 µm particles are measured using a TSI 3563 three-wavelength integrating nephelometer at λ=450, 550, and 700 nm. The calibration, data processing, and calculation of AOPs followed the procedure described by Virkkula et al. (2011) and Luoma et al. (2019). NCCN was measured at the supersaturations (SS) of 0.1 %, 0.2 %, 0.3 %, 0.5 %, and 1.0 % using a DMT CCN-100 CCN counter, similar to Schmale et al. (2017). A whole measurement cycle takes around 2 h; data were interpolated to hourly time resolution to compare with other measurements. PNSDs were measured with a custom-made differential mobility particle sizer (DMPS) system in the size range 3–1000 nm (Aalto et al., 2001). A more detailed description of CCN measurements and station operation can be found in Sihto et al. (2011) and Paramonov et al. (2015).
The Station for Observing Regional Processes of the Earth System (SORPES) is located in a suburb of Nanjing, a megacity in the Yangtze River Delta municipal aggregation (32∘07′14′′ N, 118∘57′10′′ E; ∼40 m a.s.l.). σsp and σbsp of total suspended particles (TSPs) were measured with an Ecotech Aurora 3000 three-wavelength integrating nephelometer at λ=450, 525, and 635 nm as described by Shen et al. (2018). NCCN was measured using a CCN-200 dual column CCN counter at five supersaturations: 0.1 %, 0.2 %, 0.4 %, 0.6 %, and 0.8 %. The two columns carry out the same cycle simultaneously to cross-check with each other. Each cycle took 30 min. PNSDs in the size range of 6–800 nm were measured with a DMPS built by the University of Helsinki. More details of the measurements at SORPES are given by Ding et al. (2013, 2016) and Qi et al. (2015).
The US Atmospheric Radiation Measurement Mobile Facility (AMF) measures atmospheric aerosol and radiation properties all over the world. The first AMF (AMF1) was deployed in 2005 with both a CCN counter and a nephelometer. Between 2011 and 2018, AMF1 was operated at four locations: Ganges Valley (PGH) in the Himalayas, Cape Cod, Massachusetts (PVC) in a coastal area of the US, Manacapuru (MAO) downwind of the city of Manaus, Brazil, and Ascension Island (ASI) in the South Atlantic Ocean downwind from Africa. Three of them were accompanied by a scanning mobility particle sizer (SMPS; Kuang, 2016). The SMPS is also part of the aerosol observing system (AOS) running side by side with AMF1 since 2012. Both PNSDs and AOPs are available simultaneously at PVC, MAO, and ASI. σsp and σbsp of sub-1 and sub-10 µm particles are measured at all AMF1 locations by integrating nephelometers (Uin, 2016a). The size range of the SMPS is around 11–465 nm with slightly different ranges for different periods. NCCN is measured at different supersaturations, with the details given in Table 1. The supersaturations are typically calibrated before and after each campaign at an altitude similar to that of the measurement site according to the CCN handbook (Uin, 2016b). Detailed information about each dataset and measurement site can be found in the AOS handbook (Jefferson, 2011) or ARM web site (http://www.arm.gov/, last access: 2 December 2019) and references thereby.
Ganges Valley (PGH) is located in one of the largest and most rapidly developing sections of the Indian subcontinent. The aerosols in this region have complex sources, including coal combustion, biomass burning, automobile emissions, and dust. In monsoon seasons, dust dominates the aerosol mass due to transportation (Dumka et al., 2017; Gogoi et al., 2015).
PVC refers to the onshore dataset for the “first column” of the Two-Column Aerosol Project (TCAP) on Cape Cod, Massachusetts, USA. This is a coastal site but also significantly affected by anthropogenic emissions (Berg et al., 2016).
MAO refers to Manacapuru in Amazonas, Brazil. It is a relatively clean site where Manaus pollution plumes and biomass burning plumes impact the background pristine rainforest aerosol alternately (e.g., de Sá et al., 2019).
Ascension Island (ASI) is located in the southeast Atlantic where westward transport of biomass-burning aerosols from southern Africa may increase aerosol concentrations to high levels. Air mass at this site is usually a mixture with aged biomass-burning plume and sea-salt aerosol. The aerosol loading can be very low when there is no pollution plume. In this case, there is a substantial uncertainty on the backscatter fraction.
The primary purpose of this study is to use as basic and readily accessible measurement data as possible to estimate NCCN. Aerosol optical properties are measured at different cutoff diameters, usually 1, 2.5, or 10 µm or TSP. At several stations there are two sets of AOPs using two cutoff diameters. For this study we chose to use AOP data with the 10 µm cutoff (if data for both 10 and 1 µm are available), which is more commonly used than smaller cutoff diameters.
2.2 Data processing
Regardless of the time resolution of raw data, all the data in this study were adjusted into hourly averages before further analyses. Suspicious data within the whole dataset were removed according to the following criteria.
-
For the size distributions, all the data with unexplainable spikes were removed manually.
-
For CCN measurements, insufficient water supply may cause underestimation of CCN, especially at lower supersaturations (DMT, 2009). NCCN reading at lower SS has a sudden drop a few hours before the similar sudden drop for higher SS under such conditions, so data from such periods were removed.
-
If any obvious inconsistencies between the AOPs and PNSD or between the NCCN and PNSD were found on closer study, all the data in the same hour were removed.
Special treatments were carried out for the ASI dataset. There will inevitably be a considerable uncertainty in the backscattering fraction if the zero point of either σsp or σbsp is inaccurate in very clean conditions. The measured σsp was in agreement with that calculated from the PNSD with the Mie model. However, in the data σbsp approaches 0.3 Mm−1 whenever σsp approaches 0. Thus, we subtracted from backscattering coefficients a constant 0.3 Mm−1 and no longer used any data points with σsp<2 Mm−1 for this site to assure the data quality.
A more detailed description of the total number of available hourly-averaged data, accepted data, and removed data and the fractions of these are presented in the Sect. S1.
2.3 Optical properties calculated from the nephelometer data
The hemispheric backscatter fraction BSF was calculated from
where σsp and σbsp are the total scattering coefficient and backscattering coefficient, respectively. BSF depends on both particle size and shape. For very small particles, BSF approaches the value of 0.5 and decreases with an increasing particle size (e.g., Wiscombe and Grams, 1976; Horvath et al., 2016; Shen et al., 2018). Jefferson (2010) used BSF as a proxy for the particle size for estimating CCN concentrations from in situ AOP measurements.
Scattering Ångström exponent (SAE) was calculated from total scattering coefficients σsp at wavelengths λ1 and λ2 from
For those sites where the TSI 3563 nephelometer was used the wavelength pair was 450 and 700 nm, and for the Ecotech Aurora 3000 nephelometer the wavelength pair was 450 and 635 nm. SAE is typically considered to be associated with the dominating particle size. Its large values (e.g., SAE >2) indicate a large contribution of small particles, whereas small values (e.g., SAE <1) indicate a large contribution of large particles. SAE can be retrieved by remote-sensing measurements and it serves as a proxy for particle size for satellite (e.g., Higurashi and Nakajima, 1999; King et al., 1999; Liu et al., 2008) and sun photometry (e.g., Holben et al., 2001; Gobbi et al., 2007) retrieval of aerosol optical properties, even though it is well known that this is just a crude approximation. Many studies found that this relationship is not unambiguous. Surface mean diameter (SMD) and volume mean diameter (VMD) correlate well with SAE while geometric mean diameter (GMD) correlates poorly with SAE according to Schuster et al. (2006), Virkkula et al. (2011), and Shen et al. (2018).
The reason for calculating both BSF and SAE in the present work is that they provide information on the particle size distribution, yet are sensitive to slightly different particle size ranges (e.g., Andrews et al., 2011; Collaud Coen et al., 2007). A detailed model analysis by Collaud Coen et al., 2007) showed that BSF is more sensitive to small accumulation mode particles, i.e., particles in the size range <400 nm, whereas SAE is more sensitive to particles in the size range of 500–800 nm.
2.4 Light-scattering calculated from the particle number size distributions
Light-scattering coefficients (both σsp and σbsp) were calculated using the Mie code similar to Bohren and Huffman (1983). The refractive index was set to the average value of 1.517+0.019i reported for SMEAR II by Virkkula et al. (2011). The wavelength for Mie modeling was set to 550 nm, which is the same as in the measurements. The whole size range of the DMPS or the SMPS, depending on the station, was used. BSF was calculated from Eq. (1) by using the modeled σsp and σbsp. Both the size range and the selected constant refractive index create uncertainty, especially when the modeled scattering is compared with scattering of PM10 aerosols. However, the purpose of the modeled scattering was quality control and removal of inconsistent data.
2.5 CCN number concentration calculated from the particle number size distribution
The κ-Köhler theory uses a single parameter κ to describe the relationship between hygroscopicity and water vapor saturation (Petters and Kreidenweis, 2007).
Here S(D) is water vapor saturation, which equals SS +100 %, D is the diameter of the wet particle, Dd is particle dry diameter, and κ is the hygroscopicity parameter. The rest of the coefficients are usually set to constant, for instance in this study, J m−2 is the surface tension of the solution–air interface, R=8.314 J mol−1 is the universal gas constant, T=298K is temperature, ρw=1000 kg m−3 is the density of water, and Mw=0.018 kg mol−1 is the molecular weight of water. At given κ and Dd, S(D) is a function of the wet diameter D, which is physically larger than Dd. As a combination of the Kelvin effect and the Raoult effect, S(D) first increases and then decreases as D increases, and there is a maximum value for S(D) in the S–D curve. Here, we call the maximum value of S(D) and corresponding D S(D)max and Dmax, respectively. Physically, if S(D)max is larger than the SS of the environment, the dry particle will reach a wet diameter D between Dd and Dmax; while if S(D)max is smaller than the SS of the environment, the dry particle can grow to infinite sizes, which means it is a so-called activated particle. S(D)max decreases monotonically as Dd increases. Thus we can iterate Dd until S(D)max equals a given SS. We call this Dd the critical diameter Dm. Particles with Dd>Dm have S(D)max< SS, and they can be activated while the smaller particles cannot.
Under the assumption of fully internally mixed particles, the CCN number concentration calculated from the particle number size distributions (NCCN(PNSD)) is obtained by integrating the PNSD of particles larger than the critical dry particle diameter (Dm),
at a given SS. All particles with a diameter larger than Dm can act as CCN. We calculated NCCN(PNSD) at the supersaturations at which CCN were measured at the different stations (e.g., 0.1 %, 0.2 %, 0.3 %, 0.5 %, and 1.0 % for SMEAR II).
The accuracy of NCCN(PNSD) is affected by the treatment of κ. In this study, we are not trying to achieve an accurate value of κ but instead want to illustrate that even an arbitrary setting of κ can yield reasonable CCN concentrations. This approach is named “unknown chemical approach” in (Kammermann et al., 2010) and as “prediction of NCCN from the constant κ” in Meng et al. (2014). Both of them give a detailed discussion of how this approach performs. Arbitrary κ does not perform as well as a proper κ when calculating NCCN, yet we believe that it is good enough to be an alternative to measuring CCN in the empirical estimation of this study. Wang et al. (2010) also claimed that NCCN(PNSD) may be successfully obtained by assuming an internal mixture and using bulk composition a few hours after emissions. For SORPES, ASI, and PVC, we simply set a global-average value of 0.27 for κ (Pringle et al., 2010; Kerminen et al., 2012). For the forest sites, SMEAR II and MAO, we set κ=0.12, which is close to the value of κ for Aitken mode particles reported previously by studies at forest sites (Sihto et al., 2011; Hong et al., 2014). Here we used NCCN(PNSD) for quality control and removal of inconsistent data.
2.6 Aerosol optical properties and CCN concentrations of simulated size distributions
For studying the relationships of particle size, NCCN, and AOPs, we generated unimodal particle number size distributions n(GMD,GSD) with varying geometric mean diameter (GMD) and geometric standard deviation (GSD). For them we calculated the same AOPs with the Mie model as were obtained from the real measurements from the stations, σsp and σbsp, and from these the BSF at the wavelength λ=550 nm. NCCN was calculated simply by integrating number concentrations of particles larger than a critical diameter of 50, 80, 90, 100, 110, and 150 nm. When the global average hygroscopicity parameter κ=0.27 is used, this corresponds to a SS range of ∼0.14 %–0.74 %.
Using a unimodal size distribution for the simulation is an approximation. In the boundary layer, particle number size distributions consist typically of an Aitken mode in the size range of ∼25–100 nm, an accumulation mode in the size range of 100–500 nm, and, following atmospheric new particle formation, also a nucleation mode in the size range of <25 nm (e.g., Dal Maso et al., 2005; Herrmann et al., 2015; Qi et al., 2015). While the particle number concentration is dominated by the smaller modes, essentially all light scattering is due to the accumulation mode and also coarse particles in the range of 1–10 µm. For example, at SMEAR II the average contribution of particles smaller than 100 nm to total scattering was ∼0.2 %, and even at the end of new particle formation events it was no more than ∼2 % (Virkkula et al., 2011). Also, most of the CCN are in the accumulation mode size range, especially at low supersaturations (SS <0.2 %); at higher SS Aitken mode particles also contribute to CCN (Sihto et al., 2011).
We first present general observations of the NCCN and AOPs at all the six sites and investigate in more detail data from SMEAR II. Based on the relationships of AOPs and NCCN at SMEAR II, we further use data from all the stations and develop a simple and general combined parameterization for estimating NCCN.
3.1 Site-dependent NCCN–AOP relationships
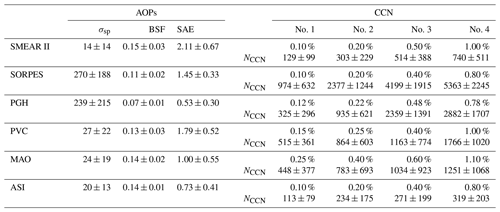
The averages of AOPs of PM10 particles and NCCN at four supersaturations during the analyzed period for each site are presented in Table 2. In general all of them are cleaner than SORPES and more polluted than SMEAR II, based on the average values of σsp. The average values of NCCN are obviously higher in more polluted air as well, as can be seen in the values presented in Table 2. The dependence of NCCN on SS is shown by plotting the averages of the measured NCCN at the six sites at the station-specific supersaturations of the CCN counters (Fig. 1). In all these different types of environments a logarithmic function fits better to the data than the power function NCCN(SS) (SS)k. It is not a new observation that the power function is not perfect for describing the NCCN vs. SS relationship. Also, other function types have been used in the literature, for instance a product of the power function and the hypergeometric function (Cohard et al., 1998; Pinsky et al., 2012), an exponential function (Ji and Shaw, 1998; Mircea et al., 2005; Deng et al., 2013), and the error function (e.g., Dusek et al., 2003, 2006b; Pöhlker et al., 2016). In the following analysis of the relationships between NCCN, AOPs, and SS we will use logarithmic fittings to the data without any theoretical reasoning.
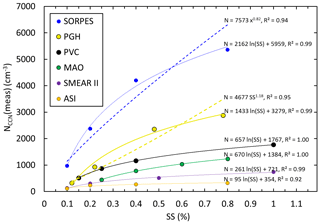
Figure 1Averages of the measured NCCN at the six sites at the station-specific supersaturations of the CCN counters and logarithmic (solid lines) and power function (dashed lines) fittings to the data.
Table 2Descriptive statistics of AOPs of PM10 aerosol and NCCN at the different sites. σsp: total scattering coefficient of green light (λ=550 or 525 nm), in reciprocal megameters; BSF: backscatter fraction of green light; SAE: scattering Ångström exponent between blue and red light. The NCCN statistics in number per cubic centimeter are presented for four supersaturations (SS) at each site.The numbers are the averages and standard deviations.
Since there is obviously a positive correlation between the averages of NCCN and σsp in Table 2, it is reasonable to study whether this is also true for the hourly-averaged data. A scatter plot shows that the correlation between NCCN and σsp was weak at SMEAR II, especially for higher supersaturations (Fig. 2). In spite of this, when the scatter plots are color-coded with respect to BSF, the relationship between NCCN and σsp becomes clear: NCCN grows almost linearly as a function of σsp for a narrow range of values of BSF. This indicates BSF can serve as a good proxy for describing the ratio between NCCN and σsp.
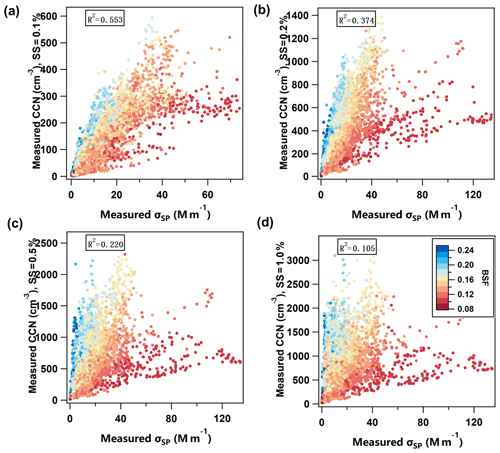
Figure 2Measured CCN number concentration NCCN(meas) vs. PM10 scattering coefficient σsp at λ=550 nm at SMEAR II at four supersaturations (SS): (a) 0.1 %, (b) 0.2 %, (c) 0.5 %, and (d) 1.0 %. Color coding: backscatter fraction (BSF) at λ=550 nm.
Hereafter, we will use the term to describe the relationship between NCCN and σsp, similar to Liu and Li (2014). Note that this same ratio was defined as ARscat in Tao et al. (2018). RCCN∕σ varies over a wide range of values, so a proper parameterization to describe it is of significance.
The first step in the development of the parameterization was to calculate linear regressions of RCCN∕σ vs. BSF. RCCN∕σ depends clearly on BSF (Fig. 3) as
The correlation between BSF and RCCN∕σ is strong when σsp>10 Mm−1. At σsp<10 Mm−1 the uncertainty of the nephelometer is higher, which may at least partly explain the lower correlation. Based on this we used σsp>10 Mm−1 as the criterion for the data fitting.
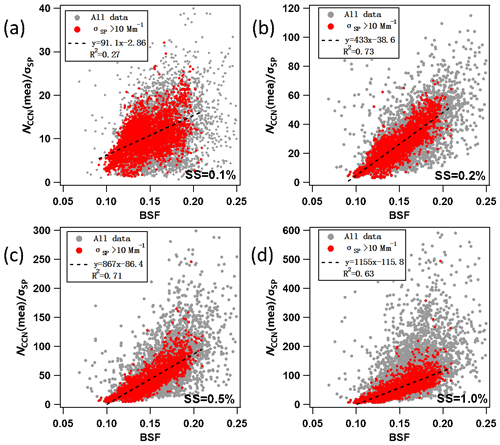
Figure 3Relationship between RCCN∕σ (=NCCN(meas)∕σsp) and BSF at SMEAR II at four supersaturations (SS): (a) 0.1 %, (b) 0.2 %, (c) 0.5 %, and (d) 1.0 %. Grey symbols: all data; red symbols: data at σsp>10 Mm−1. Both σsp and BSF were measured at λ=550 nm.
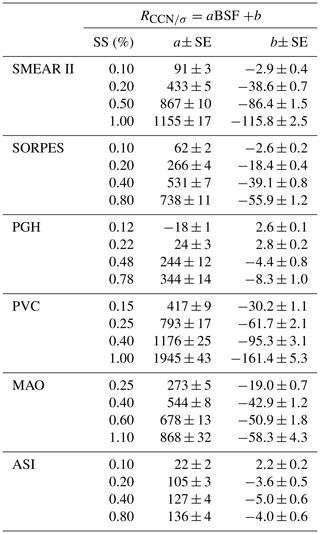
Linear regressions of RCCN∕σ vs. BSF were applied to data from all the analyzed stations. The dataset and individual supersaturation, a and b, i.e., the slope and offset of the linear regression, have different values as presented in Table 3. The calculation of a and b is based on data with σsp>10 Mm−1 only. The following discussion is based on the ordinary linear regression (OLR). In addition, we repeated the calculations with the reduced major axis (RMA) regression; see Supplement Sect. S2.
Table 3The slopes and offsets of ordinary linear regressions of RCCN∕σ vs. BSF at the different supersaturations (SS) at the studied sites. SE: standard error of the respective coefficient obtained from the linear regressions. The coefficients are written as cm−3 Mm.
The parameterization gives the formula for calculating NCCN(AOP), i.e., NCCN calculated from measurements of AOPs:
The subscript 1 for AOP1 indicates the first set of parameterization.
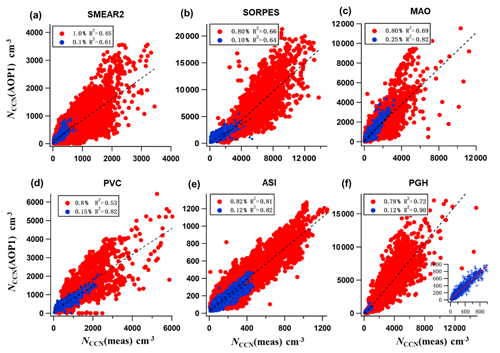
Scatter plots of NCCN(AOP1) vs. NCCN(meas) are presented for two supersaturations, high and low, at the six stations (Fig. 4). The correlation coefficient R2 between NCCN(AOP1) and NCCN(meas) is higher at lower supersaturations than that at higher supersaturations in most of the scatter plots shown in Fig. 4. A reasonable explanation for this is that the higher the supersaturation is, the smaller the particles that can act as CCN are. And further, the smaller the particles are, the less they contribute to both total scattering and backscattering and the higher the relative uncertainty of both of them and thus also the uncertainty of NCCN(AOP1) is.
3.2 Site-independent relationships between NCCN, AOPs, and supersaturations
The relationships between NCCN and AOPs are obviously different for each site and supersaturation. We next try to find a way to combine them into a site-independent form. First, the slopes and offsets obtained from the linear regression (Table 3) were plotted as a function of SS (Fig. 5). The data obviously depend logarithmically on SS, so that Eq. (6) becomes
The coefficients a0, a1, b0, and b1 obtained from the regression of aSS=a1ln(SS) +a0 and bSS=b1ln(SS) +b0 vs. the supersaturations (SSs) for each station are presented in Table 4.
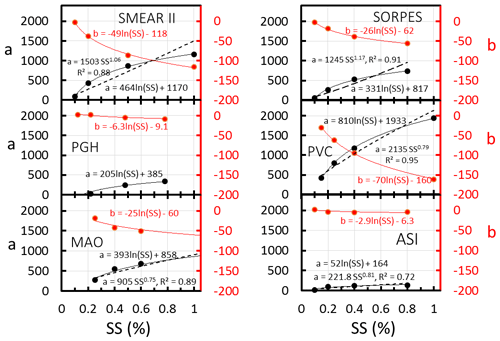
Figure 5The slopes and offsets, a and b, of the linear regressions BSF +b of each station (Table 3) as a function of supersaturation (SS). Two types of functions, a logarithmic and a power function, were fitted to the coefficient a, and to coefficient b only a logarithmic function was fit. The squared correlation coefficients R2 are shown only for the power function fittings; for the logarithmic fittings they were all >0.99.
Table 4The coefficients a0, a1, b0, and b1 obtained from the fitting of a=a1ln(SS) +a0 and b=b1ln(SS) +b0 with the data in Table 3. The coefficients are written as cm−3 Mm. SE: standard error of the respective coefficient obtained from the regressions. SAE: scattering Ångström exponent of PM10 aerosol.

Note that a power function of SS of the form SSk was also used for fitting the data (Fig. 5). This is the dependence on SS assumed for instance in the parameterization by Jefferson (2010). It is obvious that the power function fitting is not as good as the logarithm of SS. This is in line with the fittings to NCCN vs. SS (Fig. 1) and the related discussion in Sect. 3.1.
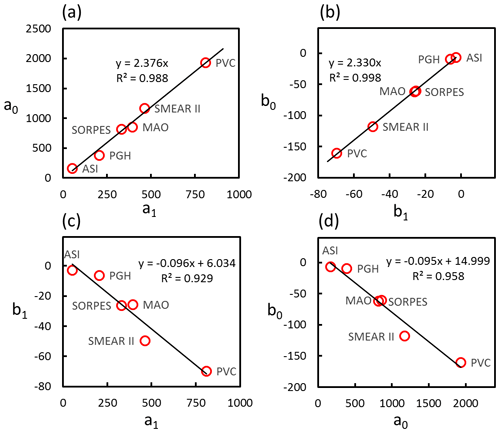
Figure 6Relationship between the coefficients a0, a1, b0, and b1 of Eq. (7) for each station presented in Table 4 for the six stations. (a) a0 vs. a1; (b) b0 vs. b1; (c) b1 vs. a1; (d) b0 vs. a0.
The relationships of the coefficients in Table 4 are next used to obtain a combined, more general parameterization. Obviously the a0 vs. a1, b0 vs. b1, a1 vs. b1, and b0 vs. b0 pairs from all stations follow the same lines very accurately (Fig. 6). Linear regressions yielding , and were used, after the simple algebra in the Sect. S3, to get
where both the coefficient a1 and the constant 6.0±5.9 and the coefficients are written as cm−3 Mm. This is the general formula for the parameterization. In both Eqs. (7) and (8) the only unquantified coefficient is now a1. However, we can find some ways to also quantify it.
The above derivation of the combined parameterization by using the logarithms of SS was fairly straightforward. In the error-function parameterizations of Dusek et al. (2003) and Pöhlker et al. (2016) there are adjustable parameters that affect the argument of the error function. In the parameterization of Ji and Shaw (1998) there is an exponential function where the argument contains the power function of SS, and the parameterization of Cohard et al. (1998) is a product of the power function and the hypergeometric function. If these functions were used for fitting the NCCN(AOP, SS) data it would be more complicated to combine the site-dependent parameterizations into a general equation analogous to Eq. (8). The simplicity of the logarithmic fitting makes it most suitable for our approach. The disadvantage of Eq. (8) is that it predicts no upper limit for NCCN at high supersaturations. This is not correct since NCCN cannot be larger than the total particle number concentration and therefore it has to be emphasized that the parameterization presented here is only valid in the range of SS <1.1 %.
For a given station, if there are simultaneous data of NCCN(meas) and σsp for some reasonably long period, Eq. (8) can be adjusted. To estimate what is a reasonably long period, we added an analysis in the Sect. S5. It shows that when the number of hourly samples is , the uncertainty in BSFmin is low enough. Instead of subtracting (0.096±0.013) from BSF, the minimum BSF = BSFmin in the dataset will be used. Further, when BSF = BSFmin the factor a1(BSF – BSFmin) =0 and NCCN(AOP2) , where Rmin is the minimum RCCN∕σ in the dataset. It follows that
The derivation of Eq. (9) is shown in the Sect. S4. In the data processing the 1st percentiles of both BSF and RCCN∕σ are used as BSFmin and Rmin, respectively. Here the free parameters are a1, BSFmin, and Rmin.
The coefficient a1 is positively correlated with SAE. The linear regressions of a1 and the average and median scattering Ångström exponents of PM10 particles (SAE) (Table 4) at the six sites in the analyzed periods yield SAE cm−3 Mm and SAE cm−3 Mm, respectively (Fig. 7). The uncertainties are large, but the main point is that the correlations show that a1 and thus NCCN(AOP2) are higher for higher values of SAE. If we consider the a1 values in Table 4 to be the accurate station-specific values, then using SAE overestimates or underestimates a1 by +37 %, +30 %, −20 %, −32 %, −20 %, and +251 % for SMEAR II, SORPES, PGH, PVC, MAO and ASI, respectively. These values were calculated from 100 %(286⋅ SAE – a1)∕a1. The effect of the biases of a1 on the biases of NCCN(AOP2) is discussed in more detail in the Sect. S6. Nevertheless, we found that SAE is the only parameter that is positively correlated with a1 and that can easily be obtained from nephelometer measurements. Searching for a more suitable proxy for a1 would be an important part of follow-up studies.
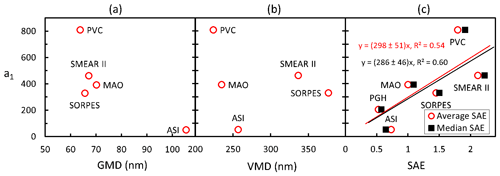
Figure 7Relationship of the a1 coefficient in Eq. (8) with the average (a) geometric mean diameter of the PNSD data size ranges of the sites, (b) volume mean diameter of the same size range, and (c) PM10 scattering Ångström exponent (SAE).
Rmin of Eq. (9) was estimated by calculating the 1st percentile of RCCN∕σ at each site at each SS. The average and standard deviations of Rmin were 5.2±3.3 cm−3 Mm. Consequently, the parameterization becomes
The parameterization suggests that at any supersaturation and constant scattering coefficient, NCCN is higher the smaller the particles are because both SAE and BSF are roughly inversely correlated with the particle size. A qualitative explanation for this is that to keep σsp constant even if the dominating particle size decreases – which means that both SAE and BSF increase – the number of particles has to increase. The analysis also shows that neither SAE nor BSF alone is enough for obtaining a good estimate of NCCN from AOP measurements. This is again in line with the model study of Collaud Coen et al. (2007), which showed that SAE and BSF are sensitive to variations in somewhat different size ranges.
The parameterization in Eq. (10) was applied to the data of the six stations and NCCN(AOP2) was compared with the NCCN(meas) at the supersaturations used in the respective CCN counters. The results are presented as scatter plots of NCCN(AOP2) vs. NCCN(meas) (Fig. 8a and b), the bias of the parameterization calculated as NCCN(AOP2)∕NCCN(meas) (Fig. 8c), and the squared correlation coefficient R2 of the linear regression of NCCN(AOP2) vs. NCCN(meas) (Fig. 8d). The NCCN(AOP2) values used for the statistics shown in Fig. 8 were calculated by using the SAE of hourly-averaged scattering coefficients. The problem with that is that when SAE <0, it is very probable that NCCN(AOP2) is also negative if BSF > BSFmin, as can be seen from Eq. (10). For this reason the data with SAE <0 were not used. The fraction of negative SAE hourly values varied from 0.0 % at SMEAR II and SORPES to 6 % at MAO (Sect. S6, Table S3 in the Supplement). To reduce the number of rejected data, we also calculated NCCN(AOP2) by using the site-specific median SAE shown in Table 4 and the hourly BSF values. The results are shown in the Sect. S6.
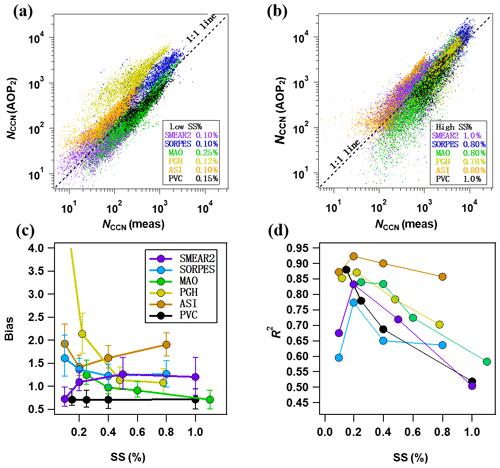
Figure 8Statistics of NCCN(AOP2) from parameterization in Eq. (10). NCCN(AOP2) vs. NCCN(meas) at different sites at relatively (a) low and (b) high supersaturations, (c) bias =NCCN(AOP2) ∕ NCCN (meas) at different sites and supersaturations, and (d) R2 of the linear regression of NCCN(AOP2) vs. NCCN (meas) at different sites and supersaturations.
At the site-specific lowest values of SS, the scatter plots of NCCN(AOP2) vs. NCCN(meas) of data from most stations clustered along the 1:1 line, but for the Himalayan site PGH the parameterization yielded significantly higher concentrations (Fig. 8a). The bias varied from 0.7 to >4 (Fig. 8c) (Table S3). At PGH at the lowest SS, the bias was >4 but decreased to ∼1.1–1.2 at SS =0.4 % and even closer to 1 at higher SS. At SS >0.4 %, the average bias varied between ∼0.7 and ∼1.3, which means NCCN was estimated with an average uncertainty of approximately 30 % by using nephelometer data. For ASI the bias was higher, in the range of ∼1.4–1.9. For the US coastal site PVC, the parameterization constantly underestimated the CCN concentrations by about 30 %. Since NCCN(AOP2)≈ (a1ln(SS/0.093)(BSF – BSFmin) + Rmin) σsp, it is obvious that biases ofa1 affect the bias of NCCN(AOP2). As it was written above, the parameterization of SAE overestimates or underestimates a1. For most stations the bias of NCCN(AOP2) can be explained by the bias of a1: when a1 is underestimated so is NCCN(AOP2), and when a1 is overestimated so is NCCN(AOP2). A detailed analysis of the effect of the bias of a1 on the bias of NCCN(AOP2) is presented in Sect. S6.
The correlation coefficient of NCCN(AOP2) vs. NCCN(meas) is higher at higher CCN concentrations (not shown in the figure). One possible reason for this is that when CCN concentration is lower, the aerosol loading is usually lower, and the relative uncertainties of both NCCN and AOPs are also higher than at high concentrations.
Below we will first present effects of simulated size distributions on the relationships between NCCN and aerosol optical properties and then compare the simulations with field data.
4.1 NCCN–AOP relationships of simulated particle size distributions
We generated lognormal unimodal size distributions as explained in Sect. 2.6. GMD was given logarithmically evenly spaced values from 50 to 1600 nm and GSD was given two values: 1.5 representing a relatively narrow size distribution and 2.0 a wide size distribution. We then calculated AOPs, NCCN, and RCCN∕σ for these size distributions.
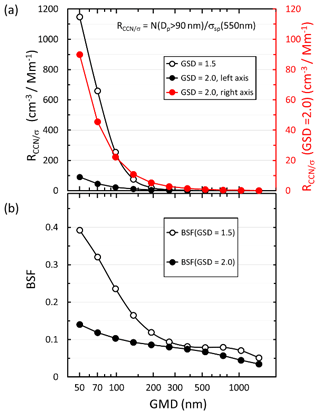
Figure 9Size distribution of (a) RCCN∕σ and (b) backscatter fraction BSF (λ=550 nm) of simulated narrow (GSD =1.5) and wide (GSD =2.0) unimodal size distributions. GMD: geometric mean diameter; GSD: geometric standard deviation. Note in (a) the RCCN∕σ of the wide size distributions is plotted twice: the black symbols and line use the left axis to emphasize the big difference in the magnitudes of the wide and narrow size distributions; the red symbols and line use the right axis to show that the shape of the RCCN∕σ size distribution is very similar to that calculated for the narrow size distributions. RCCN∕σ was calculated assuming particles larger than 90 nm get activated.
The reasoning for the approach of estimating NCCN from σsp and BSF can easily be explained by the qualitatively similar variations in RCCN∕σ and BSF as a function of GMD (Fig. 9). RCCN∕σ is the highest for the smallest particles, i.e., for GMD =50 nm, and it decreases with an increasing GMD as BSF. Note that the width of the size distribution has very strong effects on RCCN∕σ: for the wide size distribution it is approximately an order of magnitude lower than for the narrow size distribution. Note also that the values of RCCN∕σ of the wide size distributions are plotted twice (Fig. 9a): the black symbols and line use the left axis to emphasize the big difference in the magnitudes of the wide and narrow size distributions; the red symbols and line use the right axis to show that the shape of the RCCN∕σ size distribution is very similar to that calculated for the narrow size distributions. The simulation also shows a potential source of uncertainty of the method: in the GMD range of ∼500–800 nm, the BSF of the narrow size distribution actually increases, although very little with an increasing value of GMD (Fig. 9b). This phenomenon is due to Mie scattering and it is even stronger for single particles. When the size parameter of non-absorbing and weakly absorbing spherical particles grows from ∼3 to ∼8, their BSF increases and then decreases again as can be shown by Mie modeling (Wiscombe and Grams, 1976). For the wavelength λ= 550 nm this corresponds to a particle diameter range of ∼525 to ∼1400 nm.
The decrease in RCCN∕σ and BSF with the increasing GMD was used for estimating particle sizes with a stepwise linear regression. An example is given by the linear regressions of RCCN∕σ vs. BSF calculated for five consecutive size distributions, first for those that have their GMDs from 50 to 100 nm and the second for those that have their GMDs from 100 to 200 nm (Fig. 10). Note that it is obvious that linear regressions are applicable for short intervals but not do not work well for the whole size range. It is also obvious that an exponential fit would be perfect to explain the relationship between RCCN∕σ and BSF. But this is not what we are looking for. We are looking for the slopes and offsets in the relationship aBSF +b that was used for fitting the field measurement data. So, physically it would mean that NCCN would increase linearly as a function of BSF even though this is not exactly correct.
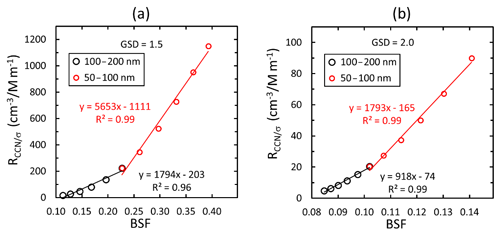
Figure 10Linear regressions of RCCN∕σ vs. backscatter fraction BSF (λ=550 nm) of simulated unimodal (a) narrow (GSD =1.5) and (b) wide (GSD =2.0) size distributions. The regressions were calculated assuming that the data consist of size distributions with GMD ranging from 50 to 100 and 100 to 200 nm. RCCN∕σ was calculated assuming particles larger than 90 nm get activated.
The absolute values of the slopes and offsets are clearly lower for the larger particle size range. Here, we define the particle size used for describing the size range of each regression as the equivalent geometric mean diameter GMDe, the geometric mean of the range of the GMDs of the unimodal size distributions used for each regression. In other words, GMD, where GMDlow and GMDhigh are the smallest GMD and the largest GMD of the range, respectively. Two examples of the regressions were given above, one calculated for the GMD range from 50 to 100 nm and the other for the GMD range from 100 to 200 nm. The GMDe values of these two size ranges are 70.7 and 141.4 nm, respectively. It will be shown below that GMDe is a mathematical concept that helps to explain the observed relationships, not an actual GMD of the particle size distribution at the sites.
For a wide size distribution, the slopes and offsets of the regressions of RCCN∕σ vs. BSF decrease and increase, respectively, monotonically with an increasing value of GMDe in the whole size range studied here (Fig. 11). For a narrow size distribution, the slope decreases until GMDe≈300 nm and then increases, which means that there is no unambiguous relationship between them. The reason is, as discussed above related to Fig. 9b, that in the GMD range of ∼500–800 nm the BSF of narrow size distributions increases slightly with an increasing GMD.
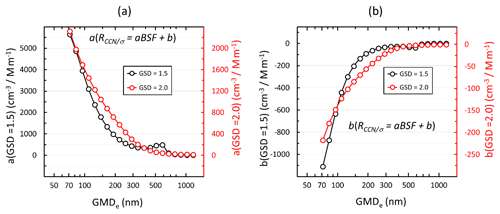
Figure 11Size distributions of the coefficients of the linear regressions of RCCN∕σ(λ=550 nm) vs. backscatter fraction BSF (λ=550 nm) of narrow and wide size distributions. (a) Slopes of RCCN∕σ vs. BSF; (b) offsets of RCCN∕σ vs. BSF. RCCN∕σ was calculated assuming particles larger than 90 nm get activated. The regressions were calculated for five consecutive size distributions. GMDe is the geometric mean of the range of the unimodal size distributions used for the regressions.
Note also that the ranges of the absolute values of the slopes and offsets of the narrow and wide size distributions are very different. For instance, when GMDe=100 nm the slope a≈4000 cm−3 Mm and a≈1600 cm−3 Mm for the narrow and wide size distributions, respectively. Since NCCN(AOP) (aBSF +b)σsp this means that the NCCN(AOP) of narrow size distributions is more sensitive to variations in mean particle size than the NCCN(AOP) of wide size distributions.
We plotted the offset vs. slope of the unimodal size distributions and those obtained from the linear regressions of the field data at the supersaturations presented in Table 3 and below it the GMDe vs. the slopes of the regressions of the unimodal size distributions (Fig. 12). In Fig. 12 the effect of the choice of the activation diameters of 50, 80, 110, and 150 nm is also shown.
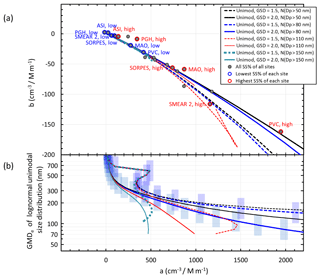
Figure 12a) Relationships of the slopes and offsets of the linear regressions of aBSF +b vs. BSF of the simulated unimodal narrow (GSD =1.5) and wide (GSD =2.0) size distributions and those obtained from the similar regressions of the station data (Table 3). (b) Equivalent geometric mean diameter (GMDe) of the unimodal modes used for the linear regression of RCCN∕σ vs. BSF. The vertical error bars show the ranges of the GMDs of the unimodal size distributions used in the respective linear regressions. RCCN∕σ was calculated for the activation diameters of 50, 80, 110, and 150 nm.
Several observations can be made in Fig. 12. First, for the simulated wide size distributions the relationship between the offset and slope is unambiguous, while this is not the case for the narrow size distributions at sizes GMD nm (Fig. 12b). Second, the field data points roughly follow the lines of the simulations. This suggests that the slopes and offsets of the linear regressions of RCCN∕σ vs. BSF yield information on the dominating particle sizes just as they do for the simulated size distributions. For instance, the PVC data point corresponding to the highest supersaturation has the highest slope (1970 cm−3 Mm3, Table 3), and it is close to the wide size distribution line with the activation diameter of 50 nm (Fig. 12a). This corresponds to the GMDe of ∼150 nm (Fig. 12b). The SMEAR II high SS offset vs. slope fits best with the corresponding lines of the narrow unimodal size distributions with activation diameters in the range of ∼50–110 nm and the corresponding GMDe≈150–200 nm.
At the lowest SS, the offset vs. slope points of all stations agree well with the lines derived from the unimodal modes. This is actually in line with the higher correlation coefficients (R2) of the regressions of NCCN (AOP1) vs. NCCN (meas) at the lowest SS (Fig. 4). This can be explained by the fact that at low SS small particles do not get activated and unimodal size distributions in the accumulation mode are mainly responsible for CCN. For ASI the slopes and offsets of the lowest and highest SS are especially close to each other, closer than at any other station (Fig. 12a), and the corresponding GMDe≈750 and 400 nm, respectively, when the GMDe vs. a relationship of any of the distributions is used (Fig. 12b). This is in line with the fact that ASI is an island site dominated by marine aerosols. For PGH at the lowest SS, the slope is actually negative, which is not obtained from the simulations at all so no GMDe can be given for it.
4.2 Aerosol size characteristics of the sites
As it was shown above, particle size distributions affect the relationships between NCCN and AOPs. It is therefore discussed here how the size distributions vary at the six sites of the study and whether they support the interpretations presented above. The size distributions are discussed using the particle number size distribution data and the ratios of σsp of PM1 and PM10 size ranges from those stations where they are available.
4.2.1 Diurnal variation in particle number size distribution
Figure 13a shows the averaged diurnal cycle of PNSD at the sites where either a DMPS or SMPS is available. New particle formation (NPF) events are a significant source of uncertainty in the prediction of NCCN (Kerminen et al., 2012; Ma et al., 2016). Complete NPF events start from a burst of sub-10 nm particles followed by a continuous growth up to a few hundred nanometers. As a result, the size distribution varies significantly. NPF is one possible explanation for the poor NCCN−σsp correlation.
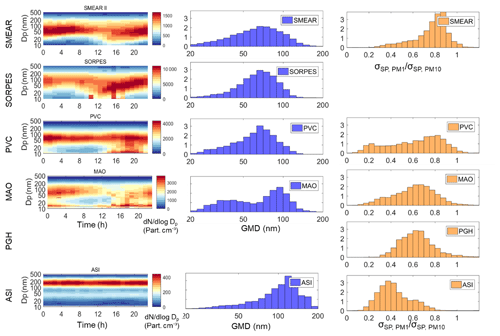
Figure 13Analyses of particle size distributions at the six sites. (a) Average diurnal cycle of PNSD and (b) normalized size distribution of GMD at SMEAR II, SORPES, PVC, and ASI; (c) normalized frequency distribution of σsp(PM1)∕σsp(PM10) at SMEAR II, PVC, MAO, PGH, and ASI.
SMEAR II and SORPES are reported to have an appreciable frequency of NPF (Kulmala et al., 2004; Dal Maso et al., 2005; Sihto et al., 2006; Qi et al., 2015). A continuous growth of particle size at SORPES can usually last for several days after NPF (Shen et al., 2018). Similar growth patterns have also been observed in the Two-Column Aerosol Project (TCAP; http://campaign.arm.gov/tcap/, last access: 2 December 2019; referred to as PVC in this study) according to Kassianov et al. (2014). NPF is rarely observed in the Amazon forest, as reported by Wang et al. (2016). However, it does take place at MAO as is shown in the diurnal cycle of PNSD. The reason is probably that the MAO site was measuring aerosol downwind of the city Manaus. At ASI, there no evidence of NPF according to the PNSD diurnal cycle.
These observations of the NPF are compared with the bias and correlation coefficients of the parameterization discussed in Sect. 4.1 (Fig. 8). The correlation coefficient of NCCN (AOP2) vs. NCCN (meas) is the highest, R2>0.85 at all SS at ASI where no NPF takes place and clearly lower at the other sites (Fig. 8d). For the bias NPF appears not to have a clear influence: for both SMEAR II and SORPES bias varies from ∼1.1 to ∼1.4 at SS >0.1 %. As it was stated above (Sect. 3.2), for most stations the bias of NCCN(AOP2) can be explained by the bias of a1 in NCCN(AOP2) ≈(a1ln(SS/0.093)(BSF – BSFmin) + Rmin)σsp.
4.2.2 Distributions of geometric mean diameters
Figure 13b presents the normalized distributions of the geometric mean diameters at SMEAR II, SORPES, PVC, MAO, and ASI. They vary from 20 to 200 nm at all sites, with the most frequent GMD between ∼70 and ∼120 nm depending on the site. This clearly shows that the above-presented equivalent geometric mean diameter GMDe calculated assuming a unimodal size distribution is not a quantitative GMD of the size distribution, but rather it is a mathematical concept that partially explains the relationships of RCCN∕σ and BSF. However, the GMD of the measured size distribution and GMDe are also not quite comparable for another reason. The simulations were made by using unimodal size distributions, so that GMDe varied in the range 70–1100 nm (Fig. 11) while the GMDs were calculated from DMPS and SMPS data that also contained the nucleation and Aitken modes that often dominate the total particle number concentration.
The frequency distribution of GMD at SMEAR II is the widest among the five sites with PNSD data available, followed by SORPES and PVC. At MAO the frequency distribution of GMD has two peaks in this study. The lower peak is possibly due to the burst of sub-20 nm particles since these particles have little chance to grow to sizes where they can serve as CCN. The second peak at around 100 nm possibly represents the GMD without the burst of sub-20 nm particles, and it is distinctly narrower than at SMEAR II, SORPES, and PVC.
A comparison of the correlation coefficients of NCCN (AOP2) vs. NCCN (meas) (Fig. 8d) and the widths of the GMD frequency distributions (Fig. 13b) does not show any clear relationships, except in ASI. The frequency distribution of GMD is the narrowest at ASI, indicating that the average particle size does not change much throughout the whole period. This is in line with the low variation in the slope and offset of the RCCN vs. BSF of ASI (Fig. 12a). At ASI the correlation coefficient of NCCN (AOP2) vs. NCCN (meas) is also the highest, R2≈0.8 at all SS.
4.2.3 Contribution of light scattering by sub-micrometer particles
There is one more measure related to particle size distribution, the ratio between σsp of sub-1 µm and sub-10 µm aerosol (σsp(PM1) ∕ σsp(PM10)). At SMEAR II, the contribution of submicron particles usually varies within a range of and it is the highest among all sites in this study. PVC has two peaks in the σsp(PM1) / σsp(PM10) distribution, with the peak around 0.2 corresponding to air masses from the sea, with a very low scattering coefficient and NCCN. By ignoring the cleanest air masses (σsp<5 Mm−1), the fraction of σsp(PM1) ∕ σsp(PM10) is usually around 0.8, which is just slightly lower than at SMEAR II. At PGH and MAO, the distribution of the ratio is wider, and the peak position is at about 0.65. The overall contribution of sub-micrometer particle light scattering at PGH is moderate among the sites in this study. At ASI, σsp(PM1) ∕ σsp(PM10) is the lowest among all sites in this study, indicating that particles larger than 1 µm contribute a considerable fraction of total light scattering. For SORPES σsp(PM1) ∕ σsp(PM10) is not available.
Among those five sites, when σsp(PM1) ∕ σsp(PM10) decreases, the correlation between BSF and RCCN∕σ decreases (not shown in a scatter plot). At some sites (e.g., ASI) the BSF of PM10 is often even larger than that of PM1, which can be an error in the measurements, but it may also be due to a real phenomenon. As discussed in Sect. 4.1, for single spherical particles Mie modeling shows that in the particle diameter range of ∼525 to ∼1400 nm BSF increases with an increasing Dp. Mugnai and Wiscombe (1986) simulated scattering by nonspherical particles and found that BSF increases when the size parameter x grows from ∼8 to ∼15, which corresponds to the particle diameter range of ∼1400 to ∼2600 nm at λ=550 nm. Therefore it is obvious that large and nonspherical particles like sea salt and dust will blur the correlation between BSF and RCCN∕σ. In such a case the increase in the number of large particles sometimes leads to an increase in BSF and a decrease in RCCN∕σ, which is opposite to the usual positive correlation between BSF and RCCN∕σ in this study. This may be at least part of the explanation of the highest bias at high values of SS in ASI (Fig. 8c), the site dominated by marine aerosol. Thus, the lower σsp(PM1) ∕ σsp(PM10) may in principle result in a poor performance of our method. However, a comparison of the correlation coefficients and the σsp(PM1) ∕ σsp(PM10) frequency distributions of each site shows the opposite. At the highest SS of each site, the R2 in a decreasing order is ASI, PGH, MAO, SORPES, SMEAR II, and PVC (Fig. 8d). The peaks, i.e., modes of the frequency distribution of σsp(PM1) ∕ σsp(PM10), are, in increasing order, ASI: 0.375, PGH: 0.625, MAO: 0.65, PVC: 0.825, and SMEAR II: 0.875. Note that at SORPES there is only one size range measured. Of these the R2 of only PVC and SMEAR II are not in the same order (Fig. 8d). This suggests that NCCN can be estimated better from the aerosol optical properties for sites dominated by large particles than for sites dominated by small particles. This further suggests that the ambient size distributions were so wide that the non-monotonous relationship between particle size and BSF discussed above did not play an important role. On the other hand, the bias at the highest SS has no clear relationship with σsp(PM1) ∕ σsp(PM10).
There is also an additional observation that can be made. The abovementioned order of the modes of the frequency distribution of σsp(PM1) ∕ σsp(PM10) is almost the same as the order of the slopes and offsets and GMDe values in Fig. 12. Only for SMEAR II and PVC is the order not the same. This further supports the interpretation that the slopes and offsets of the linear regression of RCCN vs. BSF depend on the dominating particle size of particle size distribution.
The relationships between aerosol optical properties, CCN number concentrations (NCCN), and particle number size distributions were investigated based on in situ measurement data from six stations in very different environments around the world. The goals were to find physical explanations of the relationships and to find a parametrization to obtain NCCN from sites where AOPs are measured but no CCN counter is available. There are many previous parameterizations for doing just the same. As a starting point we used the parameterization presented by Jefferson (2010). That one needs also absorption measurements since it includes single-scattering albedo. We instead studied how the parameterization would look if only total scattering and backscattering data were available.
The basic idea for the parameterization is that NCCN is proportional to σsp and a function of the backscatter fraction (BSF), i.e., NCCN(AOP) = (aBSF +b)σsp, as also in the parameterization of Jefferson (2010). In the study of the physical explanation of the relationships between NCCN and AOPs, we found that the slope a and offset b in NCCN(AOP) = (aBSF +b)σsp clearly depend on the dominating particle size and on the width of the size distributions. This was shown first by simulations and then by comparisons of the simulations with field data. The analyses showed that the sensitivity of NCCN(AOP) to variations in BSF increases with a decreasing particle size. As a result, sites dominated by supermicron aerosol particles, such as ASI that is dominated by marine aerosol, have a small value of the slope a in the above formula, which means that it is not very sensitive to variations in BSF. Sites dominated by small aerosol particles are clearly more sensitive. For instance for the coastal site PVC that is significantly affected by anthropogenic emissions, the slope a in the above formula is an order of magnitude higher than at the marine site.
A logarithmic function was fitted to the NCCN vs. supersaturation SS data in the range SS <1.1 %.
For NCCN(AOP) the fitting yielded a logarithmic dependence on SS: NCCN(AOP) ≈ (286⋅ SAE ⋅ ln(SS/0.093)(BSF – BSFmin) + (5.2±3.3))σsp. Actually this result is qualitatively in line with the relationship between AOD and CCN reported by Andreae (2010). The derived NCCN(AOP) depends on σsp, SAE, and BSF. The analysis shows that neither SAE nor BSF alone is enough for obtaining a good estimate of NCCN from AOP measurements.
At the lowest supersaturations of each site (SS ≈0.1 %), the average bias, defined as the ratio of the AOP-derived and AOP-measured NCCN, varied from ∼0.7 to ∼1.9 at most sites except at the Himalayan site PGH where the bias was >4. At SS >0.4 % the average bias ranged from ∼0.7 to ∼1.3 at most sites. For the marine-aerosol-dominated site ASI the bias was higher, ∼1.4–1.9. In other words, at SS >0.4 % NCCN was estimated with an average uncertainty of approximately 30 % by using nephelometer data. The biases were mainly due to the biases in the parameterization related to the scattering Ångström exponent SAE.
Data used in this study are provided by Department of Energy (DOE, United states), University of Helsinki (UH, Finland) and Nanjing University (NJU, China). Data provided by DOE can be accessed from the public FTP of the Atmospheric Radiation Measurement (ARM) at https://adc.arm.gov/discovery/ (ARM, 2019). Data provided by UH can be accessed from the AVAA-portal at https://avaa.tdata.fi/web/smart/ (AVAA, 2019). Data provided by NJU are available upon request from the corresponding author Aijun Ding (Aijun Ding, dingaj@nju.edu.cn) before the SORPES database is open to the public.
The supplement related to this article is available online at: https://doi.org/10.5194/acp-19-15483-2019-supplement.
YS carried out measurements at SORPES in China, analyzed and visualized data of all sites, and wrote the original draft. AV contributed to data analysis and visualization and writing and editing of the original draft, and he supervised the work of YS in Finland. AD provided funding for the measurements and research at SORPES in China, acquired funding for YS in China, and supervised the work of YS. KL, HK, and PPA carried out measurements, data collection, and maintenance of measurement data of SMEAR II in Finland. YS, XC, XQ, WN, and XH carried out measurements, data collection, and maintenance of measurement data of SORPES in China. MK and TP provided the funding for YS in Finland. MK provided funding for the measurements and research at SMEAR II in Finland. TP and VMK formulated the goals of the research and supervised it.
Aijun Ding, Veli-Matti Kerminen, and Tuukka Petäjä are co-editors of the journal ACP.
Data were also obtained from the Atmospheric Radiation Measurement (ARM) User Facility, a U.S. Department of Energy (DOE) Office of Science user facility managed by the Office of Biological and Environmental Research. For the SMEAR II data we thank the SMEAR II technical team.
This work was supported by the National Key Research & Development Program of the Ministry of Science & Technology (MOST) of China (2016YFC0202000, 2016YFC0200500), Academy of Finland via Center of Excellence in Atmospheric Sciences (project no. 272041), National Natural Science Foundation of China (41725020, 91544231), and the Collaborative Innovation Center of Climate Change supported by the Jiangsu 2011 Program. Scholarship for Yicheng Shen was supported by both the China Scholarship Council (CSC) and the Centre for International Mobility (CIMO) of Finland.
This paper was edited by Manabu Shiraiwa and reviewed by two anonymous referees.
Aalto, P., Hämeri, K., Becker, E., Weber, R., Salm, J., Mäkelä, J., Hoell, C., O'dowd, C., Hansson, H.-C., Väkevä, M., Koponen, I., Buzorius, G., and Kulmala, M.: Physical characterization of aerosol particles during nucleation events, Tellus B, 53, 344–358, https://doi.org/10.3402/tellusb.v53i4.17127, 2001.
Andreae, M. O.: Correlation between cloud condensation nuclei concentration and aerosol optical thickness in remote and polluted regions, Atmos. Chem. Phys., 9, 543–556, https://doi.org/10.5194/acp-9-543-2009, 2009.
Andrews, E., Ogren, J. A., Bonasoni, P., Marinoni, A., Cuevas, E., Rodríguez, S., Sun, J. Y., Jaffe, D. A., Fischer, E. V., Baltensperger, U., and Weingartner, E.: Climatology of aerosol radiative properties in the free troposphere, Atmos. Res., 102, 365–393, 2011.
Atmospheric Radiation Measurement (ARM): Data Discovery, https://adc.arm.gov/discovery/, last access: 2 December 2019.
AVAA: AVAA-portal, https://avaa.tdata.fi/web/smart/, last access: 2 December 2019.
Berg, L. K., Fast, J. D., Barnard, J. C., Burton, S. P., Cairns, B., Chand, D., Comstock, J. M., Dunagan, S., Ferrare, R. A., Flynn, C. J., Hair, J. W., Hostetler, C. A., Hubbe J., Jefferson, A., Johnson, R., Kassianov, E. I., Kluzek, C. D., Kollias, P., Lamer, K., Lantz, K., Mei, F., Miller, M. A., Michalsky, J., Ortega, I., Pekour, M., Rogers, R. R., Russell, P. B., Redemann, J., Sedlacek III, A. J., Segal-Rosenheimer, M., Schmid, B., Shilling, J. E., Shinozuka, Y., Springston, S. R., Tomlinson, J. M., Tyrrell, M., Wilson, J. M., Volkamer, R., Zelenyuk, A., and Berkowitz, C. M.: The Two-Column Aerosol Project: Phase I – Overview and impact of elevated aerosol layers on aerosol optical depth, J. Geophys. Res.-Atmos., 121, 336–361, 2016.
Bohren, C. F. and Huffman, D. R.: Absorption and scattering of light by small particles, 1st ed., Wiley, New York, 57–81, 1983.
Cohard, J. M., Pinty, J. P., and Bedos, C.: Extending Twomey's an-alytical estimate of nucleated cloud droplet concentrations fromCCN spectra, J. Atmos. Sci., 55, 3348–3356, 1998.
Collaud Coen, M., Weingartner, E., Nyeki, S., Cozic, J., Henning, S., Verheggen, B., Gehrig, R., and Baltensperger, U.: Long-term trend analysis of aerosol variables at the high alpine site Jungfraujoch, J. Geophys. Res., 112, D13213, https://doi.org/10.1029/2006JD007995, 2007.
Crosbie, E., Youn, J.-S., Balch, B., Wonaschütz, A., Shingler, T., Wang, Z., Conant, W. C., Betterton, E. A., and Sorooshian, A.: On the competition among aerosol number, size and composition in predicting CCN variability: a multi-annual field study in an urbanized desert, Atmos. Chem. Phys., 15, 6943–6958, https://doi.org/10.5194/acp-15-6943-2015, 2015.
Dal Maso, M., Kulmala, M., Riipinen, I., Wagner, R., Hussein, T., Aalto, P. P., and Lehtinen, K. E. J.: Formation and growth of fresh atmospheric aerosols: eight years of aerosol size distribution data from SMEAR II, Hyytiälä, Finland, Boreal Environ. Res., 10, 323–336, 2005.
Deng, Z. Z., Zhao, C. S., Ma, N., Ran, L., Zhou, G. Q., Lu, D. R., and Zhou, X. J.: An examination of parameterizations for the CCN number concentration based on in situ measurements of aerosol activation properties in the North China Plain, Atmos. Chem. Phys., 13, 6227–6237, https://doi.org/10.5194/acp-13-6227-2013, 2013.
de Sá, S. S., Rizzo, L. V., Palm, B. B., Campuzano-Jost, P., Day, D. A., Yee, L. D., Wernis, R., Isaacman-VanWertz, G., Brito, J., Carbone, S., Liu, Y. J., Sedlacek, A., Springston, S., Goldstein, A. H., Barbosa, H. M. J., Alexander, M. L., Artaxo, P., Jimenez, J. L., and Martin, S. T.: Contributions of biomass-burning, urban, and biogenic emissions to the concentrations and light-absorbing properties of particulate matter in central Amazonia during the dry season, Atmos. Chem. Phys., 19, 7973–8001, https://doi.org/10.5194/acp-19-7973-2019, 2019.
Ding, A. J., Fu, C. B., Yang, X. Q., Sun, J. N., Zheng, L. F., Xie, Y. N., Herrmann, E., Nie, W., Petäjä, T., Kerminen, V.-M., and Kulmala, M.: Ozone and fine particle in the western Yangtze River Delta: an overview of 1 yr data at the SORPES station, Atmos. Chem. Phys., 13, 5813–5830, https://doi.org/10.5194/acp-13-5813-2013, 2013.
Ding, A. J., Nie, W., Huang, X., Chi, X., Sun, J., Kerminen, V. M., Xu, Z., Guo, W., Petaja, T., Yang, X. Q., Kulmala, M., and Fu, C.: Long-term observation of air pollution-weather/climate interactions at the SORPES station: A review and outlook, Front. Environ. Sci. En., 10, 15, https://doi.org/10.1007/s11783-016-0877-3, online first, 2016.
DMT: Cloud Condensation Nuclei Counter Operator Manual, DOC-0086 Rev G-1, Droplet Measurement Technologies, Inc., p. 107, 2009.
Dumka, U. C., Kaskaoutis, D. G., Sagar, R., Chen, J. M., Singh, N., and Tiwari, S.: First results from light scattering enhancement factor over central Indian Himalayas during GVAX campaign, Sci. Total Environ., 605, 124–138, https://doi.org/10.1016/j.scitotenv.2017.06.138, 2017.
Dusek, U., Covert, D. S., Wiedensohler, A., Neususs, C., Weise, D., and Cantrell, W.: Cloud condensation nuclei spectra derived from size distributions and hygroscopic properties of the aerosol in coastal south-west Portugal during ACE-2, Tellus B, 55, 35–53, 2003.
Dusek, U., Frank, G. P., Hildebrandt, L, Curtius, J., Schneider, J., Walter, S., Chand, D., Drewnick, F., Hings, S., Jung, D., Bormann, S., and Andreae, M. O.: Size matters more than chemistry for cloud-nucleating ability of aerosol particles, Science, 312, 1375–1378, 2006a.
Dusek, U., Reischl, G. P., and Hitzenberger, R.: CCN activation of pure and coated carbon black particles, Environ. Sci. Technol., 40, 1223–1230, 2006b.
Ervens, B., Cubison, M., Andrews, E., Feingold, G., Ogren, J. A., Jimenez, J. L., DeCarlo, P., and Nenes, A.: Prediction of cloud condensation nucleus number concentration using measurements of aerosol size distributions and composition and light scattering enhancement due to humidity, J. Geophys. Res.-Atmos., 112, D10S32, https://doi.org/10.1029/2006jd007426, 2007.
Forster, P., Ramaswamy, V., Artaxo, P., Berntsen, T., Betts, R., Fahey, D. W., Haywood, J., Lean, J., Lowe, D. C., Myhre, G., Nganga, J., Prinn, R., Raga, G., Schulz, M., and Van Dorland, R.: Changes in Atmospheric Constituents and in Radiative Forcing, in: Climate Change 2007: The Physical Science Basis, contribution of Working Group I to the Fourth Assessment Report of the Intergovernmental Panel on Climate Change, edited by: Solomon, S. D., Qin, M., Manning, Z., Chen, M., Marquis, K. B., Averyt, M. T., and Miller, H. L., Cambridge University Press, Cambridge, United Kingdom and New York, NY, USA, 129–134, 2007.
Ghan, S. J., Rissman, T. A., Elleman, R., Ferrare, R. A., Turner, D., Flynn, C., Wang, J., Ogren, J., Hudson, J., Jonsson, H. H., VanReken, T., Flagan, R. C., and Seinfeld, J. H.: Use of in situ cloud condensation nuclei, extinction, and aerosol size distribution measurements to test a method for retrieving cloud condensation nuclei profiles from surface measurements, J. Geophys. Res.- Atmos., 111, D05s10, https://doi.org/10.1029/2004jd005752, 2006.
Gobbi, G. P., Kaufman, Y. J., Koren, I., and Eck, T. F.: Classification of aerosol properties derived from AERONET direct sun data, Atmos. Chem. Phys., 7, 453–458, https://doi.org/10.5194/acp-7-453-2007, 2007.
Gogoi, M. M., Babu, S. S., Jayachandran, V., Moorthy, K. K., Satheesh, S. K., Naja, M., and Kotamarthi, V. R.: Optical properties and CCN activity of aerosols in a high-altitude Himalayan environment: Results from RAWEX-GVAX, J. Geophys. Res.-Atmos., 120, 2453–2469, https://doi.org/10.1002/2014JD022966, 2015.
Hämeri, K., Väkevä, M., Aalto, P. P., Kulmala, M., Swietlicki, E., Zhou, J., Seidl, W., Becker, E., and O'Dowd, C. D.: Hygroscopic and CCN properties of aerosol particles in boreal forests, Tellus B, 53, 359–379, 2001.
Herrmann, E., Weingartner, E., Henne, S., Vuilleumier, L., Bukowiecki, N., Steinbacher, M., Conen, F., Collaud Coen, M., Hammer, E., Jurànyi, Z., Baltensperger, U., and Gysel, M.: Analysis of long-term aerosol size distribution data from Jungfraujoch with emphasis on free tropospheric conditions, cloud influence, and air mass transport, J. Geophys. Res.-Atmos., 120, 9459–9480, https://doi.org/10.1002/2015JD023660, 2015.
Higurashi, A. and Nakajima, T.: Development of a Two-Channel Aerosol Retrieval Algorithm on a Global Scale Using NOAA AVHRR, J. Atmos. Sci., 56, 924–941, 1999.
Holben, B. N., Tanré, D., Smirnov, A., Eck, T. F., Slutsker, I.,Abuhassan, N., Newcomb, W. W., Schafer, J. S., Chatenet, B., Lavenu, F., Kaufman, Y. J., Castle, J. V., Setzer, A., Markham, B., Clark, D., Frouin, R., Halthore, R., Karneli, A., O'Neill, N. T.,Pietras, C., Pinker, R. T., Voss, K., and Zibordi, G.: An emerging ground-based aerosol climatology: Aerosol optical depth from AERONET, J. Geophys. Res., 106, 12067–12098, 2001.
Hong, J., Häkkinen, S. A. K., Paramonov, M., Äijälä, M., Hakala, J., Nieminen, T., Mikkilä, J., Prisle, N. L., Kulmala, M., Riipinen, I., Bilde, M., Kerminen, V.-M., and Petäjä, T.: Hygroscopicity, CCN and volatility properties of submicron atmospheric aerosol in a boreal forest environment during the summer of 2010, Atmos. Chem. Phys., 14, 4733–4748, https://doi.org/10.5194/acp-14-4733-2014, 2014.
Horvath, H., Kasahara, M., Tohno, S., Olmo, F. J., Lyamani, H., Alados-Arboledas, L., Quirantes A., and Cachorro, V.: Relationship between fraction of backscattered light and asymmetry parameter, J. Aerosol Sci., 91, 43–53, 2016.
Hudson, J. G.: Cloud condensation nuclei, J. Appl. Meteorol., 32, 596–607, 1993.
Hudson, J. G.: Variability of the relationship between particle size and cloud-nucleating ability, Geophys. Res. Lett., 34, 08801, https://doi.org/10.1029/2006GL028850, 2007.
Jefferson, A.: Empirical estimates of CCN from aerosol optical properties at four remote sites, Atmos. Chem. Phys., 10, 6855–6861, https://doi.org/10.5194/acp-10-6855-2010, 2010.
Jefferson, A.: Aerosol observing system (AOS) handbook, ARMTR-014, US Dep. of Energy, Washington, D.C., 2011.
Ji, Q. and Shaw, G. E.: On supersaturation spectrum and size distributions of cloud condensation nuclei, Geophys. Res. Lett., 25, 1903–1906, 1998.
Kammermann, L., Gysel, M., Weingartner, E., Herich, H., Cziczo, D. J., Holst, T., Svenningsson, B., Arneth, A., and Baltensperger, U.: Sub-arctic atmospheric aerosol composition 3: Measured and modeled properties of cloud condensation nuclei (CCN), J. Geophys. Res., 115, D04202, https://doi.org/10.1029/2009JD012447, 2010.
Kassianov, E., Barnard, J., Pekour, M., Berg, L. K., Shilling, J., Flynn, C., Mei, F., and Jefferson, A.: Simultaneous retrieval of effective refractive index and density from size distribution and light-scattering data: weakly absorbing aerosol, Atmos. Meas. Tech., 7, 3247–3261, https://doi.org/10.5194/amt-7-3247-2014, 2014.
Kerminen, V.-M., Paramonov, M., Anttila, T., Riipinen, I., Fountoukis, C., Korhonen, H., Asmi, E., Laakso, L., Lihavainen, H., Swietlicki, E., Svenningsson, B., Asmi, A., Pandis, S. N., Kulmala, M., and Petäjä, T.: Cloud condensation nuclei production associated with atmospheric nucleation: a synthesis based on existing literature and new results, Atmos. Chem. Phys., 12, 12037–12059, https://doi.org/10.5194/acp-12-12037-2012, 2012.
King, M. D., Kaufman, Y. J., Tanré, D., and Nakajima, T.: Remote sensing of tropospheric aerosols from space: Past, present, and future, B. Am. Meteorol. Soc., 80, 2229–2259, 1999.
Kuang, C.: TSI Model 3936 Scanning Mobility Particle Spectrometer Instrument Handbook, United States, https://doi.org/10.2172/1245993, 2016.
Kulmala, M., Laaksonen, A., Korhonen, P., Vesala, T., Ahonen, T., and Barrett, J. C.: The effect of atmospheric nitric acid vapor on cloud condensation nuclei activation, J. Geophys. Res., 98, 22949–22958, 1993.
Kulmala, M., Vehkamäki, H., Petäjä, T., Dal Maso, M., Lauri, A., Kerminen, V.M., Birmili, W. and McMurry, P.H.: Formation and growth rates of ultrafine atmospheric particles: A review of observations, J. Aerosol Sci., 35, 143–176, 2004.
Liu, H., Pinker, R. T., Chin, M., Holben, B., and Remer, L.: Synthesis of information on aerosol optical properties, J. Geophys. Res., 113, D07206, https://doi.org/10.1029/2007JD008735, 2008.
Liu, J. and Li, Z.: Estimation of cloud condensation nuclei concentration from aerosol optical quantities: influential factors and uncertainties, Atmos. Chem. Phys., 14, 471–483, https://doi.org/10.5194/acp-14-471-2014, 2014.
Luoma, K., Virkkula, A., Aalto, P., Petäjä, T., and Kulmala, M.: Over a 10-year record of aerosol optical properties at SMEAR II, Atmos. Chem. Phys., 19, 11363–11382, https://doi.org/10.5194/acp-19-11363-2019, 2019.
Ma, N., Birmili, W., Müller, T., Tuch, T., Cheng, Y. F., Xu, W. Y., Zhao, C. S., and Wiedensohler, A.: Tropospheric aerosol scattering and absorption over central Europe: a closure study for the dry particle state, Atmos. Chem. Phys., 14, 6241–6259, https://doi.org/10.5194/acp-14-6241-2014, 2014.
Ma, N., Zhao, C., Tao, J., Wu, Z., Kecorius, S., Wang, Z., Größ, J., Liu, H., Bian, Y., Kuang, Y., Teich, M., Spindler, G., Müller, K., van Pinxteren, D., Herrmann, H., Hu, M., and Wiedensohler, A.: Variation of CCN activity during new particle formation events in the North China Plain, Atmos. Chem. Phys., 16, 8593–8607, https://doi.org/10.5194/acp-16-8593-2016, 2016.
Mather, J. H. and Voyles, J. W.: The Arm Climate Research Facility: A Review of Structure and Capabilities, B. Am. Meteorol. Soc., 94, 377–392, 2013.
Meng, J. W., Yeung, M. C., Li, Y. J., Lee, B. Y. L., and Chan, C. K.: Size-resolved cloud condensation nuclei (CCN) activity and closure analysis at the HKUST Supersite in Hong Kong, Atmos. Chem. Phys., 14, 10267–10282, https://doi.org/10.5194/acp-14-10267-2014, 2014.
Mircea, M., Facchini, M. C., Decesari, S., Cavalli, F., Emblico, L., Fuzzi, S., Vestin, A., Rissler, J., Swietlicki, E., Frank, G., Andreae, M. O., Maenhaut, W., Rudich, Y., and Artaxo, P.: Importance of the organic aerosol fraction for modeling aerosol hygroscopic growth and activation: a case study in the Amazon Basin, Atmos. Chem. Phys., 5, 3111–3126, https://doi.org/10.5194/acp-5-3111-2005, 2005.
Mugnai, A. and Wiscombe, W.: Scattering from nonspherical Chebyshev particles. I: cross sections, single-scattering albedo, asymmetry factor, and backscattered fraction, Appl. Opt., 25, 1235–1244, 1986.
Paramonov, M., Kerminen, V.-M., Gysel, M., Aalto, P. P., Andreae, M. O., Asmi, E., Baltensperger, U., Bougiatioti, A., Brus, D., Frank, G. P., Good, N., Gunthe, S. S., Hao, L., Irwin, M., Jaatinen, A., Jurányi, Z., King, S. M., Kortelainen, A., Kristensson, A., Lihavainen, H., Kulmala, M., Lohmann, U., Martin, S. T., McFiggans, G., Mihalopoulos, N., Nenes, A., O'Dowd, C. D., Ovadnevaite, J., Petäjä, T., Pöschl, U., Roberts, G. C., Rose, D., Svenningsson, B., Swietlicki, E., Weingartner, E., Whitehead, J., Wiedensohler, A., Wittbom, C., and Sierau, B.: A synthesis of cloud condensation nuclei counter (CCNC) measurements within the EUCAARI network, Atmos. Chem. Phys., 15, 12211–12229, https://doi.org/10.5194/acp-15-12211-2015, 2015.
Petters, M. D. and Kreidenweis, S. M.: A single parameter representation of hygroscopic growth and cloud condensation nucleus activity, Atmos. Chem. Phys., 7, 1961–1971, https://doi.org/10.5194/acp-7-1961-2007, 2007.
Pinsky, M., Khain, A., Mazin, I., and Korolev, A.: Analytical estimation of droplet concentration at cloud base, J. Geophys. Res.-Atmos., 117, D18211, https://doi.org/10.1029/2012jd017753, 2012.
Pöhlker, M. L., Pöhlker, C., Ditas, F., Klimach, T., Hrabe de Angelis, I., Araújo, A., Brito, J., Carbone, S., Cheng, Y., Chi, X., Ditz, R., Gunthe, S. S., Kesselmeier, J., Könemann, T., Lavrič, J. V., Martin, S. T., Mikhailov, E., Moran-Zuloaga, D., Rose, D., Saturno, J., Su, H., Thalman, R., Walter, D., Wang, J., Wolff, S., Barbosa, H. M. J., Artaxo, P., Andreae, M. O., and Pöschl, U.: Long-term observations of cloud condensation nuclei in the Amazon rain forest – Part 1: Aerosol size distribution, hygroscopicity, and new model parametrizations for CCN prediction, Atmos. Chem. Phys., 16, 15709–15740, https://doi.org/10.5194/acp-16-15709-2016, 2016.
Pringle, K. J., Tost, H., Pozzer, A., Pöschl, U., and Lelieveld, J.: Global distribution of the effective aerosol hygroscopicity parameter for CCN activation, Atmos. Chem. Phys., 10, 5241–5255, https://doi.org/10.5194/acp-10-5241-2010, 2010.
Qi, X. M., Ding, A. J., Nie, W., Petäjä, T., Kerminen, V.-M., Herrmann, E., Xie, Y. N., Zheng, L. F., Manninen, H., Aalto, P., Sun, J. N., Xu, Z. N., Chi, X. G., Huang, X., Boy, M., Virkkula, A., Yang, X.-Q., Fu, C. B., and Kulmala, M.: Aerosol size distribution and new particle formation in the western Yangtze River Delta of China: 2 years of measurements at the SORPES station, Atmos. Chem. Phys., 15, 12445–12464, https://doi.org/10.5194/acp-15-12445-2015, 2015.
Schmale, J., Henning, S., Henzing, B., Keskinen, H., Sellegri, K., Ovadnevaite, J., Bougiatioti, A., Kalivitis, N., Stavroulas, I., Jefferson, A., Park, M., Schlag, P., Kristensson, A., Iwamoto, Y., Pringle, K., Reddington, C., Aalto, P., Äijälä, M., Baltensperger, U., Bialek, J., Birmili, W., Bukowiecki, N., Ehn, M., Fjæraa, A. M., Fiebig, M., Frank, G., Fröhlich, R., Frumau, A., Furuya, M., Hammer, E., Heikkinen, L., Herrmann, E., Holzinger, R., Hyono, H., Kanakidou, M., Kiendler-Scharr, A., Kinouchi, K., Kos, G., Kulmala, M., Mihalopoulos, N., Motos, G., Nenes, A., O'Dowd, C., Paramonov, M., Petäjä, T., Picard, D., Poulain, L., Prévôt, A. S. H., Slowik, J., Sonntag, A., Swietlicki, E., Svenningsson, B., Tsurumaru, H., Wiedensohler, A., Wittbom, C., Ogren, J. A., Matsuki, A., Yum, S. S., Myhre, C. L., Carslaw, K., Stratmann, F., and Gysel, M.: Collocated observations of cloud condensation nuclei, particle size distributions, and chemical composition, Sci. Data, 4, 170003, https://doi.org/10.1038/sdata.2017.3, 2017.
Schmale, J., Henning, S., Decesari, S., Henzing, B., Keskinen, H., Sellegri, K., Ovadnevaite, J., Pöhlker, M. L., Brito, J., Bougiatioti, A., Kristensson, A., Kalivitis, N., Stavroulas, I., Carbone, S., Jefferson, A., Park, M., Schlag, P., Iwamoto, Y., Aalto, P., Äijälä, M., Bukowiecki, N., Ehn, M., Frank, G., Fröhlich, R., Frumau, A., Herrmann, E., Herrmann, H., Holzinger, R., Kos, G., Kulmala, M., Mihalopoulos, N., Nenes, A., O'Dowd, C., Petäjä, T., Picard, D., Pöhlker, C., Pöschl, U., Poulain, L., Prévôt, A. S. H., Swietlicki, E., Andreae, M. O., Artaxo, P., Wiedensohler, A., Ogren, J., Matsuki, A., Yum, S. S., Stratmann, F., Baltensperger, U., and Gysel, M.: Long-term cloud condensation nuclei number concentration, particle number size distribution and chemical composition measurements at regionally representative observatories, Atmos. Chem. Phys., 18, 2853–2881, https://doi.org/10.5194/acp-18-2853-2018, 2018.
Schuster, G. L., Dubovik, O., and Holben, B. N.: Angstrom exponent and bimodal aerosol size distributions, J. Geophys. Res., 111, D07207, https://doi.org/10.1029/2005JD006328, 2006.
Schwartz, S. E., Charlson, R. J., Kahn, R. A., Ogren, J. A., and Rodhe, H.: Why hasn't Earth warmed as much as expected?, J. Climate, 23, 2453–2464, 2010.
Shen, Y., Virkkula, A., Ding, A., Wang, J., Chi, X., Nie, W., Qi, X., Huang, X., Liu, Q., Zheng, L., Xu, Z., Petäjä, T., Aalto, P. P., Fu, C., and Kulmala, M.: Aerosol optical properties at SORPES in Nanjing, east China, Atmos. Chem. Phys., 18, 5265–5292, https://doi.org/10.5194/acp-18-5265-2018, 2018.
Shinozuka, Y., Clarke, A. D., DeCarlo, P. F., Jimenez, J. L., Dunlea, E. J., Roberts, G. C., Tomlinson, J. M., Collins, D. R., Howell, S. G., Kapustin, V. N., McNaughton, C. S., and Zhou, J.: Aerosol optical properties relevant to regional remote sensing of CCN activity and links to their organic mass fraction: airborne observations over Central Mexico and the US West Coast during MILAGRO/INTEX-B, Atmos. Chem. Phys., 9, 6727–6742, https://doi.org/10.5194/acp-9-6727-2009, 2009.
Shinozuka, Y., Clarke, A. D., Nenes, A., Jefferson, A., Wood, R., McNaughton, C. S., Ström, J., Tunved, P., Redemann, J., Thornhill, K. L., Moore, R. H., Lathem, T. L., Lin, J. J., and Yoon, Y. J.: The relationship between cloud condensation nuclei (CCN) concentration and light extinction of dried particles: indications of underlying aerosol processes and implications for satellite-based CCN estimates, Atmos. Chem. Phys., 15, 7585–7604, https://doi.org/10.5194/acp-15-7585-2015, 2015.
Sihto, S.-L., Kulmala, M., Kerminen, V.-M., Dal Maso, M., Petäjä, T., Riipinen, I., Korhonen, H., Arnold, F., Janson, R., Boy, M., Laaksonen, A., and Lehtinen, K. E. J.: Atmospheric sulphuric acid and aerosol formation: implications from atmospheric measurements for nucleation and early growth mechanisms, Atmos. Chem. Phys., 6, 4079–4091, https://doi.org/10.5194/acp-6-4079-2006, 2006.
Sihto, S.-L., Mikkilä, J., Vanhanen, J., Ehn, M., Liao, L., Lehtipalo, K., Aalto, P. P., Duplissy, J., Petäjä, T., Kerminen, V.-M., Boy, M., and Kulmala, M.: Seasonal variation of CCN concentrations and aerosol activation properties in boreal forest, Atmos. Chem. Phys., 11, 13269–13285, https://doi.org/10.5194/acp-11-13269-2011, 2011.
Tao, J., Zhao, C., Kuang, Y., Zhao, G., Shen, C., Yu, Y., Bian, Y., and Xu, W.: A new method for calculating number concentrations of cloud condensation nuclei based on measurements of a three-wavelength humidified nephelometer system, Atmos. Meas. Tech., 11, 895–906, https://doi.org/10.5194/amt-11-895-2018, 2018.
Twomey, S.: The influence of cloud nucleus population on the microstructure and stability of convective clouds, Tellus, 11, 408–411, 1959.
Uin, J.: Integrating Nephelometer Instrument Handbook, United States, https://doi.org/10.2172/1246075, 2016a.
Uin, J.: Cloud Condensation Nuclei Particle Counter (CCN) Instrument Handbook, United States, https://doi.org/10.2172/1251411, 2016b.
Virkkula, A., Backman, J., Aalto, P. P., Hulkkonen, M., Riuttanen, L., Nieminen, T., dal Maso, M., Sogacheva, L., de Leeuw, G., and Kulmala, M.: Seasonal cycle, size dependencies, and source analyses of aerosol optical properties at the SMEAR II measurement station in Hyytiälä, Finland, Atmos. Chem. Phys., 11, 4445–4468, https://doi.org/10.5194/acp-11-4445-2011, 2011.
Wang, J., Cubison, M. J., Aiken, A. C., Jimenez, J. L., and Collins, D. R.: The importance of aerosol mixing state and size-resolved composition on CCN concentration and the variation of the importance with atmospheric aging of aerosols, Atmos. Chem. Phys., 10, 7267–7283, https://doi.org/10.5194/acp-10-7267-2010, 2010.
Wang, J., Krejci, R., Giangrandel, S., Kuang, C., Barbosa, H. M. J., Brito, J., Carbone, S., Chi, X. G., Comstock, J., Ditas, F., Lavric, J., Manninen, H. E., Mei, F., Moran-Zuloaga, D., Pohlker, C., Pohlker, M. L., Saturno, J., Schmid, B., Souza, R. A. F., Springston, S. R., Tomlinson, J. M., Toto, T., Walter, D., Wimmer, D., Smith, J. N., Kulmala, M., Machado, L. A. T., Artaxo, P., Andreae, M. O., Petäjä, T., and Martin, S. T.: Amazon boundary layer aerosol concentration sustained by vertical transport during rainfall, Nature, 539, 416–419, https://doi.org/10.1038/nature19819, 2016.
Wiscombe, W. J. and Grams, G. W.: The backscattered fraction in two-stream approximations, J. Atmos. Sci., 33, 2440–2451, 1976.


