the Creative Commons Attribution 4.0 License.
the Creative Commons Attribution 4.0 License.
 | 16 Dec 2019
Impact of halogen chemistry on summertime air quality in coastal and continental Europe: application of the CMAQ model and implications for regulation
Rafael Borge
Golam Sarwar
David de la Paz
Brett Gantt
Jessica Domingo
Carlos A. Cuevas
Halogen (Cl, Br, and I) chemistry has been reported to influence the formation of secondary air pollutants. Previous studies mostly focused on the impact of chlorine species on air quality over large spatial scales. Very little attention has been paid to the effect of the combined halogen chemistry on air quality over Europe and its implications for control policy. In the present study, we apply a widely used regional model, the Community Multiscale Air Quality Modeling System (CMAQ), incorporated with the latest halogen sources and chemistry, to simulate the abundance of halogen species over Europe and to examine the role of halogens in the formation of secondary air pollution. The results suggest that the CMAQ model is able to reproduce the level of O3, NO2, and halogen species over Europe. Chlorine chemistry slightly increases the levels of OH, HO2, NO3, O3, and NO2 and substantially enhances the level of the Cl radical. Combined halogen chemistry induces complex effects on OH (ranging from −0.023 to 0.030 pptv) and HO2 (in the range of −3.7 to 0.73 pptv), significantly reduces the concentrations of NO3 (as much as 20 pptv) and O3 (as much as 10 ppbv), and decreases NO2 in highly polluted regions (as much as 1.7 ppbv); it increases NO2 (up to 0.20 ppbv) in other areas. The maximum effects of halogen chemistry occur over oceanic and coastal regions, but some noticeable impacts also occur over continental Europe. Halogen chemistry affects the number of days exceeding the European Union target threshold for the protection of human beings and vegetation from ambient O3. In light of the significant impact of halogen chemistry on air quality, we recommend that halogen chemistry be considered for inclusion in air quality policy assessments, particularly in coastal cities.
- Article
(10695 KB) - Full-text XML
-
Supplement
(1331 KB) - BibTeX
- EndNote


Halogen (Cl, Br, and I) species and related processes have been known to deplete stratospheric ozone (O3) for several decades (Molina and Rowland, 1974; Farman et al., 1985). In the troposphere, the chemistry of halogens has been described in detail in recent reviews and references therein (Saiz-Lopez and von Glasow, 2012; Simpson et al., 2015), so it is just briefly outlined here. Halogen species affect the concentration of air pollutants by, e.g., directly destroying O3 (Reaction R1), indirectly decreasing O3 production by reducing NO2 (Reactions R2 and R3), and influencing the NO∕NO2 ratio (Reactions R2 and R4) and the HO2∕OH ratio (Reactions R5 and R6). The budgets of NOx (NO+NO2) and HOx (OH+HO2) also affect the formation of O3 (e.g., Sillman, 1999; Li et al., 2018).
The chlorine radical (Cl) initiates the oxidation of hydrocarbons (Reaction R7), including methane (CH4) and non-methane volatile organic compounds (NMVOCs), in a similar way to the OH radical, reducing the lifetime of CH4 and NMVOCs and leading to the formation of O3 in the presence of NOx (Thornton et al., 2010).
The combined effect of halogen chemistry on air quality is therefore complicated and depends heavily on local conditions, e.g., atmospheric compositions and oxidative capacity (Sherwen et al., 2017; Muñiz-Unamunzaga et al., 2018). Evaluation of the complex role of halogen chemistry in air quality requires the employment of advanced, high-resolution chemical transport models.
A number of modeling studies have been conducted to investigate the impact of individual halogen species on air quality. The chemistry of chlorine, mainly that of nitryl chloride (ClNO2), has been reported to increase the oxidation capacity and the formation of O3 in recent studies (Sarwar et al., 2012, 2014; Li et al., 2016; Sherwen et al., 2017; Sommariva et al., 2018). Bromine (Fernandez et al., 2014) and iodine (Saiz-Lopez et al., 2014) chemistry are reported to decrease the concentration of O3 over oceanic and terrestrial regions.
Only a few regional modeling studies have explored the combined influence of halogen chemistry on air quality. The first modeling study with combined halogen (Cl, Br, and I) chemistry was conducted by Sarwar et al. (2015), who used a hemispheric version of the Community Multiscale Air Quality (CMAQ) model (Byun and Ching, 1999; Byun and Schere, 2006; Mathur et al., 2017) and reported a decrease in surface O3 by ∼15 % to ∼48 % over the Northern Hemisphere by Br and I. Gantt et al. (2017) then utilized the CMAQ model to explore the role of halogen chemistry at a regional scale over the continental United States (US). While these studies focused on the Northern Hemisphere and the continental US, Muñiz-Unamunzaga et al. (2018) applied the full halogen chemistry version of CMAQ with a resolution of 4 km and reported an up to 5 ppbv decrease in O3 in the city of Los Angeles, California, US. Sherwen et al. (2017) used a global model, GEOS-Chem, in a regional configuration (with a grid size of ∘, km) and predicted a large decrease in O3, on average 13.5 pptv (25 %) and as much as 28.9 pptv (45 %), in Europe. Sarwar et al. (2019) further updated the halogen chemistry in the CMAQ model and reported a reduction of 3 to 12 ppbv in annual average O3 over seawater, 3 to 6 ppbv over coastal areas, and 3 ppbv over inland areas by Br and I. These previous regional studies using various models (or versions of models) in different areas reported a large range of the halogen impact on O3, highlighting the uncertainty in this research field.
The regulation of air quality and the control of air pollutants emission in Europe started in the early 1970s and over 40 years of effort has successfully improved air quality throughout Europe (EEA, 2018a). Nonetheless, poor air quality persists in major cities like Madrid, Paris, and London (EEA, 2018a); this shows the need for continued air quality management and effective policy. Because the influence of halogens on air quality is uncertain and potentially has an impact on air quality management decisions, we have conducted regional simulations using the latest version of the CMAQ model implemented with comprehensive halogen sources and chemistry (Sarwar et al., 2019) to examine the overall effect of halogen species on air pollution over Europe. Considering that the grid size has a noticeable impact on air quality model predictions (Sommariva et al., 2018), we used a CMAQ model domain with 12 km horizontal resolution (higher than the previous studies on the halogen impact covering Europe) to simulate the levels of halogen species over Europe, examine the effect on the oxidation capacity and the concentration of air pollutants, and explore the potential implications for air quality policy related to NO2 and O3.
2.1 Data
The meteorological inputs for the CMAQ model were obtained from the Weather Research and Forecasting model (WRF 3.7.1) (Skamarock and Klemp, 2008; Borge et al., 2008a) as an offline input. The WRF model was initialized from global reanalyses from the National Centers for Environmental Prediction (NCEP) Global Forecast System (GFS) with a spatial resolution of and a temporal resolution of 6 h (available online at http://rda.ucar.edu/datasets/ds083.2/, last access: 22 November 2019), which was updated daily from NCEP global analyses with 0.5∘ resolution (available online at http://www.nco.ncep.noaa.gov/pmb/products/sst/, last access: 22 November 2019). NCEP's ADP global upper-air (NCAR archive ds351.0) and global surface observations (NCAR archive ds461.0) were used to drive the simulation with a Newtonian relaxation technique in the WRF model.
Anthropogenic emissions for the year 2016 were taken from the gridded EMEP inventory (EMEP/CEIP, 2014). It should be noted that no anthropogenic chlorine sources are included in our emission inventory. The temporal profiles and vertical distribution needed to resolve the emissions were those used in the EuroDelta experiment (van Loon et al., 2007). Biogenic emissions were estimated using the Model of Emissions of Gases and Aerosols from Nature (MEGANv2.10) (Guenther et al., 2012). All emissions were gridded to our model domain, temporally allocated, and chemically speciated using the Sparse Matrix Operator Kernel Emissions (SMOKE) model version 3.6.5 (UNC, 2015; Borge et al., 2008b).
In addition, we used measurement data on NO2 and O3 from over 400 background stations (traffic and industrial stations are not included) across Europe from the database AirBase (public air quality database system of the EEA, 2018a) to compare the results of our simulation with observations (Fig. 1). Among these stations, 315 are located in inland areas (208 for NO2 and 266 for O3), and 125 are located in coastal areas (83 for NO2 and 93 for O3).
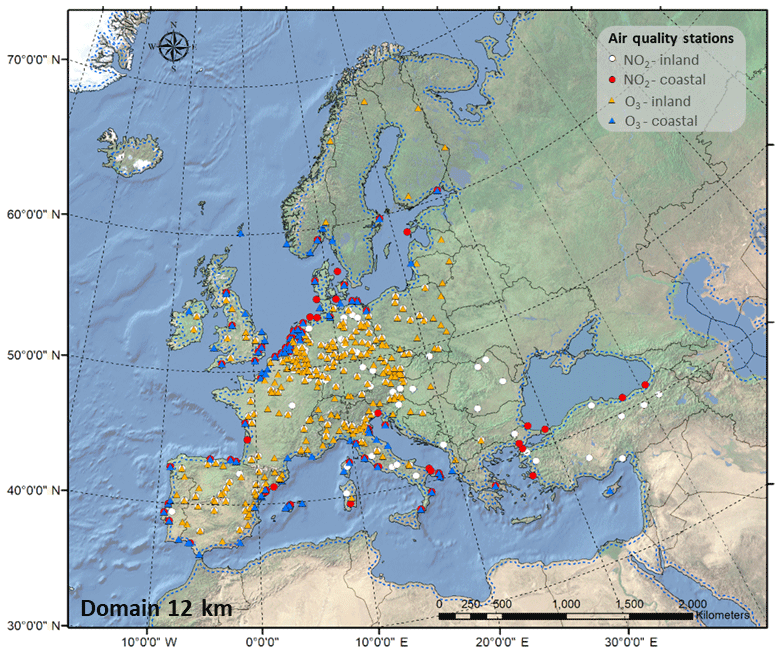
Figure 1Geographic representation of the modeling domain and the air quality stations used for model evaluation.
2.2 Modeling system
The CMAQ model is widely used and includes comprehensive representations of many essential atmospheric processes. The skill of the model in reproducing observed air quality has been demonstrated in many previous studies (Foley et al., 2010; Appel et al., 2013, 2017; Mathur et al., 2017), including applications over Europe (Borge et al., 2008a; Appel et al., 2012; Solazzo et al., 2017). CMAQ version 5.2 (https://www.epa.gov/cmaq, last access: 22 November 2019; https://doi.org/10.5281/zenodo.1167892, US EPA ORD, 2017) containing the Carbon Bond chemical mechanism (Appel et al., 2017) with halogen chemistry was used in this study. We updated the chlorine chemistry of Sarwar et al. (2012) and implemented it in CMAQ version 5.2 (Table S1 in the Supplement). The heterogeneous hydrolysis of dinitrogen pentoxide (N2O5) can produce ClNO2 and nitric acid (HNO3) in the presence of particulate chloride. In the absence of particulate chloride, the heterogeneous hydrolysis of N2O5 produces only HNO3. Sarwar et al. (2015) implemented the initial bromine and iodine chemistry in CMAQ, which has recently been updated by Sarwar et al. (2019). The updates include revising the gas-phase bromine and iodine reactions, incorporating several heterogeneous reactions of bromine and iodine species, incorporating several aqueous-phase bromine reactions, and revising the iodine and bromine emissions. We combine the updated chlorine, bromine, and iodine chemistry with the Carbon Bond chemical mechanism and use it in this study.
2.3 Simulation setup
A detailed description of physics and other model options (Table S2) can be found in de la Paz et al. (2016). The CMAQ model is applied over a domain covering the entirety of Europe (Fig. 1) with 12 km horizontal resolution. The vertical extent of the model extended from the surface to 100 mbar and contained 35 layers with an average surface layer thickness of approximately 20 m. The CMAQ chemical transport model is configured to use the piecewise parabolic method to describe advection processes, the Asymmetric Convective Model (version 2) to describe vertical diffusion processes, and the multiscale method to describe horizontal diffusion processes. Gas-phase chemistry, aqueous chemistry, aerosol processes, and dry and wet deposition were also included. The Rosenbrock solver was used for gas-phase chemistry.
The study was completed for the month of July 2016 with a spin-up period of 30 d. We performed three simulations to isolate the effect of halogen chemistry on air quality (in brackets is the name of the scenario used hereafter):
- 1.
base model without halogen chemistry (BASE),
- 2.
BASE with chlorine chemistry (CL), and
- 3.
CL with Br and I chemistry (HAL).
The BASE model simulation includes the Carbon Bond 2015 chemical mechanism but does not contain any halogen chemistry, and only HNO3 is produced from the heterogeneous hydrolysis of N2O5. The CL simulation contains the Carbon Bond chemical mechanism with chlorine chemistry and considers ClNO2 and HNO3 production from the heterogeneous uptake of N2O5 on the aerosol surface. The HAL simulation contains the Carbon Bond chemical mechanism with full halogen chemistry and produces ClNO2 and HNO3 from the heterogeneous uptake of N2O5 on the aerosol surface.
Boundary conditions for the model were derived from the hemispheric CMAQ simulations (Mathur et al., 2017). Three different annual simulations were conducted using the hemispheric CMAQ model for 2016: the first simulation used the Carbon Bond chemical mechanism without any halogen chemistry, the second simulation used the Carbon Bond chemical mechanism and the chlorine chemistry, and the third simulation used the Carbon Bond chemical mechanism and the full halogen chemistry. Results from the corresponding hemispheric CMAQ simulation were used to generate boundary conditions for the BASE, CL, and HAL simulations. Therefore, the difference between CL and BASE simulations represents the impact of the chlorine chemistry on air quality, and the difference between HAL and BASE simulations represents the effect of halogen chemistry on air quality.
3.1 Evaluation of model performance
The performance of the CMAQ model in simulating air quality over Europe is evaluated using observation data collected from >400 measurement stations. We separate the stations into coastal (within 24 km of the coast) and continental stations (Fig. 1). Table 1 presents the statistics of the model performance for O3 and NO2 for BASE and HAL simulations.
The BASE and HAL simulations generally reproduce the concentration levels and the temporal variations of O3 and NO2 both at coastal and continental stations. The correlation coefficients between simulations and observations (Fig. S1 in the Supplement) show that CMAQ satisfactorily reproduces the variation of O3 and NO2 over most of Europe, especially the coastal regions (>0.6 for O3 and >0.4 for NO2). The BASE simulation underpredicts O3 compared to observations at both coastal and continental stations (Table 1), possibly due to the uncertainty of the NMVOC emission inventory (Sherwen et al., 2017) and the underestimated NOx (Table 1). The HAL simulation slightly improves the correlation coefficient of O3 but decreases the average level of O3 compared to the BASE case. Diurnal variation plots (Fig. S2) suggest that both BASE and HAL simulations can reproduce the temporal patterns of O3.
Table 1Statistical summary of model performance.
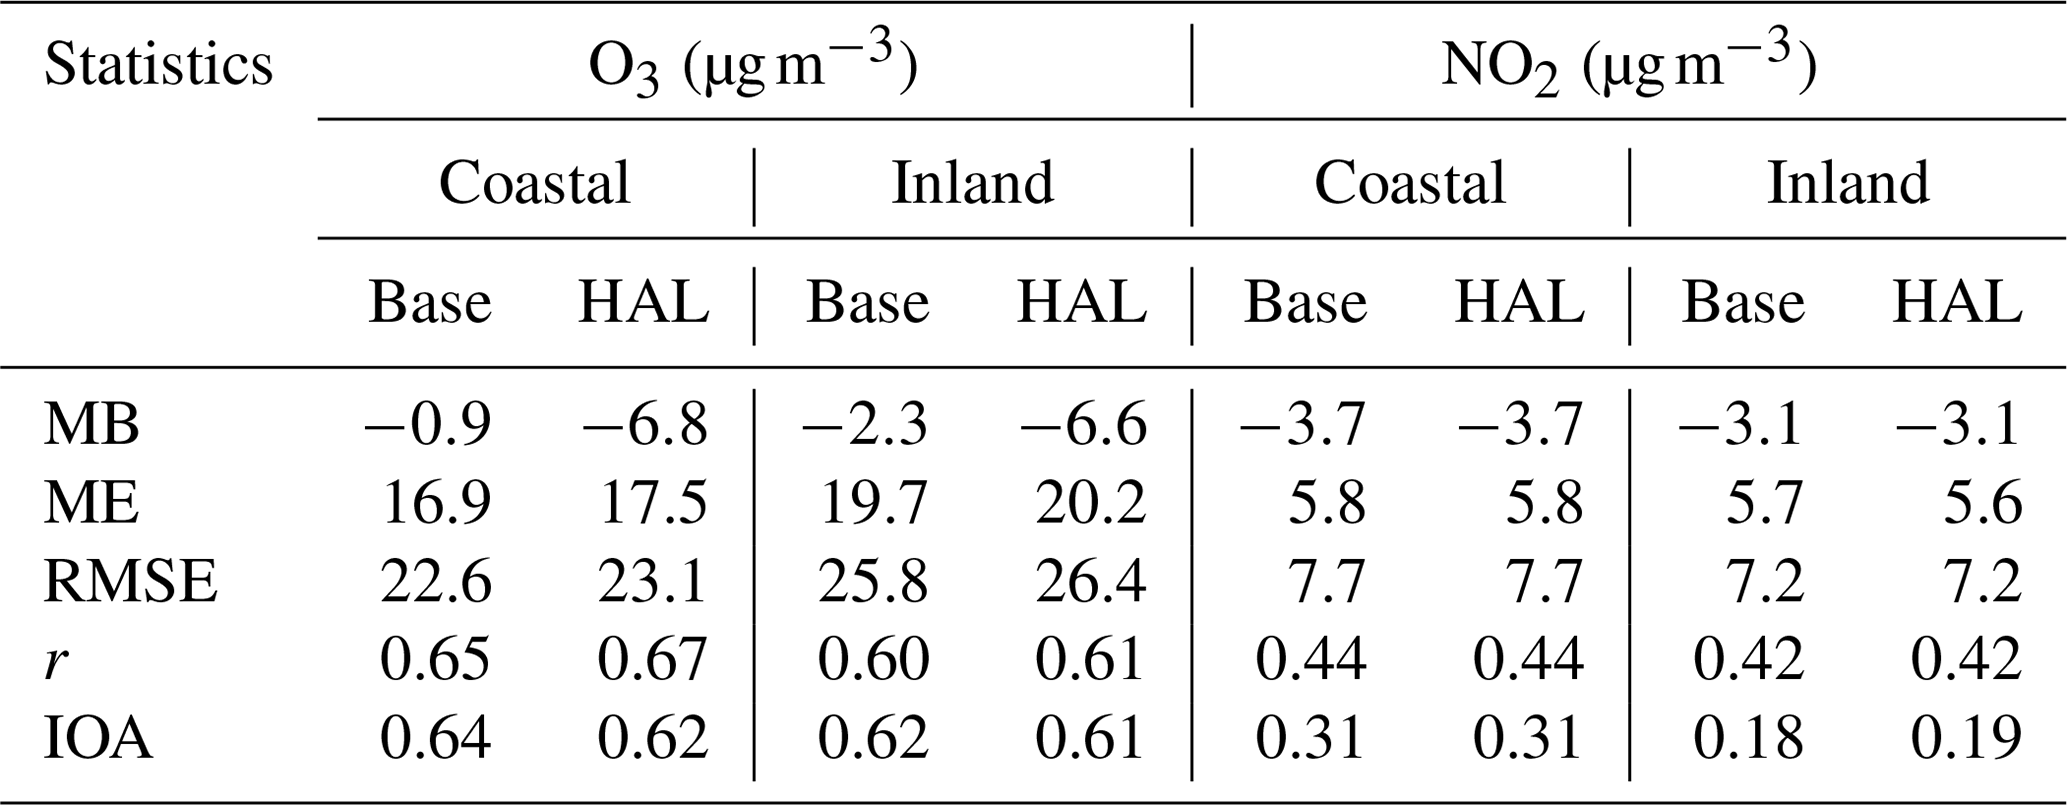
MB: mean bias, RMSE: root mean square error, r: correlation coefficient, IOA: index of agreement.
The BASE simulation underpredicts NO2 compared to observations at both coastal and continental stations (Table 1). Such an underestimation of NO2 can occur for many reasons, including (1) positive artifacts of NO2 monitors (Jung et al., 2017), (2) underestimation of NOx in the emission inventory, and (3) rapid transformation of NO2 into HNO3 in the model compared to the real atmosphere. Model performance is reasonable as the NO2 underestimation is relatively small. The HAL case predicted very similar NO2 concentrations (Table 1).
Overall, the evaluation of CMAQ results over Europe demonstrates that the model is capable of reproducing the levels of atmospheric chemical species and can be used to investigate the impact of halogen chemistry on air quality over Europe. It also suggests that the incorporation of halogen chemistry changes the model performance for O3 concentrations by a small margin without a noticeable impact on the model performance for NO2.
3.2 Simulated halogen species
Average surface concentrations of the inorganic halogen species predicted in the HAL simulation over the ocean are summarized in Table 2. HCl is the dominant chlorine species, with an average level of 247.9 pptv representing over 96 % of the total inorganic chlorine (Cly), while the average ClNO2 and HOCl is 4.9 pptv (1.9 %) and 3.8 pptv (1.5 %), respectively, with the remaining species contributing less than 1 %. The Bry species are relatively evenly partitioned, with HOBr (1.06 pptv, 27.0 %), BrCl (0.71 pptv, 18.2 %), BrNO3 (0.67 pptv, 16.9 %), HBr (0.66 pptv, 16.8 %), and Br2 (0.33 pptv, 8.4 %) being the abundant species, while the remaining species contribute <5 %. HOI (5.1 pptv, 52.0 %), INO3 (2.8 pptv, 28.7 %), and IO (1.0 pptv, 10.3 %) contribute over 90 % of Iy over the ocean, while the remaining species contribute ∼10 %. The predicted average concentrations of the critical halogen radicals, Cl, BrO, and IO, are , 0.03, and 0.4 pptv, respectively, over the ocean in Europe.
Table 2Simulated average concentrations of inorganic halogen species over the ocean.
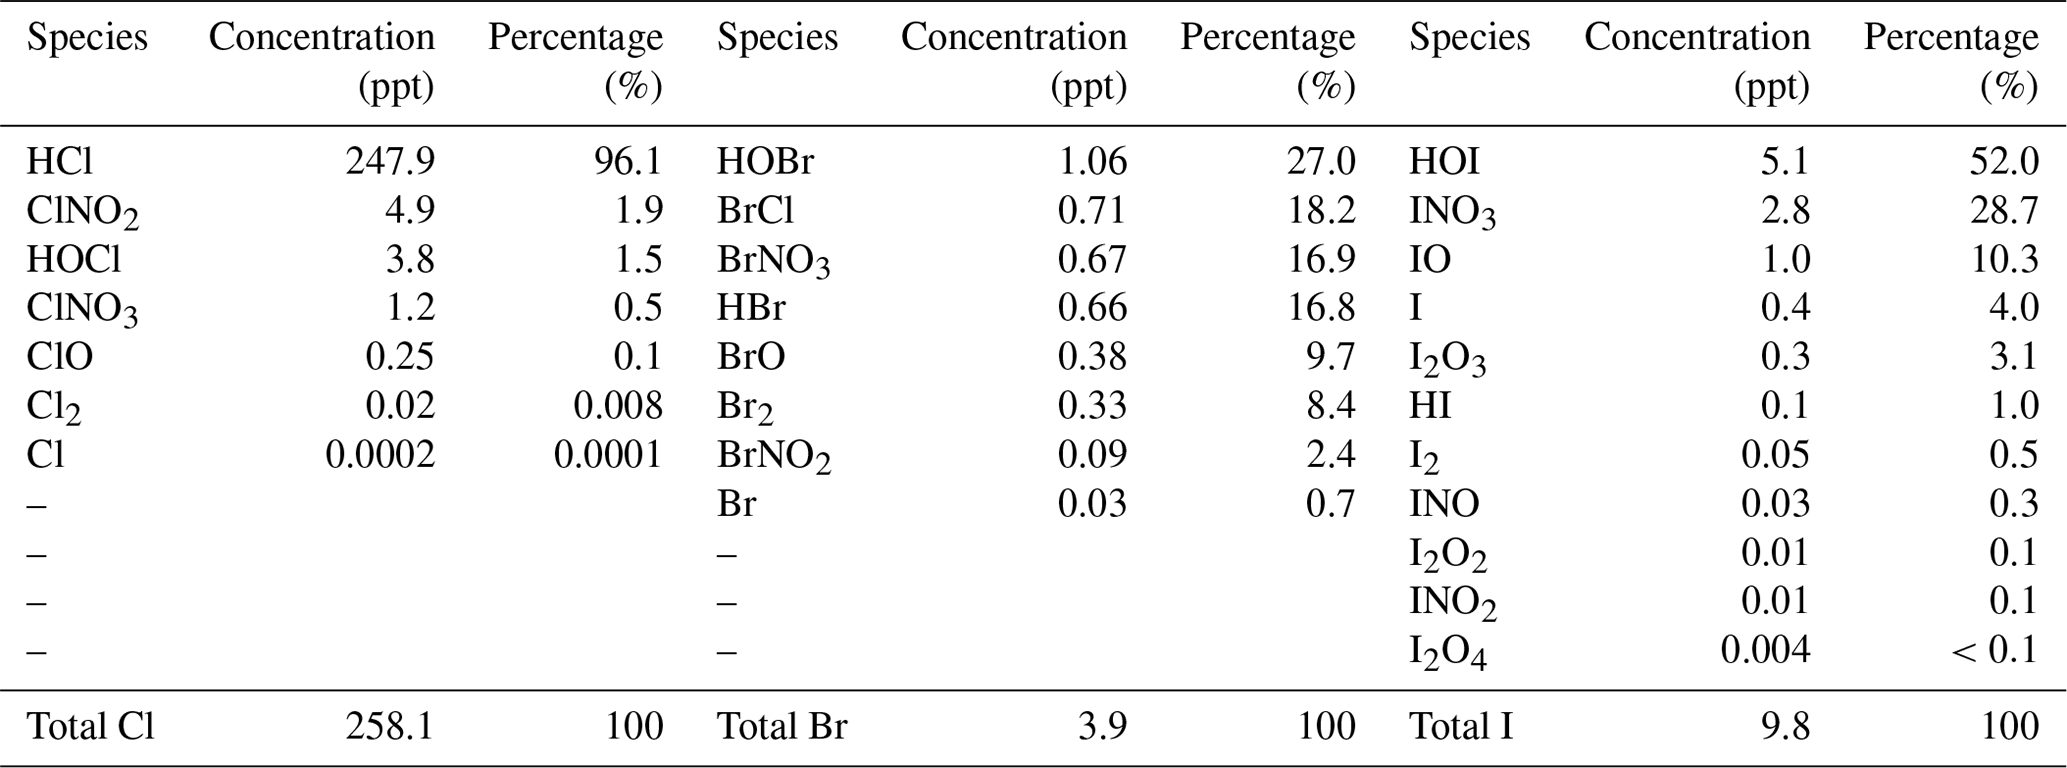
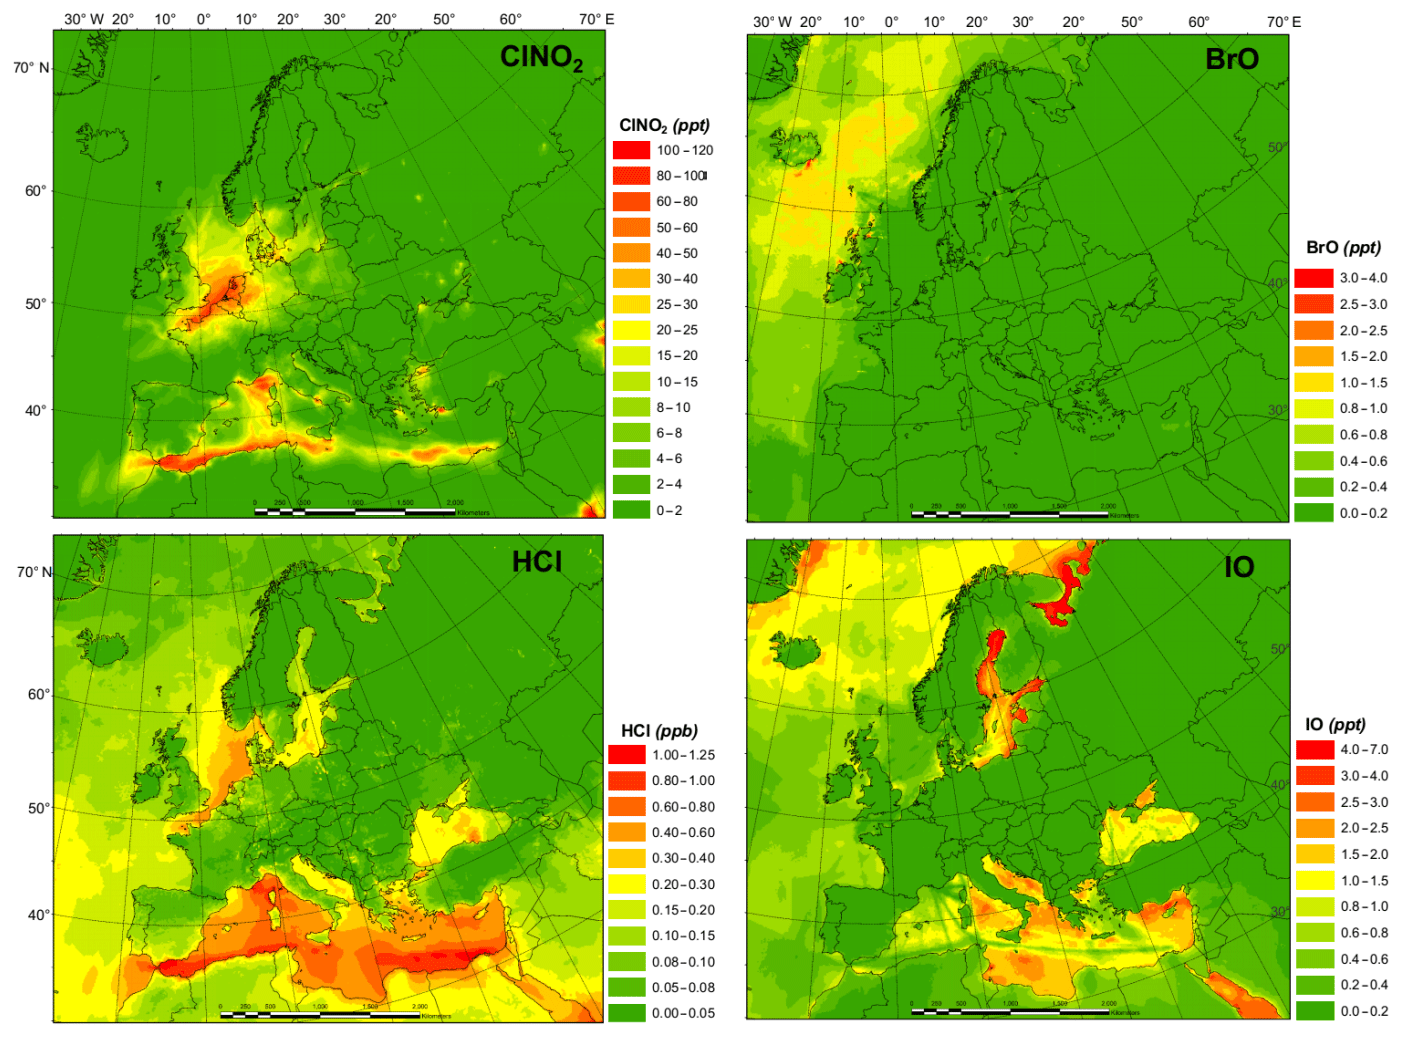
Figure 2Monthly average ClNO2, HCl, BrO, and IO concentration in the HAL simulation.
The spatial distributions of key halogen species are shown in Fig. 2. The HAL simulation with full halogen chemistry simulates generally higher ClNO2 levels (with the highest monthly average value of 113.0 pptv) along the coast of the Mediterranean Sea and the North Sea with some influence into continental Europe, especially in Germany. The simulated HCl shows a similar pattern to that of ClNO2 but with a much higher concentration (>10 times higher). The predicted BrO levels over Europe are low (average value ∼0.17 pptv), with the largest predicted value occurring within the Arctic Circle, while GEOS-Chem predicted >1.0 pptv of BrO in the Mediterranean Sea (Sherwen et al., 2017). The predicted IO peaks over the Mediterranean region with a maximum value of 6.9 pptv.
Direct measurements of halogen species are very scarce and not available for the period covered in the present study (July 2016). Since a direct comparison is not possible, here we present a comparison of the simulated concentrations with observations from previous studies (Table 3) to provide an approximate assessment of the representation of halogen species in the HAL simulation of the CMAQ model over Europe.
Table 3Comparison of observed and simulated halogen species.
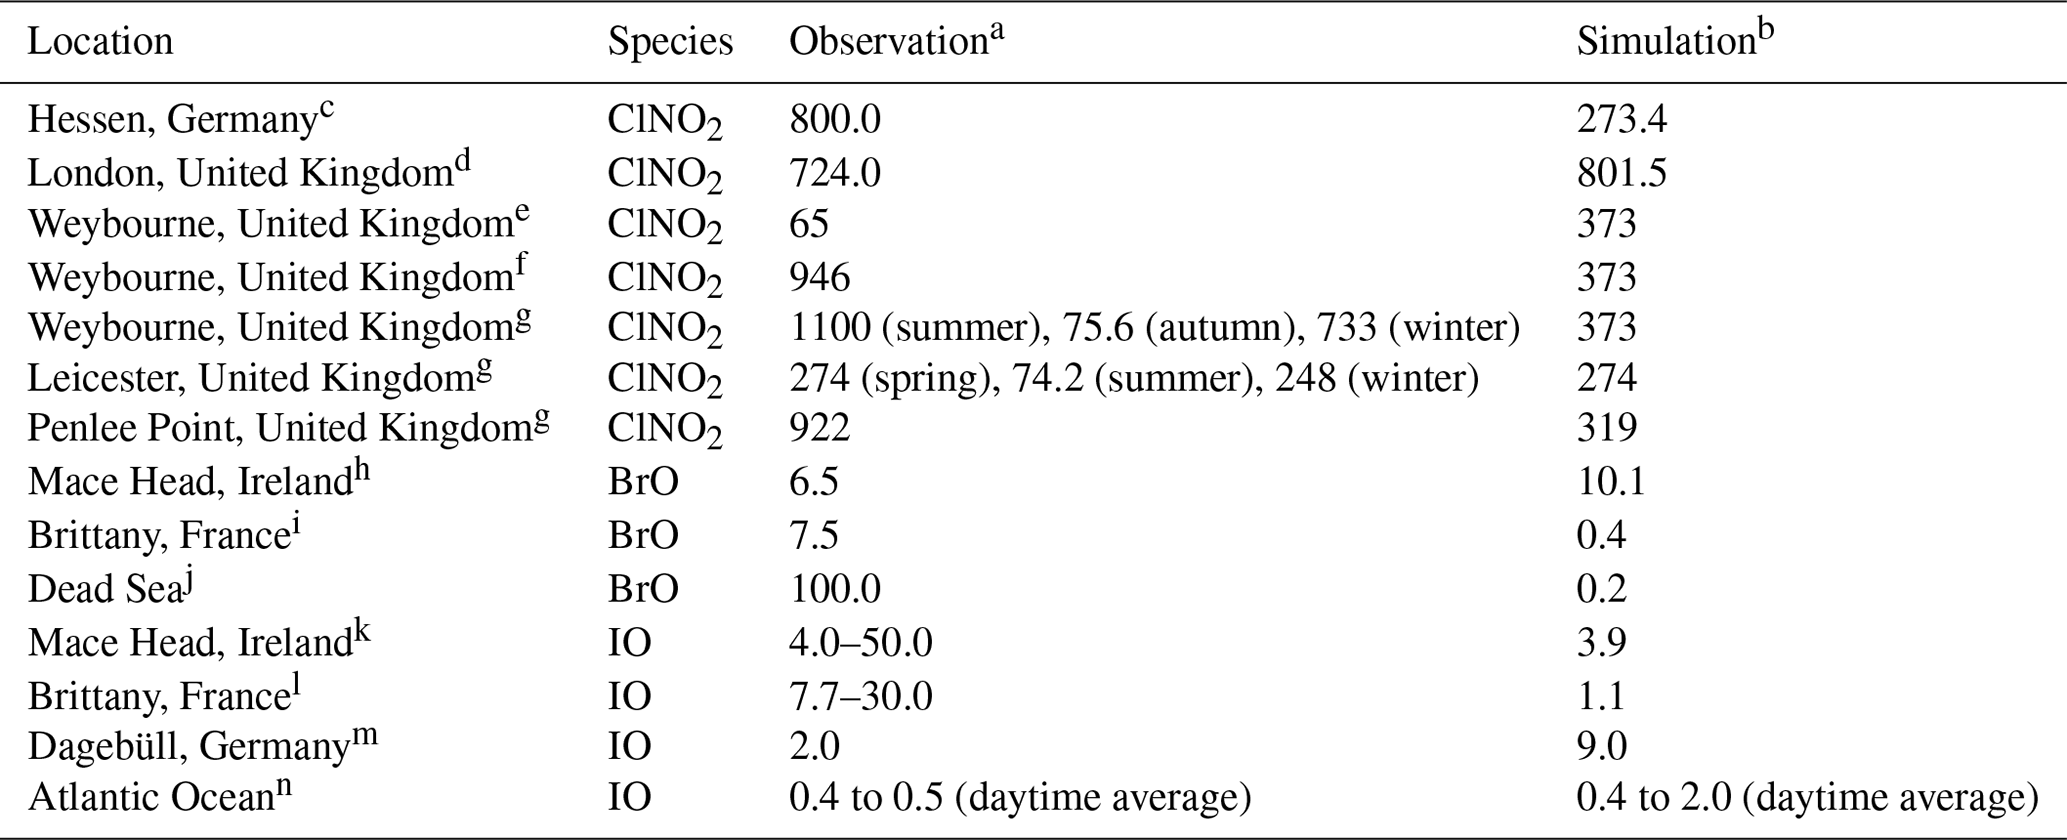
a Maximum value (pptv). b Maximum value (pptv) from the HAL simulation. c Phillips et al. (2012). d Bannan et al. (2015). e Bannan et al. (2017). f Sherwen et al. (2017). g Sommariva et al. (2018). h Saiz-Lopez et al. (2004). i Mahajan et al. (2009). j Matveev et al. (2001), Holla et al. (2015). k Allan et al. (2000), Commane et al. (2011). l Britter et al. (2005), Furneaux et al. (2010). m Peters et al. (2005). n Prados-Roman et al. (2015)
Numerous ClNO2 measurements have been reported around the globe, which show that ClNO2 is ubiquitous in the boundary layer, with maximum values ranging from hundreds to thousands of parts per trillion by volume in polluted coastal (Osthoff et al., 2008; Wang et al., 2016) and continental regions (Tham et al., 2016; Thornton et al., 2010). A few campaigns have been conducted in Europe. Phillips et al. (2012) reported a maximum value of 800 pptv for ClNO2 in Hessen, Germany, where CMAQ predicts a concentration of 273 pptv. Bannan et al. (2015) observed a peak value of 724 pptv in London where CMAQ predicts a concentration of 802 pptv. Simulations with the GEOS-Chem model (Sherwen et al., 2017) reported maximum values of 110 and 140 pptv in Hessen and London, respectively. Several field campaigns have been conducted in Weybourne in the past few years to measure ClNO2. Sherwen et al. (2017) reported a peak concentration of 946 pptv. Bannan et al. (2017) reported a peak value of 65 pptv, and Sommariva et al. (2018) reported a peak value of 1100 pptv in summer, 75.6 pptv in autumn, and 733 pptv in winter. CMAQ simulated a maximum of 373 pptv at that location, while GEOS-Chem predicted 458 pptv. Sommariva et al. (2018) also reported measurements of ClNO2 in Leicester with a maximum value of 274 pptv in spring, 74.2 pptv in summer, and 248 pptv in winter, with a peak value at Penlee Point of 922 pptv. CMAQ predicted a maximum of 274 pptv in Leicester and 319 pptv at Penlee Point. Eger et al. (2019) conducted shipborne observations of ClNO2 in the Mediterranean Sea and reported up to 600 pptv ClNO2 during their campaign, which is similar to the prediction of the present study.
The observed levels of HCl in Europe range from <100 to 5000 pptv (Hossaini et al., 2016, and the references therein). The CMAQ model predicted monthly average concentrations of HCl of 6.3 to 1249 pptv, which is similar to the observation ranges. GEOS-Chem (Sherwen et al., 2017) predicted a maximum of 12 pptv for HCl, which is significantly lower than the measurements in Europe.
BrO measurements have been reported at ground-based sites and during the ship cruises, which generally demonstrate a range of 0.5 to 2.0 pptv maximum values for land measurements and 3.0 to 3.6 pptv for ship measurements (Saiz-Lopez and von Glasow, 2012). BrO observations have been reported at several coastal sites in Europe. BrO levels of up to 6.5 pptv (Saiz-Lopez et al., 2004) and 7.5 pptv (Mahajan et al., 2009) were reported in Mace Head and Brittany, respectively. CMAQ predicts 10.1 and 0.4 pptv at those locations, which are lower than the measurements. Sherwen et al. (2017) also predicted small values, with a maximum of 0.8 pptv in Mace Head and 0.5 pptv in Brittany. An extremely high level of BrO, ∼100 pptv, was observed over the Dead Sea (Matveev et al., 2001; Holla et al., 2015). CMAQ is not able to reproduce such a high level of BrO due to the lower bromide content in typical ocean water (which was used in the present study for the Dead Sea) compared to the exceptionally high bromide content in the Dead Sea (Tas et al., 2006; Sarwar et al., 2015).
Global measurements show that the IO levels observed by ground-based campaigns were generally between 0.2 and 2.4 pptv, while those by ship measurement were ∼3.5 pptv (Saiz-Lopez and von Glasow, 2012). Observations of IO have also been conducted in Europe. Maximum IO levels of 4.0–50.0 pptv were measured at Mace Head (Allan et al., 2000; Commane et al., 2011). CMAQ predicts a value of 3.9 pptv at Mace Head, while GEOS-Chem predicted a value of 0.6 pptv (Sherwen et al., 2017). In Brittany, up to 7.7–30.0 pptv of IO were observed by Bitter et al. (2005) and Furneaux et al. (2010). CMAQ predicts 1.1 pptv of IO at Brittany and Sherwen et al. (2017) predicted 0.07 pptv. A maximum IO concentration of 2.0 pptv was reported in Dagebüll (Peters et al., 2005), and CMAQ predicts 9.0 pptv at that site, while GEOS-Chem predicted 1.8 pptv (Sherwen et al., 2017). Prados-Roman et al. (2015) reported the level of IO during a ship-based campaign in the range of <0.4 to >1.4 pptv (daytime average) around the globe and 0.4 to 0.5 pptv (daytime average) in the south of Spain and the west of Africa (over the Atlantic); the present study predicted 0.4 to 2.0 pptv (daytime average) of IO over those areas.
3.3 Influence of halogen chemistry on the atmospheric oxidation capacity
Figure 3 shows the monthly average concentrations of the OH and HO2 radicals predicted by the BASE simulation as well as the impact of chlorine chemistry (CL-BASE) and the full halogen chemistry (HAL-BASE) on the simulated OH and HO2 levels. In the BASE simulation, the highest OH concentration levels are predicted over the oceans, especially along ship tracks, with a maximum value of 0.38 pptv ( molecule cm−3). The chlorine chemistry slightly increased the OH level over most of the domain by up to 0.0041 pptv (1.0×10⁵ molecule cm−3). The impact of the halogen chemistry has competing effects on OH concentrations, with a maximum increase of 0.030 pptv (7.5×10⁵ molecule cm−3) and a reduction of as much as 0.023 pptv (5.8×10⁵ molecule cm−3). The BASE simulation predicts the highest values of HO2 over the Mediterranean Sea, with a maximum value of 21 pptv. The chlorine chemistry increases the HO2 level in the areas of elevated ClNO2 predictions (Figs. 2 and 3). The further addition of halogen chemistry lowers the HO2 as much as 3.7 pptv and increases HO2 up to 0.73 pptv compared to the BASE simulation. The overall difference of HO2 because of halogens was −0.59 pptv in the European domain. The effect of halogen chemistry on OH and HO2 is the combined effect of the following four pathways: (1) conversion of HO2 to OH via XO (Reactions R5 and R6), in which HO2 decreases and OH increases; (2) reduction of O3 (Reaction R1 and Fig. 7) and the reduced production of OH by O3 photolysis, in which both OH and HO2 decrease; (3) increase in NO2 (Reaction R4 and Fig. 7) and the enhanced consumption of OH by the reaction with NO2, in which both OH and HO2 decrease; and (4) increased oxidation of VOCs due to halogens in which both OH and HO2 increase. Pathway (1) leads to the increase in OH and decrease in HO2 over coastal areas, the Mediterranean Sea, and the Baltic Sea (except the ship tracks). Pathway (2) results in a decrease in OH and HO2 over the remote ocean. Pathways (2), (3), and (4) result in a decrease in OH and an increase or decrease in HO2 along the ship tracks in the Mediterranean Sea.

Figure 3Monthly average OH and HO2 concentration in the BASE simulation and changes due to chlorine (CL) and full halogen chemistry (HAL).
Sarwar et al. (2015) reported a small overall decrease in OH (1 %) and a significant decrease in HO2 (11 %) in the Northern Hemisphere due to bromine and iodine chemistry. Their results suggest a considerable reduction of the HO2∕OH ratio, which is consistent with the present study. Muñiz-Unamunzaga et al. (2018) found a slight increase in diurnal OH (1 %–2 %) and a noticeable decrease in HO2 (4 %), leading to a decrease in HO2∕OH in Los Angeles, California. Sherwen et al. (2017) suggested that OH was reduced across their European domain due to halogen chemistry and concluded that the shift of HO2 to OH by XO could not compensate for the decrease in OH due to the loss of O3. Another GEOS-Chem study, however, predicted an increase in OH over the Mediterranean Sea (Stone et al., 2018). The discrepancy among previous studies and between those works and the present one is difficult to deduce and requires further investigation. Several possible causes could lead to different simulated levels of halogens and their impact on oxidants, including the different mechanisms of producing and recycling halogen species (Sarwar et al., 2019), spatial resolution (Sommariva et al., 2018), emission inventory (Wang et al., 2019), and different spatiotemporal scale of interest (Stone et al., 2018).
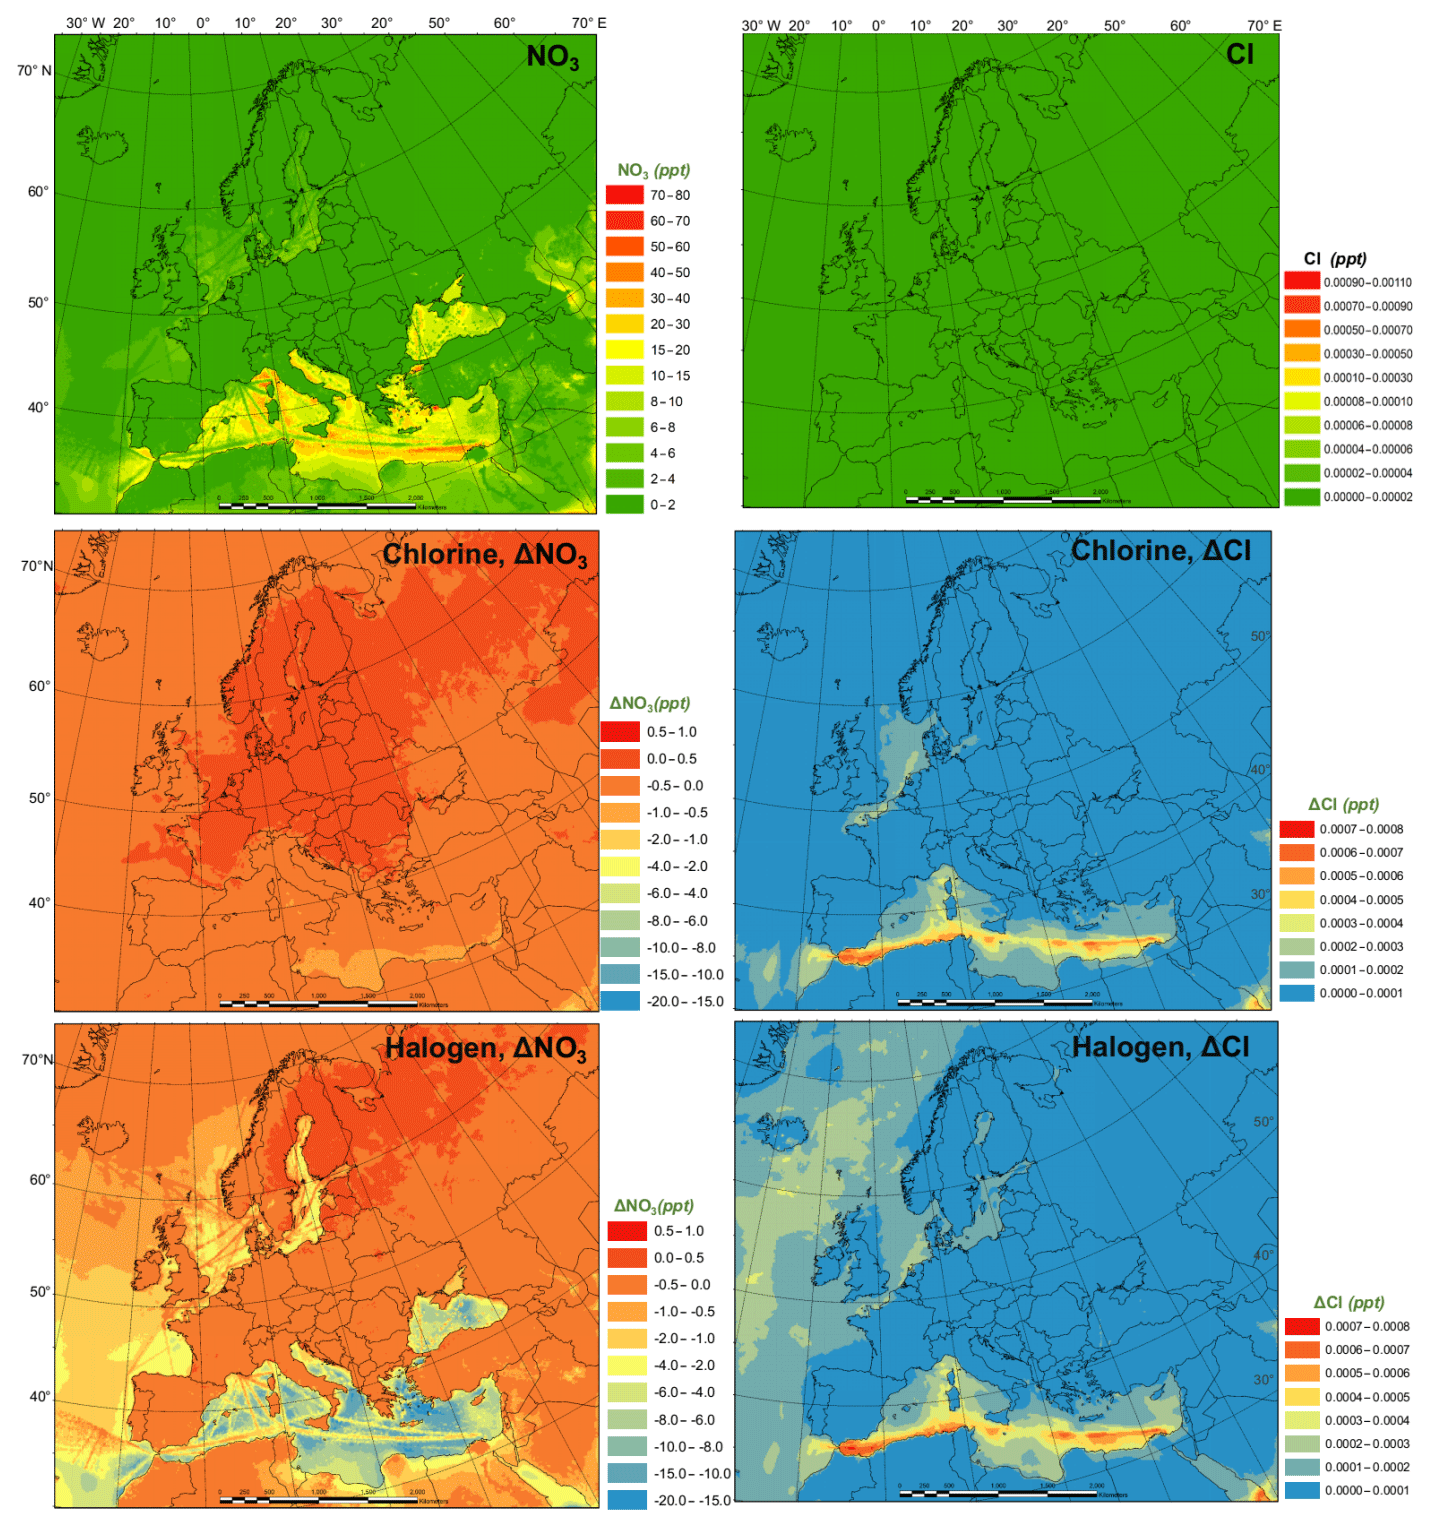
Figure 4Monthly average NO3 and Cl radical concentrations in the BASE simulation and changes induced by chlorine (CL) and full halogen chemistry (HAL).
Figure 4 presents the monthly average prediction of NO3 and Cl radicals in the BASE scenario and the influence of chlorine (CL-BASE) and halogen chemistry (HAL-BASE) on the levels of NO3 and Cl. The BASE simulation predicted relatively high NO3 concentrations over the Mediterranean Sea along the busy shipping tracks. Although concentrations as high as 71 pptv are found, the majority of oceanic regions have concentrations in the range of 10 to 40 pptv and between 0 and 4 pptv over land. The chlorine chemistry slightly increases the NO3 radical due to the increase in O3 (see Sect. 3.4). In contrast, the halogen chemistry considerably reduces NO3 concentrations by as much as 20 pptv in the nighttime over the Mediterranean Sea. Muñiz-Unamunzaga et al. (2018) reported a 20 %–50 % (2 to 4 pptv) decrease in the NO3 radical in Los Angeles, California, when considering the halogen chemistry.
In the BASE simulation, the Cl concentration was negligible because there was no relevant chlorine source incorporated in the CMAQ model. The CL simulation contains the production of ClNO2 and its subsequent photolysis, which increases the Cl concentration to as high as pptv ( atom cm−3). The HAL simulation predicted a very similar magnitude and spatial distribution of chlorine concentration. Sherwen et al. (2017) reported Cl concentrations less than 1.4×10⁴ atom cm−3 ( pptv) over Europe, comparable to our prediction. Hossaini et al. (2016) reported more than 1.0×10⁴ atom cm−3 ( pptv) of chlorine over Asia, Europe, and North America, with a maximum of 8.5×10⁴ atom cm−3 ( pptv), using a global chemical transport model (TOMCAT) that incorporated chlorine sources from sea salt dechlorination, coal and biomass burning, oxidation of natural and anthropogenic chlorocarbon, and heterogeneous reactions on sea salt and sulfate aerosol. In their study, Hossaini et al. (2016) used the Reactive Emission Inventory of Chlorine (Keene et al., 1999), which Wang et al. (2019) reported to be unrealistic for present-day applications.
The current study and previous studies simulated a broad range of surface Cl concentrations, although they were all within the scope of the reported observed (observation-based calculation) values of 103 to 105 atom cm−3 ( to pptv) according to the review of Saiz-Lopez and von Glasow (2012). In light of the considerable variation of observed and model-predicted Cl levels, further study may be needed to comprehensively evaluate the significant role of Cl in the troposphere.

Figure 5Monthly average of daily maximum concentrations of OH and HO2 in the BASE simulation and changes due to chlorine (CL) and full halogen chemistry (HAL).
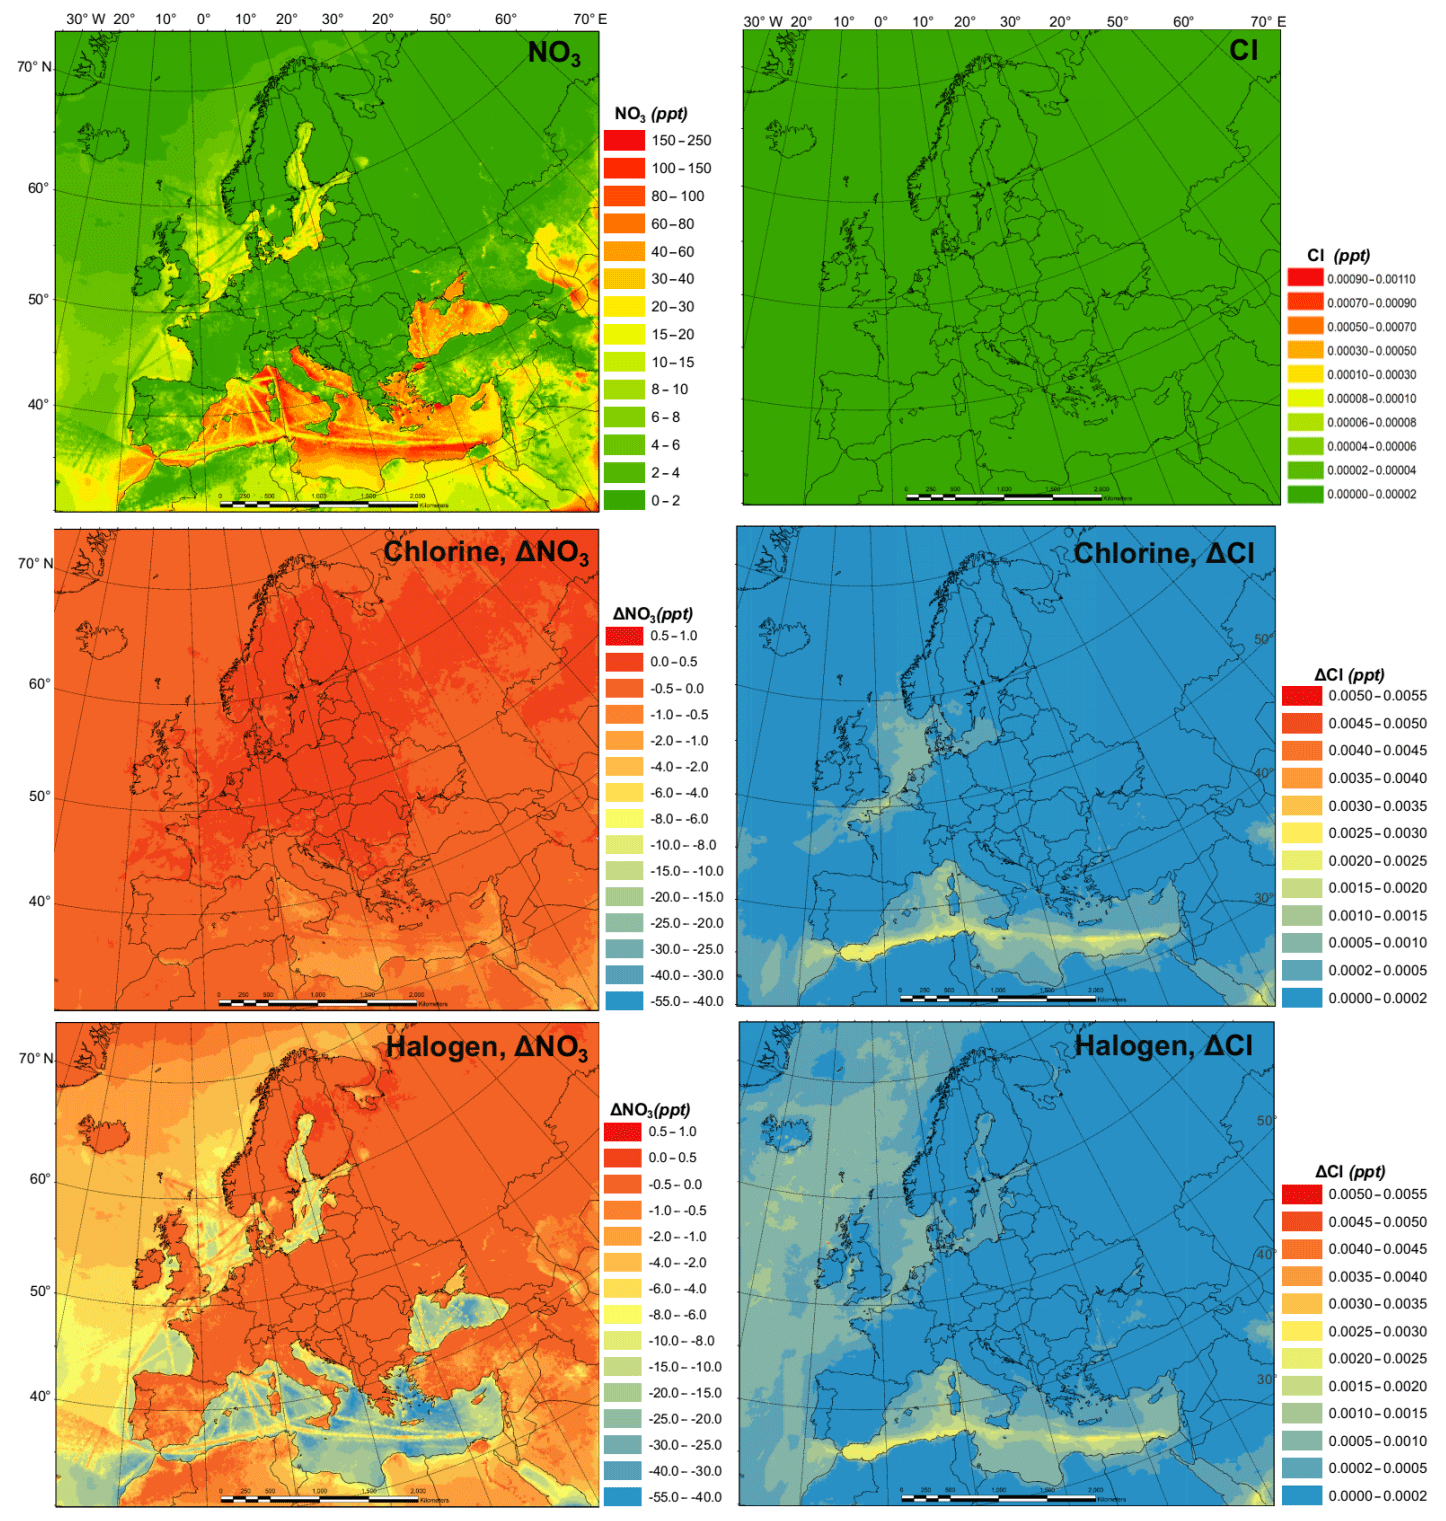
Figure 6Monthly average of daily maximum concentrations of NO3 and the Cl radical in the BASE simulation and changes induced by chlorine (CL) and full halogen chemistry (HAL).
Figures 5 and 6 demonstrate the monthly average of the daily maximum concentrations of OH, HO2, NO3, and Cl in the BASE simulation and also the impact of chlorine (CL-BASE) and the halogen chemistry (HAL-BASE). The maximum values of OH, HO2, and Cl were predicted during the daytime, but they peak at different hours with Cl in the early morning and OH and HO2 later in the day, while the highest levels of the NO3 radical were simulated during nighttime.
The monthly averages of the daily maxima of OH, HO2, NO3, and Cl (Figs. 5 and 6) have similar spatial patterns and higher concentrations (or changes in concentration) compared to those of the monthly averages (Figs. 3 and 4). The monthly average of the daily maximum OH (HO2 and NO3) radical is 3.7 (2.5 and 3.4) times the monthly average OH (HO2 and NO3) concentration in the BASE simulations, while both the monthly average of the daily maximum and monthly average Cl show negligible values. The monthly average of daily maximum changes in the OH (HO2) concentration due to the chlorine and halogen chemistry has a magnitude of −0.10 to 0.09 pptv (−4.0 to 0.8 pptv), which is wider than (the same as) that of the monthly averages, i.e., −0.020 to 0.03 pptv (−4.0 to 0.8 pptv). For the NO3 (Cl) radicals, the magnitude of changes in the monthly average is −20 to 1.0 pptv (0.0 to 0.0008 pptv), while that in the monthly average of daily maximums is −55 to 1.0 pptv (0.0 to 0.0055 pptv).
We also examine the diurnal variations of the four radicals in the BASE and HAL scenarios (Figs. S3 and S4). Halogens have a small effect on the diurnal pattern of OH. HO2 is reduced by halogens, especially in the midday. The NO3 radical is strongly decreased throughout the night after the addition of halogens. The Cl atom is released by the halogen chemistry in the early morning. The significant effects of halogen chemistry on the diurnal variation of OH, HO2, NO3, and Cl radicals highlight the role of halogen chemistry in regulating the atmospheric oxidation capacity throughout the day, with the highest effect on Cl in the early morning, maximum effects on OH and HO2 in daytime, and the largest effect on NO3 at night.
3.4 Impact of halogen chemistry on regulated gaseous air pollutants
The monthly average modeled NO2 and O3, two major gaseous air pollutants in Europe, and the effect of chlorine and halogen chemistry on the two regulated gaseous species are shown in Fig. 7. The BASE simulation produced many hot spots of NO2 over Europe in the vicinity of major cities and ship trajectories. The chlorine chemistry slightly increases the level of NO2 (by up to 0.038 ppbv) in the majority of the domain since (1) the production and the subsequent photolysis of ClNO2 recycles the NOx and extends its lifetime, which increases both NO2 and NO (Figs. 7 and S5), and (2) the increased O3 level (Fig. 7) enhances the transformation of NO to NO2, which increases NO2 and decreases NO (Figs. 7 and S2). Some grid cells show a decrease in NO2 (as much as 0.09 ppbv) because the enhanced oxidative capacity (Sect. 3.3) promotes the cleansing of NO2 via OH, forming HNO3. The full halogen chemistry enhances NO2 (up to 0.20 ppbv) over the North Sea and the Mediterranean Sea and decreases NO2 (by as much as 1.7 ppbv) in the most polluted hot spots. The increase in NO2 occurs through the reactions of XO with NO. Meanwhile, in the most polluted regions, the NO–NO2 balance is predominantly controlled by the reactions of NO with HO2 and O3. With the decrease in HO2 and O3 due to the halogen chemistry, the transformation of NO to NO2 is reduced, which leads to decreasing NO2 and increasing NO.
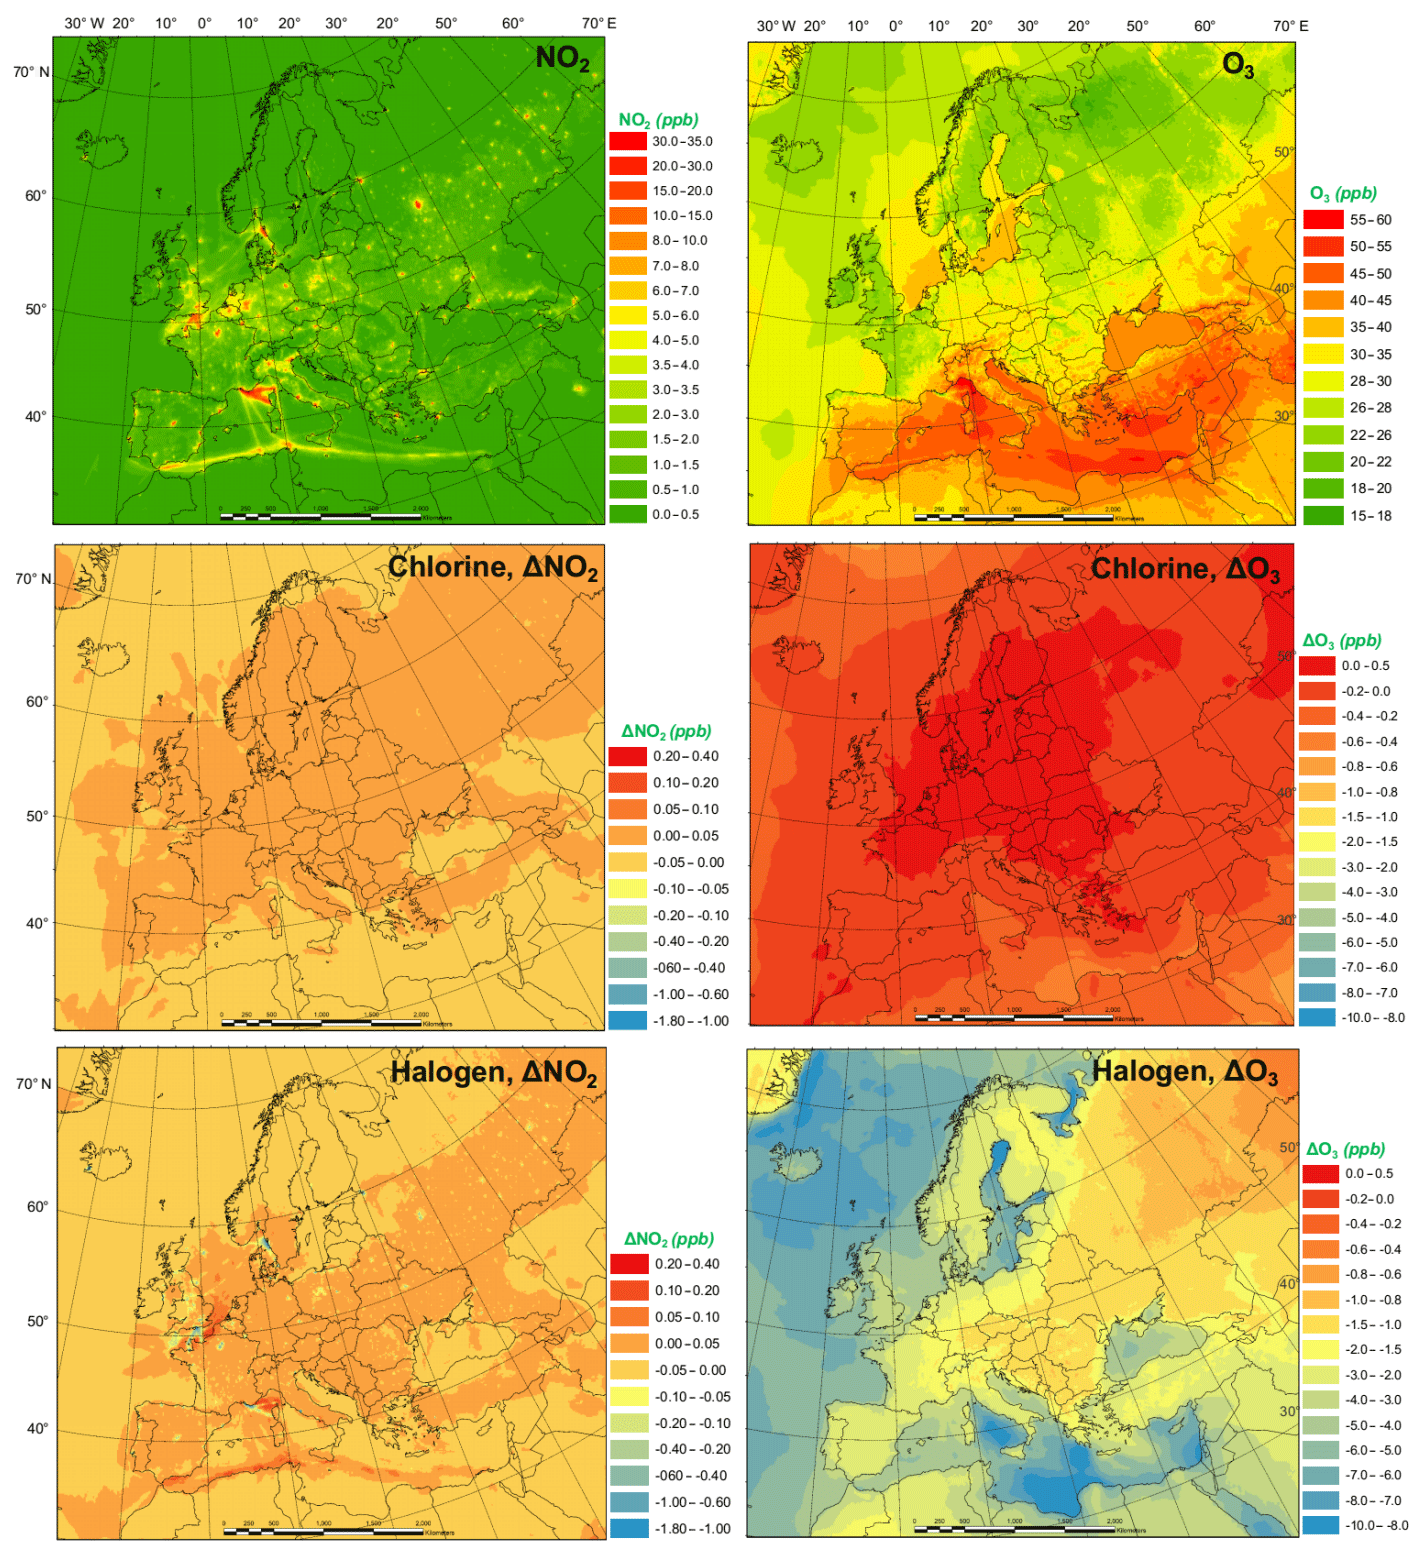
Figure 7Monthly average NO2 and O3 concentration in the BASE simulation and changes induced by chlorine (CL) and full halogen chemistry (HAL).
The monthly average O3 concentration over Europe from the BASE simulation was relatively high (up to 57 ppbv), especially over southern Europe where higher temperatures and more intensive radiation promote the formation of this secondary pollutant. Chlorine chemistry increases O3 levels over the land of Europe with a maximum increment of 0.22 ppbv and decreases O3 over the oceanic area by as much as 0.76 ppbv. The full halogen chemistry decreases O3 throughout the domain, with a maximum reduction of 10 ppbv. On average, the halogen chemistry reduces the O3 concentration by more than 3.0 ppbv in coastal Europe and by over 2.0 ppbv over western and central Europe (nearly 1000 km from the ocean). Our model simulation highlights the fact that halogen chemistry has a large impact on O3 concentrations over oceanic areas and a moderate impact on O3 over coastal and continental regions of Europe.
Muñiz-Unamunzaga et al. (2018) reported a decrease of −2.0 ppbv O3 in the inland areas of the western US (several hundred kilometers from the ocean) and a reduction of 2.5 to 5.0 ppbv O3 in the coastal regions due to the full halogen chemistry. Sarwar et al. (2015) suggested that the inclusion of halogen processes reduced O3 concentrations by 2.0 to 4.0 ppbv over most of the terrestrial regions in the Northern Hemisphere and over 6.0 ppbv in some coastal areas. Sherwen et al. (2017) used a revised version of GEOS-Chem (Sherwen et al., 2016) with halogen chemistry to show substantial reductions in O3 over Europe, with an average reduction of 13.5 ppbv in the domain and a maximum of 28.9 ppbv in some locations.
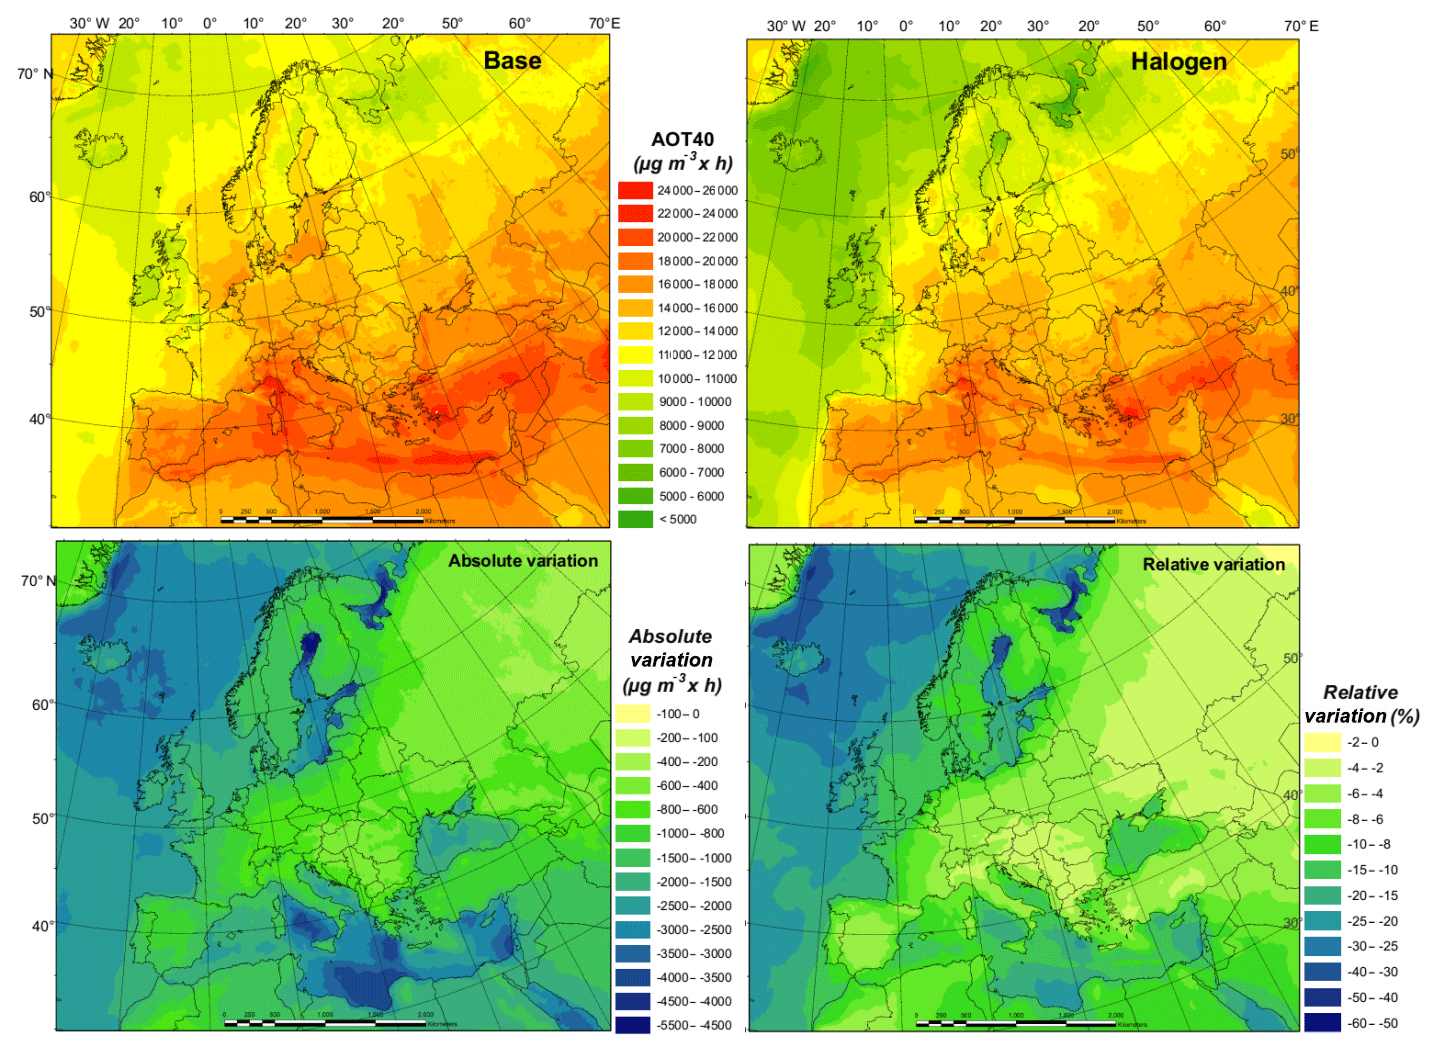
Figure 8AOT40 for July in the BASE and HAL simulations and absolute and relative changes between the two simulations.
3.5 Implications for policy assessment
The current air quality management in Europe has two main objectives: (1) to protect human health and (2) to protect the environment. While many plans and measures have prioritized particulate matter (PM) or NO2, policies to reduce O3 concentrations are still needed (EEA, 2018a). The World Health Organization (WHO) Air Quality Guidelines value for O3 (maximum daily 8 h mean of 100 µg m−3) was exceeded in 96 % of all the reporting stations in Europe, although this is especially true for areas near the Mediterranean Sea. According to the European Environment Agency's latest report, 12 % of the EU-28 urban population is exposed to O3 concentrations above the European Union target value threshold (a maximum daily 8 h mean of 120 µg m−3 is not to be exceeded on more than 25 d yr−1, as set out by the Directive 2008/50/EC) in 2016. Apart from significant potential health effects (Jerrett et al., 2009; Malley et al., 2017), O3 is also known to have a negative impact on vegetation (Mills et al., 2011). The target value for the protection of vegetation (18 000 accumulated over May to July), based on the AOT40 index (Accumulated Ozone exposure over a Threshold of 40 ppbv), was exceeded for about 31 % of all agricultural land in all European countries. The critical level for this pollutant (10 000 accumulated over April to September) was exceeded in 60 % of the total forest area of the continent in 2016 (EEA, 2018a).
Since our experiment covers only 1 month, it is not possible to assess the impact of halogen chemistry on these two indexes. Nonetheless, we have compared the results of both maximum daily 8 h mean and 1-month AOT40 (over July; Fig. 8) for the BASE and HAL simulations. The relative variation provides a good indication of the potential impact of considering halogens in our modeling system in the estimation of legally relevant indexes.
We find that halogen chemistry strongly affects the ambient O3 concentration and may need to be considered in the formulation of plans and strategies for O3 non-attainment areas. We see differences between BASE and HAL simulations (over land in July 2016) as high as 12 % and 36 % for the number of days with daily maximum 8 h O3 over 120 µg m−3 and the monthly average daily maximum 8 h O3 level, respectively (Figs. S6 and S7). Furthermore, we notice strong regional differences, mainly between coastal and inland areas. The considerable effect of halogen chemistry on air quality implies the need to improve the robustness and accuracy of modeling tools to design customized policies to control O3.
In Sect. 3.3 and 3.4, we have also discussed the effect of halogen chemistry on the partitioning of OH∕HO2 and NO∕NO2. The budgets of HOx and NOx are key parameters to accurately simulate the formation of O3 and its response to the reduction of precursors, namely NOx and VOCs (e.g., Li et al., 2018). Air quality models are predominantly used to formulate air pollution control policy by examining the responses of O3 levels to various reduction rates of NOx and/or VOCs. The models that do not include the comprehensive halogen chemistry can potentially lead to different O3 concentration responses to NOx and/or VOC emission changes in Europe.
This study also demonstrates that chlorine chemistry affects the formation of O3. The current policy is only designed to control the long-lived chlorinated species (Hossaini et al., 2015) but not reactive chlorine species, e.g., HCl, chloride, and short-lived chlorocarbons, from coal burning, biomass burning, and industrial activities. The coal-fired power plants in the EU (EEA, 2018b; Kuklinska et al., 2015) can potentially provide chlorine sources, making the implications of halogen chemistry even more relevant.
We applied the CMAQ model with comprehensive halogen chemistry (Cl, Br, and I) to conduct high-resolution simulations for examining the impact of halogen chemistry on air quality over Europe.
The comparison of model results with observations from over 400 monitoring sites indicates that the CMAQ model is capable of reproducing the concentrations and temporal variations of air pollutants over Europe and can be employed to study the impact of halogen chemistry in Europe. The comparison of predicted halogen species concentrations with measurements suggests that the CMAQ model is able to predict observed levels of chlorine and iodine species, although it underestimates bromine species.
Chlorine chemistry enhances the atmospheric oxidation capacity by significantly increasing the level of the Cl radical and affects the levels of OH, HO2, NO3, O3, and NO2. The combined halogen chemistry marginally increases the level of OH and reduces HO2, NO3, and O3. The impact of halogen chemistry on the ambient concentration of NO2 is smaller but non-negligible.
Halogen chemistry significantly influences the atmospheric oxidation capacity throughout the day by imposing the highest effect on Cl in the early morning, maximum effects on OH and HO2 in daytime, and the largest effect on NO3 at night. Halogen chemistry can have a strong influence on atmospheric composition over oceanic and coastal regions but also some noticeable impacts over continental Europe. This study highlights the potential benefit of incorporating halogen chemistry into air quality models for policy development.
Although the incorporation of the halogen chemistry may improve the capabilities of 3-D Eulerian chemical transport models, we acknowledge that large uncertainties still exist in the assessment of the halogen chemistry impact due to emission inventories (e.g., chlorine emission inventory; Wang et al., 2019), model configurations (e.g., grid size; Sommariva et al., 2018), and chemical mechanisms (e.g., photolysis rate of iodine oxides, recycling rate of halogen species on aerosol; Simpson et al., 2015). Further field, laboratory, and theoretical studies are needed to constrain modeling studies for evaluating the impacts of halogen chemistry on air quality and for assessing air quality policy implications.
The data used and demonstrated in this study are available upon the request to the corresponding author.
The supplement related to this article is available online at: https://doi.org/10.5194/acp-19-15321-2019-supplement.
ASL designed the research. GS and BG conducted the CMAQ modeling. RB, DP, JD, GS, BG, QL, and ASL analyzed the results. QL, RB, GS, and ASL wrote the paper with contributions from all authors.
The authors declare that they have no conflict of interest.
The views expressed in this paper are those of the authors and do not necessarily represent the views or policies of the U.S. EPA.
This research has been supported by the European Commission, H2020 Research Infrastructures (CLIMAHAL (grant no. 726349)).
This paper was edited by Michel Van Roozendael and reviewed by three anonymous referees.
Allan, B. J., McFiggans, G., Plane, J. M. C., and Coe, H.: Observations of iodine monoxide in the remote marine boundary layer, J. Geophys. Res., 105, 14363–14369, https://doi.org/10.1029/1999JD901188, 2000.
Appel, K. W., Chemel, C., Roselle, S. J., Francis, X. V, Hu, R.-M., Sokhi, R. S., Rao, S. T., and Galmarini, S.: Examination of the Community Multiscale Air Quality (CMAQ) model performance over the North American and European domains, Atmos. Environ., 53, 142–155, https://doi.org/10.1016/j.atmosenv.2011.11.016, 2012.
Appel, K. W., Pouliot, G. A., Simon, H., Sarwar, G., Pye, H. O. T., Napelenok, S. L., Akhtar, F., and Roselle, S. J.: Evaluation of dust and trace metal estimates from the Community Multiscale Air Quality (CMAQ) model version 5.0, Geosci. Model Dev., 6, 883–899, https://doi.org/10.5194/gmd-6-883-2013, 2013.
Appel, K. W., Napelenok, S. L., Foley, K. M., Pye, H. O. T., Hogrefe, C., Luecken, D. J., Bash, J. O., Roselle, S. J., Pleim, J. E., Foroutan, H., Hutzell, W. T., Pouliot, G. A., Sarwar, G., Fahey, K. M., Gantt, B., Gilliam, R. C., Heath, N. K., Kang, D., Mathur, R., Schwede, D. B., Spero, T. L., Wong, D. C., and Young, J. O.: Description and evaluation of the Community Multiscale Air Quality (CMAQ) modeling system version 5.1, Geosci. Model Dev., 10, 1703–1732, https://doi.org/10.5194/gmd-10-1703-2017, 2017.
Bannan, T. J., Murray Booth, A., Bacak, A., Muller, J. B. A., Leather, K. E., Le Breton, M., Jones, B., Young, D., Coe, H., Allan, J., Visser, S., Slowik, J. G., Furger, M., Prévôt, A. S. H., Lee, J., Dunmore, R. E., Hopkins, J. R., Hamilton, J. F., Lewis, A. C., Whalley, L. K., Sharp, T., Stone, D., Heard, D. E., Fleming, Z. L., Leigh, R., Shallcross, D. E., and Percival, C. J.: The first UK measurements of nitryl chloride using a chemical ionization mass spectrometer in central London in the summer of 2012, and an investigation of the role of Cl atom oxidation, J. Geophys. Res., 120, 5638–5657, https://doi.org/10.1002/2014JD022629, 2015.
Bannan, T. J., Bacak, A., Le Breton, M., Flynn, M., Ouyang, B., McLeod, M., Jones, R., Malkin, T. L., Whalley, L. K., Heard, D. E., Bandy, B., Khan, M. A. H., Shallcross, D. E., and Percival, C. J.: Ground and airborne UK measurements of nitryl chloride: An investigation of the role of Cl atom oxidation at Weybourne Atmospheric Observatory, J. Geophys. Res.-Atmos., 122, 11154–11165, https://doi.org/10.1002/2017JD026624, 2017
Bitter, M., Ball, S. M., Povey, I. M., and Jones, R. L.: A broadband cavity ringdown spectrometer for in-situ measurements of atmospheric trace gases, Atmos. Chem. Phys., 5, 2547–2560, https://doi.org/10.5194/acp-5-2547-2005, 2005.
Borge, R., Alexandrov, V., José del Vas, J., Lumbreras, J., and Rodríguez, E.: A comprehensive sensitivity analysis of the WRF model for air quality applications over the Iberian Peninsula, Atmos. Environ., 42, 8560–8574, https://doi.org/10.1016/j.atmosenv.2008.08.032, 2008a.
Borge, R., Lumbreras, J., and Rodríguez, E.: Development of a high-resolution emission inventory for Spain using the SMOKE modelling system: A case study for the years 2000 and 2010, Environ. Model. Softw., 23, 1026–1044, https://doi.org/10.1016/j.envsoft.2007.11.002, 2008b.
Byun, D. and Schere, K. L.: Review of the Governing Equations, Computational Algorithms, and Other Components of the Models-3 Community Multiscale Air Quality (CMAQ) Modeling System, Appl. Mech. Rev., 59, 51–77, https://doi.org/10.1115/1.2128636, 2006.
Byun, D. W. and Ching, J. K. S.: Science Algorithms of the EPA MODELS-3 Community Multiscale Air Quality (CMAQ) Modelling System. U.S. Environmental Protection Agency, Washington, D.C., EPA/600/R-99/030 (NTIS PB2000-100561), 1999.
Commane, R., Seitz, K., Bale, C. S. E., Bloss, W. J., Buxmann, J., Ingham, T., Platt, U., Pöhler, D., and Heard, D. E.: Iodine monoxide at a clean marine coastal site: observations of high frequency variations and inhomogeneous distributions, Atmos. Chem. Phys., 11, 6721–6733, https://doi.org/10.5194/acp-11-6721-2011, 2011.
de la Paz, D., Borge, R., and Martilli, A.: Assessment of a high resolution annual WRF-BEP/CMAQ simulation for the urban area of Madrid (Spain), Atmos. Environ., 144, 282–296, https://doi.org/10.1016/j.atmosenv.2016.08.082, 2016.
EEA (European Environmental Agency): Air Quality in Europe – 2018 report, EEA, Luxembourg, 12/2018, 83 pp., https://doi.org/10.2800/777411, 2018a.
EEA (European Environmental Agency): European Union emission inventory report 1990–2016 under the UNECE Convention on Long-range Transboundary Air Pollution (LRTAP), EEA, Luxembourg, 6/2018, 150 pp., https://doi.org/10.2800/571876, 2018b.
Eger, P. G., Friedrich, N., Schuladen, J., Shenolikar, J., Fischer, H., Tadic, I., Harder, H., Martinez, M., Rohloff, R., Tauer, S., Drewnick, F., Fachinger, F., Brooks, J., Darbyshire, E., Sciare, J., Pikridas, M., Lelieveld, J., and Crowley, J. N.: Shipborne measurements of ClNO2 in the Mediterranean Sea and around the Arabian Peninsula during summer, Atmos. Chem. Phys., 19, 12121–12140, https://doi.org/10.5194/acp-19-12121-2019, 2019.
EMEP/CEIP: Present state of emissions as used in EMEP models, available at: http://www.ceip.at/webdab_emepdatabase/emissions_emepmodels (last access: 22 November 2019), 2014.
Farman, J. C., Gardiner, B. G., and Shanklin, J. D.: Large losses of total ozone in Antarctica reveal seasonal ClOx∕NOx interaction, Nature, 315, 207–210, https://doi.org/10.1038/315207a0, 1985.
Fernandez, R. P., Salawitch, R. J., Kinnison, D. E., Lamarque, J.-F., and Saiz-Lopez, A.: Bromine partitioning in the tropical tropopause layer: implications for stratospheric injection, Atmos. Chem. Phys., 14, 13391–13410, https://doi.org/10.5194/acp-14-13391-2014, 2014.
Foley, K. M., Roselle, S. J., Appel, K. W., Bhave, P. V., Pleim, J. E., Otte, T. L., Mathur, R., Sarwar, G., Young, J. O., Gilliam, R. C., Nolte, C. G., Kelly, J. T., Gilliland, A. B., and Bash, J. O.: Incremental testing of the Community Multiscale Air Quality (CMAQ) modeling system version 4.7, Geosci. Model Dev., 3, 205–226, https://doi.org/10.5194/gmd-3-205-2010, 2010.
Furneaux, K. L., Whalley, L. K., Heard, D. E., Atkinson, H. M., Bloss, W. J., Flynn, M. J., Gallagher, M. W., Ingham, T., Kramer, L., Lee, J. D., Leigh, R., McFiggans, G. B., Mahajan, A. S., Monks, P. S., Oetjen, H., Plane, J. M. C., and Whitehead, J. D.: Measurements of iodine monoxide at a semi polluted coastal location, Atmos. Chem. Phys., 10, 3645–3663, https://doi.org/10.5194/acp-10-3645-2010, 2010.
Gantt, B., Sarwar, G., Xing, J., Simon, H., Schwede, D., Hutzell, W. T., Mathur, R., and Saiz-Lopez, A.: The Impact of Iodide-Mediated Ozone Deposition and Halogen Chemistry on Surface Ozone Concentrations Across the Continental United States, Environ. Sci. Technol., 51, 1458–1466, https://doi.org/10.1021/acs.est.6b03556, 2017.
Guenther, A. B., Jiang, X., Heald, C. L., Sakulyanontvittaya, T., Duhl, T., Emmons, L. K., and Wang, X.: The Model of Emissions of Gases and Aerosols from Nature version 2.1 (MEGAN2.1): an extended and updated framework for modeling biogenic emissions, Geosci. Model Dev., 5, 1471–1492, https://doi.org/10.5194/gmd-5-1471-2012, 2012.
Holla, R., Schmitt, S., Frieß, U., Pöhler, D., Zingler, J., Corsmeier, U., and Platt, U.: Vertical distribution of BrO in the boundary layer at the Dead Sea, Environ. Chem., 12, 438–460, https://doi.org/10.1071/EN14224, 2015.
Hossaini, R., Chipperfield, M. P., Saiz-Lopez, A., Harrison, J. J., Von Glasow, R., Sommariva, R., Atlas, E., Navarro, M., Montzka, S. A., Feng, W., Dhomse, S., Harth, C., Mühle, J., Lunder, C., O'Doherty, S., Young, D., Reimann, S., Vollmer, M. K., Krummel, P. B., and Bernath, P. F.: Growth in stratospheric chlorine from short-lived chemicals not controlled by the Montreal Protocol, Geophys. Res. Lett., 42, 4573–4580, https://doi.org/10.1002/2015GL063783, 2015.
Hossaini, R., Chipperfield, M. P., Saiz-Lopez, A., Fernandez, R., Monks, S., Feng, W., Brauer, P., and Von Glasow, R.: A global model of tropospheric chlorine chemistry: Organic versus inorganic sources and impact on methane oxidation, J. Geophys. Res., 121, 14271–14297, https://doi.org/10.1002/2016JD025756, 2016.
Jerrett, M., Burnett, R. T., Pope, C. A., Ito, K., Thurston, G., Krewski, D., Shi, Y., Calle, E., and Thun, M.: Long-Term Ozone Exposure and Mortality, New Engl. J. Med., 360, 1085–1095, https://doi.org/10.1056/NEJMoa0803894, 2009.
Jung, J., Lee, J., Kim, B., and Oh, S.: Seasonal variations in the NO2 artifact from chemiluminescence measurements with a molybdenum converter at a suburban site in Korea (downwind of the Asian continental outflow) during 2015–2016, Atmos. Environ., 165, 290–300, 2017.
Keene, W., Khalil, M. A. K., Erickson, D., McCulloch, A., Graedel, T. E., Lobert, J. M., Aucott, M. L., Gong, S. L., Harper, D. B., Kleiman, G., Midgley, P., Moore, R. M., Seuzaret, C., Sturges, W. T., Benkovitz, C. M., Koropalov, V., Barrie, L. A., and Li, Y. F.: Composite global emissions of reactive chlorine from anthropogenic and natural sources: Reactive Chlorine Emissions Inventory, J. Geophys. Res., 104, 8429–8440, 1999.
Kuklinska, K., Wolska, L., and Namiesnik, J.: Air quality policy in the U.S. and the EU – a review, Atmos. Pollut. Res., 6, 129–137, https://doi.org/10.5094/APR.2015.015, 2015.
Li, Q., Zhang, L., Wang, T., Tham, Y. J., Ahmadov, R., Xue, L., Zhang, Q., and Zheng, J.: Impacts of heterogeneous uptake of dinitrogen pentoxide and chlorine activation on ozone and reactive nitrogen partitioning: improvement and application of the WRF-Chem model in southern China, Atmos. Chem. Phys., 16, 14875–14890, https://doi.org/10.5194/acp-16-14875-2016, 2016.
Li, Q., Zhang, L., Wang, T., Wang, Z., Fu, X., and Zhang, Q.: “New” Reactive Nitrogen Chemistry Reshapes the Relationship of Ozone to Its Precursors, Environ. Sci. Technol., 52, 2810–2818, https://doi.org/10.1021/acs.est.7b05771, 2018.
Mahajan, A. S., Oetjen, H., Lee, J. D., Saiz-Lopez, A., McFiggans, G. B., and Plane, J. M. C.: High bromine oxide concentrations in the semi-polluted boundary layer, Atmos. Environ., 43, 3811–3818, https://doi.org/10.1016/j.atmosenv.2009.05.033, 2009.
Malley, C. S., Henze, D. K., Kuylenstierna, J. C. I., Vallack, H. W., Davila, Y., Anenberg, S. C., Turner, M. C., and Ashmore, M. R.: Updated Global Estimates of Respiratory Mortality in Adults ≥30 Years of Age Attributable to Long-Term Ozone Exposure, Environ. Health Persp., 125, 87021, https://doi.org/10.1289/EHP1390, 2017.
Mathur, R., Xing, J., Gilliam, R., Sarwar, G., Hogrefe, C., Pleim, J., Pouliot, G., Roselle, S., Spero, T. L., Wong, D. C., and Young, J.: Extending the Community Multiscale Air Quality (CMAQ) modeling system to hemispheric scales: overview of process considerations and initial applications, Atmos. Chem. Phys., 17, 12449–12474, https://doi.org/10.5194/acp-17-12449-2017, 2017.
Matveev, V., Peleg, M., Rosen, D., Tov-Alper, D. S., Hebestreit, K., Stutz, J., Platt, U., Blake, D., and Luria, M.: Bromine oxide–ozone interaction over the Dead Sea, J. Geophys. Res., 106, 10375–10387, https://doi.org/10.1029/2000JD900611, 2001.
Mills, G., Pleijel, H., Braun, S., Büker, P., Bermejo, V., Calvo, E., Danielsson, H., Emberson, L., Fernández, I. G., Grünhage, L., Harmens, H., Hayes, F., Karlsson, P.-E., and Simpson, D.: New stomatal flux-based critical levels for ozone effects on vegetation, Atmos. Environ., 45, 5064–5068, https://doi.org/10.1016/j.atmosenv.2011.06.009, 2011.
Molina, M. J. and Rowland, F. S.: Stratospheric sink for chlorofluoromethanes: chlorine atom-catalysed destruction of ozone, Nature, 249, 810–812, https://doi.org/10.1038/249810a0, 1974.
Muñiz-Unamunzaga, M., Borge, R., Sarwar, G., Gantt, B., de la Paz, D., Cuevas, C. A., and Saiz-Lopez, A.: The influence of ocean halogen and sulfur emissions in the air quality of a coastal megacity: The case of Los Angeles, Sci. Total Environ., 610–611, 1536–1545, https://doi.org/10.1016/j.scitotenv.2017.06.098, 2018.
Osthoff, H. D., Roberts, J. M., Ravishankara, A. R., Williams, E. J., Lerner, B. M., Sommariva, R., Bates, T. S., Coffman, D., Quinn, P. K., Dibb, J. E., Stark, H., Burkholder, J. B., Talukdar, R. K., Meagher, J., Fehsenfeld, F. C., and Brown, S. S.: High levels of nitryl chloride in the polluted subtropical marine boundary layer, Nat. Geosci., 1, 324–328, https://doi.org/10.1038/ngeo177, 2008.
Peters, C., Pechtl, S., Stutz, J., Hebestreit, K., Hönninger, G., Heumann, K. G., Schwarz, A., Winterlik, J., and Platt, U.: Reactive and organic halogen species in three different European coastal environments, Atmos. Chem. Phys., 5, 3357–3375, https://doi.org/10.5194/acp-5-3357-2005, 2005.
Phillips, G. J., Tang, M. J., Thieser, J., Brickwedde, B., Schuster, G., Bohn, B., Lelieveld, J., and Crowley, J. N.: Significant concentrations of nitryl chloride observed in rural continental Europe associated with the influence of sea salt chloride and anthropogenic emissions, Geophys. Res. Lett., 39, L10811, https://doi.org/10.1029/2012GL051912, 2012.
Prados-Roman, C., Cuevas, C. A., Hay, T., Fernandez, R. P., Mahajan, A. S., Royer, S.-J., Galí, M., Simó, R., Dachs, J., Großmann, K., Kinnison, D. E., Lamarque, J.-F., and Saiz-Lopez, A.: Iodine oxide in the global marine boundary layer, Atmos. Chem. Phys., 15, 583–593, https://doi.org/10.5194/acp-15-583-2015, 2015.
Saiz-Lopez, A. and von Glasow, R.: Reactive halogen chemistry in the troposphere, Chem. Soc. Rev., 41, 6448–6472, https://doi.org/10.1039/c2cs35208g, 2012.
Saiz-Lopez, A., Plane, J. M. C., and Shillito, J. A.: Bromine oxide in the mid-latitude marine boundary layer, Geophys. Res. Lett., 31, L03111, https://doi.org/10.1029/2003GL018956, 2004.
Saiz-Lopez, A., Fernandez, R. P., Ordóñez, C., Kinnison, D. E., Gómez Martín, J. C., Lamarque, J.-F., and Tilmes, S.: Iodine chemistry in the troposphere and its effect on ozone, Atmos. Chem. Phys., 14, 13119–13143, https://doi.org/10.5194/acp-14-13119-2014, 2014.
Sarwar, G., Simon, H., Bhave, P., and Yarwood, G.: Examining the impact of heterogeneous nitryl chloride production on air quality across the United States, Atmos. Chem. Phys., 12, 6455–6473, https://doi.org/10.5194/acp-12-6455-2012, 2012.
Sarwar, G., Simon, H., Xing, J., and Mathur, R.: Importance of tropospheric ClNO2 chemistry across the Northern Hemisphere, Geophys. Res. Lett., 41, 4050–4058, https://doi.org/10.1002/2014GL059962, 2014.
Sarwar, G., Gantt, B., Schwede, D., Foley, K., Mathur, R., and Saiz-Lopez, A.: Impact of Enhanced Ozone Deposition and Halogen Chemistry on Tropospheric Ozone over the Northern Hemisphere, Environ. Sci. Technol., 49, 9203–9211, https://doi.org/10.1021/acs.est.5b01657, 2015.
Sarwar, G., Gantt, B., Foley, K., Fahey, K., Spero T. L., Kang, D., Mathur, R., Hosein F., Xing, J., Sherwen, T., and Saiz-Lopez, A.: Influence of bromine and iodine chemistry on annual, seasonal, diurnal, and background ozone: CMAQ simulations over the Northern Hemisphere, Atmos. Environ., 213, 395–404, 2019.
Sherwen, T., Schmidt, J. A., Evans, M. J., Carpenter, L. J., Großmann, K., Eastham, S. D., Jacob, D. J., Dix, B., Koenig, T. K., Sinreich, R., Ortega, I., Volkamer, R., Saiz-Lopez, A., Prados-Roman, C., Mahajan, A. S., and Ordóñez, C.: Global impacts of tropospheric halogens (Cl, Br, I) on oxidants and composition in GEOS-Chem, Atmos. Chem. Phys., 16, 12239–12271, https://doi.org/10.5194/acp-16-12239-2016, 2016.
Sherwen, T., Evans, M. J., Sommariva, R., Hollis, L. D. J., Ball, S. M., Monks, P. S., Reed, C., Carpenter, L. J., Lee, J. D., Forster, G., Bandy, B., Reeves, C. E., and Bloss, W. J.: Effects of halogens on European air-quality, Faraday Discuss., 200, 75–100, https://doi.org/10.1039/c7fd00026j, 2017.
Sillman, S.: The relation between ozone, NOx and hydrocarbons in urban and polluted rural environments, Atmos. Environ., 33, 1821–1845, https://doi.org/10.1016/S1352-2310(98)00345-8, 1999.
Simpson, W. R., Brown, S. S., Saiz-Lopez, A., Thornton, J. A., and Von Glasow, R.: Tropospheric Halogen Chemistry: Sources, Cycling, and Impacts, Chem. Rev., 115, 4035–4062, https://doi.org/10.1021/cr5006638, 2015.
Skamarock, W. C. and Klemp, J. B.: A time-split nonhydrostatic atmospheric model for weather research and forecasting applications, J. Comput. Phys., 227, 3465–3485, https://doi.org/10.1016/j.jcp.2007.01.037, 2008.
Solazzo, E., Hogrefe, C., Colette, A., Garcia-Vivanco, M., and Galmarini, S.: Advanced error diagnostics of the CMAQ and Chimere modelling systems within the AQMEII3 model evaluation framework, Atmos. Chem. Phys., 17, 10435–10465, https://doi.org/10.5194/acp-17-10435-2017, 2017.
Sommariva, R., Hollis, L. D. J., Sherwen, T., Baker, A. R., Ball, S. M., Bandy, B. J., Bell, T. G., Chowdhury, M. N., Cordell, R. L., Evans, M. J., Lee, J. D., Reed, C., Reeves, C. E., Roberts, J. M., Yang, M., and Monks, P. S.: Seasonal and geographical variability of nitryl chloride and its precursors in Northern Europe, Atmos. Sci. Lett., 19, e844, https://doi.org/10.1002/asl.844, 2018.
Stone, D., Sherwen, T., Evans, M. J., Vaughan, S., Ingham, T., Whalley, L. K., Edwards, P. M., Read, K. A., Lee, J. D., Moller, S. J., Carpenter, L. J., Lewis, A. C., and Heard, D. E.: Impacts of bromine and iodine chemistry on tropospheric OH and HO2: comparing observations with box and global model perspectives, Atmos. Chem. Phys., 18, 3541–3561, https://doi.org/10.5194/acp-18-3541-2018, 2018.
Tas, E., Peleg, M., Pedersen, D. U., Matveev, V., Pour Biazar, A., and Luria, M.: Measurement-based modeling of bromine chemistry in the boundary layer: 1. Bromine chemistry at the Dead Sea, Atmos. Chem. Phys., 6, 5589–5604, https://doi.org/10.5194/acp-6-5589-2006, 2006.
Tham, Y. J., Wang, Z., Li, Q., Yun, H., Wang, W., Wang, X., Xue, L., Lu, K., Ma, N., Bohn, B., Li, X., Kecorius, S., Größ, J., Shao, M., Wiedensohler, A., Zhang, Y., and Wang, T.: Significant concentrations of nitryl chloride sustained in the morning: investigations of the causes and impacts on ozone production in a polluted region of northern China, Atmos. Chem. Phys., 16, 14959–14977, https://doi.org/10.5194/acp-16-14959-2016, 2016.
Thornton, J. A., Kercher, J. P., Riedel, T. P., Wagner, N. L., Cozic, J., Holloway, J. S., Dubé, W. P., Wolfe, G. M., Quinn, P. K., Middlebrook, A. M., Alexander, B., and Brown, S. S.: A large atomic chlorine source inferred from mid-continental reactive nitrogen chemistry, Nature, 464, 271–274, https://doi.org/10.1038/nature08905, 2010.
UNC (University of North Carolina at Chapel Hill): SMOKE v3.6.5 User's Manual, Institute for the Environment, available at: https://www.cmascenter.org/smoke/documentation/3.6.5/html (last access: 22 November 2019), 2015.
US EPA Office of Research and Development (ORD): CMAQ (Version 5.2), Zenodo, https://doi.org/10.5281/zenodo.1167892, 30 June 2017.
van Loon, M., Vautard, R., Schaap, M., Bergström, R., Bessagnet, B., Brandt, J., Builtjes, P. J. H., Christensen, J. H., Cuvelier, C., Graff, A., Jonson, J. E., Krol, M., Langner, J., Roberts, P., Rouil, L., Stern, R., Tarrasón, L., Thunis, P., Vignati, E., White, L., and Wind, P.: Evaluation of long-term ozone simulations from seven regional air quality models and their ensemble, Atmos. Environ., 41, 2083–2097, https://doi.org/10.1016/j.atmosenv.2006.10.073, 2007.
Wang, T., Tham, Y. J., Xue, L., Li, Q., Zha, Q., Wang, Z., Poon, S. C. N., Dubé, W. P., Blake, D. R., Louie, P. K. K., Luk, C. W. Y., Tsui, W., and Brown, S. S.: Observations of nitryl chloride and modeling its source and effect on ozone in the planetary boundary layer of southern China, J. Geophys. Res.-Atmos., 121, 2476–2489, https://doi.org/10.1002/2015JD024556, 2016.
Wang, X., Jacob, D. J., Eastham, S. D., Sulprizio, M. P., Zhu, L., Chen, Q., Alexander, B., Sherwen, T., Evans, M. J., Lee, B. H., Haskins, J. D., Lopez-Hilfiker, F. D., Thornton, J. A., Huey, G. L., and Liao, H.: The role of chlorine in global tropospheric chemistry, Atmos. Chem. Phys., 19, 3981–4003, https://doi.org/10.5194/acp-19-3981-2019, 2019.