the Creative Commons Attribution 4.0 License.
the Creative Commons Attribution 4.0 License.
 | 13 Dec 2019
Ice-nucleating particle versus ice crystal number concentrationin altocumulus and cirrus layers embedded in Saharan dust:a closure study
Rodanthi-Elisavet Mamouri
Johannes Bühl
Patric Seifert
Ronny Engelmann
Julian Hofer
Argyro Nisantzi
James D. Atkinson
Zamin A. Kanji
Berko Sierau
Mihalis Vrekoussis
Jean Sciare
For the first time, a closure study of the relationship between the ice-nucleating particle concentration (INP; INPC) and ice crystal number concentration (ICNC) in altocumulus and cirrus layers, solely based on ground-based active remote sensing, is presented. Such aerosol–cloud closure experiments are required (a) to better understand aerosol–cloud interaction in the case of mixed-phase clouds, (b) to explore to what extent heterogeneous ice nucleation can contribute to cirrus formation, which is usually controlled by homogeneous freezing, and (c) to check the usefulness of available INPC parameterization schemes, applied to lidar profiles of aerosol optical and microphysical properties up to the tropopause level. The INPC–ICNC closure studies were conducted in Cyprus (Limassol and Nicosia) during a 6-week field campaign in March–April 2015 and during the 17-month CyCARE (Cyprus Clouds Aerosol and Rain Experiment) campaign. The focus was on altocumulus and cirrus layers which developed in pronounced Saharan dust layers at heights from 5 to 11 km. As a highlight, a long-lasting cirrus event was studied which was linked to the development of a very strong dust-infused baroclinic storm (DIBS) over Algeria. The DIBS was associated with strong convective cloud development and lifted large amounts of Saharan dust into the upper troposphere, where the dust influenced the evolution of an unusually large anvil cirrus shield and the subsequent transformation into an cirrus uncinus cloud system extending from the eastern Mediterranean to central Asia, and thus over more than 3500 km. Cloud top temperatures of the three discussed closure study cases ranged from −20 to −57 ∘C. The INPC was estimated from polarization/Raman lidar observations in combination with published INPC parameterization schemes, whereas the ICNC was retrieved from combined Doppler lidar, aerosol lidar, and cloud radar observations of the terminal velocity of falling ice crystals, radar reflectivity, and lidar backscatter in combination with the modeling of backscattering at the 532 and 8.5 mm wavelengths. A good-to-acceptable agreement between INPC (observed before and after the occurrence of the cloud layer under investigation) and ICNC values was found in the discussed three proof-of-concept closure experiments. In these case studies, INPC and ICNC values matched within an order of magnitude (i.e., within the uncertainty ranges of the INPC and ICNC estimates), and they ranged from 0.1 to 10 L−1 in the altocumulus layers and 1 to 50 L−1 in the cirrus layers observed between 8 and 11 km height. The successful closure experiments corroborate the important role of heterogeneous ice nucleation in atmospheric ice formation processes when mineral dust is present. The observed long-lasting cirrus event could be fully explained by the presence of dust, i.e., without the need for homogeneous ice nucleation processes.
- Article
(25318 KB) - Full-text XML
- Companion paper
- BibTeX
- EndNote


Heterogeneous ice formation is an important pathway of aerosol–cloud interaction. Via heterogeneous freezing and nucleation mechanisms, solid aerosol particles trigger the nucleation of ice crystals at relatively high temperatures from 0 to about −35 ∘C. At these temperatures, ice formation (and the formation of mixed-phase clouds) is not possible without the assistance of ice-nucleating particles (INPs) (Pruppacher and Klett, 1997; Kärcher and Seifert, 2016). Even at lower temperatures (−40 to −65 ∘C), at which homogeneous freezing usually dominates, heterogeneous ice nucleation on dust and soot particles can have a strong impact at relative humidities (RHs) of ice with an RHi of <140 %–150 % on the evolution and lifetime of tropospheric clouds. Because the occurrence of the ice phase is an important prerequisite to initiate the formation of precipitation (almost everywhere around the globe) (Mülmenstädt et al., 2015), aerosol particles, when acting as INPs, can have a sensitive impact on the vertical distribution of water vapor and cloud water and thus on the tropospheric water cycle.
Heterogeneous ice nucleation is however not well understood due to the complexity of the ice-nucleating efficiency of atmospheric aerosol mixtures depending on their specific chemical and microphysical properties (Hoose and Möhler, 2012; Murray et al., 2012; Kanji et al., 2017) and the complex influences of ambient temperature, humidity, air motion (updrafts, downdrafts, turbulence, and entrainment), and associated ice supersaturation conditions on the nucleation of ice crystals (Lohmann et al., 2016). In cirrus layers, the competition between heterogeneous and homogeneous ice nucleation further complicates the effort to improve our knowledge about the role of aerosols in ice formation processes in the climate system (Kärcher et al., 2014; Kärcher, 2017; Kuebbeler et al., 2014; Jensen et al., 2016). As a consequence, aerosol–cloud interaction remains an important source of large uncertainty in weather and climate predictions.
Despite the gaps in our knowledge about heterogeneous freezing, tremendous progress has been made in the field of mixed-phase and ice cloud research. Numerous aerosol types and components have been characterized in the laboratory and field campaigns regarding their ice-nucleating potential (see the review of Kanji et al., 2017). Recent field activities with a focus on ice-nucleating particle concentration (INPC) were reported by Schrod et al. (2017), Welti et al. (2018), McCluskey et al. (2017, 2018a, b), Price et al. (2018), and Wex et al. (2019). More than 30 years of airborne observations in mixed-phase and cirrus clouds have improved our understanding of ice formation processes and have provided a wealth of information on the microphysical properties of ice clouds (see the review articles of Heymsfield et al., 2017, Field et al., 2017, and Korolev et al., 2017). Prenni et al. (2009) and Eidhammer et al. (2010) were, to our knowledge, the first who successfully performed closure studies on the relationship between the INPC and ice crystal number concentration (ICNC), based on airborne in situ observations. Such closure studies (see definition in Sect. 2) are one of the most direct and powerful efforts to investigate the aerosol impact on the development of the ice phase in clouds. Costa et al. (2017) also made an attempt to combine aerosol and ice crystal information gained from airborne in situ observations to characterize the link between INPC and ICNC and thus the potential impact of heterogeneous ice formation on cirrus evolution.
However, it remains difficult to obtain a clear picture of the influence of aerosols on the life cycle of ice-containing clouds from airborne in situ measurements. Usually the environmental conditions (temperature, relative humidity, and INPC) at which the ice crystals nucleated remain unknown in the analysis of aircraft observation performed within the clouds. Most of the aircraft tracks are hundreds of meters below cloud top and thus below the coldest region of the cloud, where the probability of ice nucleation is highest. After nucleation, the ice crystals quickly grow to sizes of 50–100 µm within minutes (Bailey and Hallett, 2012) and immediately start falling through the cloud deck and influence the further evolution of the entire cloud system from the top to the base and the virga zone (Spichtinger and Gierens, 2009a, b; Field and Heymsfield, 2003). Clear and unambiguous conclusions on the specific impact of aerosol particles on the evolution of the ice phase can only be obtained by monitoring aerosol layering and embedded cloud systems at all heights simultaneously from the cloud base to its top.
A promising way to explore cloud evolution processes with a focus on heterogeneous ice nucleation is the use of ground-based remote sensing (see, e.g., the approach presented by Simmel et al., 2015). The continuous vertical profiling of aerosol, altocumulus, and cirrus layers (from the base of the virga zone up to the cloud top at the same time) with lidars and radars allows us to study processes rather coherently and in large detail. As illustrative examples we presented a Raman-lidar-based documentation of the impact of a strong gravity wave on ice production in a mixed-phase altocumulus layer (Ansmann et al., 2005) and reported the complete life cycle of a tropical altocumulus layer from the birth to the decay of the cloud system by complete glaciation at −34 ∘C monitored with wind Doppler lidar and cloud-phase-resolving polarization lidar (Ansmann et al., 2009).
Recently, retrieval techniques have been introduced to estimate the ICNC (Sourdeval et al., 2018; Mitchell et al., 2018; Bühl et al., 2019) and INPC (Mamouri and Ansmann, 2015, 2016; Marinou et al., 2019) from spaceborne and ground-based lidar and radar observations. The potential is therefore given to cloud-process-resolving as well as global-scale information and large statistics on the link between the INPC and ICNC and thus to quantify the impact of aerosol particles on the evolution of, e.g., cirrus clouds on a global scale (Gryspeerdt et al., 2018). However, active remote sensing with polar-orbiting satellites deliver snapshot-like observations of the atmospheric state only and thus do not permit the investigation of the fundamental aerosol–cloud interaction processes in detail such as the birth and evolution (life cycle) of a cloud system (over minutes to hours) in a given aerosol environment. Passive remote sensing by means of a geostationary satellite, on the other hand, can provide cloud information with high temporal resolution but not with sufficient height resolution.
The idea of performing INPC–ICNC closure studies, solely based on active ground-based remote sensing, came up after the introduction of a new lidar method to estimate INPC profiles throughout the troposphere (Mamouri and Ansmann, 2015, 2016). However, the additionally required ICNC retrieval technique was only recently developed (Bühl et al., 2019). Both methods are briefly outlined in Sect. 4. Before that, we introduce our field campaigns in Sect. 3. We applied the remote-sensing-based INPC–ICNC closure approach for the first time during the Cyprus-2015 campaign conducted in the framework of the BACCHUS (Impact of Biogenic versus Anthropogenic emissions on Clouds and Climate: towards a Holistic UnderStanding, https://www.bacchus-env.eu/, last access: 8 October 2019) project. Later, we continued with closure studies during the 17-month CyCARE (Cyprus Clouds Aerosol and Rain Experiment) campaign performed at Limassol from October 2016 to March 2018. Section 5 contains the results of the selected three closure studies which may be regarded as proof-of-concept studies. Two cases with prevailing deposition nucleation in thin and thick cirrus layers and one case with immersion freezing in an altocumulus layer are discussed. Summarizing and concluding remarks are given in Sect. 6. As a highlight, we will discuss our observation of the final phase of a unique, unusually long-lasting cloud life cycle (Sect. 5.2, case study 2, 17 March 2015). The event started with the generation of a dust-infused baroclinic storm (DIBS) (Fromm et al., 2016; Caffrey et al., 2018) that was associated with strong cloud convection over desert areas of northern Africa followed by the evolution of rather large anvil cirrus shield (of more than 15 000 km2) and cirrus uncinus fields that extended from the eastern Mediterranean to central Asia (more than 3500 km). The storm lifted large amounts of Saharan dust into the upper troposphere and thus created favorable conditions for a strong contribution of heterogeneous ice nucleation to ice production and apparently to an extension of cirrus lifetime. This finding seems to be in contradiction with the established hypothesis that heterogeneous ice formation usually leads to a reduction of cirrus lifetime (e.g., Storelvmo et al., 2018; Gruber et al., 2019).
INPC–ICNC closure studies are of key importance in our effort to better understand and quantify the specific impact of aerosol particles (i.e., of mixtures of different aerosol types of different number concentrations) on the evolution of the cloud ice phase. Therefore, we begin with a historical overview of published (pioneering) attempts to simultaneously measure the INPC and ICNC and to perform ice-nucleation-related aerosol–cloud closure studies.
The concept of aerosol-related closure experiments (Russel et al., 1979; Bates et al., 1998; Russell and Heintzenberg, 2000; Ansmann et al., 2002) was originally introduced to investigate the complex relationships between physical, chemical, optical, and radiative properties of atmospheric aerosol particles and thus to study the direct effect on climate solely based on aerosol observations (Quinn et al., 1996). In closure experiments, the measured value of a dependent variable is compared with the modeled or predicted value that is calculated from measured values of independent variables by using an appropriate model. The outcome of a closure experiment provides a direct evaluation of the combined uncertainty of the model and the measurements. If we transfer this concept to the field of heterogeneous ice nucleation, we may use the ICNC as the dependent, measured variable. Then, the INPC may be regarded as the predicted ICNC value assuming that all INPs become ice crystals during favorable heterogeneous ice nucleation conditions and further assuming that secondary ice production processes (Hallett and Mossop, 1974; Field et al., 2017; Sullivan et al., 2017, 2018; Korolev et al., 2019) and homogeneous freezing events do not occur (i.e., are suppressed because of unfavorable meteorological conditions). The INPC is calculated from measured independent variables such as the particle surface area concentration, denoted as s, or particle number concentration of large particles with a radius of >250 nm, denoted as n250. The variables s and n250 are input parameters in INPC parameterization schemes (DeMott et al., 2010, 2015; Ullrich et al., 2017) which are the models in our closure experiments. Details of the INPC computation from lidar observations are given in Mamouri and Ansmann (2016) and Marinou et al. (2019), and in Sect. 4.
The first attempts to find agreement between INPC and ICNC levels in natural cloudy environments date back to the early 1960s. Auer et al. (1969) performed closure studies by comparing INPC with ICNC observations in cap clouds (at 3350 m height a.s.l., Elk Mountain, Wyoming, in autumn 1967). Hobbs (1969) reviewed even earlier INPC–ICNC studies and investigated the link between the INPC and ICNC in natural clouds at 2025 m height in the Olympic Mountains, Washington, in March 1968. Both field observations revealed a steady decrease of the ICNC ∕ INPC ratio from values of >5000 at temperatures of −5 to −10 ∘C towards values of the order of 1–10 at temperatures around −25 ∘C. The high ICNC ∕ INPC ratios of >5000 were the result of secondary ice formation.
The first ice closure studies based on airborne measurements were conducted about 10–15 years ago. As pointed out by Avramov et al. (2011), Prenni et al. (2009) reanalyzed airborne observations of the INPC collected during an Arctic field campaign in northern Alaska during October 2004 and compared them against corresponding ICNC observations in long-lived stratiform mixed-phase Arctic clouds at temperatures ∘C. Taking into account the uncertainty ranges for both types of measurements, the reanalysis showed that the INPC and ICNC were approximately equal if only large ice particles (with sizes >125 µm) were considered. For smaller ice particles, the INPC and ICNC differed by more than two orders of magnitude. This difference was attributed to ice-shattering artifacts (Korolev et al., 2011). However, ice multiplication effects caused by riming and ice breakup processes cannot be fully excluded at these temperatures (Sullivan et al., 2017, 2018).
Eidhammer et al. (2010) then conducted an aircraft campaign on the close link between measured ICNC and INPC concentrations in stable, well-defined orographic clouds at 7000–7700 m height a.s.l. (temperatures in the clouds were between −20 and −30 ∘C) over Colorado and Wyoming in November and December 2007. The measurements showed that observed and parameterized INPC values compared well in number with ice crystals observed to nucleate in the same cloud. The ICNC ranged from 0.1 to 2 L−1, and the INPC values were mostly between 0.05 and 1 L−1. INPC ∕ ICNC ratios from 0.7 to 9 were found.
Avramov et al. (2011) presented a complex INPC–ICNC closure attempt by combining airborne in situ measurements (of INPC and ice crystal microphysical properties), active remote sensing with several cloud radars (cloud profiling in terms of radar reflectivity, Doppler velocities related to air motion, and falling ice crystals), radiosonde observations of atmospheric state parameters, and large-eddy simulation (LES) modeling to test the hypothesis that INPC values measured above cloud top can account for the observed ICNC values. Reasonable agreement between the INPC and ICNC was obtained in this way for low-lying mixed-phase Arctic cloud layers observed in northern Alaska in April 2008. However, a key aspect was that a second INP reservoir, located below the well-mixed cloud layer, had to be assumed in the LES modeling efforts as well. These INPs were slowly mixed upward (into the cloud) in the simulations and helped to maintain the INPC values in the model close to those observed. A similar approach, based on cloud radar observations and estimates of the INPC from airborne in situ measurements of aerosol size distributions below and above a long-lasting shallow mixed-phase cloud deck over the United Kingdom, was used in the investigation of a long-lived altocumulus layer regarding the impact of the INPC on the cloud lifetime (Westbrook and Illingworth, 2013).
In strong contrast to these Arctic and mid-latitude aerosol–cloud closure studies at clean-air and thus low aerosol concentration levels, our remote-sensing-based INPC–ICNC closure approach deals with stratiform altocumulus and cirrus layers which developed in pronounced Saharan dust layers in the middle and upper troposphere over Cyprus (at Middle Eastern meteorological conditions). Such clouds were frequently observed during our field campaigns, conducted in each of the spring seasons from 2015 to 2018, and thus are obviously very common in the eastern Mediterranean. Cloud top temperatures typically ranged from −20 to about −60 ∘C. Secondary ice production (SIP), that can sensitively disturb any ice closure experiment, is assumed to have a minor impact on the ICNC at these low temperatures. The Hallett–Mossop SIP process is associated with a splinter ejection during the riming of ice crystals at temperatures between −3 and −8 ∘C (Hallett and Mossop, 1974).
The Mediterranean Basin is well recognized by the IPCC (Intergovernmental Panel on Climate Change) (Stocker et al., 2013) as a hot spot for climate change, the impacts of which are expected to amplify further in the years to come. However, the IPCC also identified aerosol–cloud–precipitation relationships as one of the unsolved problems of atmospheric research and thus their simplified representation in atmospheric circulation models as one of the most prominent reasons for the large uncertainties in the present future-climate-change debate. The European Commission responded to this issue by funding the BACCHUS project. BACCHUS is aimed at a better understanding of heterogeneous ice formation in tropospheric clouds around the globe and improved consideration of cloud processes in cloud-resolving and Earth system models. In the framework of this research initiative, in which about 20 European research institutes, universities, and weather services were involved, a series of short-term intensive field observations was conducted in Cyprus in each spring of 2015–2017. The spring season coincides with the end of the rainy season (November to March) in the eastern Mediterranean, and, at the same time, frequent dust outbreaks towards Cyprus from the deserts in northern Africa and the Middle East take place. In addition, the 17-month monitoring campaign CyCARE (covering two rain seasons) was performed in Limassol, Cyprus, from October 2016 to March 2018.
Cyprus, in the center of the eastern Mediterranean, offers favorable conditions for atmospheric and climate research, especially in the field of cloud and precipitation formation with a focus on the influence of natural (desert dust, soil dust, and marine particles) and anthropogenic aerosols (urban haze and biomass burning smoke) on these processes. The island exhibits Middle Eastern atmospheric and climate conditions, and its air quality is strongly affected by a mixture of urban haze, originating mainly from urban and industrial conglomerations in southeastern Europe but also from the Middle East and northern Africa. This includes biomass burning smoke from the north (e.g., Black Sea countries), mineral dust originating from arid regions in Turkey and Middle Eastern deserts, and Saharan dust (Lelieveld et al., 2002; Nisantzi et al., 2014, 2015; Abdelkadar et al., 2015; Mamouri et al., 2016; Pikridas et al., 2018; Michaelides et al., 2018). There are very few locations on Earth which experience such complex aerosol structures, vertical layering, and mixtures which can sensitively influence cloud evolution and precipitation processes.
3.1 Cyprus-2015
As a first BACCHUS field experiment, the joint BACCHUS/ENVI-Med (Environmental Mediterranean program; see http://www.mistrals-home.org, last access: 8 October 2019) and ChArMEx (French Chemistry-Aerosol Mediterranean Experiment) (Mallet et al., 2016) Cyprus-2015 campaign took place from 4 March to 7 April 2015 and was coordinated by the Cyprus Institute (CyI). The campaign was organized in collaboration with the ChArMEx and ENVI-Med (project CyAr: Cyprus Aerosols and Gas Precursors) research initiatives. ChArMEx (http://charmex.lsce.ipsl.fr, last access: 8 October 2019) (Mallet et al., 2016) is a collaborative research program federating international activities to investigate Mediterranean regional chemistry–climate interactions. The ENVI-Med regional program is a French cooperation initiative for countries in the Mediterranean Basin designed to encourage and strengthen high-level scientific and technological cooperation in the region as well as research networking on sustainable development and understanding the environmental (ENVI) operation of the Mediterranean Basin (Med). In partnership with France, the program is focused on countries on the rim of the Mediterranean.

Figure 1Landasat/Copernicus image of Cyprus with the main field sites of the Cyprus-2015 and CyCARE campaigns. The inset shows the greater area of the eastern Mediterranean, Middle East, and northern Africa. (© Google Earth; data provider: Scripps Institution for Oceanography (SIO), NOAA, US Navy, National Geospatial-Intelligence Agency (NGA), General Bathymetric Chart of the Oceans (GEBCO).)
In situ observations of gaseous and particulate pollution including the INPC, CCNC (cloud condensation nucleus concentration), particle size distribution, number concentrations, chemical composition, and particle optical properties (absorption, light scattering, and extinction coefficients) were performed at the remote site of the CAO (Cyprus Atmospheric Observatory, http://www.cyi.ac.cy/index.php/cao.html, last access: 8 October 2019) at Agia Marina Xyliatou (35.0∘ N, 33.1∘ E, about 500 m a.s.l., see Fig. 1) in the northern part of the Troodos mountains about 25 km west of Nicosia, the capital city of Cyprus. UAVs (unmanned aerial vehicles) were operated at the Agia Marina site to measure aerosol microphysical, optical, and cloud-relevant properties as a function of height up to 2 km a.s.l. (Calmer et al., 2019).
The remote-sensing facility was deployed on the roof of a CyI building which is located in the southern part of the capital, Nicosia (35.2∘ N, 33.4∘ E, 180 m a.s.l.). The different field sites are shown in Fig. 1. The instrumentation was run continuously over a 6-week period. The station consisted of a multiwavelength polarization/Raman lidar Polly (PortabLe Lidar sYtsem) (PollyNET, 2019; Engelmann et al., 2016; Baars et al., 2016) from the National Observatory Athens (NOA) (Marinou et al., 2019), a wind Doppler lidar (HALO Photonics) from the Leibniz Institute for Tropospheric Research (TROPOS) (Bühl et al., 2016), Leipzig, and a sun/lunar photometer (Cimel, CE318-T) from TROPOS, belonging to the Aerosol Robotic Network (AERONET) (Holben et al., 1998; Barreto et al., 2017). Another polarization/Raman lidar and AERONET sun photometer was operated by the Cyprus University of Technology (CUT-TEPAK (Technologiko Panepistimio Kyprou) in Fig. 1) at Limassol (Mamouri et al., 2013).
3.2 Cyprus-2016
The follow-up Cyprus-2016 campaign included further aerosol and INP observations performed by the German INUIT (Ice Nuclei Research Unit, https://www.ice-nuclei.de/the-inuit-project/, last access: 8 October 2019) research group. The INUIT consortium studied heterogeneous ice formation in the atmosphere within three different work packages divided into laboratory studies, field measurements, and modeling. The European research infrastructure project ACTRIS-2 (Aerosols, Clouds, and Trace gases Research InfraStructure, https://www.actris.eu/, last access: 8 October 2019) supported the field activities in Cyprus as well. Almost the same infrastructure consisting of a ground station (Agia Marina Xyliatou), a UAV airport (now at Orunda, 7 km northeast of Agia Marina Xyliatou and 21 km west of the lidar station at Nicosia), and the NOA Polly site (Marinou et al., 2019) at the CyI premises was available during the Cyprus-2016 campaign. The Doppler lidar of TROPOS was however not deployed in 2016.
For the first time, an in-depth comparison of aerosol mass profiles, INPC, and INP-relevant aerosol parameters obtained from UAV flights and derived from the lidar observations was performed during the Cyprus-2016 campaign (Schrod et al., 2017; Mamali et al., 2018; Marinou et al., 2019). Some of these results will be discussed in Sect. 5.
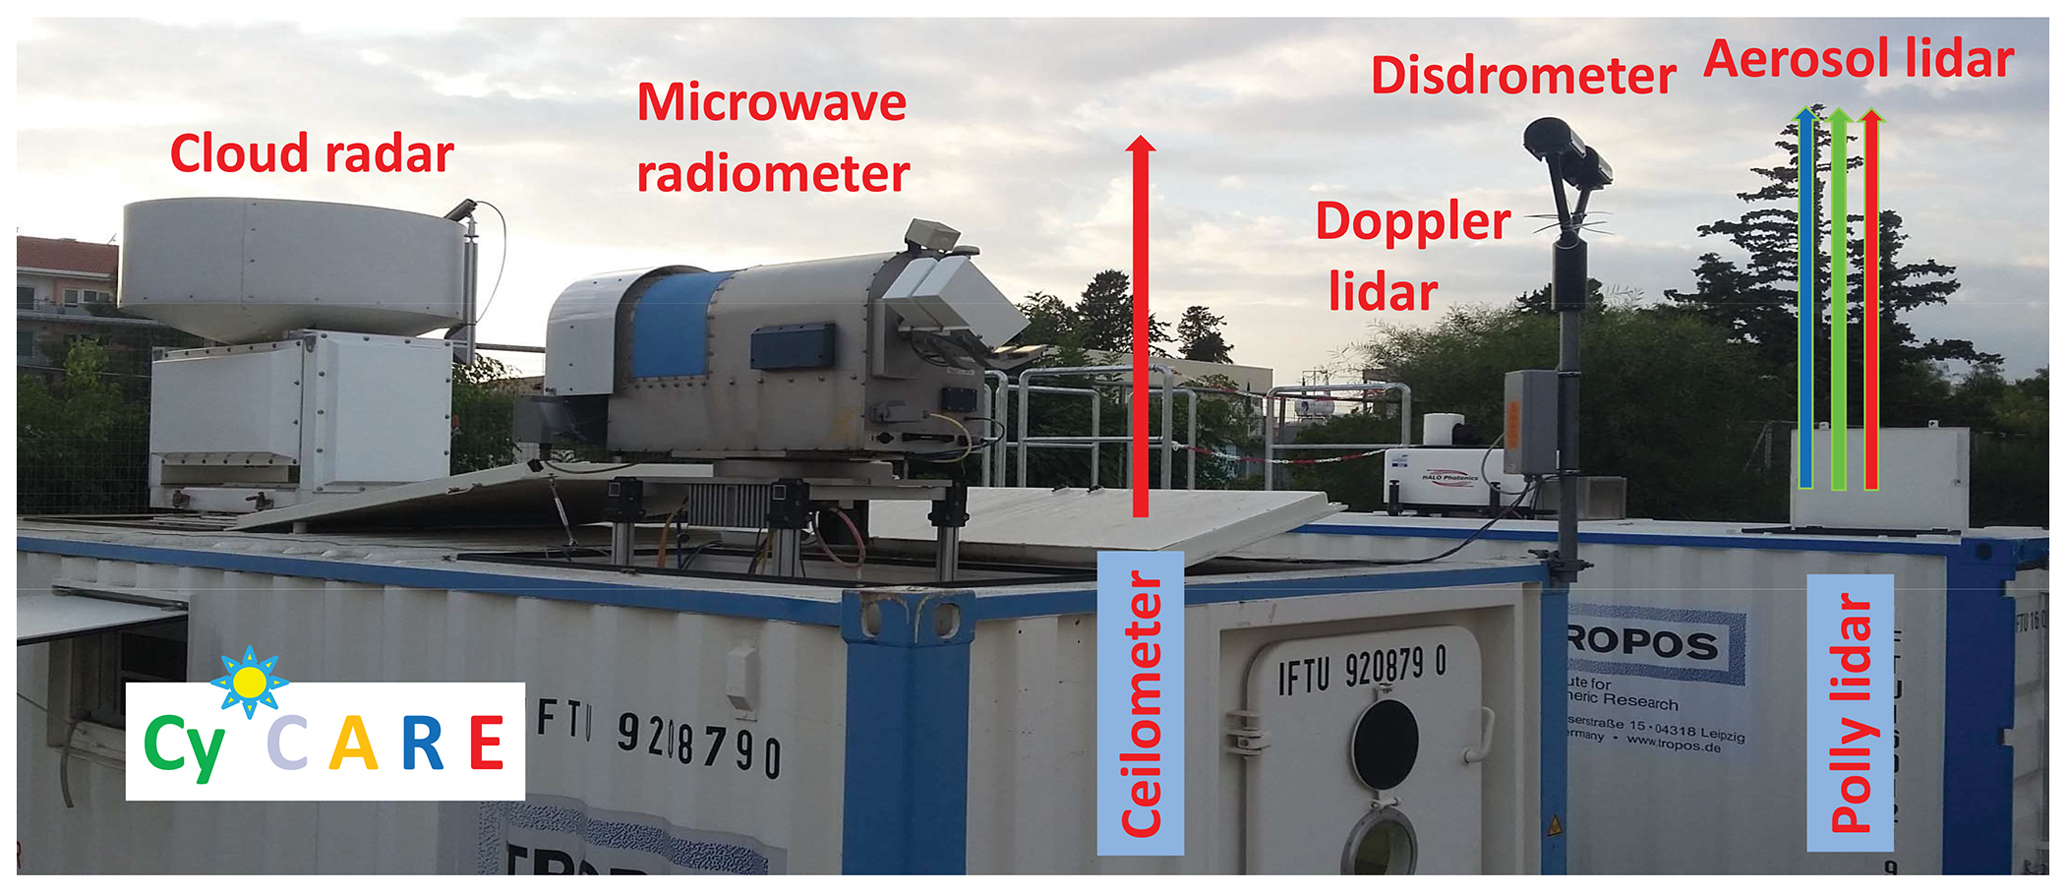
Figure 2LACROS (Leipzig Aerosol and Cloud Remote Observations System) deployed at Limassol, Cyprus, from 22 October 2016 to 26 March 2018 in the framework of the CyCARE field campaign. LACROS belongs to Cloudnet and consists of a 35 GHz Doppler cloud radar, microwave radiometer, disdrometer (on the roof of the cloud container), and 1.5 µm wind Doppler lidar on the roof of the aerosol container and a multiwavelength polarization/Raman lidar (Polly) within the aerosol container. A ceilometer (1064 nm wavelength) was deployed between the cloud and aerosol containers (not visible in the photograph).
3.3 CyCARE (2016–2018)
As one of the central BACCHUS remote-sensing initiatives the mobile Leipzig Cloudnet supersite LACROS (Leipzig Aerosol and Cloud Remote Observation System, http://lacros.rsd.tropos.de/, last access: 8 October 2019) (Bühl et al., 2013, 2016) was moved to the eastern Mediterranean and was run at CUT in the city center of Limassol (34.7∘ N, 33∘ E, see Fig. 1), Cyprus, from 22 October 2016 to 26 March 2018, in the framework of CyCARE. The CyCARE campaign is part of a long-term cooperation between TROPOS and CUT established in 2012 and integrated into the Cloudnet activities coordinated by the European Union infrastructure project ACTRIS-2. The mobile Leipzig Cloudnet supersite is shown in Fig. 2 and is equipped with a multiwavelength polarization/Raman lidar Polly, wind Doppler lidar, 35 GHz Doppler cloud radar, ceilometer, disdrometer, and microwave radiometer. All tools were run continuously over the 17-month period. In addition, nearby AERONET sun photometer observations (CUT-TEPAK site) were taken. An excellent data set was collected for in-depth studies on the impact of dust and aerosol pollution on cloud and rain evolution in the eastern Mediterranean. During the intensive CyCARE field phase in April 2017, 43 Vaisala radiosondes were launched at Limassol (Dai et al., 2018).
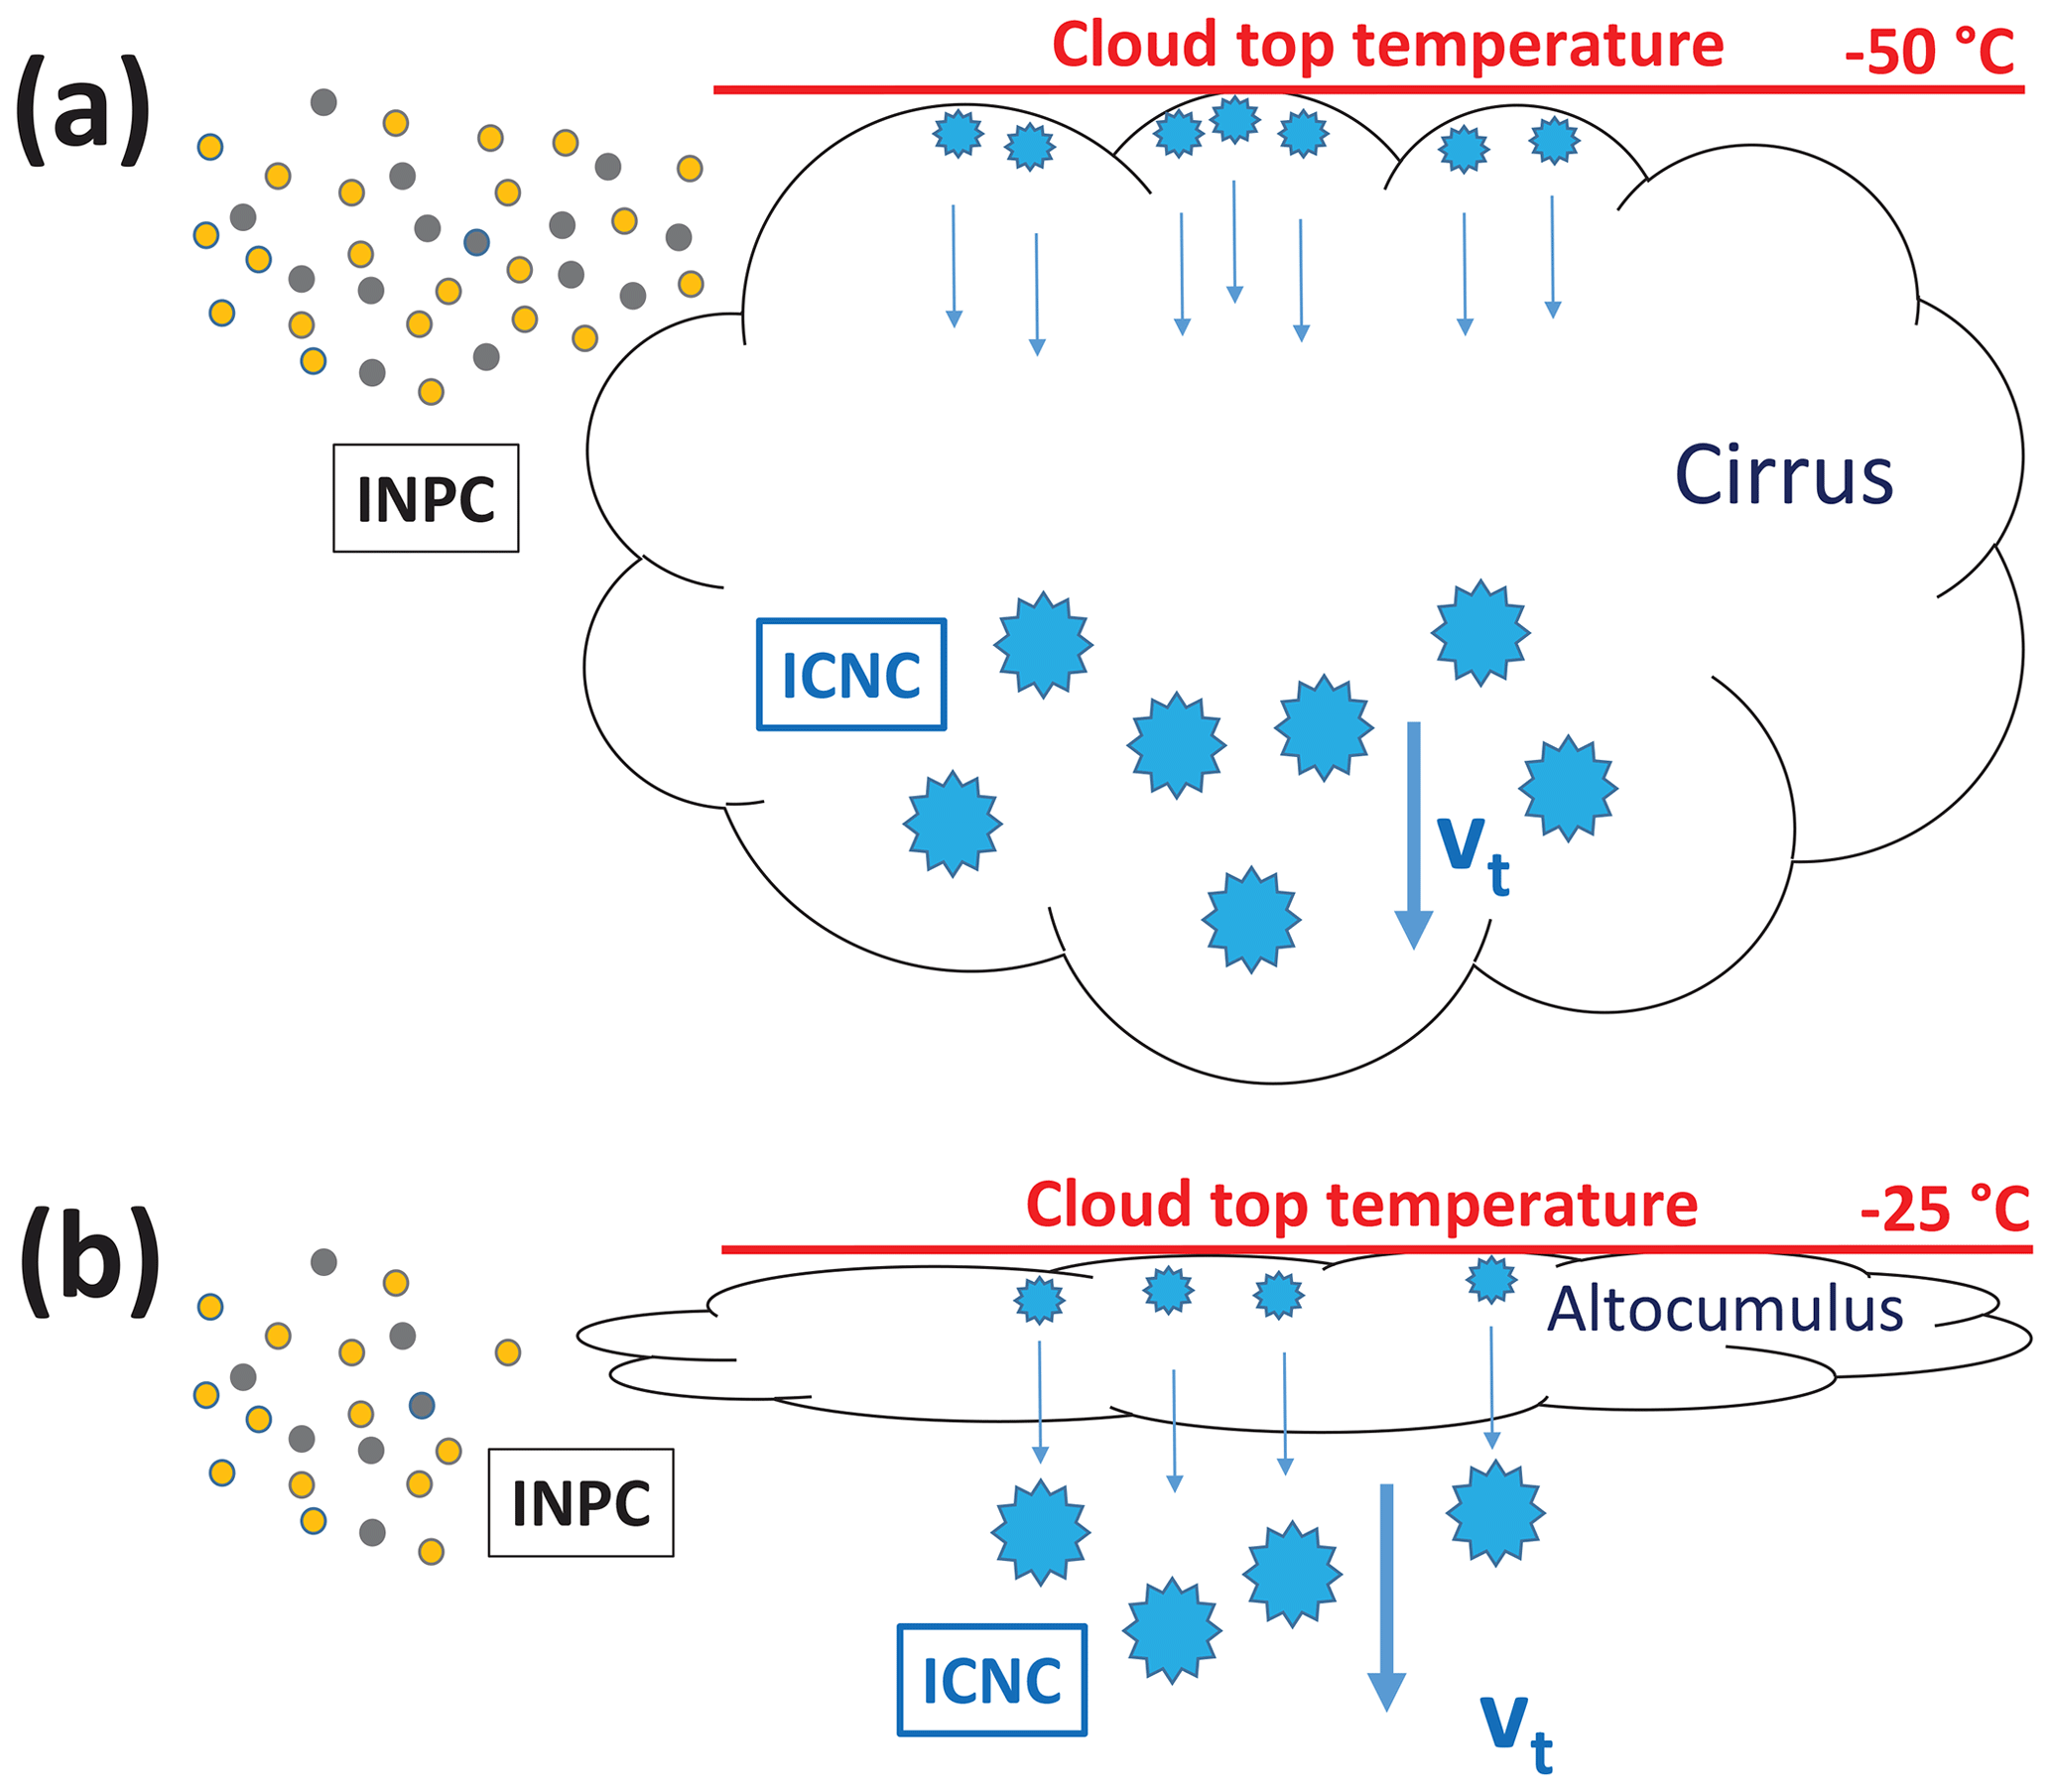
Figure 3Illustration of the INPC–ICNC closure approach for (a) a vertically deep cirrus cloud and (b) a shallow stratiform mixed-phase altocumulus layer. In the first step, the INPC is retrieved from polarization lidar observations outside the cloud layer (e.g., before the cloud layer crosses the lidar field site). Gray and orange particles indicate continental pollution and mineral dust particles, respectively. In the second step, the ICNC is estimated from observations with the available backscatter lidar, Doppler lidar, and cloud radar instrumentations. Within the cirrus layer (a) the ICNC is preferably estimated in the lower part of the cloud with large ice crystals and thus clear falling features of ice crystals. vt is the mean terminal velocity of the ice crystal population relative to the surrounding air. In the case of a shallow altocumulus layer (b), the ICNC is determined in the ice virga zone, below the main cloud layer in which backscatter by liquid droplets dominate the lidar return signals and prohibit ice observations. In the closure experiments, we assume that all ice crystals nucleate at the top of the cloud layer (at the coldest point of the cloud layer), grow quickly, and start falling and that the number of nucleated ice crystals does not change on the way downward towards the lower part of the cirrus (a) and below the altocumulus layer (b), i.e., that collisions of ice crystals and the subsequent formation of crystal aggregates as well as secondary ice production do not change the number of nucleated ice crystals significantly.
Figure 3 illustrates our approach to a cloud closure experiment with a focus on heterogeneous ice nucleation. The INPC is estimated from lidar observations in a cloud-free region before or after the passage of the cloud field. INPC values at the cloud top height level are compared with ICNC values obtained from combined backscatter lidar, wind Doppler lidar, and cloud Doppler radar observations in the lower part of a cirrus cloud (see Fig. 3a) or in the virga zone below a mixed-phase altocumulus layer (see Fig. 3b). We assume that ice crystals nucleate at the coldest point of the cloud (at the cloud top), where the INPC is highest because of the rather strong INP number increase with deceasing temperature (Kanji et al., 2017). Furthermore, we assume that the freshly formed ice crystals grow fast by water vapor deposition, immediately start falling, and do not collide and form aggregates so that the number of ice crystals does not change during sedimentation to the lower part of the cloud and the virga zone. In Sect. 4.1, we briefly outline the methods of the INPC retrieval (Mamouri and Ansmann, 2016; Marinou et al., 2019). Section 4.2 deals with the estimation of the ICNC.
The uncertainties in our closure methodology caused by the idealized assumptions may be small in the case of geometrically and optically thin ice clouds (case study 1 in Sect. 5.1) with a vertical extent of a few hundred meters and in case of shallow mixed-phase altocumulus layers (case study 3 in Sect. 5.3) with the nucleation of a comparably low amount of ice crystals within the thin liquid water layer at the top of the altocumulus. However, in a geometrically and optically thick cirrus (as is the case in case study 2, Sect. 5.2) the assumption of a height-independent ice crystal number concentration from the top down to the virga zone is probably not well justified. Crystal–crystal collisions and subsequent aggregation processes can cause a significant decrease by a factor of 3–10 in the ICNC from the upper part to the lower part of a cirrus deck (Field and Heymsfield, 2003; Field et al., 2006). Based on CALIPSO (Cloud-Aerosol Lidar and Infrared Pathfinder Satellite Observations), the retrieved ICNC near the cloud top was frequently 5 times higher than in the lower half of vertically deep cirrus clouds (Mitchell et al., 2018). Further processes such as ice nucleation within the central and lower parts of the cirrus layer as well as dilution and accumulation effects by turbulent processes and wind shear can lead to a strongly varying ICNC profile from the cloud top to its base (Spichtinger and Gierens, 2009a, b). Since we concentrate on clouds and heterogeneous ice nucleation at temperatures 20 ∘C, secondary ice nucleation (Field et al., 2017; Korolev et al., 2019) may not introduce further uncertainties.
4.1 INPC retrieval
INPC profiling with lidar dates back to 2006 (Ansmann et al., 2008) when we made an attempt to investigate the impact of dust particles on ice formation in an altocumulus which formed at the top of the Saharan dust layer over southeastern Morocco at temperatures from −10 to −18 ∘C. Later, when aerosol-based INP parameterization schemes became available (DeMott et al., 2010, 2015; Niemand et al., 2012; Ullrich et al., 2017), a lidar-based methodology was developed (Mamouri and Ansmann, 2015). In the first step of the INPC estimation, height profiles of the dust-related extinction coefficient σd at the 532 nm wavelength and the non-dust extinction coefficient σc for continental aerosol particles (anthropogenic haze, biomass burning smoke, and biological decay products) are derived and then converted into number concentrations of large aerosol particles n250,d and n250,c (considering particles with a radius of >250 nm only) and particle surface area concentrations sd and sc. These microphysical parameters together with temperature profiles are used as an input for the INPC estimation by means of INPC parameterization schemes as given in Table 1. We use GDAS (Global Data Assimilation System) temperature profiles of the National Weather Service's National Centers for Environmental Prediction (NCEP) in our computations. NOAA's Air Resources Laboratory (ARL, https://www.ready.noaa.gov/gdas1.php, last access: 8 October 2019) NCEP model GDAS1 output archives contain these data (GDAS, 2019). During CyCARE we found remarkably good agreement between the GDAS1 and radiosonde temperature profiles (Dai et al., 2018). The standard deviation (root-mean-square deviation based on all 43 radiosonde profiles and respective GDAS1 profiles) was 0.87 K.
The complete lidar-based INPC retrieval is described in detail by Mamouri and Ansmann (2016). The uncertainties in the products are as follows: the dust extinction coefficients can be obtained with 15 %–25 % relative error, and the non-dust extinction coefficients can be obtained with an uncertainty of 20 %–30 %. The uncertainty in the microphysical parameters are of the order of 20 %–30 % for the dust component and 25 %–40 % for the non-dust aerosol fraction. The uncertainty in the INPC values is finally of the order of a factor of 2–5. The range of uncertainty around the estimated INPC values is thus 1 order of magnitude (Mamouri and Ansmann, 2016; DeMott et al., 2017; Marinou et al., 2019) when using published INP parameterizations.
Favorable INPs are insoluble particles such as mineral dust particles, biological material, volcanic ash and dust, and soot particles originating from open fires, burning, and heating processes (e.g., Seifert et al., 2010, 2011, 2015; Hoose and Möhler, 2012; Murray et al., 2012; Kanji et al., 2017). According to the INP parameterizations in Table 1, we consider immersion freezing (D10, D15, U17-I) and deposition nucleation (U17-D). In the case of immersion freezing, ice nucleates on a solid particle immersed within a supercooled liquid droplet (e.g. Murray et al., 2012; Vali et al., 2015). Particles may contain insoluble and soluble components. The soluble fraction triggers the formation of supercooled liquid droplets, and the insoluble part is then responsible for heterogeneous freezing events. The D10 parameterization can be used to estimate INPC from the measured overall (dust plus non-dust) aerosol number concentration of particles with a radius of >250 nm. We also use the D10 retrieval method for dust and non-dust INP estimation in Sect. 5. The D15 parameterization was explicitly introduced for dust particles. Deposition nucleation describes the process when an ice embryo directly forms by water vapor deposition onto an insoluble surface. The deposition nucleation parameterization (U17-D in Table 1) includes pore condensation and freezing (PCF) (Marcolli, 2014) occurring in voids and cavities of aggregated primary particles at a relative humidity over water (RHw) of <100 % and low temperatures of ∘C when at least one pore is filled with water.
DeMott et al. (2010)DeMott et al. (2010)DeMott et al. (2015)Ullrich et al. (2017)Ullrich et al. (2017)Ullrich et al. (2017)Ullrich et al. (2017)Table 1INPC parameterizations used in our study and taken from the literature (reference and specific equation in this reference). Details of the lidar-based method to estimate INPC profiles can be found in Mamouri and Ansmann (2016) and Marinou et al. (2019). Input parameters in the INPC estimation are the particle number concentrations n250,d and n250,c, the particle surface area concentrations sd and sc, and temperature T. Indices d and c denote dust particles and continental pollution particles (e.g., haze and smoke). The D15 INPC parameterization is used with a factor (cf. Eq. (1) in D15) of 1.0 in our study instead of 3.0 as applied in the original equation (DeMott et al., 2015). In the U17-D INP parameterization the ice supersaturation value Si has to be set.

Our INPC–ICNC closure study however ignores contact nucleation and pre-activation influences. Contact freezing occurs when an INP initiates freezing by colliding with a supercooled droplet (see the latest research by Hoffmann et al., 2013). As outlined in detail by Marcolli (2017), pre-activation denotes the capability of particles or materials to nucleate ice at lower relative humidities or higher temperatures compared to their intrinsic ice nucleation efficiency after having experienced an ice nucleation event before. The subsequent, next ice nucleation event is then thought to occur because of ice preserved in pores between the first ice nucleation event and second ice growth cycles.
There is an ongoing discussion on the applicability of the INP parameterization methods (Phillips et al., 2013; Boose et al., 2016; DeMott et al., 2017; Schrod et al., 2017; Price et al., 2018; Marinou et al., 2019). Our closure study contributes to this discussion. Because most of the INP parameterization schemes are based on laboratory studies performed at well-defined meteorological conditions (temperature, cooling rate, and ice supersaturation level) and precisely known aerosol properties (aerosol type, chemical composition, and size distribution), the central question arises as to whether these parameterizations can be applied to predict the INPC, e.g., in the upper troposphere up to cirrus height level, at which aged, chemically and cloud-processed aerosol particles may prevail. Chemical reactions on the surfaces of the particles may have already significantly changed the potential of the particles to serve as ice nuclei (Archuleta et al., 2005; Möhler et al., 2008; Cziczo et al., 2009; Sullivan et al., 2010a, b; Wex et al., 2014).
As a first activity of the Cyprus-2015 data analysis, we checked our INP retrieval approach by comparing the lidar-derived INPC values with in situ INPC observations taken at Agia Marina Xyliatou. Results are shown in Sect. 5. Marinou et al. (2019) furthered the discussion on the applicability of the D10, D15, U17-I, and U17-D parameterizations by comparing lidar-derived INPC profiles with UAV-based in situ observations performed during the Cyprus-2016 campaign (Schrod et al., 2017). These results are also discussed in Sect. 5.
4.2 ICNC retrieval
Three different ways are used in order to derive ICNC from combined lidar and radar observations. The basic methodology is described in detail in Bühl et al. (2019) and briefly in this section.
4.2.1 Observations of the radar reflectivity (with cloud radar) and the ice extinction coefficient (with lidar)
Lidar return signals (backscatter) and cloud radar reflectivity show approximately a diameter (D) and (equivalent) diameter dependence on ice crystal size of D2 and D6, respectively. This difference in sensitivity between both signals can be exploited in order to derive information about particle size. The ICNC is estimated by comparing simulations of the ice crystal light extinction coefficient at the 532 nm and of the radar reflectivity at the 8.5 mm wavelengths with the respective measured extinction coefficients (Polly lidar) and radar reflectivity values. The lidar extinction values are obtained from the observed cirrus backscatter coefficients after multiplication with the climatological mean cirrus extinction-to-backscatter ratio of 32 sr (Seifert et al., 2007; Giannakaki et al., 2007; Josset et al., 2012; Garnier et al., 2015; Haarig et al., 2016). In the simulations, the ICNC and the crystal size distribution are input parameters. For realistic size distributions the ICNC is varied until the simulations match the observations. Such a combined lidar–radar approach has been widely used before, e.g., for estimating particle properties from spaceborne lidar and radar (DARDAR) (Ceccaldi et al., 2013). Combined lidar–radar observations of LACROS are available for the complete CyCARE campaign.
4.2.2 Observations of the ice crystal terminal fall velocity spectrum and radar reflectivity (with cloud radar) and the ice extinction coefficient (with lidar)
The ice crystal size distribution can be estimated via measurements of the terminal fall velocity spectrum with the Doppler cloud radar. The mean terminal fall velocity vt of ice crystals is difficult to derive because it is usually offset by the vertical motion of air. Recently, methods have been developed to measure terminal fall velocity directly (Radenz et al., 2018), but those require additional instrumentation not available in the Cyprus experiments. However, the involved Doppler lidar detects both the Doppler velocity of falling ice crystals and of small liquid droplets moving with air parcel velocity in the cloud top layer. Both pieces of information together are used to estimate the impact of updraft and downdraft velocities on the retrieved ice crystal terminal velocities in the ice virga below the mixed-phase cloud layers. In a similar way, the Doppler lidar is also able to detect updrafts and downdrafts in the cirrus top region where small ice crystals showing only small vertical velocities dominate. Again, this information is used to correct for air motions (eventually induced by gravity waves, radiative cooling, and entrainment processes). In the case of stratiform mixed-phase clouds with a shallow liquid water layer at cloud top, vt is usually offset by the vertical air motion vair, which is estimated at the base of the liquid water layer directly above the zone dominated by ice crystals. In the ICNC retrieval, we take into account that values of vt from Doppler lidar and cloud radar are weighted by the particle area or the particle mass squared, respectively. The terminal velocity of ice crystals is also a strong function of their shape and size characteristics. All this is considered and described in detail in Bühl et al. (2019). Regarding the assumption on crystal shapes (plates, needles, and complex forms), we make use of a variety of laboratory studies made under ambient temperature conditions (Fukuta and Takahashi, 1999; Furukawa and Wettlaufer, 2007; Myagkov et al., 2016). All in all, the terminal velocity spectrum of falling ice crystals can be retrieved with an uncertainty of about 30 %–50 %. From the vertical-velocity information particle size and the ice crystal size distribution is retrieved.
In the next step, the ICNC is estimated by comparing simulations of the ice crystal light extinction coefficient and of the radar reflectivity, in which the ICNC is now left as the only input parameter, with the measured extinction coefficients and radar reflectivity values. The ICNC is varied in the simulations until the measured extinction and reflectivity values are matched. The uncertainty in the ICNC estimates would be in the order of 50 % in the case of perfectly calibrated lidar and radar systems. However, realistic radar reflectivity uncertainties lead to ICNC uncertainties of a factor of 3. Such large uncertainties are still acceptable in our closure studies as we show in Sect. 5.
4.2.3 Observations of the characteristic ice crystal terminal fall velocity (with Doppler lidar) and the ice extinction coefficient (with lidar)
During the BACCHUS Cyprus-2015 campaign, we ran a Polly together with a vertically pointing Doppler lidar. A cloud radar was not available. Under these condition the entire retrieval is usually much more uncertain because of the missing Doppler spectrum information and the backscatter wavelength dependence (532 versus 8.5 mm). However, for the selected two case studies of the Cyprus-2015 campaign discussed in Sect. 5.2 and 5.3, stable, temporally constant ice sedimentation conditions were observed so that a good retrieval of the terminal velocity and estimation of the mean ice crystal size within an uncertainty of 30 %–50 % was possible. The ICNC is again derived from comparison of observations with respective simulations of the light extinction coefficient from lidar with the ICNC as an input and for an assumed size distribution adjusted to the derived mean ice crystal size. The overall uncertainty factor of 3 was also assumed in this case of ICNC estimation (applied in Sect. 5.2 and 5.3).
At the end of Sect. 4, it is noteworthy to mention that it is practically impossible to measure, retrieve, or estimate the INPC with an overall uncertainty range of less than 1 order of magnitude (factor 3) (DeMott et al., 2017). This holds also for many retrieval techniques and in situ measurement approaches in the case of the ICNC. But, as will be shown in the next section, these uncertainties still allow us to study aerosol–cloud interaction in detail, to quantify the aerosol impact on cloud properties (such as the ICNC), and to evaluate and rate the closure study as good or acceptable or even determine if we failed to achieve closure between the INPC and ICNC.
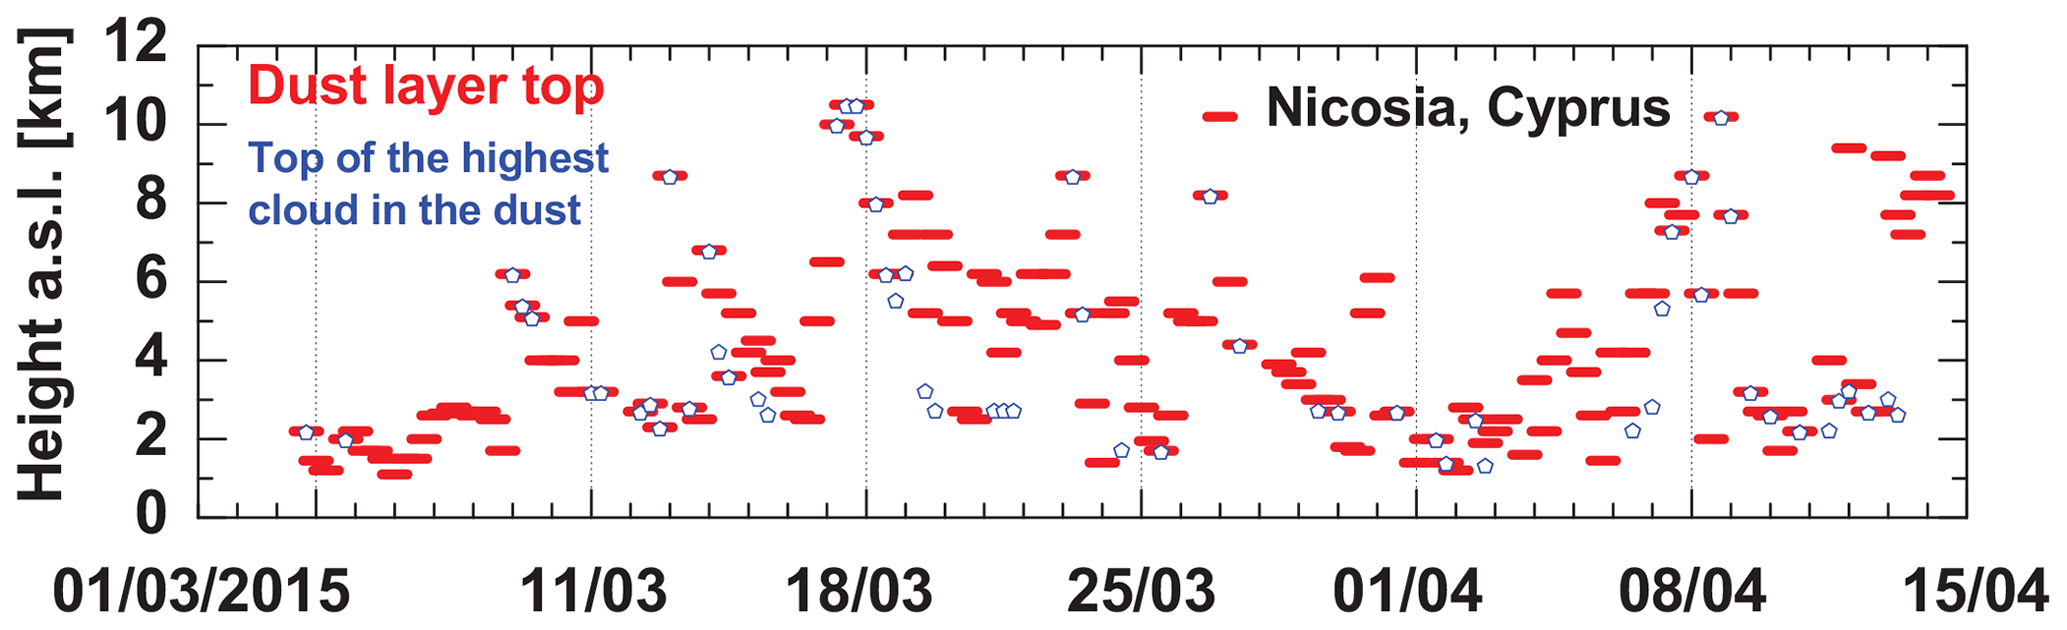
Figure 4Dust and cloud conditions observed with lidar over Nicosia, Cyprus, during the BACCHUS Cyprus-2015 campaign from 1 March to 15 April 2015. The Polly lidar was running continuously over the 6-week period. Periods of 6 h (00:00–06:00, 06:00–12:00, 12:00–18:00, and 18:00–24:00 UTC) were evaluated separately regarding the occurrence of dust, the top height of the uppermost dust layer (red short lines), cloud occurrence in dust, and the top height of the detected uppermost cloud layer (blue open symbols). Frequently clouds developed in Saharan dust, preferably in the top region of the dust layer.
We begin with an overview of desert dust conditions over Cyprus in the spring of 2015. Figure 4 shows the frequency of occurrence of mineral dust over Nicosia during the BACCHUS Cyprus-2015 campaign. Almost every day traces of dust were visible in the lidar measurements. Dust layers were often present at heights above 5 km. Stratiform altocumulus and cirrus clouds frequently developed in these dust layers. Similar conditions were observed during the spring seasons 2016–2018 (not shown). In March–April, the rainy winter season ends and coincides with the period of frequent advection of warm and dusty air from Africa. Favorable conditions for heterogeneous ice nucleation are given during this season of the year. Examples of cloud fields evolving in Saharan dust layers during the Cyprus-2015 campaign are shown in Fig. 5. The observation of the cirrus layer in the evening of 17 March 2015 (Fig. 5e and f) and of the altocumulus layer on 8 March 2015 (Fig. 5a and b, at heights of 5–6 km after 21:00 UTC) will be discussed in detail in Sect. 5.2 and 5.3.
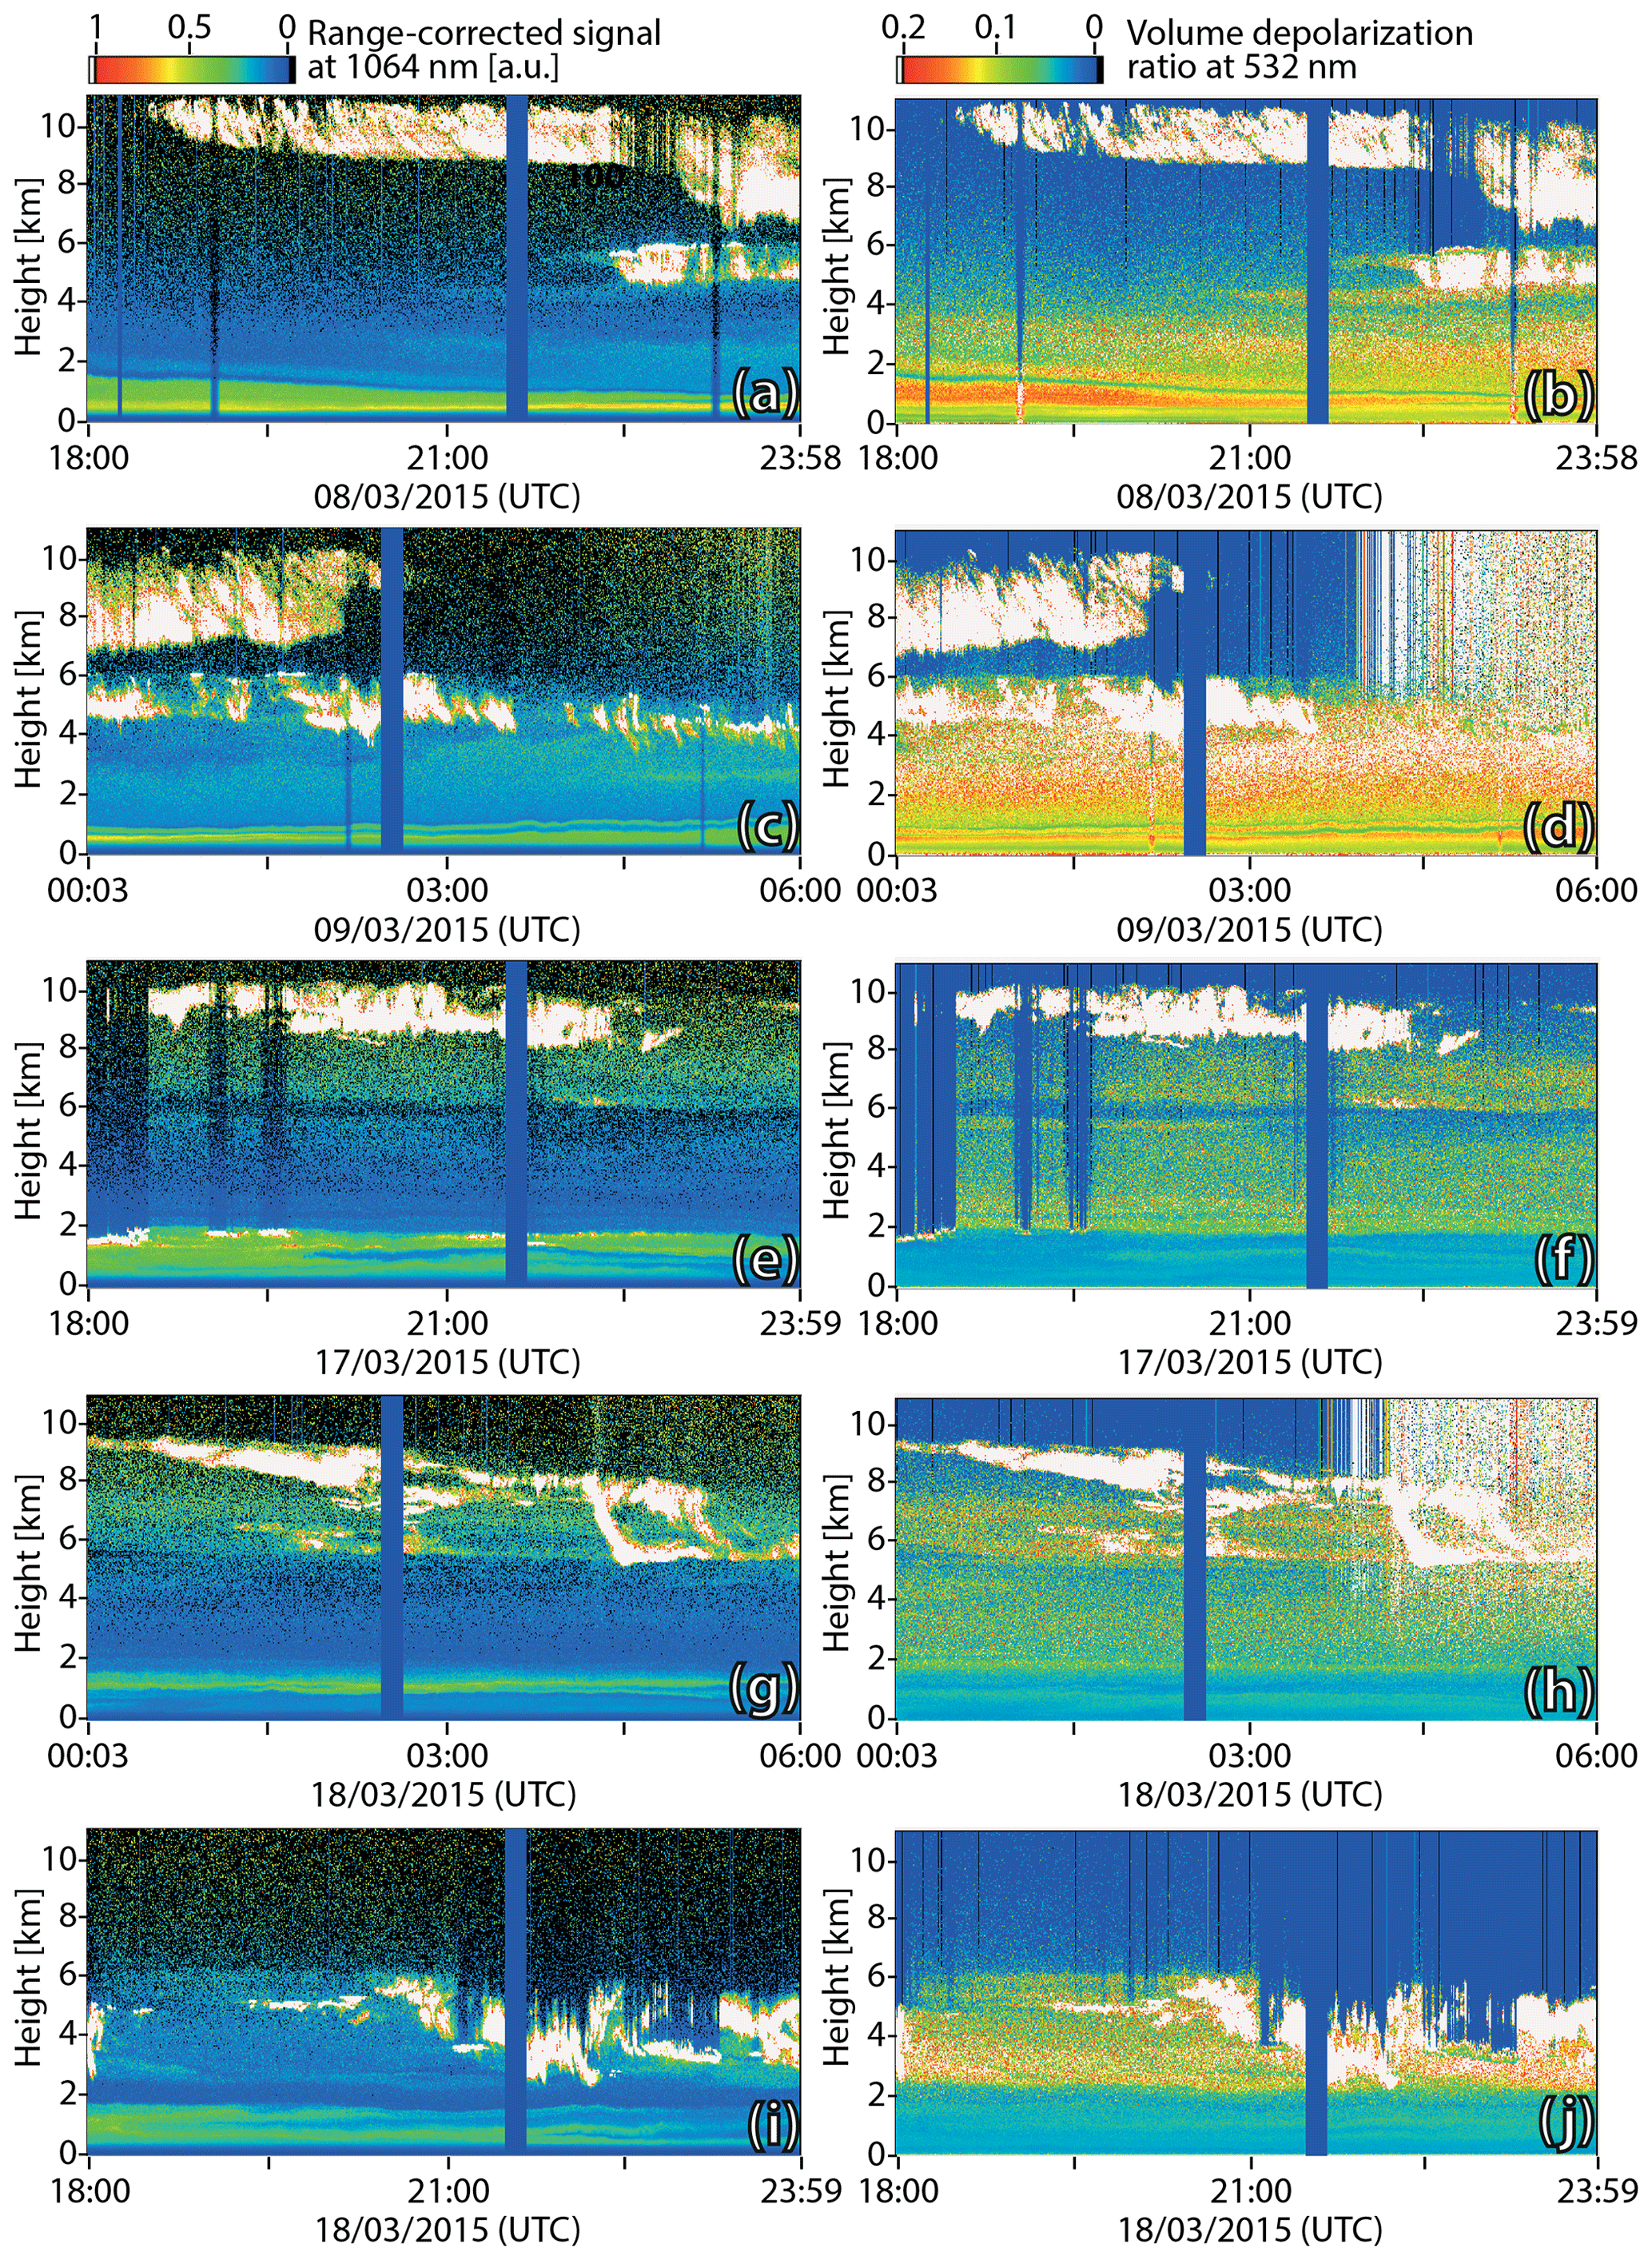
Figure 5Cirrus and mixed-phase altocumulus layers (white areas) embedded in Saharan dust observed with polarization lidar during the BACCHUS Cyprus-2015 campaign. The range-corrected 1064 nm signal (a, c, e, g, i) and the 532 nm volume depolarization ratio (b, d, f, h, j) are shown. The depolarization ratio is especially sensitive to irregularly shaped particles such as mineral dust particles (values from 0.08 to 0.2, green to red) and ice crystals (>0.2, white). A remarkable coincidence of cloud layers with dust layers is visible which indicates a close link between dust occurrence and ice formation. The thin vertical columns (dark because of low signal strength) are caused by strongly light-attenuating liquid water clouds and near-surface fog. The well-defined broad vertical columns (around 02:30 and 21:40 UTC) indicate automatically performed polarization lidar calibration units.
Before the presentation of the closure results, we compare the lidar-derived INPC estimates (over Nicosia) with respective in situ INPC observations taken at Agia Marina Xyliatou (see Fig. 1 and station description in Sect. 3.1). This comparison is shown in Fig. 6 and can be regarded as a good opportunity to check the reliability of the lidar INPC retrieval method. The Horizontal Ice Nucleation Chamber (HINC) (Lacher et al., 2017) from ETH (Eidgenössische Technische Hochschule) Zurich, was used for the in situ measurements performed during 20 d in March 2015 during daytime hours (at −30 ∘C and RHw=104 %, immersion/condensation freezing mode). For comparison 10 nighttime lidar observations (30–60 min mean values, for the height layer from 450 to 550 m a.s.l.) are shown. We used the immersion freezing parameterizations D15 and D10(d) (see Table 1) for the dust fraction and D10 also for the non-dust particles as described in Sect. 4.1. The lidar-derived INPC values were computed for −30 ∘C. We applied the D10(d) INP parameterization in addition to the D15 parameterization because Marinou et al. (2019) found during the Cyprus-2016 campaign that INPC values obtained with the D10 parameterization were in better agreement with UAV-based in situ INPC observations than respective INPC estimates obtained with the D15 INP parameterization. The latter INPC values were a factor of 2–50 times higher than the in situ measured ones (at aerosol conditions described by n250,d of 10–30 L−1 and for temperatures from −20 to −30 ∘C) (Marinou et al., 2019).
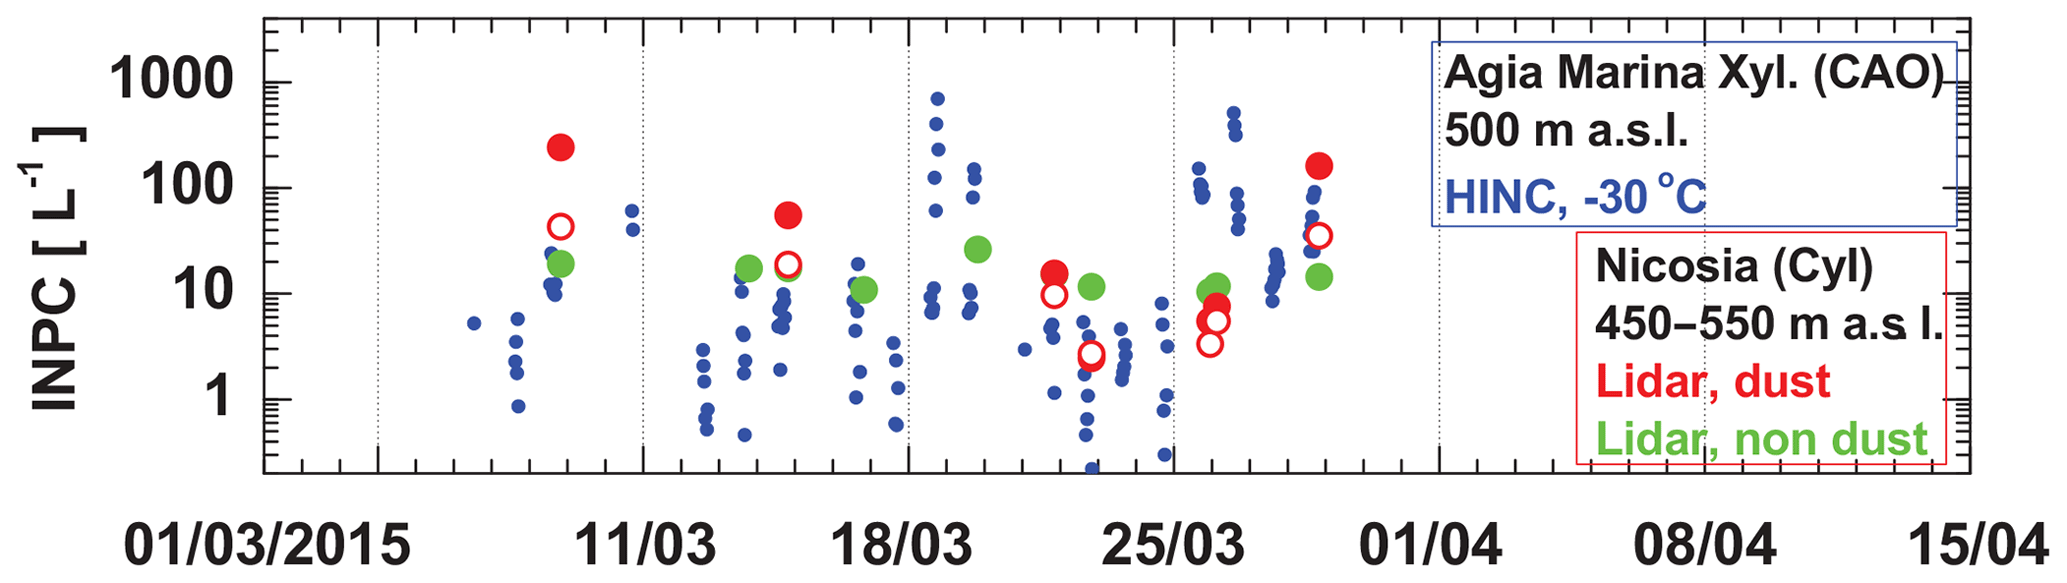
Figure 6Comparison of in situ observations of the INPC (HINC, ETH Zurich; see the text for more explanation) at Agia Marina Xyliatou (about 500 m a.s.l.) and lidar-based INPC estimations (mean values for the 450–550 m a.s.l. height range) at Nicosia, about 25 km downwind of Agia Marina Xyliatou. All in situ observations collected in March 2015 are shown. The green circles indicate lidar estimates of the INPC based on the D10 parameterization (for non-dust continental aerosol pollution) and the red circles are computed by using the D15 parameterization (for the dust aerosol fraction). For comparison, we also include dust INPC values (open red circles) obtained with the D10(d) parameterization (see Table 1). All INPC values (HINC, lidar) are given for −30 ∘C.
According to Fig. 6, a reasonable agreement between in situ measured and lidar-estimated INPC values is found, keeping the uncertainties in the measurement and retrieval methods into account. We compare in situ measurements at rural background conditions in the Troodos mountains at Agia Marina Xyliatou with lidar observations in a lofted dust layer 220 m above ground over Nicosia. On average, the lidar-derived INPC values were higher. This is in agreement with the findings of Schrod et al. (2017). They found that the UAV-based in situ measured INPC values (for heights between 200 and 2000 m above ground) were, on average, an order of magnitude higher than the INPC values measured at the surface of the Agia Marina Xyliatou field site during the Cyprus-2016 campaign.
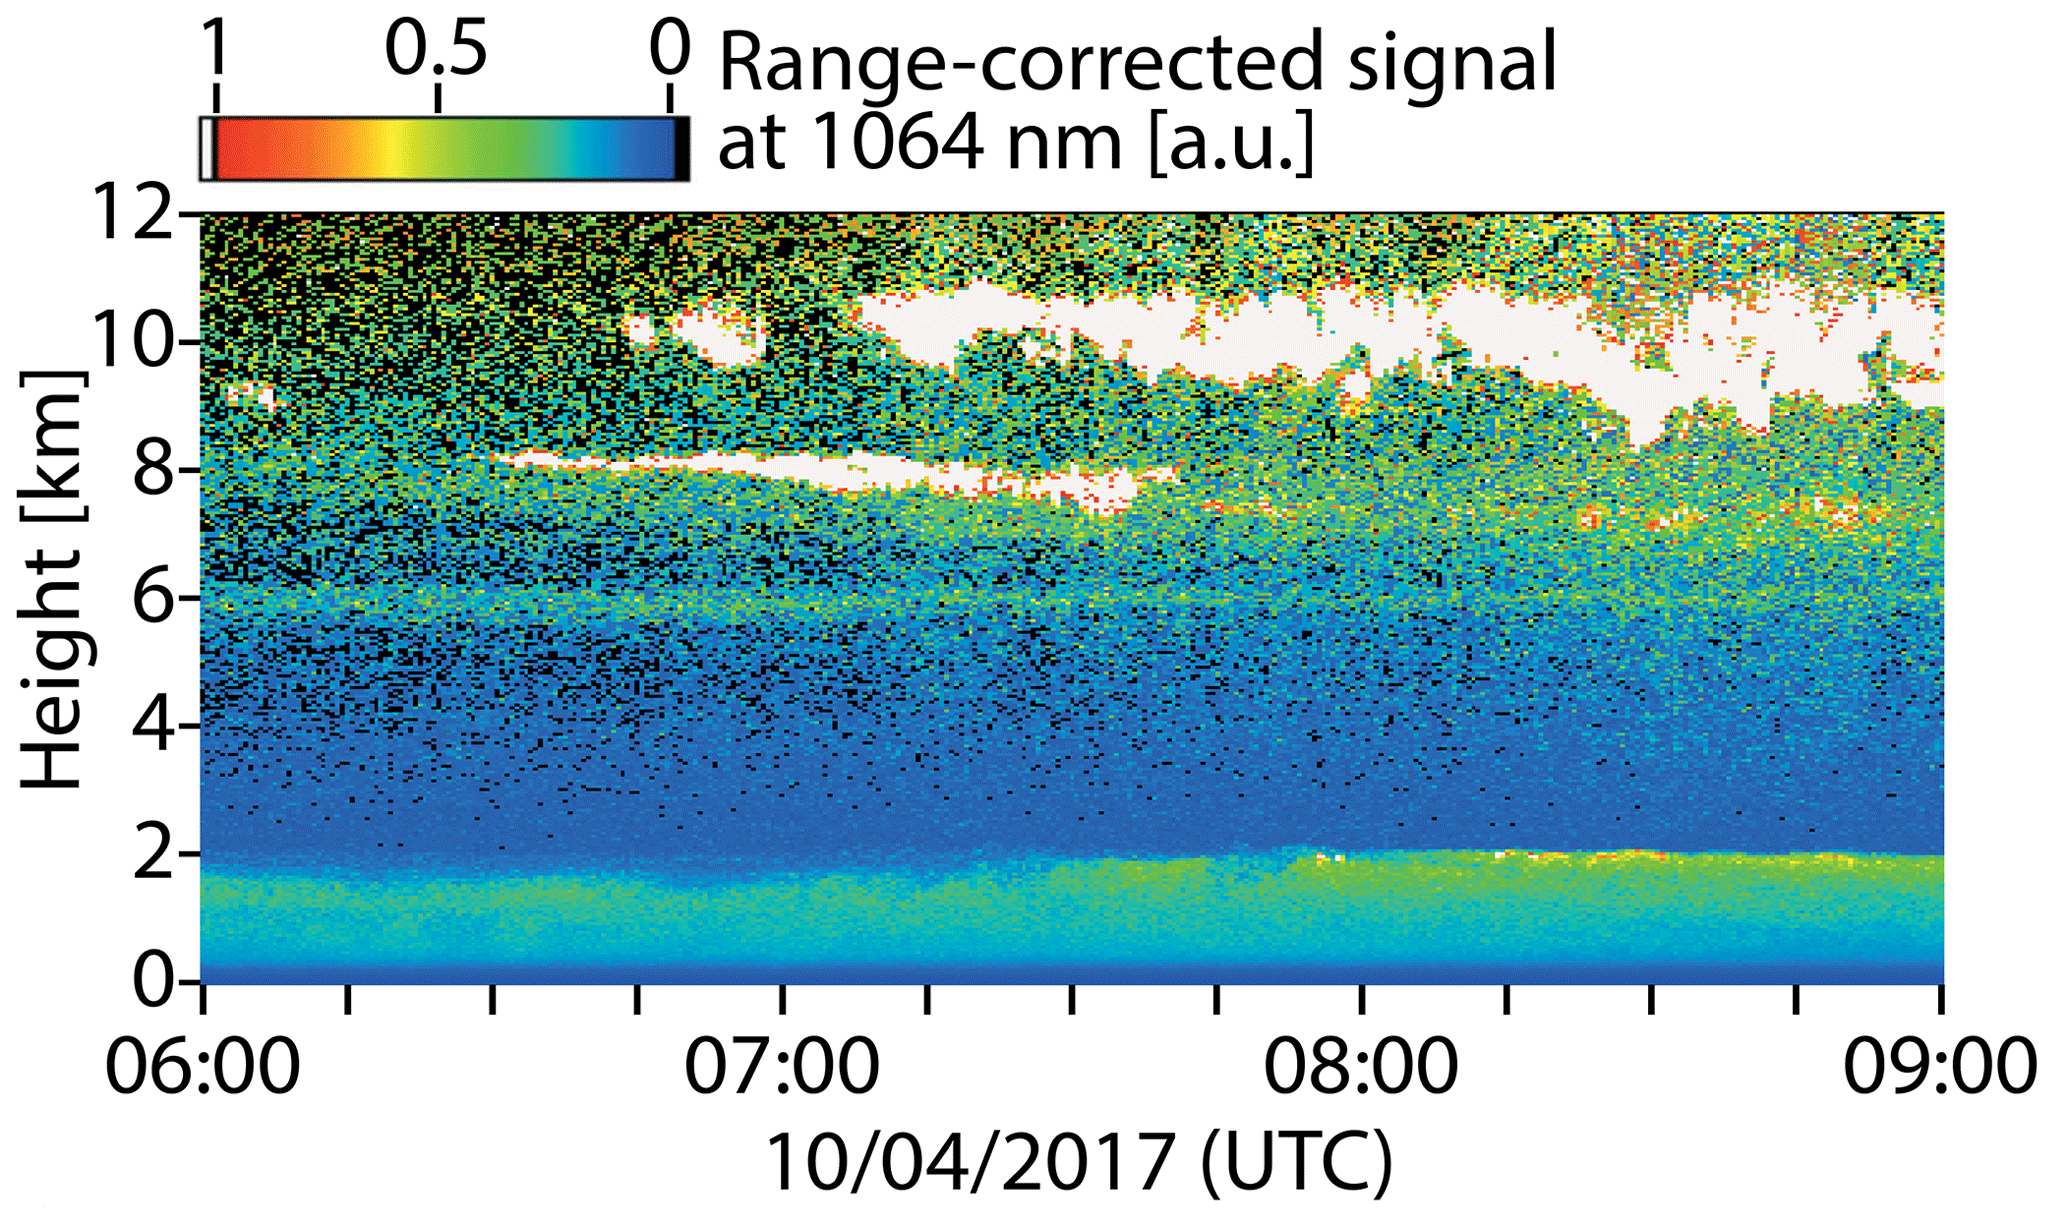
Figure 7Development of a thin cirrus at 8 km height at 06:30 UTC on 10 April 2017. The thin cirrus layer was embedded in Saharan dust. An extended cirrus field is visible from 9 to 11 km height. The polluted boundary layer reached to about 2 km height. Ranged-corrected 1064 nm lidar signals are shown with 7.5 m and 30 s resolution.
In the following Sect. 5.1–5.3, we present and discuss three cases of cloud evolution with a focus on the ICNC–INPC relationship. These three closure experiments cover the deposition nucleation as well as the immersion freezing regime. In the framework of these closure studies, we further check the quality and applicability of the different INPC parameterization schemes listed in Table 1. All clouds developed in pronounced Saharan dust layers. Case 1 (10 April 2017) deals with a rather thin and shallow cirrus layer that began to form at 8 km height at −35 to −36 ∘C in a pure Saharan dust layer (not mixed with pollution). Deposition nucleation is the prevalent ice nucleation mode at these temperatures. In Sect 5.2, we then discuss a long-lasting cirrus event (case 2, 17 March 2015) observed in the upper part of the troposphere. Cloud top temperatures were −55 to −57 ∘C. Homogeneous as well as heterogeneous freezing processes can take place at these cold conditions in dusty air. Finally in Sect. 5.3 (case 3, 8 March 2015), immersion freezing in an altocumulus layer developing in polluted Saharan dust at heights around 5.5–6 km and temperatures of −19 to −22 ∘C is discussed. The altocumulus developed in a mixture of desert dust and continental pollution particles.
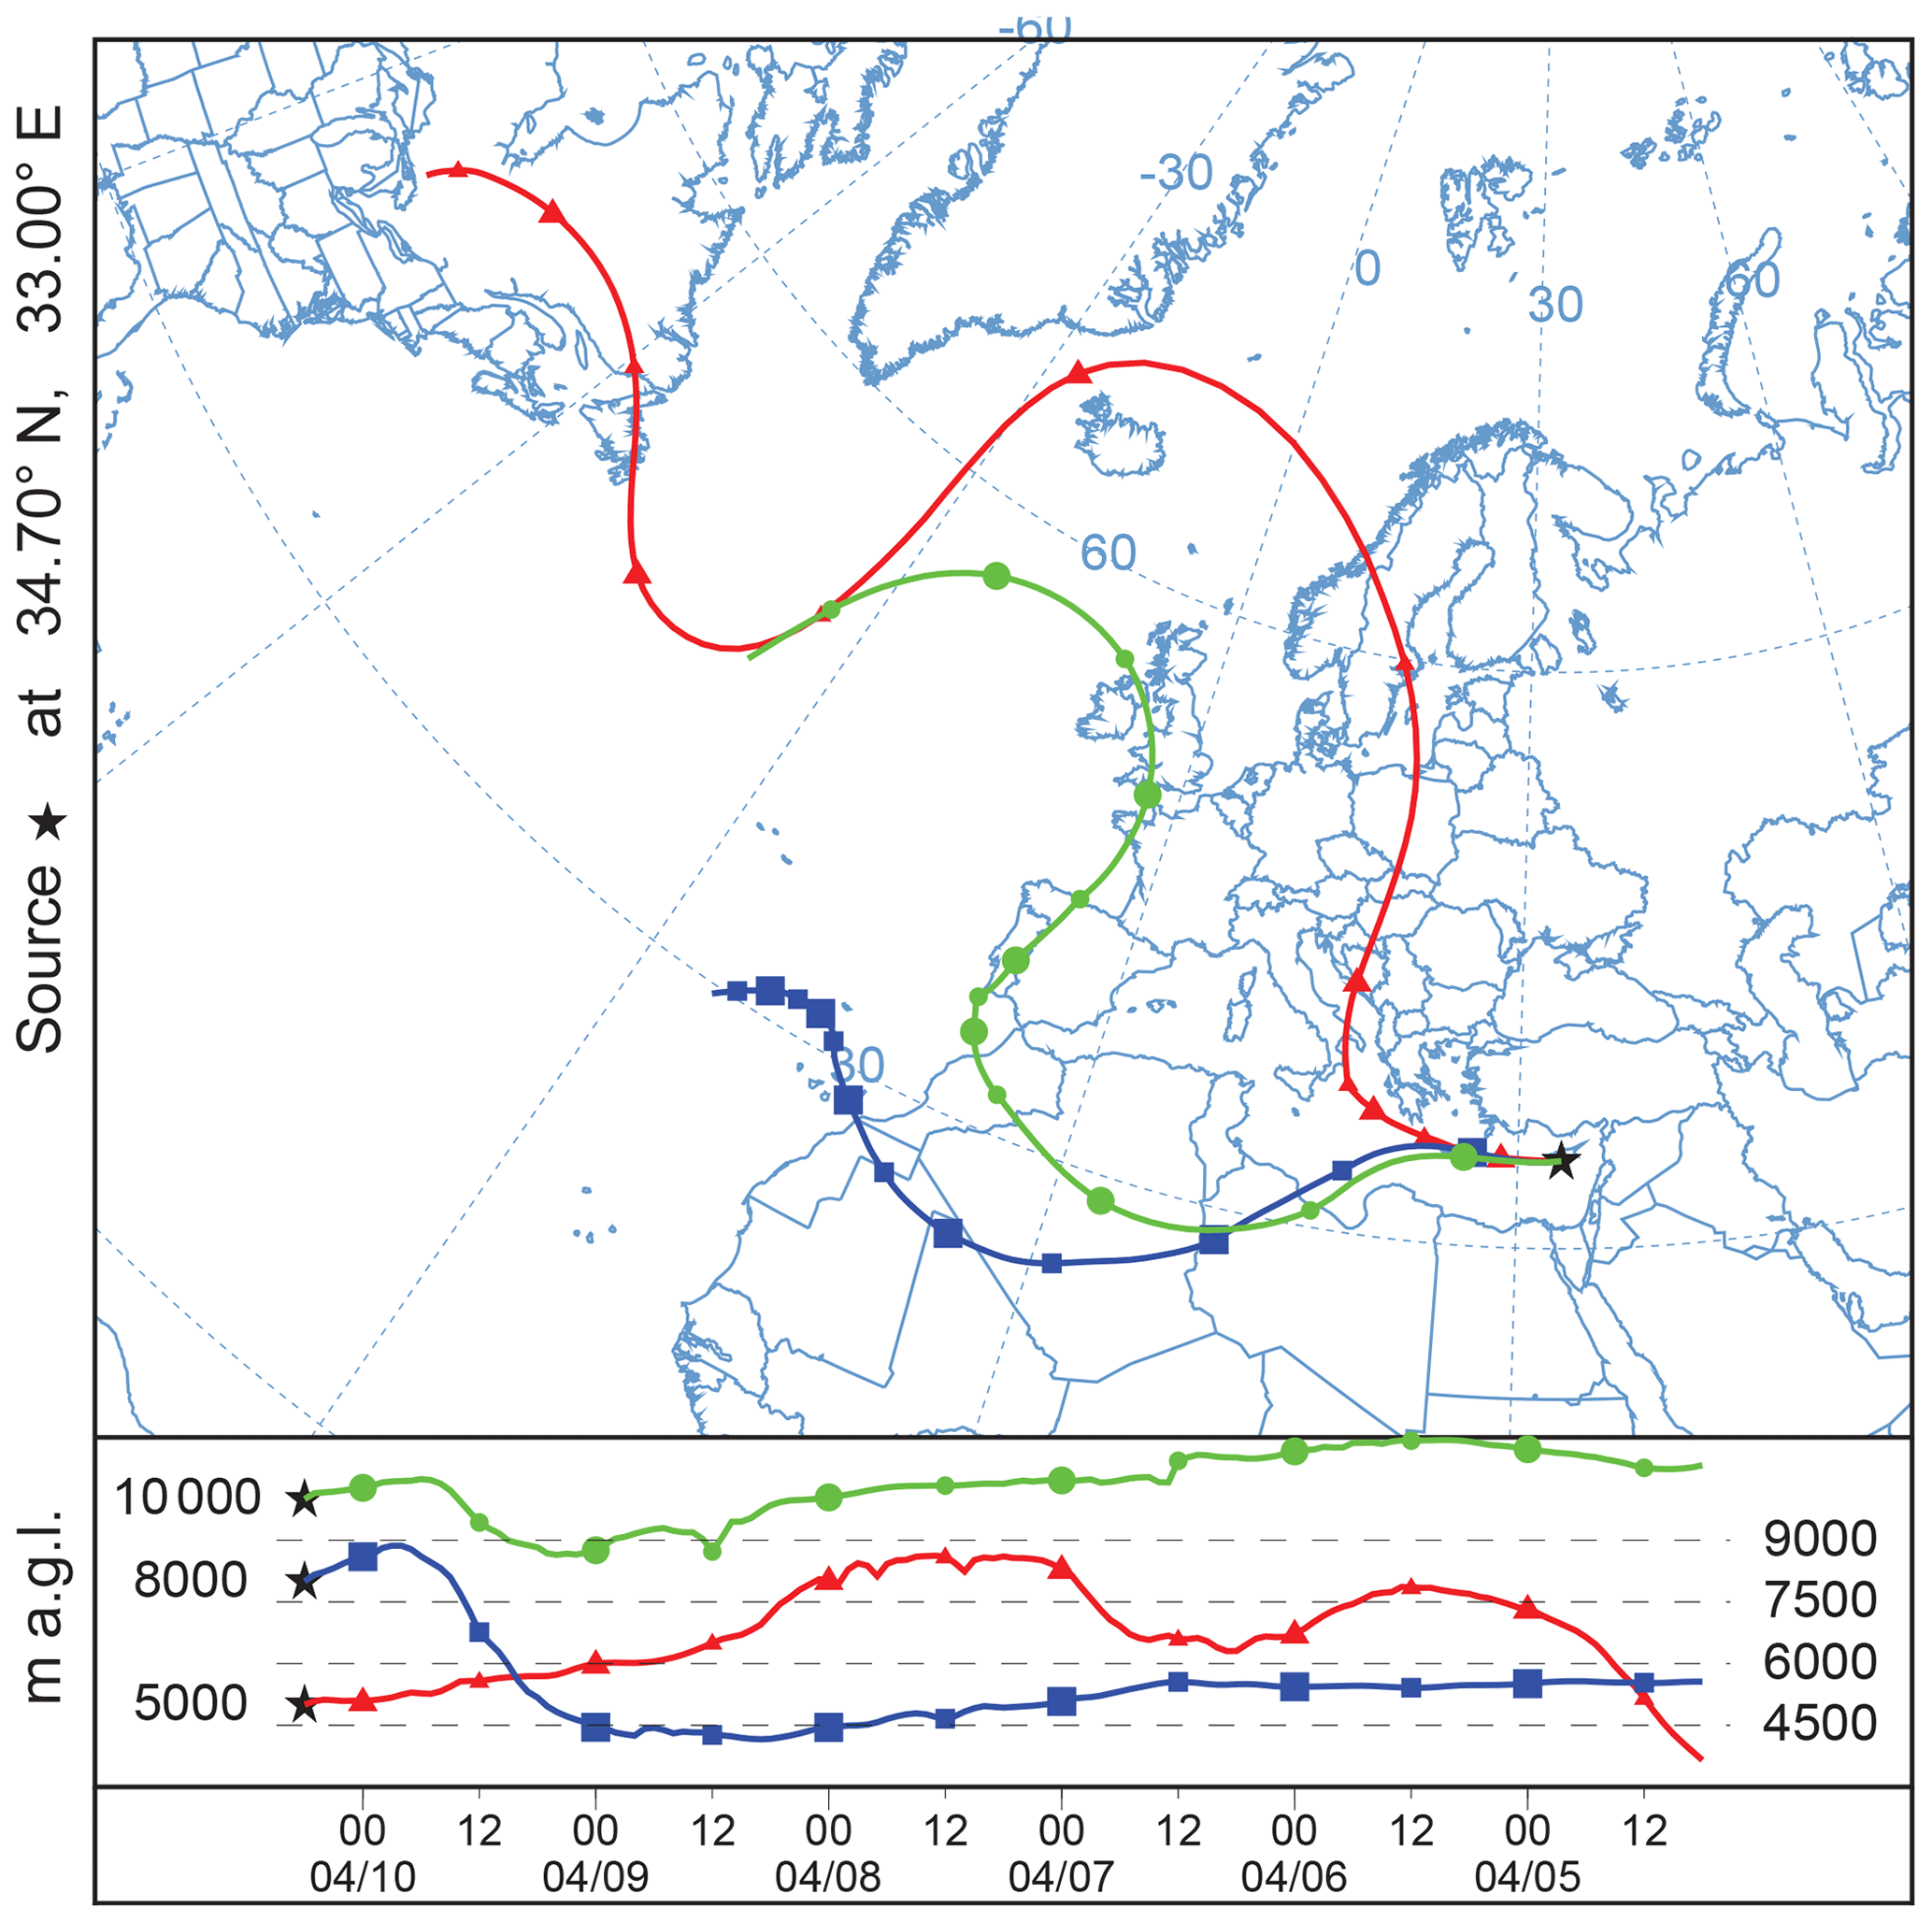
Figure 8HYSPLIT (Hybrid Single Particle Lagrangian Integrated Trajectory) backward trajectories for 6 d arriving at Limassol, Cyprus, on 10 April 2017 at 06:00 UTC. The backward trajectories are computed with the HYSPLIT model (HYSPLIT, 2019; Stein et al., 2015; Rolph et al., 2017) and are based on GDAS0.5 meteorological fields. Arrival heights are 5000 m (red, clear air), 8000 m (blue, Saharan dust layer), and 10 000 m (green, dust free upper troposphere). See Fig. 7 for comparison.
5.1 The 10 April 2017 case study: evolution of a very thin ice cloud layer in Saharan dust
Case 1 is shown in Fig. 7 and was observed in the early morning of 10 April 2017 during the CyCARE campaign. Ideal observational conditions for an in-depth INPC–ICNC closure study were given. The full LACROS equipment was running and a radiosonde was launched at 05:50 UTC (08:50 local summer time) and reached heights around 8 km just a few minutes before ice formation started. INPC values at cloud level could be estimated in cloud-free dusty air right before first cirrus traces crossed the lidar field site. A thin ice cloud embedded in Saharan dust developed at 8–8.2 km height at 06:30 UTC. Temperatures were −35 to −36 ∘C at these heights. The particle depolarization ratio indicated ice crystal backscattering from the beginning of cirrus formation (the absence of any liquid phase) so that deposition nucleation or PCF (because this would also occur without a bulk liquid phase being detected) was obviously exclusively responsible for ice crystal nucleation. The available INPs thus determine the maximum number of observable ice crystals.
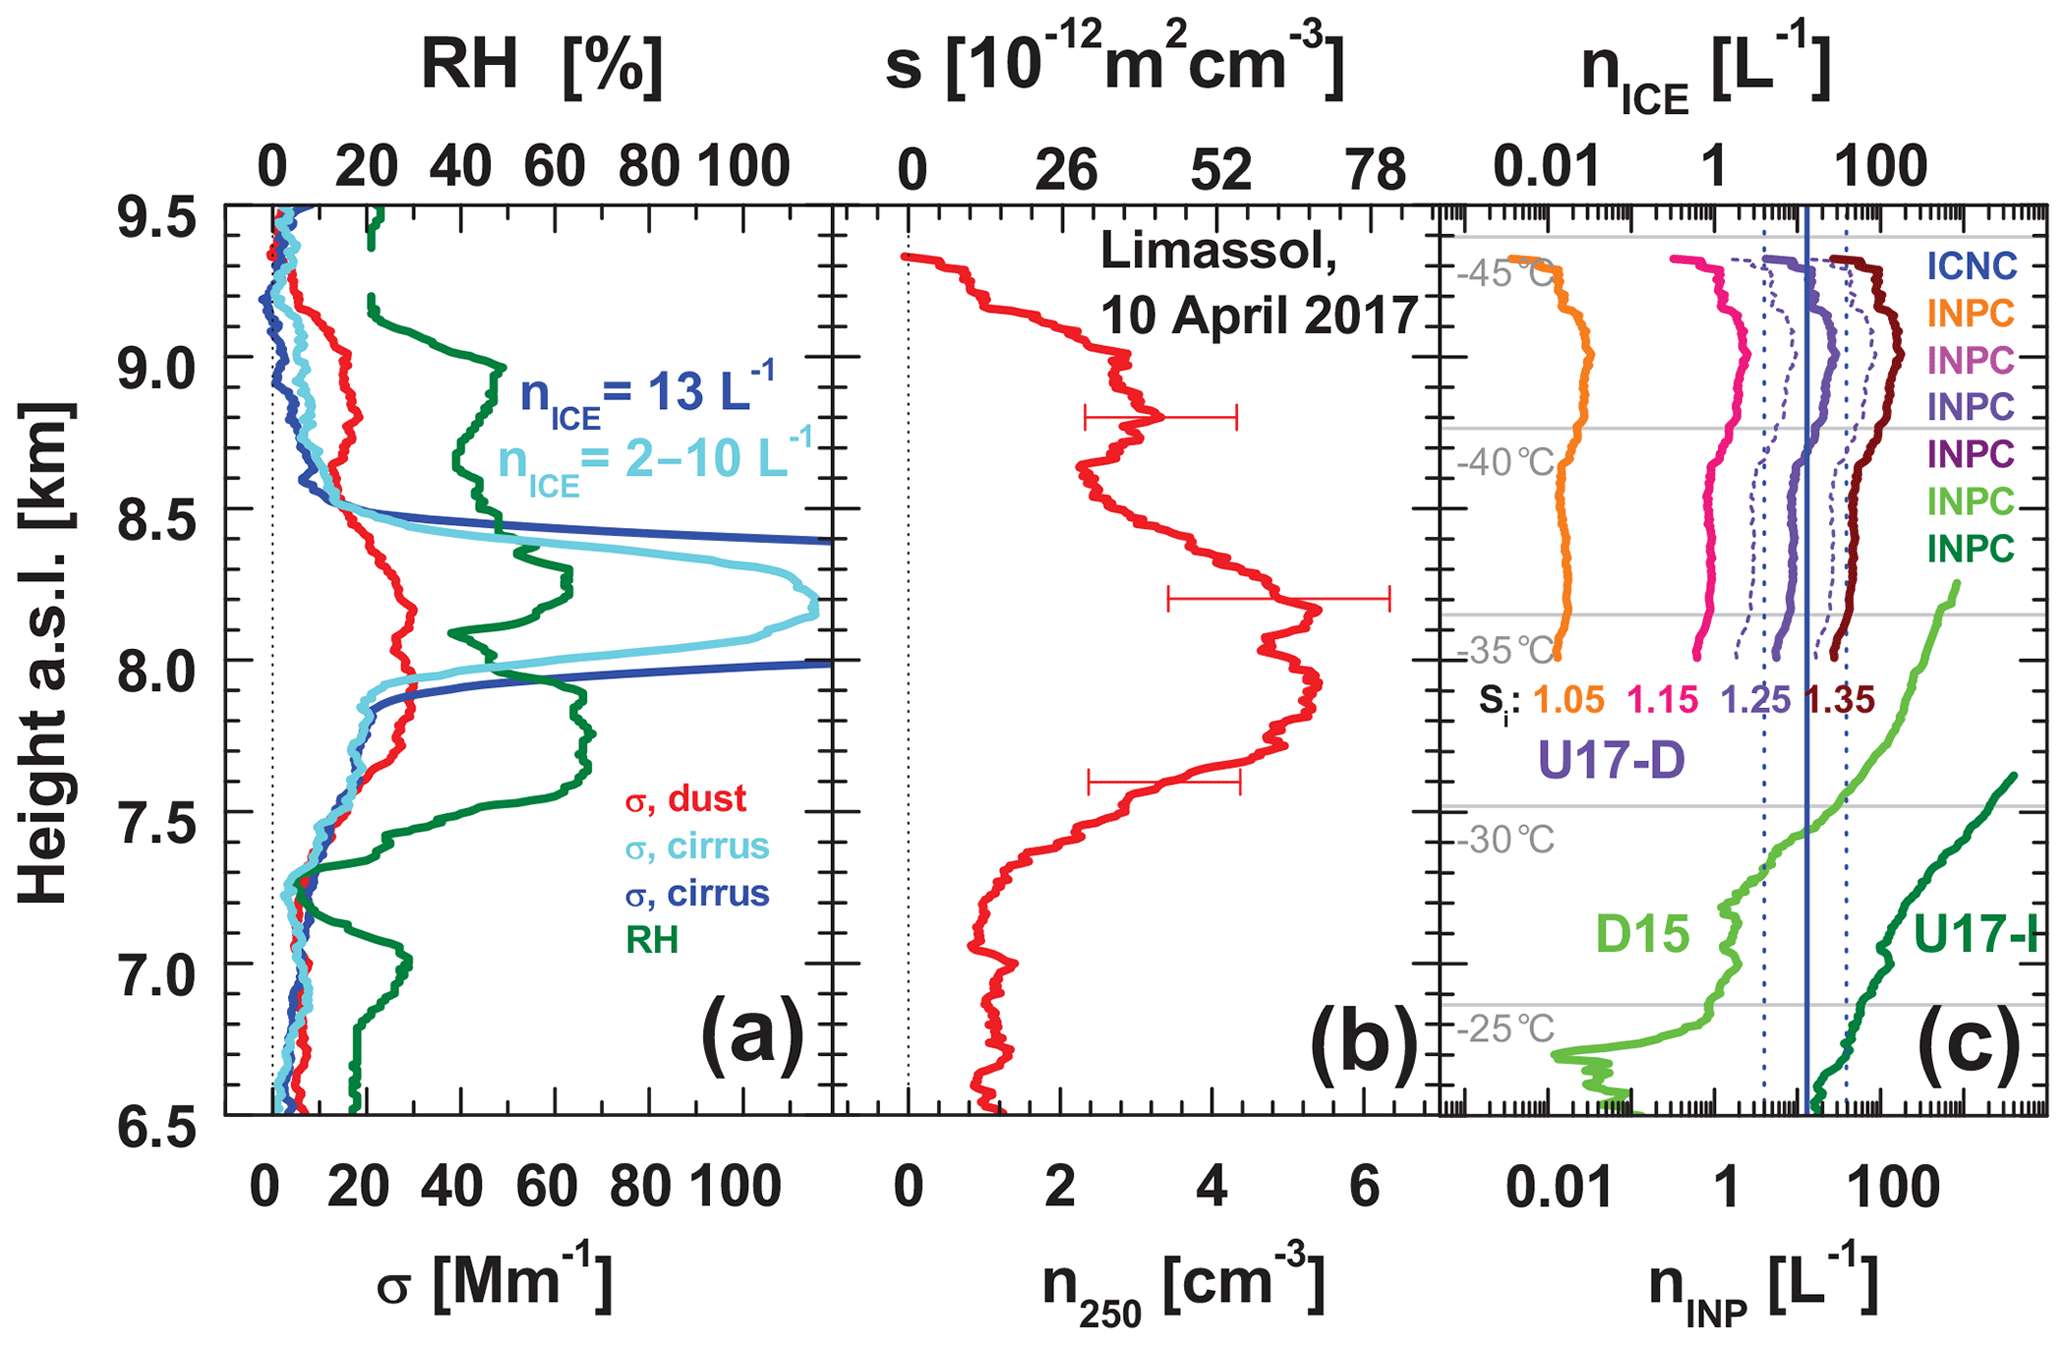
Figure 9Cirrus INPC–ICNC closure study based on LACROS observations at Limassol, Cyprus, on 10 April 2017 (see Fig. 7) during CyCARE. (a) Dust extinction coefficient (06:10–06:30 UTC mean), ice crystal extinction coefficient (light blue, 06:35–06:42 UTC mean; blue, 06:48–06:57 UTC mean; cirrus from 8 to 8.5 km height), relative humidity (RH, radiosonde, launch at 05:50 UTC), estimated ICNC (nICE; light blue for the 06:35–06:42 UTC time period; blue for the 06:58–07:05 UTC time period), (b) dust particle number concentration n250,d (considering large particles with a radius of > 250 nm only) and surface area concentration sd (06:10–6:30 UTC mean values), and (c) INPC (nINP, 06:10–6:30 UTC mean) determined by using the deposition nucleation U17-D(d) parameterization for four different ice supersaturation values (Si from 1.05 to 1.35). The uncertainty range of each of the four deposition nucleation INPC profiles is indicated for Si=1.10. For comparison, also immersion freezing INPC profiles estimated by using the U17-I(d) (dark green) and D15 INP parameterizations (green, see Table 1) are shown. The ICNC value of 13 L−1 (see the number in a) is shown as the vertical blue line with the uncertainty range as the vertical blue dashed lines.
The backward trajectories in Fig. 8 suggest that the air masses that reached Limassol at 8 km height crossed the Sahara at comparably high altitudes of 4.5–5 km height. Marinou et al. (2017) showed that dust layers over northern Africa (Algeria and Libya) reach up to 6 km throughout the year, except during the main winter months (December–January) so that significant dust uptake is always possible during the spring months as long as the trajectories are below 6 km over northern Africa.
In Fig. 9, the main closure results are summarized. A pronounced dust layer was present from 7.2 to 9.3 km height at times before the cirrus developed (06:10–06:25 UTC) and showed 532 nm particle extinction coefficients of about 25 Mm−1 at 8 km height (see Fig. 9a). The particle depolarization ratio (not shown) was around 0.3 in the dust layer. This means that dust particles dominated and contributions from non-dust aerosol particles to the overall particle lidar backscatter return signals were negligible. The radiosonde RHw indicated a moist layer which coincided with the dust layer. The air in the middle troposphere (at 5 km height) and at cirrus level (10 km) was dust free according to the trajectory analysis in Fig. 8 and our lidar observations.
The dust extinction coefficients were then converted into number concentrations of large particles, n250,d, and the surface area concentration sd. At the cloud level, the peak n250,d and sd values were close to 5500 L−1 and around m2 cm−3, respectively (Fig. 9b). By applying the INPC parameterization schemes U17-I(d), U17-D(d), and D15 (see Table 1) with n250,d, sd, the corresponding GDAS1 temperature profiles as inputs, and the assumed values of the ice supersaturation Si from 1.05 to 1.35 in the U17-D(d) computations, we obtain the INPC profiles shown in Fig. 9c. The immersion freezing INPC profiles (although not relevant here) are included in the figure to visualize the high INP numbers of >1000 L−1 if immersion freezing would have been the dominant ice nucleation mode. As we will discuss below, such high numbers are in strong contradiction with the estimated ICNC that were clearly <100 L−1 as shown in Fig. 9c as well.
In the second part of the closure experiment, we estimated the ICNC in the thin ice cloud. In Fig. 10, the observations with the vertically pointing Doppler lidar and Doppler radar are shown. The Doppler lidar detected the first ice crystals around 06:30 UTC (see Fig. 10d) in agreement with the more powerful Polly observations (with higher signal-to-noise ratios) shown in Fig. 7. The first significantly enhanced attenuated backscatter values were recorded about 5–7 min later (see Fig. 10a). Vertical velocities were positive (upward motion) and in the range of 0–0.5 m s−1 around 06:30 UTC as the Doppler lidar measurements revealed and triggered the first ice nucleation events. A pronounced region with positive vertical velocities, indicating a well-organized updraft, then occurred between 06:50 and 06:57 UTC. This lifting intensified ice crystal nucleation and growth. Afterwards a pronounced area with descending particles became visible, especially in the Doppler radar observations (Fig. 10c).
This time period from 06:57 to 07:05 UTC was used to estimate the ICNC following the method described in Sect. 4.2.2. The analysis yielded a mean crystal terminal velocity of 0.29 m s−1 and an ICNC of 13 L−1 (as given in Fig. 9a and c). The ice crystal extinction coefficient peaked at 710 Mm−1 (not shown, in the case of the blue cirrus profile in Fig. 9a). The cirrus optical thickness was 0.02–0.05 (06:35–06:48 UTC) and then 0.1–0.2 (06:48–07:07 UTC). An overview of all ICNC and INPC analysis products for 10 April 2017 is given in Table 2. Taking an uncertainty of a factor of 3 into account, the ICNC was in the range of 4–39 L−1.
The 35.5 GHz cloud radar (8.5 mm wavelength) provided useful reflectivity and Doppler information, caused by growing ice crystals, but this did not happen before 06:52 UTC. During the initial phase (06:30–06:50 UTC) the cirrus remained invisible for the radar (see the light-blue profile in Fig. 9a with a peak ice extinction coefficient of 115–120 Mm−1). Our simulations with the cirrus information obtained from the Polly and Doppler lidar observations and by assuming a radar reflectivity value (clearly below the detection limit) reveal that the ICNC was probably in the range of 2–10 L−1 before 06:50 UTC. Here, we used the approach described in Sect. 4.2.1. However, we cannot fully exclude that a rather narrow ice crystal spectrum with crystal sizes of 10–20 µm was present at the beginning of the cirrus formation so that the ICNC was as high as 100–200 L−1. However, such high numbers of the ICNC would be in contradiction with the lidar-based INPC estimates of <50 L−1 as discussed above and shown in Fig. 9c.
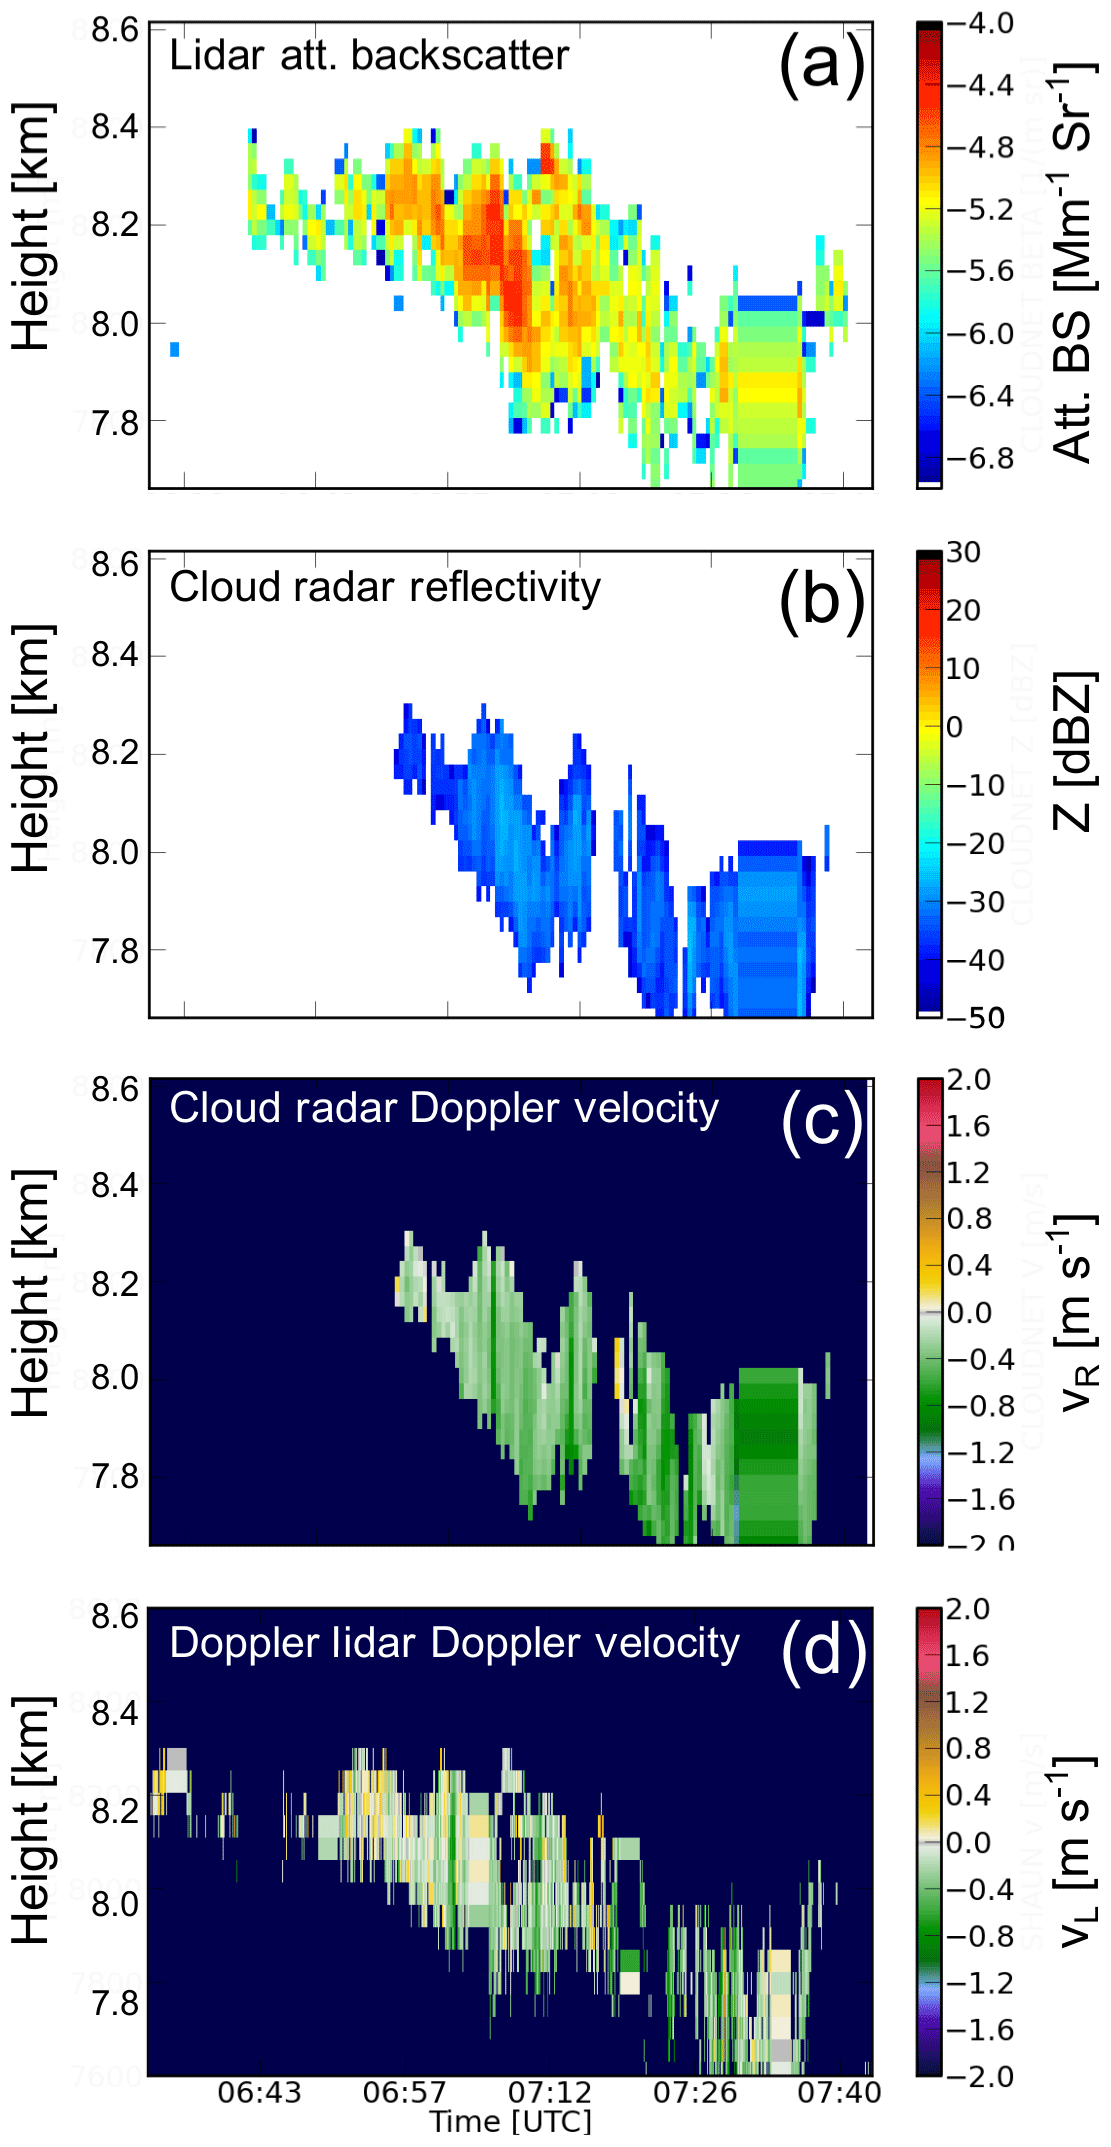
Figure 10Evolution of a thin cirrus layer on 10 April 2017 (see also Fig. 7) as observed with Polly lidar in terms of (a) attenuated backscatter (at 532 nm), with cloud radar in terms of (b) radar reflectivity Z at 8.5 mm wavelength and (c) vertical velocity, vR, and Doppler lidar in terms of (d) vertical velocity vL.
As shown in Fig. 9a (light blue curve, 06:35–06:42 UTC) the thin cirrus layer developed in the center of the dust layer. No indication of a strong lifting of the Saharan air mass and rapid growth of the nucleated ice crystals and subsequent evolution of fall streaks were visible within the first 20 min (06:30–06:50 UTC) of the evolving ice layer (see Fig. 7). It seems that the ice supersaturation level Si for the initiation of heterogeneous ice nucleation was slowly reached so that ice crystals formed, but then Si decreased again towards the ice saturation level (Si=1.0) because of water vapor deposition on the nucleated ice crystals, and, as a consequence, strong growth of ice crystals and the formation of a virga zone were not possible. Virga were absent during the first 20 min of cloud evolution.
Regarding the required ice supersaturation conditions, we assume that large-scale lifting and advection of moist air was responsible for the evolution of the cirrus layer at 8 km height. The radiosonde measured a relative humidity over water of 63 % at 8.2 km height at about 06:30 UTC, obviously in clear air, i.e., before cirrus formation started. As can be seen in Fig. 9c, closure between the ICNC of 13 L−1 (or from 4 to 39 L−1) in the developing cirrus layer and the INPC at the cloud top of 8.4–8.5 km is obtained for ice supersaturation values around 1.2–1.25 (or RHi of 120 %–125 %) which corresponds to RHw of about 90 %–95 % at temperatures of −35 to −36 ∘C. It is interesting to note that Roberts and Hallett (1968) and Schaller and Fukuta (1979) found in laboratory studies more than 40 years ago that deposition nucleation occurs when Si exceeds 1.2. This finding is in good agreement with our observation and the applied U17-D INP parameterization. Nevertheless, according to Fig. 9c deposition nucleation can occur at any RHi>100 % and Si>1.0 as already found earlier (Mangold et al., 2005; Kanji and Abbatt, 2006).
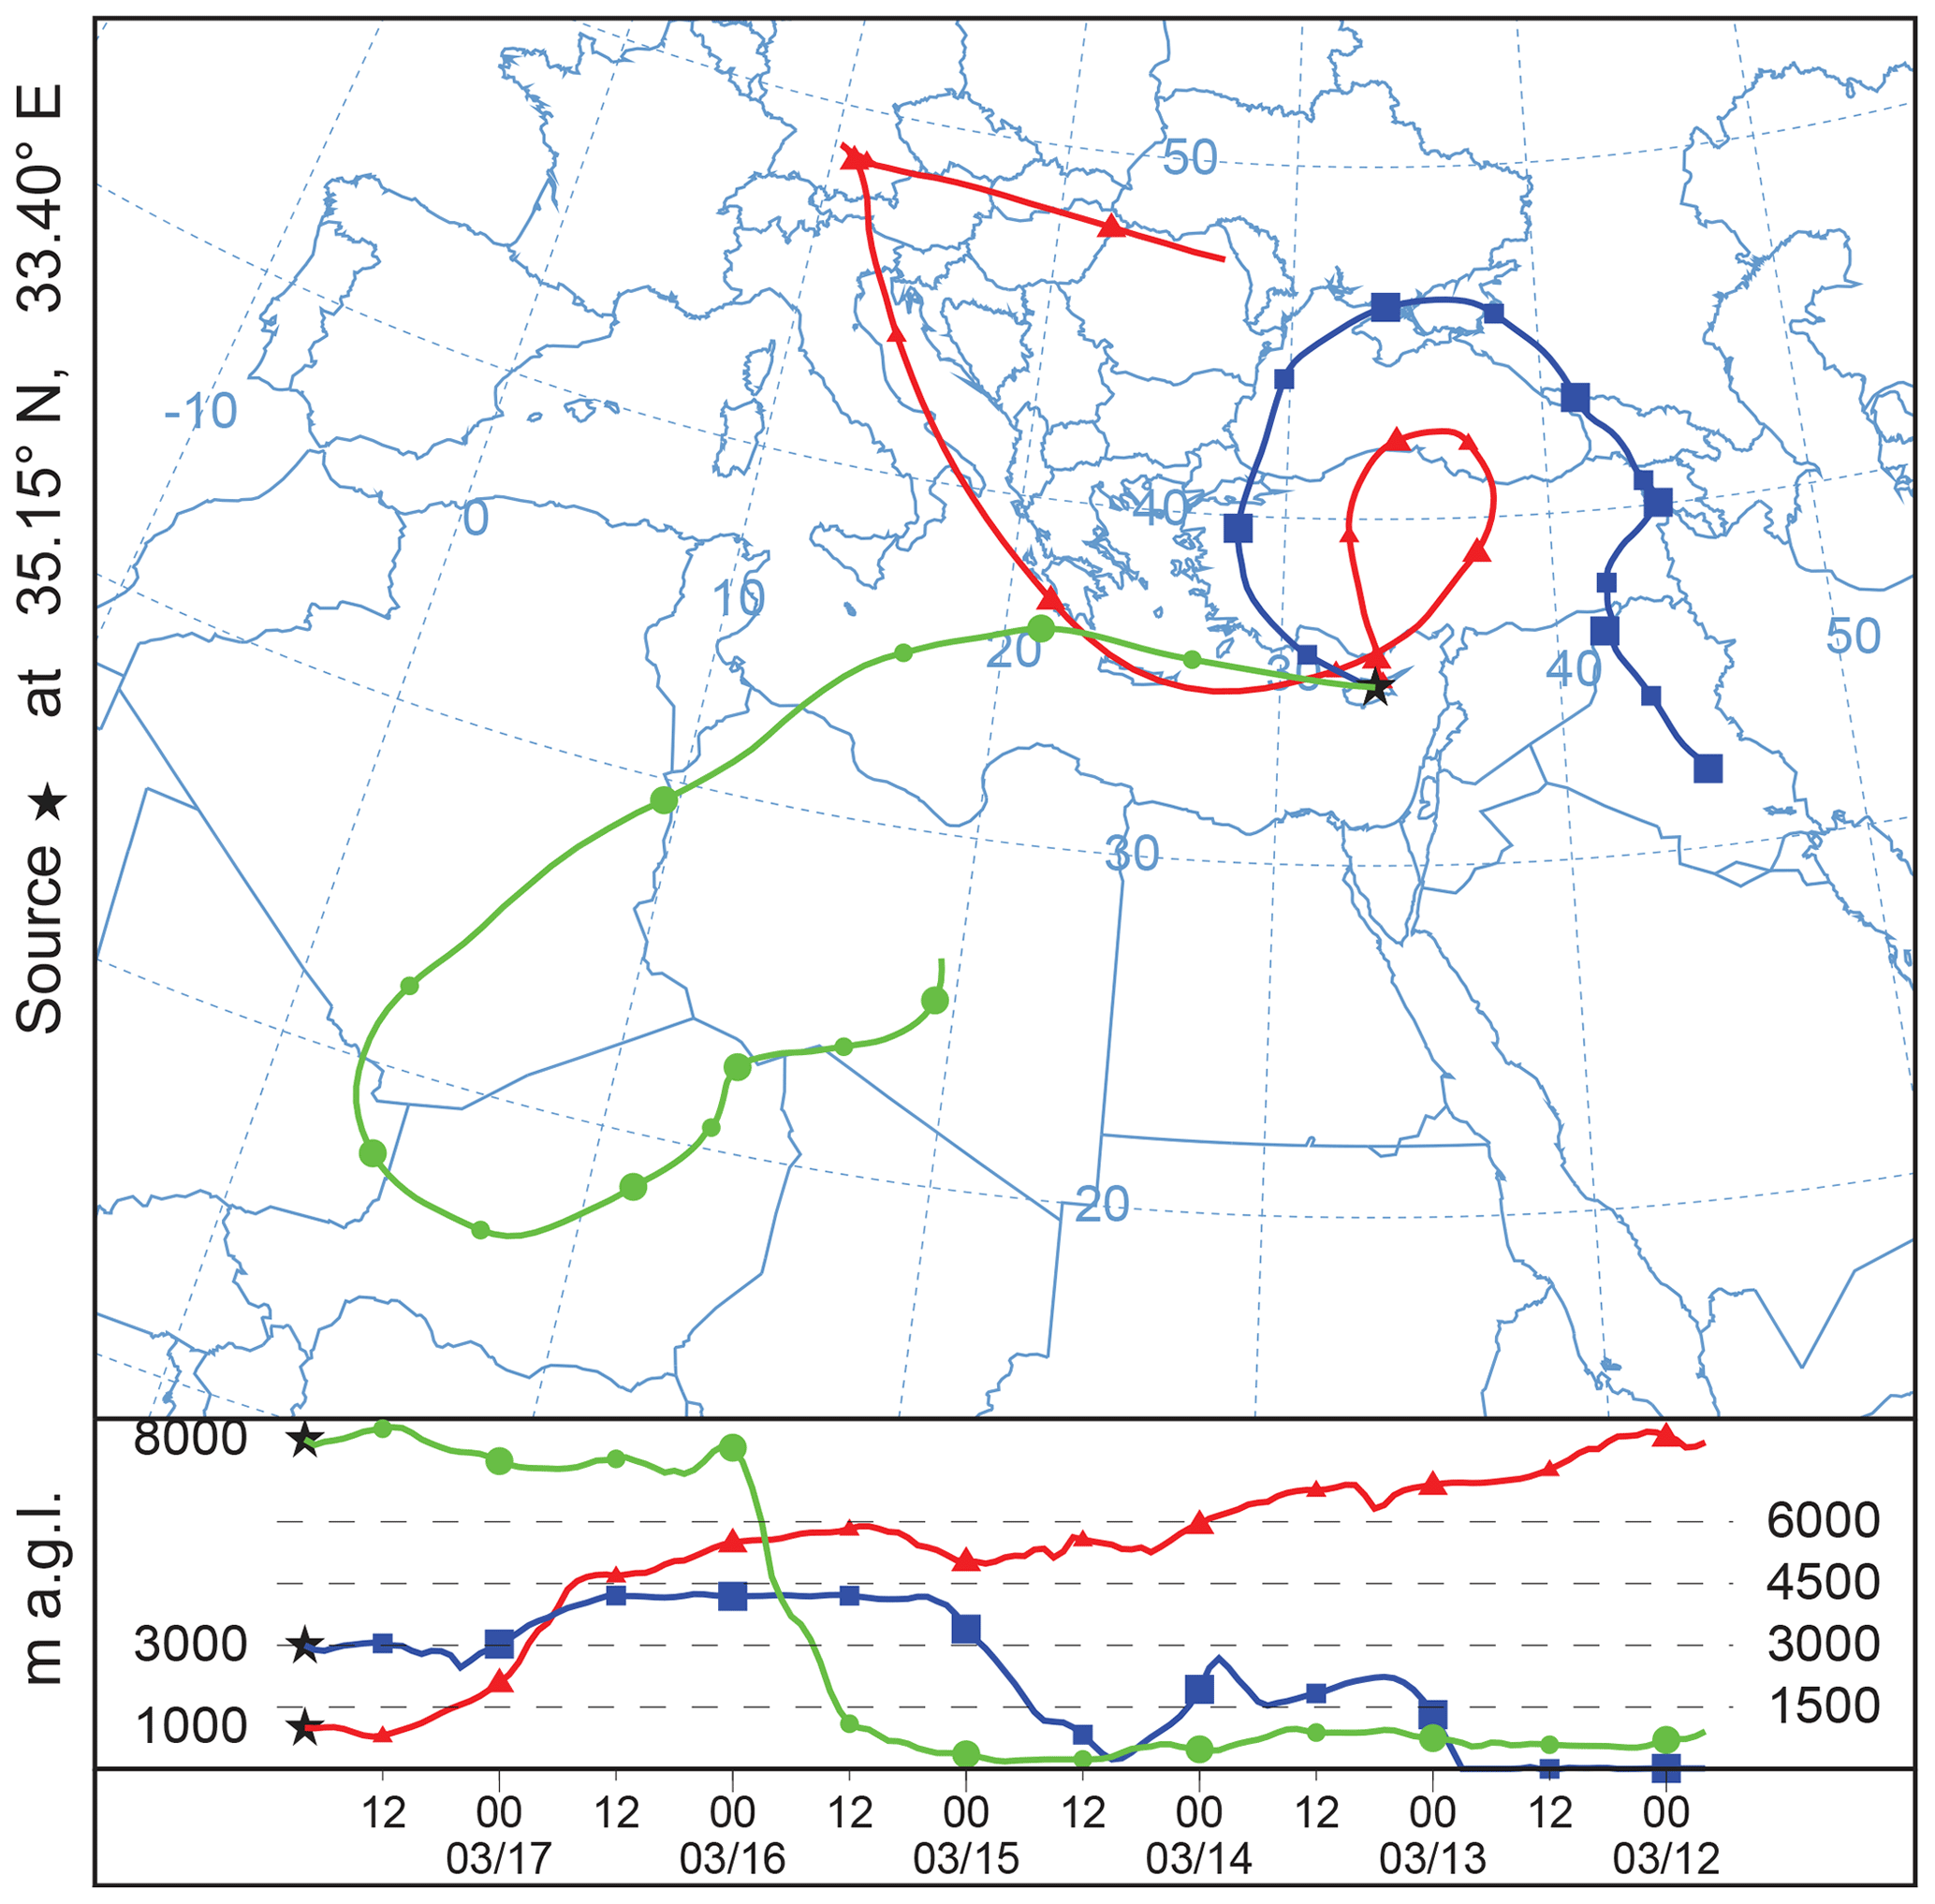
Figure 11HYSPLIT backward trajectories for 6 d arriving at Nicosia, Cyprus, on 17 March 2015 at 20:00 UTC (see Fig. 5e and f). The computations are based on GDAS0.5 meteorological fields. Arrival heights are 1000 m (red, boundary layer), 3000 m (blue, Middle Eastern dust layer), and 8000 m (green, Saharan dust layer).
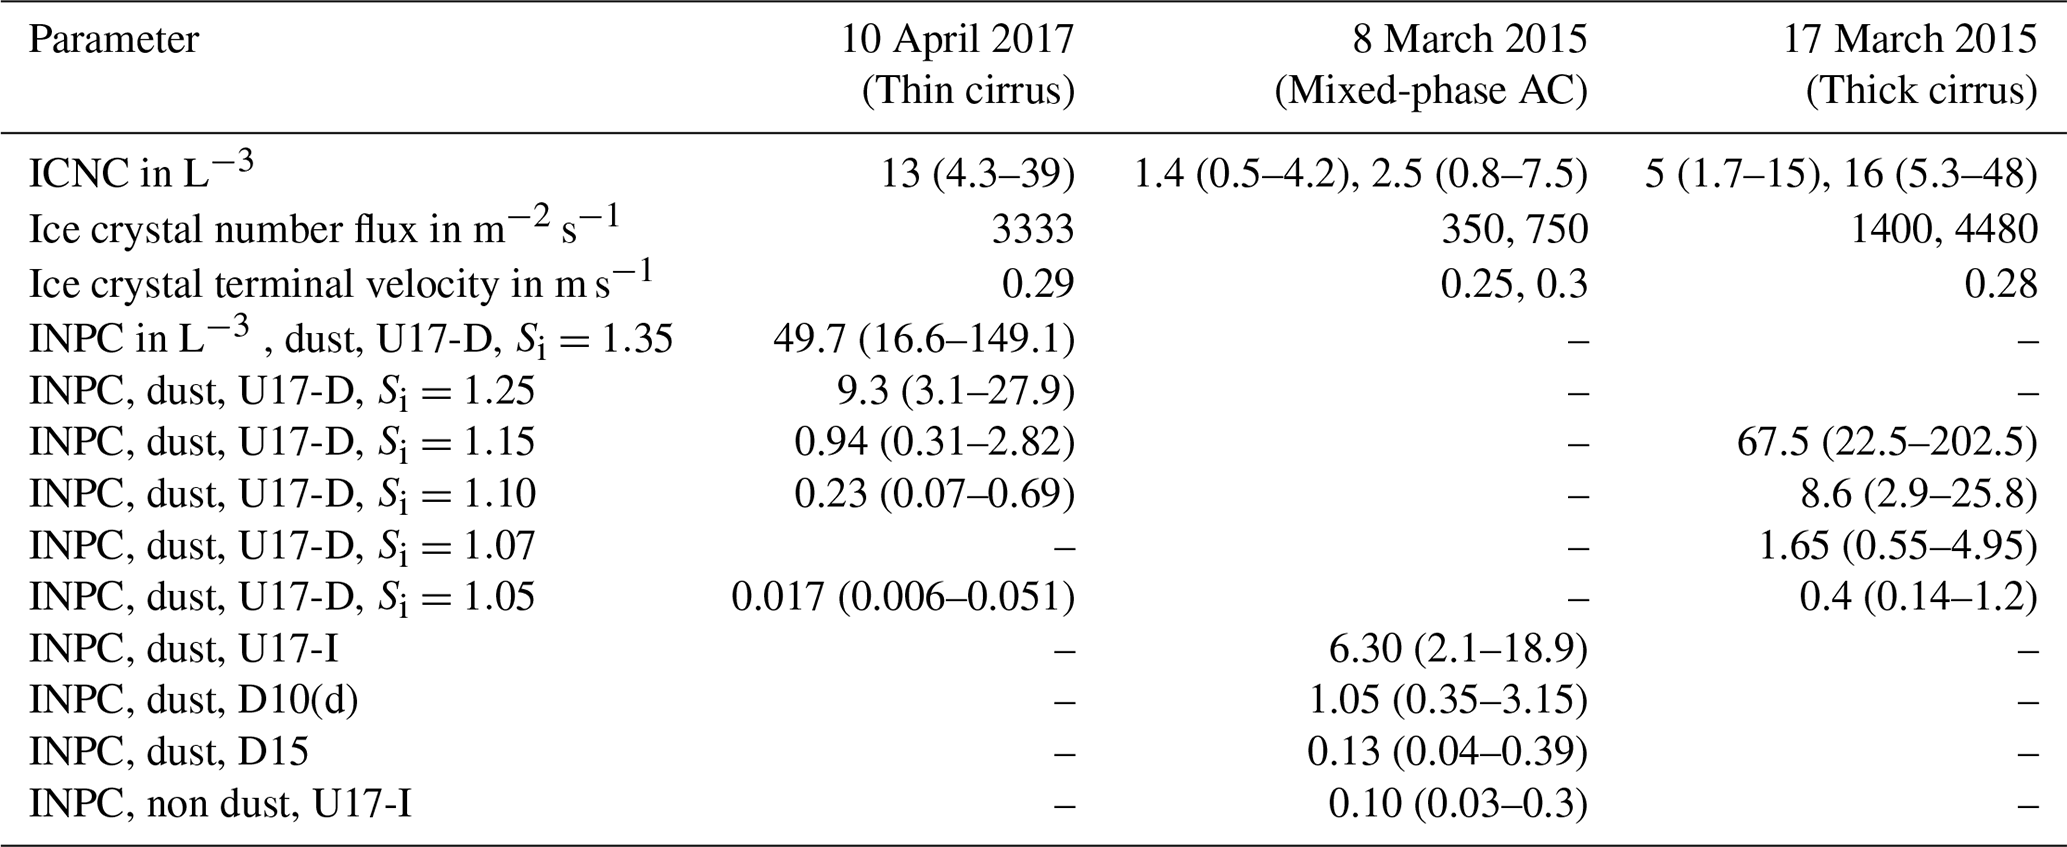
Table 2Overview of ICNC and INPC retrieval results for the three closure studies on 10 April 2017 (CyCARE) and 8 and 17 March 2015 (Cyprus-2015 campaign). The vertical ice crystal number flux is the most direct observation and was determined from the combined information of the terminal velocity of the falling ice crystals, the radar reflectivity, and the lidar backscatter coefficient. The ICNC is obtained from the ratio of the ice crystal number flux to the terminal velocity. The listed INPC values are maximum values found within the upper part of the cloud layer, i.e., at 8.4 km height on 10 April, at 9.8 km height on 17 March, and at 5.8 km height on 8 March 2015. All INPC and ICNC values are given with an uncertainty range of about a factor of 3 (in parentheses).
In this context, it should be mentioned (in order to avoid confusion about the apparently high INPC numbers outside the clouds, above 8.6 km in Fig. 9a) that the presented INPC profiles are given for fixed, height-independent ice supersaturation levels. In reality, these high supersaturation values typically only hold for those parts of the cloud layers (e.g., from 8.2 to 8.5 km height in Fig. 9) in which ice nucleation takes place. Outside the clouds (and below the ice virga zone) ice subsaturation (Si<1.0) is given so that the INPC is 0.
As a final remark, it should also be emphasized that the unknown vertical motions have a sensitive impact on the actually active INPs and thus on the success of the INPC–ICNC closure study. Even weak short-lived updrafts associated with the cooling of the air by 1–2 ∘C and a respective increase in ice supersaturation can easily increase the INPC by a factor of 2–3 (for temporally constant dust conditions).

Figure 12Evolution of a dust-infused baroclinic storm (DIBS) (Fromm et al., 2016) over eastern Algeria and the central Mediterranean Sea on 15 March (a–c), followed by the decay and dissolution of the anvil cirrus shield on 16 March (d–f) and its transformation into an active cirrus uncinus field extending from Crete to central Asia on 17 March 2015 (f–g). The lidar site at Nicosia is indicated by a yellow star. The Meteosat Second Generation (MSG) infrared 10.8 µm channel images were produced by the European Organization for the Exploitation of Meteorological Satellites (EUMETSAT).
The successful closure between the INPC and ICNC as given in Fig. 9c for Si=1.25 and an ICNC of 13 L−1 suggests also that the U17-D INP parameterization scheme is useful and allows for a trustworthy estimation of dust INPC from measured profiles of sd. This finding is corroborated by the study of Marinou et al. (2019) who also observed good agreement between the lidar-based INPC obtained by means of U17-D(d) and respective UAV-based in situ observations of deposition nucleation INPC during the Cyprus-2016 campaign.
5.2 The 17 March 2015 case study: long-lasting cirrus evolution in Saharan dust
The next closure study deals with cirrus formation in the upper troposphere. This case is shown in Fig. 5e and f and was measured during the Cyprus-2015 campaign (see Sect. 3.1). The ice cloud developed in the upper part of a Saharan dust layer. According to the backward trajectory analysis in Fig. 11, Saharan dust was lifted from heights close to the surface up to the upper troposphere over Africa 2 d before arriving over Nicosia. We observed the final phase of a complex and long-lasting cloud evolution event which started on 15 March 2015 over northern Africa. The particle linear depolarization ratio measured with lidar during cloud-free periods was again around 0.3 throughout the dust layer and indicated pure desert dust conditions. The trajectory analysis in Fig. 11 further reveals that the boundary layer aerosol was advected from Turkey and crossed Europe days before, whereas the dust layer from 2 to 6 km (see Fig. 5f) contained a mixture of dust from Iraq and continental pollution aerosol. Such complex mixtures and the layering of aerosols frequently occur over Cyprus.
This cloud case deserves a detailed discussion of the entire life cycle. A dust-infused baroclinic storm (a synoptic-scale dynamics driven storm) (Fromm et al., 2016; Caffrey et al., 2018) associated with vigorous convective motions within cloud towers was responsible for the uplift of large amounts of dust into the upper troposphere over the Sahara, observed with lidar later on over Cyprus. According to Fig. 12a several fronts crossed the desert areas of northwestern Africa from the west in the morning and afternoon of 15 March 2015. The DIBS developed over the desert areas of eastern Algeria from 18:00 to 24:00 UTC on 15 March 2015 (Fig. 12b). Dust lifting obviously occurred also before and after the main cloud convection period according to HYSPLIT backward trajectories in combination with our continuous lidar observations. The convective cluster with a large anvil cirrus on top moved northeastward and started to dissolve over the central Mediterranean Sea on 16 March 2015 at 03:00–06:00 UTC (Fig. 12c). The large anvil cirrus shield covering an area of approximately 600 km × 1200 km over the central and eastern Mediterranean is visible in Fig. 12d. The anvil cirrus deck weakened and then transformed into an active cirrus uncinus field which persistently generated new ice crystals and virga. This cirrus field extended from Crete to Tajikistan (as confirmed by our Polly lidar observations at Dushanbe, Tajikistan, in the afternoon of 17 March 2015), and thus over a distance of more than 3500 km (Fig. 12g). These cirrus uncinus structures were visible over Nicosia from about 07:00 UTC on 17 March 2015 to 15:00 UTC on 18 March 2015 as will be discussed below.
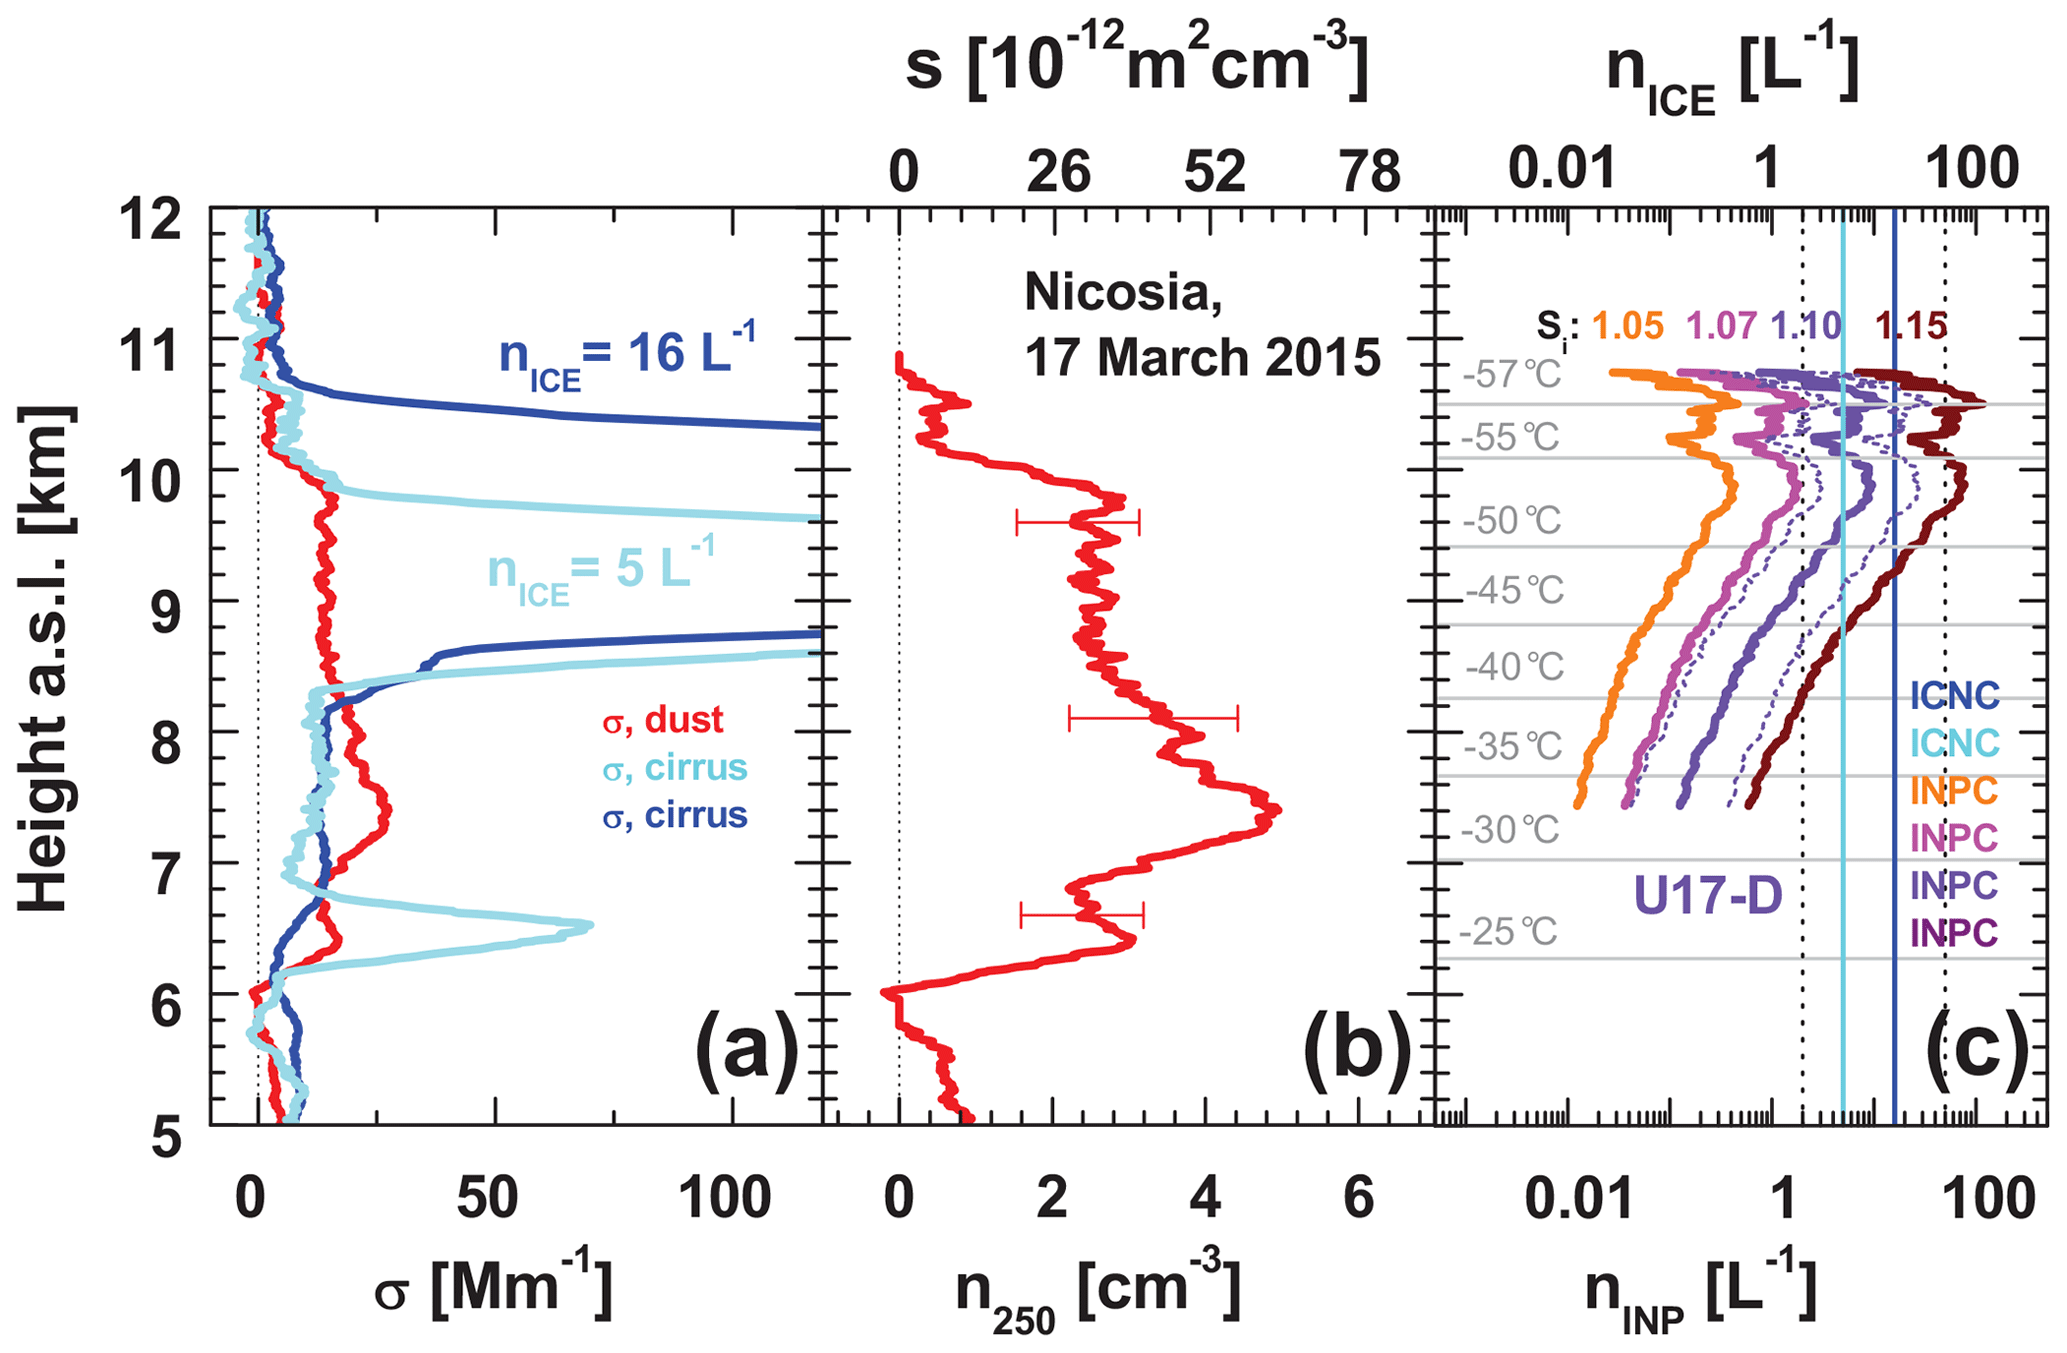
Figure 13Same as Fig. 9 except for a cirrus layer observed with lidar over Nicosia on 17 March 2015 (see Fig. 5e and f) during the Cyprus-2015 campaign. (a) Dust extinction coefficient (red, 23:05–23:30 UTC mean), ice crystal extinction coefficient (blue, 20:00–20:40 UTC mean, cirrus from 8.6 to 10.6 km; light blue, 22:15–22:19 UTC mean, cirrus from 8.4 to 9.8 km), and estimated ICNC (nICE for the 20:00–20:40 and 22:15–22:19 UTC periods); (b) dust particle number concentration n250,d and surface area concentration sd (23:05–23:30 UTC mean values); (c) INPC (nINP, 23:05–23:30 UTC mean) by using the U17-D(d) parameterizations for four different ice supersaturation values (Si from 1.05 to 1.15). The uncertainty range of each of the four profiles is indicated for Si=1.10 (violet thin dotted lines). The ICNC values (numbers in a) are shown as vertical light-blue and dark-blue lines with the overall uncertainty range as vertical black dashed lines.
Cirrus uncinus belongs to the synoptic cirrus category (Sassen, 2002). These ice clouds form in situ in the upper troposphere in response to a variety of weather disturbances. They typically form from the top down (i.e, ice crystal nucleation occurs at cloud top and subsequent sedimentation of ice crystals lead to an extended virga zone). The almost constant (non-descending) cirrus top height, observed over the whole day of 17 March 2015 with lidar, indicated an active ice cloud that continuously produced new ice crystals. Usually dissolving anvil cirrus fields descend with time (Strandgren, 2018). However, these clouds were visible in the satellite images until 18 March, about 3 d after the formation of the DIBS-related cloud complex over Algeria and did not descend according to our lidar observations. These long-living cirrus features were probably the result of favorable meteorological conditions (high humidity and the permanent occurrence of vertical motions) (Feng et al., 2012) in combination with the high dust load in the upper troposphere serving as an almost unlimited reservoir of INPs. Feng et al. (2012) reported that typical lifetimes of midlatitudinal anvil cirrus systems are <3 h in 50 % of observed cases; the majority shows lifetimes of <15 h. Here, we have an overall cirrus lifetime of 2–2.5 d, and thus all in all of 48–60 h. Note, that reduced cirrus lifetimes are usually assumed when heterogeneous (instead of homogeneous) ice nucleation dominates (see, e.g., Storelvmo et al., 2018; Gruber et al., 2019). This may indeed be the case in controlled seeding experiments or, more generally, in cases with a limited, depletable source of INPs.
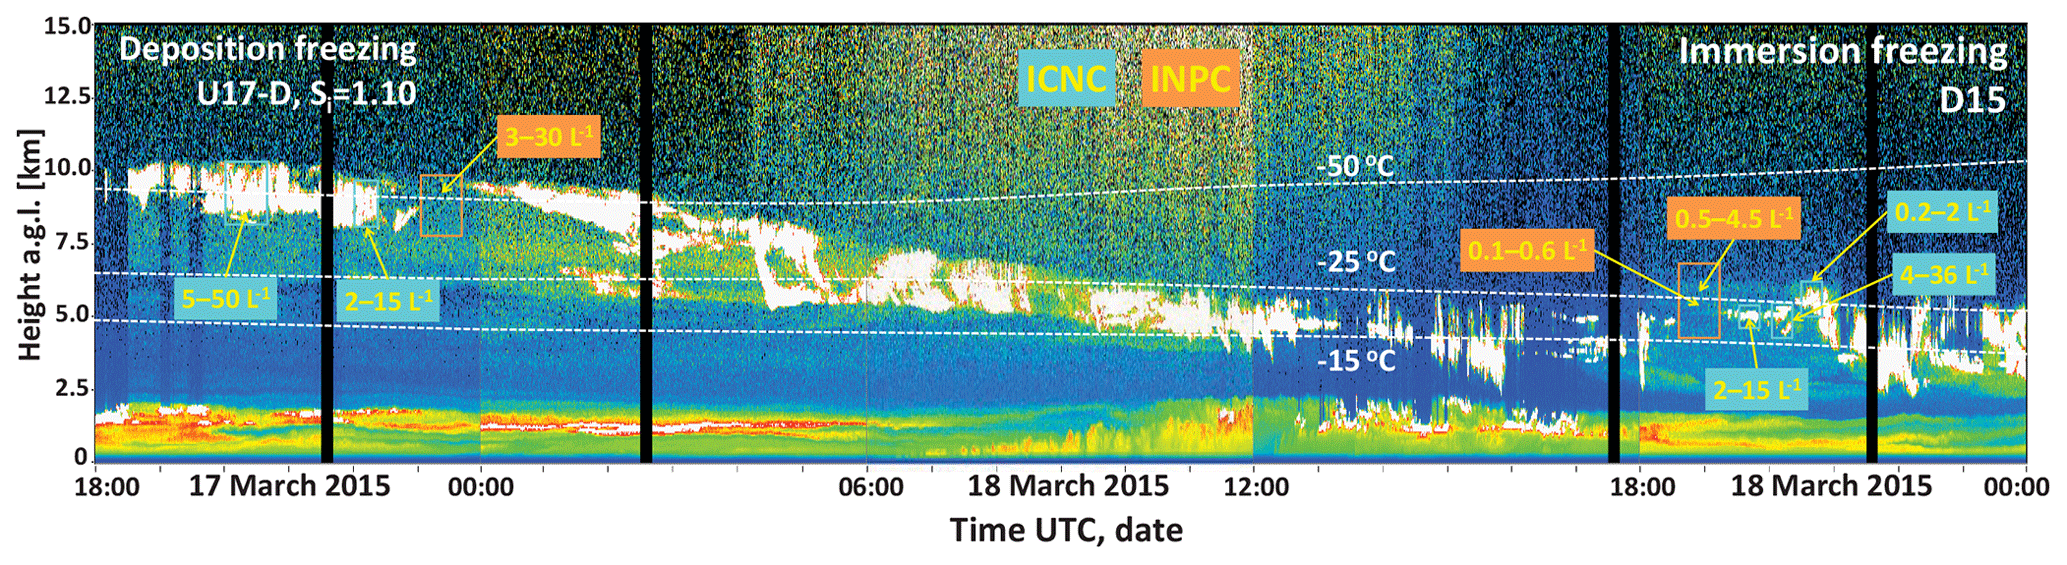
Figure 14Continuous cirrus and mixed-phase cloud observations for 30 h over Nicosia on 17–18 March 2015 (also shown in Fig. 5e, g, and i). The air mass from 5 to 10 km height was replaced (starting at great heights) by dust-free, dry air advected from Turkey and southern Europe between 02:00 and 11:00 UTC on 18 March, leading to the impression of a descending dust and cirrus layer. Several INPC and ICNC values estimated from the lidar observations are given as numbers determined for the indicated orange (INPC) and blue (ICNC) boxes. The deposition nucleation U17-I(d) parameterization is used on 17 March (at 9–10 km height for Si=1.1) and the immersion freezing D15 parameterization is applied in the evening data analysis on 18 March (at 5–6 km height). Dashed white lines show the GDAS1 temperature isolines with a 3 h resolution.
Following the terminology of Kuebbeler et al. (2014), our closure study in Fig. 13 describes ice nucleation at preexisting ice conditions. Strong supersaturation over ice is no longer possible at preexisting ice conditions, i.e., in a fully developed cirrus system, so that homogeneous freezing can be excluded in our closure analysis. Homogeneous freezing needs stable conditions regarding the lifting of air parcels over a long time period so that Si steadily rises and can finally reach values of 1.4–1.7. Number concentrations of nucleated ice crystals may be of the order of 1000 L−1 in the case of homogeneous freezing (Kärcher et al., 2006; Kuebbeler et al., 2014). However, at preexisting cirrus conditions, positive and negative vertical motions change frequently within the cirrus layer as a result of radiative cooling at the cloud top, turbulence, and entrainment processes and under the permanent influence of short-term gravity wave activity so that it is very likely that Si remains below 1.2. At these conditions, we assume that new crystals form heterogeneously in updraft parcels, grow quickly by water vapor deposition, and start falling. These ice crystals leave the upper part of the cloud and are replaced by ice crystals freshly nucleated in the dusty air. At theses steady-state conditions, the number concentration of ice crystals is controlled by the number of available INPs (Kärcher et al., 2006; Kuebbeler et al., 2014) and ice nucleation is exclusively caused by deposition nucleation (in Fig. 13 at −55 to −57 ∘C).
The main closure results are summarized in Fig. 13. According to the dust extinction coefficient of 10–20 Mm−1 in the upper part of the pronounced dust layer from 6 to 10 km height (red profile in Fig. 13a), particle number concentrations n250,d of large particles were mostly between 2000 and 3000 L−1 and the dust particle surface area concentrations sd were between 25 and m2 cm−3 (Fig. 13b). The aerosol observations were performed after the passage of the day-long cirrus field from 23:05 to 23:30 UTC. The higher cirrus layer (deep-blue profile in Fig. 13a, measured from 20:00 to 20:40 UTC) started to develop at heights from 10 to 11 km and obviously depleted the dust layer of INPs in this height range. The second cirrus with a top height at 10 km was observed between 22:10 and 22:19 UTC (light-blue profile in Fig. 13a), about 45 min before the cirrus-free aerosol observations were conducted. This ice layer started to form just at the top of the pronounced dust layer, and thus in a less dust-depleted environment.
The INPC height profiles for different reasonable Si values shown in Fig. 13c are derived from the lidar observations by means of the U17-D(d) parameterization (Table 1). As already mentioned in the preceding section, it should be emphasized here again that the dust conditions at 23:05–23:30 UTC can only provide a realistic range of INP numbers. The true ones, responsible for ice nucleations from 20:00 to 20:40 UTC (first cirrus layer) and 22:15–22:19 UTC (second cloud layer) remain unknown because of unknown vertical motions, cooling rates, and variability in the dust concentration. We bear this caveat in mind in the interpretation of the results of the INPC–ICNC closure experiments. Also the unknown ICNC reduction by, e.g., ice crystal collision and aggregation processes need to be kept in consideration in cases with a cirrus vertical extent of 1.5–2 km and a cirrus optical thickness of 0.25 (22:15–22:19 UTC) to 0.75 (20:00–20:40 UTC).
Regarding the estimation of the ICNC values, only the vertically pointing Doppler lidar and the backscatter lidar Polly were available during the Cyprus-2015 campaign. From the continuous vertical-velocity observations with the Doppler lidar over hours, a clear picture of the mean terminal velocity of falling ice crystals in the lower part of the cirrus (see sketch in Fig. 3a) could be obtained. By using this terminal-velocity information together with the peak values of the ice extinction coefficient of 760 Mm−1 (not shown in the case of the dark-blue curve in Fig. 13a) and 310 Mm−1 (also not shown), both occurring at 9.1–9.2 km height, the analysis (see Sect. 4.2.3) revealed ICNC values of 16 and 5 L−1 for the two analyzed cirrus segments. These ICNC values plus an uncertainty margin of a factor of 3 are indicated as vertical lines in Fig. 13c. The results of the ICNC and INPC data analysis for this case are also presented in Table 2.
As can be seen, an acceptable agreement of the INPC with the ICNC is obtained for an Si around 1.1. Taking an underestimation of the INPC in updrafts into consideration, even lower ice supersaturation values of 1.05–1.07 were probably sufficient to maintain the observed cirrus conditions and to obtain agreement between the numbers of the ICNC and INPC. A reduction of the ICNC by, for example, aggregation effects, may have occurred as well so that our ICNC value (representing the cirrus conditions in the lower half of the cloud layer) was too low (with respect to the ICNC at the cloud top) by a factor of 5. Agreement between the ICNC and INPC is then only reached when Si is in the range of 1.15. All this is in good agreement with modeling results presented by Kuebbeler et al. (2014) for preexisting cirrus conditions. The consistent picture of cirrus evolution in terms of the INPC and ICNC again corroborates the usefulness of the U17-D parameterization to predict dust INPC even at temperatures below −55 ∘C.

Figure 15HYSPLIT backward trajectories for 6 d arriving at Nicosia, Cyprus, on 8 March 2015 at 23:00 UTC (see Fig. 5a and b). The computations are based on GDAS0.5 meteorological fields. Arrival heights are 2500 m (red, Middle Eastern dust layer), 4500 m (blue, Saharan dust layer), and 5800 m (green, Saharan dust layer).
Figure 14 provides an overview of the entire cloud evolution from 17 March at 18:00 UTC to 18 March at 24:00 UTC. As mentioned, the cirrus layer was monitored over the whole day on 17 March (from 07:00 to 22:45 UTC). Another cirrus field started to cross the lidar site around midnight (17 March 2015 at 23:45 UTC), and the evolution of this cirrus system was controlled by a low-pressure system over Turkey that moved slowly eastward. With time, the dusty, humid African air was replaced by dust-free and drier air from the north. As a consequence the cirrus deck apparently descended (embedded in Saharan dust) from 00:00 UTC to about 15:00 UTC from 10 to 3–4 km height and transformed into extended fields of mixed-phase altocumulus layers during the second half of 18 March 2015. A new dust outbreak advecting dusty air from Africa reached Cyprus at about 17:00 UTC on 18 March 2015. The composite shows the full advantage of continuously running remote-sensing instruments. Such coherent observations of cloud processes are not possible by any other means. The transition from the deposition nucleation regime with cloud top temperatures of ∘C to the immersion freezing regime with cloud top temperatures ∘C was covered by the lidar observations. Seeder–feeder effects (Rutledge and Hobbs, 1983; Fleishauer et al., 2002; Ansmann et al., 2009) with a pronounced virga formation below the lowest liquid water cloud layers around 5 km height are visible in the figure, especially from 11:00 to 18:00 UTC, before the new dusty air mass arrived. In this air, the altocumulus developed and immersion freezing processes were responsible for the observed ice formation.
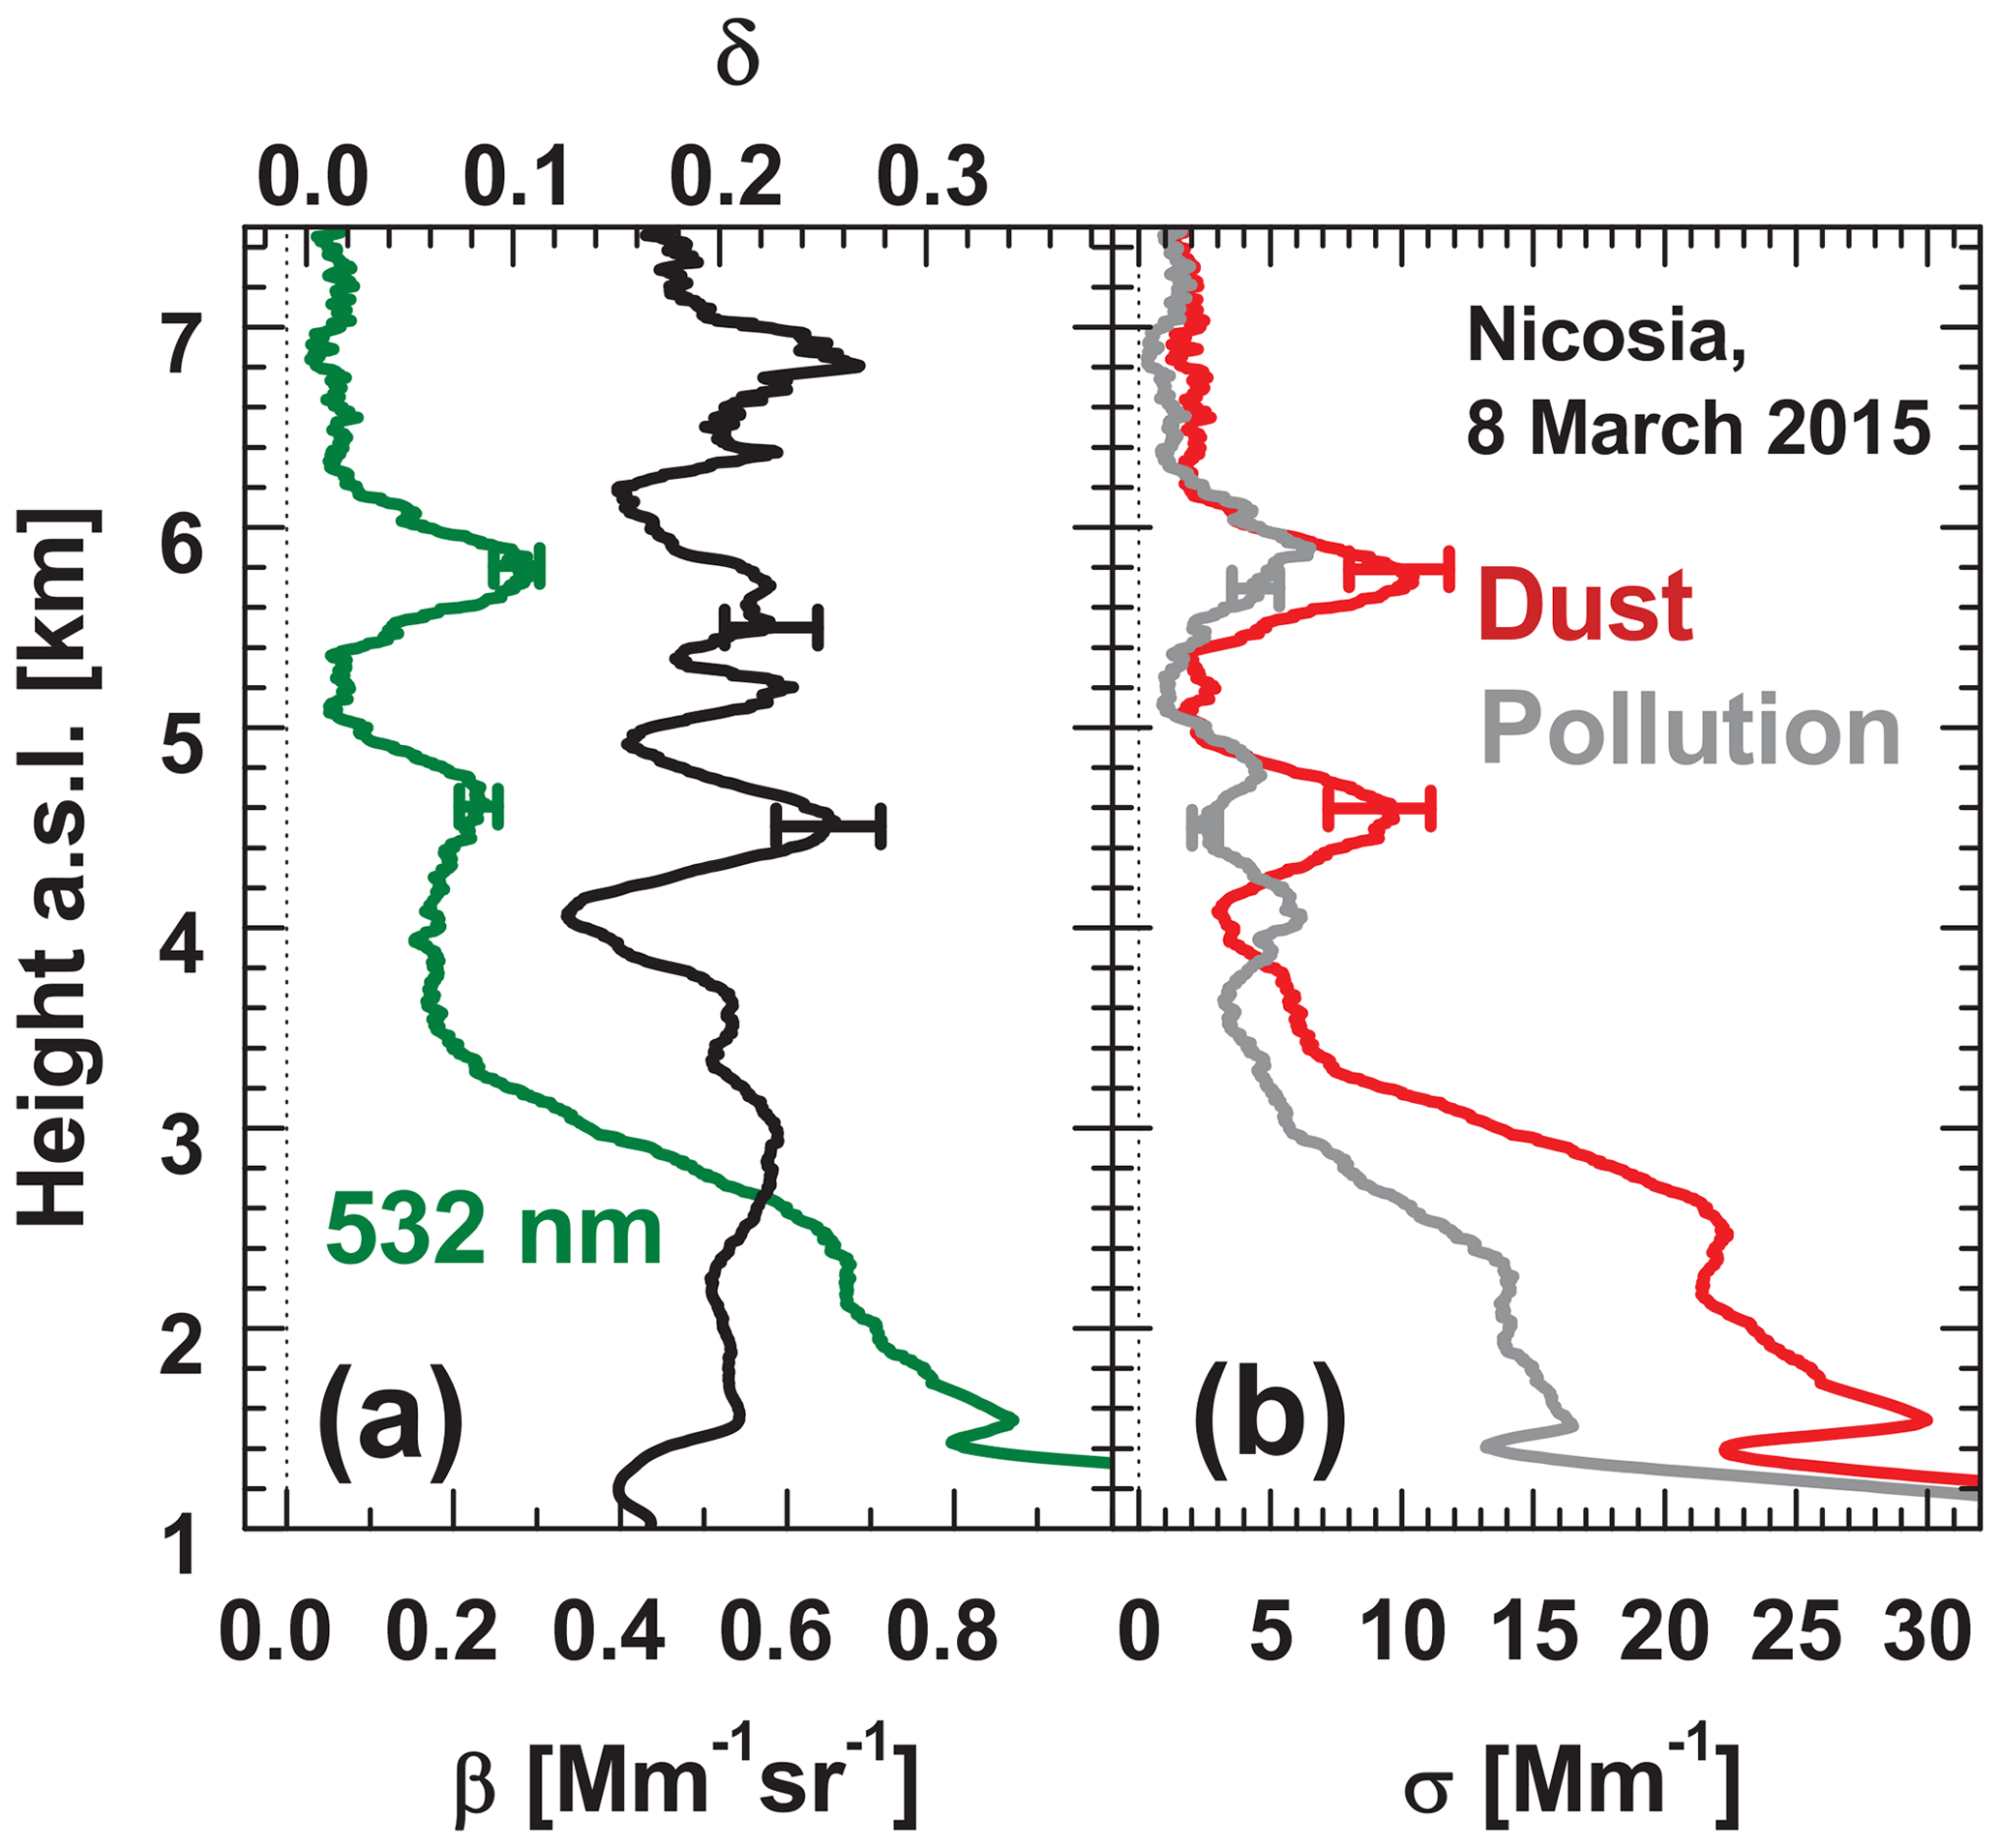
Figure 16(a) Particle backscatter coefficient (green, 532 nm) and particle linear depolarization ratio (black, 532 nm); (b) corresponding dust and non-dust continental particle extinction coefficients. Mean lidar profiles for the time period from 22:00 to 22:20 UTC are shown. The uncertainty bars show typical retrieval uncertainties of 10 % (backscatter, depolarization ratio) and 20 % (extinction coefficient).
INPC and ICNC values are given for several orange and blue boxes (indicating signal averaging periods and data analysis height ranges) in Fig. 14. The numbers for 17 March 2015 (cirrus in the upper troposphere) were already discussed above. Good-to-acceptable agreement between the estimated INPC and ICNC values was found in this case with deposition nucleation. The agreement is less good for the altocumulus layer observed in the evening of 18 March. For cloud-free periods INPC values were determined and ranged from 0.1 to about 5 L−1. For several cloud segments with a cloud top height between 5 and 6.5 km, quite different ICNC values were derived, ranging from 0.2–2 to 4–36 L−1. Besides the uncertainties in the remote-sensing-based INPC estimation (already considered in the INPC numbers shown in Fig. 14) ice breakup processes and crystal collision events associated with crystal aggregation formation which lead to an increase and reduction of the ICNC, respectively, must be kept in mind in the closure studies at these relatively high ice formation temperatures ranging from about −15 to −25 ∘C. These problems mostly associated with high ICNC / INPC ratios were already reported by Auer et al. (1969) and Hobbs (1969) (see Sect. 2).
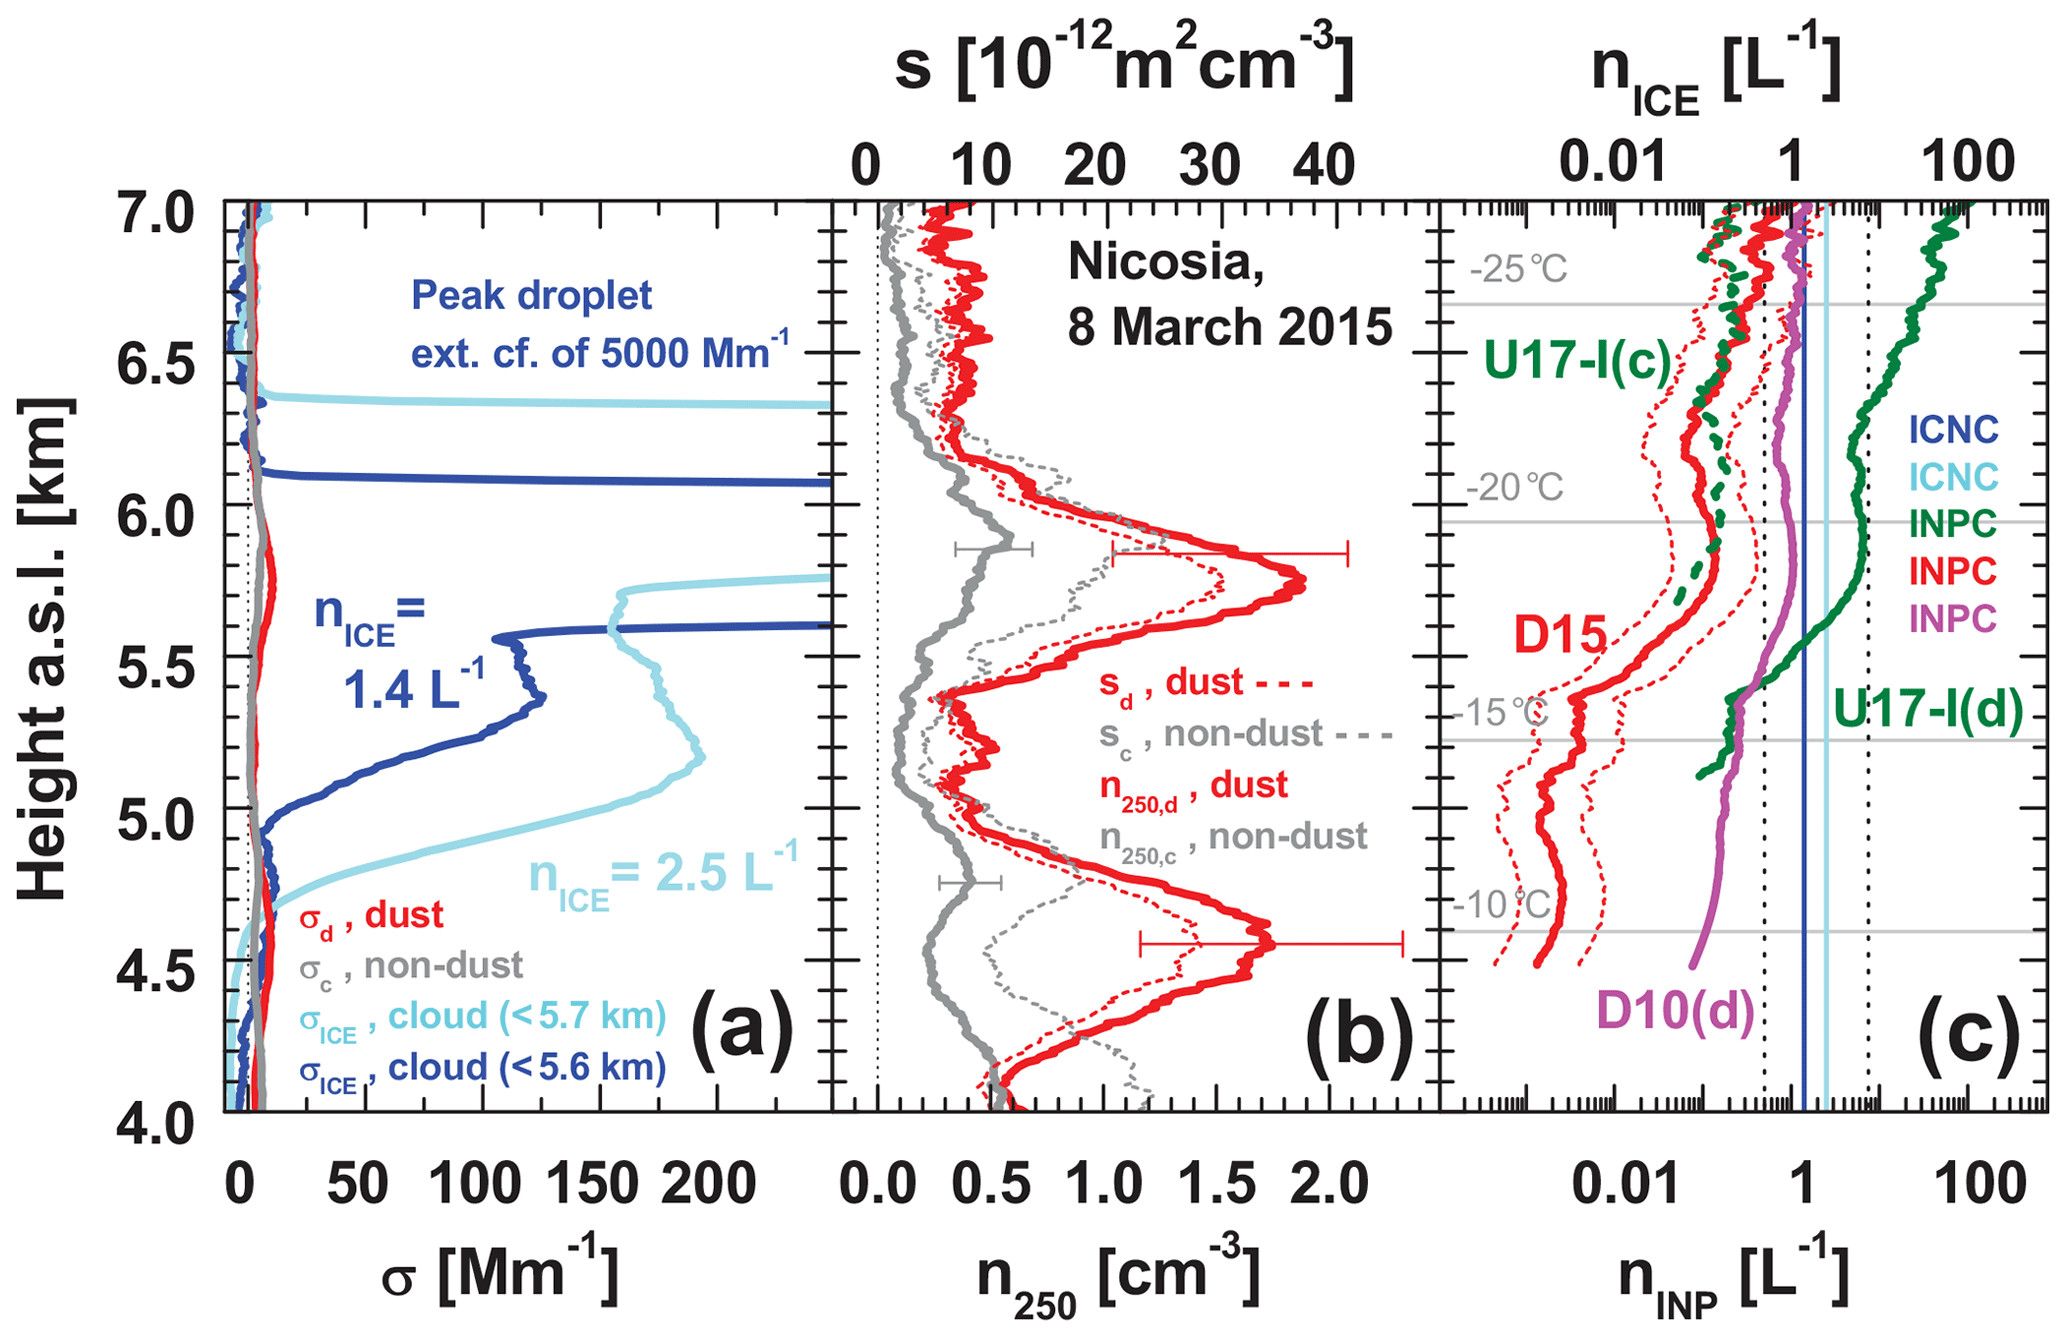
Figure 17Mixed-phase-cloud INPC–ICNC closure study based on lidar observations over Nicosia on 8 March 2015 (see Fig. 5a and b). (a) Dust (red) and non-dust (grey) particle extinction coefficient (22:00–22:20 UTC mean values, as shown in Fig. 16b), ice crystal extinction coefficient (blue, 22:29–22:31 UTC mean, ice virga from 5 to 5.6 km; light blue, 22:43–22:53 UTC mean, ice virga from 4.7 to 5.7 km), and estimated ICNC values (nICE in blue and light blue for the two time periods); (b) dust (red) and non-dust (grey) particle number concentration n250,d and n250,c (thick lines) and surface area concentration sd and sc (thin dashed lines, 22:00–22:20 UTC mean values); (c) INPC values (nINP, 22:00–22:20 UTC mean) determined by using the immersion freezing INP parameterizations U17-I(c) (dotted dark green) for non-dust continental aerosol and D10(d) (magenta, thick solid) and D15 (red, thick solid, cf = 1.0), and U17-I(d) (dark green, thick solid) for the dust aerosol fraction. The uncertainty range (factor 3) of each of the four INPC profiles is indicated for D15 only (red dotted lines). The ICNC values (numbers in a) are shown again, but here they are shown as vertical dark-blue and light-blue lines with the overall uncertainty range as vertical black dashed lines.
5.3 The 8 March 2015 case study: evolution of a mixed-phase altocumulus layer in polluted Saharan dust
In the first two closure studies, we discussed ice nucleation processes at the relatively low temperatures of −35 to −57 ∘C and found that deposition nucleation explained the observed ICNC. The third case now deals with heterogeneous ice nucleation within a stratiform mixed-phase altocumulus layer with cloud top temperatures of −20 to −23 ∘C. Immersion freezing is the prevalent ice nucleation mode at these temperatures.
The altocumulus developed over Nicosia in desert dust at heights around 6 km in the late evening of 8 March 2015 (after 21:00 UTC). The case is shown in Fig. 5a and b. According to the backward trajectories in Fig. 15, the dust above 4 km height originated from the Sahara, whereas the dust layer between 1 and 3.5 km was aged dust from the Middle East mixed with eastern European aerosol pollution.
Figure 16 presents the basic lidar aerosol products for the time period just before the cloud layers appeared (22:00–22:20 UTC). The dust from northern Africa was contaminated by anthropogenic fine-mode aerosol because the measured particles depolarization ratio was significantly below the pure dust value of 0.3. Small particles cause depolarization ratios of less than 0.05 so that depolarization ratio values around 0.2 indicate a significant contribution of continental fine-mode particles (indicated by the index c) to the total particle backscattering and extinction as shown in Fig. 16. After separation of the dust and non-dust continental extinction coefficients σd and σc as described in detail by Mamouri and Ansmann (2014), the particle extinction profiles were used as an input in the retrieval of the particle number concentrations n250,d and n250,c and of the particle surface area concentrations sd and sc in Fig. 17b and in the INPC estimation in Fig. 17c as outlined in Sect. 4.1. In Fig. 17b, n250,d values were as high as 1800 L−1 at 5.8 km height (cloud level); n250,c values were close to 500 L−1; and surface area concentrations sd and sc reached values of m2 cm−3 and m2 cm−3, respectively.
For the non-dust continental aerosol fraction we then applied the U17-I(c) INP parameterization (Table 1), and for the dust fraction we used the D10(d), D15, and U17-I(d) INP parameterizations. We show all obtained INPC profiles in Fig. 17c to give an impression of the uncertainty range. The dust INPC estimates obtained with D15 and U17-I(d) differ by almost a factor of 50 at 5.8 km height and −20 ∘C (see also Table 1). The D10(d) solutions are close to the retrieved ICNC values in Table 1 and may be thus more reliable than the other solutions as found also by Boose et al. (2016) and Marinou et al. (2019). In both studies, it was found that the D10(d) parameterization (with in situ measured n250,d values as an input) yielded better agreement with in situ measured INPC values at Tenerife and Cyprus than the use of the D15 approach. Further discussion on uncertainties in INPC measurement methods, predictions, and parameterizations can be found in Phillips et al. (2013), Price et al. (2018), and DeMott et al. (2017).
The reason for the large difference between the D15 and U71-I(d) INPC values of 0.13 and 6.3 L−1, respectively, remain unclear. DeMott et al. (2015) introduced a calibration factor (cf) of 3.0 to obtain good agreement between the D15 INPC values and the INPC values when using the parameterization of Niemand et al. (2012), denoted here as the N12 parameterization. The U17-I(d) INPC numbers are a constant factor of 1.64 higher than the respective N12 INPC numbers (Ullrich et al., 2017) so that a difference of a factor of about 5 (3×1.64) between the D15 solutions (with a cf of 1.0 in our closure study) and the U17-I(d) results can explain a part of the difference. However even after a multiplication of the D15 INPC by a factor of 5, yielding 0.65 L−1, an order of magnitude remains between the U17-I(d) and the increased D15 INPC values. This may be partly related to the fact that the D15 parameterization (INPC versus temperature) is different for low and high dust concentration levels. The D15 and N12 INPC comparisons discussed in DeMott et al. (2015) were performed at dust outbreak conditions over Cabo Verde with dust extinction coefficients around 100 Mm−1. Our U17-I(d)–D15 INPC comparison is performed for dust conditions with dust extinction coefficients of 10 Mm−1 at 5.8 km height. For such low dust concentrations, a much larger calibration factor of 6.0 is needed in the D15 INPC retrieval to match the N12 INPC numbers (DeMott et al., 2015). It is also possible that the INPC reservoir comprises even smaller particles, e.g., particles with a radius of >100–150 nm. This would lead to an increase by a factor of 3–4 of the D15 INPC numbers compared to the INPC values obtained with n250. In contrast, the surface area concentration used in the U17-I(d) INPC computation may be too large. Only the surface area for those particles (with a radius of >100 nm) should be considered that serve as cloud condensation nuclei (Ansmann et al., 2019). The respective surface area concentration is a factor of 1.5–2 lower than the total particle surface area. It remains to be mentioned that a similar deviation of the U17-I(d) from the D15 INPC numbers as shown in Fig. 17c was obtained in the studies of Marinou et al. (2019).
Regarding the estimation of the ICNC values, we followed the strategy illustrated in Fig. 3b. The first altocumulus layer (22:29–22:31 UTC) started to form at 5.6 to 6.1 km height (dark-blue profile in Fig. 17a) in the center of the upper dust layer (peaking at 5.8 km). Peak cloud extinction values (not shown) in the main altocumulus layer of 5000 Mm−1 (in the case of the light-blue curve) up to 8000 Mm−1 (in the case of the blue curve) occurred at heights from 6 to 6.2 km, i.e., at the cloud top. These high values are typical for cloud layers dominated by liquid droplet backscattering. The depolarization ratio also dropped to low values typical for spherical droplets in this droplet-dominated layer. Virga developed (see Fig. 5a and b) and caused ice particle extinction coefficients of 100–150 Mm−1 below 5.6 km height (see Fig. 17a). Later, the second cloud layer (22:43–22:53 UTC) was found roughly at 250 m higher so that the cloud top temperature decreased by 2 ∘C, which means that the INPC values increased by a factor of roughly 2–4 assuming that the dust particle concentrations remained almost constant. As a consequence of the increased availability of INPs, more crystals also nucleated, and consequently ice extinction coefficients in the virga zone increased to 150–180 Mm−1 in Fig. 17a (ice virga zone from 4.7 to 5.7 km height).
For completeness it should be mentioned that the primary lidar cloud parameter is the cloud backscatter coefficient. The liquid water extinction coefficients are obtained by multiplying the strong cloud backscatter coefficients (in the cloud top region of the altocumulus layer) with the droplet lidar ratio of 18 sr (O'Connor et al., 2004). The ice crystal extinction coefficients in the ice virga zone are obtained as described in the sections before by using a typical cirrus lidar ratio of 32 sr (Seifert et al., 2007; Giannakaki et al., 2007) in the conversion of the ice crystal backscatter values into the extinction coefficients. Note also that the backscatter coefficient profiles are determined by means of the Raman lidar method (Ansmann et al., 1992), in which no lidar ratio profile is needed as an input, in contrast to the widely and commonly used Fernald backscatter retrieval technique (Fernald, 1984) so that the obtained backscatter profiles are very accurate and not corrupted by strong height variations of the lidar ratio (from the dust layer below the cloud dust over the ice virga zone to the liquid water layer at the cloud top) or biased by multiple scattering.
The Doppler lidar measurements of the fall speed of the ice crystals and the ice extinction values of 120 and 180 Mm−1 in the virga zone were then used to estimate the ICNC numbers in Fig. 17a for the two cloud cases following the methodology described in Sect. 4.2.3. By considering an uncertainty of a factor of 3, the ICNC was between 0.3 and 7.5 L−1. The main findings for this case are summarized in Table 2.
As mentioned, the comparison of estimated ICNC and INPC values is difficult in view of the large differences between the different INPC profiles. However, if we use the ICNC values as a guideline for the true INPC levels then the D10(d) INPC values (ignoring a small non-dust INPC contribution) is closest to the ICNC values at 5.8 km height. The respective D15 and U17-I(d) profiles in Fig. 17c may be used as minimum and maximum boundaries of the INPC uncertainty range, as was already suggested by Marinou et al. (2019).
The cloud top height increased by 250 m from cloud segment 1 to cloud segment 2 in Fig. 17a. The respective decrease in temperature leads to an increase of the INPC by a factor of 2–4, as already mentioned. This lifting of cloud and dust parcels is not included in the INPC profiles (estimated from the aerosol conditions before the cloud field arrived and before the lifting took place). All in all, we rate this closure experiment also as successful. A better agreement cannot be expected. With increasing cloud top temperature the probability of secondary ice formation and thus of strong changes in the ICNC numbers increases. Furthermore, ice crystals nucleated via immersion freezing can grow very fast in the (almost) unlimited liquid water reservoir and then probably create ice crystal clusters with complex shape features which may intensify ice breakup as well as collision processes.
-
For the first time closure studies of the relationship between the ice-nucleating particle concentration and ice crystal number concentration in altocumulus and cirrus layers, solely based on ground-based active remote sensing, have been conducted. Three closure experiments (proof-of-concept studies) covering the deposition nucleation and immersion freezing regimes were presented. All clouds developed in pronounced Saharan dust layers. We rated the closure study as successful if the estimated INPC and ICNC values agreed within an order of magnitude (i.e., if the INPC and ICNC uncertainty ranges of 1 order of magnitude widely overlapped). All three closure experiments were classified as successful.
A long-lasting, complex evolution of a DIBS (Fromm et al., 2016) associated with the formation of an usual large anvil cirrus shield and the development of a rather large cirrus uncinus field extending from the eastern Mediterranean to central Asia over more than 3000 km was investigated. The unusual characteristics (long lifetime and large coverage with anvil and synoptic cirrus fields) lead to the conclusion that the presence of dust (i.e., of an unlimited reservoir of INPC) in the upper troposphere sensitively influenced the cloud evolution processes and extended the cloud lifetime. Such cloud evolution cases with a largely extended cloud lifetime and increased regional coverage may be counted as a contribution to anthropogenic climate forcing if it can be shown that the occurrence frequency and strength of these DIBSs, able to lift a large amount of natural INPs into the upper troposphere, increased during the last decades in a warming climate caused by man-made activity.
-
Our remote-sensing-based closure experiments demonstrated that dust can trigger significant ice formation in the middle and upper troposphere via heterogeneous ice nucleation. The homogeneous freezing pathway was not needed to explain the evolution of the cirrus uncinus fields at −55 to −57 ∘C (case 2 of our closure studies).
-
A lidar–radar methodology based on new ICNC and INPC retrieval techniques (Mamouri and Ansmann, 2015, 2016; Marinou et al., 2019; Bühl et al., 2019) is now available to investigate the role and impact of aerosol particles on ice formation in atmospheric clouds and on subsequent precipitation processes. Especially lidar profiling of INPC can be regarded as an important step forward in the research field dealing with aerosol–cloud interaction via ice formation. In view of a potential consideration and implementation of complex aerosol–cloud interaction in numerical weather forecast models and the assimilation of measured INPC profiles into those models, there is no alternative to continuous lidar-based INPC profiling and monitoring techniques. This fact corroborates the importance of lidar and the need for further in-depth laboratory and field studies to obtain robust and trustworthy INPC parameterization schemes applicable to ground-based and spaceborne lidar measurements. Although the INPC retrieval input parameters (large particle fraction and particle surface area concentration) can be determined with lidar with an uncertainty of the order of 25 %–30 %, the overall uncertainty of the lidar-based INPC profiling is in the range of 1 order of magnitude caused by the available INPC parameterization schemes.
It can be concluded from these comparisons that further efforts are needed to evaluate the reliability and usefulness of the developed INPC parameterization schemes used to predict the INPC in the middle and upper troposphere (see recent publications of Welti et al., 2019, and Harrison et al., 2019). In situ observations aboard aircraft overflying sophisticated remote-sensing field sites (equipped with state-of-the-art instrumentation for detailed aerosol, cloud, and meteorological measurements) are required to allow in-depth comparisons of measured, retrieved, and estimated INPC profiles up to the tropopause level. Although UAVs are mostly used in atmospheric research at heights below 3 km, UAV–balloon systems are under development that can even reach stratospheric heights and will be able to profile particle size distribution and other aerosol properties within the entire troposphere. We also need these kinds of in situ–remote-sensing studies to validate our developed remote-sensing-based ICNC retrieval method. Airborne in situ observations of ice crystal size distributions, shape properties, and the ICNC in ice clouds over the remote-sensing facility would be desirable for intensive ICNC comparisons.
-
As a significant contribution to climate-change research, we need to apply the INPC–ICNC closure concept to spaceborne lidar–radar studies to obtain an improved view of the aerosol–cloud–precipitation relationship and the role of different aerosol types (marine, anthropogenic, and dust particles) on ice formation processes on a global scale. A first attempt was shown by Marinou et al. (2019). Complementarily, we need ground-based long-term field campaigns such as CyCARE in Cyprus and DACAPO-PESO (Dynamics, Aerosol, Cloud And Precipitation Observations in the Pristine Environment of the Southern Ocean) to improve cloud process understanding at very different places (climate zones) with very contrasting weather regimes and aerosol conditions. We moved our lidar–radar LACROS equipment after the CyCARE campaign (October 2016–March 2018) to Punta Arenas at the southern most tip of South America (long term measurements started with DACAPO-PESO at the end of November 2018) to investigate aerosol–cloud interaction at rather pristine conditions, with only a few episodes of significant amounts of continental aerosols (smoke and dust from southern parts of South America and long-term transport for Australia).
-
As an outlook and to reduce the number of critical assumptions in our closure methodology as discussed in Sect. 4, we may include the next generation of powerful water vapor differential absorption lidars (DIALs) or Raman lidars to obtain temporally and vertically highly resolved water vapor and relative-humidity profiles in cirrus and transparent altocumulus layers (Leblanc et al., 2012; Reichardt et al., 2012; Späth et al., 2016; Sakai et al., 2019) as well as information on liquid water and ice water content (Wang et al., 2004; Sakai et al., 2013; Reichardt, 2014) in future closure studies. We may also integrate radar wind profilers in our cloud studies to obtain detailed updraft and downdraft observations in the cloud top regions (Bühl et al., 2015; Radenz et al., 2018) and even lidar techniques for the quantification of mineral dust concentrations within the ice clouds (Tatarov and Sugimoto, 2005; Müller et al., 2010; Tatarov et al., 2011).
Polly lidar observations (level 0 data and measured signals) are in the PollyNET database (http://polly.rsd.tropos.de/, PollyNET, 2019). LACROS observations (level 0 data) are stored in the Cloudnet database (http://lacros.rsd.tropos.de, Cloudnet, 2019). All analysis products are available at TROPOS upon request (info@tropos.de). The backward trajectory analysis has been supported by air mass transport computation with the NOAA (National Oceanic and Atmospheric Administration) HYSPLIT (HYbrid Single-Particle Lagrangian Integrated Trajectory) model (HYSPLIT, 2019) using GDAS1 meteorological data (Stein et al., 2015; Rolph et al., 2017). GDAS1 data are available via the ARL web page at (https://www.ready.noaa.gov/gdas1.php, GDAS, 2019).
AA, REM, and JB prepared the paper. JB, PS, RE, REM, and AN took care of Cyprus-2015 and CyCARE data collections and analysis. JH was involved in the CyCARE Polly data analysis. JA, ZK, and BS performed and analyzed the HINC-based in situ INPC observations at Agia Marina Xyliatou. MV and JS were responsible for all Agia Marina Xyliatou field activities, including UAV operation, data collection, and analysis, and they took care of the well-prepared infrastructure and logistics of the remote-sensing field site at the Cyprus Institute in Nicosia during the Cyprus-2015 and Cyprus-2016 campaigns.
The authors declare that they have no conflict of interest.
This article is part of the special issue “BACCHUS – Impact of Biogenic versus Anthropogenic emissions on Clouds and Climate: towards a Holistic UnderStanding (ACP/AMT/GMD inter-journal SI)”. It is not associated with a conference.
We are grateful to the National Observatory of Athens (NOA, Vassilis Amiridis) for providing the Polly lidar for the 6-week BACCHUS field campaign in 2015. The aerosol source apportionment analysis has been supported by air mass transport computation with the HYSPLIT model using GDAS1 meteorological data. We acknowledge the provisioning of GDAS1 data by the NOAA Air Resources Laboratory.
The authors acknowledge funding from the European FP7 project by the European Union's 7th Framework Programme (FP7/2007-2013) for the collaborative project BACCHUS (grant agreement no. 603445) and the Horizon 2020 research and innovation program ACTRIS-2 Integrating Activities (H2020-INFRAIA-2014-2015; grant agreement no. 654109). The NOA Polly lidar was supported by the EU FP7-REGPOT-2012-2013-1BEYOND project (Building Capacity for a Centre of Excellence for EO-based monitoring of Natural Disasters; grant agreement no. 316210). The CyCARE/A-LIFE data analysis has been supported by the SIROCCO project (grant no. EXCELLENCE/1216/0217) co-funded by the Republic of Cyprus and the structural funds of the European Union for Cyprus through the Research and Innovation Foundation. MV acknowledges funding from the University of Bremen and the DFG Research Centre/Cluster of Excellence The Ocean in the Earth System – MARUM.
This paper was edited by Matthias Tesche and reviewed by David Mitchell and one anonymous referee.
Abdelkader, M., Metzger, S., Mamouri, R. E., Astitha, M., Barrie, L., Levin, Z., and Lelieveld, J.: Dust–air pollution dynamics over the eastern Mediterranean, Atmos. Chem. Phys., 15, 9173–9189, https://doi.org/10.5194/acp-15-9173-2015, 2015. a
Ansmann, A., Wandinger, U., Riebesell, M., Weitkamp, C., and Michaelis, W.: Independent measurement of extinction and backscatter profiles in cirrus clouds by using a combined Raman elastic–backscatter lidar, Appl. Opt., 31, 7113–7131, https://doi.org/10.1364/AO.31.007113, 1992. a
Ansmann, A., Wandinger, U., Wiedensohler, A., and Leiterer, U.: Lindenberg Aerosol Characterization Experiment 1998 (LACE 98): Overview, J. Geophys. Res., 107, 8129, https://doi.org/10.1029/2000JD000233, 2002. a
Ansmann, A., Mattis, I., Müller, D., Wandinger, U., Radlach, M., Althausen, D., and Damoah, R: Ice formation in Saharan dust over central Europe observed with temperature/humidity/aerosol Raman lidar, J. Geophys. Res., 110, D18S12, https://doi.org/10.1029/2004JD005000, 2005. a
Ansmann, A., Tesche, M., Althausen, D., Müller, D., Freudenthaler, V., Heese, B., Wiegner, M., Pisani, G., Knippertz, P., and Dubovik, O.: Influence of Saharan dust on cloud glaciation in southern Morocco during SAMUM, J. Geophys. Res., 113, D04210, https://doi.org/10.1029/2007JD008785, 2008. a
Ansmann, A., Tesche, M., Seifert, P., Althausen, D., Engelmann, R., Fruntke, J., Wandinger, U., Mattis, I., and Müller, D.: Evolution of the ice phase in tropical altocumulus: SAMUM lidar observations over Cape Verde, J. Geophys. Res., 114, D17208, https://doi.org/10.1029/2008JD011659, 2009. a, b
Ansmann, A., Mamouri, R.-E., Hofer, J., Baars, H., Althausen, D., and Abdullaev, S. F.: Dust mass, cloud condensation nuclei, and ice-nucleating particle profiling with polarization lidar: updated POLIPHON conversion factors from global AERONET analysis, Atmos. Meas. Tech., 12, 4849–4865, https://doi.org/10.5194/amt-12-4849-2019, 2019. a
Archuleta, C. M., DeMott, P. J., and Kreidenweis, S. M.: Ice nucleation by surrogates for atmospheric mineral dust and mineral dust/sulfate particles at cirrus temperatures, Atmos. Chem. Phys., 5, 2617–2634, https://doi.org/10.5194/acp-5-2617-2005, 2005. a
Auer, A. H., Veal, D. L., and Marwitz, J. D.: Observations of ice crystal and ice nuclei concentrations in stable cap clouds, J. Atmos. Sci., 26, 1342–1343, https://doi.org/10.1175/1520-0469(1969)026<1342:Ooicai>2.0.Co;2, 1969. a, b
Avramov, A,, Ackerman, A. S., Fridlind, A. M., van Diedenhoven, B., Botta, G., Aydin, K., Verlinde, J., Korolev, A. V., Strapp, J. W., McFarquhar, G. M., Jackson, R., Brooks, S. D., Glen, A., and Wolde, M.: Toward ice formation closure in Arctic mixed-phase boundary layer clouds during ISDAC, J. Geophys. Res., 116, D00T08, https://doi.org/10.1029/2011JD015910, 2011. a, b
Baars, H., Kanitz, T., Engelmann, R., Althausen, D., Heese, B., Komppula, M., Preißler, J., Tesche, M., Ansmann, A., Wandinger, U., Lim, J.-H., Ahn, J. Y., Stachlewska, I. S., Amiridis, V., Marinou, E., Seifert, P., Hofer, J., Skupin, A., Schneider, F., Bohlmann, S., Foth, A., Bley, S., Pfüller, A., Giannakaki, E., Lihavainen, H., Viisanen, Y., Hooda, R. K., Pereira, S. N., Bortoli, D., Wagner, F., Mattis, I., Janicka, L., Markowicz, K. M., Achtert, P., Artaxo, P., Pauliquevis, T., Souza, R. A. F., Sharma, V. P., van Zyl, P. G., Beukes, J. P., Sun, J., Rohwer, E. G., Deng, R., Mamouri, R.-E., and Zamorano, F.: An overview of the first decade of PollyNET: an emerging network of automated Raman-polarization lidars for continuous aerosol profiling, Atmos. Chem. Phys., 16, 5111–5137, https://doi.org/10.5194/acp-16-5111-2016, 2016. a
Bailey, M., and Hallett, J.: Ice Crystal Linear Growth Rates from −20 ∘ to −70 ∘C: Confirmation from Wave Cloud Studies, J. Atmos. Sci., 69, 390–402, https://doi.org/10.1175/JAS-D-11-035.1, 2012 a
Barreto, Á., Román, R., Cuevas, E., Berjón, A. J., Almansa, A. F., Toledano, C., González, R., Hernández, Y., Blarel, L., Goloub, P., Guirado, C., and Yela, M.: Assessment of nocturnal aerosol optical depth from lunar photometry at the Izaña high mountain observatory, Atmos. Meas. Tech., 10, 3007–3019, https://doi.org/10.5194/amt-10-3007-2017, 2017. a
Bates, T. S., Huebert, B. J., Gras, J. L., Griffins, F. B., and Durkee, P. A.: International Global Atmospheric Chemistry (IGAC) Project's first Aerosol Characterization Experiment (ACE 1): Overview, J. Geophys. Res., 103, 16297–16318, https://doi.org/10.1029/97JD03741, 1998. a
Boose, Y., Sierau, B., García, M. I., Rodríguez, S., Alastuey, A., Linke, C., Schnaiter, M., Kupiszewski, P., Kanji, Z. A., and Lohmann, U.: Ice nucleating particles in the Saharan Air Layer, Atmos. Chem. Phys., 16, 9067–9087, https://doi.org/10.5194/acp-16-9067-2016, 2016. a, b
Bühl, J., Ansmann, A., Seifert, P., Baars, H., and Engelmann, R.: Towards a quantitative characterization of heterogeneous ice formation with lidar/radar: Comparison of CALIPSO/CloudSat with ground-based observations, Geophys. Res. Lett., 40, 4404–4408, https://doi.org/10.1002/grl.50792, 2013. a
Bühl, J., Leinweber, R., Görsdorf, U., Radenz, M., Ansmann, A., and Lehmann, V.: Combined vertical-velocity observations with Doppler lidar, cloud radar and wind profiler, Atmos. Meas. Tech., 8, 3527–3536, https://doi.org/10.5194/amt-8-3527-2015, 2015. a
Bühl, J., Seifert, P., Myagkov, A., and Ansmann, A.: Measuring ice- and liquid-water properties in mixed-phase cloud layers at the Leipzig Cloudnet station, Atmos. Chem. Phys., 16, 10609–10620, https://doi.org/10.5194/acp-16-10609-2016, 2016. a, b
Bühl, J., Seifert, P., Radenz, M., Baars, H., and Ansmann, A.: Ice crystal number concentration from lidar, cloud radar and radar wind profiler measurements, Atmos. Meas. Tech., 12, 6601–6617, https://doi.org/10.5194/amt-12-6601-2019, 2019. a, b, c, d, e
Caffrey, P. F., Fromm, M. D., and Kablick, G. P.: WRF‐Chem simulation of an East Asian dust-infused baroclinic storm (DIBS), J. Geophys. Res.-Atmos., 123, 6880–6895, https://doi.org/10.1029/2017JD027848, 2018. a, b
Calmer, R., Roberts, G. C., Sanchez, K. J., Sciare, J., Sellegri, K., Picard, D., Vrekoussis, M., and Pikridas, M.: Aerosol–cloud closure study on cloud optical properties using remotely piloted aircraft measurements during a BACCHUS field campaign in Cyprus, Atmos. Chem. Phys., 19, 13989–14007, https://doi.org/10.5194/acp-19-13989-2019, 2019. a
Ceccaldi, M., Delanoë, J., Hogan, R. J., Pounder, N. L., Protat, A., and Pelon, J.: From CloudSat‐CALIPSO to EarthCare: Evolution of the DARDAR cloud classification and its comparison to airborne radar‐lidar observations, J. Geophys. Res. Atmos., 118, 7962–7981, https://doi.org/10.1002/jgrd.50579, 2013. a
Cloudnet: Cloudnet data base, available at: http://lacros.rsd.tropos.de/, last access: 8 October 2019. a
Costa, A., Meyer, J., Afchine, A., Luebke, A., Günther, G., Dorsey, J. R., Gallagher, M. W., Ehrlich, A., Wendisch, M., Baumgardner, D., Wex, H., and Krämer, M.: Classification of Arctic, midlatitude and tropical clouds in the mixed-phase temperature regime, Atmos. Chem. Phys., 17, 12219–12238, https://doi.org/10.5194/acp-17-12219-2017, 2017. a
Cziczo, D. J., Froyd, K. D., Gallavardin, S. J., Moehler, O., Benz, S., Saathoff, H., and Murphy, D. M.: Deactivation of ice nuclei due to atmospherically relevant surface coatings, Environ. Res. Lett., 4, 044013, https://doi.org/10.1088/1748-9326/4/4/044013, 2009. a
Dai, G., Althausen, D., Hofer, J., Engelmann, R., Seifert, P., Bühl, J., Mamouri, R.-E., Wu, S., and Ansmann, A.: Calibration of Raman lidar water vapor profiles by means of AERONET photometer observations and GDAS meteorological data, Atmos. Meas. Tech., 11, 2735–2748, https://doi.org/10.5194/amt-11-2735-2018, 2018. a, b
DeMott, P. J., Prenni, A. J., Liu, X., Kreidenweis, S. M., Petters, M. D., Twohy, C. H., Richardson, M. S., Eidhammer, T., and Rogers, D. C.: Predicting global atmospheric ice nuclei distributions and their impacts on climate, P. Natl. Acad. Sci. USA, 107, 11217–11222, https://doi.org/10.1073/pnas.0910818107, 2010. a, b, c, d
DeMott, P. J., Prenni, A. J., McMeeking, G. R., Sullivan, R. C., Petters, M. D., Tobo, Y., Niemand, M., Möhler, O., Snider, J. R., Wang, Z., and Kreidenweis, S. M.: Integrating laboratory and field data to quantify the immersion freezing ice nucleation activity of mineral dust particles, Atmos. Chem. Phys., 15, 393–409, https://doi.org/10.5194/acp-15-393-2015, 2015. a, b, c, d, e, f, g
DeMott, P. J., Hill, T. C. J., Petters, M. D., Bertram, A. K., Tobo, Y., Mason, R. H., Suski, K. J., McCluskey, C. S., Levin, E. J. T., Schill, G. P., Boose, Y., Rauker, A. M., Miller, A. J., Zaragoza, J., Rocci, K., Rothfuss, N. E., Taylor, H. P., Hader, J. D., Chou, C., Huffman, J. A., Pöschl, U., Prenni, A. J., and Kreidenweis, S. M.: Comparative measurements of ambient atmospheric concentrations of ice nucleating particles using multiple immersion freezing methods and a continuous flow diffusion chamber, Atmos. Chem. Phys., 17, 11227–11245, https://doi.org/10.5194/acp-17-11227-2017, 2017. a, b, c, d
Eidhammer, T., DeMott, P. J., Prenni, A. J., Petters, M. D., Twohy, C. H., Rogers, D. C., Stith, J., Heymsfield, A., Wang, Z., Haimov, S., French, J., Pratt, K., Prather, K., Murphy, S., Seinfeld, J., Subramanian, R., and Kreidenweis, S. M.: Ice initiation by aerosol particles: Measured and predicted ice nuclei concentrations versus measured ice crystal concentrations in an orographic wave cloud, J. Atmos. Sci., 67, 2417–2436, https://doi.org/10.1175/2010JAS3266.1, 2010. a, b
Engelmann, R., Kanitz, T., Baars, H., Heese, B., Althausen, D., Skupin, A., Wandinger, U., Komppula, M., Stachlewska, I. S., Amiridis, V., Marinou, E., Mattis, I., Linné, H., and Ansmann, A.: The automated multiwavelength Raman polarization and water-vapor lidar PollyXT: the neXT generation, Atmos. Meas. Tech., 9, 1767–1784, https://doi.org/10.5194/amt-9-1767-2016, 2016. a
Feng, Z., Dong, X., Xi, B., McFarlane, S. A., Kennedy, A., Lin, B., and Minnis, P.: Life cycle of midlatitude deep convective systems in a Lagrangian framework, J. Geophys. Res.-Atmos., 117, D23201, https://doi.org/10.1029/2012JD018362, 2012. a, b
Fernald, F. G.: Analysis of atmospheric lidar observations: some comments, Appl. Opt., 23, 652–653, doi.org/10.1364/AO.23.000652, 1984. a
Field, P.R. and Heymsfield, A.J.: Aggregation and Scaling of Ice Crystal Size Distributions, J. Atmos. Sci., 60, 544–560, https://doi.org/10.1175/1520-0469(2003)060<0544:AASOIC>2.0.CO;2, 2003. a, b
Field, P.R., Heymsfield, A. J., and Bansemer, A.: A Test of Ice Self-Collection Kernels Using Aircraft Data, J. Atmos. Sci., 63, 651–666, https://doi.org/10.1175/JAS3653.1, 2006. a
Field, P. R., Lawson, R. P., Brown, P. R. A., Lloyd, G., Westbrook, C., Moisseev, D., Miltenberger, A., Nenes, A., Blyth, A., Choularton, T., Connolly, P., Buehl, J., Crosier, J., Cui, Z., Dearden, C., DeMott, P., Flossmann, A., Heymsfield, A., Huang, Y., Kalesse, H., Kanji, Z. A., Korolev, A., Kirchgaessner, A., Lasher-Trapp, S., Leisner, T., McFarquhar, G., Phillips, V., Stith, J., and Sullivan, S.: Secondary ice production: current state of the sience and recommendations for the future, Meteor. Monogr., 58, 1–20, https://doi.org/10.1175/AMSMONOGRAPHS-D-16-0014.1, 2017. a, b, c
Fleishauer, R. P., Larson, V. E., and Vonder Haar, T. H.: Observed microphysical structure of midlevel, mixed-phase clouds, J. Atmos. Sci., 59, 1779–1804, https://doi.org/10.1175/1520-0469(2002)059<1779:OMSOMM>2.0.CO;2, 2002. a
Fromm, M. D., Kablick, G. P., and Caffrey, P.: Dust‐infused baroclinic cyclone storm clouds: The evidence, meteorology, and some implications, Geophys. Res. Lett., 43, 12643–12650, https://doi.org/10.1002/2016GL071801, 2016. a, b, c, d
Furukawa, Y. and Wettlaufer.: Snow and ice crystals, Phys. Today 60, 70–71, https://doi.org/10.1063/1.2825081, 2007.
Fukuta, N. and Takahashi, T.: The growth of atmospheric ice crystals: a summary of findings in vertical supercooled cloud tunnel studies, J. Atmos. Sci., 56, 1963–1979, https://doi.org/10.1175/1520-0469(1999)056<1963:TGOAIC>2.0.CO;2, 1999.
Garnier, A., Pelon, J., Vaughan, M. A., Winker, D. M., Trepte, C. R., and Dubuisson, P.: Lidar multiple scattering factors inferred from CALIPSO lidar and IIR retrievals of semi-transparent cirrus cloud optical depths over oceans, Atmos. Meas. Tech., 8, 2759–2774, https://doi.org/10.5194/amt-8-2759-2015, 2015. a
GDAS: Global Data Assimilation System, meteorological data base, available at: https://www.ready.noaa.gov/gdas1.php, last access: 20 February, 2019. a, b
Giannakaki, E., Balis, D. S., Amiridis, V., and Kazadzis, S.: Optical and geometrical characteristics of cirrus clouds over a Southern European lidar station, Atmos. Chem. Phys., 7, 5519–5530, https://doi.org/10.5194/acp-7-5519-2007, 2007. a, b
Gruber, S., Blahak, U., Haenel, F., Kottmeier, C., Leisner, T., Muskatel, H., Storelvmo, T., and Vogel, B.: A process study on thinning of Arctic winter cirrus clouds with high‐resolution ICON‐ART simulations, J. Geophys. Res.-Atmos., 124, 5860–5888, https://doi.org/10.1029/2018JD029815, 2019. a, b
Gryspeerdt, E., Sourdeval, O., Quaas, J., Delanoë, J., Krämer, M., and Kühne, P.: Ice crystal number concentration estimates from lidar–radar satellite remote sensing – Part 2: Controls on the ice crystal number concentration, Atmos. Chem. Phys., 18, 14351–14370, https://doi.org/10.5194/acp-18-14351-2018, 2018. a
Haarig, M., Engelmann, R., Ansmann, A., Veselovskii, I., Whiteman, D. N., and Althausen, D.: 1064 nm rotational Raman lidar for particle extinction and lidar-ratio profiling: cirrus case study, Atmos. Meas. Tech., 9, 4269–4278, https://doi.org/10.5194/amt-9-4269-2016, 2016. a
Hallett, J. and Mossop, S. C.: Production of secondary ice particles during the riming process, Nature, 249, 26–28, https://doi.org/10.1038/249026a0, 1974. a, b
Harrison, A. D., Lever, K., Sanchez-Marroquin, A., Holden, M. A., Whale, T. F., Tarn, M. D., McQuaid, J. B., and Murray, B. J.: The ice-nucleating ability of quartz immersed in water and its atmospheric importance compared to K-feldspar, Atmos. Chem. Phys., 19, 11343–11361, https://doi.org/10.5194/acp-19-11343-2019, 2019. a
Heymsfield, A. J., Krämer, M., Luebke, A., Brown, P., Cziczo, D. J., Franklin, C., Lawson, P., Lohmann, U., McFarquhar, G., Ulanowski, Z., and van Tricht, K.: Chapter 2: Cirrus clouds, Meteor Monogr. Am. Meteorol. Soc., 58, 1–26, https://doi.org/10.1175/AMSMONOGRAPHS-D-16-0010.1, 2017. a
Hobbs, P. V.: Ice Multiplication in Clouds, J. Atmos. Sci., 26, 315–318, https://doi.org/10.1175/1520-0469(1969)026<0315:IMIC>2.0.CO;2, 1969. a, b
Hoffmann, N., Kiselev, A., Rzesanke, D., Duft, D., and Leisner, T.: Experimental quantification of contact freezing in an electrodynamic balance, Atmos. Meas. Tech., 6, 2373–2382, https://doi.org/10.5194/amt-6-2373-2013, 2013. a
Holben, B. N., Eck, T. F., Slutsker, I., Tanré, D., Buis, J. P., Setzer, A., Vermote, E., Reagan, J. A., Kaufman, Y. J., Nakajima, T., Lavenu, F., Jankowiak, I., and Smirnov, A.: AERONET – a federated instrument network and data archive for aerosol characterization, Remote Sens. Environ., 66, 1–16, 1998. a
Hoose, C. and Möhler, O.: Heterogeneous ice nucleation on atmospheric aerosols: a review of results from laboratory experiments, Atmos. Chem. Phys., 12, 9817–9854, https://doi.org/10.5194/acp-12-9817-2012, 2012. a, b
HYSPLIT: HYbrid Single-Particle Lagrangian Integrated Trajectory model, backward trajectory calculation tool, available at: http://ready.arl.noaa.gov/HYSPLIT_traj.php, last access: 20 February, 2019. a, b
Jensen, E. J., Ueyama, R., Pfister, L., Bui, T. V., Lawson, R. P., Woods, S., Thornberry, T., Rollins, A. W., Diskin, G. S., Digangi, J. P., and Avery, M. A.: On the Susceptibility of Cold Tropical Cirrus to Ice Nuclei Abundance, J. Atmos. Sci., 73, 2445–2464, https://doi.org/10.1175/JAS-D-15-0274.1, 2016 a
Josset, D., Pelon, J., Garnier, A., Hu, Y., Vaughan, M., Zhai, P.-W., Kuehn, R., and Lucker, P.: Cirrus optical depth and lidar ratio retrieval from combined CALIPSO-CloudSat observations using ocean surface echo, J. Geophys. Res., 117, D05207,https://doi.org/10.1029/2011JD016959, 2012. a
Kanji, Z. A., and Abbatt, J. P. D., Laboratory studies of ice formation via deposition mode nucleation onto mineral dust and n‐hexane soot samples, J. Geophys. Res., 111, D16204, https://doi.org/10.1029/2005JD006766, 2006. a
Kanji, Z. A., Ladino, L. A., Wex, H., Boose, Y., Burkert-Kohn, M., Cziczo, D. J., and Krämer, M.: Chapter 1: Overview of ice nucleating particles, Meteor Monogr. Am. Meteorol. Soc., 58, 1–33, https://doi.org/10.1175/amsmonographs-d-16-0006.1, 2017. a, b, c, d
Kärcher, B., Hendricks, J., and Lohmann, U.: Physically based parameterization of cirrus cloud formation for use in global atmospheric models, J. Geophys. Res., 111, D01205, https://doi.org/10.1029/2005JD006219, 2006. a, b
Kärcher, B., Dörnbrack, A., and, Sölch, I.: Supersaturation Variability and Cirrus Ice Crystal Size Distributions, J. Atmos. Sci., 71, 2905–2026, https://doi.org/10.1175/JAS-D-13-0404.1so, 2014. a
Kärcher, B. and Seifert, A.: On homogeneous ice formation in liquid clouds, Q. J. Roy. Meteorol. Soc., 142, 1320–1334, https://doi.org/10.1002/qj.2735, 2016. a
Kärcher, B.: Cirrus Clouds and Their Response to Anthropogenic Activities, Current Climate Change Reports, 3, 45–57, https://doi.org/10.1007/s40641-017-0060-3, 2017. a
Korolev, A., Emery, E. F., Strapp, J. W., Cober, S. G., Isaac, G. A., Wasey, M., and Marcotte, D.: Small ice particles in tropospheric clouds: fact or artifact?, Airborne Icing Instrumentation Evaluation Experiment, B. Am. Meteorol. Soc., 92, 967–973, 2011. a
Korolev, A., McFarquhar, G., Field, P. R., Franklin, C., Lawson, P., Wang, Z., Williams, E., Abel, S. J., Axisa, D., Borrmann, S., Crosier, J., Fugal, J., Krämer, M., Lohmann, U., Schlenczek, O., Schnaiter, M., and Wendisch, M.: Chapter 5: Mixed-Phase Clouds: Progress and Challenges, Meteor Monogr. Am. Meteorol. Soc., 58, 1–50, https://doi.org/10.1175/AMSMONOGRAPHS-D-17-0001.1, 2017. a
Korolev, A., Heckman, I., Wolde, M., Ackerman, A. S., Fridlind, A. M., Ladino, L., Lawson, P., Milbrandt, J., and Williams, E.: A new look at the environmental conditions favorable to secondary ice production, Atmos. Chem. Phys. Discuss., https://doi.org/10.5194/acp-2019-611, in review, 2019. a, b
Kuebbeler, M., Lohmann, U., Hendricks, J., and Kärcher, B.: Dust ice nuclei effects on cirrus clouds, Atmos. Chem. Phys., 14, 3027–3046, https://doi.org/10.5194/acp-14-3027-2014, 2014. a, b, c, d, e
Lacher, L., Lohmann, U., Boose, Y., Zipori, A., Herrmann, E., Bukowiecki, N., Steinbacher, M., and Kanji, Z. A.: The Horizontal Ice Nucleation Chamber (HINC): INP measurements at conditions relevant for mixed-phase clouds at the High Altitude Research Station Jungfraujoch, Atmos. Chem. Phys., 17, 15199–15224, https://doi.org/10.5194/acp-17-15199-2017, 2017. a
Leblanc, T., McDermid, I. S., and Walsh, T. D.: Ground-based water vapor raman lidar measurements up to the upper troposphere and lower stratosphere for long-term monitoring, Atmos. Meas. Tech., 5, 17–36, https://doi.org/10.5194/amt-5-17-2012, 2012. a
Lelieveld, J., Berresheim, H., Borrmann, S., Crutzen, P. J., Dentener, F. J., Fischer, H., Feichter, J., Flatau, P. J., Heland, J., Holzinger, R., Korrmann, R., Lawrence, M. G., Levin, Z., Markowicz, K. M., Mihalopoulos, N., Minikin, A., Ramanathan,V., de Reus, M., Roelofs, G. J., Scheeren, H. A., Sciare, J., Schlager, H., Schultz, M., Siegmund, P., Steil, B., Stephanou, E. G., Stier, P., Traub, M., Warneke, C., Williams, J., and Ziereis, H.: Global air pollution crossroads over the Mediterranean, Science, 298, 794–799, https://doi.org/10.1126/science.1075457, 2002. a
Lohmann, U., Lüöond, F., and Mahrt, F.: An Introduction to Clouds: From the Microscale to Climate, Cambridge University Press., ISBN 9781139087513, https://doi.org/10.1017/CBO9781139087513, 391 pp., 2016. a
Mallet, M., Dulac, F., Formenti, P., Nabat, P., Sciare, J., Roberts, G., Pelon, J., Ancellet, G., Tanré, D., Parol, F., Denjean, C., Brogniez, G., di Sarra, A., Alados-Arboledas, L., Arndt, J., Auriol, F., Blarel, L., Bourrianne, T., Chazette, P., Chevaillier, S., Claeys, M., D'Anna, B., Derimian, Y., Desboeufs, K., Di Iorio, T., Doussin, J.-F., Durand, P., Féron, A., Freney, E., Gaimoz, C., Goloub, P., Gómez-Amo, J. L., Granados-Muñoz, M. J., Grand, N., Hamonou, E., Jankowiak, I., Jeannot, M., Léon, J.-F., Maillé, M., Mailler, S., Meloni, D., Menut, L., Momboisse, G., Nicolas, J., Podvin, T., Pont, V., Rea, G., Renard, J.-B., Roblou, L., Schepanski, K., Schwarzenboeck, A., Sellegri, K., Sicard, M., Solmon, F., Somot, S., Torres, B., Totems, J., Triquet, S., Verdier, N., Verwaerde, C., Waquet, F., Wenger, J., and Zapf, P.: Overview of the Chemistry-Aerosol Mediterranean Experiment/Aerosol Direct Radiative Forcing on the Mediterranean Climate (ChArMEx/ADRIMED) summer 2013 campaign, Atmos. Chem. Phys., 16, 455–504, https://doi.org/10.5194/acp-16-455-2016, 2016. a, b
Mamali, D., Marinou, E., Sciare, J., Pikridas, M., Kokkalis, P., Kottas, M., Binietoglou, I., Tsekeri, A., Keleshis, C., Engelmann, R., Baars, H., Ansmann, A., Amiridis, V., Russchenberg, H., and Biskos, G.: Vertical profiles of aerosol mass concentration derived by unmanned airborne in situ and remote sensing instruments during dust events, Atmos. Meas. Tech., 11, 2897–2910, https://doi.org/10.5194/amt-11-2897-2018, 2018. a
Mamouri, R.-E. and Ansmann, A.: Fine and coarse dust separation with polarization lidar, Atmos. Meas. Tech., 7, 3717–3735, https://doi.org/10.5194/amt-7-3717-2014, 2014. a
Mamouri, R.-E. and Ansmann, A.: Estimated desert-dust ice nuclei profiles from polarization lidar: methodology and case studies, Atmos. Chem. Phys., 15, 3463–3477, https://doi.org/10.5194/acp-15-3463-2015, 2015. a, b, c, d
Mamouri, R.-E. and Ansmann, A.: Potential of polarization lidar to provide profiles of CCN- and INP-relevant aerosol parameters, Atmos. Chem. Phys., 16, 5905–5931, https://doi.org/10.5194/acp-16-5905-2016, 2016. a, b, c, d, e, f, g, h
Mamouri, R. E., Ansmann, A., Nasantzi, A., Kokkalis, P., Schwarz, A., and Hadjimitsis, D.: Low Arabian extinction-to-backscatter ratio, Geophys. Res. Lett., 40, 4762–4766, https://doi.org/10.1002/grl.50898, 2013. a
Mamouri, R.-E., Ansmann, A., Nisantzi, A., Solomos, S., Kallos, G., and Hadjimitsis, D. G.: Extreme dust storm over the eastern Mediterranean in September 2015: satellite, lidar, and surface observations in the Cyprus region, Atmos. Chem. Phys., 16, 13711–13724, https://doi.org/10.5194/acp-16-13711-2016, 2016. a
Mangold, A., Wagner, R., Saathoff, H., Schurath, U., Giesemann, C., Ebert, V., Krämer, M., and Möhler, O.: Experimental investigation of ice nucleation by different types of aerosols in the aerosol chamber AIDA: implications to microphysics of cirrus clouds, Meteorol. Z., 14, 485–497, https://doi.org/10.1127/0941-2948/2005/00532005. a
Marcolli, C.: Deposition nucleation viewed as homogeneous or immersion freezing in pores and cavities, Atmos. Chem. Phys., 14, 2071–2104, https://doi.org/10.5194/acp-14-2071-2014, 2014. a
Marcolli, C.: Pre-activation of aerosol particles by ice preserved in pores, Atmos. Chem. Phys., 17, 1595–1622, https://doi.org/10.5194/acp-17-1595-2017, 2017. a
Marinou, E., Amiridis, V., Binietoglou, I., Tsikerdekis, A., Solomos, S., Proestakis, E., Konsta, D., Papagiannopoulos, N., Tsekeri, A., Vlastou, G., Zanis, P., Balis, D., Wandinger, U., and Ansmann, A.: Three-dimensional evolution of Saharan dust transport towards Europe based on a 9-year EARLINET-optimized CALIPSO dataset, Atmos. Chem. Phys., 17, 5893–5919, https://doi.org/10.5194/acp-17-5893-2017, 2017. a
Marinou, E., Tesche, M., Nenes, A., Ansmann, A., Schrod, J., Mamali, D., Tsekeri, A., Pikridas, M., Baars, H., Engelmann, R., Voudouri, K.-A., Solomos, S., Sciare, J., Groß, S., Ewald, F., and Amiridis, V.: Retrieval of ice-nucleating particle concentrations from lidar observations and comparison with UAV in situ measurements, Atmos. Chem. Phys., 19, 11315–11342, https://doi.org/10.5194/acp-19-11315-2019, 2019. a, b, c, d, e, f, g, h, i, j, k, l, m, n, o, p, q, r
McCluskey, C. S., Hill, T. C. J., Malfatti, F., Sultana, C. M., Lee, C., Santander, M. V., Beall, C. M., Moore, K. A., Cornwell, G. C., Collins, D. B., Prather, K. A., Jayarathne, T., Stone, E. A., Azam, F., Kreidenweis, S. M., and DeMott, P. J.: A dynamic link between ice nucleating particles released in nascent sea spray aerosol and oceanic biological activity during two Mesocosm experiments, J. Atmos. Sci., 74, 151–166, https://doi.org/10.1175/JAS-D-16-0087.1, 2017. a
McCluskey, C. S., Hill, T. C. J., Humphries, R. S., Rauker, A. M., Moreau, S., Strutton, P. G., Chambers, S. D., Williams, A. G., McRobert, I., Ward, J., Keywood, M. D., Harnwell, J., Ponsonby, W., Loh, Z. M., Krummel, P. B., Protat, A., Kreidenweis, S. M., and DeMott, P. J.: Observations of ice nucleating particles over Southern Ocean waters, Geophys. Res. Lett., 45, 11989–11997, https://doi.org/10.1029/2018GL079981, 2018a. a
McCluskey, C. S., Ovadnevaite, J., Rinaldi, M., Atkinson, J., Belosi, F., Ceburnis, D., Marullo, S., Hill, T. C. J., Lohmann, U., Kanji, Z. A., O'Dowd, C., Kreidenweis, S. M., and DeMott P. J.: Marine and terrestrial organic ice-nucleating particles in pristine marine to continentally influenced Northeast Atlantic air masses, J. Geophys. Res.-Atmos., 123, 6196–6212, https://doi.org/10.1029/2017JD028033, 2018b. a
Michaelides, S., Karacostas, T., Sanchez, J. L., Retalis, A., Pytharoulis, I., Homar, V., Romero, R., Zanis, P., Giannakopoulos, C., Bühl, J., Ansmann, A., Merino, A., Melcon, P., Lagouvardos, K., Kotroni, V., Bruggeman, A., Lopez-Moreno, J. I., Berthet, C., Katragkou, E., Tymvios, F., Hadjimitsis, D. G., Mamouri, R. E., and Nisantzi, A.: Reviews and perspectives of high impact atmospheric processes in the Mediterranean, Atmos. Res, 208, 4–44, https://doi.org/10.1016/j.atmosres.2017.11.022, 2018. a
Mitchell, D. L., Garnier, A., Pelon, J., and Erfani, E.: CALIPSO (IIR–CALIOP) retrievals of cirrus cloud ice-particle concentrations, Atmos. Chem. Phys., 18, 17325–17354, https://doi.org/10.5194/acp-18-17325-2018, 2018. a, b
Möhler, O., Benz, S., Saathoff, H., Schnaiter, M., Wagner, R., Schneider, J., Walter, S., Ebert, V., and Wagner, S.: The effect of organic coating on the heterogeneous ice nucleation efficiency of mineral dust aerosols, Environ. Res. Lett., 3, 025007, https://doi.org/10.1088/1748-9326/3/2/025007, 2008. a
Müller, D., Mattis, I., Tatarov, B., Noh, Y. M., Shin, D. H., Shin, S. K., Lee, K. H., Kim, Y. J., and Sugimoto, N.: Mineral quartz concentration measurements of mixed mineral dust/urban haze pollution plumes over Korea with multiwavelength aerosol Raman‐quartz lidar, Geophys. Res. Lett., 37, L20810, https://doi.org/10.1029/2010GL044633, 2010. a
Mülmenstädt, J., Sourdeval, O., Delanoe, J. and Quaas, J.: Frequency of occurrence of rain from liquid-, mixed-, and ice-phase clouds derived from A-Train satellite retrievals, Geophys. Res. Lett., 42(15), 6502–6509, https://doi.org/10.1002/2015GL064604, 2015. a
Murray, B. J., O'Sullivan, D., Atkinson, J. D., and Webb, M. E.: Ice nucleation by particles immersed in supercooled cloud droplets, Chem. Soc. Rev., 41, 6519–6554, https://doi.org/10.1039/c2cs35200a, 2012. a, b, c
Myagkov, A., Seifert, P., Wandinger, U., Bühl, J., and Engelmann, R.: Relationship between temperature and apparent shape of pristine ice crystals derived from polarimetric cloud radar observations during the ACCEPT campaign, Atmos. Meas. Tech., 9, 3739–3754, https://doi.org/10.5194/amt-9-3739-2016, 2016.
Niemand, M., Möhler, O., Vogel, B., Vogel, H., Hoose, C., Connolly, P., Klein, H., Bingemer, H., DeMott, P., Skrotzki, J., and Leisner, T.: Parameterization of immersion freezing on mineral dust particles: an application in a regional scale model, J. Atmos. Sci., 69, 3077–3092, 2012. a, b
Nisantzi, A., Mamouri, R. E., Ansmann, A., and Hadjimitsis, D.: Injection of mineral dust into the free troposphere during fire events observed with polarization lidar at Limassol, Cyprus, Atmos. Chem. Phys., 14, 12155–12165, https://doi.org/10.5194/acp-14-12155-2014, 2014. a
Nisantzi, A., Mamouri, R. E., Ansmann, A., Schuster, G. L., and Hadjimitsis, D. G.: Middle East versus Saharan dust extinction-to-backscatter ratios, Atmos. Chem. Phys., 15, 7071–7084, https://doi.org/10.5194/acp-15-7071-2015, 2015. a
O'Connor, E. J., Illingworth, A. J., and Hogan, R. J.: A Technique for Autocalibration of Cloud Lidar, J. Atmos. Ocean. Tech., 21, 777–786, https://doi.org/10.1175/1520, 2004. a
Pappalardo, G., Amodeo, A., Apituley, A., Comeron, A., Freudenthaler, V., Linné, H., Ansmann, A., Bösenberg, J., D'Amico, G., Mattis, I., Mona, L., Wandinger, U., Amiridis, V., Alados-Arboledas, L., Nicolae, D., and Wiegner, M.: EARLINET: towards an advanced sustainable European aerosol lidar network, Atmos. Meas. Tech., 7, 2389–2409, https://doi.org/10.5194/amt-7-2389-2014, 2014.
Phillips, V., DeMott, P., Andronache, C., Pratt, K., Prather, K., Subramanian, R., and Twohy, C.: Improvements to an empirical parameterization of heterogeneous ice nucleation and its comparison with observations. J. Atmos. Sci., 70, 378–409, https://doi.org/10.1175/JAS-D-12-080.1, 2013. a, b
Pikridas, M., Vrekoussis, M., Sciare, J., Kleanthous, S., Vasiliadou, E., Kizas, C., Savvides, C., and Mihalopoulos, N.: Spatial and temporal(short and long-term) variability of submicron, fine and sub-10 µm particulate matter (PM1, PM2.5, PM10) in Cyprus, Atmos. Environ, 191, 79–93, https://doi.org/10.1016/j.atmosenv.2018.07.048, 2018. a
Prenni, A. J., DeMott, P. J., Rogers, D. C., Kreidenweis, S. M., McFarquhar, G. M., Zhang, G., and Poellot, M. R.: Ice nuclei characteristics from M-PACE and their relation to ice formation in clouds, Tellus, B, 61, 436–448, https://doi.org/10.1111/j.1600-0889.2009.00415.x., 2009. a, b
PollyNET: PollyNET lidar data base, available at: http://polly.rsd.tropos.de/, last access: 8 October 2019. a, b
Price, H. J., Baustian, K. J., McQuaid, J. B., Blyth, A., Bower, K. N., Choularton, T., Cotton, R. J., Cui, Z., Field, P. R., Gallagher, M., Hawker, R., Merrington, A., Miltenberger, A., Neely III, R. R., Parker, S. T., Rosenberg, P. D., Taylor, J. W., Trembath, J., Vergara-Temprado, J., Whale, T. F., Wilson, T. W., Young, G., and Murray, B. J.: Atmospheric Ice-Nucleating Particles in the Dusty Tropical Atlantic, J. Geophys. Res., 123, 2175–2193, https://doi.org/10.1002/2017JD027560, 2018. a, b, c
Pruppacher, H. R. and Klett, J. D.: Microphysics of Clouds and Precipitation, Kluwer Academic Publishers, Dordrecht, 954 pp., 1997. a
Quinn, P. K., Anderson, T. L., Bates, T. S., Dlugi, R., Heintzenberg, J., von Hoyningen-Huene, W., Kulmala, M., Russel, P. B., and Swietlicki, E.: Closure in tropospheric aerosol-climate research: A review and future needs for addressing aerosol direct short-wave radiative forcing, Contrib. Atmos. Phys., 69, 547–577, 1996. a
Radenz, M., Bühl, J., Lehmann, V., Görsdorf, U., and Leinweber, R.: Combining cloud radar and radar wind profiler for a value added estimate of vertical air motion and particle terminal velocity within clouds, Atmos. Meas. Tech., 11, 5925–5940, https://doi.org/10.5194/amt-11-5925-2018, 2018. a, b
Reichardt, J., Wandinger, U., Klein, V., Mattis, I., Hilber, B., and Begbie, R.: RAMSES: German Meteorological Service autonomous Raman lidar for water vapor, temperature, aerosol, and cloud measurements, Appl. Opt., 51, 8111–8131, https://doi.org/10.1364/AO.51.008111, 2012. a
Reichardt, J.: Cloud and Aerosol Spectroscopy with Raman Lidar, J. Atmos. Ocean. Tech., 31, 1946–1963, https://doi.org/10.1175/JTECH-D-13-00188.1, 2014. a
Roberts, P. and Hallett, J.: A laboratory study of the ice nucleating properties of some mineral particulates, Q. J. Roy. Meteor. Soc., 94, 25–34, https://doi.org/10.1002/qj.49709439904, 1968. a
Rolph, G., Stein, A., and Stunder, B.: Real-time Environmental Applications and Display sYstem: READY, Environ. Modell. Softw., 95, 210–228, https://doi.org/10.1016/j.envsoft.2017.06.025, 2017. a, b
Russel, P. B., Livingston, J. M. and Uthe, E. E.: Aerosol induced albedo change: measurement and modelling of an incident, J. Atmos. Sci., 36, 1587–1608, 1979. a
Russell, P. B. and Heintzenberg, J.: An overview of the ACE‐2 clear sky column closure experiment (CLEARCOLUMN), Tellus B, 52, 463–483, https://doi.org/10.1034/j.1600-0889.2000.00013.x, 2000. a
Rutledge, S. A. and Hobbs, P. V.: The mesoscale and microscale structure and organization of clouds and precipitation in midlatitude cyclones, VIII: A model for the seeder-feeder process in warm-frontal rainbands, J. Atmos. Sci., 40, 1185–1206, https://doi.org/10.1175/1520-0469(1983)040<1185:TMAMSA>2.0.CO;2, 1983. a
Sakai, T., Whiteman, D. N., Russo, F., Turner, D. D., Veselovskii, I., Melfi, S. H., Nagai, T., and Mano, Y.: Liquid Water Cloud Measurements Using the Raman Lidar Technique: Current Understanding and Future Research Needs, J. Atmos. Ocean. Tech., 30, 1337–1353, https://doi.org/10.1175/JTECH-D-12-00099, 2013. a
Sakai, T., Nagai, T., Izumi, T., Yoshida, S., and Shoji, Y.: Automated compact mobile Raman lidar for water vapor measurement: instrument description and validation by comparison with radiosonde, GNSS, and high-resolution objective analysis, Atmos. Meas. Tech., 12, 313–326, https://doi.org/10.5194/amt-12-313-2019, 2019. a
Sassen, K.: Cirrus: A modern perspective, in: Cirrus, edited by: Lynch, D. K., Sassen, K., Starr, D. O'C., and Stephens, G., Oxford University Press, ISBN 0-19-513072-3, 2002. a
Schaller, R. C. and Fukuta, N.: Ice nucleation by aerosol particles: Experimental studies using a wedge-shaped ice thermal diffusion chamber, J. Atmos. Sci., 36, 1788–1802, https://doi.org/10.1175/1520-0469(1979)036<1788:INBAPE>2.0.CO;2, 1979. a
Schrod, J., Weber, D., Drücke, J., Keleshis, C., Pikridas, M., Ebert, M., Cvetković, B., Nickovic, S., Marinou, E., Baars, H., Ansmann, A., Vrekoussis, M., Mihalopoulos, N., Sciare, J., Curtius, J., and Bingemer, H. G.: Ice nucleating particles over the Eastern Mediterranean measured by unmanned aircraft systems, Atmos. Chem. Phys., 17, 4817–4835, https://doi.org/10.5194/acp-17-4817-2017, 2017. a, b, c, d, e
Seifert, P., Ansmann, A., Mattis, I., Wandinger, U., Tesche, M., Engelmann, R., Müller, D., Pérez, C., and Haustein, K.: Saharan dust and heterogeneous ice formation: eleven years of cloud observations at a central European EARLINET site, J. Geophys. Res., 115, D20201, https://doi.org/10.1029/2009JD013222, 2010. a
Seifert, P., Ansmann, A., Müller, D., Wandinger, U., Althausen, D., Heymsfield, A. J., Massie, S. T., and Schmitt, C.: Cirrus optical properties observed with lidar, radiosonde, and satellite over the tropical Indian Ocean during the aerosol‐polluted northeast and clean maritime southwest monsoon, J. Geophys. Res., 112, D17205, https://doi.org/10.1029/2006JD008352, 2007. a, b
Seifert, P., Ansmann, A., Groß, S., Freudenthaler, V., Heinold, B., Hiebsch A., Mattis, I., Schmidt, J., Schnell, F., Tesche, M., Wandinger, U., and Wiegner, M.: Ice formation in ash-influenced clouds after the eruption of the Eyjafjallajökull volcano in April 2010, J. Geophys. Res., 116, D00U04, https://doi.org/10.1029/2011JD015702, 2011. a
Seifert, P., Kunz, C., Baars, H., Ansmann, A., Bühl, J., Senf, F., Engelmann, R., Althausen, D., and Artaxo, P.: Seasonal variability of heterogeneous ice formation in stratiform clouds over the Amazon Basin, Geophys. Res. Lett., 42, 5587–5593, https://doi.org/10.1002/2015GL064068, 2015. a
Simmel, M., Bühl, J., Ansmann, A., and Tegen, I.: Ice phase in altocumulus clouds over Leipzig: remote sensing observations and detailed modeling, Atmos. Chem. Phys., 15, 10453–10470, https://doi.org/10.5194/acp-15-10453-2015, 2015. a
Sourdeval, O., Gryspeerdt, E., Krämer, M., Goren, T., Delanoë, J., Afchine, A., Hemmer, F., and Quaas, J.: Ice crystal number concentration estimates from lidar–radar satellite remote sensing – Part 1: Method and evaluation, Atmos. Chem. Phys., 18, 14327–14350, https://doi.org/10.5194/acp-18-14327-2018, 2018. a
Späth, F., Behrendt, A., Muppa, S. K., Metzendorf, S., Riede, A., and Wulfmeyer, V.: 3-D water vapor field in the atmospheric boundary layer observed with scanning differential absorption lidar, Atmos. Meas. Tech., 9, 1701–1720, https://doi.org/10.5194/amt-9-1701-2016, 2016. a
Spichtinger, P. and Gierens, K. M.: Modelling of cirrus clouds – Part 1b: Structuring cirrus clouds by dynamics, Atmos. Chem. Phys., 9, 707–719, https://doi.org/10.5194/acp-9-707-2009, 2009a. a, b
Spichtinger, P. and Gierens, K. M.: Modelling of cirrus clouds – Part 2: Competition of different nucleation mechanisms, Atmos. Chem. Phys., 9, 2319–2334, https://doi.org/10.5194/acp-9-2319-2009, 2009b. a, b
Stein, A. F., Draxler, R. R., Rolph, G. D., Stunder, B. J. B., Cohen, M. D., and Ngan, F.: NOAA's HYSPLIT atmospheric transport and dispersion modeling system, B. Am. Meteorol. Soc., 96, 2059–2077, https://doi.org/10.1175/BAMS-D-14-00110.1, 2015. a, b
Stocker, T. F., Qin, D., Plattner, G.-K., Tignor, M., Allen, S. K., Boschung, J., Nauels, A., Xia, Y., Bex, V., and Midgley, P. M. (Eds.): IPCC, 2013: Climate Change 2013: The Physical Science Basis. Contribution of Working Group I to the Fifth Assessment Report of the Intergovern-mental Panel on Climate Change, Cambridge University Press, Cambridge, United Kingdom and New York, NY, USA, 1535 pp, 2013. a
Storelvmo, T., Boos, W. R., and Herger, N.: Cirrus cloud seeding: a climate engineering mechanism with reduced side effects?, Philos. T. Roy. Soc. A, 372, 20140116, https://doi.org/10.1098/rsta.2014.0116, 2014. a, b
Strandgren, J.: The life cycle of anvil cirrus clouds from a combination of passive and active satellite remote sensing, PhD thesis, 133 pp., Ludwig-Maximilians-Universität München, Germany, 2018. a
Sullivan, R. C., Minambres, L., DeMott, P. J., Prenni, A. J., Carrico, C. M., Levin, E. J. T., and Kreidenweis, S. M.: Chemical processing does not always impair heterogeneous ice nucleation of mineral dust particles, Geophys. Res. Lett., 37, L24805, https://doi.org/10.1029/2010gl045540, 2010a. a
Sullivan, R. C., Petters, M. D., DeMott, P. J., Kreidenweis, S. M., Wex, H., Niedermeier, D., Hartmann, S., Clauss, T., Stratmann, F., Reitz, P., Schneider, J., and Sierau, B.: Irreversible loss of ice nucleation active sites in mineral dust particles caused by sulphuric acid condensation, Atmos. Chem. Phys., 10, 11471–11487, https://doi.org/10.5194/acp-10-11471-2010, 2010b. a
Sullivan, S., Hoose, C., and Nenes, A.: Investigating the contribution of secondary ice production to in-cloud ice crystal numbers, J. Geophys. Res.-Atmos., 122, 9391–9412, https://doi.org/10.1002/2017JD026546, 2017. a, b
Sullivan, S. C., Hoose, C., Kiselev, A., Leisner, T., and Nenes, A.: Initiation of secondary ice production in clouds, Atmos. Chem. Phys., 18, 1593–1610, https://doi.org/10.5194/acp-18-1593-2018, 2018. a, b
Tatarov, B. and Sugimoto, N.: Estimation of quartz concentration in the tropospheric mineral aerosols using combined Raman and high-spectral-resolution lidars, Opt. Lett., 30, 3407–3409, https://doi.org/10.1364/OL.30.003407, 2005. a
Tatarov, B., Müller, D., Shin, D., Shin, S.-K., Mattis, I., Seifert, P., Min, N. Young, K. Y., and Sugimoto, N.: Lidar measurements of Raman scattering at ultraviolet wavelength from mineral dust over East Asia, Opt. Exp., 19. 1569–1581, https://doi.org/10.1364/OE.19.001569, 2011. a
Ullrich, R., Hoose, C., Möhler, O., Niemand, M., Wagner, R., Höhler, K., Hiranuma, N., Saathoff, H., and Leisner, T.: A new ice nucleation active site parameterization for desert dust and soot, J. Atmos. Sci., 74, 699–717, 2017. a, b, c, d, e, f, g
Vali, G., DeMott, P. J., Möhler, O., and Whale, T. F.: Technical Note: A proposal for ice nucleation terminology, Atmos. Chem. Phys., 15, 10263–10270, https://doi.org/10.5194/acp-15-10263-2015, 2015. a
Wang, Z., Whiteman, D. N., Demoz, B. B., and Veselovskii, I.: A new way to measure cirrus cloud ice water content by using ice Raman scatter with Raman lidar, Geophys. Res. Lett., 31, L15101, https://doi.org/10.1029/2004GL020004, 2004. a
Welti, A., Müller, K., Fleming, Z. L., and Stratmann, F.: Concentration and variability of ice nuclei in the subtropical maritime boundary layer, Atmos. Chem. Phys., 18, 5307–5320, https://doi.org/10.5194/acp-18-5307-2018, 2018. a
Welti, A., Lohmann, U., and Kanji, Z. A.: Ice nucleation properties of K-feldspar polymorphs and plagioclase feldspars, Atmos. Chem. Phys., 19, 10901–10918, https://doi.org/10.5194/acp-19-10901-2019, 2019. a
Westbrook, C. and Illingworth, A.: The formation of ice in a long-lived supercooled layer cloud, Q. J. Roy. Meteor. Soc., 139, 2209–2221, 2013. a
Wex, H., DeMott, P. J., Tobo, Y., Hartmann, S., Rösch, M., Clauss, T., Tomsche, L., Niedermeier, D., and Stratmann, F.: Kaolinite particles as ice nuclei: learning from the use of different kaolinite samples and different coatings, Atmos. Chem. Phys., 14, 5529–5546, https://doi.org/10.5194/acp-14-5529-2014, 2014. a
Wex, H., Huang, L., Zhang, W., Hung, H., Traversi, R., Becagli, S., Sheesley, R. J., Moffett, C. E., Barrett, T. E., Bossi, R., Skov, H., Hünerbein, A., Lubitz, J., Löffler, M., Linke, O., Hartmann, M., Herenz, P., and Stratmann, F.: Annual variability of ice-nucleating particle concentrations at different Arctic locations, Atmos. Chem. Phys., 19, 5293–5311, https://doi.org/10.5194/acp-19-5293-2019, 2019. a
- Abstract
- Introduction
- Short review on cloud closure experiments in the case of mixed-phase and ice clouds
- Cyprus field campaigns
- INPC and ICNC from ground-based active remote sensing
- Field observations and closure studies
- Summary and conclusions
- Data availability
- Author contributions
- Competing interests
- Special issue statement
- Acknowledgements
- Financial support
- Review statement
- References