the Creative Commons Attribution 4.0 License.
the Creative Commons Attribution 4.0 License.
 | 11 Dec 2019
Evaluation of hygroscopic cloud seeding in liquid-water clouds: a feasibility study
Fei Wang
Qi Jiang
Gaili Wang
Shuo Jia
Jing Duan
Yuquan Zhou
An airborne cloud seeding experiment was conducted over the eastern coast of Zhejiang, China, on 4 September 2016 during a major international event held in Hangzhou. In an attempt to reduce the likelihood of rainfall onset, a major airborne experiment for weather modification took place by seeding hygroscopic agents to warm clouds to reduce cloud droplet size. The effectiveness of seeding is examined, mainly for stratiform clouds with patchy small convective cells. A radar-domain-index (RDI) algorithm was proposed to analyze the seeding effect. The threshold strategy and the tracking radar echo by correlation (TREC) technique was applied in the domain selection. Factors analyzed include echo reflectivity parameters such as the mean and maximum echo intensity, the anomaly percentage of the grid number of effective echoes, the fractional contribution to the total reflectivities, and the vertically integrated liquid (VIL) water content during and after the seeding process. About 12 min after seeding ended, the composite reflectivity of seeded clouds decreased to a minimum (< 10 dBz) and the VIL of seeded clouds was ∼0.2 kg m−3. The echo top height dropped to ∼3.5 km, and the surface echoes were also weakened. By contrast, there was no significant variation in these echo parameters for the surrounding non-seeded clouds. The seeded cell appeared to have the shortest life cycle, as revealed by applying the cloud-cluster tracking method. The airborne Cloud Droplet Probe (CDP) measured cloud number concentration, effective diameter, and liquid water content, which gradually increased after the start of cloud seeding. This is probably caused by the hygroscopic growth of agent particles and collision–coalescence of small cloud droplets. However, these parameters sampled at ∼40 min after seeding decreased significantly, which is probably due to the excessive seeding agents generating a competition for cloud water and thus suppressing cloud development and precipitation. Overall, the physical phenomenon was captured in this study, but a more quantitative in-depth analysis of the underlying principle is needed.
- Article
(2385 KB) - Full-text XML
-
Supplement
(607 KB) - BibTeX
- EndNote


Weather modification, mainly by cloud seeding, is a common technique of changing the amount or intensity of precipitation. Cloud seeding activities include dispersing agents to a cloud by a ground-based generator (Dessens, 1998), rockets (Warburton et al., 1982; Radinović and Ćurić, 2007), and aircraft (Jung et al., 2015; French et al., 2018). The seeding agents can serve as cloud condensation nuclei (CCN) to advance the collision–coalescence process in warm clouds (Jensen and Lee, 2008; Jung et al., 2015), or serve as ice nuclei (IN) to convert liquid water into ice crystals and strengthen vapor deposition, riming, and aggregation processes in super-cooled clouds. The theories behind hygroscopic and glaciogenic cloud seeding have been well documented (Schaefer, 1946; Vonnegut, 1947; Bowen, 1952), but the actual effect in practice remains highly uncertain and even controversial (Council, 2003).
Many laboratory, modeling, and field experimental studies on cloud seeding have been conducted for more than a half-century, and assessing the effectiveness of cloud seeding is very challenging due to notorious difficulties in gaining convincing scientific evidence. The randomized evaluation of cloud seeding based on multiple samples has been performed with relatively high support and confidence (Gagin and Neumann, 1981; Silverman, 2001). However, conducting a long-term, well-designed, and randomized cloud seeding experiment is fraught with difficulties and uncertainties (Guo et al., 2015). Relative to modeling and statistical evaluations, much fewer studies have been done to acquire direct observational evidence in field experiments on the effectiveness of cloud seeding (Kerr, 1982; Mather et al., 1997; Silverman, 2003). Encouraged by some recent successes (Tessendorf et al., 2012, 2018), we have attempted to investigate the effectiveness of cloud seeding by exploring different evaluation methods.
Presented here is a study assessing the cloud seeding effect by injecting hygroscopic particles into a convective cell in a warm stratocumulus cloud for the prevention of rainfall. Hygroscopic seeding to promote the drop collision–coalescence process in liquid-water clouds has been investigated for some time (Bowen, 1952). Rosenfeld et al. (2010) concluded that hygroscopic seeding was generally guided by three conceptual models: seeding with large CCN that serve as embryos for raindrops, acceleration of the coalescence process via the competition effect, and widening of cloud drop size distribution though the tail effect. However, hygroscopic materials of different properties, concentrations, and size distributions may have positive or negative responses to cloud seeding. Previous studies (Bruintjes, 2003; Belyaeva et al., 2013) have shown that introducing a certain amount of CCN into clouds could broaden the cloud droplet spectrum at the initial stage of condensation, intensify coagulation during the formation of precipitation, and enhance the lifetime of convective clouds by changing their vertical structure. For example, flares generate giant hygroscopic particles which could shift the cloud drop size distribution toward large sizes, thereby promoting the coalescence process and enhancing precipitation (Tzivion et al., 1994; Cooper et al., 1997). A modeling study (Segal et al., 2004) showed that hygroscopic particles with diameters (D) of 3–6 µm are optimal for enhancing precipitation in liquid-water clouds. Conversely, high concentrations of small hygroscopic particles may suppress precipitation (Rosenfeld et al., 2008) or cause a delayed onset of precipitation (Rosenfeld et al., 2014; Guo et al., 2016; Lee et al., 2016). The increasing CCN from anthropogenic pollution causes higher cloud drop concentration and a narrower droplet spectrum, leading to suppressed drizzle formation and prolonged stratiform clouds (Bruintjes, 2003). They also produce brighter clouds that are less efficient in precipitation (Albrecht, 1989). Some modeling studies on hygroscopic seeding have suggested similar effects, such as Yin et al. (2000), who reported that particles with D less than 2 µm had a negative effect on rain development in convective clouds.
Radar observation has been used to probe any changes in cloud properties after seeding (Hobbs et al., 1981; French et al., 2018). To this end, radar-based methodologies have been developed such as the Thunderstorm Identification, Tracking, Analysis and Nowcasting (TITAN, Dixon and Wiener, 1993) and Tracking Radar Echo by Correlation (TREC, Rinehart and Garvey, 1978), which were used in cloud seeding experiments (Rosenfeld, 1987; Woodley and Rosenfeld, 2004). The traditional Z–R relationship for estimating rainfall has also been widely used in randomized cloud seeding experiments (Dennis et al., 1975; Cunning Jr., 1976).
China has the world's largest operational program of weather modification (Guo et al., 2015). The airborne and ground-based instrumentation has been greatly enhanced, which helped reduce the observation uncertainties. Several field experiments were conducted in recent years for more scientific identification and quantification of the cloud seeding effects (Lu and Guo, 2012; Zhu et al., 2015; Wang et al., 2019), but their effectiveness remains highly uncertain, with some critical issues not being resolved yet.
The goals of this study are to evaluate any consequence of aircraft hygroscopic seeding and to develop a feasible method for analyzing the cloud seeding effect for stratocumulus clouds by the following means:
- a.
analyzing the variability of radar parameters in nearby regions with and without seeding
- b.
tracking and comparing the lifetime between seeded and unseeded echoes
- c.
examining the variation of surface precipitation
- d.
analyzing the cloud microphysics before and after cloud seeding.
2.1 Experimental and data description
Unlike the usual practice of cloud seeding that chiefly aims at triggering and enhancing rainfall, our seeding was intended for suppressing rainfall by using hygroscopic agents. A series of field experiments were conducted off the eastern coast of Zhejiang during August and September 2016. A ground-based Doppler S-band radar deployed at Zhoushan (30.07∘ N, 122.11∘ E, ∼438 m above sea level) provided useful information for the identification of seeding echoes. The volume scan pattern (VCP) was the standard mode of precipitation observation in 6 min intervals and a minimum elevation angle of about 0.5∘. A twin turboprop (Modern Ark 60, MA-60) research aircraft was responsible for cloud seeding. This was equipped with in situ probes to measure aerosol, cloud, and rainfall particles that are integrated in a system developed by the Droplet Measurement Technologies Inc. (DMT), which provided cloud microphysical observations. The aircraft-mounted cloud physics probe relevant to this study is the Cloud Droplet Probe (CDP) which resolves cloud drops with D ranging from 2 to 50 µm. Details about the uncertainties of the CDP and the CDP-estimated liquid water content (LWP) in liquid-water clouds have been described in other studies (Lance et al., 2010; Lance, 2012; Faber et al., 2018). Air temperature was also measured to ascertain if a cloud is in liquid phase. The typical speed of the aircraft is 60–70 m s−1 during the cloud seeding and cloud microphysics sampling operations. The frequency of data acquisition is 1 Hz in this study.
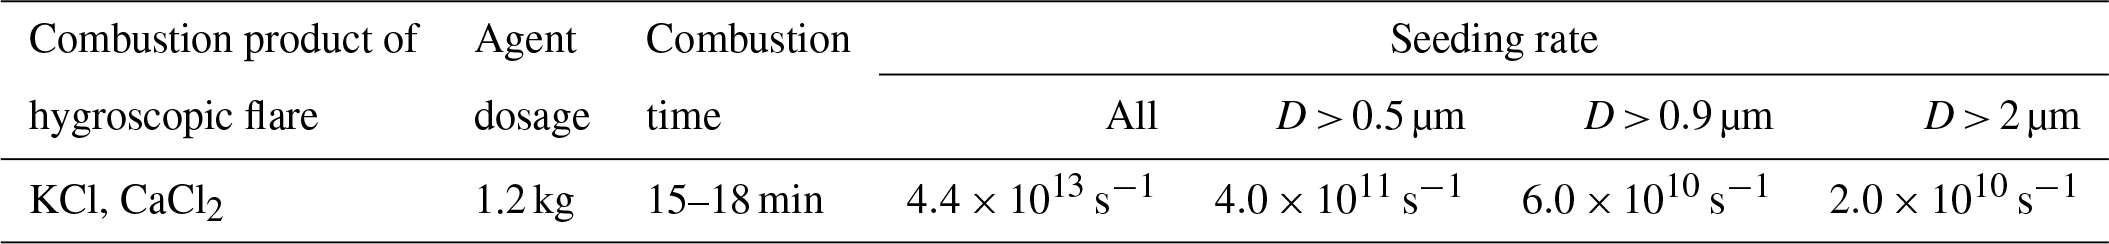
The hygroscopic cloud seeding agent used in the experiment was the ZY-1NY flare developed by Shannxi Zhongtian Rocket Technology. The combustion product of ZY-1NY flares primarily consists of potassium chloride (KCl) and calcium chloride (CaCl2), which leads to the formation of accumulation- and coarse-mode hygroscopic aerosols (D > 0.5 µm) in the shape of salt aggregates. The agent was set to disperse the hygroscopic particles at a rate of s−1 under laboratory conditions. For hygroscopic particles larger than D > 0.5 µm, D > 0.9 µm, and D > 2 µm, we estimate that , , and hygroscopic particles were emitted per second, respectively. Table 1 gives details about the technical parameters of the ZY-1NY cloud seeding flare.
Table 1Technical parameters of the ZY-1NY cloud seeding flare.
Marine stratocumulus clouds were observed off the coast of eastern Zhejiang on 4 September 2016. Figure 1a shows the cloud image of Himawari-8 in the visible channel (0.47 µm) at 03:00 UTC. There was a wide range of stratiform cloud over eastern China, and a severe tropical storm (Typhoon Namtheun, NO. 1612) located near Yatsushiro Sea. Because of the co-work of these two systems, a weak easterly wave was developing off the east coast of Zhenjiang. Inhomogeneity internal structure within a low-level cloud deck was captured from satellite images. The cloud showed an apparently dual-layer structure over the experimental region. The wide-range continental cloud of 8–12 km height was dominated by west winds, while the easterly wave cloud, which mainly blew under 4 km, was dominated by east winds (Figs. 1b and Supplement S1). From the cloud optical depth (COD) of the satellite image in Fig. 1c, the large values of COD were mainly contributed by the low-level cloud.
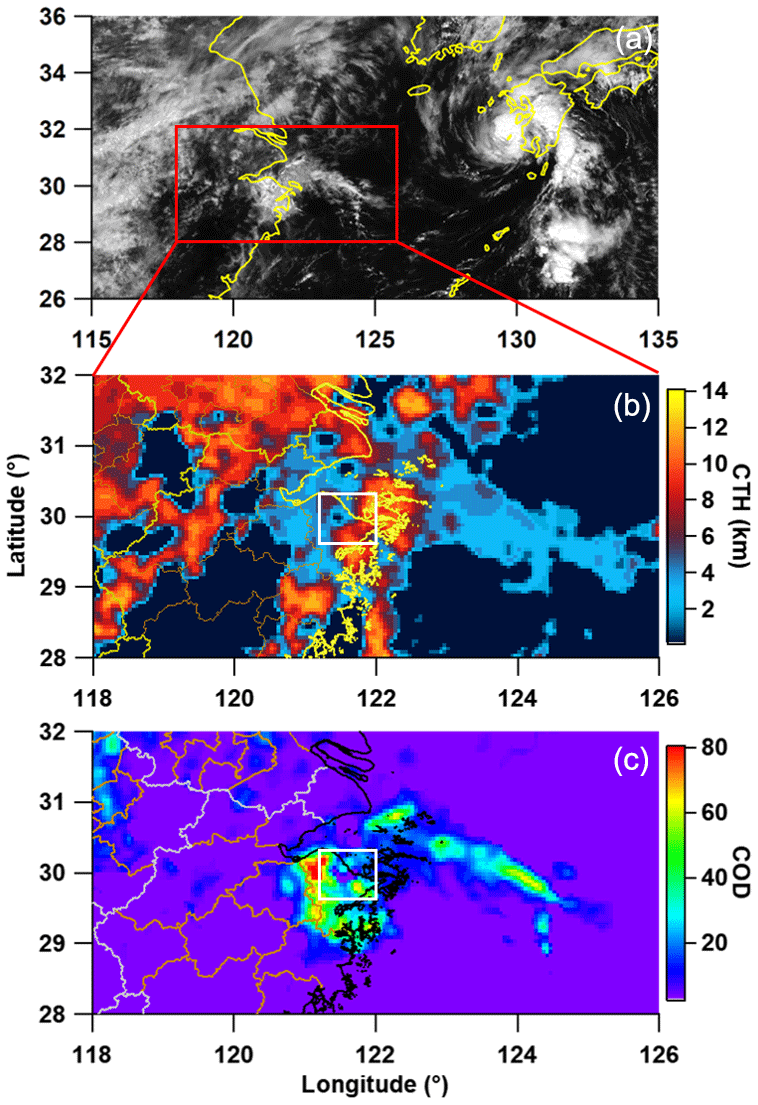
Figure 1Cloud image of Himawari-8 at visible channel (a), cloud top height (b), and cloud optical depth (c) at 03:00 UTC. The rectangles in (b) and (c) indicate the experimental region.
Real-time Himawari-8 satellite and ground-based radar images were used to identify cloud decks for cloud seeding purposes. As our focus is on hygroscopic seeding, sounding data can help us monitor the vertical structure of atmosphere and identify liquid-water clouds. As part of the radiosonde observational network operated by the China Meteorological Administration (CMA), Shanghai (31.40∘ N , 121.44∘ E; ∼150 km north of the experiment area), Hangzhou (30.25∘ N, 120.16∘ E; ∼150 km west of the experiment area), and Taizhou (28.62∘ N, 121.41∘ E; ∼150 km south of the experiment area) stations provide fine-resolution measurements of temperature, relative humidity, and wind speed and direction. The uncertainties of relative humidity and temperature measured by radiosonde are addressed in the Supplement. Routine meteorological measurements, especially rain gauge data of hourly precipitation, made by the CMA are also used. Together, they provided information on the state of the atmosphere and cloud properties that are critical to the seeding experiment and the design of the sampling flight pattern in and out of clouds. The MA-60 aircraft seeded the clouds along a circular trajectory ∼5 km in diameter centered at ∼29.8∘ N, 121.8∘ E. Eight ZY-1NY flares were burned in the middle part of the cloud (1900–2200 m). Since the mean wind direction was northeasterly at the seeding altitude, the seeded cloud exposed to burned flares moved toward the southwest. The aircraft sampled the seeded cloud about 15 min after the seeding was completed so that the seeding effect could be studied. Figure 2 shows the flight track of the aircraft and the sampling position of the seeded cloud.
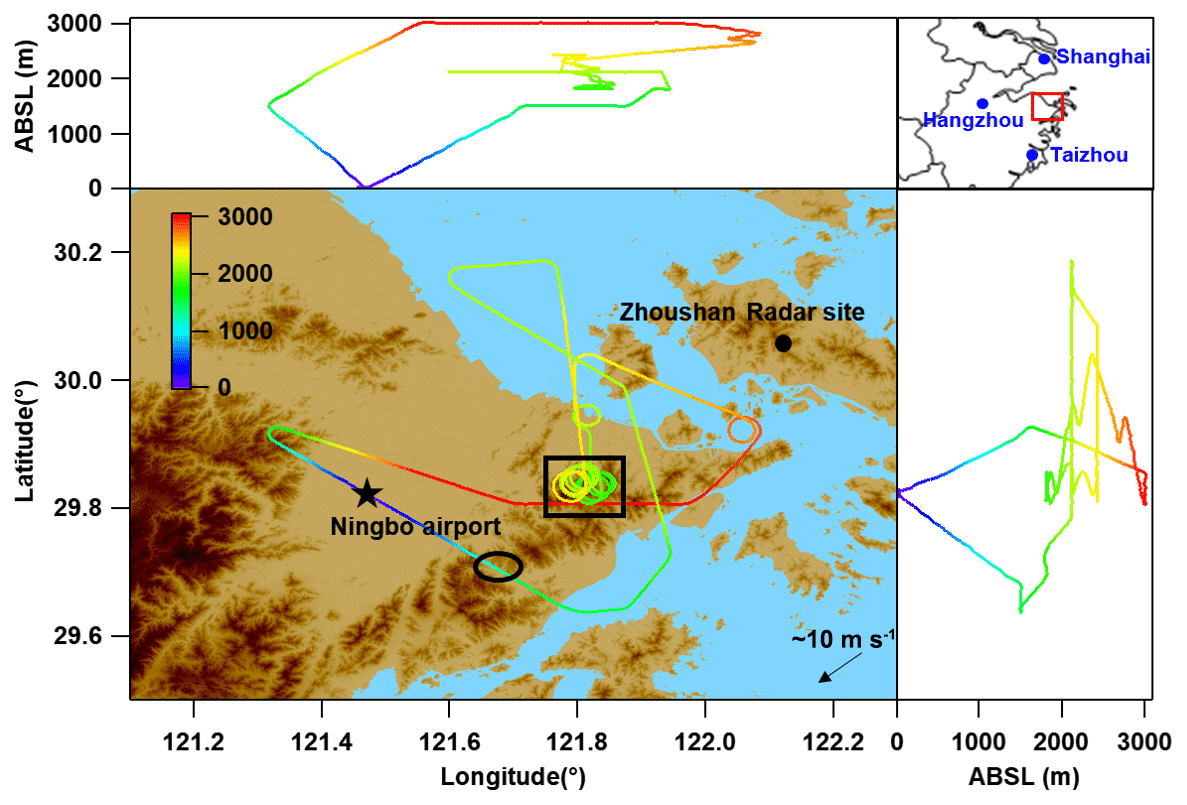
Figure 2Geographical location of the experimental region (top right: the red box denotes the flight region, the blue spots denote the Shanghai, Hangzhou, and Taizhou radiosonde stations) and the flight track of the research flight (top left and bottom right subplots indicate the flight profile along longitude and latitude). The black box shows the area of cloud seeding, and the black oval shows the area where post-seeding observations of the seeded clouds were made. Map data are sourced from © CGIAR-CSI.
2.2 Radar-domain-index (RDI) algorithm
The ground-based S-band radar and airborne CDP data were analyzed to evaluate the efficacy of cloud seeding. Since there was a sufficient amount of water vapor in the lower atmosphere of the experimental region on 4 September 2016, the cloud seeding region was mainly covered by stratiform clouds with patchy small convective cells. The radar-domain-index (RDI) method based on radar grid data is proposed to analyze the cloud seeding effect.
The radar grid data used by the RDI method are from the Doppler Weather Radar 3D Digital Mosaic System (RDMS, Wang et al., 2009). Quality control was performed on the reflectivity data to remove electronic interference, ground clutter, and anomalous propagations. The 3-D Cartesian-gridded reflectivity data were then interpolated in the spherical coordinate system (Wang et al., 2012, 2013). The interpolation method is a nearest-neighbor scheme on the range-azimuth plane combined with a linear interpolation in the vertical direction. This method has proved to be a sound scheme that retains high-resolution structures comparable to the raw data (Xiao et al., 2008). Based on high spatial–temporal resolution 3-D mosaic reflectivity data, several radar features were obtained from the RDMS: the radar constant altitude plan position indicator (CAPPI), composite reflectivity (CR), and vertically integrated liquid (VIL). The vertical resolution of CAPPI was 500 m, and the horizontal resolution was (∼1 km ×1 km). The temporal resolution was 6 min.
The effect of cloud seeding was analyzed following the RDI method that is based on radar echo parameters before and after seeding over the same or different areas, depending on the motion of the seeded clouds. For example, assuming that a strong echo in the black rectangle is a seeded cloud, three domains can be defined: Domain A as the effective detection scope of the Doppler radar (Fig. 3a), Domain B as the possible influence area of the seeded cloud based on the diffusion of agents by wind and the motion of the seeding plume (Fig. 3b), and Domain C as a movable region which represents the seeding echoes at a particular time (Fig. 3c). In Domain C, a threshold value of reflectivity and the TREC technique (Rinehart and Garvey, 1978; Tuttle and Gall, 1999) are performed to identify and track the motion of the seeded echo, and the echo parameters in this domain are also calculated. Details about the TREC method are provided in the Supplement.
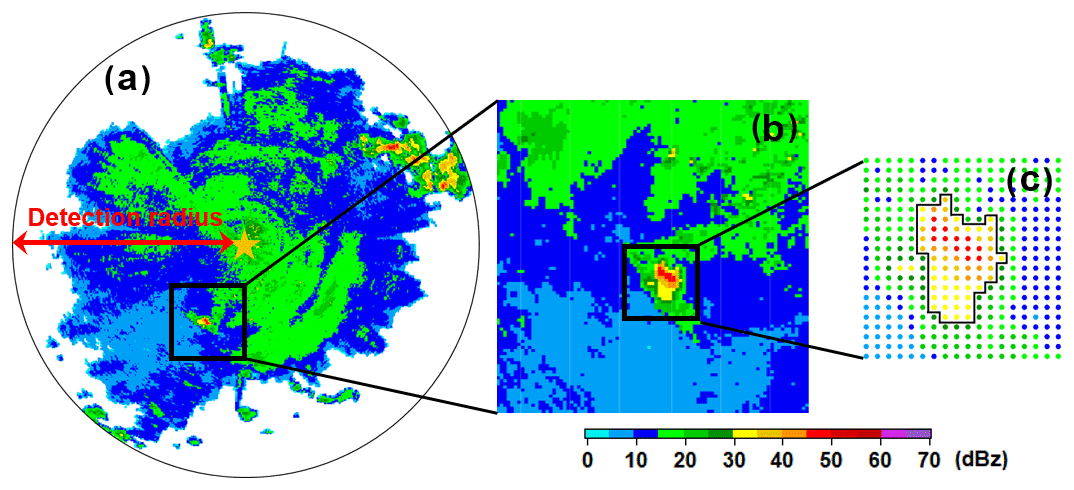
Figure 3Schematic diagrams showing how the RDI method selects a domain. A single radar is used as an example here. (a) The background radar echo field is defined as Domain A. The orange star shows the location of the radar site. The effective detection scope (corresponding to Domain A) is . (b) The black rectangle outlines Domain B, representing a or polluted region that was affected by seeding agents based on the motion of the seeded cloud or seeding plumes. (c) Domain C is a movable region using the threshold strategy and the TREC technique. The background field (Domain A) and the polluted region (Domain B) could be adjusted according to the scope of the seeding plume such as the regional mosaic reflectivity field retrieved by multiple radars.
Typical parameters related to the seeding evaluation by the RDI method include echo size, duration, and intensity. This study presents statistical analyses of the reflectivity pixels of the seeded clouds and the variation in CAPPI at the height of the seeding layer. Since the seeding altitude was ∼2 km and taking the vertical diffusion of hygroscopic particles into consideration, five levels of gridded CAPPI data are selected (from 1000 to 3000 m in 500 m intervals). Quantities calculated at each level include the anomaly percentage of the gird number of effective echoes (σ), the maximum and mean echo intensity (ref_max and ref_mean), and the fractional contribution to the total reflectivities (FCRi). VIL level in the three domains are also calculated.
Although the RDI method could be used to evaluate the effect of cloud seeding by analyzing the variation in the echo parameters over a wide area during and after the seeding, it still has some limitations. For example, the targeted cloud should ideally be stratiform with an embedded convective core, and the echo parameters of Domains A and B are better when they are homogeneous and fluctuate linearly to obtain stable systematic movement during the period of study so that the data have good consistency and small standard deviations. Additionally, the targeted cloud must be seeded as sufficiently as possible.
2.3 Echo-cluster tracking and identification algorithm
For comparisons with the RDI results, an echo-cluster tracking and identification algorithm was launched to evaluate the seeding effect. As a physical testing method, the algorithm was applied to track the seeded echo and surrounding non-seeded echoes for comparative analyses, which is similar to the TITAN algorithm (Wang et al., 2019). A reflectivity threshold was defined to ensure that the life history of these echoes could be objectively and completely characterized. The meteorological and topographical similarity were also required while selecting echoes for comparison. Radar parameters such as echo top height, echo volume, and maximum reflectivity were calculated to track the echo evolution. Variation of these parameters were analyzed to determine the effectiveness of cloud seeding. Details about the algorithm and uncertainties have been described elsewhere (Rosenfeld, 1987; Dixon and Wiener, 1993; Woodley and Rosenfeld, 2004).
3.1 Evaluation by RDI algorithm
Raw data from the Zhoushan-based S-band Doppler Radar were obtained as input to the RDI algorithm to evaluate the efficacy of cloud seeding. Through analyzing the Shanghai, Hangzhou, and Taizhou stations' sounding data on 06:00 UTC, we calculated the wind speed and direction at the altitude of the seeding layer (Fig. S1). By taking into consideration the change of wind field during and after cloud seeding, the direction in which the target radar echo moved and its speed were approximated. Table 2 defines the domains for evaluation purposes.
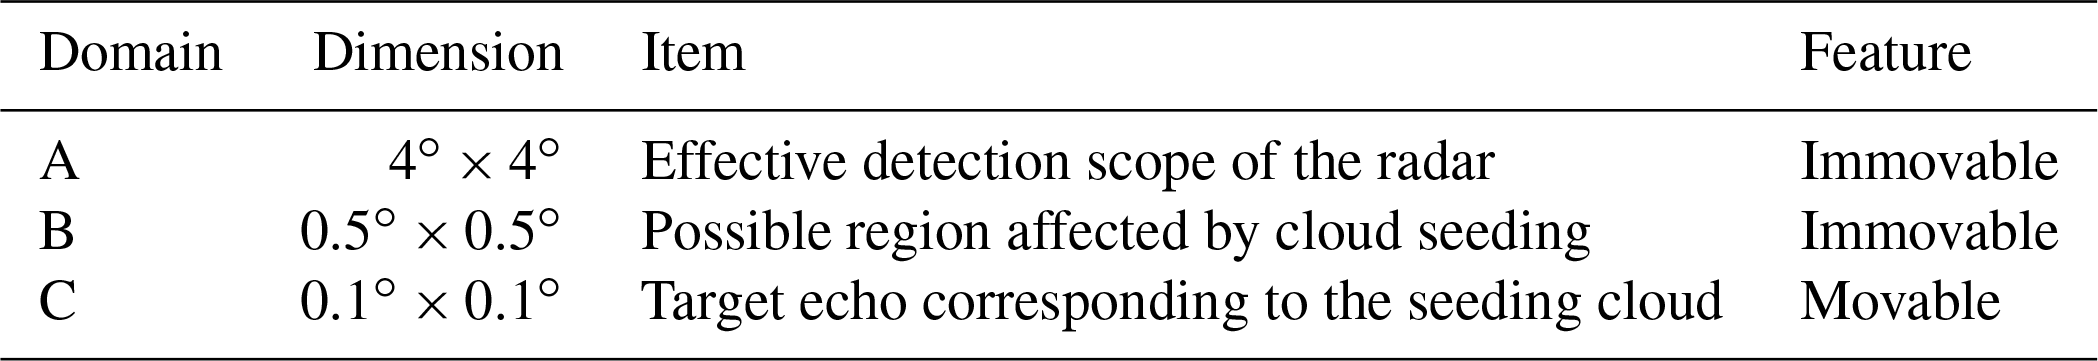
Figure 4 shows the time series of σ and ref_mean. There is no significant variance in σ (±1.59 %), and the ref_mean is ∼9.1 dBz (±0.3 dBz) in Domain A during the intensive operation period (03:00–04:48 UTC), but σ shows a gradual reduction in domain B (−15.02 %) and C (−25.25 %). In Domain C in particular, the σ value dramatically decreased after cloud seeding ended. Similarly, the ref_mean of Domain B and C fell to ∼8 dBz at 04:00 UTC, which was even lower than the background value (ref_mean of Domain A). The variation of echo intensity in Domain B and C is beyond that caused by natural variability (Domain A), from which it can be concluded that cloud seeding played a significant role in it. From another side, this comparison of σ and ref_mean in the three domains suggests that the cloud seeding of an individual convective cell embedded in a widespread stratiform cloud contributes little to the natural variability of radar echoes at large scales. The dissipation of the seeded cloud, as evidenced by the variation in σ and ref_mean in Domain B and C, is preliminarily considered the result of excessive seeding by hygroscopic particles.
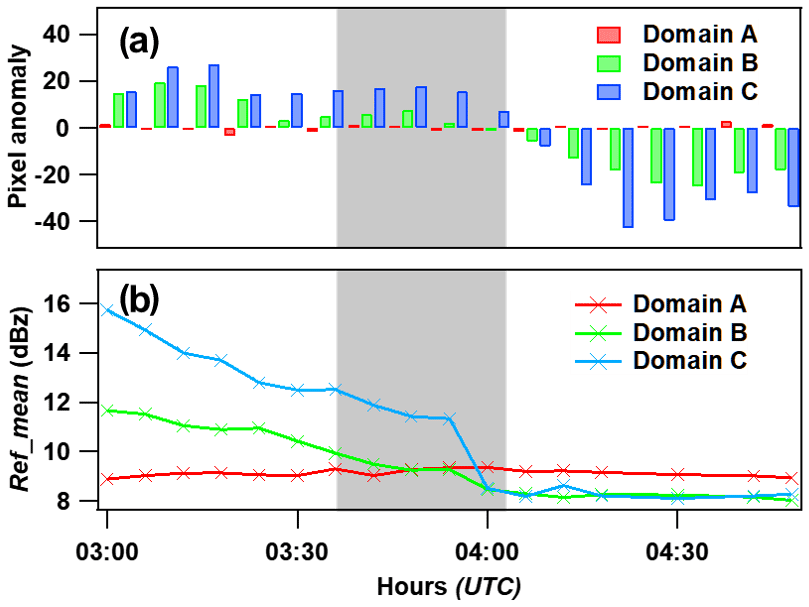
Figure 4Time series of (a) the anomaly percentage of grid number of effective echoes and (b) mean echo intensity (ref_mean) in Domain A, B, and C. The five CAPPI levels are considered. Gray shaded areas show when cloud seeding was done.
Figure 5 shows the time series of the fractional contribution to the total reflectivities (FCRi, where i represents the ith reflectivity bin: ≤0, 0–10, 10–20, 20–30, ≥30 dBz) in Domain A, B, and C. The FCRi in these domains can be compared to assess differences in ranges. There was little variation in reflectivity across all bins in Domain A (Fig. 5). About 80 % of the grid points in this domain had reflectivity values between 10 and 30 dBz. However, FCR and FCR(i≥30 dBz) decreased gradually over time in Domain B and C. In particular, after cloud seeding, FCR(i≥30 dBz) decreased to a minimum (∼0 %) in Domain C. The influence of cloud seeding on FCR is not significant. The time series of FCR(i<10 dBz) show different trends: an almost invariant trend in domain A (between 58.2 % and 62.6 %), a slight increasing trend in domain B (from 48 % to 66 %), and a stronger increasing trend in domain C (from 27 % to 69 %). These results suggest that cloud seeding effectively weakens the development of strong echoes (> 20 dBz). Meanwhile, accompanied by the seeding process, the appearance of weak echoes (< 10 dBz) increases.
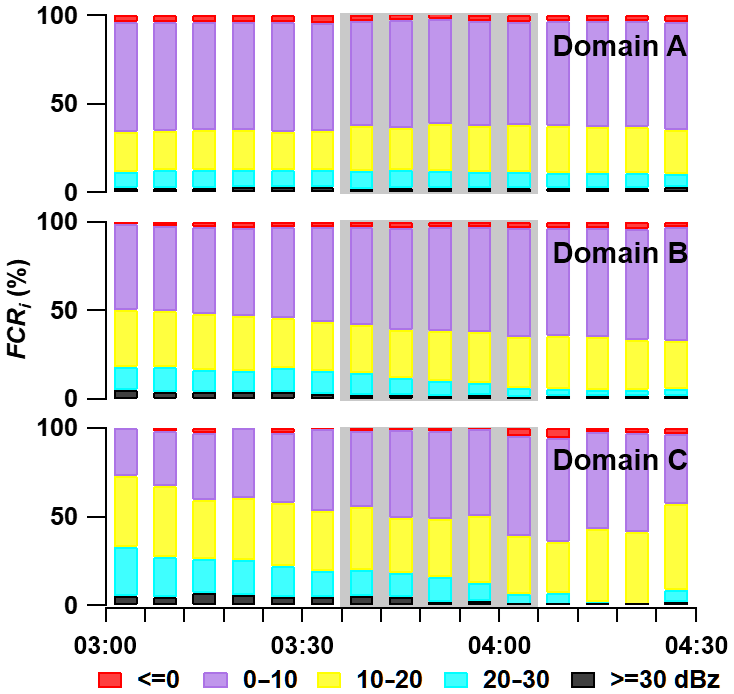
Figure 5Time series of the fractional contribution to the total reflectivities (FCRi, where i represents the ith reflectivity bin: ≤0, 0–10, 10–20, 20–30, ≥30 dBz) in Domain A, B, and C. The five CAPPI levels are considered. Gray shaded areas show when cloud seeding was done.
The cloud layer in the lower troposphere moved from the northeast to the southwest. The cloud seeding started at 03:36 UTC, and a corresponding maximum reflectivity of over ∼35 dBz was seen (Fig. 6a). From the vertical cross section along the violet line in Fig. 6a, there were strong echoes near the surface, and the echo top height was ∼4.2 km (Fig. 6c). As the seeding operation continued, CR and VIL decreased in varying degrees, and the targeted cloud gradually dissipated (see Figs. S3 and S4). About 12 min after seeding ended (04:18 UTC), CR decreased to a minimum (∼10 dBz) and VIL was ∼0.2 kg m−3 (Fig. 6e). The echo top height dropped to ∼3.5 km, and the surface echoes also weakened.
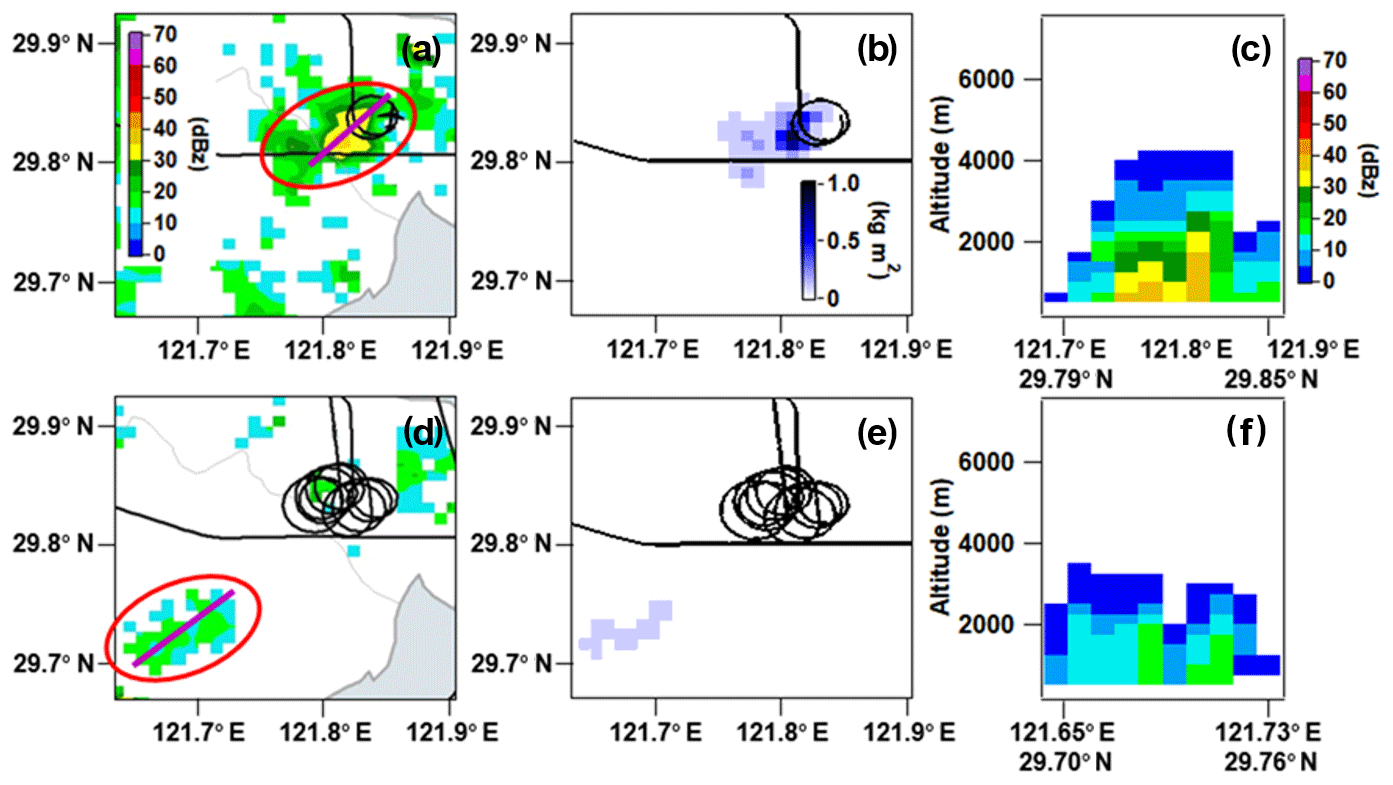
Figure 6(a, d) Composite reflectivity from the five levels (1000–3000 m in 500 m intervals), (b, e) vertically integrated liquid water content, and (c, f) vertical cross section (along the violet lines in a, d) of the seeding echo. The top panels are for the start of cloud seeding (03:36 UTC), and the bottom panels are for 12 min after the end of seeding (04:18 UTC). The red ovals in (a) and (d) outline the seeding cloud, and the black lines show the flight tracks. To clearly show the seeding cloud in (a) and (d), weak echoes (< 10 dBz) are rejected.
3.2 Evaluation by the echo-cluster tracking and identification algorithm
Besides the RDI method, an echo-cluster tracking and identification algorithm was applied to evaluate seeding efficacy. The echo volumes and mean CR from 01:00 to 06:00 UTC, i.e., the 3 h period around the seeding time, were examined to identify convective cells in Domain A. Using a reflectivity threshold of CR (∼19 dBz), four other cells were identified (Fig. 7).
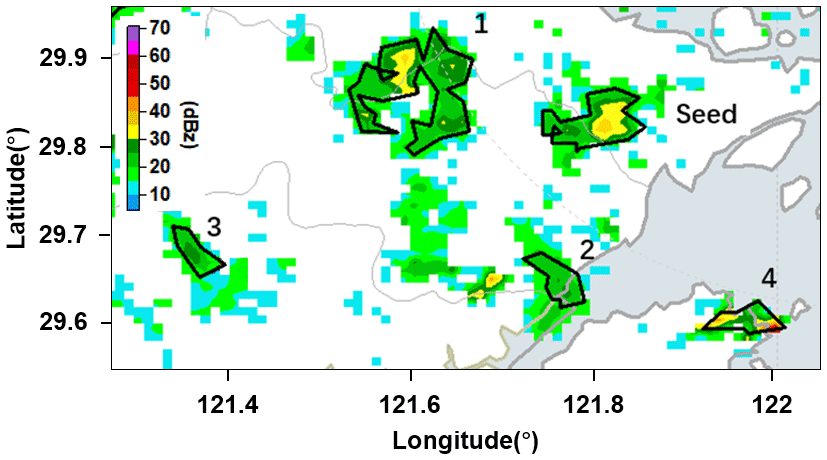
Figure 7Composite reflectivity of the seeded cell and other cells identified by the cloud cluster algorithm at 03:36 UTC (cell numbers 1–4). The reflectivity threshold is ∼19 dBz. To clearly show identified cells, weak echoes (< 10 dBz) are rejected.
Figure 8 shows the time series of echo volumes and mean CRs of the four unseeded cells. Both time series show the evolution and echo intensities of these cells. The mean CRs of the identified cells are roughly the same (the seeded cell is ∼26.2 dBz, and the mean value of the other identified cells is ∼25.2 dBz). However, the seeded cell appears to have the shortest life cycle (∼1 h 6 min) compared with the other unseeded cells (mean value of the four cells is ∼1 h 46 min).
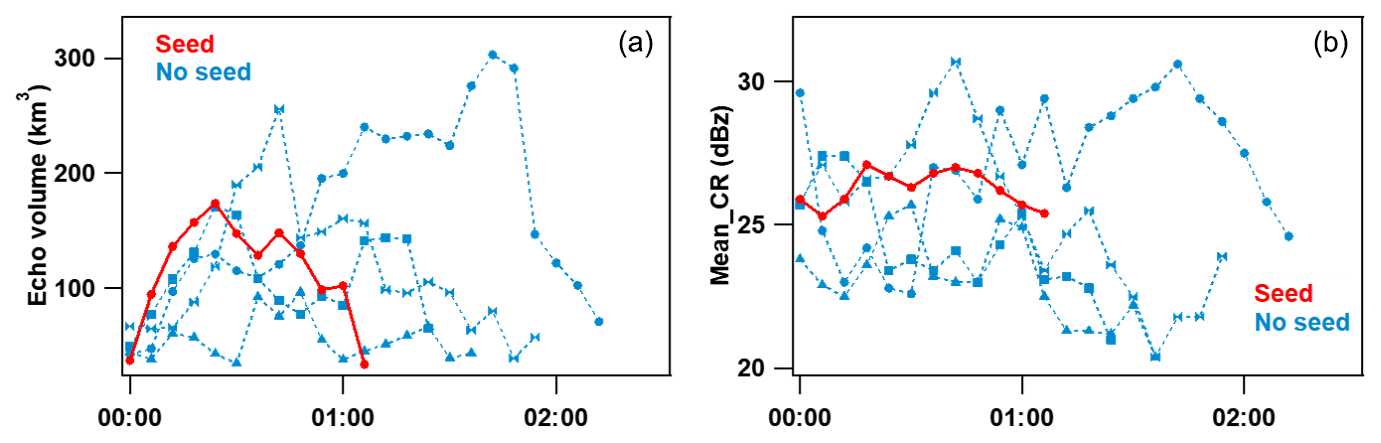
Figure 8Echo volume (a) and mean composite reflectivity (b) of identified cells (including seeded and unseeded cells). All sampling cells are normalized to the same initial time on the x-axis.
3.3 Hourly variability of surface precipitation
The end result of cloud seeding is often associated with the variation of surface precipitation. If rainfall occurred, the surface echoes might weaken (red ovals in Fig. 6) due to a natural process of cloud depletion. But from the echo-cluster tracking result between seeded and unseeded cells in Sect. 3.3, we can conclude that the seeded echo was weakened at the fastest speed and had the shortest life cycle. Figure 9 shows the rainfall distribution over the cloud seeding region during 02:00–05:00 UTC, and the different values between them. The inhomogeneous feature of this precipitation event was also seen. The rain gauge data used in this study consist of hourly precipitation with a space interval of ∼10 km. Hourly precipitation during cloud seeding (03:00–04:00 UTC) with a maximum ∼5.8 mm was stronger than that before (02:00–03:00 UTC) and after (04:00–05:00 UTC) cloud seeding. There were ∼23 rain gauges with effective precipitation record (hourly precipitation ≥0.1 mm) at 04:00–05:00 UTC, which was approximately one-half of that at 03:00–04:00 UTC (∼44 rain gauges). To better see the contrast of surface precipitation caused by cloud seeding, the interpolated precipitation fields were constructed from site measurements to produce a time series of precipitation for each grid square. From the grid difference of precipitation between 03:00–04:00 and 04:00–05:00 UTC, cloud seeding seems to have led a decrease in precipitation from seeded cloud relative to the surrounding clouds (Fig. 9d).
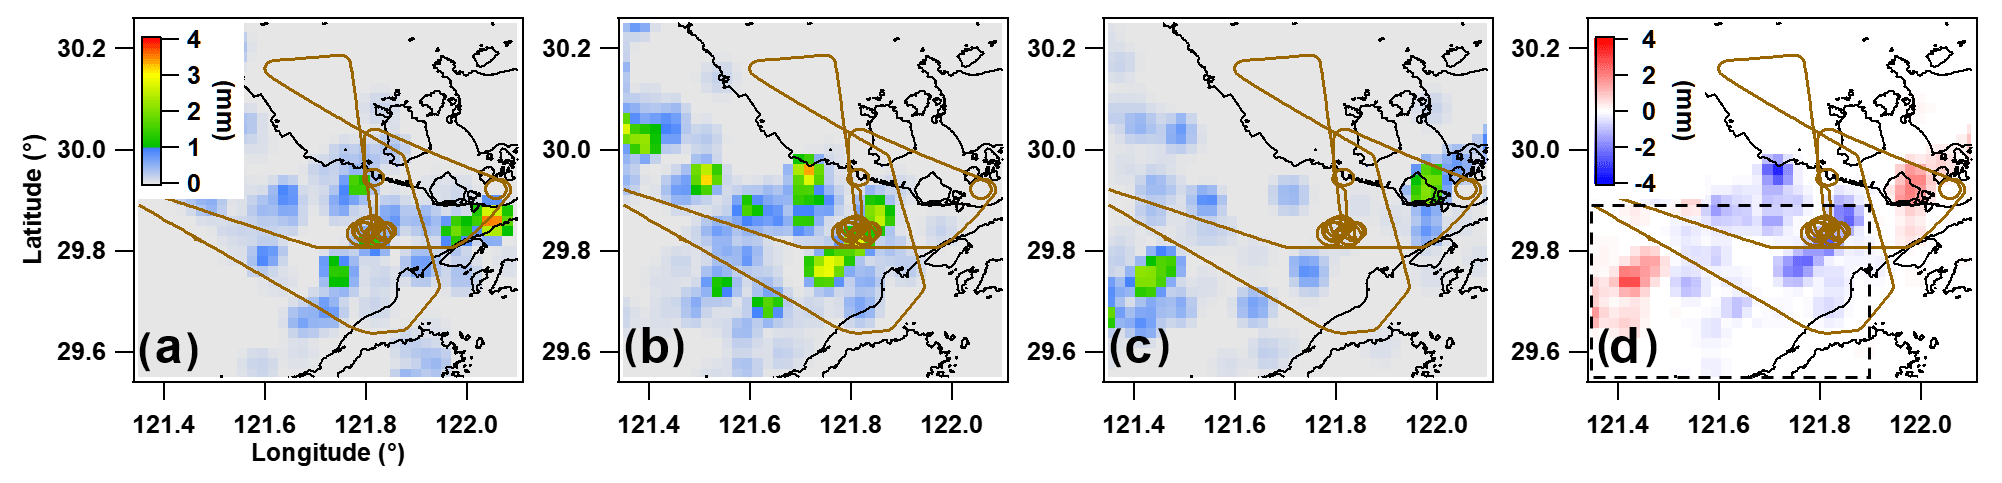
Figure 9Hourly surface precipitation at 02:00–03:00 UTC (a), 03:00–04:00 UTC (b), and 04:00–05:00 UTC (c), which approximately corresponds to before, during, and after cloud seeding. Panel (d) indicates the grid difference of precipitation between 03:00–04:00 UTC and 04:00–05:00 UTC.
On the other hand, it seems that the precipitation peaked at 03:00–04:00 UTC from the analysis of the cloud life cycle using radar echo in Sect. 3.3. The decrease of surface precipitation is probably due to a natural process of cloud depletion. However, according to the seeding time, extent, and dosage in this experiment, the hygroscopic seeding could just change the cloud number concentration and size distribution in a very limited scope. Besides, cloud seeding is a chain of physical processes, similar to cloud–precipitation processes in nature, and it influences surface precipitation through a complex mechanism. From our comparative analysis, its development was restrained and its life cycle was shortened, which was also demonstrated by analyzing our airborne cloud micro-physics data (Sect. 3.4). Actually, an increase in surface precipitation was observed in the domain following cloud seeding. We thus consider it was a necessary but insufficient condition for the evaluation.
3.4 Microphysical characteristics of the seeded cloud
Generally, radar data can provide information about large hydrometeors such as raindrops. However, the hygroscopic flare used in this seeding experiment was mostly comprised of submicron and micro-hygroscopic particles (Table 1) which could directly affect the concentration and spectrum of cloud droplets. Calibrated airborne CDP measurements can provide such information about cloud droplets. Table 3 summarizes the microphysical characteristics of the targeted cloud during the various seeding periods (black box in Fig. 2) and post-seeding sampling of the cloud layer (black oval in Fig. 2). Stages I, II, and III represent the cloud seeding periods with an average flight altitude of 1875–1975 m, and stage IV represents the post-seeding sampling period when the aircraft flew through the seeded cloud again on its return to base. The mean flight altitude during stage IV was ∼2200 m.
Table 3Statistics (mean and maximum values) of airborne CDP-measured microphysical parameters (cloud droplet number concentration Nc, effective diameter ED, liquid water content LWC, and cloud droplet spectral dispersion ε) on 4 September 2016 for seeding and post-seeding legs at approximately the cloud seeding height.

The cloud droplet number concentration (Nc), the effective diameter (ED), the liquid water content (LWC), and the cloud droplet spectral dispersion (ε) increased in progression from stage I to stage III. The maximum Nc increased from 216.7 to 322.4 cm−3, and the mean LWC increased from 0.4 to 0.8 g m−3. Affected by hygroscopic particles, Nc showed a bi-modal size distribution (peaks at 4–6 and 17–18 µm) during the seeding period (Fig. 10). Large amounts of small particles (likely agent particles) were captured in the initial stage of cloud seeding (see the black arrow in the top-left panel of Fig. 10). Considering the potential hygroscopic growth of agent particles, the cloud number concentration of the first peak diminished and the second peak gradually increased. The spectrum also confirms that larger-mode (corresponding to second peak) particles were increased but showed slowing growth (17.9 to 18.2 µm) from ED information in stage II and III. It can be concluded that some of the hygroscopic particles grow to cloud drops, even raindrops, through the collision–coalescence process. But most of the agent particles were accumulated at 17–18 µm by hygroscopic growth and did not grow much bigger, which cloud be explained by the competition effect of water vapor. The Nc, ED, and LWC were much lower and the drop size distribution of the seeded cloud was broadened during post-seeding sampling, likely because the seeding agents became progressively more diluted as the particles grew by condensation or dissipated by turbulent motion. More in-depth quantitative analyses are needed to examine this.
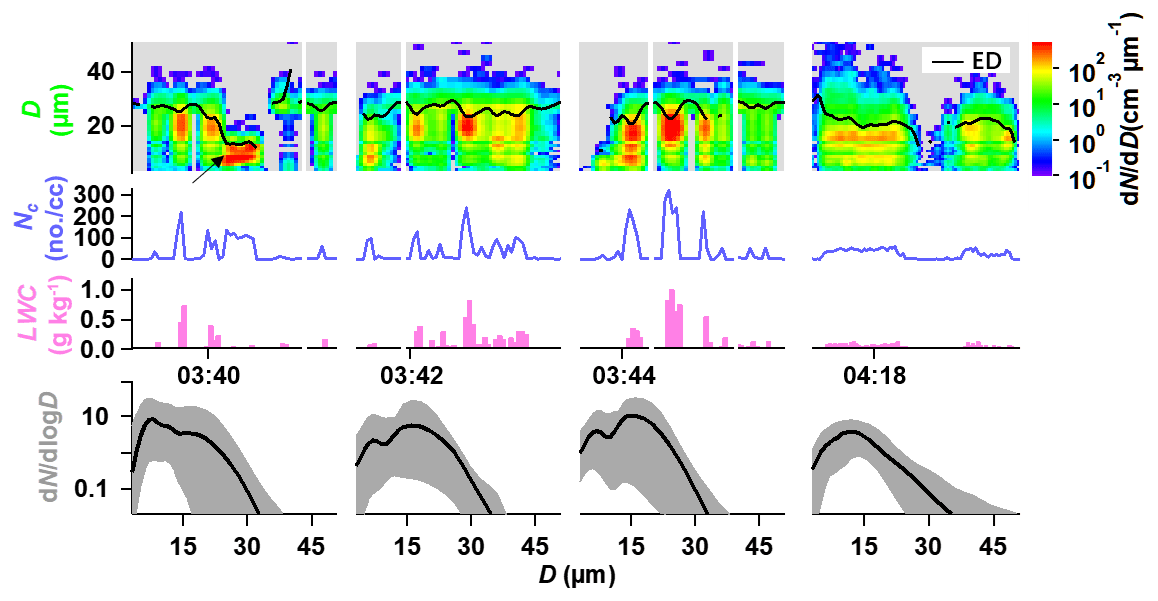
Figure 10Top three rows: The time series of (row 1) cloud number size distribution (dN ∕ dD; color shaded) and effective diameter (ED; black solid line), (row 2) cloud droplet number concentration (Nc), and (row 3) liquid water content (LWC). Bottom row: Mean spectrum during the flight though the seeded cloud measured by an aircraft-mounted CDP. Black lines represent the means and the gray shaded areas represent the 10th and 90th percentiles of the data. The first three columns from the left represent the seeding period (corresponding to the black box in Fig. 2) and the rightmost column represents the period when the aircraft flew through the seeded cloud again on its return to base (corresponding to the black oval in Fig. 2).
The goal of this study is to evaluate the potential effect of hygroscopic seeding on cloud and precipitation processes for the sake of suppressing rainfall during a weather modification experiment around the southeastern coast of Zhejiang province in China. A marine stratocumulus cloud deck with a large horizontal extent was observed off the coast of eastern Zhejiang on 4 September 2016. Hygroscopic flares were dispersed into an appropriate region of the targeted cloud by an MA-60 research aircraft. Real-time satellite images, radar data, and airborne CDP observations were all acquired to help identify cloud conditions suitable for cloud seeding. After seeding, the research aircraft flew into seeded cloud to measure cloud microphysical parameters.
Analysis of the differences in numerous cloud and rainfall parameters before and after seeding is a means of assessing the effect of the hygroscopic agents introduced into a convective cell embedded in a stratiform cloud. The marine stratocumulus clouds chosen in this study are under an enrichment condition of plentiful of water vapor, favorable for cloud development with rich CCN. By introducing hygroscopic agents into a small region of the targeted cloud and comparing its evolution with surrounding clouds in the same cloud regime, the role that other factors may have in modifying the cloud can be minimized so that the influence of cloud seeding can be singled out. A method for estimating the effectiveness of the seeding based on various parameters of radar echoes is presented. It is demonstrated that cloud seeding had altered the course of cloud development and their parameters and had suppressed precipitation.
An RDI algorithm based on radar grid data was proposed to analyze the cloud seeding effect. An echo tracking method including the TREC technique and threshold strategy were performed for domain selection. Echo reflectivity parameters such as ref_mean, σ, and FCRi were analyzed during and after the seeding process to examine any spatial differences. Results show that about 12 min after seeding, the composite reflectivity of the seeded cloud decreased to a minimum (< 10 dBz), and the VIL of the seeded cloud was ∼0.2 kg m−3. The echo top height dropped to ∼3.5 km, and the surface echoes were also weakened. By contrast, there was no significant variation in the echo parameters of non-seeded clouds. The RDI results suggest that the hygroscopic seeding effectively weakened the development of strong echoes (> 20 dBz). After cloud seeding, the area of weak echoes (< 10 dBz) increased. The seeded echo had the shortest lifetime compared with the neighboring unseeded echoes identified by a cloud-cluster tracking and identification algorithm. From airborne CDP measurement during cloud seeding, a small number of hygroscopic particles grow to cloud drops and raindrops through a collision–coalescence process. However, most of the agent particles were accumulated at 17–18 µm by hygroscopic growth did not grow much bigger, presumably due to the competition effect of water vapor. It seems plausible that hygroscopic seeding creates a competition mechanism and limits cloud development, thus suppressing precipitation.
It is admitted that this is just a case study with a certain degree of coincidence, from which we may hardly draw any solid conclusion that the change was totally due to seeding effects rather than natural variation. More observational evidence is certainly needed. They are, however, very costly and difficult to acquire, especially in densely populated regions where access to aerospace is usually extremely difficult to gain in order to fly into the right clouds at the right time. In this regard, the case as studied here is an invaluable sample that is worth exploring.
The observational radar, precipitation, and radiosonde data used in this paper can be downloaded from http://data.cma.cn/en (China Meteorological Data Service Center, 2019). The airborne data of the field experiment are also available. Readers can access the data by contacting feiwang@cma.gov.cn.
The supplement related to this article is available online at: https://doi.org/10.5194/acp-19-14967-2019-supplement.
FW and YZ designed the aircraft campaign. FW and GW analyzed the radar data. FW, QJ, JD, and SJ analyzed satellite, rain gauge, and airborne data. FW and ZL wrote the paper.
The authors declare that they have no conflict of interest.
This study was supported by National Key Research and Development Program of China (2016YFA0601701 and 2017YFC1501702) and the National Science Foundation of China (91544217). We are very grateful to the reviewers for their constructive comments and thoughtful suggestions. We also thank all of the experimental research team, especially the flight crew of CMA's MA-60 airplane.
This research has been supported by the National Key Research and Development Program of China (grant nos. 2016YFA0601701 and 2017YFC1501702) and the National Science Foundation of China (grant no. 91544217).
This paper was edited by Jianping Huang and reviewed by two anonymous referees.
Albrecht, B. A.: Aerosols, cloud microphysics, and fractional cloudiness, Science, 245, 1227–1231, 1989.
Belyaeva, M., Drofa, A., and Ivanov, V.: Efficiency of stimulating precipitation from convective clouds using salt powders, Izvestiya, Atmospheric and Oceanic Physics, 49, 154–161, 2013.
Bowen, E.: A new method of stimulating convective clouds to produce rain and hail, Q. J. Roy. Meteor. Soc., 78, 37–45, 1952.
Bruintjes, R.: Similarities between the effects of hygroscopic seeding and anthropogenic pollution on clouds, 8th WMO Scientific Conference on Weather Modification, Casablanca, Morocco, 2003.
China Meteorological Data Service Center: Hourly rainfall, radar and radiosonde data, available at: http://data.cma.cn/en, last access: 4 December 2019.
Cooper, W. A., Bruintjes, R. T., and Mather, G. K.: Calculations pertaining to hygroscopic seeding with flares, J. Appl. Meteorol., 36, 1449–1469, 1997.
Council, N. R.: Critical Issues in Weather Modification Research, The National Academies Press, Washington, DC, 143 pp., 2003.
Cunning Jr., J. B.: Comparison of the ZR relationships for seeded and nonseeded Florida cumuli, J. Appl. Meteorol., 15, 1121–1125, 1976.
Dennis, A., Koscielski, A., Cain, D., Hirsch, J., and Smith Jr., P.: Analysis of radar observations of a randomized cloud seeding experiment, J. Appl. Meteorol., 14, 897–908, 1975.
Dessens, J.: A physical evaluation of a hail suppression project with silver iodide ground burners in southwestern France, J. Appl. Meteorol., 37, 1588–1599, 1998.
Dixon, M. and Wiener, G.: TITAN: Thunderstorm identification, tracking, analysis, and nowcasting – A radar-based methodology, J. Atmos. Ocean. Tech., 10, 785–797, 1993.
Faber, S., French, J. R., and Jackson, R.: Laboratory and in-flight evaluation of measurement uncertainties from a commercial Cloud Droplet Probe (CDP), Atmos. Meas. Tech., 11, 3645–3659, https://doi.org/10.5194/amt-11-3645-2018, 2018.
French, J. R., Friedrich, K., Tessendorf, S. A., Rauber, R. M., Geerts, B., Rasmussen, R. M., Xue, L., Kunkel, M. L., and Blestrud, D. R.: Precipitation formation from orographic cloud seeding, P. Natl. Acad. Sci. USA, 115, 1168–1173, 2018.
Gagin, A. and Neumann, J.: The second Israeli randomized cloud seeding experiment: Evaluation of the results, J. Appl. Meteorol., 20, 1301–1311, 1981.
Guo, J., Deng, M., Lee, S. S., Wang, F., Li, Z., Zhai, P., Liu, H., Lv, W., Yao, W., and Li, X.: Delaying precipitation and lightning by air pollution over the Pearl River Delta. Part I: Observational analyses, J. Geophys. Res.-Atmos., 121, 6472–6488, 2016.
Guo, X., Fu, D., Li, X., Hu, Z., Lei, H., Xiao, H., and Hong, Y.: Advances in cloud physics and weather modification in China, Adv. Atmos. Sci., 32, 230–249, 2015.
Hobbs, P. V., Lyons, J. H., Locatelli, J. D., Biswas, K. R., Radke, L. F., Weiss, R. R., and Rangno, A. L.: Radar Detection of Cloud-Seeding Effects, Science, 213, 1250–1252, 10.1126/science.213.4513.1250, 1981.
Jensen, J. B. and Lee, S.: Giant sea-salt aerosols and warm rain formation in marine stratocumulus, J. Atmos. Sci., 65, 3678–3694, 2008.
Jung, E., Albrecht, B. A., Jonsson, H. H., Chen, Y.-C., Seinfeld, J. H., Sorooshian, A., Metcalf, A. R., Song, S., Fang, M., and Russell, L. M.: Precipitation effects of giant cloud condensation nuclei artificially introduced into stratocumulus clouds, Atmos. Chem. Phys., 15, 5645–5658, https://doi.org/10.5194/acp-15-5645-2015, 2015.
Kerr, R. A.: Cloud seeding: one success in 35 years, Science, 217, 519–521, 1982.
Lance, S.: Coincidence errors in a cloud droplet probe (CDP) and a cloud and aerosol spectrometer (CAS), and the improved performance of a modified CDP, J. Atmos. Ocean. Tech., 29, 1532–1541, 2012.
Lance, S., Brock, C. A., Rogers, D., and Gordon, J. A.: Water droplet calibration of the Cloud Droplet Probe (CDP) and in-flight performance in liquid, ice and mixed-phase clouds during ARCPAC, Atmos. Meas. Tech., 3, 1683–1706, https://doi.org/10.5194/amt-3-1683-2010, 2010.
Lee, S. S., Guo, J., and Li, Z.: Delaying precipitation by air pollution over the Pearl River Delta: 2. Model simulations, J. Geophys. Res.-Atmos., 121, 11739–711760, 2016.
Lu, G. and Guo, X.: Distribution and origin of aerosol and its transform relationship with CCN derived from the spring multi-aircraft measurements of Beijing Cloud Experiment (BCE), Chinese Sci. Bull., 57, 2460–2469, https://doi.org/10.1007/s11434-012-5136-9, 2012.
Mather, G., Terblanche, D., Steffens, F., and Fletcher, L.: Results of the South African cloud-seeding experiments using hygroscopic flares, J. Appl. Meteorol., 36, 1433–1447, 1997.
Radinović, D. and Ćurić, M.: A specific evidence of hail suppression effectiveness in Serbia, Journal of Weather Modification, 39, 74–75, 2007.
Rinehart, R. and Garvey, E.: Three-dimensional storm motion detection by conventional weather radar, Nature, 273, 287–289, 1978.
Rosenfeld, D.: Objective method for analysis and tracking of convective cells as seen by radar, J. Atmos. Ocean. Tech., 4, 422–434, 1987.
Rosenfeld, D., Lohmann, U., Raga, G. B., O'Dowd, C. D., Kulmala, M., Fuzzi, S., Reissell, A., and Andreae, M. O.: Flood or drought: how do aerosols affect precipitation?, Science, 321, 1309–1313, 2008.
Rosenfeld, D., Axisa, D., Woodley, W. L., and Lahav, R.: A quest for effective hygroscopic cloud seeding, J. Appl. Meteorol. Clim., 49, 1548–1562, 2010.
Rosenfeld, D., Sherwood, S., Wood, R., and Donner, L.: Climate effects of aerosol-cloud interactions, Science, 343, 379–380, 2014.
Schaefer, V. J.: The production of ice crystals in a cloud of supercooled water droplets, Science, 104, 457–459, 1946.
Segal, Y., Khain, A., Pinsky, M., and Rosenfeld, D.: Effects of hygroscopic seeding on raindrop formation as seen from simulations using a 2000-bin spectral cloud parcel model, Atmos. Res., 71, 3–34, 2004.
Silverman, B. A.: A critical assessment of glaciogenic seeding of convective clouds for rainfall enhancement, B. Am. Meteorol. Soc., 82, 903–924, 2001.
Silverman, B. A.: A critical assessment of hygroscopic seeding of convective clouds for rainfall enhancement, B. Am. Meteorol. Soc., 84, 1219–1230, 2003.
Tessendorf, S. A., Bruintjes, R. T., Weeks, C., Wilson, J. W., Knight, C. A., Roberts, R. D., Peter, J. R., Collis, S., Buseck, P. R., and Freney, E.: The Queensland cloud seeding research program, B. Am. Meteorol. Soc., 93, 75–90, 2012.
Tessendorf, S. A., French, J. R., Friedrich, K., Geerts, B., Rauber, R. M., Rasmussen, R. M., Xue, L., Ikeda, K., Blestrud, D. R., and Kunkel, M. L.: A transformational approach to winter orographic weather modification research: The SNOWIE Project, B. Am. Meteorol. Soc., 100, 71–92, 2018.
Tuttle, J. and Gall, R.: A single-radar technique for estimating the winds in tropical cyclones, B. Am. Meteorol. Soc., 80, 653–668, 1999.
Tzivion, S., Reisin, T., and Levin, Z.: Numerical simulation of hygroscopic seeding in a convective cloud, J. Appl. Meteorol., 33, 252–267, 1994.
Vonnegut, B.: The nucleation of ice formation by silver iodide, J. Appl. Phys., 18, 593–595, 1947.
Wang, G., Liu, L., and Ding, Y.: Improvement of radar quantitative precipitation estimation based on real-time adjustments to ZR relationships and inverse distance weighting correction schemes, Adv. Atmos. Sci., 29, 575–584, 2012.
Wang, G., Wong, W., Liu, L., and Wang, H.: Application of multi-scale tracking radar echoes scheme in quantitative precipitation nowcasting, Adv. Atmos. Sci., 30, 448–460, 2013.
Wang, H., Liu, L., Wang, G., Zhuang, W., Zhang, Z., and Chen, X.: Development and application of the Doppler weather radar 3-D digital mosaic system, J. Appl. Meteorol. Sci., 20, 241–224, 2009.
Wang, W., Yao, Z., Guo, J., Tan, C., Jia, S., Zhao, W., Zhang, P., and Gao, L.: The extra-area effect in 71 cloud seeding operations during winters of 2008–14 over Jiangxi Province, East China, J. Meteorol. Res., 33, 528–539, 2019.
Warburton, J., Linkletter, G., and Stone, R.: The use of trace chemistry to estimate seeding effects in the National Hail Research Experiment, J. Appl. Meteorol., 21, 1089–1110, 1982.
Woodley, W. L. and Rosenfeld, D.: The development and testing of a new method to evaluate the operational cloud-seeding programs in Texas, J. Appl. Meteorol., 43, 249–263, 2004.
Xiao, Y., Liu, L., and Shi, Y.: Study of Methods for Three-Dimensional Multiple-Radar Re ectivity Mosaics, J. Meteorol. Res., 22, 351–361, 2008.
Yin, Y., Levin, Z., Reisin, T., and Tzivion, S.: Seeding convective clouds with hygroscopic flares: Numerical simulations using a cloud model with detailed microphysics, J. Appl. Meteorol., 39, 1460–1472, 2000.
Zhu, S., Guo, X., Lu, G., and Guo, L.: Ice crystal habits and growth processes in stratiform clouds with embedded convection examined through aircraft observation in northern China, J. Atmos. Sci., 72, 2011–2032, 2015.