the Creative Commons Attribution 4.0 License.
the Creative Commons Attribution 4.0 License.
 | 10 Dec 2019
Organic aerosol source apportionment in Zurich using an extractive electrospray ionization time-of-flight mass spectrometer (EESI-TOF-MS) – Part 1: Biogenic influences and day–night chemistry in summer
Giulia Stefenelli
Veronika Pospisilova
Felipe D. Lopez-Hilfiker
Kaspar R. Daellenbach
Christoph Hüglin
Yandong Tong
Urs Baltensperger
André S. H. Prévôt
Jay G. Slowik
Improving the understanding of the health and climate impacts of aerosols remains challenging and is restricted by the limitations of current measurement techniques. Detailed investigation of secondary organic aerosol (SOA), which is typically the dominating fraction of the organic aerosol (OA), requires instrumentation capable of real-time, in situ measurements of molecular composition. In this study, we present the first ambient measurements by a novel extractive electrospray ionization time-of-flight mass spectrometer (EESI-TOF-MS). The EESI-TOF-MS was deployed along with a high-resolution time-of-flight aerosol mass spectrometer (HR-ToF-AMS) during summer 2016 at an urban location (Zurich, Switzerland). Positive matrix factorization (PMF), implemented within the Multilinear Engine (ME-2), was applied to the data from both instruments to quantify the primary and secondary contributions to OA. From the EESI-TOF-MS analysis, a six-factor solution was selected as the most representative and interpretable solution for the investigated dataset, including two primary and four secondary factors. The primary factors are dominated by cooking and cigarette smoke signatures while the secondary factors are discriminated according to their daytime (two factors) and night-time (two factors) chemistry. All four factors showed strong influence by biogenic emissions but exhibited significant day–night differences. Factors dominating during daytime showed predominantly ions characteristic of monoterpene and sesquiterpene oxidation while the night-time factors included less oxygenated terpene oxidation products, as well as organonitrates which were likely derived from NO3 radical oxidation of monoterpenes. Overall, the signal measured by the EESI-TOF-MS and AMS showed a good correlation. Further, the two instruments were in excellent agreement in terms of both the mass contribution apportioned to the sum of POA and SOA factors and the total SOA signal. However, while the oxygenated organic aerosol (OOA) factors separated by AMS analysis exhibited a flat diurnal pattern, the EESI-TOF-MS factors illustrated significant chemical variation throughout the day. The captured variability, inaccessible from AMS PMF analysis, was shown to be consistent with the variations in the physiochemical processes influencing chemical composition and SOA formation. The improved source separation and interpretability of EESI-TOF-MS results suggest it to be a promising approach to source apportionment and atmospheric composition research.
- Article
(5028 KB) - Full-text XML
- Companion paper
-
Supplement
(798 KB) - BibTeX
- EndNote


Atmospheric aerosols impact visibility, human health, and climate on global scale; therefore a detailed knowledge of chemical composition, sources, and processes is a fundamental prerequisite to develop appropriate mitigation policies. Organic aerosols are an important fraction of the chemical composition and are classified as primary (POA) when directly emitted to the atmosphere and secondary (SOA) when formed in the atmosphere through the oxidation of gas-phase precursors, yielding less volatile products which condense to the particle phase (Hallquist et al., 2009). Overall, organic aerosols account for 20 %–60 % of the total fine particulate mass in the continental mid-latitude atmosphere and up to 90 % in tropical forested areas (Kanakidou et al., 2005; Carlton et al., 2009). POA emissions typically include combustion of fossil fuels, direct injection of unburnt fuel and lubricants, industrial emissions, plant matter debris, biomass burning, cooking emissions, and biogenic emissions (De Gouw and Jimenez, 2009; Hayes et al., 2013). Current models estimate that SOA accounts for a dominant fraction of the total organic particulate mass in the lower troposphere, typically between 50 % (in polluted urban areas) and 90 % (Jimenez et al., 2009; Hallquist et al., 2009; Pye and Seinfeld, 2010; Spracklen et al., 2011). However our capability to characterize SOA is limited (Heald et al., 2008; Shiravastava et al., 2017). SOA precursors can have either biogenic or anthropogenic origins, and although key precursor gases for SOA formation are known, the absolute and relative contributions of different sources to SOA remain challenging to determine. Globally, SOA is dominated by oxidation products of biogenic volatile organic compounds, (including the monoterpene α-pinene, one of the largest sources of secondary biogenic particulate matter worldwide) resulting in an estimated 90 % of SOA from biogenic emissions compared to only 10 % from anthropogenic sources (Hallquist et al., 2009). However, it has been shown that interaction between biogenic and anthropogenic volatile organic compounds can significantly enhance SOA production and affect its properties (Weber et al., 2007; De Gouw and Jimenez, 2009; Kautzman et al., 2010; Glasius et al., 2011; Hoyle et al., 2011; Emanuelsson et al., 2013; Setyan et al., 2014; Moise et al., 2015). Further, anthropogenic SOA disproportionally affects regions with a higher population and thereby exerts a larger impact on global health than suggested by its global average concentration. Elucidating the sources and physicochemical processes governing SOA concentrations requires measurement techniques with high temporal and chemical resolution, which have proven challenging to achieve. The molecular composition of aerosol particles has so far mostly been investigated offline, using filter or cascade impactor samples, which are based on a time-integrating sampling step (typically 1 to 24 h) followed by post-analysis. This method provides detailed information on individual chemical species and/or functional groups in SOA but can be affected by compositional changes due to adsorption, evaporation, and chemical reactions during sample collection, storage, and/or transfer (Turpin et al., 2000; Hallquist et al., 2009). Further, many sources and processes affecting SOA have characteristic timescales that are too short for this measurement approach. Several online techniques have been developed, which couple thermal desorption and/or hard ionization with online mass spectrometry. A major advantage of the online techniques over offline techniques is their time resolution (Nozière et al., 2015). For instance, the Aerodyne aerosol mass spectrometer (AMS) and the CHARON PTR-ToF-MS are both able to describe bulk compositional properties of OA. However, the AMS subjects OA molecules to significant thermal decomposition and ionization-induced fragmentation. While thermal decomposition does not significantly influence the CHARON, the proton transfer reaction is of sufficiently high energy that molecules of the type found in SOA undergo significant fragmentation, with the signal from the parent ion comprising a very small fraction of the total (Müller et al., 2017). In order to retrieve information at the molecular level while avoiding ionization-induced fragmentation, a few online semi-continuous measurement techniques using soft ionization or thermal desorption have been developed (e.g. FIGAERO-CIMS; Lopez-Hilfiker et al., 2014 and TAG, Williams et al., 2006). These instruments have better chemical resolution and reduced thermal decomposition but still low time resolution. Another important drawback is the segregation of collection and analysis stages, which similarly to offline techniques open the possibility of reaction on the collection substrate and/or transfer artefacts. Alternatively, a soft ionization called aerosol flowing atmospheric-pressure afterglow (AeroFAPA) is also available. This technique allows mass spectrometric analysis of organic aerosols in real time and it consists of an ion source based on a helium glow discharge at atmospheric pressure. Ionization of the analytes occurs in the afterglow region after thermal desorption and produces mainly intact quasi-molecular ions (Brüggemann et al., 2015). The method is best suited for polar analytes with high volatilities and low molecular weights though, while for compounds with low vapour pressures, containing long carbon chains and/or high molecular weights, desorption and ionization is in direct competition with oxidation of the analytes, leading to the formation of adducts and oxidation products, which impede a clear signal assignment in the acquired mass spectra. In addition, the ionization pathways are not well-constrained, which makes non-linear behaviour likely. All these limitations (decomposition, fragmentation, reaction–transfer artefacts) are particularly problematic for SOA species, which is the fraction of sources and reactions that are least understood. Therefore, instrumentation is urgently needed that can assess original molecular information of organic aerosol, online, with high time resolution and with a linear response to mass.
Here we present the first field deployment of a recently developed extractive electrospray ionization time-of-flight mass spectrometer (EESI-TOF-MS) (Lopez-Hilfiker et al., 2019), which to our knowledge is the first instrument capable of online OA measurements at atmospheric concentrations using a controlled ionization scheme without thermal decomposition, ionization-induced fragmentation, or separated collection–analysis stages. The field campaign took place during summer 2016 at an urban background site in Zurich, the largest city in Switzerland; the companion paper presents results from a subsequent winter campaign (Qi et al., 2019). This study compares EESI-TOF-MS and AMS results in terms of both bulk composition and source apportionment to characterize the EESI-TOF-MS field performance and gain new insight into the sources and physicochemical processes governing OA composition.
2.1 Field campaign
Continuous online measurements were performed between June and July 2016 at the Swiss National Air Pollution Monitoring Network (NABEL) station located in Zürich Kaserne, Switzerland (47∘22′42′′ N, 8∘31′52′′ E, 410 m a.s.l. – above sea level) (Herich et al., 2011). Zürich has a population of 1.3 million, and the site is located in the central metropolitan area, in a courtyard approximately 500 m south of the main train station. This location is not affected by major emissions from industries, but surrounded by roads with rather low traffic, apartment buildings, small businesses, and restaurants. The NABEL measurement station includes a number of long-term measurements, including trace gas monitors for nitrogen oxides (NOx) and ozone (O3, Thermo Environmental Instruments 49C, Thermo Electro Crop., Waltham, MA) and meteorological data including temperature, relative humidity, solar radiation, and wind speed and direction. For the intensive campaign, a separate trailer was deployed to house an additional suite of gas and particle instrumentation, including the EESI-TOF-MS and several other mass spectrometers, as described below.
The measurement site has been characterized in previous studies as “urban background” for PM10, PM2.5, and PM1 and additional air quality parameters (Hueglin et al., 2005; Lanz et al., 2007a, b; Daellenbach et al., 2016). The city of Zurich is a hub for railways, roads, and air traffic and is thus useful to assess different sources of SOA depending on location and seasonality. Lanz et al. (2007a, b) reported the first PMF study on an AMS dataset acquired at this site in summer 2005 and identified six factors, including traffic, wood burning, cooking, and a charbroiling-related source along with two secondary sources discriminated according to their volatility and degree of oxygenation. Additional studies on summer OA measurements provided further discrimination of sources including primary vs. secondary and fossil vs. non-fossil. Also, studies at other sites in Europe demonstrated that during summer carbonaceous aerosols are mainly of biogenic origin, emitted through either primary emissions or gas-phase oxidation products from biogenic volatile organic compounds (BVOCs) (Genberg et al., 2011; Yttri et al., 2011). Biogenic SOA (BSOA) has been shown to dominate over combustion-derived aerosols during summer (Gelencsér et al., 2007; Genberg et al., 2011; Yttri et al., 2011).
2.2 Instrumentation
Particle composition was measured by a high-resolution time-of-flight aerosol mass spectrometer (HR-ToF-AMS) and an extractive electrospray time-of-flight mass spectrometer (EESI-TOF-MS). A scanning mobility particle sizer (SMPS) measured particle size distributions. Here we focus on particle-phase composition and organic aerosol source apportionment via positive matrix factorization (PMF).
2.2.1 High-resolution time-of-flight aerosol mass spectrometer (HR-ToF-AMS)
The non-refractory particle composition was monitored by a high-resolution time-of-flight aerosol mass spectrometer (HR-ToF-AMS, Aerodyne Research Inc.) equipped with a PM1 aerodynamic lens (DeCarlo et al., 2006; Canagaratna et al., 2007). The HR-ToF-AMS was operated with a temporal resolution of 1 min. Briefly, aerosol particles are continuously sampled through an aerodynamic lens, which focuses the particles into a narrow beam and accelerates them to a velocity inversely related to their vacuum aerodynamic diameter. The beam impacts a heated element (600 ∘C, 10−7 torr), where the non-refractory components flash-vaporize. The resulting gas is ionized by electron impact (EI, 70 eV), and ion mass-to-charge ratios (m∕z) are analysed by a time-of-flight mass spectrometer. The instrument was calibrated for ionization efficiency (IE) at the beginning and at the end of the campaign using 400 nm NH4NO3 particles following a mass-based method. A composition-dependent collection efficiency (CDCE) was used to correct the measured aerosol mass according to the algorithm of Middlebrook et al. (2012). Data analysis was performed in Igor Pro 6.3 (Wave Metrics) using SQUIRREL 1.57 and PIKA 1.16.
The PMF source apportionment technique (Sect. 2.3) requires as input the time series of ions from high-resolution mass spectral fitting along with their corresponding uncertainties. In the case of the AMS, the measurement uncertainties considered in the error matrix account for electronic noise, ion-to-ion variability at the detector, and ion counting statistics (Allan et al., 2003). Following the recommendation of Paatero and Hopke (2003), variables (m∕z) with low signal-to-noise ratio (SNR < 0.2) were removed, whereas “weak” variables (0.2 < SNR < 2) were down-weighted by a factor of 2. Further, all variables calculated during the AMS data analysis as a constant fraction of m∕z 44 (), i.e. the OA contributions to O+, OH+, H2O+, and CO+, were excluded from PMF analysis to avoid overweighting . The contributions of these ions were recalculated after obtaining a solution and reinserted in the factor profiles presented here; the total factor mass was likewise corrected. Isotopic species were likewise excluded from the PMF solver and rescaled afterwards to their parent ions. The final input matrix contained 281 ions (excluding isotopes and CO2-dependent ions and 285 ions including the CO2-dependent ions) between m∕z 12 and 120 at a resolution of 3000–4000 m∕Δm and 22 182 points in time (with steps of 60 s).
2.2.2 Extractive electrospray ionization time-of-flight mass spectrometer (EESI-TOF-MS)
The EESI-TOF-MS provides online, near-molecular-level measurements of organic aerosol composition with high time resolution. The system, which is described in detail elsewhere (Lopez-Hilfiker et al., 2019), consists of a recently developed EESI source integrated with a commercial time-of-flight mass spectrometer capable of mass resolution up to ∼4000 Th Th−1 (Tofwerk AG, Thun, Switzerland). Briefly, particles and gases are continuously sampled through a multi-channel extruded carbon denuder which removes most gas-phase species with high efficiency. After the denuder, particles intersect a spray of charged droplets generated by a conventional electrospray probe and soluble components are extracted. The droplets enter the mass spectrometer through a heated stainless steel capillary, wherein the electrospray solvent evaporates and ions are ejected. Although the capillary is heated to 250 ∘C, the effective temperature experienced by the analyte molecules is much lower due to the short residence time, and no thermal decomposition is observed. The resulting ions are analysed by a portable high-resolution time-of-flight mass spectrometer with an atmospheric pressure interface (API-ToF-MS) (Junninen et al., 2010). The electrospray solution was a 50 : 50 water ∕ methanol mixture doped with 100 ppm NaI, with spectra detected in positive mode. The NaI dopant almost entirely suppresses ionization pathways other than formation of Na+ adducts, yielding a linear response to mass (without significant matrix effects) and simplifying spectral interpretation. The EESI-TOF-MS alternated between direct sampling (8 min) and sampling through a particle filter (3 min) to provide a measurement of instrument background (including spray); the difference between these two spectra yields the ambient aerosol composition. Data analysis, including high-resolution peak fitting, was performed using Tofware version 2.5.7 (Tofwerk AG, Thun, Switzerland).
Overall the EESI-TOF-MS measured for 3 consecutive weeks during summer in Zurich, achieving >85 % data coverage. The remaining ∼15 % loss of data acquisition was due to instrumental issues, e.g. clogged electrospray capillary resulting in loss of the signal or “dirty solution” to substitute (contamination from ambient air decreasing the purity of the solution). Concentrations of inorganic species were very low (see Fig. S1 in the Supplement) and a Nafion diffusion dryer was used to prevent major changes in relative humidity. No ion-dependent relative response factors were applied. The (NaI)Na+ signal, an approximate surrogate for ion source stability, varied by ±7.3 % (relative standard deviation) across the entire campaign and exhibited no systematic drift (Fig. S2), and no corrections relating to sensitivity drift were applied.
Source apportionment analysis on the EESI data included 507 ions between m∕z 139 and 401, all of which were detected as adducts with Na+ except for nicotine, which was observed with an extra hydrogen (C10H14N2H+, m∕z 163.123), likely due to hydrogen abstraction from water. Because of this unique ionization pathway, its relative sensitivity is less certain and its response to a changing particle matrix is poorly constrained, e.g. non-linear response to mass is a possibility. However, the good agreement between the PMF factors for the AMS and the EESI, discussed in Sect. 3.3, suggests that any such non-linearities are not significant. One unidentified ion was also included in the analysis. The final input matrix contained 4436 points in time (with steps of 300 s, re-averaged from original 2 s). The input matrix of data and error was calculated as follows. (1) Raw data with time resolution of 2 s were processed with Tofware, including high-resolution peak fitting, to generate an initial data matrix including mass spectra from both direct ambient sampling and the filter blank. (2) Filter periods were interpolated to yield an estimated background spectrum during ambient measurements. (3) The estimated background was subtracted from the ambient spectrum and the resulting difference matrix re-averaged to 300 s time resolution for PMF analysis. (4) Ions whose signal was dominated by spray and/or instrument/gas background as defined by a signal-to-noise ratio (SNR) below 2 were excluded from further analysis. (5) The error matrix was calculated according to Eq. (1) following the model of Allan et al. (2003), which accounts for uncertainties related to the measurements (δij) and to the background (βij).
The raw measured signal from the EESI-TOF-MS is acquired in ions per seconds (cps) but throughout the text and figures we report the signal measured by the EESI-TOF-MS in terms of the mass flux of ions to the microchannel plate detector (ag s−1), to facilitate interpretation of PMF results and comparison with other instruments, both of which are typically described in terms of mass rather than moles. The mass flux of ions is calculated as follows:
where Mx is the mass flux of ions in attogrammes per second and x represents the measured molecular composition. Ix is the recorded signal (cps) measured by the EESI-TOF-MS. MWx and MWcc represent the molecular weight of the ion and the charge carrier (e.g. H+, Na+), respectively. Note that this measured mass flux can be related to ambient concentration by the instrument flow rate, EESI extraction–ionization efficiency, declustering probability, and ion transmission, where several of these parameters are ion-dependent (Lopez-Hilfiker et al., 2019).
2.3 Source apportionment
Source apportionment was performed separately on the organic HR-ToF-AMS and EESI-TOF-MS mass spectral time series using positive matrix factorization (PMF) as implemented by the Multilinear Engine (ME-2) (Paatero, 1997) and controlled via the interface SoFi (Source Finder, version 6.39; Canonaco et al., 2013) programmed in Igor Pro (WaveMetrics, Inc.). PMF is a bilinear receptor model used to describe measurements (in this case the matrix of organic mass spectra as a function of time) as a linear combination of static factor profiles (i.e. characteristic mass spectra), corresponding to specific emission sources and/or atmospheric processes, and their time-dependent source contributions as shown in the following equation (Paatero and Tapper, 1994):
Here xij, gik, fkj, and eij are matrix elements of the measurement, factor time series, factor profiles, and residual matrices, respectively. The subscript i corresponds to time, j corresponds to m∕z, and k corresponds to a discrete factor. The number of factors in the PMF solution, p, is determined by the user. The factor profiles are static, but their concentrations vary with time. Equation (3) is solved for G and F using a least-squares algorithm that iteratively minimizes the quantity Q, defined as the sum of the square of the uncertainty-weighted residuals (eij∕σij):
Whereas PMF does not require any a priori assumption regarding sources, ME-2 (Paatero, 1999) enables the inclusion of external data and/or constraints in the PMF model to improve factor resolution and uncertainty analysis. This allows for intelligent rotational control of the retrieved solution. That is, because different combinations of G and F can yield solutions with similar mathematical quality, constraining one or more factor profiles can direct the model towards environmentally reasonable, optimally unmixed solutions. The first application of constrained profiles to AMS data was performed by Lanz et al. (2007b) and demonstrated improved model performance by resolving spectrally or temporally similar sources not well-separated by conventional PMF. Here constraints are applied by requiring one or more factor profiles to fall within a predetermined range defined by a combination of a reference profile and a scalar (α) determining the tightness of constraint. The α value () determines the extent to which the resolved factors (fj,solution) and (gi,solution) may deviate from input values (fj, gi). The following conditions need to be fulfilled:
Because of post-PMF renormalization, the actual profile may contain elements that exceed the boundaries defined by Eq. (5). A key consideration for PMF analysis is the number of factors selected by the user. As currently no methodical and completely objective approach exists for choosing the right number of factors, this selection must be evaluated subjectively to provide the most interpretable solution. Factor identification and interpretation likewise require user judgement. Criteria utilized here include investigation of the retrieved factor profiles for distinctive chemical signatures, diurnal cycle characteristics, and correlations between the time series of factors and external measurements. In addition, the evolution of the residual time series as a function of the number of resolved factors is also evaluated (Ulbrich et al., 2009; Canonaco et al., 2013; Crippa et al., 2014).
3.1 AMS PMF
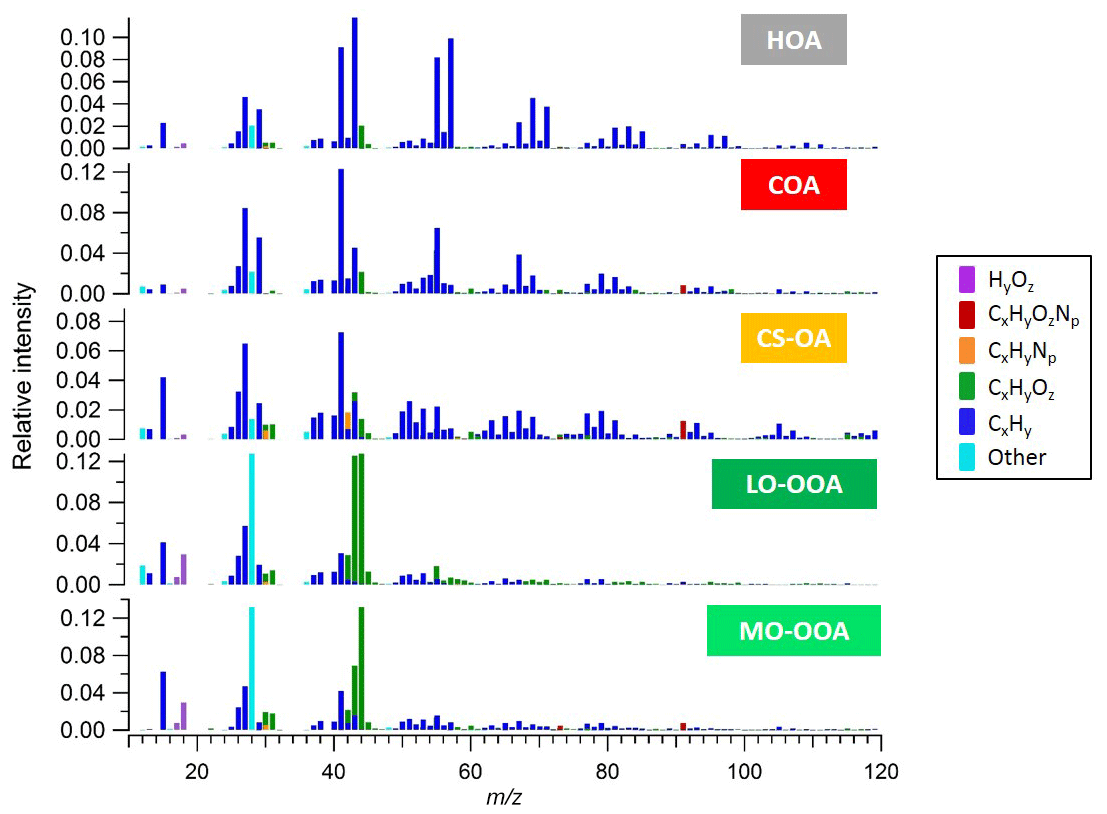
Figure S1 shows time series of the species concentrations measured by the AMS over the full period of measurements. The organic mass dominates NR-PM1 with a contribution of 74 % compared to only a 26 % contribution from inorganic mass. The total measured organic mass reached a maximum concentration of ∼30 µg m−3 during the measurement period, with an average concentration of ∼3 µg m−3. We note evidence of both long-term events and short-term spikes. We selected a five-factor unconstrained PMF solution containing three primary and two secondary factors. The primary factors consisted of hydrocarbon-like organic (HOA) related to traffic, cooking-related organic aerosol (COA), and a cigarette-smoke-related factor (CS-OA). The secondary factors were separated by their oxygen content, which has been empirically related to volatility (Jimenez et al., 2009), and are classified here as less-oxidized oxygenated organic aerosol (LO-OOA) and more-oxidized oxygenated organic aerosol (MO-OOA) (Zhang et al., 2011). The five-factor solution was preferred because the four-factor solution was not able to separate the HOA and COA factors, while the six-factor solution added an additional OOA factor with a noisy time series for which no physical interpretation could be found. Higher-order solutions with up to 10 factors likewise yielded no additional interpretable factors. Figure 1 shows the mass spectra of the five-factor solution with ions colour-coded according to their chemical family (CxHy, CxHyOz, CxHyNp, CxHyOzNp, HyOz, and “other”, which includes CxOy, Cx, Oy, and sulfur-containing ions). The factor time series and diurnal patterns are shown in the Supplement (Fig. S3). The dominant source in mass is LO-OOA, especially during the period with higher temperature, followed by MO-OOA. Specific local events are instead dominated by the primary sources.
The HOA factor is related to fossil fuel combustion, mainly from traffic emissions. These emissions are typically dominated by engine-lubricating oil and consist mainly of n-alkanes, branched alkanes, cycloalkanes, and aromatics, leading to high signal of the ions and (Ng et al., 2011). Prominent contributions of non-oxygenated species at m∕z 43 (), m∕z 55 () and m∕z 57 () can be observed. Similar to the results of other studies (e.g. Lanz et al., 2007a, b; Ulbrich et al., 2009; Zhang et al., 2011) HOA exhibits temporal correlations with primary vehicular emissions tracers, such as elemental carbon from traffic (ECtr) and NOx (Zhang et al., 2005).
The COA factor is similar to HOA in that a large fraction of the signal is contributed by ions. However, COA has distinctive mass spectral features, typical of the fragmentation of fatty acids. Characteristic peaks include C3H3O+ at m∕z 55, C3H5O+ at m∕z 57, and higher-molecular-weight oxygenated fragments: C5H8O+ (m∕z 84), C6H10O+ (m∕z 98), and C7H12O+ (m∕z 112). In addition, the COA and HOA factors could be differentiated on the basis of the signal ratio of C3H3O+ to C3H5O+ as the COA spectrum tends to show a substantially higher m∕z 55 to m∕z 57 ratio (Mohr et al., 2009; Sun et al., 2011). Reliable molecular tracers of cooking emissions are not typically available, but Fig. S3b shows a diurnal pattern with significant peaks during mealtimes, consistent with previous studies.
The CS-OA factor is related to a cigarette smoke signature and the profile is similar to previously reported smoking-related factors measured at Jungfraujoch (Fröhlich et al., 2015) and a German soccer stadium (Faber et al., 2013). Similar to HOA and COA, the profile includes a strong contribution from , but for CS-OA is shifted towards less saturated ions (branched and n-alkanes, cycloalkanes, and alcohols). Relevant signal can be observed at m∕z 41 () and m∕z 43 ( and C2H3O+) and also fragments from aromatic compounds at m∕z 77 (), 91 (), 105 () and 119 (). In addition, this factor is unique in having a significant contribution from C5H10N+ (m∕z 84), which has been attributed to n-methyl-pyrrolidine, a tracer for cigarette smoke (Struckmeier et al., 2016). Furthermore, the CS-OA factor exhibits a significantly higher N:C ratio (0.02) compared to the other factors (ranging from 0.003 to 0.01) and explains most of the organic nitrogen signal.
Finally, the OOA factors are characterized by a very high contribution of the signal at m∕z 44 (), typical of AMS SOA profiles. The LO-OOA spectrum is characterized by prominent peaks at m∕z 43 (C2H3O+) and m∕z 28 (CO+). It resembles LO-OOA factors determined in previous studies at urban sites, as well as newly formed aerosol from forest emissions and biogenic SOA from chamber studies (Zhang et al., 2007; Lanz et al., 2007a, b; Ulbrich et al., 2009; Hao et al., 2009, 2014; Kiendler-Scharr et al., 2009; Ng et al., 2010; Sun et al., 2010). LO-OOA has an atomic O:C ratio of 0.40 (consistent with the global average of LO-OOA of 0.35±0.14; Ng et al., 2010) while the second OOA factor, MO-OOA, is more oxidized with an O:C ratio of 0.50. The mass spectrum of the latter is dominated by m∕z 44 () and m∕z 28 (CO+). The profile is similar to MO-OOA factors reported at various locations, including urban areas and the boreal forest (Allan et al., 2006; Ulbrich et al., 2009; Sun et al., 2010; Raatikainen et al., 2010; Hao et al., 2014). Overall, LO-OOA includes less oxygenated and possibly freshly oxidized species while MO-OOA includes highly oxygenated species. Furthermore, the LO-OOA ∕ MO-OOA ratio is higher, particularly on days with higher OOA concentration, which in turn correspond to sunny weather and warmer temperatures. The strong correlation of this factor with local ambient temperature indicates that LO-OOA is rather locally formed and possibly linked with SOA formed from the oxidation of biogenic emissions (Fig. S5). Similar findings have been reported by Canonaco et al. (2015) at the same site for summer OA measured by an aerosol chemical speciation monitor (ACSM). During summer afternoons, when photochemical processes are most vigorous, the formation of semi-volatile oxygenated organic aerosol (SVOOA) is enhanced compared to low-volatility oxygenated organic aerosol (LVOOA) formation, which typically occurs on a timescale of hours. This is likely due to the formation of semi-volatile oxygenated aerosol produced from biogenic precursor gases, especially monoterpenes, whose emissions increase with ambient temperature.
The diurnal patterns of these two factors are flatter than the POA factors, however the LO-OOA concentrations started increasing from early morning, most likely due to condensation of semi-volatile species and fresh formation of OOA due to photochemistry. Afterwards this factor continuously decreased, possibly due to boundary layer expansion and photochemical conversion to MO-OOA (Fig. 4). However, the LO-OOA concentration remained significantly higher than other primary emissions which suggests that LO-OOA probably forms from the oxidation of primary emissions and/or continued conversion of less oxidized gas-phase products into the particle phase. Furthermore, a correlation between the concentrations of LO-OOA and nitrate (NO3) was observed (R=0.47). Particulate nitrate also represents semi-volatile secondary species, which share similarity with LO-OOA in terms of volatility and its partitioning behaviour with temperature while the MO-OOA time series are is correlated with sulfate (SO4) (R=0.6), representing a less volatile fraction and suggesting that MO-OOA is related to longer-lived aged regional SOA (Lanz et al., 2007a, b). Overall, the LO-OOA and MO-OOA components account for 46 % and 25 % of the total organic aerosol mass observed, respectively, dominating the total OA concentration. Due to the extent of fragmentation occurring in the AMS system, it was not possible to gain any more information about SOA sources apart from their oxygenation–volatility pattern. The inclusion in the analysis of more highly detailed chemical composition, provided by the new EESI-TOF-MS system, allowed us to distinguish, with more detail, the SOA processes of formation and oxidation pathways, as outlined in the following.
3.2 EESI-TOF PMF
3.2.1 Selection and overview of the solution
We present in the following a PMF analysis on the first-ever ambient EESI-TOF-MS data. As discussed in the previous section, PMF analysis of AMS data indicates SOA to be the dominant component but does not provide any direct chemical information indicating the SOA sources. In contrast, PMF analysis of EESI-TOF-MS data yielded several organic aerosol factors related to secondary OA formation. Factors were separated according to different mass spectral fingerprints and ageing processes for a total of six factors including both POA and SOA. The six-factor solution presented throughout the text is the averaged solution among 795 accepted bootstrap runs (out of 1000 total). The bootstrap analysis is discussed in detail in Sect. 3.2.5 and is based around random selection of the a value constraints on the profile of a cooking-related factor (COAEESI) (with a values selected in the range 0 to 0.1, with a step size of 0.1), with the COAEESI anchor profile constrained using the cleaner cooking-related factor profile retrieved in the seven-factor solution. Critically, we consider all solutions classified as being reasonable and unmixed (according to the evaluation in Sect. 3.2.5) to be of equal merit. Therefore the base case solution represents only a single, quasi-randomly selected solution out of this large set (rather than an optimized solution), and we consider the average of all acceptable solutions to be the best representation of the source apportionment analysis.
An overview of the factor profiles, time series, and diurnal patterns is presented in Figs. 2–4, respectively. Note that the diurnal pattern presented in Fig. 4 refers to the entire measurement period while Fig. S4 shows the diurnal patterns for the same factors calculated for only the overlapping measurement period between EESI-TOF-MS and AMS. We observed two primary factors: cooking-related OA (COAEESI) and cigarette-smoke-related OA (CS-OAEESI). Four SOA factors were resolved: two daytime SOA factors (DaySOA1EESI and DaySOA2EESI) and two night-time factors (NightSOA1EESI and NightSOA2EESI). Each factor is described in further detail in the following sections.
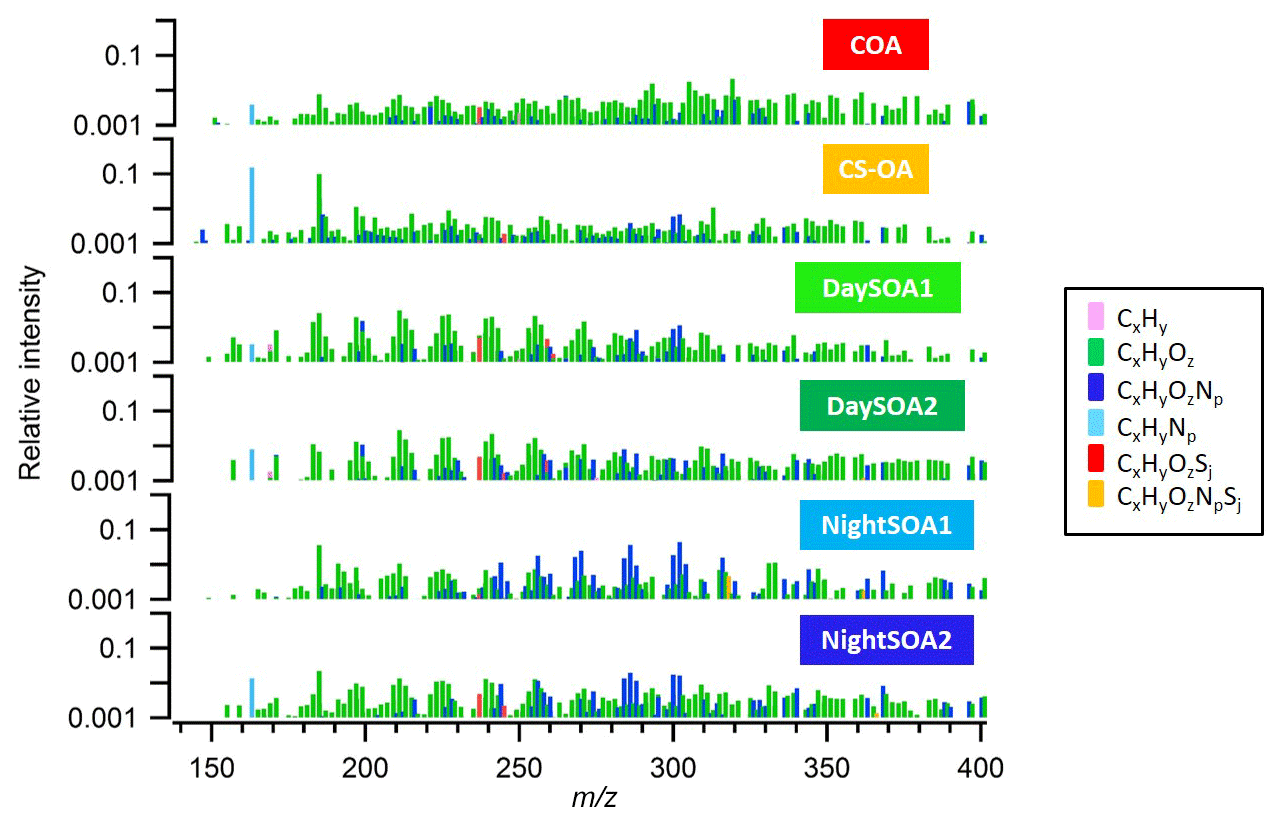
Figure 2Mass spectra in log scale of the six identified OA EESI-TOF-MS PMF factors, colour-coded according to their chemical families. The sum of each spectrum is normalized to 1.
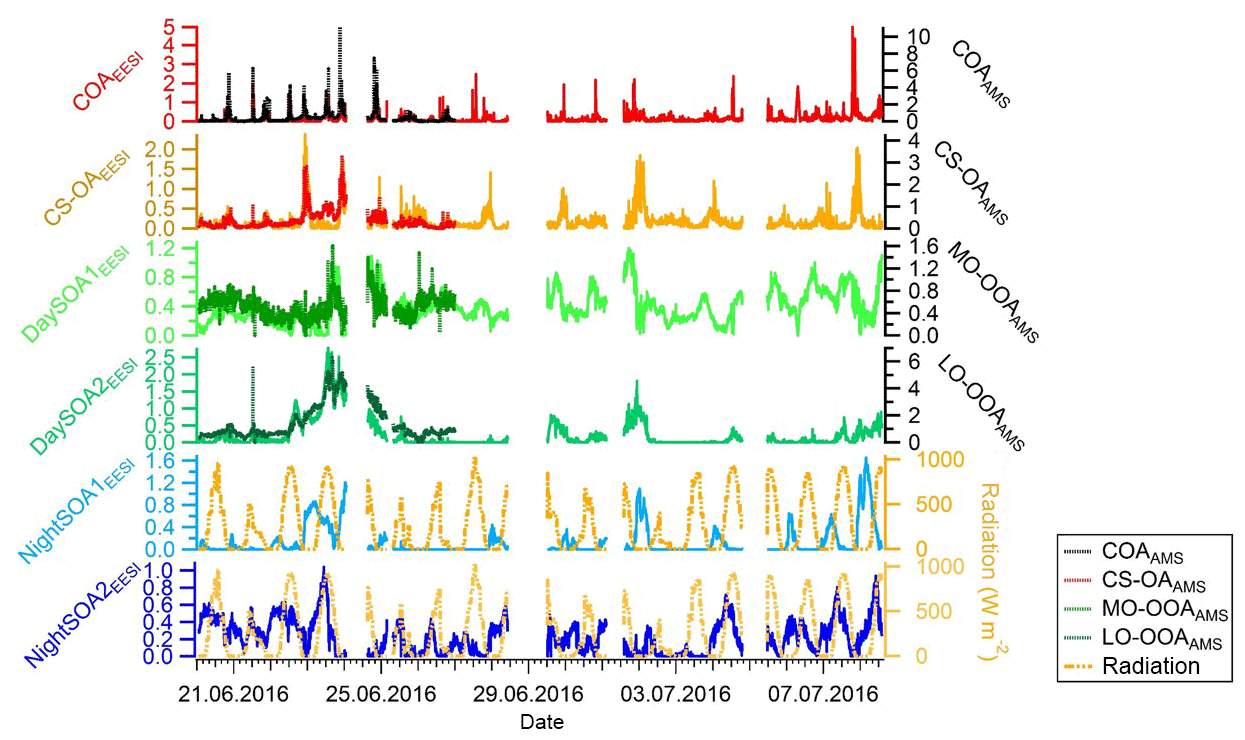
Figure 3Time series of EESI-TOF-MS PMF factors (ag s−1) on the left axis and related AMS PMF factors, when applicable, on the right axis (µg m−3) for the overlapping measurement period. Solar radiation measurements (W m−2) from the NABEL station are reported as well for comparison with the night-time EESI factors time series.
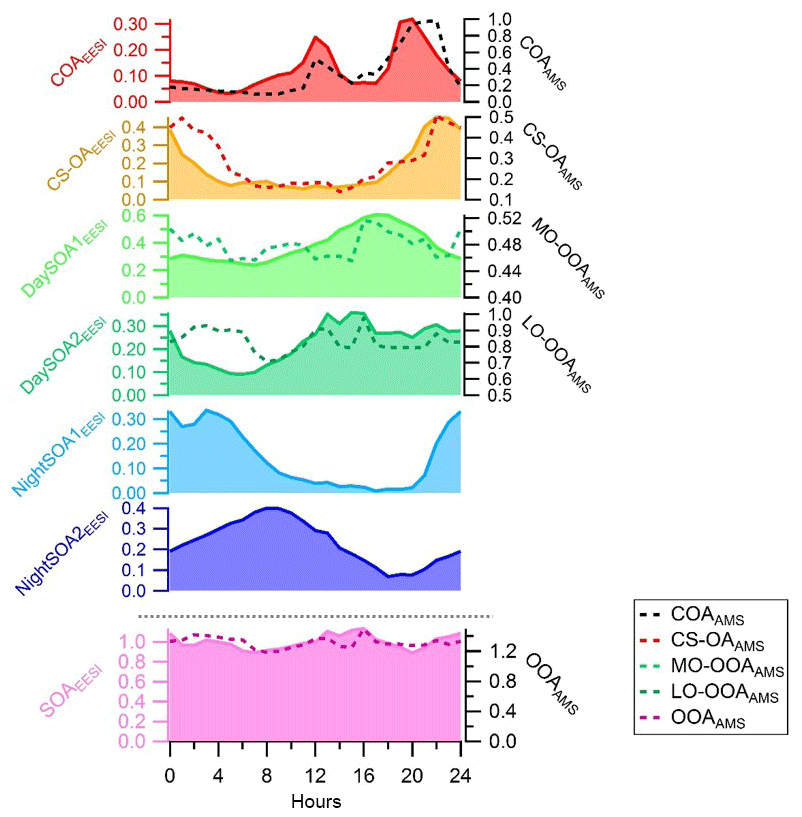
Figure 4Diurnal variations in the EESI-TOF-MS PMF factors on the left axis (ag s−1) and counterpart diurnal variations from the AMS PMF analysis on the right axis (µg m−3). The diurnal variations are presented here for the entire measurement period (see Fig. S4 for the overlapping period only). SOAEESI and OOAAMS denote the sums of all the secondary factors.
A common criterion used to assess the selection of the number of factors is the examination of Q∕Qexp for an increasing number of solution factors to evaluate the fraction of explained variation in the data. For unconstrained solutions, the Q∕Qexp value decreased smoothly from 5.4 to 4.0 as the number of factors increased from 2 to 10, providing little insight into the optimal number of factors. The six-factor solution was chosen after constraining the cleaner cooking profile retrieved from the seven-factor solution within the bootstrap analysis (Sect. 3.2.5). The solution with one factor fewer provided a mixed primary emissions factor, while the seven-factor solution resulted in an additional non-interpretable splitting of the daytime SOA (as did higher-order solutions).
Figure 4 shows the diurnal patterns of all individual factors as well as of the sum of all four SOA factors from the EESI-TOF-MS analysis and sum of the two OOA factors from the AMS analysis. The pattern of the sum of all SOA factors is basically flat. However, each individual SOA factor exhibits strong and distinctive variation. The diurnal pattern of DaySOA1EESI exhibits a factor of 2 enhancement in signal between 15:00 and 21:00 LT while the DaySOA2EESI exhibits the same magnitude of enhancement in signal around 12:00 LT without a consistent decrease before 01:00 LT. This shift in time between the two factors could reflect gradients in composition according to lifetime of the compounds, production time, partitioning, and reactive environment. Concerning the diurnal pattern, NightSOA1EESI peaks during the night between 22:00 and 05:00 LT while NightSOA2EESI is elevated in the early morning between 04:00 LT and noon, corroborating the shift in chemistry with daytime oxidants also being available.
3.2.2 Primary factors (COAEESI and CS-OAEESI)
The COAEESI mass spectrum is dominated by long-chain fatty acids and alcohols, which are typical of cooking emissions (Liu et al., 2017). For example, C18H32O3 (coronaric acid, m∕z 319.2), C18H34O2 (oleic acid, m∕z 305.2), and C16H30O3 (2-oxo-tetredecanoic acid, m∕z 293.2) are prominent and contribute 2.1 %, 1.7 %, and 1.5 %, respectively, to the overall profile signal. The variability of these ions is also dominated by the cooking source. Another prominent peak in the spectrum, accounting for 0.7 % of the signal, is C6H10O5 (m∕z 185), which is attributed to levoglucosan and commonly used as an indicator for primary aerosols originating from biomass combustion (Hennigan et al., 2010; Giannoni et al., 2012) as it is derived from the pyrolysis of cellulose and hemicellulose. The study from Bertrand et al. (2018) shows C6H10O5 (m∕z 185) to be a very prominent peak in the EESI-TOF-MS mass spectrum of fresh wood burning emissions. Further, the EESI-TOF-MS is probably more sensitive to levoglucosan than to bulk SOA (Lopez-Hilfiker et al., 2019). During this study, levoglucosan is likely emitted from open cooking activities in the vicinity of the measurement site.
The COAEESI and COAAMS factor time series are well correlated (R=0.65) during the overlapping measurement period (20 to 27 June) (Fig. 3), with both showing clear peaks at lunchtime and dinner time (Figs. 4 and S4).
The CS-OAEESI mass spectrum is dominated by C10H14N2 (nicotine, m∕z 163.12) and C6H10O5 (levoglucosan), which contribute 15 % and 10 %, respectively, to the profile signal. Levoglucosan is also a known product of pyrolysis of simple sugars present in tobacco (Talhout et al., 2006). Other prominent signals occur at m∕z 197.04 (C7H10O5), 199.09 (C7H12O5), 203.1 (C6H12O6, glucose), 215.05 (C7H12O6), 227.05 (C8H12O6), and 313.05 (C7H14O12). The CS-OAEESI shows strong correlation with the AMS factors traffic (HOAAMS, R=0.6) and cigarette smoke (CS-OAAMS, R=0.73). The correlation further improves when considering the two sources together (R=0.77) suggesting a certain extent of mixing of the two sources within the same factor. The discrimination of a separate factor related solely to traffic was not possible, even investigating solutions with a higher number of factors, where only additional non-interpretable secondary sources were discriminated. The inability of the EESI-TOF-MS to resolve a clear traffic-related factor is likely due to the insensitivity of the instrument to the hydrocarbons dominating these emissions (Sect. 3.3). The diurnal pattern of CS-OAEESI shows a peak during the evening between 21:00 and 23:00 LT, during which the courtyard in which the measurement site is located is typically more crowded. Overall, as expected, the primary factors show low O:C ratios of 0.38 and 0.43 and high H:C ratios of 1.75 and 1.7 for COAEESI and CS-OAEESI, respectively.
3.2.3 Secondary daytime factors
Two daytime SOA factors (DaySOA1EESI and DaySOA2EESI) were resolved from the EESI-TOF-MS PMF analysis (Fig. 2), both of which contain strong signatures of terpene oxidation products.
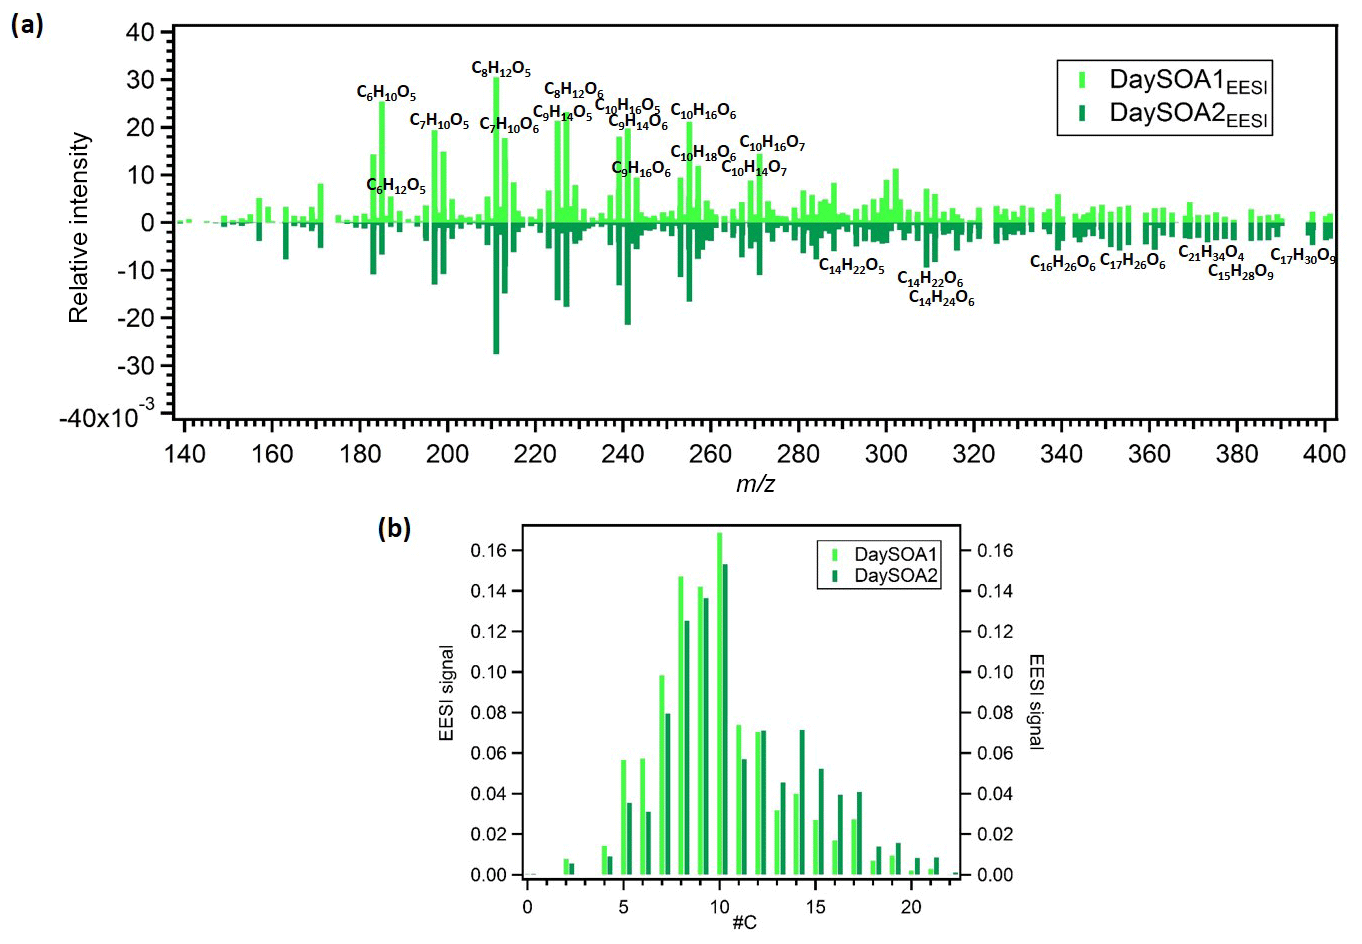
Figure 5(a) Mirrored mass spectra of EESI DaySOA1 and DaySOA2. Factor profiles are first weighted by their molecular weight to represent equivalent mass concentrations (ag s−1) and then normalized such that the sum of each spectrum is 1. (b) Histogram of normalized profile signals distributed across bins of carbon atom number.
Prominent monoterpene-derived ions in the DaySOA2EESI factor profile include m∕z 239.09 (C10H16O5), 255.08 (C10H16O6), and 271.079 (C10H16O7) while other peaks are tentatively identified as sesquiterpene oxidation products, i.e. m∕z 275.16 (C15H24O3), 307.15 (C15H24O5), and 325.162 (C15H26O6). The latter species could also be dimers from monoterpenes/isoprene oxidation products. However, the absence of signal from C19 and C20 compounds suggests that dimer concentrations are low in Zurich. This may be due to suppression of dimerization by NOx (Yan et al., 2016; Kürten et al., 2016) and is consistent with the dimer fraction here being low compared to that observed in the Finnish boreal forest and with both ambient measurements being lower than that of α-pinene ozonolysis in a NOx-free simulation chamber (Pospisilova et al., 2019). Thus, we believe that the above-mentioned species are likely related to sesquiterpene oxidation products. Overall, the C10H16Oz series accounts for 6.2 % of the total profile signal for DaySOA1EESI and 5.3 % for DaySOA2EESI (2.5 %, 2 %, 4.4 %, and 5.1 % for COAEESI, CS-OAEESI, NightSOA1EESI, and NightSOA2EESI) while the C15H24−28Oz series accounts for 1 % of the total profile signal for DaySOA1EESI and 2.3 % for DaySOA2EESI. Furthermore, other significant series of compounds are present including (C9H14Oz) accounting for 5.8 % and 5.2 %, (C7H10Oz) accounting for 4.7 % and 3.5 %, and (C8H12Oz) accounting for 6.4 % and 5.6 % of the total profile signal for DaySOA1EESI and for DaySOA2EESI.
The two DaySOAEESI factor spectra are compared in more detail in Fig. 5a, with the carbon number distribution shown in Fig. 5b. DaySOA1EESI is more shifted towards ions with lower m∕z and carbon number. These species with fewer than 10 carbon atoms can represent fragmentation products from terpene oxidation either in the gas phase (Molteni et al., 2019) followed by condensation or during ageing in the condensed phase (Pospisilova et al., 2019). However, fragmentation results in products progressively more difficult to distinguish from ring-opening products from the oxidation of aromatic precursors, and therefore we cannot rule out a contribution to these ions from aromatic oxidation products. DaySOA2EESI is instead shifted towards higher masses with a carbon atom number typical of sesquiterpene oxidation products and/or dimerization. Overall the two secondary daytime factors show a high apparent O:C ratio of 0.63 and 0.58 and similar apparent H:C ratios of 1.64 and 1.66 for DaySOA1EESI and DaySOA2EESI, respectively, consistent with the expected values for biogenic precursors of SOA, which exhibit an H:C ratio from 1.2 to 1.7 (Daellenbach et al., 2019) and specifically monoterpenes and sesquiterpenes with a H:C ratio of 1.6.
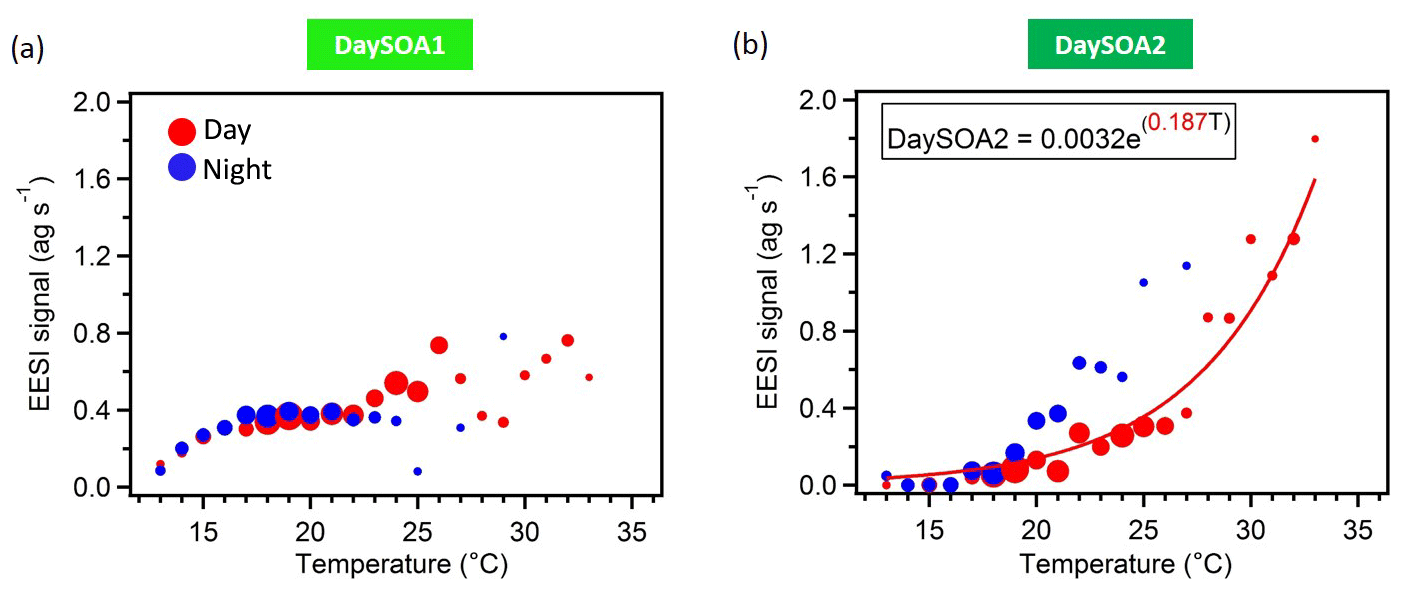
Figure 6DaySOA1EESI (a) and DaySOA2EESI (b) correlation with hourly ambient temperature (∘C). The data are colour-coded according to day (06:00–21:00 LT, red) and night (21:00–06:00 LT, blue) measurement times, they are grouped in temperature bins of 1 ∘C, and the size of the dots corresponds to the number of points considered. Data recorded during precipitation events are discarded. The fitting curve is weighted by 1 SD (standard deviation).
The two daytime SOA factors exhibit not only different chemistry but also a different dependency on ambient temperature. Figure 6 shows the correlation of the two daytime SOA factors with the hourly ambient temperature. While DaySOA1EESI does not show a clear dependency on temperature DaySOA2EESI increases exponentially with temperature, consistent with known relationships for terpene emissions and biogenic aerosol in terpene-dominated regions (Leaitch et al., 2011; Vlachou et al., 2018). This supports the interpretation of DaySOA2EESI as a factor related to local oxidation of biogenic VOCs and DaySOA1EESI as a factor related to more aged or regional air masses. Figure S5 shows the equivalent relation with temperature for the AMS secondary factors; we note that LO-OOAAMS exhibits an exponential increase with temperature similar to the DaySOA2EESI but with a weaker correlation, suggesting mixing of the two factors identified by the EESI-TOF-MS and possibly also with other sources not related to biogenic emissions. The time series DaySOA1EESI shows a correlation with MO-OOAAMS (R=0.54), which typically represents less volatile and more aged/regional, secondary organic aerosol compounds. An even higher correlation is observed between DaySOA2EESI and LO-OOAAMS (R=0.91), where LO-OOAAMS is believed to represent semi-volatile and more freshly produced secondary organic aerosol compounds.
3.2.4 Secondary night-time factors
Two night-time SOA factors (NightSOA1EESI and NightSOA2EESI) were resolved from the EESI-TOF-MS PMF analysis (Fig. 2). The differences in composition between the two-factor profiles is shown in Fig. 7 where the signal from the two profiles are also summed by carbon number. NightSOA1EESI peaks between midnight and 04:00 LT, decreases to nearly zero shortly after sunrise, and remains near zero until after sunset. Relative to the DaySOAEESI factors, the NightSOA1EESI spectrum includes less oxygenated and more volatile terpene oxidation products (e.g. C10H16O2 and C10H16O3), which likely partition to the particle phase due to lower night-time temperatures. In addition, prominent signatures from organonitrates are evident, which are likely derived from nitrate (NO3) radical oxidation of monoterpenes at night. Previous studies in rural areas during summer suggested NO3 oxidation of monoterpenes to contribute a large fraction of the night-time SOA (Xu et al., 2015; Zhang et al., 2018). Dominant peaks in the spectrum can be observed for the C10H17OxN species at m∕z 286.09 (C10H17O7N), 302.08 (C10H17O8N), and 270.09 (C10H17O6N), which contribute 3.6 %, 4.6 %, and 2.4 %, respectively, to the overall profile signal (ag s−1), resulting in the highest contributions compared to all the other factors. Another major series of compounds in the spectra is found for C10H15OxN, which can be observed at m∕z 268.08 (C10H15O6N), 284.07 (C10H15O7N), 300.07 (C10H15O8N), and 316.06 (C10H15O9N) and contribute 1.6 %, 1.5 %, 1.8 %, and 1.5 %, respectively, to the profile signal, resulting in the highest contributions compared to all the other factors except for C10H15O7N and C10H15O8N, which contribute ∼1.3 % and ∼1.7 % to the NightSOA2EESI profile signal (ag s−1). These species are consistent with NO3 oxidation products of atmospherically relevant monoterpenes such as limonene (Faxon et al., 2018).

Figure 7(a) Mirrored mass spectra of EESI NightSOA1 and NightSOA2. Factor profiles are first weighted by their molecular weight to represent equivalent mass concentrations (ag s−1) and then normalized such that the sum of each spectrum is 1. (b) Histogram of normalized profile signals distributed across bins of carbon atom number.
The NightSOA2EESI likewise exhibits a strong and consistent diurnal cycle, with a daily maximum at approximately 09:00 LT, minimum at 21:00 LT, and smooth transitions in between. Like NightSOA1EESI, NightSOA2EESI exhibits strong signatures from organonitrates. However, contributions from non-nitrogen-containing species consistent with limonene and α-pinene ozonolysis and photo-oxidation are also evident, e.g. C9H14O5−6 and C10H16O4−6 (Bateman et al., 2009; Kahnt et al., 2014; Park et al., 2017), as well as species probably consistent with multi-generation terpene chemistry or aromatic oxidation products suggesting a certain extent of influence from photochemistry, consistent with the diurnal morning peak of this factor. Dominant compounds in the spectrum can be observed at m∕z 286.09 (C10H17O7N), 211.058 (C8H12O5), 225.07 (C9H14O5), 239.09 (C10H16O5), and 197.042 (C7H10O5) contributing 1.9 %, 1.3 %, 1.3 %, 1.2 %, and 0.9 %, respectively, to the total profile signal resulting in the highest contributions among all the other factor signals except for the two DaySOAEESI factors, where they contribute with higher percentages between 1.3 % and 3 % to the profile signal. Overall the two secondary night-time factors show similar O:C ratios (∼0.6) and H:C ratios (∼1.65) while the N:C ratio is higher for NightSOA1EESI (0.46) than for NightSOA2EESI (0.3).
Figure S5 shows the correlations of the two night-time SOA factors with ambient temperature. We note that the NightSOA1EESI increases to some extent with temperature, consistent with biogenic aerosol and with the behaviour of DaySOA2. The effect is clear for the night points while not visible for the day points, which is expected from the diurnal pattern of the factor going almost to zero during the day. On the other hand, the NightSOA2EESI does not show any clear dependency on the temperature, suggesting a combined effect of partitioning, additional chemistry, and possibly additional sources. Overall, during the day there will generally be higher terpene emissions due to higher temperature, but also higher dilution due to an enhanced boundary layer height compared to the night, suggesting that, by compensation, terpene-related SOA formation in the lowest layers of the atmosphere might be similar. As a consequence DaySOA2EESI and NightSOA1EESI might represent first-generation chemistry with different oxidants reflecting the availability during the time of the day while DaySOA1EESI and NightSOA2EESI might represent second-generation chemistry oxidation products. As an example, some highly functionalized oxidation products from α-pinene photooxidation like C10H16O5 are thought to be second-generation oxidation products (McVay et al., 2016). As a consequence of the extensive decomposition and fragmentation occurring in the AMS system, which particularly affects organonitrates (Farmer et al., 2010), we were not able to resolve any factor related to night chemistry or specific factor dominated by a nitrate signature to compare with the night-time SOA factors from the EESI-TOF-MS analysis. However, the organonitrate-derived signal in the AMS and that of the EESI-TOF-MS are well correlated. Figure 8 shows the time series of the sum of all CxHyOzN+ ions from the AMS and [CxHyOzNp]Na+ ions from the EESI-TOF-MS, with R=0.7. For the AMS analysis the MO-OOAAMS is the factor that contributes the most to these nitrogen-containing fragments mentioned above (∼50 %) followed by the CS-OAAMS (∼20 %), while for the EESI-TOF-MS analysis the NightSOA1EESI is the major contributor to the nitrogen-containing species (∼35 %) followed by NightSOA2EESI (∼20 %).
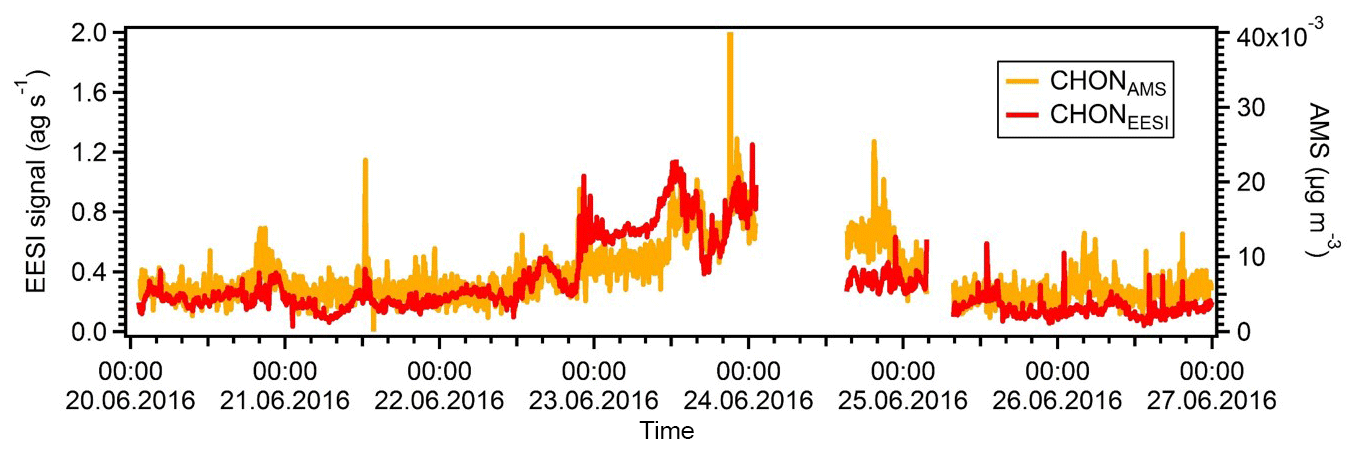
Figure 8Time series of the total signal of all CxHyOzNp species from the AMS (orange trace) and the EESI-TOF-MS (red trace).
3.2.5 Bootstrap analysis
Bootstrap analysis (Davison and Hinkley, 1997) was conducted to determine the statistical stability and uncertainties of the EESI-TOF-MS PMF solution and evaluate some trends in specific ions and the extent to which factors are discrete versus basis vectors describing compositional gradients. Bootstrap analyses generate a set of new input data and error matrices for analysis from random resampling of the original input data. This resampling perturbs the input data by randomly choosing rows (time points) of the original matrix which are present several times, while other rows are removed (Paatero et al., 2014); the overall dimensions of the data matrix are kept constant for each resampling. The resampled data made up on average ∼64 % of the total original data per bootstrap run. We performed 1000 bootstrap runs for a six-factor solution with all factors unconstrained except for COAEESI, which as discussed above was constrained using the cooking-related spectrum obtained from the seven-factor unconstrained solution. The cleaner spectra and higher correlation with AMS cooking factor (COAAMS) compared to the cooking profile discriminated in the unconstrained six-factor solution, where a clear mixing with other profiles was still present and an additional not meaningful SOA profile was present, resulted from a splitting of the SOA factor in the solution with one factor fewer. The a value of the constrained COAEESI was randomly selected for each bootstrap iteration within the range of 0 to 1 with a 0.1 step size. Note that each bootstrap run is started from a different initialization point; thus, this methodology also includes the investigation of seed-based variability, accounting for the possibility of local minima in the solution space.
A particular point of interest in the bootstrap analysis was the extent to which (day and/or night) SOA factors mix with each other. Thus, it is important to characterize solutions where factors are distinct or mixed and, in the case of mixing, to characterize the type of mixing (i.e. which factors are mixed). For this purpose, we adapted the method of Vlachou et al. (2018). The key steps in this method are as follows: (1) creation of a six-factor base case: this was synthesized from the unconstrained seven-factor solution described above to optimize COAEESI, with the split SOA mathematically combined into a single factor (see Fig. S6 for the seven-factor solution); (2) Spearman correlation between the time series and the profiles of each factor from the base case and a bootstrap solution are used to sort the bootstrap factors, yielding a correlation matrix with the highest correlation values on the diagonal; (3) each correlation coefficient on the matrix diagonal is compared to those on the intersecting row and column to evaluate whether it is the highest by a statistically significant margin (based on a preselected significance level p from a t test). Vlachou et al. (2018) rejected any solution failing to meet this criterion; here we retain the solution but classify it as “mixed”. For mixed solutions, we then determined which factor(s) was mixed (i.e. which factor(s) had time series that could not be unambiguously linked to a unique base case factor based on the statistical significance test described above) and classified solutions according to combinations of mixed factors. This allowed a systematic exploration of bootstrapped solutions most likely to have perturbed the boundaries between selected SOA factors.
The analysis of Vlachou et al. (2018) utilized a p value = 0.05; here we conducted a sensitivity test covering p values ranging from 0.05 to 0.6. For p values lower than 0.3, the only mixing observed was among POA factors (e.g. p value = 0.2 yielded mixing between COAEESI and POAEESI for ∼100 runs based on time series analysis and ∼80 runs based on profile analysis). A p value of 0.4 showed mixing NightSOA1EESI with NightSOA2EESI and/or DaySOA2EESI for ∼50 runs based on time series analysis, while ∼10 bootstrap runs showed profile mixing between DaySOA1EESI and DaySOA2EESI. However, visual analysis of these mixed-SOA solutions at p=0.4 showed solutions where both the factor profiles and time series were not distinguishable from the base case. We therefore concluded that the SOA factor separation is robust, supporting our treatment of these factors as discrete entities rather than highly interrelated descriptors of composition gradients.
We applied, at this point, a significance threshold of 0.3 (p value from t test analysis) and extracted all the solutions classified as unmixed. This resulted in 795 accepted solutions out of 1000 runs, with an average a value of the constrained COAEESI profile of 0.399. Figure 9 summarizes the averaged extracted solution from the bootstrap analysis, showing the means and standard deviations of these 795 accepted solutions for the diurnal patterns (Fig. 9a) and factor mass spectra standard deviations against relative intensities (Fig. 9b). The uncertainties of the model (which correspond to the standard deviations among retained solutions) are also presented in Fig. 9 and indicate the high stability of the solution. First we calculated the diurnals, then the standard deviation of the mean diurnals across all bootstrap runs. Thus, the error bars describe variability across solutions (i.e. model uncertainty) and deliberately exclude day-to-day variability in the actual data.
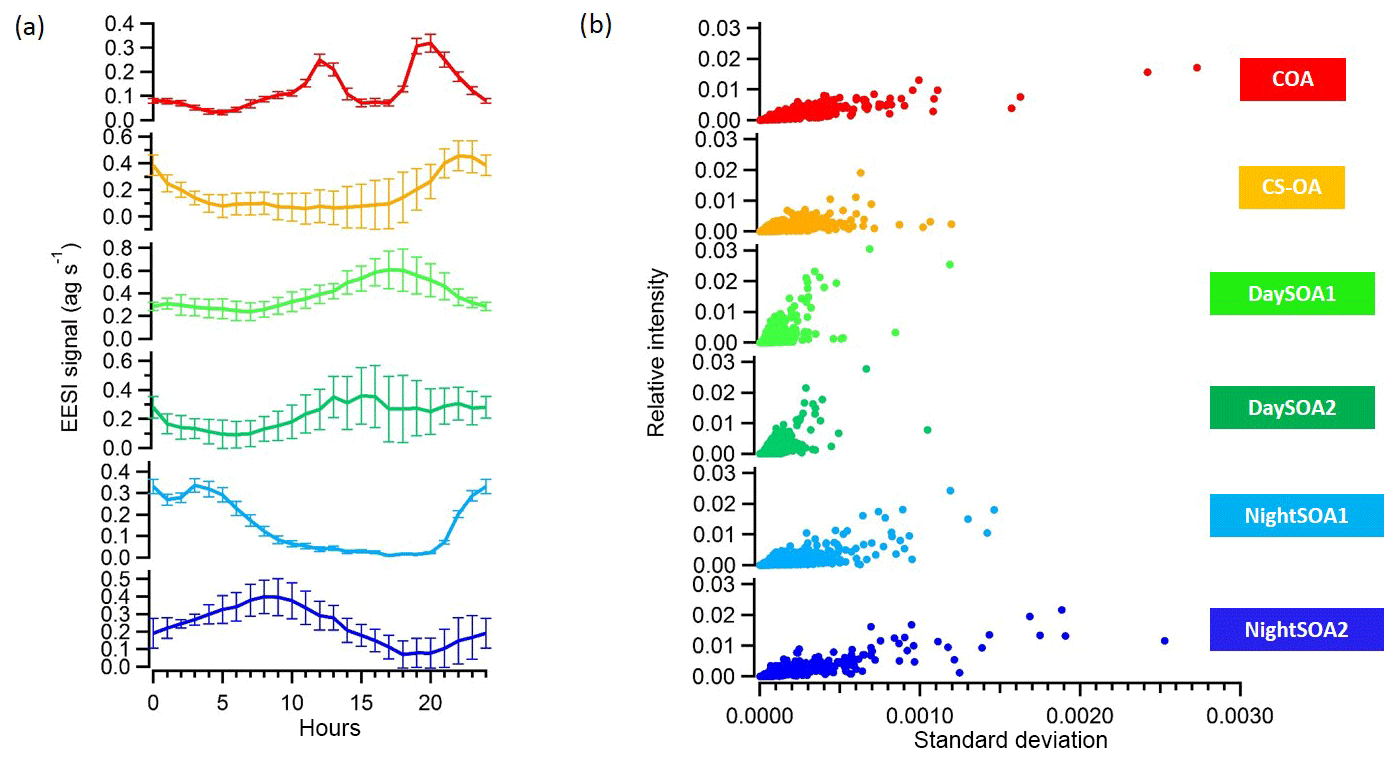
Figure 9(a) Diurnal variations and (b) scatter plots of the relative intensities and standard deviations among 795 bootstrap runs of the six OA factors identified with PMF from the EESI-TOF-MS analysis.
The median percentage uncertainties for the profiles varied between 5.3 % and 12 % where the highest uncertainties were related to the night-time SOA factors. The highest diurnal variability was related to CS-OAEESI and DaySOA2EESI. Overall, the uncertainties were not of sufficient magnitude to disrupt the diurnal gradients discussed above or to significantly affect the apportionment of key ions discussed above. This highlights the relatively discrete nature of the factors.
3.3 EESI-TOF-MS and AMS comparison
Figure 10a shows the bulk comparison between the EESI-TOF-MS and the AMS total signal for the overlapping measurement period. The AMS total signal represents the time series of measured organic mass concentration while the EESI-TOF-MS total signal is the sum of the mass fluxes of every detected ion (neglecting Na+ mass and excluding ions that are high intensity but spray-dominated). Further, no relative sensitivity corrections were applied for the EESI-TOF-MS even though it is known that there is some sensitivity variability (Lopez-Hilfiker et al., 2019).
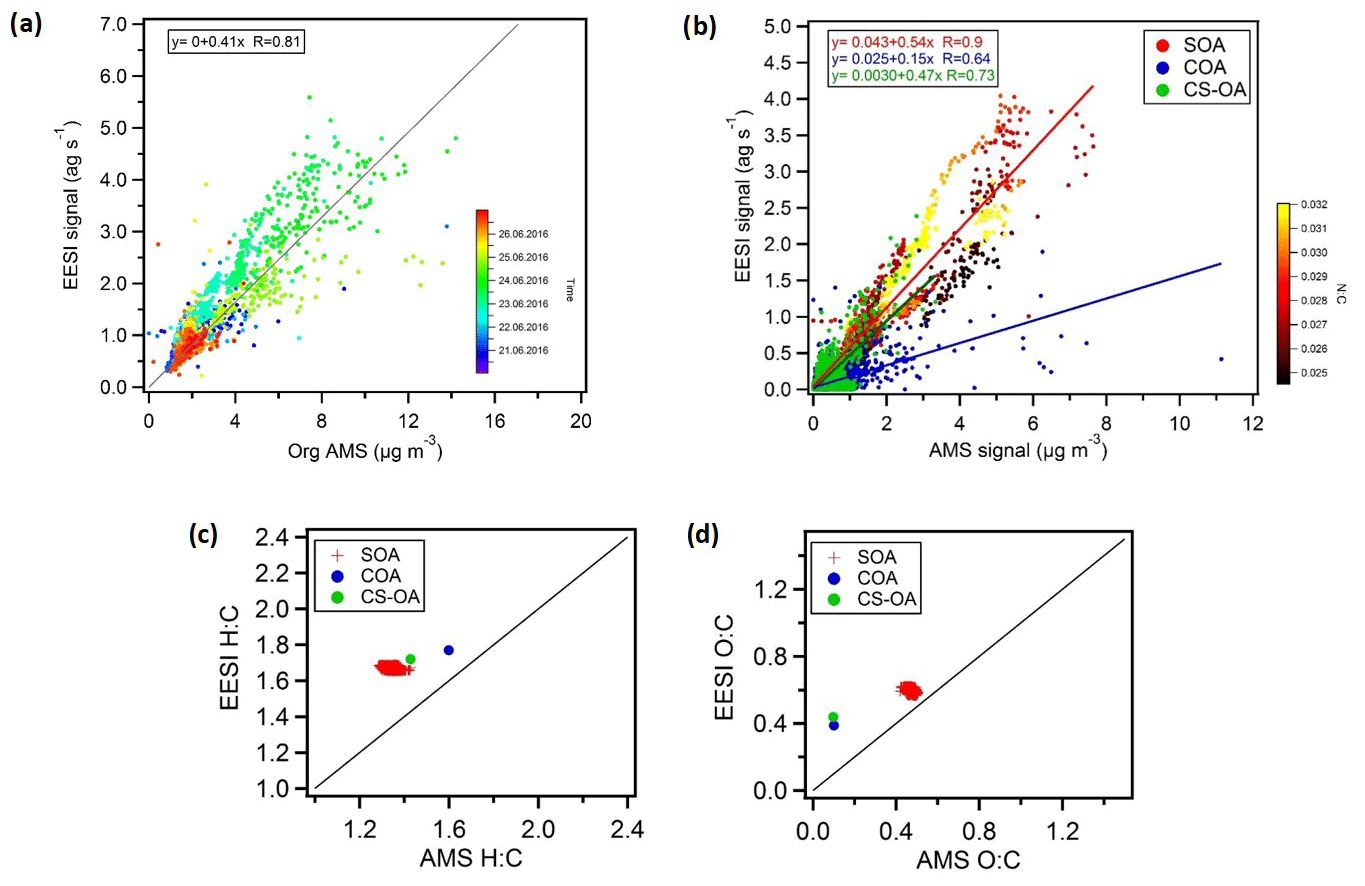
Figure 10(a) Total aerosol signal measured by the EESI-TOF-MS versus OA measured by the AMS, with the points coloured by time. An overall bulk sensitivity to OA can also be estimated from (a) (). (b) Correlations of the CS-OA and COA factors and of SOA (total SOA estimated by EESI-TOF-MS and AMS) from the two instruments, where SOA is colour-coded by the N:C ratio (yellow dots represent ). We estimate bulk sensitivities of ions per molecule to SOA, ions per molecule to CS-OA, and ions per molecule to COA. (c, d) Atomic ratios, i.e. H:C and O:C ratios for SOA and the CS-OA and COA factors.
The results of the two instruments are correlated (R=0.81) despite the assumption that all EESI-TOF-MS ions have the same response factor and even though the AMS-measured mass includes a primary source related to traffic (HOAAMS) that consists mainly of compounds that are insoluble in the electrospray droplets and therefore not visible in the EESI-TOF-MS.
Figure 10b shows the EESI-TOF-MS signal as a function of AMS mass for the COA and CS-OA primary factors and the sum of the SOA factors (i.e. total SOA estimated by EESI-TOF-MS and AMS), where SOA is colour-coded according to the N:C ratios. The AMS and EESI-TOF-MS SOA estimates are highly correlated (R=0.90), suggesting that the variability in the composition is well captured by the model and in good agreement between the two instruments. This strong correlation occurs despite significant variation in SOA composition (e.g. enhanced organonitrates at night), suggesting that the differences in relative response factors among different species are not so large as to significantly bias the overall source apportionment results. However, some differences are apparent. The time of the day is the main driver of SOA composition and the N:C ratio follows a similar pattern. The N:C ratio colour-coding of SOA shows a generally higher slope for higher N:C ratios. This is likely due to a combination of two factors: (1) underestimation of SOA by the AMS due to organonitrate decomposition to the inorganic ions NO+ and , which are not included in the calculation of SOA mass, and (2) higher sensitivity of the EESI-TOF-MS to SOA with a higher nitrogen content.
The cooking factors (COA) and the cigarette smoke factors (CS-OA) retrieved from each instrument are in good agreement with each other as well, although with lower correlation compared to the secondary factors (R=0.64 and R=0.73, respectively). The AMS–EESI-TOF-MS correlation for CS-OA further suggests that even though nicotine does not ionize by adduct formation with Na+, this alternate pathway does not introduce significant nonlinearities in its detection, at least under the conditions encountered in Zurich during summer. Similar performance was obtained for nicotine detection during winter measurements in Zurich (Qi et al., 2019). Note that the slopes retrieved from the linear correlation in Fig. 10a are proportional to the EESI-TOF-MS mean sensitivity of the compounds comprising each factor. The slope is nearly a factor of 2 higher for SOA than for COA, which may be due to a combination of two factors. First, it is expected that the EESI-TOF-MS may be more sensitive to the highly oxygenated and highly water-soluble components in SOA than to the fatty acids in COA. Second, the AMS relative ionization efficiency for COA has recently been suggested to be approximately 2 times higher for COA than for bulk organics, due to the higher molecular weight and thermal decomposition characteristics of the molecules comprising COA (Reyes-Villegas et al., 2018). Nevertheless, these correlations indicate that the EESI-TOF-MS signal linearly relates to mass concentration even for complex ambient aerosol and also suggest that the overall EESI-TOF-MS sensitivity to OA is not subject to significant variation during the study even if the composition-dependent relative sensitivities are actually unknown. Therefore, we assume that factor-specific sensitivities are not needed for the interpretation of the EESI PMF solution where the factors describe the variability in composition.
Figure 10c and d show the atomic H:C and O:C ratios, respectively, for the total SOA as well as the COA and CS-OA factors determined from the EESI-TOF-MS and AMS data. In terms of O:C ratio, the SOA factors show fair consistency with values around 0.6 and 0.5 for the EESI-TOF-MS and AMS analysis, respectively. For the COA and CS-OA factors, the O:C ratio is much lower for the AMS (∼0.1) than for the EESI-TOF COA (∼0.4). This is again consistent with a reduced sensitivity of the EESI-TOF-MS to hydrocarbon-like molecules due to a lower extraction and/or ionization efficiency. On the other hand the H:C ratios are slightly higher for the EESI-TOF-MS measurements with values of ∼1.6, ∼1.7, and ∼1.8 for SOA, CS-OA, and COA, respectively, compared to ∼1.3, ∼1.4, and ∼1.6, respectively, for the AMS analysis. Similar results were also observed for winter aerosol in Zurich (Qi et al., 2019) and for ageing experiments of wood burning emissions in an environmental chamber (Bertrand et al., 2018). This could suggest a reduced sensitivity of the EESI-TOF-MS to low H:C compounds (e.g. aromatic oxidation products) relative to terpene SOA. Alternatively, given that the EESI-TOF-MS sensitivity to laboratory-generated SOA from single-component precursors roughly decreases with decreasing molecular weight (Lopez-Hilfiker et al., 2019), it may be that compounds with a lower H:C ratio occur predominantly in ions with lower carbon number.
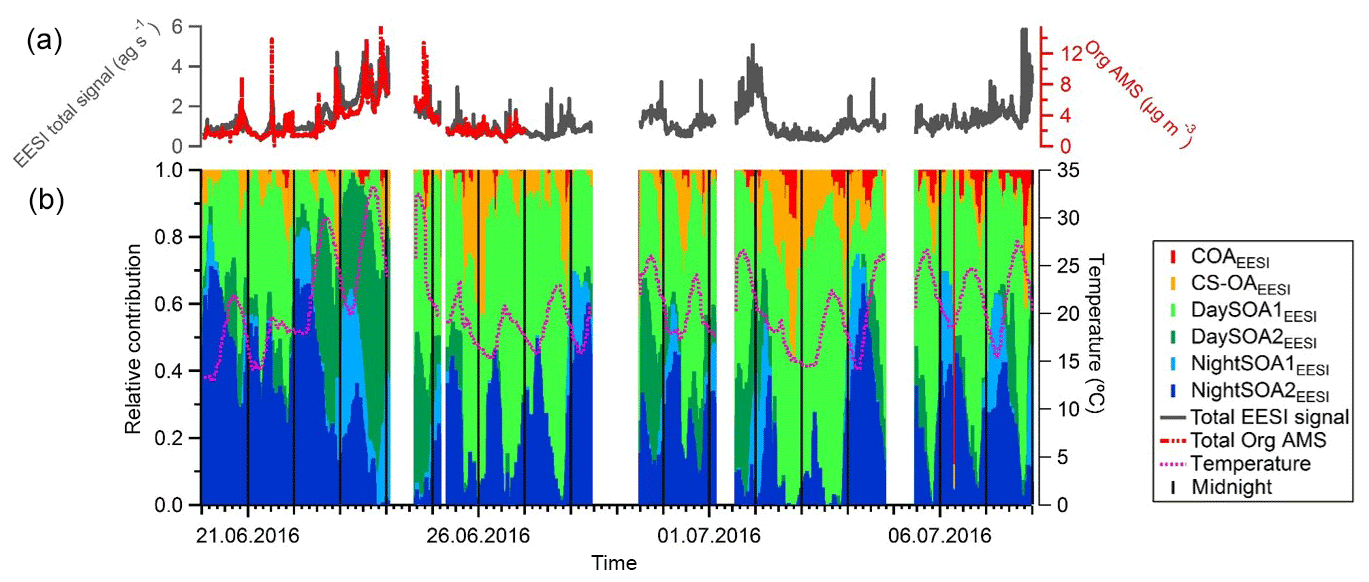
Figure 11(a) Total signal from the EESI-TOF-MS (ag s−1) and total organic mass concentration measured with the AMS (µg m−3). (b) Relative contributions of the EESI-TOF-MS factors to the total signal. Vertical black lines denote midnight.
Because the first step in EESI-TOF-MS detection is a rapid extraction into the methanol ∕ water droplets generated by the electrospray, one possibility for the observed discrepancies in the O:C ratios between the AMS and the EESI-TOF-MS could be incomplete extraction of less soluble components in the EESI-TOF-MS. To investigate this, we compare the O:C ratios from the AMS factors retrieved in the current study (COAAMS 0.1, HOAAMS 0.057, and OOAAMS 0.42–0.5) with those from offline AMS source apportionment of aqueous filter extracts, where water-insoluble components are not detected. The offline-AMS method yields O:C ratios consistent with the online AMS (COAoffline 0.10, HOAoffline 0.06, and OOAoffline 0.51) (Bozzetti et al., 2017). In contrast, the EESI-TOF-MS ratios are significantly higher (COAEESI 0.38 and SOAEESI 0.56–0.62) despite extraction into a water ∕ methanol mixture rather than water only. This suggests that the EESI extraction process (i.e. solubility) alone cannot explain the discrepancies between the two instruments. Note that this assumes no kinetic limitations on solubility and extraction, as the offline method applies a water extraction for 20 min, while the EESI-TOF-MS uses a very fast extraction in water ∕ methanol; however, this assumption is likely valid as laboratory tests suggest complete extraction of particles by the EESI-TOF-MS in the measured size range (Lopez-Hilfiker et al., 2019).
The bulk variabilities of the H:C and O:C ratios for the total EESI-TOF-MS signal vs. that of the AMS are presented in Fig. S7. The trends shown there are consistent with and explained by those of the individual factors as discussed above.
The contribution of each factor from the EESI-TOF-MS PMF analysis over the entire campaign is reported in Fig. 11 along with the total signal measured from the EESI-TOF-MS (ag s−1) and the total measured mass from the AMS (µg m−3) (panel a). We note that periods with higher signal correspond to periods with higher ambient temperature, above 25 ∘C (23–24 June and 1–2 and 6–7 July). These days are characterized by high contributions from the SOA factors, and when temperature exceeded 30 ∘C (23–24 June) the contribution of the DaySOA2EESI was higher compared to DaySOA1EESI. It has been shown previously that oxidized biogenic VOCs can considerably enhance particulate mass during heat waves (Guenther et al., 1993; Churkina et al., 2017), suggesting a probable relation of the SOA sources discriminated in these analyses with biogenic emissions and especially suggesting a relation between DaySOA2EESI and oxidation of freshly emitted terpenes from vegetation as previously presented in Fig. 6.
The night-time composition is significantly different, with NightSOA2EESI in particular often being at or above 50 % of the total SOA as measured by the EESI-TOF-MS while the AMS analysis does not allow identification of this factor. We note that according to Fig. 4 (bottom panel) the total AMS OOA is well-correlated with the sum of all four EESI-TOF-MS SOA factors, indicating that the high contribution of NightSOA2EESI reflects a large contribution to the total SOA mass rather than an anomalously high relative sensitivity in the EESI-TOF-MS. This demonstrates the extent to which important chemical variability is missed by the AMS PMF analysis. Figure 12 shows pie charts of the mean EESI-TOF-MS factor contributions over the entire measurement period (Fig. 12a), for only the measurement period overlapping with the AMS (Fig. 12b) and the mean AMS factor contributions (Fig. 12c). We note that the relative contributions of the factors retrieved from the EESI-TOF-MS analysis are consistent for the two measurement periods, with only small variability. This supports the applied approach of comparing the AMS and EESI-TOF-MS PMF solutions for the entire available periods, despite the limited temporal overlap. Overall the primary factors contribute up to ∼20 % for the EESI-TOF-MS analysis while they reach up to ∼30 % of the total measured mass for the AMS. The secondary factors on the other hand contribute up to ∼80 % of the total apportioned signal for the EESI-TOF-MS analysis and ∼70 % of the total apportioned mass for the AMS.
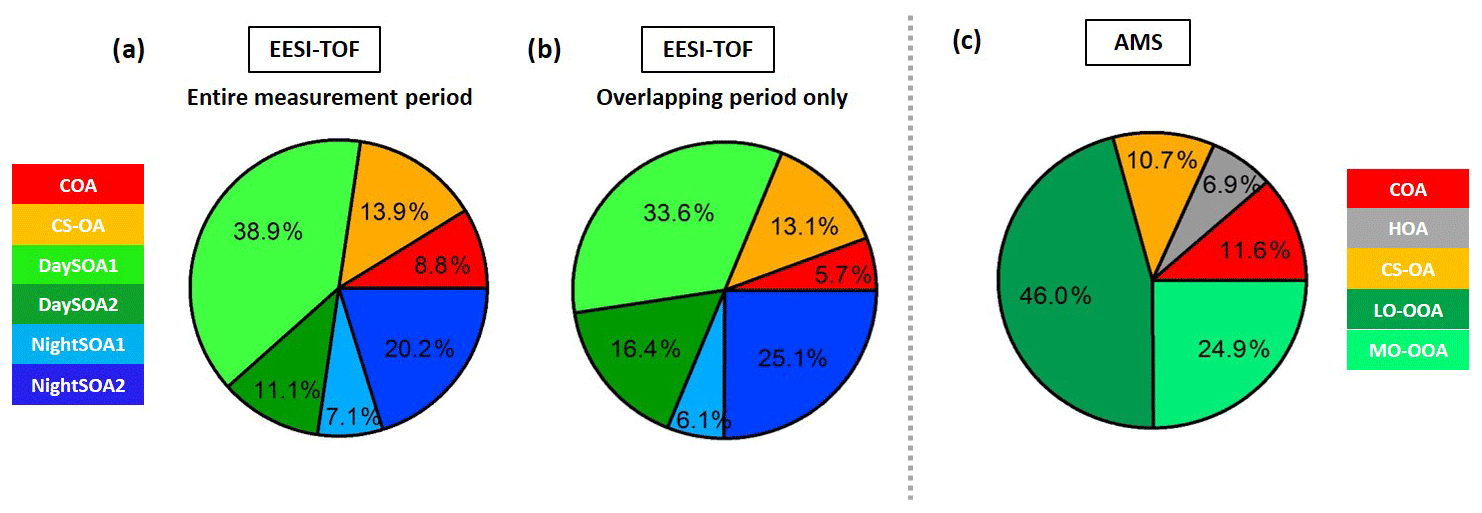
Figure 12(a) Pie charts of the EESI-TOF-MS factor mean contributions (%) to the total measured signal for (a) the entire measurement period and (b) the period overlapping with the AMS measurements; (c) the AMS factor mean contributions (%) to the total measured organic mass.
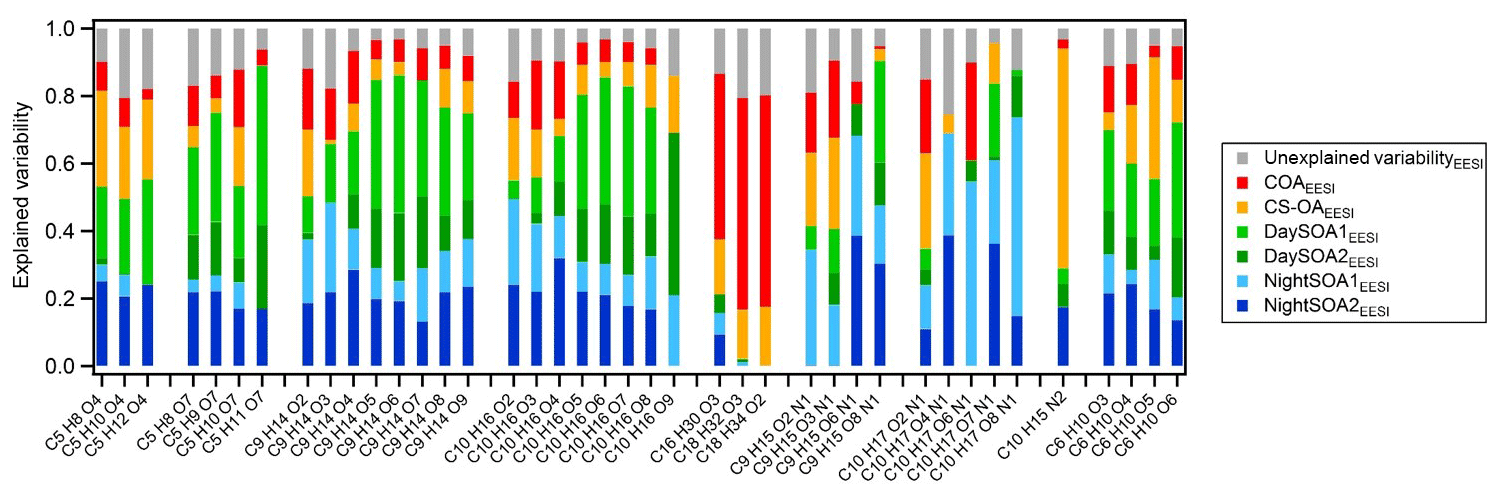
Figure 13Explained and unexplained variability for a subset of compounds from the EESI-TOF-MS PMF analysis weighted on the explained variability of each factor. The subset of molecules has been selected according to the interesting species among all the variables in the analysis. Species are ordered according to their chemical composition. On average the C5 species contribute 1.7 % to the total signal measured, the C9H14Ox∼4 %, C10H16Ox∼4.6 %, %, C10H17OxN∼1.7 %, C9H15OxN∼1.1 %, C10H15N2∼2.5 %, C6H10O5∼3.5 %, and the remaining C6H10Ox∼0.5 %.
Between the two instruments, the COA factors exhibit the strongest difference in contribution, with COAAMS accounting for 11.6 % of the total measured organic mass, while COAEESI for the overlapping period reaches only 5.7 %. This could be a consequence of the underestimation of the relative ionization efficiency (RIE) of COAAMS, discussed earlier, which would result in an overestimation of its measured mass (Reyes-Villegas et al., 2018). Accounting for this effect, e.g. considering a COA RIE of 2 instead of the default 1.4 value, the COAAMS contribution would decrease to 7.2 % and as a consequence the HOAAMS, CS-OAAMS, LO-OOAAMS, and MO-OOAAMS contributions would be 7.1 %, 11.2 %, 48.2 %, and 26 %, respectively, improving in this way the agreement with the COA factor extracted from the EESI-TOF-MS analysis. The RIE is although only one of the possible explanations; another possible reason is that the AMS collection efficiency is likely closer to 1 if cooking aerosols are externally mixed (Middlebrook et al., 2012).
Figure 13 shows the explained variation (EV) of each factor for selected ions in the EESI-TOF-MS dataset, as well as the variation that cannot be explained by the solution. This is a dimensionless quantity that indicates how much each computed factor explained a row (G) or a column (F) of the input data matrix, X. EV values can be interpreted as the scaled version of the elements of the input matrix, where the loading of each chemical species in each factor is normalized to 1 (Eq. 12, Canonaco et al., 2013).
The compounds explained most by a single factor are nicotine (C10H15N2), of which ∼80 % of EV is explained by the cigarette factor alone (CS-OAEESI), and the fatty acids (C16−18 in Fig. 13), of which up to 78 % of EV is explained by the cooking factor alone (COAEESI). The variability of the nitrogen-containing compounds is mostly explained by the secondary night-time factors, and with increasing oxygenation, the contributions from the primary factors are drastically reduced. Further, we include in the analysis two series of compounds likely deriving from biogenic emissions (C9H14Ox and C10H16Ox), where EV by the DaySOAEESI factors is higher for the more oxygenated species, while the EV of less oxygenated species is increased for the NightSOAEESI and primary factors. This is consistent with temperature-driven partitioning, causing the less oxygenated (and thus more volatile) compounds to be depleted in the particle phase during the day. We also included in the analysis two series of compounds that are commonly related to fossil sources (C5 species), and we note the same effect consistent with partitioning described above. Finally, the C6H10O5 contribution to the total profile signal is 54 % and 45 % for the primary and secondary factors, respectively, while its variability is almost equally explained by the primary and secondary factors with similar contributions of 46 % and 54 %, respectively. This suggests that most likely this chemical formula does not exclusively represent levoglucosan (or other sugars emitted from cellulose pyrolysis), which is enhanced in primary biomass combustion emissions and under summer conditions can be quickly oxidized (Bertrand et al., 2018b). Instead, significant contributions from non-sugar isomers generated by gas-phase oxidation (similar to the rest of the C6H10Ox series) are likely. For the last series of compounds the primary factors contribute ∼30 % and the secondary factors ∼70 % to the total signal while in terms of explained mass weighted variability the series is explained by up to 18 % and 81 % by primary and secondary factors, respectively. Overall, we were able, with the EESI-TOF-MS PMF analysis, to separate more SOA factors compared to the AMS analysis where all variability related to secondary components is included in MO-OOAAMS and LO-OOAAMS. Further, the DaySOA2EESI and NightOOA1EESI appear related to specific processes (local daytime terpene oxidation and local night-time terpene oxidation, respectively). On the other hand, the DaySOA1EESI and NightOOA2EESI factors could not be unambiguously related to a single source of gaseous precursors. These last factors are also more closely related to each other and likely a convolution of VOC emissions sources and the atmospheric reactions/timescales for conversion to PM.
This result is conceptually similar to PMF analysis of NO3 CIMS measurements of gas-phase highly oxygenated molecules (HOMs) by Yan et al. (2016) in the Finnish boreal forest during spring 2012. Several factors were separated and related to different oxidation mechanisms. Overall the most significant separation was observed between daytime and night-time; the daytime profiles appeared to be dominated by light HOMs and organonitrates derived from monoterpene chemistry initiated by OH reaction in the presence of NO while the night-time profiles appeared to be dominated by HOM dimers deriving from the oxidation of monoterpenes with O3 and NO3. Despite compositional differences between the gas and particle phases, several ions having common molecular formulae are identified in both studies and also have similar temporal behaviour. We use these correlations together with the better-understood gas-phase chemistry, giving rise to the chosen ions to infer the major processes affecting the particle phase. For example, C10H15O8N was found to be the major organonitrate representative of daytime HOMs (Yan et al., 2016) and in the current study shows the highest contributions from the DaySOA1EESI and NightSOA2EESI factors. Another example is C10H15O9N, which was considered a tracer molecule of daytime processes initiated by O3 reaction there, while in the current study its variability is mostly explained by the less source-specific DaySOA2EESI and NightSOA1EESI factors. On the other hand, fingerprint molecules related to night-time chemistry in Finland, e.g. C10H14O7 and C10H14O9, are mostly explained by NightSOA2EESI and even more so by DaySOA1EESI in the current study. This suggests that the variability is strongly driven by local source characteristics and environmental conditions, including daylight hours and oxidant concentrations, of oxidant and terpene sink variability. Similarly, Zhang et al. (2018) investigated the nature of monoterpene SOA (MTSOA) from FIGAERO-CIMS analysis in a forested area in the southeastern United States influenced by anthropogenic pollution. They found that different chemical processes involving nitrogen oxides (NOx), during day and night, play a central role in the monoterpene SOA produced, suggesting a strong anthropogenic–biogenic interaction affecting the ambient aerosol. The diurnal pattern of MTSOA was flat, but specifically they found that the majority of daytime MTSOA was due to fragmentation products of RO2 + NO while during night-time monoterpenes were most likely oxidized by NO3, which is primarily formed by NO2+O3. Overall a large fraction of the identified species in the MTSOA are also present in the current study and contribute with different abundance to all four SOA factors discriminated, suggesting once more the strong biogenic influence of secondary aerosol in summer at the measurement site.
We present the first field deployment of a novel extractive electrospray ionization time-of-flight mass spectrometer (EESI-TOF-MS), the first instrument capable of near-molecular measurements of organic aerosol (OA) at ambient concentrations using a controlled ionization scheme without thermal decomposition, ionization-induced fragmentation, or separated collection–analysis stages. The EESI-TOF-MS measured for 3 weeks during summer in Zurich, Switzerland, achieving >85 % data coverage without any systematic drift and signal stability within ±7.3 % (relative standard deviation). Overall, the campaign demonstrated the EESI-TOF-MS to be a sufficiently robust instrument for field operation.
Positive matrix factorization (PMF) analysis of EESI-TOF-MS mass spectra yielded two primary organic aerosol factors: cooking-related OA (COAEESI) characterized by long-chain fatty acids and levoglucosan (likely influenced by nearby open-cooking activities) and cigarette smoke OA (CS-OAEESI), with a strong nicotine signature, as well as four secondary factors. The SOA factors were subdivided into two factors enhanced during the day (DaySOA1EESI and DaySOA2EESI) and two during night and/or early morning (NightSOA1EESI and NightSOA2EESI). All four factors showed strong contribution from ions characteristic of monoterpene oxidation. Signatures consistent with sesquiterpene oxidation products were also observed in the daytime factors. DaySOA2 exhibited a strong exponential relationship with temperature, and the DaySOA1EESI factor mass spectrum was slightly shifted towards ions with fewer carbon atoms. These differences suggest that DaySOA2EESI is more influenced by local oxidation of biogenic emissions, whereas DaySOA1EESI represents more aged aerosol with possible anthropogenic influences from the oxidation of light aromatics. Two secondary night-time factors were also observed, with one peaking between midnight and 04:00 LT (NightSOA1EESI) and the other (NightSOA2EESI) gradually increasing after sunset to reach a maximum between 07:00 and 09:00 LT. NightSOA1EESI included less oxygenated terpene oxidation products, as well as organonitrates, likely derived from NO3 radical oxidation of monoterpenes. NightSOA2EESI contained the same signatures with somewhat reduced organonitrate content, as well as a stronger contributions from aromatic oxidation products consistent with the onset of photochemistry.
The EESI-TOF-MS analysis was supported and corroborated by the AMS PMF analysis. We observed a good correlation between the total EESI-TOF-MS and AMS organic signals. The apportionment to the sum of POA and SOA factors was very similar in terms of mass contribution, and the agreement between the total SOA signals measured by the two instruments was remarkable. However, the diurnal patterns of the SOA factors disclosed a different picture. While the total sum of the SOA factors exhibited a rather flat diurnal pattern for both instruments, the two AMS OOA factors similarly showed a flat pattern, while the EESI-TOF-MS factors illustrated significant chemical variation throughout the day. The variation in chemical composition described by the EESI-TOF-MS factors was consistent with various physicochemical processes influencing SOA formation, which was not described by the AMS PMF solution. Further, the O:C ratio between the two instruments was correlated but offset, and similar differences were found for the H:C ratio. These differences may be due to higher sensitivity of the EESI system for terpene-derived SOA than aromatic-derived SOA or higher sensitivity to higher molecular weight species (Lopez-Hilfiker et al., 2019). Overall this work highlights the importance of real-time, highly chemically resolved data, such as that provided by the EESI-TOF-MS, for identification of the key sources and physicochemical processes governing SOA composition, such as the biogenic emission influences and day–night chemistry identified here.
Data related to this article are available at https://doi.org/10.5281/zenodo.3260168 (Stefenelli et al., 2019).
The supplement related to this article is available online at: https://doi.org/10.5194/acp-19-14825-2019-supplement.
The main author is GS. The experimental work was performed by GS, VP, FRLH, and YD. The formal analyses were performed by GS and JS. The external data included were provided by CH while KRD contributed to the scientific input. The supervision was carried out by JGS, ASHP, and UB. The paper was commented on by all the co-authors.
The authors declare that they have no conflict of interest.
This study was funded by the Swiss National Science Foundation (SNSF starting grant BSSGI0_155846). Logistical support by Rene Richter (PSI) is gratefully acknowledged.
This research has been supported by the Swiss National Science Foundation (grant no. BSSGI0_155846).
This paper was edited by Nga Lee Ng and reviewed by two anonymous referees.
Allan, J. D., Jimenez, J. L., Williams, P. I., Alfarra, M. R., Bower, K. N., Jayne, J. T., Coe, H., and Worsnop, D. R.: Quantitative sampling using an Aerodyne aerosol mass spectrometer 1. Techniques of data interpretation and error analysis: quantitative aerosol mass spectrometer analysis, J. Geophys. Res.-Atmos., 108, 4090, https://doi.org/10.1029/2002JD002358, 2003.
Allan, J. D., Alfarra, M. R., Bower, K. N., Coe, H., Jayne, J. T., Worsnop, D. R., Aalto, P. P., Kulmala, M., Hyotylainen, T., Cavalli, F., and Laaksonen, A.: Size and composition measurements of background aerosol and new particle growth in a Finnish forest during QUEST 2 using an Aerodyne Aerosol Mass Spectrometer, Atmos. Chem. Phys., 6, 315–327, https://doi.org/10.5194/acp-6-315-2006, 2006.
Bateman, A. P., Nizkorodov, S. A., Laskin, J., and Laskin, A.: Time-resolved molecular characterization of limonene/ozone aerosol using high-resolution electrospray ionization mass spectrometry, Phys. Chem. Chem. Phys., 11, 7931–7942, https://doi.org/10.1039/b905288g, 2009.
Bertrand, A., Stefenelli, G., Jen, C. N., Pieber, S. M., Bruns, E. A., Ni, H., Temime-Roussel, B., Slowik, J. G., Goldstein, A. H., El Haddad, I., Baltensperger, U., Prévôt, A. S. H., Wortham, H., and Marchand, N.: Evolution of the chemical fingerprint of biomass burning organic aerosol during aging, Atmos. Chem. Phys., 18, 7607–7624, https://doi.org/10.5194/acp-18-7607-2018, 2018.
Bozzetti, C., El Haddad, I., Salameh, D., Daellenbach, K. R., Fermo, P., Gonzalez, R., Minguillón, M. C., Iinuma, Y., Poulain, L., Elser, M., Müller, E., Slowik, J. G., Jaffrezo, J.-L., Baltensperger, U., Marchand, N., and Prévôt, A. S. H.: Organic aerosol source apportionment by offline-AMS over a full year in Marseille, Atmos. Chem. Phys., 17, 8247–8268, https://doi.org/10.5194/acp-17-8247-2017, 2017.
Brüggemann, M., Karu, E., Stelzer, T., and Hoffmann, T.: Real-time analysis of ambient organic aerosols using aerosol flowing atmospheric-pressure afterglow mass spectrometry (AeroFAPA-MS), Environ. Sci. Technol., 49, 5571–5578, https://doi.org/10.1021/es506186c, 2015.
Canagaratna, M. r., Jayne, J. T., Jimenez, J. l., Allan, J. D., Alfarra, M. R., Zhang, Q., Onasch, T. B., Drewnick, F., Coe, H., Middlebrook, A., Delia, A., Williams, L. R., Trimborn, A. M., Northway, M. J., DeCarlo, P. F., Kolb, C. E., Davidovits, P., and Worsnop, D. R.: Chemical and microphysical characterization of ambient aerosols with the aerodyne aerosol mass spectrometer, Mass Spectrom. Rev., 26, 185–222, https://doi.org/10.1002/mas.20115, 2007.
Canonaco, F., Crippa, M., Slowik, J. G., Baltensperger, U., and Prévôt, A. S. H.: SoFi, an IGOR-based interface for the efficient use of the generalized multilinear engine (ME-2) for the source apportionment: ME-2 application to aerosol mass spectrometer data, Atmos. Meas. Tech., 6, 3649–3661, https://doi.org/10.5194/amt-6-3649-2013, 2013.
Canonaco, F., Slowik, J. G., Baltensperger, U., and Prévôt, A. S. H.: Seasonal differences in oxygenated organic aerosol composition: implications for emissions sources and factor analysis, Atmos. Chem. Phys., 15, 6993–7002, https://doi.org/10.5194/acp-15-6993-2015, 2015.
Carlton, A. G., Wiedinmyer, C., and Kroll, J. H.: A review of Secondary Organic Aerosol (SOA) formation from isoprene, Atmos. Chem. Phys., 9, 4987–5005, https://doi.org/10.5194/acp-9-4987-2009, 2009.
Churkina, G., Kuik, F., Bonn, B., Lauer, A., Grote, R., Tomiak, K., and Butler, T. M.: Effect of VOC emissions from vegetation on air quality in Berlin during a heatwave, Environ. Sci. Technol., 51, 6120–6130, https://doi.org/10.1021/acs.est.6b06514, 2017.
Crippa, M., Canonaco, F., Lanz, V. A., Äijälä, M., Allan, J. D., Carbone, S., Capes, G., Ceburnis, D., Dall&apos;Osto, M., Day, D. A., DeCarlo, P. F., Ehn, M., Eriksson, A., Freney, E., Hildebrandt Ruiz, L., Hillamo, R., Jimenez, J. L., Junninen, H., Kiendler-Scharr, A., Kortelainen, A.-M., Kulmala, M., Laaksonen, A., Mensah, A. A., Mohr, C., Nemitz, E., O&apos;Dowd, C., Ovadnevaite, J., Pandis, S. N., Petäjä, T., Poulain, L., Saarikoski, S., Sellegri, K., Swietlicki, E., Tiitta, P., Worsnop, D. R., Baltensperger, U. ,and Prévôt, A. S. H.: Organic aerosol components derived from 25 AMS data sets across Europe using a consistent ME-2 based source apportionment approach, Atmos. Chem. Phys., 14, 6159–6176, https://doi.org/10.5194/acp-14-6159-2014, 2014.
Daellenbach, K. R., Bozzetti, C., Křepelová, A., Canonaco, F., Wolf, R., Zotter, P., Fermo, P., Crippa, M., Slowik, J. G., Sosedova, Y., Zhang, Y., Huang, R.-J., Poulain, L., Szidat, S., Baltensperger, U., El Haddad, I., and Prévôt, A. S. H.: Characterization and source apportionment of organic aerosol using offline aerosol mass spectrometry, Atmos. Meas. Tech., 9, 23–39, https://doi.org/10.5194/amt-9-23-2016, 2016.
Daellenbach, K. R., Kourtchev, I., Vogel, A. L., Bruns, E. A., Jiang, J., Petäjä, T., Jaffrezo, J.-L., Aksoyoglu, S., Kalberer, M., Baltensperger, U., El Haddad, I., and Prévôt, A. S. H.: Impact of anthropogenic and biogenic sources on the seasonal variation in the molecular composition of urban organic aerosols: a field and laboratory study using ultra-high-resolution mass spectrometry, Atmos. Chem. Phys., 19, 5973–5991, https://doi.org/10.5194/acp-19-5973-2019, 2019.
Davison, A. C. and Hinkley, D. V.: Bootstrap methods and their application, Cambridge University Press, Cambridge, 1997.
DeCarlo, P. F., Kimmel, J. R., Trimborn, A., Northway, M. J., Jayne, J. T., Aiken, A. C., Gonin, M., Fuhrer, K., Horvath, T., Docherty, K. S., Worsnop, D. R., and Jimenez, J. L.: Field-Deployable, High-Resolution, Time-of-Flight Aerosol Mass Spectrometer, Anal. Chem., 78, 8281–8289, https://doi.org/10.1021/ac061249n, 2006.
De Gouw, J. and Jimenez, J. L.: Organic Aerosols in the Earth's Atmosphere, Environ. Sci. Technol., 43, 7614–7618, https://doi.org/10.1021/es9006004, 2009.
Emanuelsson, E. U., Hallquist, M., Kristensen, K., Glasius, M., Bohn, B., Fuchs, H., Kammer, B., Kiendler-Scharr, A., Nehr, S., Rubach, F., Tillmann, R., Wahner, A., Wu, H.-C., and Mentel, T. F.: Formation of anthropogenic secondary organic aerosol (SOA) and its influence on biogenic SOA properties, Atmos. Chem. Phys., 13, 2837–2855, https://doi.org/10.5194/acp-13-2837-2013, 2013.
Faber, P., Drewnick, F., Veres, P. R., Williams, J., and Borrmann, S.: Anthropogenic sources of aerosol particles in a football stadium: Real-time characterization of emissions from cigarette smoking, cooking, hand flares, and color smoke bombs by high-resolution aerosol mass spectrometry, Atmos. Environ., 77, 1043–1051, https://doi.org/10.1016/j.atmosenv.2013.05.072, 2013.
Farmer, D. K., Matsunaga, A., Docherty, K. S., Surratt, J. D., Seinfeld, J. H., Ziemann, P. J., and Jimenez, J. L.: Response of an aerosol mass spectrometer to organonitrates and organosulfates and implications for atmospheric chemistry, P. Natl. Acad. Sci. USA, 107, 6670–6675, https://doi.org/10.1073/pnas.0912340107, 2010.
Faxon, C., Hammes, J., Le Breton, M., Pathak, R. K., and Hallquist, M.: Characterization of organic nitrate constituents of secondary organic aerosol (SOA) from nitrate-radical-initiated oxidation of limonene using high-resolution chemical ionization mass spectrometry, Atmos. Chem. Phys., 18, 5467–5481, https://doi.org/10.5194/acp-18-5467-2018, 2018.
Fröhlich, R., Cubison, M. J., Slowik, J. G., Bukowiecki, N., Canonaco, F., Croteau, P. L., Gysel, M., Henne, S., Herrmann, E., Jayne, J. T., Steinbacher, M., Worsnop, D. R., Baltensperger, U., and Prévôt, A. S. H.: Fourteen months of on-line measurements of the non-refractory submicron aerosol at the Jungfraujoch (3580 m a.s.l.) – chemical composition, origins and organic aerosol sources, Atmos. Chem. Phys., 15, 11373–11398, https://doi.org/10.5194/acp-15-11373-2015, 2015.
Gelencsér, A., May, B., Simpson, D., Sánchez-Ochoa, A., Kasper-Giebl, A., Puxbaum, H., Caseiro, A., Pio, C., and Legrand, M.: Source apportionment of PM2.5 organic aerosol over Europe: Primary/secondary, natural/anthropogenic, and fossil/biogenic origin, J. Geophys. Res., 112, D23S04, https://doi.org/10.1029/2006JD008094, 2007.
Genberg, J., Hyder, M., Stenström, K., Bergström, R., Simpson, D., Fors, E. O., Jönsson, J. Å., and Swietlicki, E.: Source apportionment of carbonaceous aerosol in southern Sweden, Atmos. Chem. Phys., 11, 11387–11400, https://doi.org/10.5194/acp-11-11387-2011, 2011.
Giannoni, M., Martellini, T., Del Bubba, M., Gambaro, A., Zangrando, R., Chiari, M., Lepri, L., and Cincinelli, A.: The use of levoglucosan for tracing biomass burning in PM2.5 samples in Tuscany (Italy), Environ. Pollut., 167, 7–15, https://doi.org/10.1016/j.envpol.2012.03.016, 2012.
Glasius, M., la Cour, A., and Lohse, C.: Fossil and nonfossil carbon in fine particulate matter: a study of five European cities, J. Geophys. Res., 116, D11302, https://doi.org/10.1029/2011JD015646, 2011.
Guenther, A. B., Zimmerman, P. R., Harley, P. C., Monson, R. K., and Fall, R.: Isoprene and monoterpene emission rate variability: Model evaluations and sensitivity analyses, J. Geophys. Res., 98, 12609, https://doi.org/10.1029/93JD00527, 1993.
Hallquist, M., Wenger, J. C., Baltensperger, U., Rudich, Y., Simpson, D., Claeys, M., Dommen, J., Donahue, N. M., George, C., Goldstein, A. H., Hamilton, J. F., Herrmann, H., Hoffmann, T., Iinuma, Y., Jang, M., Jenkin, M. E., Jimenez, J. L., Kiendler-Scharr, A., Maenhaut, W., McFiggans, G., Mentel, T. F., Monod, A., Prévôt, A. S. H., Seinfeld, J. H., Surratt, J. D., Szmigielski, R., and Wildt, J.: The formation, properties and impact of secondary organic aerosol: current and emerging issues, Atmos. Chem. Phys., 9, 5155–5236, https://doi.org/10.5194/acp-9-5155-2009, 2009.
Hao, L. Q., Yli-Pirila, P., Tiitta, P., Romakkaniemi, S., Vaattovaara, P., Kajos, M. K., Rinne, J., Heijari, J., Kortelainen, A., Miettinen, P., Kroll, J. H., Holopainen, J. K., Smith, J. N., Joutsensaari, J., Kulmala, M., Worsnop, D. R., and Laaksonen, A.: New particle formation from the oxidation of direct emissions of pine seedlings, Atmos. Chem. Phys., 9, 8121–8137, https://doi.org/10.5194/acp-9-8121-2009, 2009.
Hao, L. Q., Kortelainen, A., Romakkaniemi, S., Portin, H., Jaatinen, A., Leskinen, A., Komppula, M., Miettinen, P., Sueper, D., Pajunoja, A., Smith, J. N., Lehtinen, K. E. J., Worsnop, D. R., Laaksonen, A., and Virtanen, A.: Atmospheric submicron aerosol composition and particulate organic nitrate formation in a boreal forestland–urban mixed region, Atmos. Chem. Phys., 14, 13483–13495, https://doi.org/10.5194/acp-14-13483-2014, 2014.
Hayes, P. L., Ortega, A. M., Cubison, M. J., Froyd, K. D., Zhao, Y., Cliff, S. S., Hu, W. W., Toohey, D. W., Flynn, J. H., Lefer, B. L., Grossberg, N., Alvarez, S., Rappenglück, B., Taylor, J. W., Allan, J. D., Holloway, J. S., Gilman, J. B., Kuster, W. C., de Gouw, J. A., Massoli, P., Zhang, X., Liu, J., Weber, R. J., Corrigan, A. L., Russell, L. M., Isaacman, G., Worton, D. R., Kreisberg, N. M., Goldstein, A. H., Thalman, R., Waxman, E. M., Volkamer, R., Lin, Y. H., Surratt, J. D., Kleindienst, T. E., Offenberg, J. H., Dusanter, S., Griffith, S., Stevens, P. S., Brioude, J., Angevine, W. M., and Jimenez, J. L.: Organic aerosol composition and sources in Pasadena, California during the 2010CalNex campaign, J. Geophys. Res.-Atmos., 118, 9233–9257, https://doi.org/10.1002/jgrd.50530, 2013.
Heald, C. L., Henze, D. K., Horowitz, L. W., Feddema, J., Lamarque, J.-F., Guenther, A., Hess, P. G., Vitt, F., Seinfeld, J. H., Goldstein, A. H., and Fung, I.: Predicted change in global secondary organic aerosol concentrations in response to future climate, emissions, and land use change: future predicted change in global SOA., J. Geophys. Res.-Atmos., 113, D05211, https://doi.org/10.1029/2007JD009092, 2008.
Hennigan, C. J., Sullivan, A. P., Collett, J. L., and Robinson, A. L.: Levoglucosan stability in biomass burning particles exposed to hydroxyl radicals: levoglucosan stability in aerosol, Geophys. Res. Lett., 37, L09806, https://doi.org/10.1029/2010GL043088, 2010.
Herich, H., Hueglin, C., and Buchmann, B.: A 2.5 year's source apportionment study of black carbon from wood burning and fossil fuel combustion at urban and rural sites in Switzerland, Atmos. Meas. Tech., 4, 1409–1420, https://doi.org/10.5194/amt-4-1409-2011, 2011.
Hoyle, C. R., Boy, M., Donahue, N. M., Fry, J. L., Glasius, M., Guenther, A., Hallar, A. G., Huff Hartz, K., Petters, M. D., Petäjä, T., Rosenoern, T., and Sullivan, A. P.: A review of the anthropogenic influence on biogenic secondary organic aerosol, Atmos. Chem. Phys., 11, 321–343, https://doi.org/10.5194/acp-11-321-2011, 2011.
Hueglin, C., Gehrig, R., Baltensperger, U., Gysel, M., Monn, C., and Vonmont, H.: Chemical characterisation of PM2.5, PM10 and coarse particles at urban, near-city and rural sites in Switzerland, Atmos. Environ., 39, 637–651, https://doi.org/10.1016/j.atmosenv.2004.10.027, 2005.
Jimenez, J. L., Canagaratna, M. R., Donahue, N. M., Prevot, A. S. H., Zhang, Q., Kroll, J. H., DeCarlo, P. F., Allan, J. D., Coe, H., Ng, N. L., Aiken, A. C., Docherty, K. S., Ulbrich, I. M., Grieshop, A. P., Robinson, A. L., Duplissy, J., Smith, J. D., Wilson, K. R., Lanz, V. A., Hueglin, C., Sun, Y. L., Tian, J., Laaksonen, A., Raatikainen, T., Rautiainen, J., Vaattovaara, P., Ehn, M., Kulmala, M., Tomlinson, J. M., Collins, D. R., Cubison, M. J., E., Dunlea, J., Huffman, J. A., Onasch, T. B., Alfarra, M. R., Williams, P. I., Bower, K., Kondo, Y., Schneider, J., Drewnick, F., Borrmann, S., Weimer, S., Demerjian, K., Salcedo, D., Cottrell, L., Griffin, R., Takami, A., Miyoshi, T., Hatakeyama, S., Shimono, A., Sun, J. Y., Zhang, Y. M., Dzepina, K., Kimmel, J. R., Sueper, D., Jayne, J. T., Herndon, S. C., Trimborn, A. M., Williams, L. R., Wood, E. C., Middlebrook, A. M., Kolb, C. E., Baltensperger, U., and Worsnop, D. R.: Evolution of Organic Aerosols in the Atmosphere, Science, 326, 1525–1529, https://doi.org/10.1126/science.1180353, 2009.
Junninen, H., Ehn, M., Petäjä, T., Luosujärvi, L., Kotiaho, T., Kostiainen, R., Rohner, U., Gonin, M., Fuhrer, K., Kulmala, M., and Worsnop, D. R.: A high-resolution mass spectrometer to measure atmospheric ion composition, Atmos. Meas. Tech., 3, 1039–1053, https://doi.org/10.5194/amt-3-1039-2010, 2010.
Kahnt, A., Iinuma, Y., Mutzel, A., Böge, O., Claeys, M., and Herrmann, H.: Campholenic aldehyde ozonolysis: a mechanism leading to specific biogenic secondary organic aerosol constituents, Atmos. Chem. Phys., 14, 719–736, https://doi.org/10.5194/acp-14-719-2014, 2014.
Kanakidou, M., Seinfeld, J. H., Pandis, S. N., Barnes, I., Dentener, F. J., Facchini, M. C., Dingenen, R. V., Ervens, B., Nenes, A., and Nielsen, C. J.: Organic aerosol and global climate modelling: a review, Atmos. Chem. Phys., 5, 1053–1123, https://doi.org/10.5194/acp-5-1053-2005, 2005.
Kautzman, K. E., Surratt, J. D., Chan, M. N., Chan, A. W. H., Hersey, S. P., Chhabra, P. S., Dalleska, N. F., Wennberg, P. O., Flagan, R. C., and Seinfeld, J. H.: Chemical Composition of Gas- and Aerosol-Phase Products from the Photooxidation of Naphthalene, J. Phys. Chem. A, 114, 913–934, https://doi.org/10.1021/jp908530s, 2010.
Kiendler-Scharr, A., Wildt, J., Maso, M. D., Hohaus, T., Kleist, E., Mentel, T. F., Tillmann, R., Uerlings, R., Schurr, U., and Wahner, A.: New particle formation in forests inhibited by isoprene emissions, Nature, 461, 381–384, https://doi.org/10.1038/nature08292, 2009.
Kürten, A., Bergen, A., Heinritzi, M., Leiminger, M., Lorenz, V., Piel, F., Simon, M., Sitals, R., Wagner, A. C., and Curtius, J.: Observation of new particle formation and measurement of sulfuric acid, ammonia, amines and highly oxidized organic molecules at a rural site in central Germany, Atmos. Chem. Phys., 16, 12793–12813, https://doi.org/10.5194/acp-16-12793-2016, 2016.
Lanz, V. A., Alfarra, M. R., Baltensperger, U., Buchmann, B., Hueglin, C., and Prévôt, A. S. H.: Source apportionment of submicron organic aerosols at an urban site by factor analytical modelling of aerosol mass spectra, Atmos. Chem. Phys., 7, 1503–1522, https://doi.org/10.5194/acp-7-1503-2007, 2007a.
Lanz, V. A., Alfarra, M. R., Baltensperger, U., Buchmann, B., Hueglin, C., Szidat, S., Wehrli, M. N., Wacker, L., Weimer, S., and Caseiro, A.: Source attribution of submicron organic aerosols during wintertime inversions by advanced factor analysis of aerosol mass spectra, Environ. Sci. Technol., 42, 214–220, https://doi.org/10.1021/es0707207, 2007b.
Leaitch, W. R., Macdonald, A. M., Brickell, P. C., Liggio, J., Sjostedt, S. J., Vlasenko, A., Bottenheim, J. W., Huang, L., Li, S.-M., Liu, P. S. K., Toom-Sauntry, D., Hayden, K. A., Sharma, S., Shantz, N. C., Wiebe, H. A., Zhang, W., Abbatt, J. P. D., Slowik, J. G., Chang, R. Y.-W., Russell, L. M., Schwartz, R. E., Takahama, S., Jayne, J. T., and Ng, N. L.: Temperature response of the submicron organic aerosol from temperate forests, Atmos. Environ., 45, 6696–6704, https://doi.org/10.1016/j.atmosenv.2011.08.047, 2011.
Liu, T., Li, Z., Chan, M., and Chan, C. K.: Formation of secondary organic aerosols from gas-phase emissions of heated cooking oils, Atmos. Chem. Phys., 17, 7333–7344, https://doi.org/10.5194/acp-17-7333-2017, 2017.
Lopez-Hilfiker, F. D., Mohr, C., Ehn, M., Rubach, F., Kleist, E., Wildt, J., Mentel, T. F., Lutz, A., Hallquist, M., Worsnop, D., and Thornton, J. A.: A novel method for online analysis of gas and particle composition: description and evaluation of a Filter Inlet for Gases and AEROsols (FIGAERO), Atmos. Meas. Tech., 7, 983–1001, https://doi.org/10.5194/amt-7-983-2014, 2014.
Lopez-Hilfiker, F. D., Pospisilova, V., Huang, W., Kalberer, M., Mohr, C., Stefenelli, G., Thornton, J. A., Baltensperger, U., Prevot, A. S. H., and Slowik, J. G.: An extractive electrospray ionization time-of-flight mass spectrometer (EESI-TOF) for online measurement of atmospheric aerosol particles, Atmos. Meas. Tech., 12, 4867–4886, https://doi.org/10.5194/amt-12-4867-2019, 2019.
McVay, R. C., Zhang, X., Aumont, B., Valorso, R., Camredon, M., La, Y. S., Wennberg, P. O., and Seinfeld, J. H.: SOA formation from the photooxidation of α-pinene: systematic exploration of the simulation of chamber data, Atmos. Chem. Phys., 16, 2785–2802, https://doi.org/10.5194/acp-16-2785-2016, 2016.
Middlebrook, A. M., Bahreini, R., Jimenez, J. L., and Canagaratna, M. R.: Evaluation of composition-dependent collection efficiencies for the aerodyne aerosol mass spectrometer using field data, Aerosol Sci. Tech., 46, 258–271, https://doi.org/10.1080/02786826.2011.620041, 2012.
Mohr, C., Huffman, J. A., Cubison, M. J., Aiken, A. C., Docherty, K. S., Kimmel, J. R., Ulbrich, I. M., Hannigan, M., and Jimenez, J. L.: Characterization of primary organic aerosol emissions from meat cooking, trash burning, and motor vehicles with high-resolution aerosol mass spectrometry and comparison with ambient and chamber observations, Environ. Sci. Technol., 43, 2443–2449, https://doi.org/10.1021/es8011518, 2009.
Moise, T., Flores, J. M., and Rudich, Y.: Optical properties of secondary organic aerosols and their changes by chemical processes, Chem. Rev., 115, 4400–4439, https://doi.org/10.1021/cr5005259, 2015.
Molteni, U., Simon, M., Heinritzi, M., Hoyle, C. R., Bernhammer, A.-K., Bianchi, F., Breitenlechner, M., Brilke, S., Dias, A., Duplissy, J., Frege, C., Gordon, H., Heyn, C., Jokinen, T., Kürten, A., Lehtipalo, K., Makhmutov, V., Petäjä, T., Pieber, S. M., Praplan, A., Schobesberger, S., Steiner, G., Stozhkov, Y., Tomé, A., Tröstl, J., Wagner, A. C., Wagner, R., Williamson, C., Yan, C., Baltensperger, U., Curtius, J., Donahue, N., Hansel, A., Kirkby, jasper, Kulmala, M., Worsnop, D. R., and Dommen, J.: Formation of highly-oxygenated organic molecules from α-pinene ozonolysis: chemical characteristics, mechanism and kinetic model development, ACS Earth Space Chem., 3, 873–883, https://doi.org/10.1021/acsearthspacechem.9b00035, 2019.
Müller, M., Eichler, P., D'Anna, B., Tan, W., and Wisthaler, A.: Direct sampling and analysis of atmospheric particulate organic matter by proton-transfer-reaction mass spectrometry, Anal. Chem., 89, 10889–10897, https://doi.org/10.1021/acs.analchem.7b02582, 2017.
Ng, N. L., Canagaratna, M. R., Zhang, Q., Jimenez, J. L., Tian, J., Ulbrich, I. M., Kroll, J. H., Docherty, K. S., Chhabra, P. S., Bahreini, R., Murphy, S. M., Seinfeld, J. H., Hildebrandt, L., Donahue, N. M., DeCarlo, P. F., Lanz, V. A., Prévôt, A. S. H., Dinar, E., Rudich, Y., and Worsnop, D. R.: Organic aerosol components observed in Northern Hemispheric datasets from Aerosol Mass Spectrometry, Atmos. Chem. Phys., 10, 4625–4641, https://doi.org/10.5194/acp-10-4625-2010, 2010.
Ng, N. L., Canagaratna, M. R., Jimenez, J. L., Chhabra, P. S., Seinfeld, J. H., and Worsnop, D. R.: Changes in organic aerosol composition with aging inferred from aerosol mass spectra, Atmos. Chem. Phys., 11, 6465–6474, https://doi.org/10.5194/acp-11-6465-2011, 2011.
Nozière, B., Kalberer, M., Claeys, M., Allan, J., D'Anna, B., Decesari, S., Finessi, E., Glasius, M., Grgić, I., Hamilton, J. F., Hoffmann, T., Iinuma, Y., Jaoui, M., Kahnt, A., Kampf, C. J., Kourtchev, I., Maenhaut, W., Marsden, N., Saarikoski, S., Schnelle-Kreis, J., Surratt, J. D., Szidat, S., Szmigielski, R., and Wisthaler, A.: The Molecular Identification of Organic Compounds in the Atmosphere: State of the Art and Challenges, Chem. Rev., 115, 3919–3983, https://doi.org/10.1021/cr5003485, 2015.
Paatero, P.: Least squares formulation of robust non-negative factor analysis, Chemom. Intell. Lab. Syst., 37, 23–35, https://doi.org/10.1016/S0169-7439(96)00044-5, 1997.
Paatero, P.: The Multilinear Engine – A Table-Driven, Least Squares Program for Solving Multilinear Problems, Including the n -Way Parallel Factor Analysis Model, J. Comput. Graph. Stat., 8, 854–888, https://doi.org/10.1080/10618600.1999.10474853, 1999.
Paatero, P. and Hopke, P. K.: Discarding or downweighting high-noise variables in factor analytic models, Anal. Chim. Ac., 490, 277–289, https://doi.org/10.1016/S0003-2670(02)01643-4, 2003.
Paatero, P. and Tapper, U.: Positive matrix factorization: A non-negative factor model with optimal utilization of error estimates of data values, Environmetrics, 5, 111–126, https://doi.org/10.1002/env.3170050203, 1994.
Paatero, P., Eberly, S., Brown, S. G., and Norris, G. A.: Methods for estimating uncertainty in factor analytic solutions, Atmos. Meas. Tech., 7, 781–797, https://doi.org/10.5194/amt-7-781-2014, 2014.
Park, J.-H., Babar, Z. B., Baek, S. J., Kim, H. S., and Lim, H.-J.: Effects of NOx on the molecular composition of secondary organic aerosol formed by the ozonolysis and photooxidation of α-pinene, Atmos. Environ., 166, 263–275, https://doi.org/10.1016/j.atmosenv.2017.07.022, 2017.
Pospisilova, V., Lopez-Hilfiker, F. D., Bell, D., El Haddad, I., Mohr, C., Huang, W., Heikkinen, L., Xiao, M., Dommen, J., Prévôt, A. S. H., Baltensperger, U., and Slowik, J. G.: On the fate of oxygenated organic molecules in atmospheric aerosol particles, Sci. Adv., submitted, 2019.
Pye, H. O. T. and Seinfeld, J. H.: A global perspective on aerosol from low-volatility organic compounds, Atmos. Chem. Phys., 10, 4377–4401, https://doi.org/10.5194/acp-10-4377-2010, 2010.
Qi, L., Chen, M., Stefenelli, G., Pospisilova, V., Tong, Y., Bertrand, A., Hueglin, C., Ge, X., Baltensperger, U., Prévôt, A. S. H., and Slowik, J. G.: Organic aerosol source apportionment in Zurich using an extractive electrospray ionization time-of-flight mass spectrometer (EESI-TOF-MS) – Part 2: Biomass burning influences in winter, Atmos. Chem. Phys., 19, 8037–8062, https://doi.org/10.5194/acp-19-8037-2019, 2019.
Raatikainen, T., Vaattovaara, P., Tiitta, P., Miettinen, P., Rautiainen, J., Ehn, M., Kulmala, M., Laaksonen, A., and Worsnop, D. R.: Physicochemical properties and origin of organic groups detected in boreal forest using an aerosol mass spectrometer, Atmos. Chem. Phys., 10, 2063–2077, https://doi.org/10.5194/acp-10-2063-2010, 2010.
Reyes-Villegas, E., Bannan, T., Le Breton, M., Mehra, A., Priestley, M., Percival, C., Coe, H., and Allan, J. D.: Online chemical characterization of food-cooking organic aerosols: implications for source apportionment, Environ. Sci. Technol., 52, 5308–5318, https://doi.org/10.1021/acs.est.7b06278, 2018.
Setyan, A., Song, C., Merkel, M., Knighton, W. B., Onasch, T. B., Canagaratna, M. R., Worsnop, D. R., Wiedensohler, A., Shilling, J. E., and Zhang, Q.: Chemistry of new particle growth in mixed urban and biogenic emissions – insights from CARES, Atmos. Chem. Phys., 14, 6477–6494, https://doi.org/10.5194/acp-14-6477-2014, 2014.
Shrivastava, M., Cappa, C. D., Fan, J., Goldstein, A. H., Guenther, A. B., Jimenez, J. L., Kuang, C., Laskin, A., Martin, S. T., Ng, N. L., Petaja, T., Pierce, J. R., Rasch, P. J., Roldin, P., Seinfeld, J. H., Shilling, J., Smith, J. N., Thornton, J. A., Volkamers, R., Wang, J., Worsnop, D. R., Zaveri, R. A., Zelenyuk, A., and Zhang, Q.: Recent advances in understanding secondary organic aerosol: Implications for global climate forcing, Rev. Geophys., 55, 505–559, 2017.
Spracklen, D. V., Jimenez, J. L., Carslaw, K. S., Worsnop, D. R., Evans, M. J., Mann, G. W., Zhang, Q., Canagaratna, M. R., Allan, J., Coe, H., McFiggans, G., Rap, A., and Forster, P.: Aerosol mass spectrometer constraint on the global secondary organic aerosol budget, Atmos. Chem. Phys., 11, 12109–12136, https://doi.org/10.5194/acp-11-12109-2011, 2011.
Stefenelli, G., Pospisilova, V., Lopez-Hilfiker, F. D., Daellenbach, K. R., Hüglin, C., Tong, Y., Baltensperger, U., Prevot, A. S. H., and Slowik, J. G.: Organic aerosol source apportionment in Zurich using extractive electrospray ionization time-of-flight mass spectrometry (EESI-TOF): Part I, biogenic influences and day/night chemistry in summer, 1–36, https://doi.org/10.5281/zenodo.3260168, 2019.
Struckmeier, C., Drewnick, F., Fachinger, F., Gobbi, G. P., and Borrmann, S.: Atmospheric aerosols in Rome, Italy: sources, dynamics and spatial variations during two seasons, Atmos. Chem. Phys., 16., 15277–15299, https://doi.org/10.5194/acp-16-15277-2016, 2016.
Sun, Y. L., Zhang, Q., Anastasio, C., and Sun, J.: Insights into secondary organic aerosol formed via aqueous-phase reactions of phenolic compounds based on high resolution mass spectrometry, Atmos. Chem. Phys., 10, 4809–4822, https://doi.org/10.5194/acp-10-4809-2010, 2010.
Sun, Y.-L., Zhang, Q., Schwab, J. J., Demerjian, K. L., Chen, W.-N., Bae, M.-S., Hung, H.-M., Hogrefe, O., Frank, B., Rattigan, O. V., and Lin, Y.-C.: Characterization of the sources and processes of organic and inorganic aerosols in New York city with a high-resolution time-of-flight aerosol mass apectrometer, Atmos. Chem. Phys., 11, 1581–1602, https://doi.org/10.5194/acp-11-1581-2011, 2011.
Talhout, R., Opperhuizen, A., and van Amsterdam, J. G. C.: Sugars as tobacco ingredient: Effects on mainstream smoke composition, Food Chem. Toxicol., 44, 1789–1798, https://doi.org/10.1016/j.fct.2006.06.016, 2006.
Turpin, B. J., Saxena, P., and Andrews, E.: Measuring and simulating particulate organics in the atmosphere: problems and prospects, Atmos. Environ., 34, 2983–3013, https://doi.org/10.1016/S1352-2310(99)00501-4, 2000.
Ulbrich, I. M., Canagaratna, M. R., Zhang, Q., Worsnop, D. R., and Jimenez, J. L.: Interpretation of organic components from Positive Matrix Factorization of aerosol mass spectrometric data, Atmos. Chem. Phys., 9, 2891–2918, https://doi.org/10.5194/acp-9-2891-2009, 2009.
Vlachou, A., Daellenbach, K. R., Bozzetti, C., Chazeau, B., Salazar, G. A., Szidat, S., Jaffrezo, J.-L., Hueglin, C., Baltensperger, U., Haddad, I. E., and Prévôt, A. S. H.: Advanced source apportionment of carbonaceous aerosols by coupling offline AMS and radiocarbon size-segregated measurements over a nearly 2-year period, Atmos. Chem. Phys., 18, 6187–6206, https://doi.org/10.5194/acp-18-6187-2018, 2018.
Williams, B. J., Goldstein, A. H., Kreisberg, N. M., and Hering, S. V.: An In-Situ Instrument for Speciated Organic Composition of Atmospheric Aerosols: Thermal Desorption Aerosol G C/MS-FID (TAG), Aerosol Sci. Tech., 40, 627–638, https://doi.org/10.1080/02786820600754631, 2006.
Xu, L., Suresh, S., Guo, H., Weber, R. J., and Ng, N. L.: Aerosol characterization over the southeastern United States using high-resolution aerosol mass spectrometry: spatial and seasonal variation of aerosol composition and sources with a focus on organic nitrates, Atmos. Chem. Phys., 15, 7307–7336, https://doi.org/10.5194/acp-15-7307-2015, 2015.
Yan, C., Nie, W., Äijälä, M., Rissanen, M. P., Canagaratna, M. R., Massoli, P., Junninen, H., Jokinen, T., Sarnela, N., Häme, S. A. K., Schobesberger, S., Canonaco, F., Yao, L., Prévôt, A. S. H., Petäjä, T., Kulmala, M., Sipilä, M., Worsnop, D. R., and Ehn, M.: Source characterization of highly oxidized multifunctional compounds in a boreal forest environment using positive matrix factorization, Atmos. Chem. Phys., 16, 12715–12731, https://doi.org/10.5194/acp-16-12715-2016, 2016.
Yttri, K. E., Simpson, D., Nøjgaard, J. K., Kristensen, K., Genberg, J., Stenström, K., Swietlicki, E., Hillamo, R., Aurela, M., Bauer, H., Offenberg, J. H., Jaoui, M., Dye, C., Eckhardt, S., Burkhart, J. F., Stohl, A., and Glasius, M.: Source apportionment of the summer time carbonaceous aerosol at Nordic rural background sites, Atmos. Chem. Phys., 11, 13339–13357, https://doi.org/10.5194/acp-11-13339-2011, 2011.
Zhang, H., Yee, L. D., Lee, B. H., Curtis, M. P., Worton, D. R., Isaacman-VanWertz, G., Offenberg, J. H., Lewandowski, M., Kleindienst, T. E., Beaver, M. R., Holder, A. L., Lonneman, W. A., Docherty, K. S., Jaoui, M., Pye, H. O. T., Hu, W., Day, D. A., Campuzano-Jost, P., Jimenez, J. L., Guo, H., Weber, R. J., de Gouw, J., Koss, A. R., Edgerton, E. S., Brune, W., Mohr, C., Lopez-Hilfiker, F. D., Lutz, A., Kreisberg, N. M., Spielman, S. R., Hering, S. V., Wilson, K. R., Thornton, J. A., and Goldstein, A. H.: Monoterpenes are the largest source of summertime organic aerosol in the southeastern United States, P. Natl. Acad. Sci. USA, 115, 2038–2043, https://doi.org/10.1073/pnas.1717513115, 2018.
Zhang, Q., Worsnop, D. R., Canagaratna, M. R., and Jimenez, J. L.: Hydrocarbon-like and oxygenated organic aerosols in Pittsburgh: insights into sources and processes of organic aerosols, Atmos. Chem. Phys., 5, 3289–3311, https://doi.org/10.5194/acp-5-3289-2005, 2005.
Zhang, Q., Jimenez, J. L., Canagaratna, M. R., Allan, J. D., Coe, H., Ulbrich, I., Alfarra, M. R., Takami, A., Middlebrook, A. M., Sun, Y. L., Dzepina, K., Dunlea, E., Docherty, K., DeCarlo, P. F., Salcedo, D., Onasch, T., Jayne, J. T., Miyoshi, T., Shimono, A., Hatakeyama, S., Takegawa, N., Kondo, Y., Schneider, J., Drewnick, F., Borrmann, S., Weimer, S., Demerjian, K., Williams, P., Bower, K., Bahreini, R., Cottrell, L., Griffin, R. J., Rautiainen, J., Sun, J. Y., Zhang, Y. M., and Worsnop, D. R.: Ubiquity and dominance of oxygenated species in organic aerosols in anthropogenically-influenced Northern Hemisphere midlatitudes, Geophys. Res. Lett., 34, L13801, https://doi.org/10.1029/2007GL029979, 2007.
Zhang, Q., Jimenez, J. L., Canagaratna, M. R., Ulbrich, I. M., Ng, N. L., Worsnop, D. R., and Sun, Y.: Understanding atmospheric organic aerosols via factor analysis of aerosol mass spectrometry: a review, Anal. Bioanal. Chem., 401, 3045–3067, https://doi.org/10.1007/s00216-011-5355-y, 2011.