the Creative Commons Attribution 4.0 License.
the Creative Commons Attribution 4.0 License.
 | 05 Dec 2019
Regional sources of airborne ultrafine particle number and mass concentrations in California
Xin Yu
Melissa Venecek
Anikender Kumar
Jianlin Hu
Saffet Tanrikulu
Su-Tzai Soon
Cuong Tran
David Fairley
Michael J. Kleeman
Regional concentrations and source contributions are calculated for airborne particle number concentration (Nx) and ultrafine particle mass concentration (PM0.1) in the San Francisco Bay Area (SFBA) and the South Coast Air Basin (SoCAB) surrounding Los Angeles with 4 km spatial resolution and daily time resolution for selected months in the years 2012, 2015, and 2016. Performance statistics for daily predictions of N10 concentrations meet the goals typically used for modeling of PM2.5 (mean fractional bias (MFB) < ±0.5 and mean fractional error (MFE) < 0.75). The relative ranking and concentration range of source contributions to PM0.1 predicted by regional calculations agree with results from receptor-based studies that use molecular markers for source apportionment at four locations in California. Different sources dominated regional concentrations of N10 and PM0.1 because of the different emitted particle size distributions and different choices for heating fuels. Nucleation (24 %–57 %) made the largest single contribution to N10 concentrations at the 10 regional monitoring locations, followed by natural gas combustion (28 %–45 %), aircraft (2 %–10 %), mobile sources (1 %–5 %), food cooking (1 %–2 %), and wood smoke (0 %–1 %). In contrast, natural gas combustion (22 %–52 %) was the largest source of PM0.1 followed by mobile sources (15 %–42 %), food cooking (4 %–14 %), wood combustion (1 %–12 %), and aircraft (2 %–6 %). The study region encompassed in this project is home to more than 25 million residents, which should provide sufficient power for future epidemiological studies on the health effects of airborne ultrafine particles. All of the PM0.1 and N10 outdoor exposure fields produced in the current study are available free of charge at http://webwolf.engr.ucdavis.edu/data/soa_v3/hourly_avg/ (last access: 20 November 2019).
- Article
(26481 KB) - Full-text XML
-
Supplement
(426 KB) - BibTeX
- EndNote


Numerous epidemiological studies have identified positive correlations between exposure to ambient particulate matter (PM) and increased risk of respiratory and cardiovascular diseases, premature mortality, and hospitalization (Pope et al., 2002, 2004, 2009; Dockery and Stone, 2007; Ostro et al., 2006, 2010, 2015; Brunekreef and Forsberg, 2005; Fann et al., 2012; Gauderman et al., 2015; Miller et al., 2007). Most of these studies have not fully addressed ultrafine particles (UFPs; Dp < 0.1 µm) because these particles make a very small contribution to total ambient PM mass (Ogulei et al., 2007). Toxicity studies suggest that UFPs may be especially dangerous to human health since they have higher toxicity per unit mass (Li et al., 2003; Nel et al., 2006; Oberdorster et al., 2002) and can penetrate the lungs and enter the bloodstream and secondary organs (Sioutas et al., 2005). These toxicology results are suggestive but more epidemiological evidence is required before the threat to public health from UFPs can be fully assessed.
Most previous UFP epidemiology studies are based on particle number concentration (Nx – the number of particles with diameter less than x nm) measured at fixed sites using commercially available instruments. These devices are expensive and they require regular maintenance, which limits the number of measurement sites that can be deployed. Translating measured Nx into population exposure estimates is also difficult because UFP concentrations change more rapidly over shorter distances than PM2.5 (Hu et al., 2014a, b, 2015). Land use regression (LUR) models could potentially be used to interpolate UFP concentrations between sparse measurement locations, but the atmospheric processes governing Nx concentrations are highly non-linear and (so far) sufficient training data are not generally available for LUR models to estimate Nx exposure over a large enough population to support a definitive epidemiology study (Montagne et al., 2015). Previous attempts to use regional reactive chemical transport models to predict Nx in highly populated regions have focused on nucleation, yielding a wide range of predicted concentrations and only modest agreement with measurements when different nucleation algorithms were used (Elleman and Covert, 2009a, b; Zhang et al., 2010). Obtaining accurate exposure estimates to Nx in highly populated regions therefore remains a major challenge in UFP epidemiological studies.
Recent work has examined UFP mass (PM0.1) as an alternative metric for UFP exposure and demonstrated that PM0.1 can be predicted with reasonable accuracy over large populations using regional reactive chemical transport models (Hu et al., 2014a, b). The PM0.1 exposure fields developed using this technique have been used in multiple epidemiological studies that revealed associations with mortality and pre-term birth (Ostro et al., 2015; Laurent et al., 2016). Despite the success of studies using PM0.1, techniques that estimate Nx exposure are still needed because a large number of ongoing UFP studies are based on Nx and it is possible that PM0.1 and Nx are associated with different types of health effects.
Here, we extend the previous work using regional reactive chemical transport models for UFPs to include Nx in the San Francisco Bay Area (SFBA) and the South Coast Air Basin (SoCAB) region around Los Angeles which are the two most densely populated major metropolitan location in California. Source contributions to PM0.1 and Nx are tracked using the University of California, Davis/California Institute of Technology (UCD/CIT) regional reactive chemical transport model with 4 km spatial resolution. Predicted concentrations during the year 2012 are compared to measurements available at 10 regional monitoring sites. The spatial distribution fields of different particle metrics (Nx, PM0.1, PM2.5) are combined with population distributions to estimate exposure. To the best of our knowledge, this is the first integrated study of both UFP number and mass using a regional reactive chemical transport model in California.
The UCD/CIT chemical transport model used in the current study has been successfully applied in several previous studies in the San Joaquin Valley (SJV) and the SoCAB (Ying et al., 2008a, b; Hu et al., 2012, 2015, 2017; Chen et al., 2010; Held et al., 2004, 2005; Hixson et al., 2010, 2012; Kleeman and Cass, 2001; Kleeman et al., 1997, 2007; Mahmud et al., 2010; Mysliwiec and Kleeman, 2002; Rasmussen et al., 2013; Ying and Kleeman, 2006; Zhang and Ying, 2010). The model includes algorithms for emissions, transport, dry deposition, wet deposition, gas-phase chemistry, gas-to-particle conversion, coagulation, and some condensed-phase chemical reactions. Nucleation was added to the model for the first time in the current study using the ternary nucleation (TN) mechanism involving H2SO4−H2O–ammonia (NH3) (Napari et al., 2002). As was the case in previous studies using this algorithm, the resulting nucleation rate was adjusted using a tunable nucleation parameter set to 10−5 for new particle nucleation (Jung et al., 2010). The Kerminen and Kulmala (2002) parameterization was added in order to bridge the gap between the 1 nm particle nuclei and their appearance into the smallest size bin of the UCD/CIT model (∼10 nm). The nuclei growth rate (GR) in the Kerminen and Kulmala (2002) parameterization is one of the factors that accounts for the competition between the condensation and nucleation of oversaturated compounds until the nucleated particles grow to the size of the smallest bin in the regional model, at which point this competition is represented explicitly by the model operators. In the current study, the GR for nucleated sulfate particles was calculated using the diffusion-limited condensation rate of sulfuric acid based on the recommendation of Kerminen and Kulmala. Once particles reach ∼10 nm, the full operators in the model calculations predict growth by condensation of sulfuric acid, nitric acid, ammonia, and secondary organic aerosol (SOA). Perturbation studies were conducted in the current analysis to test the effect of GR with a box model configured to represent a single grid cell using the full set of model operators. Initial conditions in the SAPRC11 gas-phase mechanism were 0.04 ppm O3, 0.05 ppm NO, 0.0 ppm NO2, 0.05 ppm HCHO, 0.1 ppm isoprene, 0.1 ppm benzene, and 0.01 ppm ALK5. A nucleation event was initiated at 08:00 LT by setting H2SO4 concentrations to 107 molecules cm−3 and NH3 concentrations to 100 ppt. The nominal GR was multiplied by a factor ranging from 0.5 to 2.0 to test the sensitivity of the model results. Figure 1 illustrates the growth of nucleated particles between 05:00 and 12:00 LT for conditions representing July in California. The number concentration of nucleated particles increases from zero to values between 2500 and 3000 cm−3. SOA condenses on the particles, causing their size to increase above 100 nm. Coagulation and deposition processes remove particles over time. Three separate simulations are illustrated in Fig. 1 using the nominal GR along with perturbations of 0.5 × GR and 2.0 × GR. These model perturbations fall almost exactly on top of the base-case simulations, suggesting that results are not overly sensitive to GR during the first few seconds of nuclei growth before calculations are handed off to the regional model algorithms.
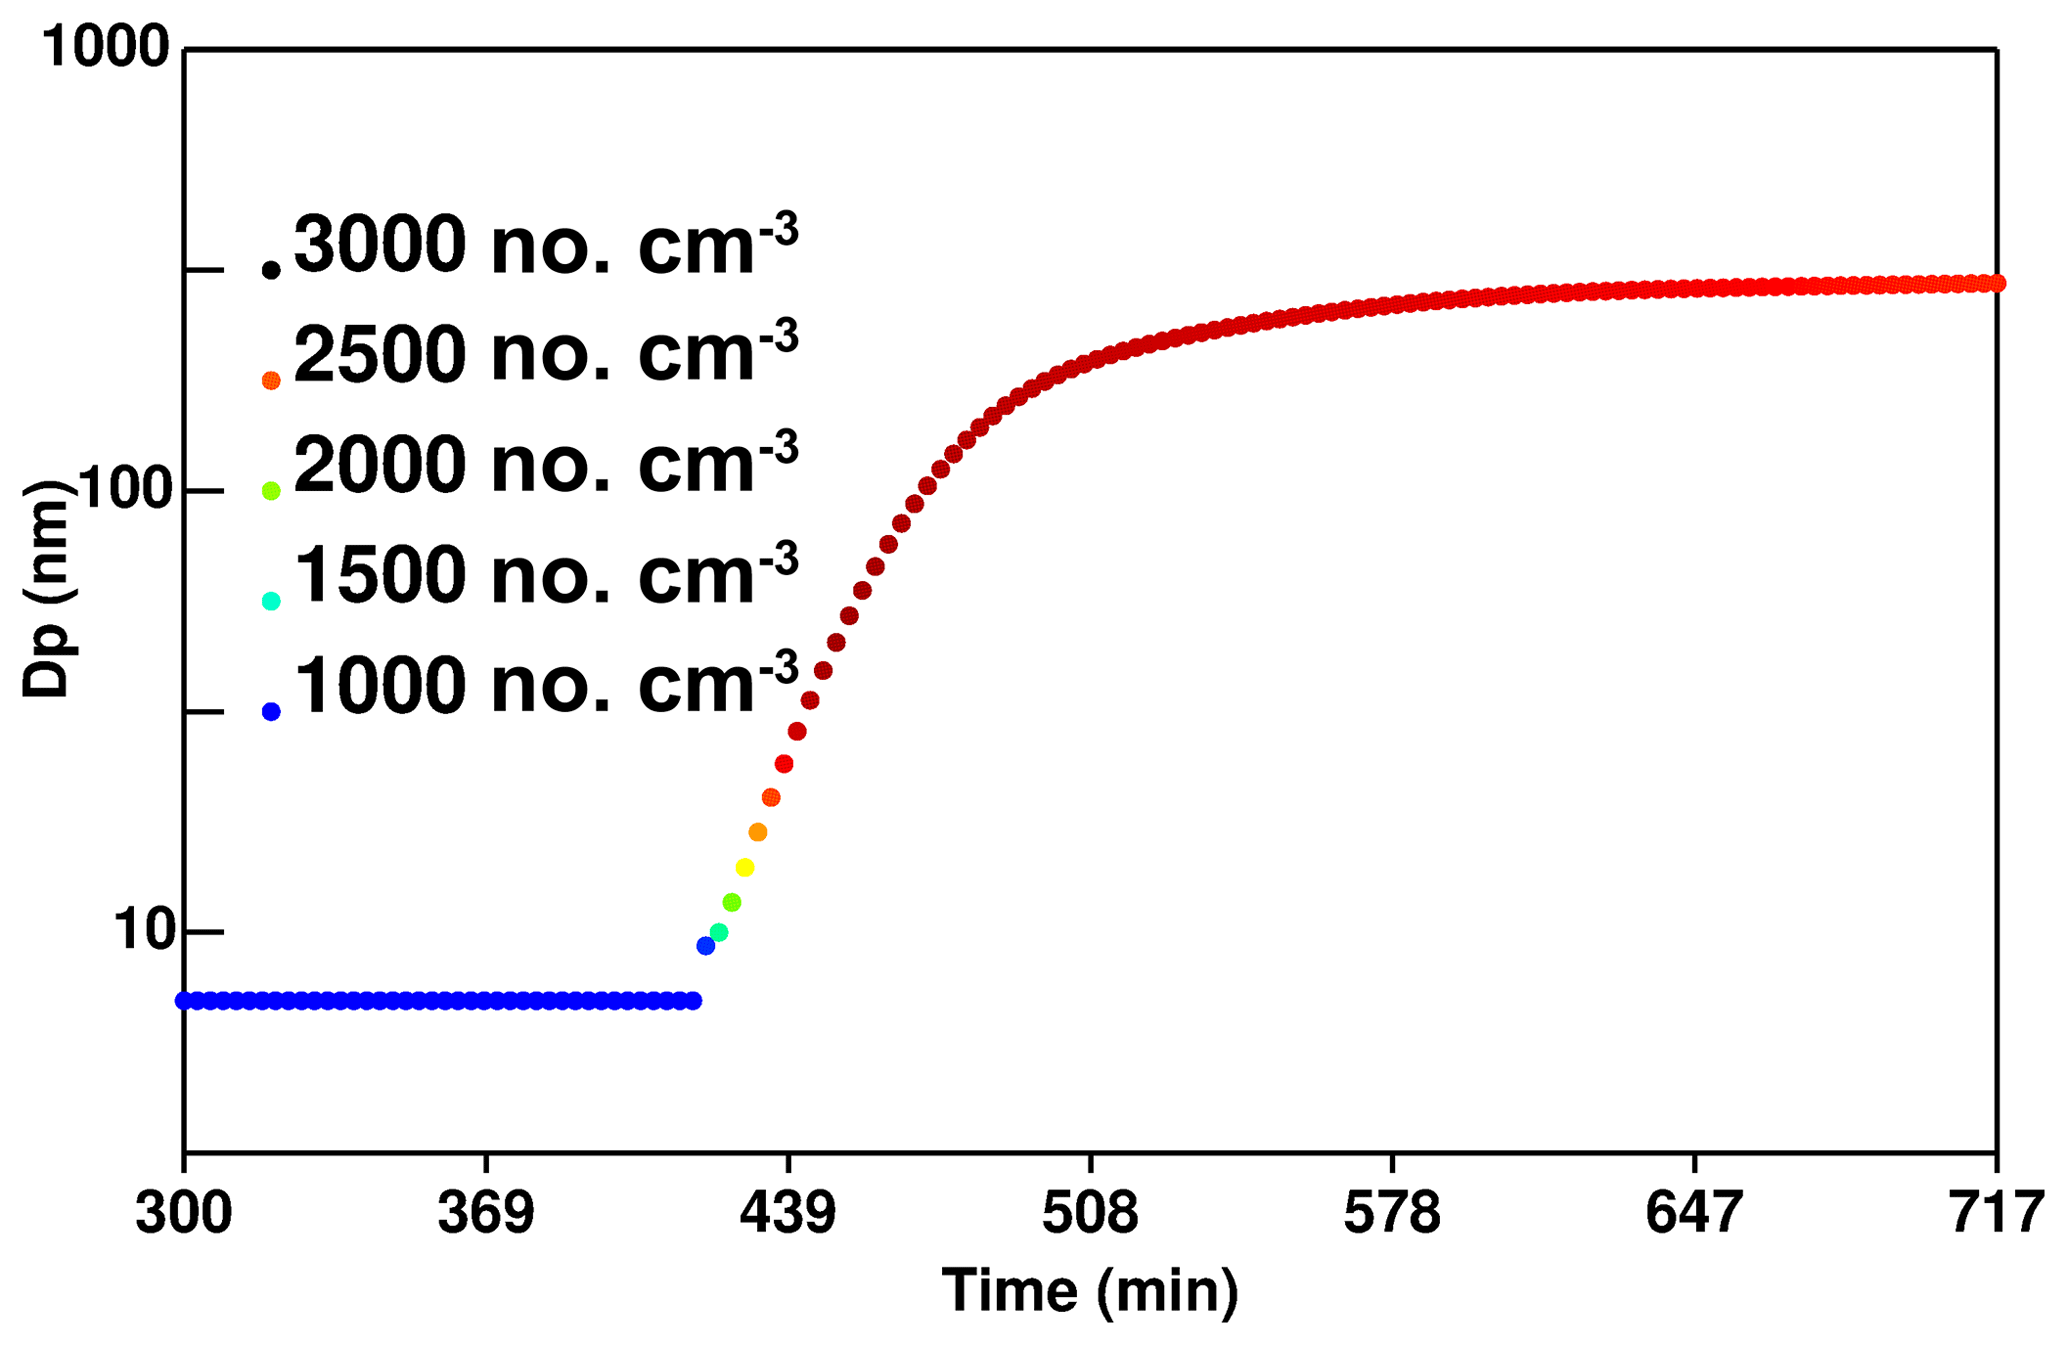
Figure 1Simulated particle nucleation event followed by growth due to SOA condensation under conditions representing July in California. The vertical axis displays the mean diameter of the nuclei mode, while color represents the particle number concentration.
Several previous modeling studies have been conducted to evaluate the performance of the ternary nucleation mechanism on predicted Nx using global and regional models. Jung et al. (2010) found that a scaled version of the ternary nucleation theory (Napari et al., 2002 with a supplemental 10−5 nucleation tuning factor) added to the PMCAMx-UF model (a three-dimensional chemical transport model with an updated nucleation formation mechanism) produced Nx predictions in reasonable agreement with observations. The study of Westervelt et al. (2013) also showed that the ternary nucleation parameterization (with a supplemental 10−5 nucleation tuning factor) added to the Goddard Earth Observing System global chemical transport model (GEOS-Chem) produced reasonable Nx predictions on average when compared with measurements at five locations spanning various environments. Jung et al. (2008) considered multiple nucleation parameterizations in the Dynamic Model for Aerosol Nucleation (DMAN) to predict the nucleation events and non-events observed during the Pittsburgh Air Quality Study (PAQS) conducted between July 2001 and September 2002. Their results showed that the ternary nucleation mechanism (Napari et al., 2002 with a supplemental 10−5 nucleation tuning factor) was a suitable nucleation scheme for 3-D chemical transport models. Although there have been numerous significant efforts to incorporate nucleation algorithms into three-dimensional regional and global models (Jung et al., 2008, 2010; Westervelt et al., 2013; Zhang et al., 2010; Yu et al., 2015; Dunne et al., 2016; Fanourgakis et al., 2019), nucleation modeling studies are still in the early stages of development and further efforts are needed to reduce the uncertainty in both the nucleation rate and growth mechanisms.
In the current study, emission, transport, deposition, and coagulation of UFPs were simulated using operators developed for the UCD/CIT model framework, leading to modification of the particle size distribution and the subsequent Nx concentrations. Dynamic condensation/evaporation is considered for all particle size bins with predicted UFP growth rates of 2–3 nm h−1 or higher under favorable conditions. The regional model operators are not well suited for the most extreme changes to the particle size distribution that occur within the first few seconds or minutes after emissions to the atmosphere (such as within 300 m of roadways). Dedicated simulations can predict the dynamic condensation/evaporation of particles at distances of tens of meters downwind of the roadway (Zhang et al., 2004, 2005) mostly due to the partitioning of SOA (Anttila and Kerminen, 2003; Trostl et al., 2016), but these calculations are too expensive for domains spanning thousands of kilometers. Regional calculations such as those illustrated in the current study rely on emissions characterization measurements that include a few minutes of aging to capture the “near-field” emissions of particle size and composition that can then be used as the starting point for regional model calculations. In some cases, evaporation of UFPs in the first few seconds after release to the atmosphere is therefore represented by reducing the primary emissions of nanoparticles based on measurements conducted at high dilution factors (Xue et al., 2018a) or using measurements of particle volatility to estimate the evaporation at high dilution factors (May et al., 2013a, b; Kuwayama et al., 2015). All of the results presented in the current analysis focus on regional UFP concentrations with 4 km resolution.
The model domains used in the study are shown in Fig. 2. The parent domain with 24 km horizontal resolution covered the entire state of California (referred to as CA_24 km) and the two nested domains with 4 km horizontal resolution covered the SFBA, SJV, and south Sacramento Valley air basins (referred to as SJV_4 km) and the SoCAB surrounding Los Angeles (referred to as SoCAB_4 km). The UCD/CIT model was configured with 16 vertical layers up to a height of 5 km above ground level, with 10 layers in the first 1 km. Previous studies have shown that this vertical configuration captures the air pollution system above California (Hu et al., 2014a, b, 2015). Particulate number, mass, and composition are represented in 15 size bins, with particle diameters being centered within equally spaced logarithmic size interval spanning the diameter range from 0.01 to 10 µm. Nucleated particles were initialized in a 16th size bin with an initial diameter of 0.007 µm.
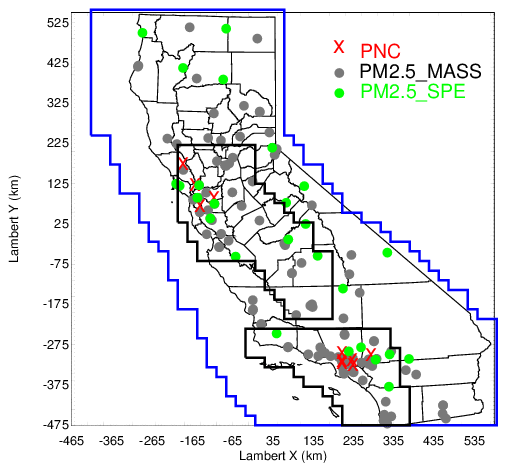
Figure 2Modeling domains. Blue lines outline the CA_24 km domain; black lines outline the SoCAB_4 km (bottom) and SJV_4 km domains (top). Red crosses represent 10 Nx sites: four sites operated by staff at the Bay Area Air Quality Management District (BAAQMD) and six sites from the Multiple Air Toxics Exposure Study IV (MATES IV). Detailed location information for the Nx sites is listed in Table S3. Green dots represent BAAQMD PM2.5 speciation network sites and the Interagency Monitoring of Protected Visual Environments (IMPROVE) sites; gray dots represent the PM2.5 federal reference method (FRM) sites.
2.1 Meteorological fields
Hourly meteorological fields during the modeling period were generated by the Weather Research and Forecasting (WRF) model version 3.4 with three nested domains that had horizontal resolutions of 36, 12, and 4 km, respectively. In the present simulations, the WRF model was configured with 50 vertical layers (up to 100 hPa) and four-dimensional data assimilation (FDDA) nudging was utilized to improve the agreement between model predictions and observed meteorological patterns (Otte, 2008a, b). WRF predictions for wind speed, temperature, and relative humidity were compared to measurements for seven counties in the SFBA and two counties in the SoCAB (see Table S2). Temperature has a mean bias (MB) within ∼0.2 ∘C and root mean square errors (RMSEs) between 4 and 5 ∘C. Wind speed has mean fraction bias (MFB) within ±0.20 and RMSE generally < 2.0 m s−1. This level of performance is consistent with the performance of WRF in previous studies conducted in California (Zhao et al., 2011; Hu et al., 2015).
2.2 Emissions
The emission inventories used in the SFBA were developed by the BAAQMD for the year 2012 based on the regulatory inventory provided by the California Air Resources Board for that same year. The SFBA inventory was processed using the Sparse Matrix Operator Kernel Emissions (SMOKE) v3.7 software package provided by the US EPA. SMOKE was configured to separately tag emissions from on-road gasoline vehicles, off-road gasoline vehicles, on-road diesel vehicles, off-road diesel vehicles, food cooking, biomass burning, non-residential natural gas, and all other sources. The emission inventories used in south Sacramento Valley, SJV and SoCAB were provided by the California Air Resources Board.
Measurements conducted in parallel with the current study found that particles emitted from natural gas combustion in home appliances were semi-volatile when diluted by a factor of 25 in clean air, but particles emitted from reciprocating engines did not evaporate under the same conditions (Xue et al., 2018a). Near-field emissions from all natural gas combustion sources other than reciprocating engines were therefore set to 30 % of their nominal levels. A map of the natural gas emissions distribution is shown in the Supplement (Fig. S3).
SMOKE results were transformed into size-resolved emissions of particle number, mass, and composition using measured source profiles through an updated version of the emissions model described by Kleeman and Cass (1998). The PM profiles used for each source type were specified as weighted averages from each of the detailed sources within each broad category, as summarized in Table S1. Detailed PM source profiles for major sources of ultrafine particulate matter are based on measurements conducted during source tests (Li and Hopke, 1993; Kleeman et al., 1999, 2000; Robert et al., 2007a, b; Mazaheri et al., 2009). In most cases, these emissions size distributions strongly influence the size distributions of particles in the ambient atmosphere (see Figs. S1 and S4). A more detailed discussion of the emissions processing has been presented in a previous study (Hu et al., 2015).
Table 1Performance statistics for “best-fit” N10 predictions vs. N7 at individual monitoring sites. The threshold for PM modeling applications is typically MFB < ±0.5 and MFE < 0.75.

Table 2Daily average correlation (R2) between PM2.5 mass and particle number concentration at eight sites in California.
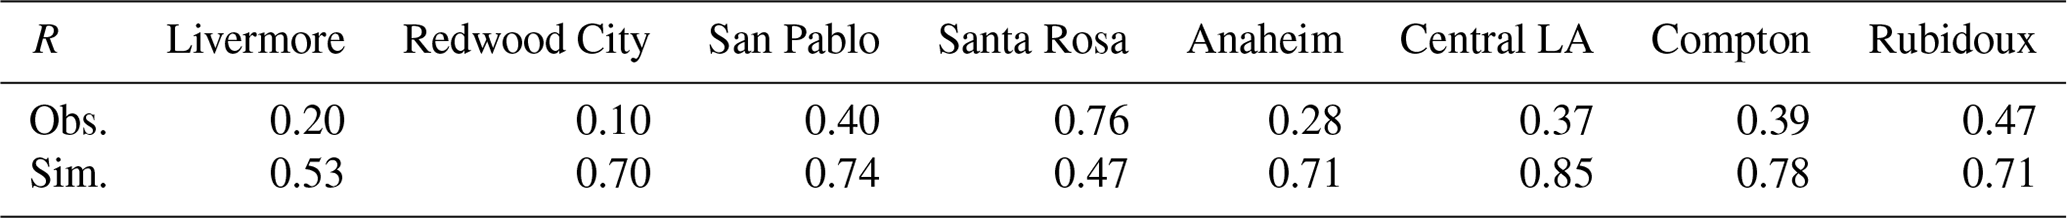
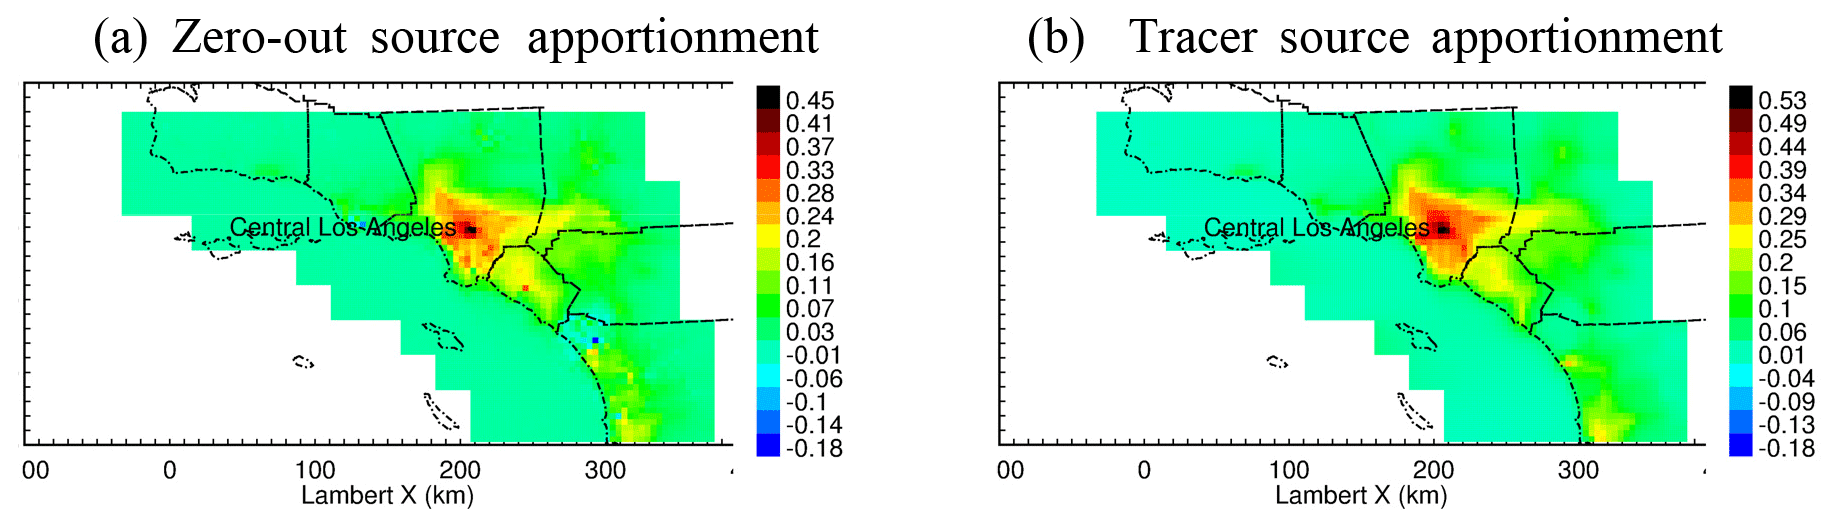
Figure 3Particle number concentrations associated with on-road gasoline vehicles calculated using the zero-out method and the artificial tracer method in August 2012.
3.1 Statistical evaluation
According to Taylor's hypothesis (Shet et al., 2017), it is expected that the spatial distribution of model results is more important than the temporal distribution when evaluating performance. In the current study, model performance evaluations are limited to the locations where measurements were made. Therefore, the temporal distribution is also considered by comparing predicted vs. measured daily average Nx, PM2.5, and individual PM2.5 species mass concentrations.
The evaluation data set was compiled from several measurement networks including the sites operated by staff at the Bay Area Air Quality Management District (BAAQMD), the IMPROVE sites, the MATES IV sites, and FRM sites. In order to account for the uncertainty in predicted wind fields and spatial surrogates used to place emissions, “best-fit” model results were created by identifying the closest match within three grid cells of each measurement location. Best-fit model performance for PM2.5 at routine monitoring sites (Fig. 2) meets the performance criteria suggested by Boylan and Russell (Boylan and Russell, 2006) (mean fractional error (MFE) and mean fractional bias (MFB) ) (Table S4). Table S5 shows the MFB and MFE values of gaseous species of O3, NO, NO2, CO, and SO2 using daily averages across all measurement sites during the entire simulated period. Gaseous species of O3, CO, NO, NO2, and SO2 have MFBs within ±0.3 and MFE less than 0.5, indicating consistent behavior between predictions and measurement for these species. The ability of UCD/CIT predictions for key gas species, mass, and chemical component concentrations in the PM0.1 and PM2.5 size fractions was also evaluated in previous studies (Ying and Kleeman, 2006; Ying et al., 2008a, b; Hu et al., 2012, 2015, 2017; Chen et al., 2010; Held et al., 2005; Venecek et al., 2019). The performance of the UCD/CIT air quality model in these studies generally meets standard model performance criteria. Of greatest interest in the current study, predicted best-fit N10 values were compared to measured N7 values at four sites in the SFBA (Santa Rosa, San Pablo, Redwood City, and Livermore) and six sites in the SoCAB (Anaheim, central Los Angeles, Compton, Huntington, Inland Valley, and Rubidoux). N7 measurements in the SFBA were made using an environmental particle counter (EPC) monitor model 3783 (TSI Inc.), while N7 measurements in the SoCAB were made with EPC model 3781 (TSI Inc.). Both monitors can detect ultrafine particles down to 7 nm, which is smaller than the first size bin of 10 nm used in model calculations. Previous studies conducted at Fresno, California, suggest that N7–10 accounts for approximately 8 % of N7 (Watson et al., 2011), and so some amount of negative bias is expected when comparing predicted N10 to measured N7. The evaluation results for best-fit N10 summarized in Table 1 follow this expected trend but MFB and MFE at each comparison site still meet the PM2.5 performance criteria suggested by Boylan and Russell (2006). This level of performance is comparable to the results from a previous UFP number simulation conducted in northern California using a modified version of the WRF-Chem model (Lupascu et al., 2015). The level of agreement between predicted best-fit and measured PM2.5, individual PM2.5 species, key gas species, and N10 builds confidence in the model skill for UFP predictions in the current study.
Table 2 summarizes the predicted correlations between daily average particle number concentrations and PM2.5 along with the measured correlations for these metrics. Measured correlations (R) are less than 0.5 at all locations except Santa Rosa, where correlations are above 0.75. Model predictions for daily average particle number concentrations and PM2.5 are more highly correlated, with R ranging from 0.47 to 0.85. The higher correlation between particle number and PM2.5 in the predicted concentrations suggests that the model does not capture all of the complexity in the real atmosphere. Locations with high R values such as central Los Angeles also have the highest MFB and MFE, and so the high correlation between particle number and PM2.5 may reflect inaccuracies in the model inputs. At other locations where traditional model performance metrics suggest that predictions are more accurate, the high correlation between particle number and PM2.5 may be related to the model grid resolution. The 4 km grid resolution used in the calculations smooths the sharp spatial gradients in the ultrafine particle concentration fields (see Fig. 4 below). This same issue makes it difficult for point source measurements to accurately represent 4 km average number concentrations. The particle number concentrations measured at a fixed monitoring location may not represent the variation in particle number concentrations a few kilometers away. PM2.5 concentration gradients are smoother, making model predictions and point measurements easier to compare.
3.2 PM0.1 and N10 source apportionment in California
The UCD/CIT model uses a moving sectional approach to conserve particle number and mass while letting particle radius change due to condensation and evaporation (Kleeman et al., 1997). The method to calculate source contributions to number concentration is performed for each moving section individually. Number is explicitly conserved and correctly apportioned to sources in this algorithm. Each particle source type/moving size bin includes an artificial tracer equal to 1 % of the primary particle mass. The mass of this tracer is related to the number of particles by the equation
where ρ_i is the density of primary particles emitted from source i. This equation can be easily rearranged to solve for N_source_i as a function of tracer_source_i in each size bin. Condensation/evaporation changes the particle diameter as semi-volatile components move on and off the particle but this does not change tracer_source_i or N_source_i. As a result, the moving sectional approach greatly simplifies the source apportionment of particle number compared to other models that use fixed particle size bins with condensation/evaporation transferring material between bins.
Coagulation complicates source apportionment calculations for particle number because coagulation events conserve particle mass but destroy particle number. The model calculations treat the most frequently occurring coagulation events between very small particles and very large particles in a manner analogous to condensation. When two particles coagulate, the mass of the smaller particle is added to the mass of the larger particle. The number concentration of the smaller particle is discarded, while the number concentration of the larger particle stays constant. This slightly reduces the accuracy of source apportionment calculations for particle number in the larger size bins because the tracer_source mass in the larger size bin is no longer proportional to the number concentration from that source. This issue is relatively minor since size bins larger than 1 µm that act as the dominant sink during particle coagulation events typically account for less than 5 % of the total number concentration.
Perturbation studies were conducted to test the accuracy of the source apportionment calculations by setting the UFP emissions for on-road gasoline vehicles to zero during the month of August 2012. Emissions of gases and emissions of larger particles from on-road vehicles were not changed. The difference between this perturbation simulation and the base-case simulation was calculated to estimate the number concentration of particles associated with on-road gasoline vehicles. This “zero-out” concentration was then compared to the standard model source apportionment calculations in Fig. 3. The two methods for number source apportionment yield very similar spatial patterns and very similar maximum concentrations of ∼0.5 k counts cm−3. The tracer source apportionment method accounts for all particle sizes, which produces slightly higher concentrations than the zero-out method that only considered particles smaller than 100 nm.
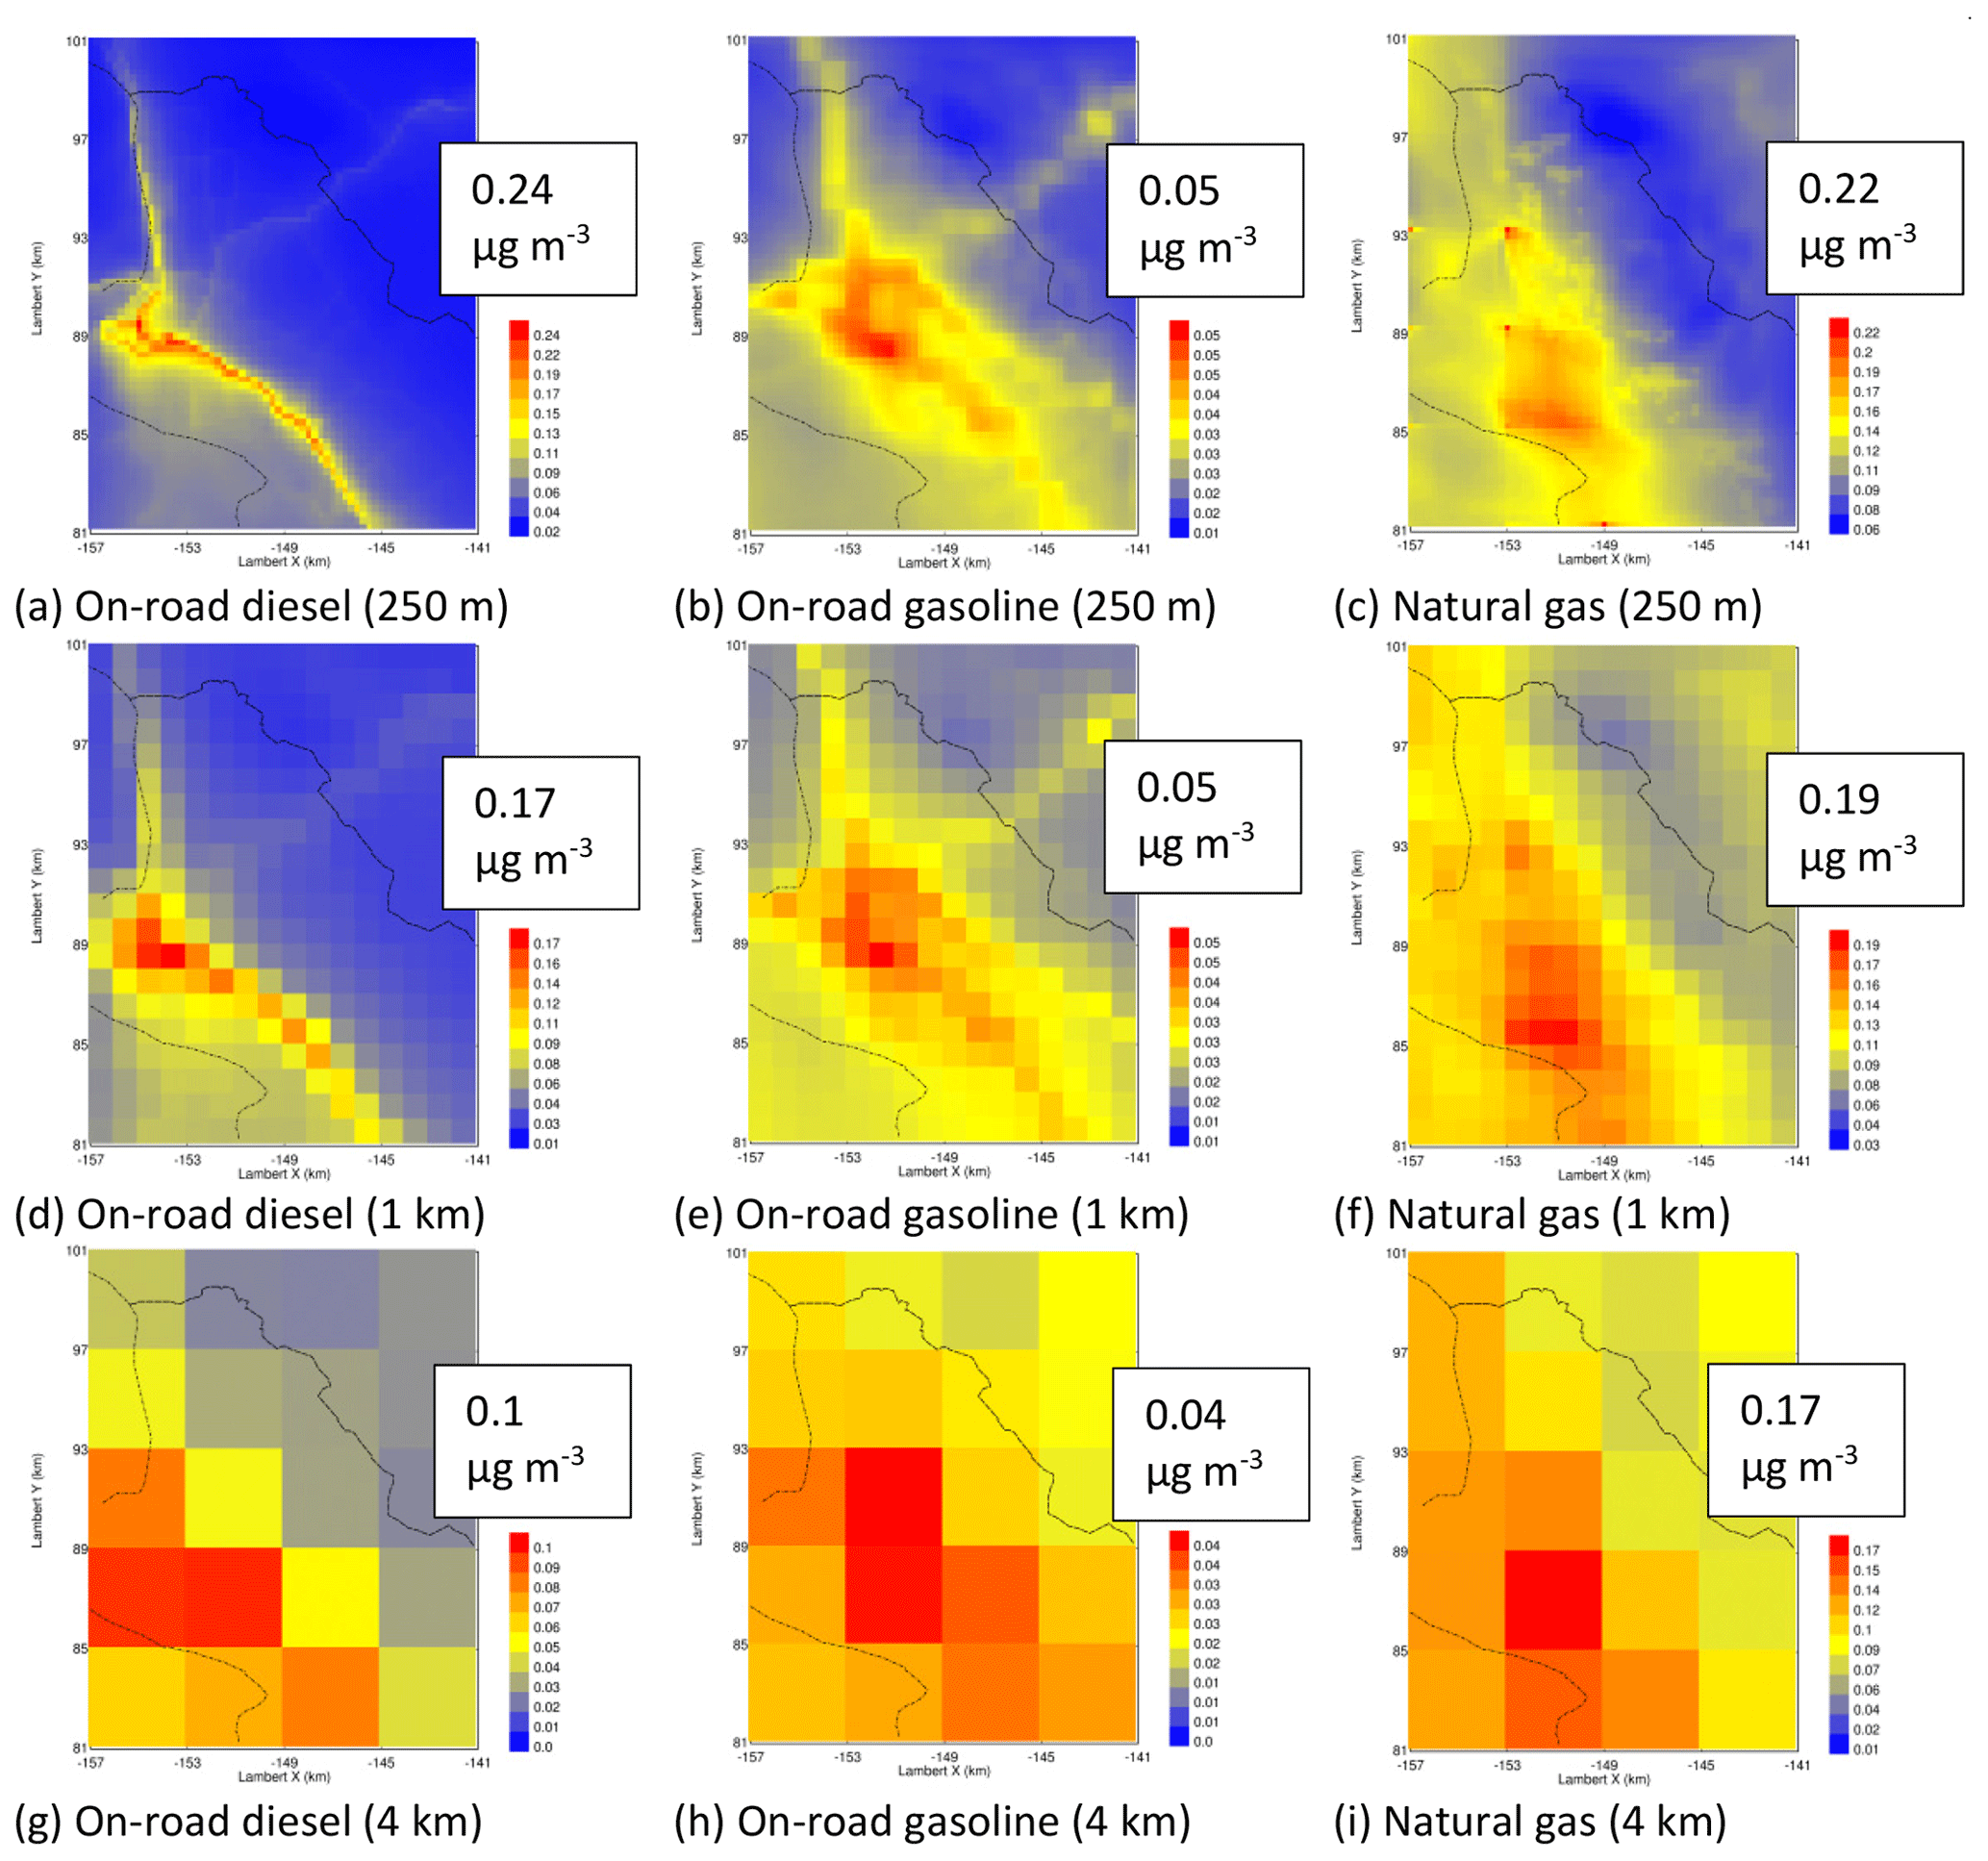
Figure 4PM0.1 mass concentration associated with on-road diesel, on-road gasoline, and natural gas combustion at 250 m, 1 km, and 4 km resolution over Oakland, California.
Many of the spatial patterns measured for airborne particle number concentrations in past studies have focused on the gradients around roads (see, for example, Zhu et al., 2002a, b; Zhang et al., 2004, 2005; Sowlat et al., 2016). These gradients are impossible to resolve using a regional model with 4 km resolution. A limited set of additional simulations was conducted using the WRF-Chem model configured with large eddy simulation (LES) around Oakland, California, so that spatial scales down to 250 m could be examined. Maps of the predicted ultrafine particle mass concentrations for gasoline, diesel, food cooking, wood combustion, and natural gas combustion particles are shown in Fig. 4 below. At 250 m resolution, ultrafine particles from diesel engines peak on major transportation corridors, while ultrafine particles from gasoline vehicles are more diffuse, reflecting their increased activity on adjacent surface streets. Ultrafine particles from natural gas combustion are even more diffuse, reflecting contributions from area sources across the region. As the spatial resolution decreases to 1 km and then 4 km, the fine details around roadways are artificially diluted in the larger grid cells. This process shifts the dominant source of ultrafine particles over roadways from diesel engines at 250 m resolution to natural gas combustion at 4 km resolution. These simulation results are consistent with measurements of particle number in the proximity of roadways which show that the traffic contribution to particle number concentration decays to background levels within 300 m (Zhu et al., 2002a, b). The measurements made by Zhu et al. indicate that the traffic contribution to regional number concentration cannot be distinguished from other sources on a regional scale using 4 km grid cells, which is the focus of this study.
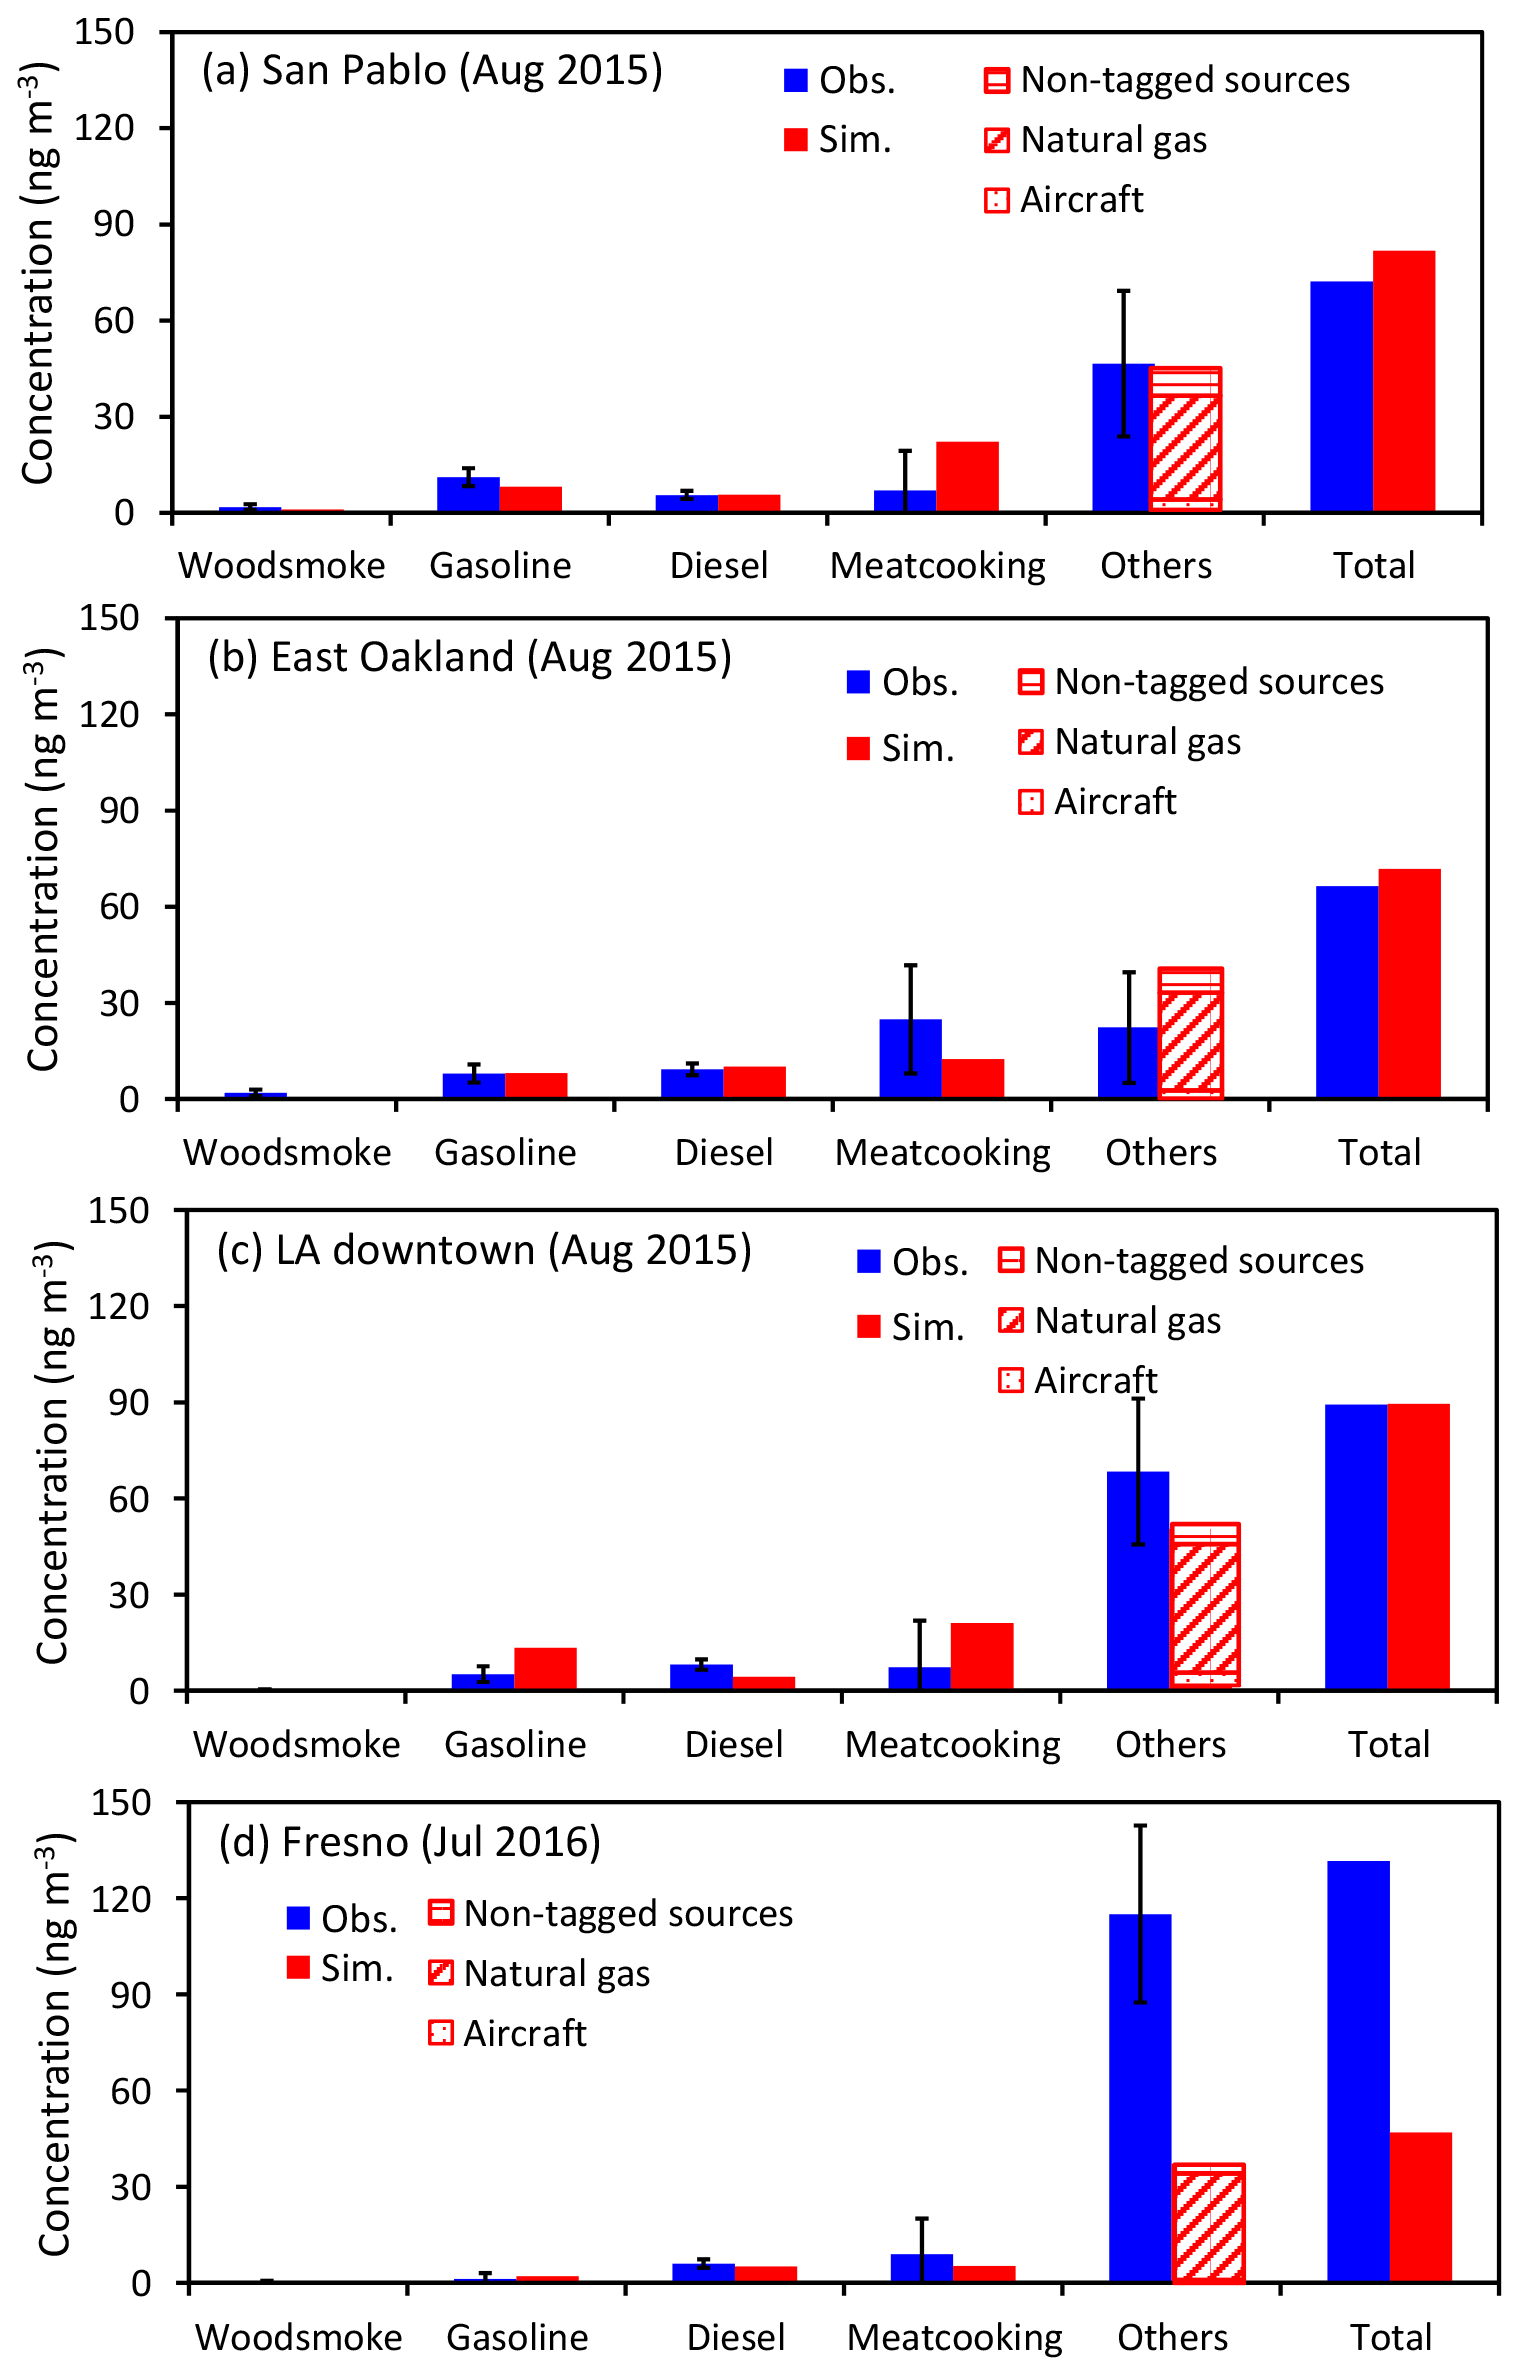
Figure 5Source contribution to PM0.1 predicted by the chemical mass balance (CMB) receptor model and the UCD/CIT model at four sites in California in August 2015. CMB results are calculated using 3 d average measurements composited for a full month.
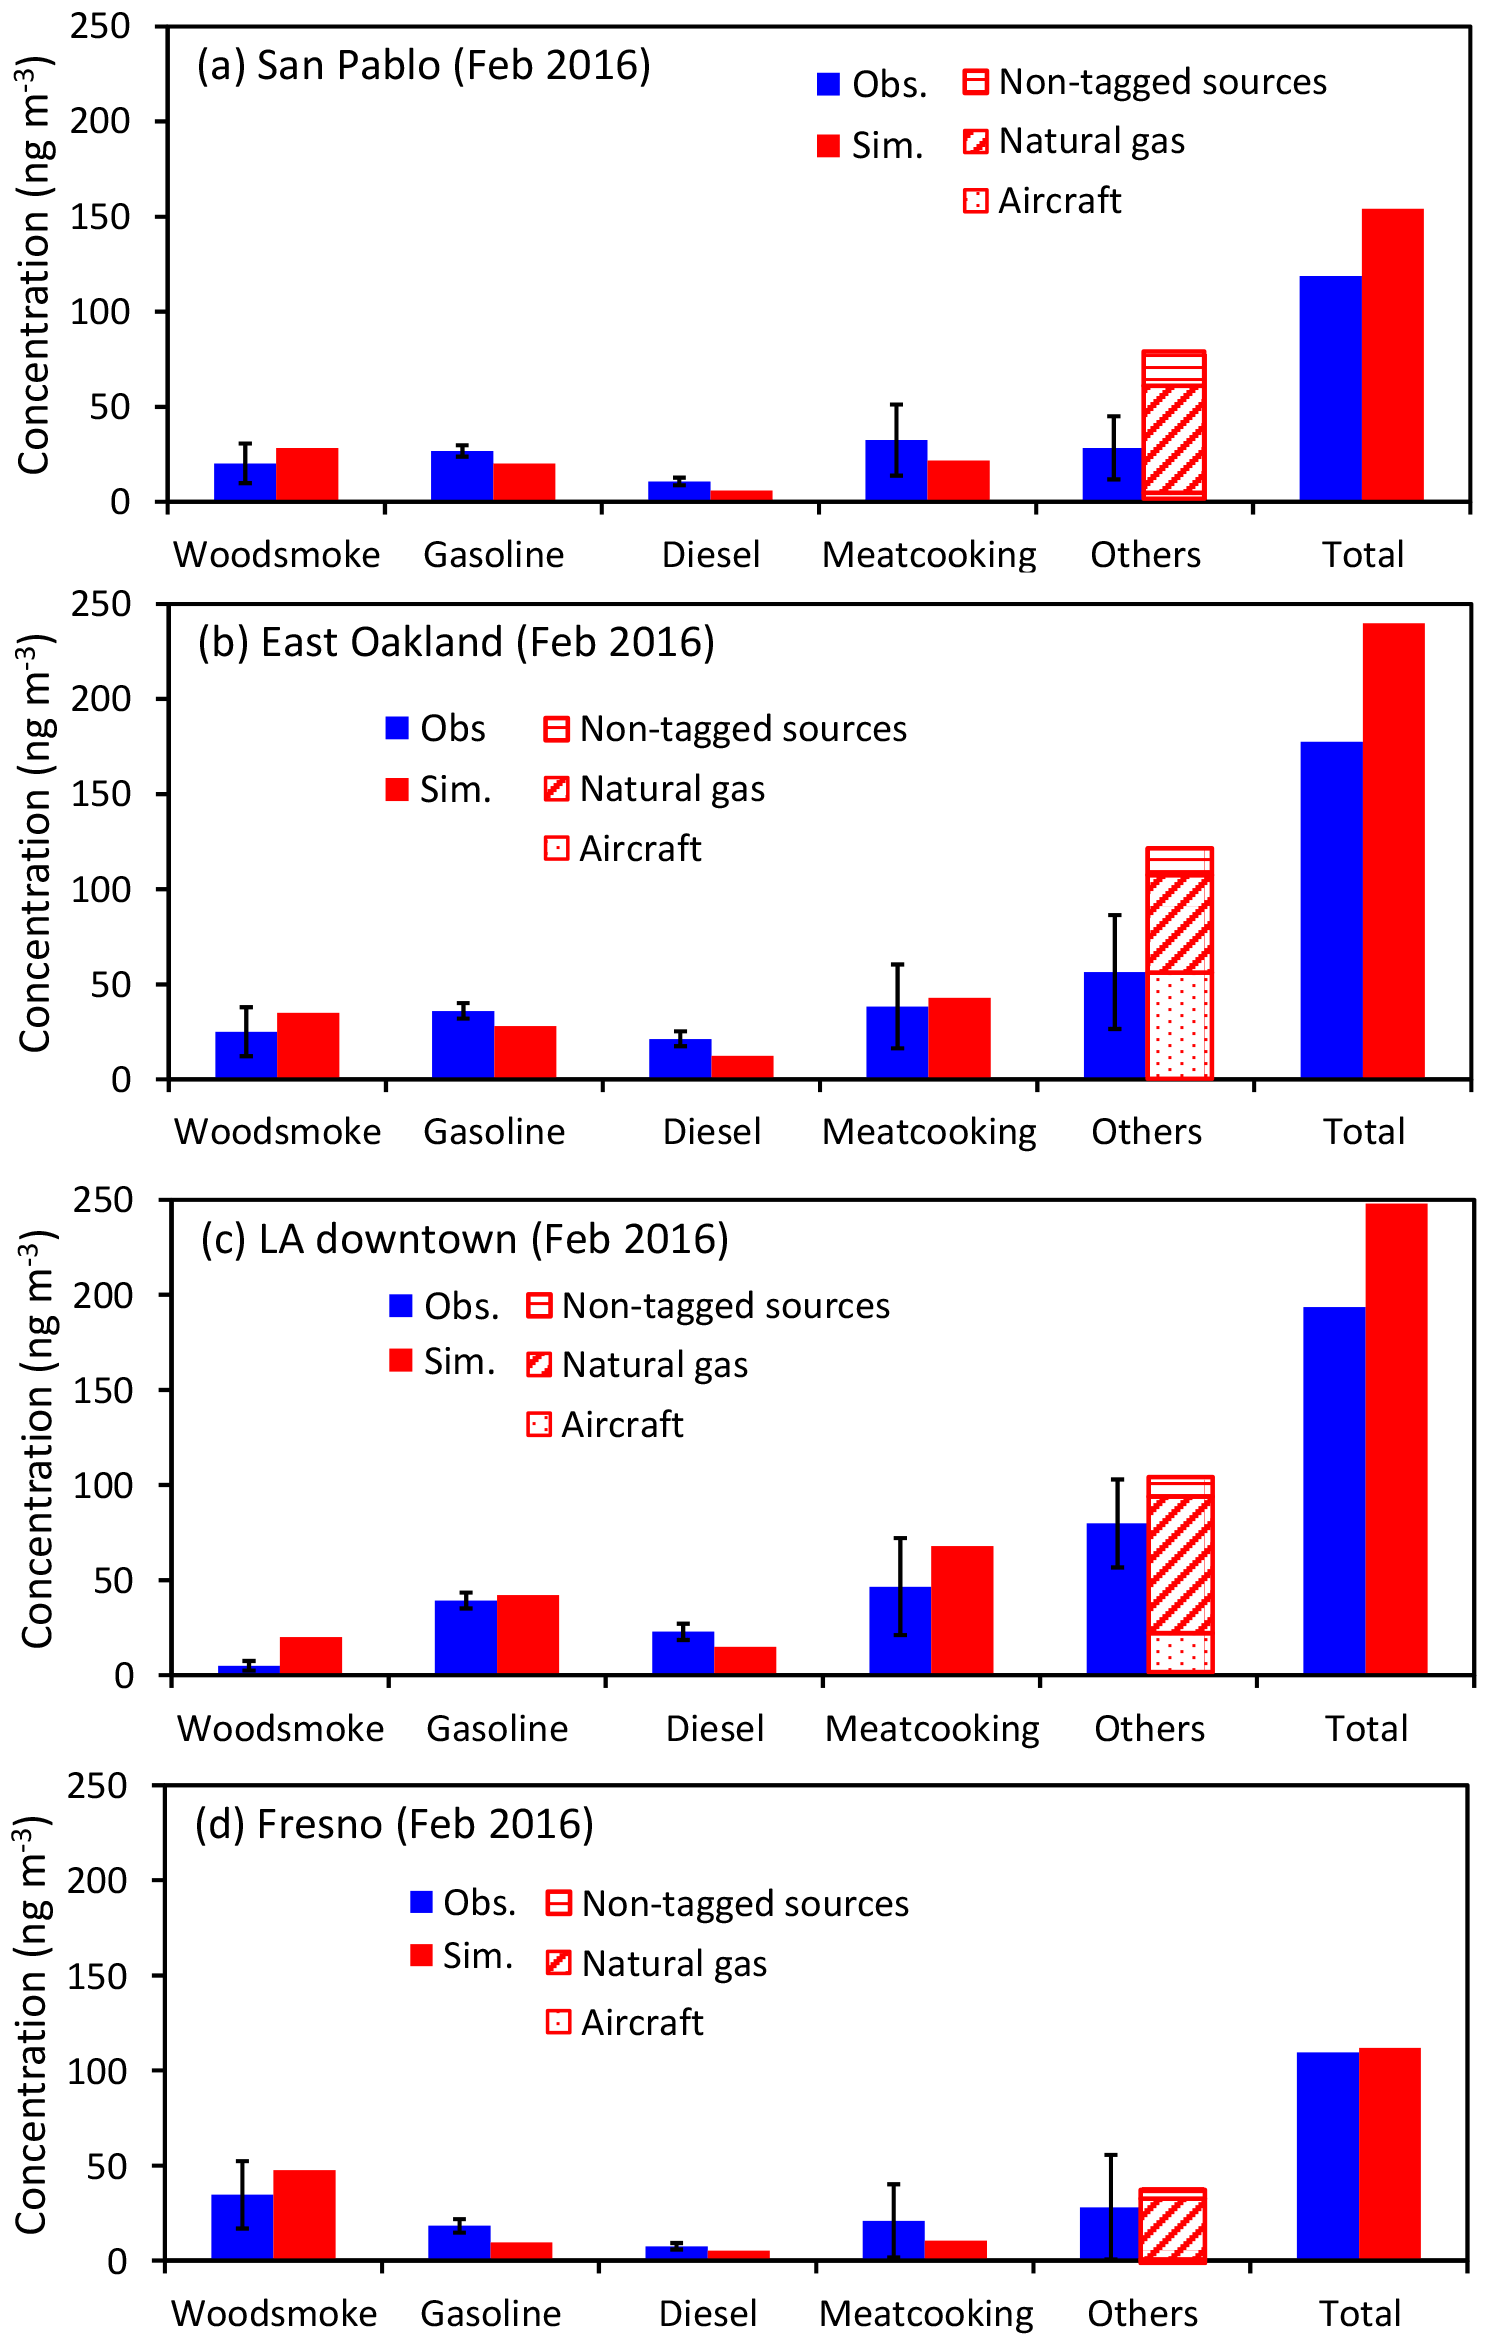
Figure 6Source contribution to PM0.1 predicted by the CMB receptor model and the UCD/CIT model at four sites in California in February 2016. CMB results are calculated using 3 d average measurements composited for a full month.
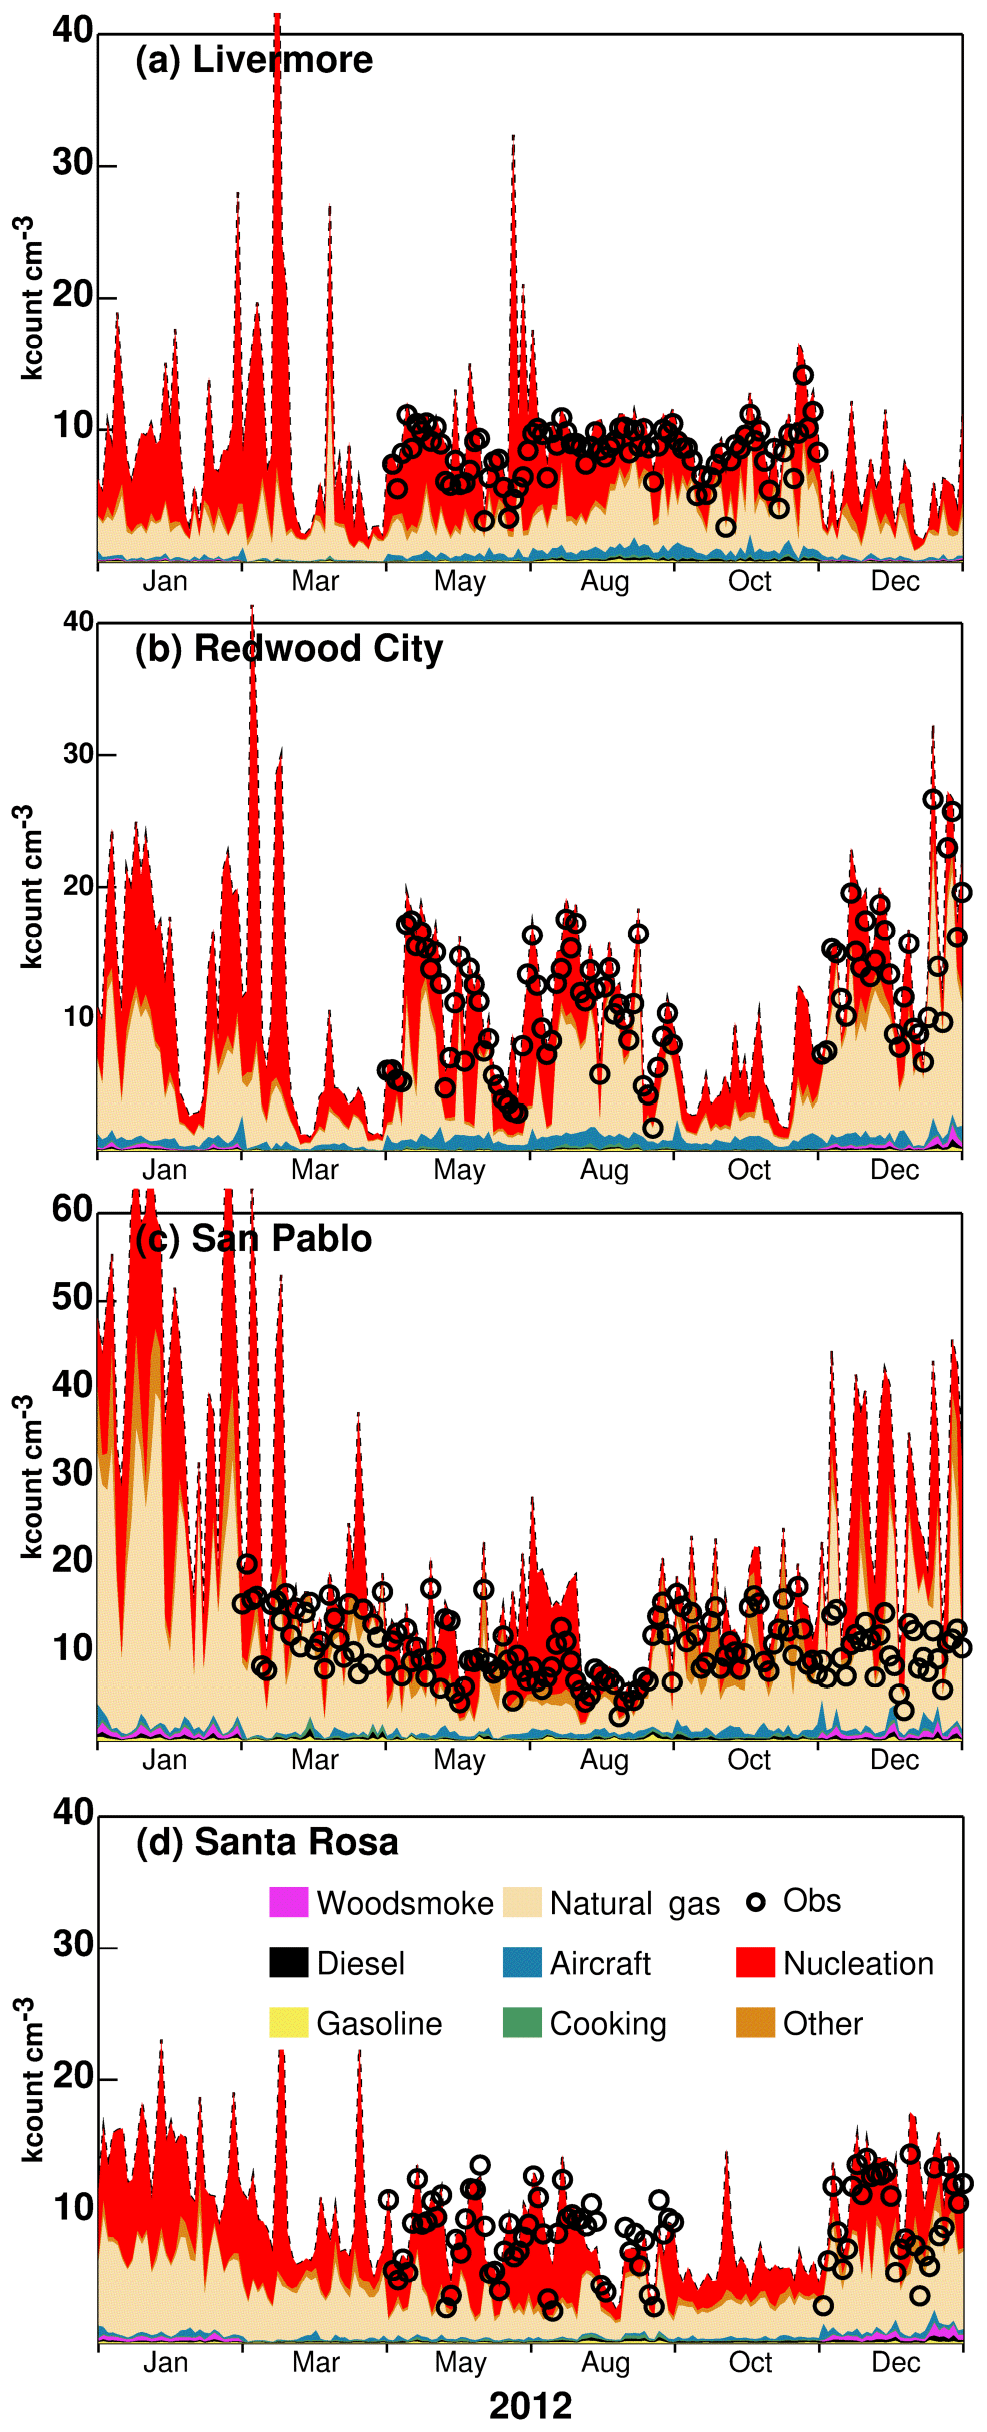
Figure 7Seasonal variation of measured N7 (black circles) and major source contributions to best-fit N10 at Livermore, Redwood City, San Pablo, and Santa Rosa, respectively. Results within each month have daily time resolution.

Figure 8Seasonal variation of measured N7 (black circles) and major source contributions to best-fit N10 at Anaheim, central LA, and Compton, respectively. Results within each month have daily time resolution.

Figure 9Seasonal variation of measured N7 (black circles) and major source contributions to best-fit N10 at Huntington, Inland Valley, and Rubidoux, respectively. Results within each month have daily time resolution.
3.2.1 UCD/CIT PM0.1 source contributions compared to chemical mass balance (CMB) results
A recently completed study measured the composition of PM0.1 at four sites in California and calculated source contributions using molecular markers (Xue et al., 2018b). Figures 5 and 6 compare the source contributions to PM0.1 OC concentrations predicted by the UCD/CIT model and “measured” using the molecular marker technique at San Pablo, East Oakland, downtown Los Angeles, and Fresno during a summer month (August 2015) and a winter month (February 2016). The “others” category in the molecular marker calculation represents unresolved sources, while in the UCD/CIT model “others” represents the sum of non-residential natural gas source combustion, aircraft emissions, and the sources that were not tagged in the current study. In general, the ranking and concentration range of source contributions to PM0.1 OC from the molecular marker technique and the UCD/CIT model are consistent. Natural gas dominates PM0.1 OC in the summer of 2015 at San Pablo, East Oakland, downtown Los Angeles, and Fresno, while wood smoke and aircraft are the major sources of PM0.1 OC in Fresno and East Oakland during the winter of 2016. The importance of ultrafine particles from natural gas combustion has not previously been recognized because these particles lack a unique chemical signature, which causes them to be lumped into the “unresolved” category in receptor-based source apportionment studies. The source contribution results for the gasoline, diesel, wood burning, meat cooking, and other source categories predicted by the UCD/CIT model and the molecular marker technique illustrated in Figs. 5 and 6 build confidence in the accuracy of the UFP source predictions in the current study.
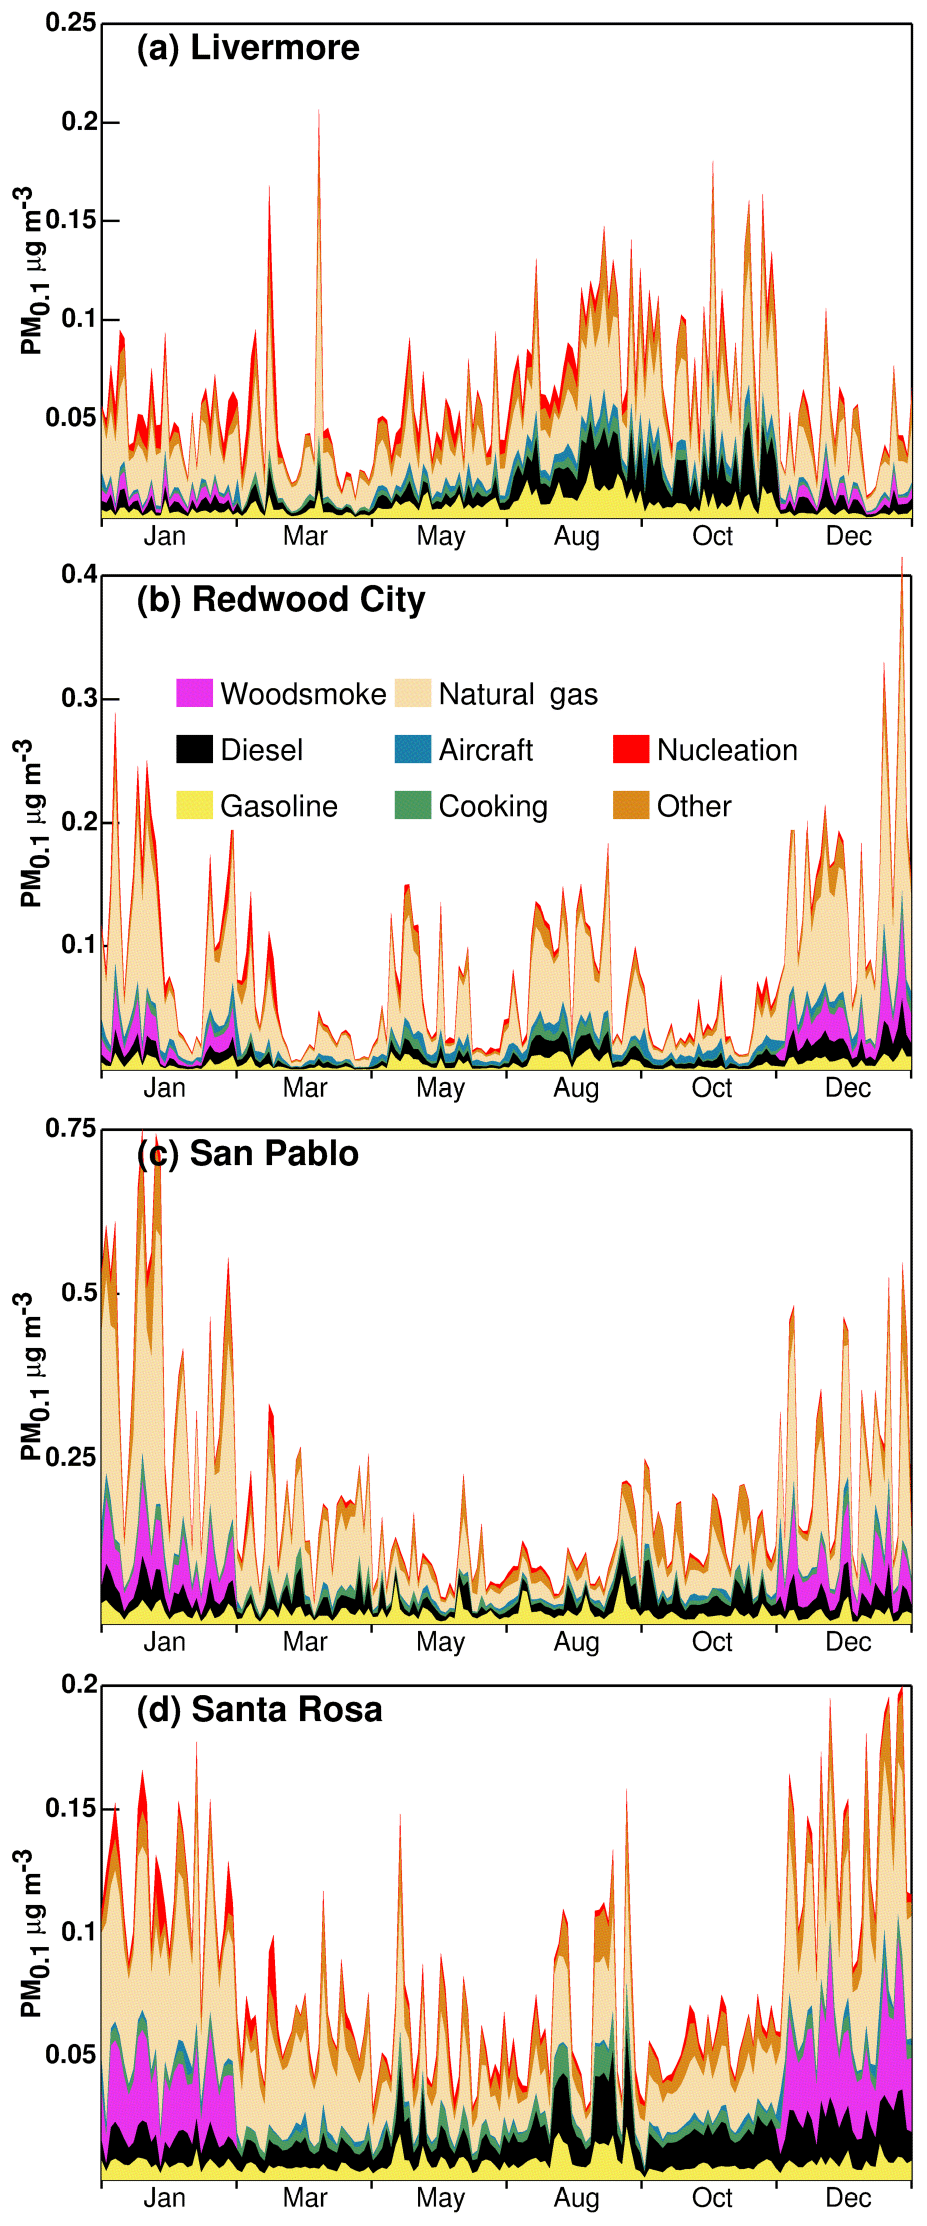
Figure 10Seasonal variation of major source contributions to PM0.1 at Livermore, Redwood City, San Pablo, and Santa Rosa, respectively. Results within each month have daily time resolution.
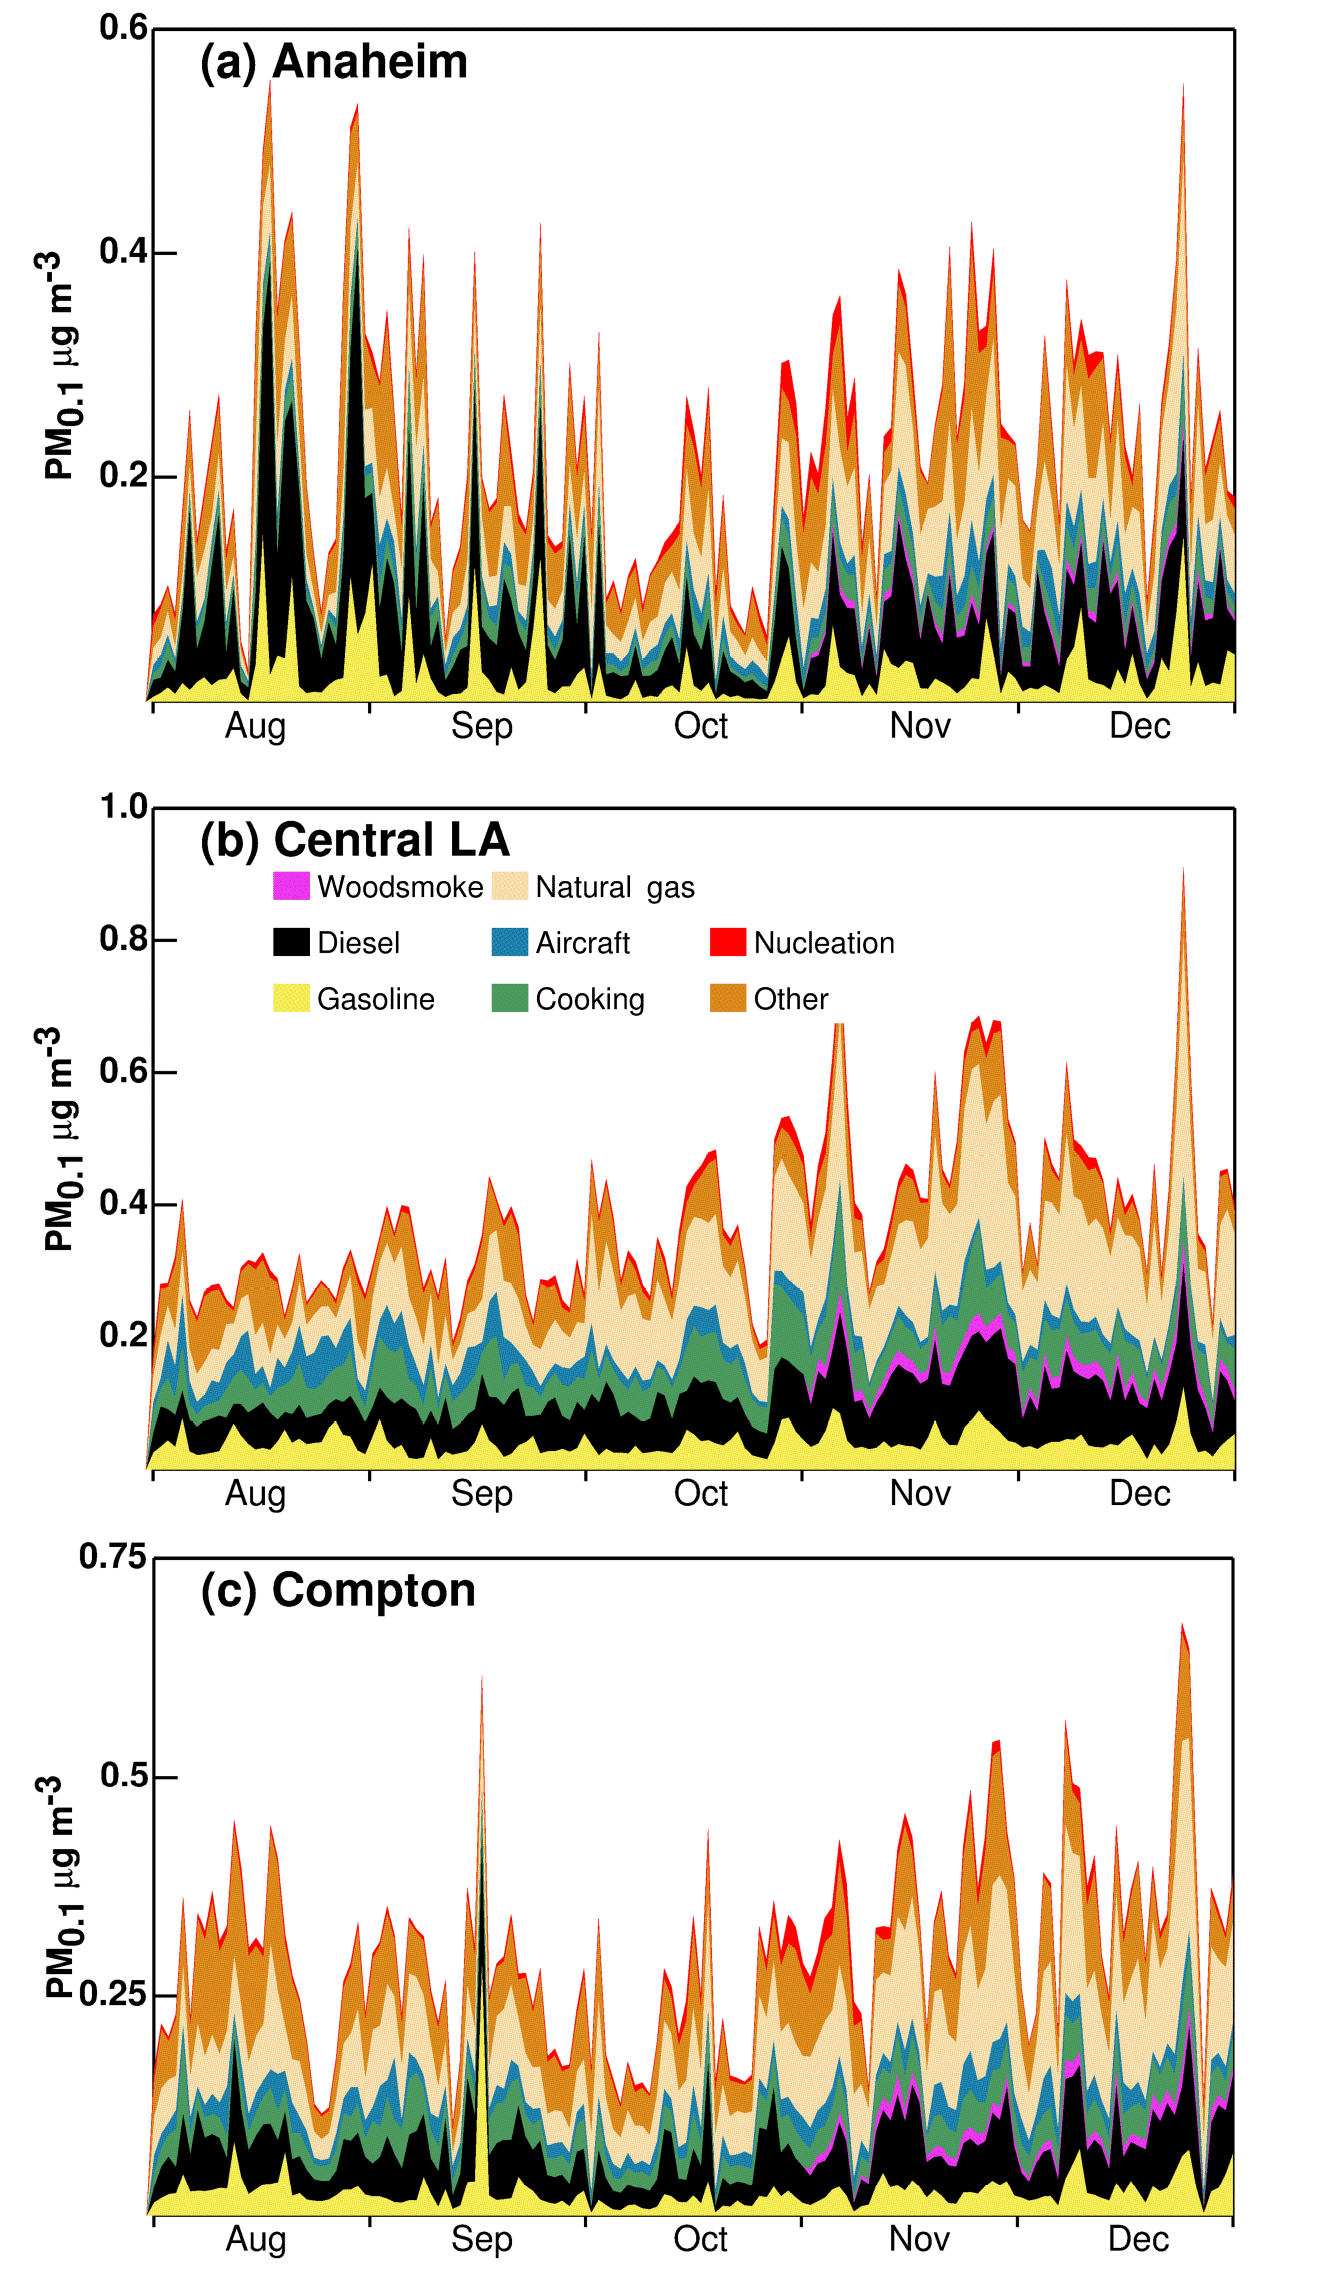
Figure 11Seasonal variation of major source contributions to PM0.1 at Anaheim, central LA, and Compton, respectively. Results within each month have daily time resolution.

Figure 12Seasonal variation of major source contributions to PM0.1 at Huntington, Inland Valley, and Rubidoux, respectively. Results within each month have daily time resolution.
3.2.2 PM0. and N10–1000 source contributions in California
Figures 7–9 and 10–12 show the seasonal variation of major source contributions to primary N10 and PM0.1, respectively. The black circles in Figs. 7–9 represent the measured N7–1000 at four BAAQMD sites in the SFBA and six MATES sites in Los Angeles and Riverside counties. Predicted best-fit N10 follows the same trends as measured seasonal variations of N7 at Livermore, Redwood City, Santa Rosa, Huntington Park, Inland Valley, and Rubidoux. The model overpredicts N7 at Anaheim, central Los Angeles, and Compton, but overall model performance statistics for N7 are within the target range for PM2.5 applications (see Table 1). Nucleation contributes to N10 at all sites but makes negligible contributions to PM0.1 concentrations. Traffic sources including gasoline- and diesel-powered vehicles make significant contributions to PM0.1 concentrations at each measurement site depending on proximity to major freeways. Near-roadway effects on ultrafine particle concentrations are not apparent since these locations were chosen to be regional monitors and so they are more than 300 m from the nearest freeway. Predicted contributions from traffic sources are consistent with the molecular marker results illustrated in Figs. 5–6. Traffic contributions to regional N10 concentrations more than 300 m away from roadways are even smaller than PM0.1 contributions because the size distribution of particles emitted from motor vehicles peaks at 100–200 nm (Robert et al., 2007a, b). Wood smoke makes strong contributions to regional PM0.1 concentrations in central California during winter but much smaller contributions in the SoCAB because wood burning is not typically used for home heating in this region. Wood burning contributions to N10 are less dominant in central California because the size distribution of particles emitted from wood combustion peaks at 100–300 nm (Kleeman et al., 2008b). The largest primary source of N10 in central California and N10 and PM0.1 in the SoCAB is natural gas combustion. Industrial processes and power generation that use natural gas do not follow strong seasonal cycles and so the strength of the natural gas source contributions is somewhat constant across seasons subject to variability caused by meteorological conditions.
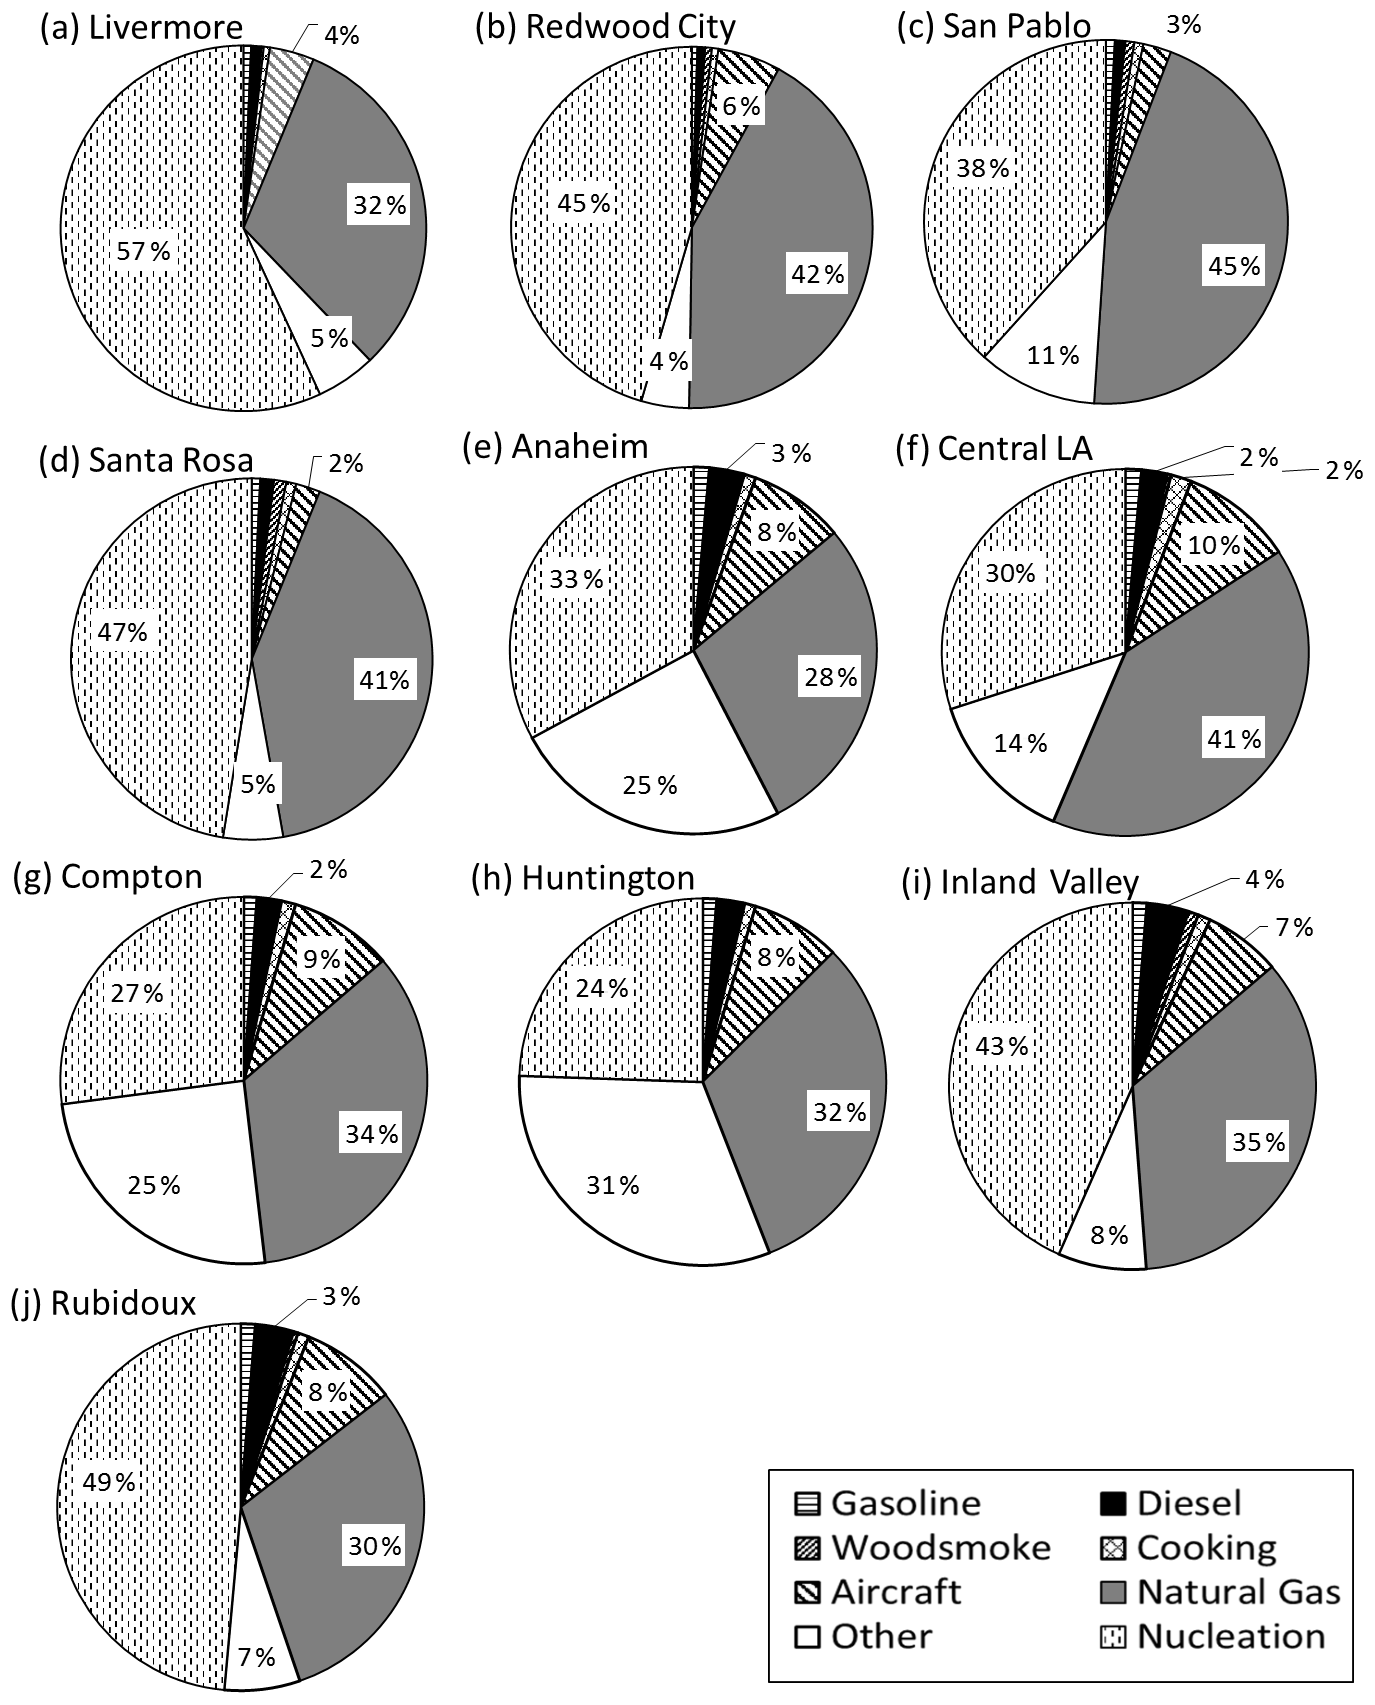
Figure 13The relative source contributions to N10 at Livermore, Redwood City, San Pablo, Santa Rosa, Anaheim, central LA, Compton, Huntington, Inland Valley, and Rubidoux, respectively. Averaging time included all days shown in Figs. 7–9. Values not displayed are ≤1 %.
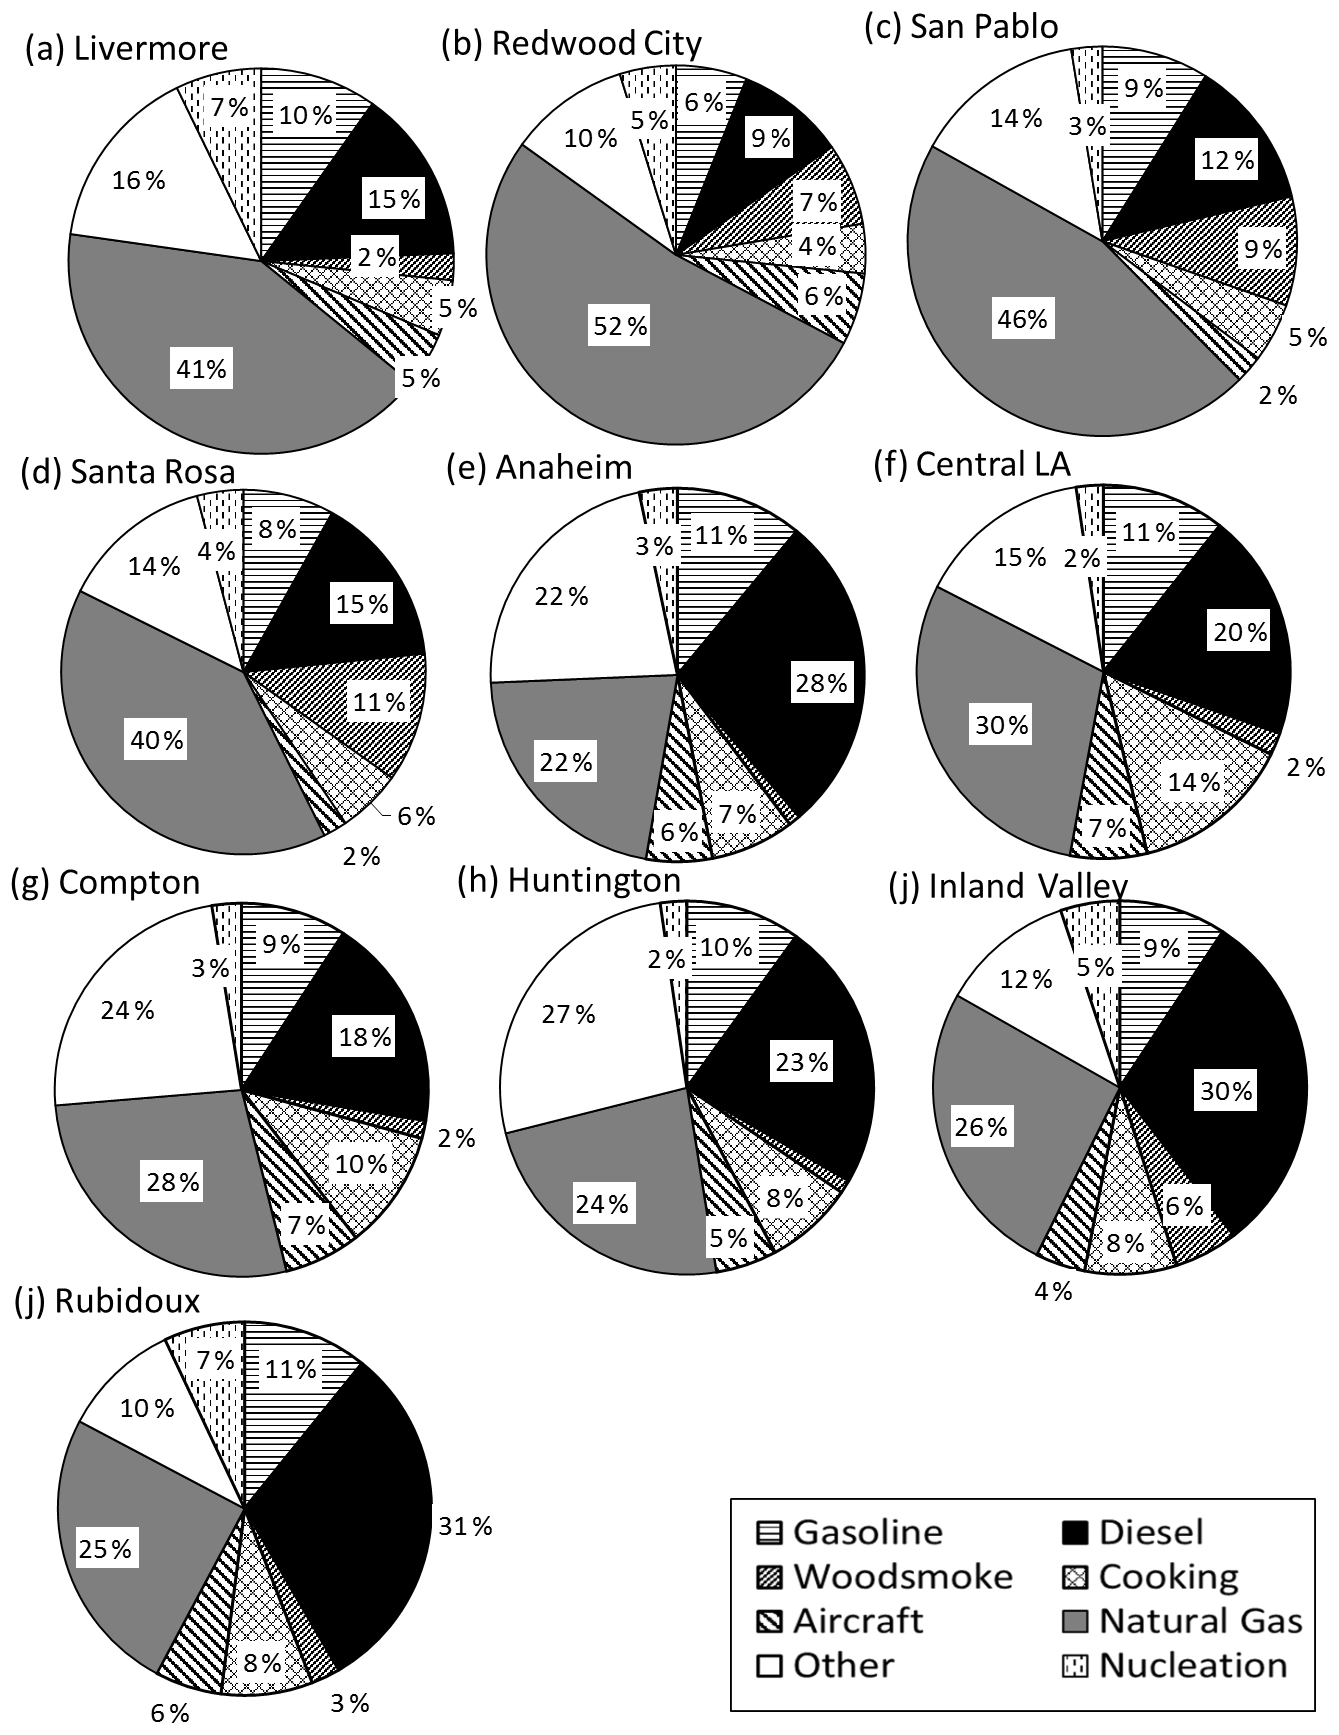
Figure 14The relative source contributions to PM0.1 seasonally averaged at Livermore, Redwood City, San Pablo, Santa Rosa, Anaheim, central LA, Compton, Huntington, Inland Valley, and Rubidoux, respectively. Averaging time included all days shown in Figs. 10–12. Values not displayed are ≤1 %.
Figures 13 and 14 show the source contributions to N10 and PM0.1, respectively, averaged over the days shown in Figs. 7–9. Aside from nucleation, non-residential natural gas combustion makes the largest predicted primary contribution to N10 at all the sites that were evaluated. Traditional sources that were tracked including meat cooking, wood smoke, and mobile (gasoline plus diesel) accounted for approximately 5 %–15 % of the predicted N10 at the sites selected for study. “Other” sources that were not tagged explicitly in the current study accounted for 5 %–31 % of N10 across these sites. Nucleation is a significant source for of N10 for both BAAQMD sites and MATES sites where sulfur emissions were highest, with contributions ranging from 24 % to 57 %.
The strong N10 contribution from natural gas combustion reflects the emitted particle size distribution combined with the ubiquitous use of this fuel in the SFBA and SoCAB regions. The chemical composition and size distribution information for non-residential natural gas combustion emissions used in this study was measured by Hildemann et al. (1991a) and Li and Hopke (1993), respectively. Size distributions and volatility were further confirmed during on-going field studies conducted by the current authors (Xue et al., 2018a). The estimated non-residential natural gas combustion particle number and mass size distributions are shown in Fig. S1 (left column). Clearly, the majority of particles from non-residential natural gas combustion are typically found in diameters < 0.05 µm, while particles emitted from other sources such as wood combustion tend to have slightly larger particle diameter (with lower number concentration per unit of emitted mass). These natural gas particles grow through the condensation of SOA once in the atmosphere, but they still contribute strongly to N10 concentrations.
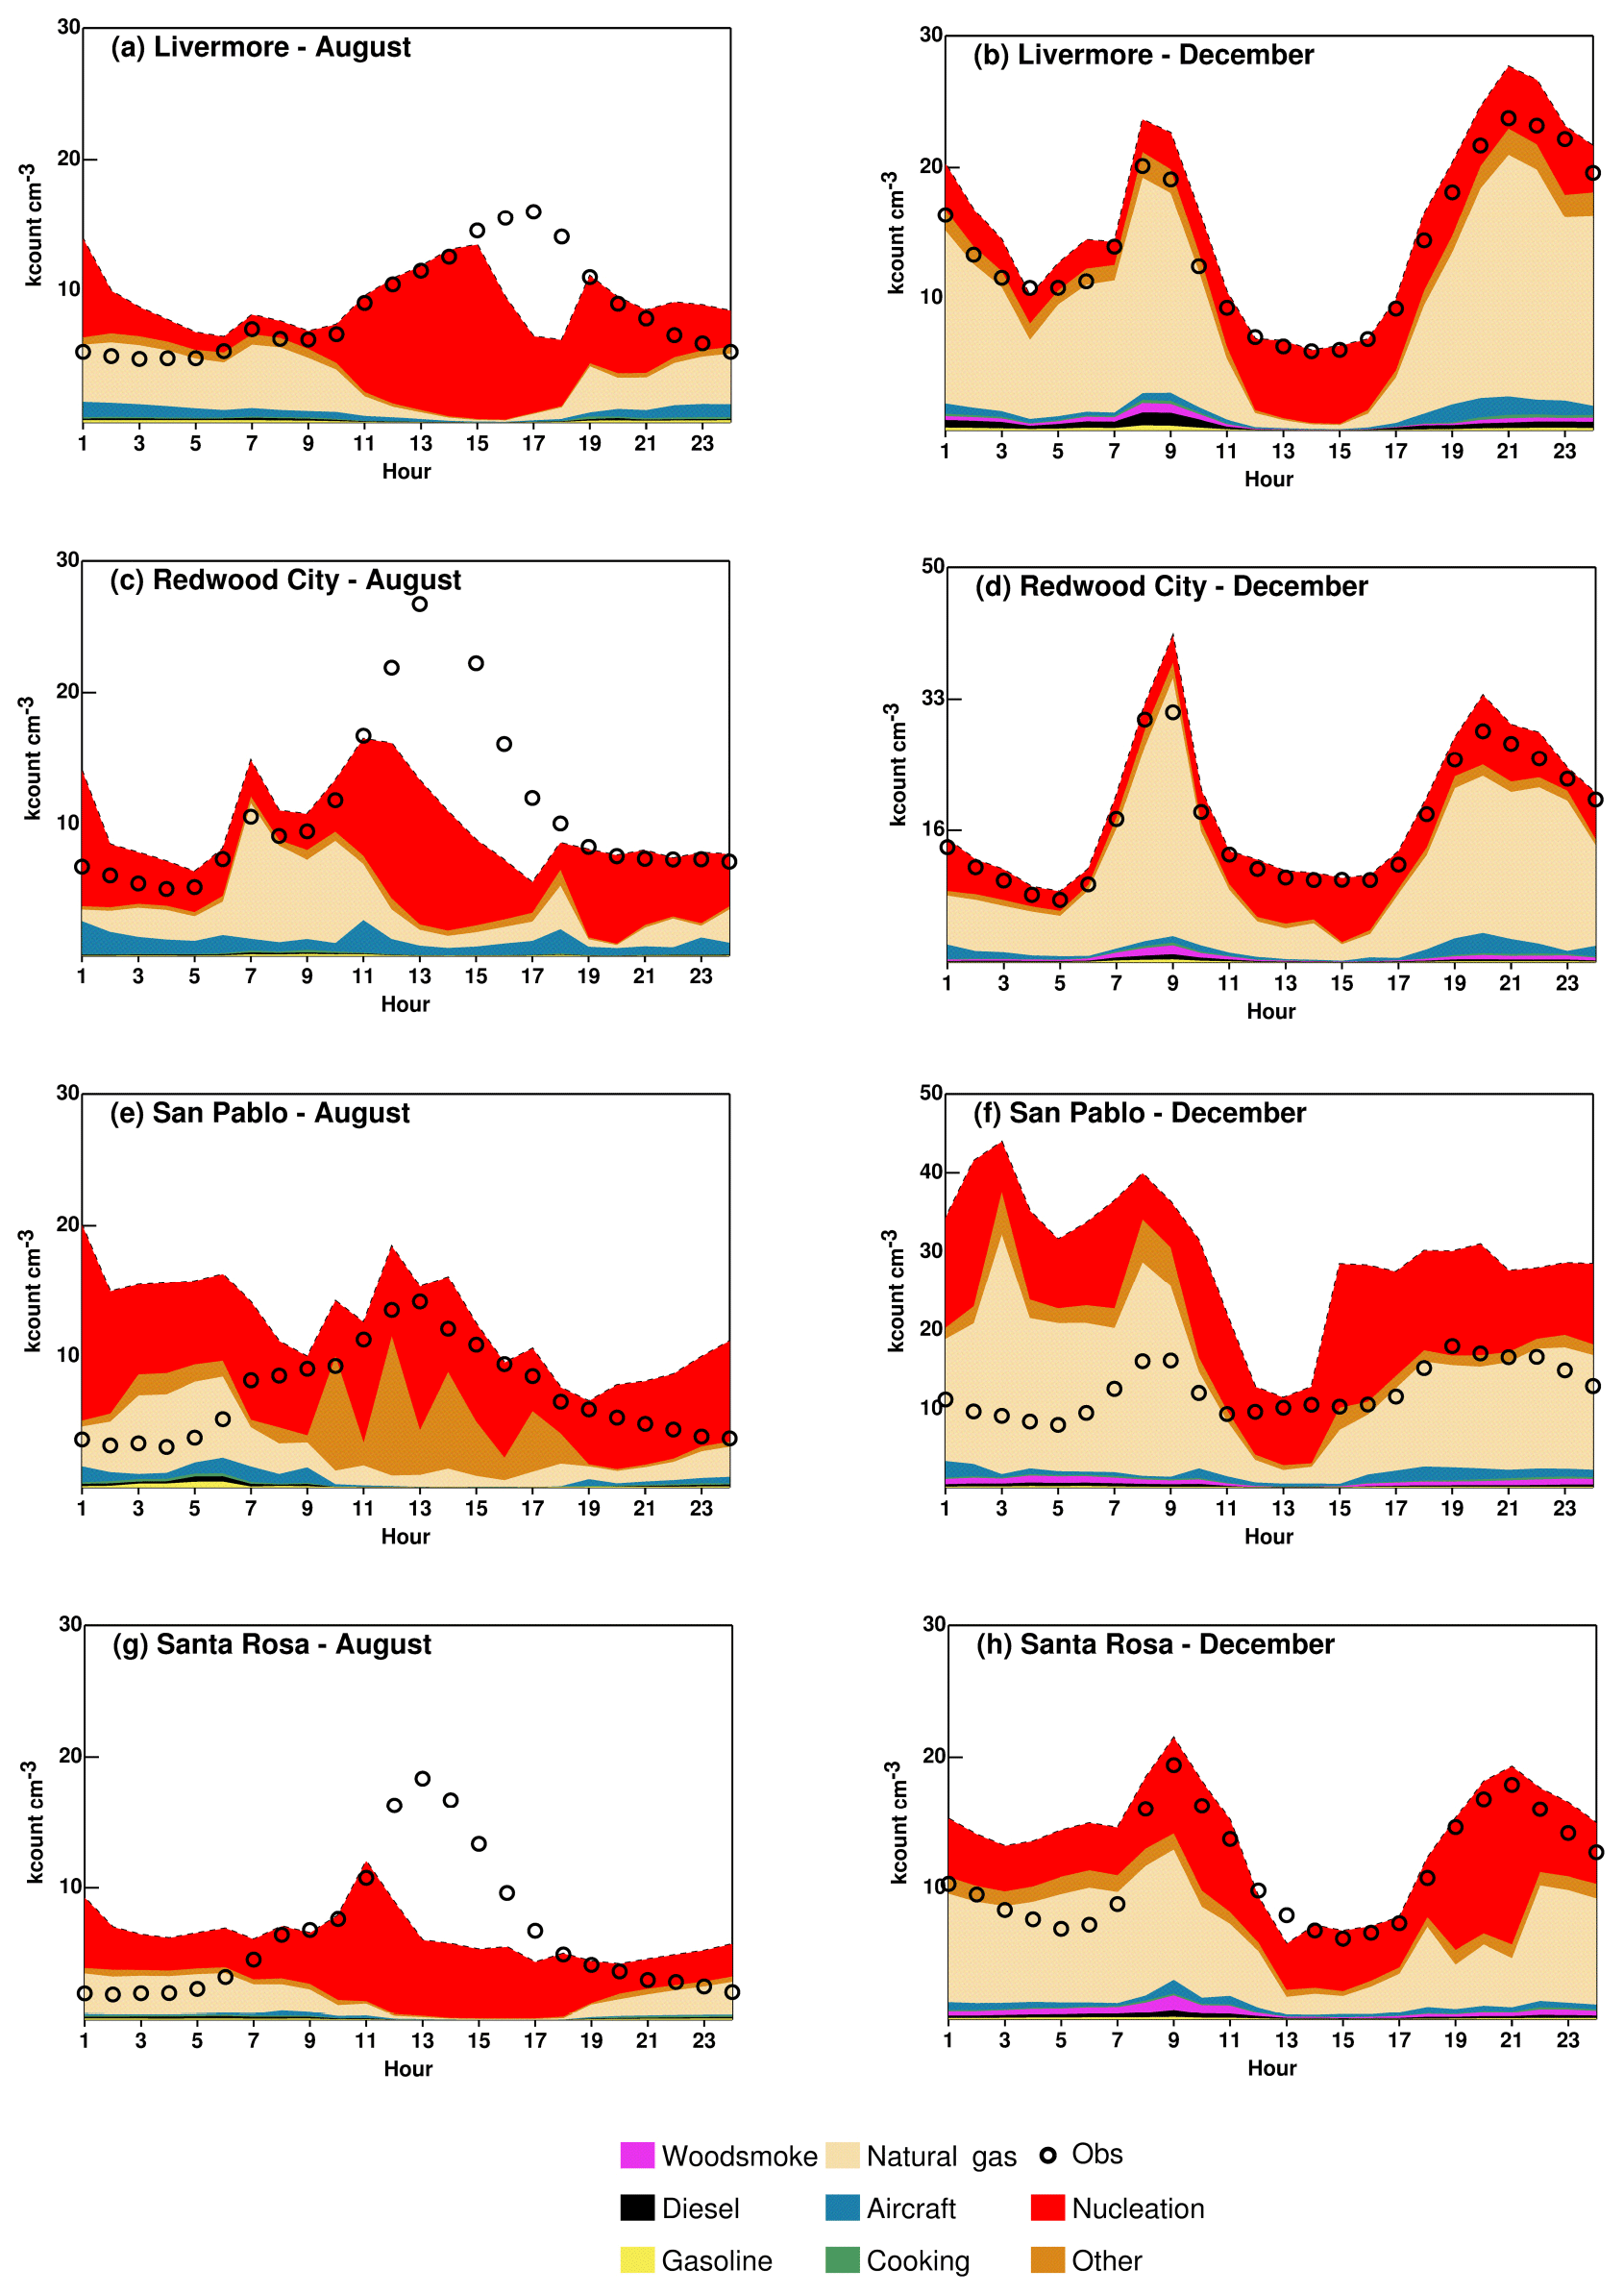
Figure 15Diurnal variations of measured N7 and predicted best-fit N10 averaged for August 2012 (a, c, e, g) and December 2012 (b, d, f, h) at Livermore, Redwood City, San Pablo, and Santa Rosa.

Figure 16Diurnal variations of measured N7 and predicted best-fit N10 averaged for August 2012 (a, c, e) and December 2012 (b, d, f) at Anaheim, central LA, and Compton.
Figure 14 shows that on-road vehicles (gasoline and diesel combined) are the largest PM0.1 source at Anaheim (39 %), central LA (31 %), Huntington Park (33 %), Inland Valley (39 %), and Rubidoux (42 %), while natural gas combustion still makes the largest contribution to PM0.1 at other evaluation sites. Contributions from cooking and mobile sources are enhanced in PM0.1 vs. N10, with the cooking source accounting for 11 % of PM0.1 at Santa Rosa. The different rankings of source contributions to N10 and PM0.1 can be explained by the comparison of particle number-size distribution and particle mass-size distribution for the non-residential natural gas and wood burning sources at the four evaluated sites (Fig. S1). Particles emitted from non-residential natural gas combustion and wood burning have number distributions that peak at particle diameters of 0.016–0.025 and 0.025–0.04 µm, respectively. Non-residential natural gas combustion and wood burning mass distributions, however, peak at particle diameters of 0.025–0.04 and 0.10–0.16 µm, respectively.

Figure 17Diurnal variations of measured N7 and predicted best-fit N10 averaged for August 2011 (a, c, e) and December 2012 (b, d, f) at Anaheim, central LA, and Compton.
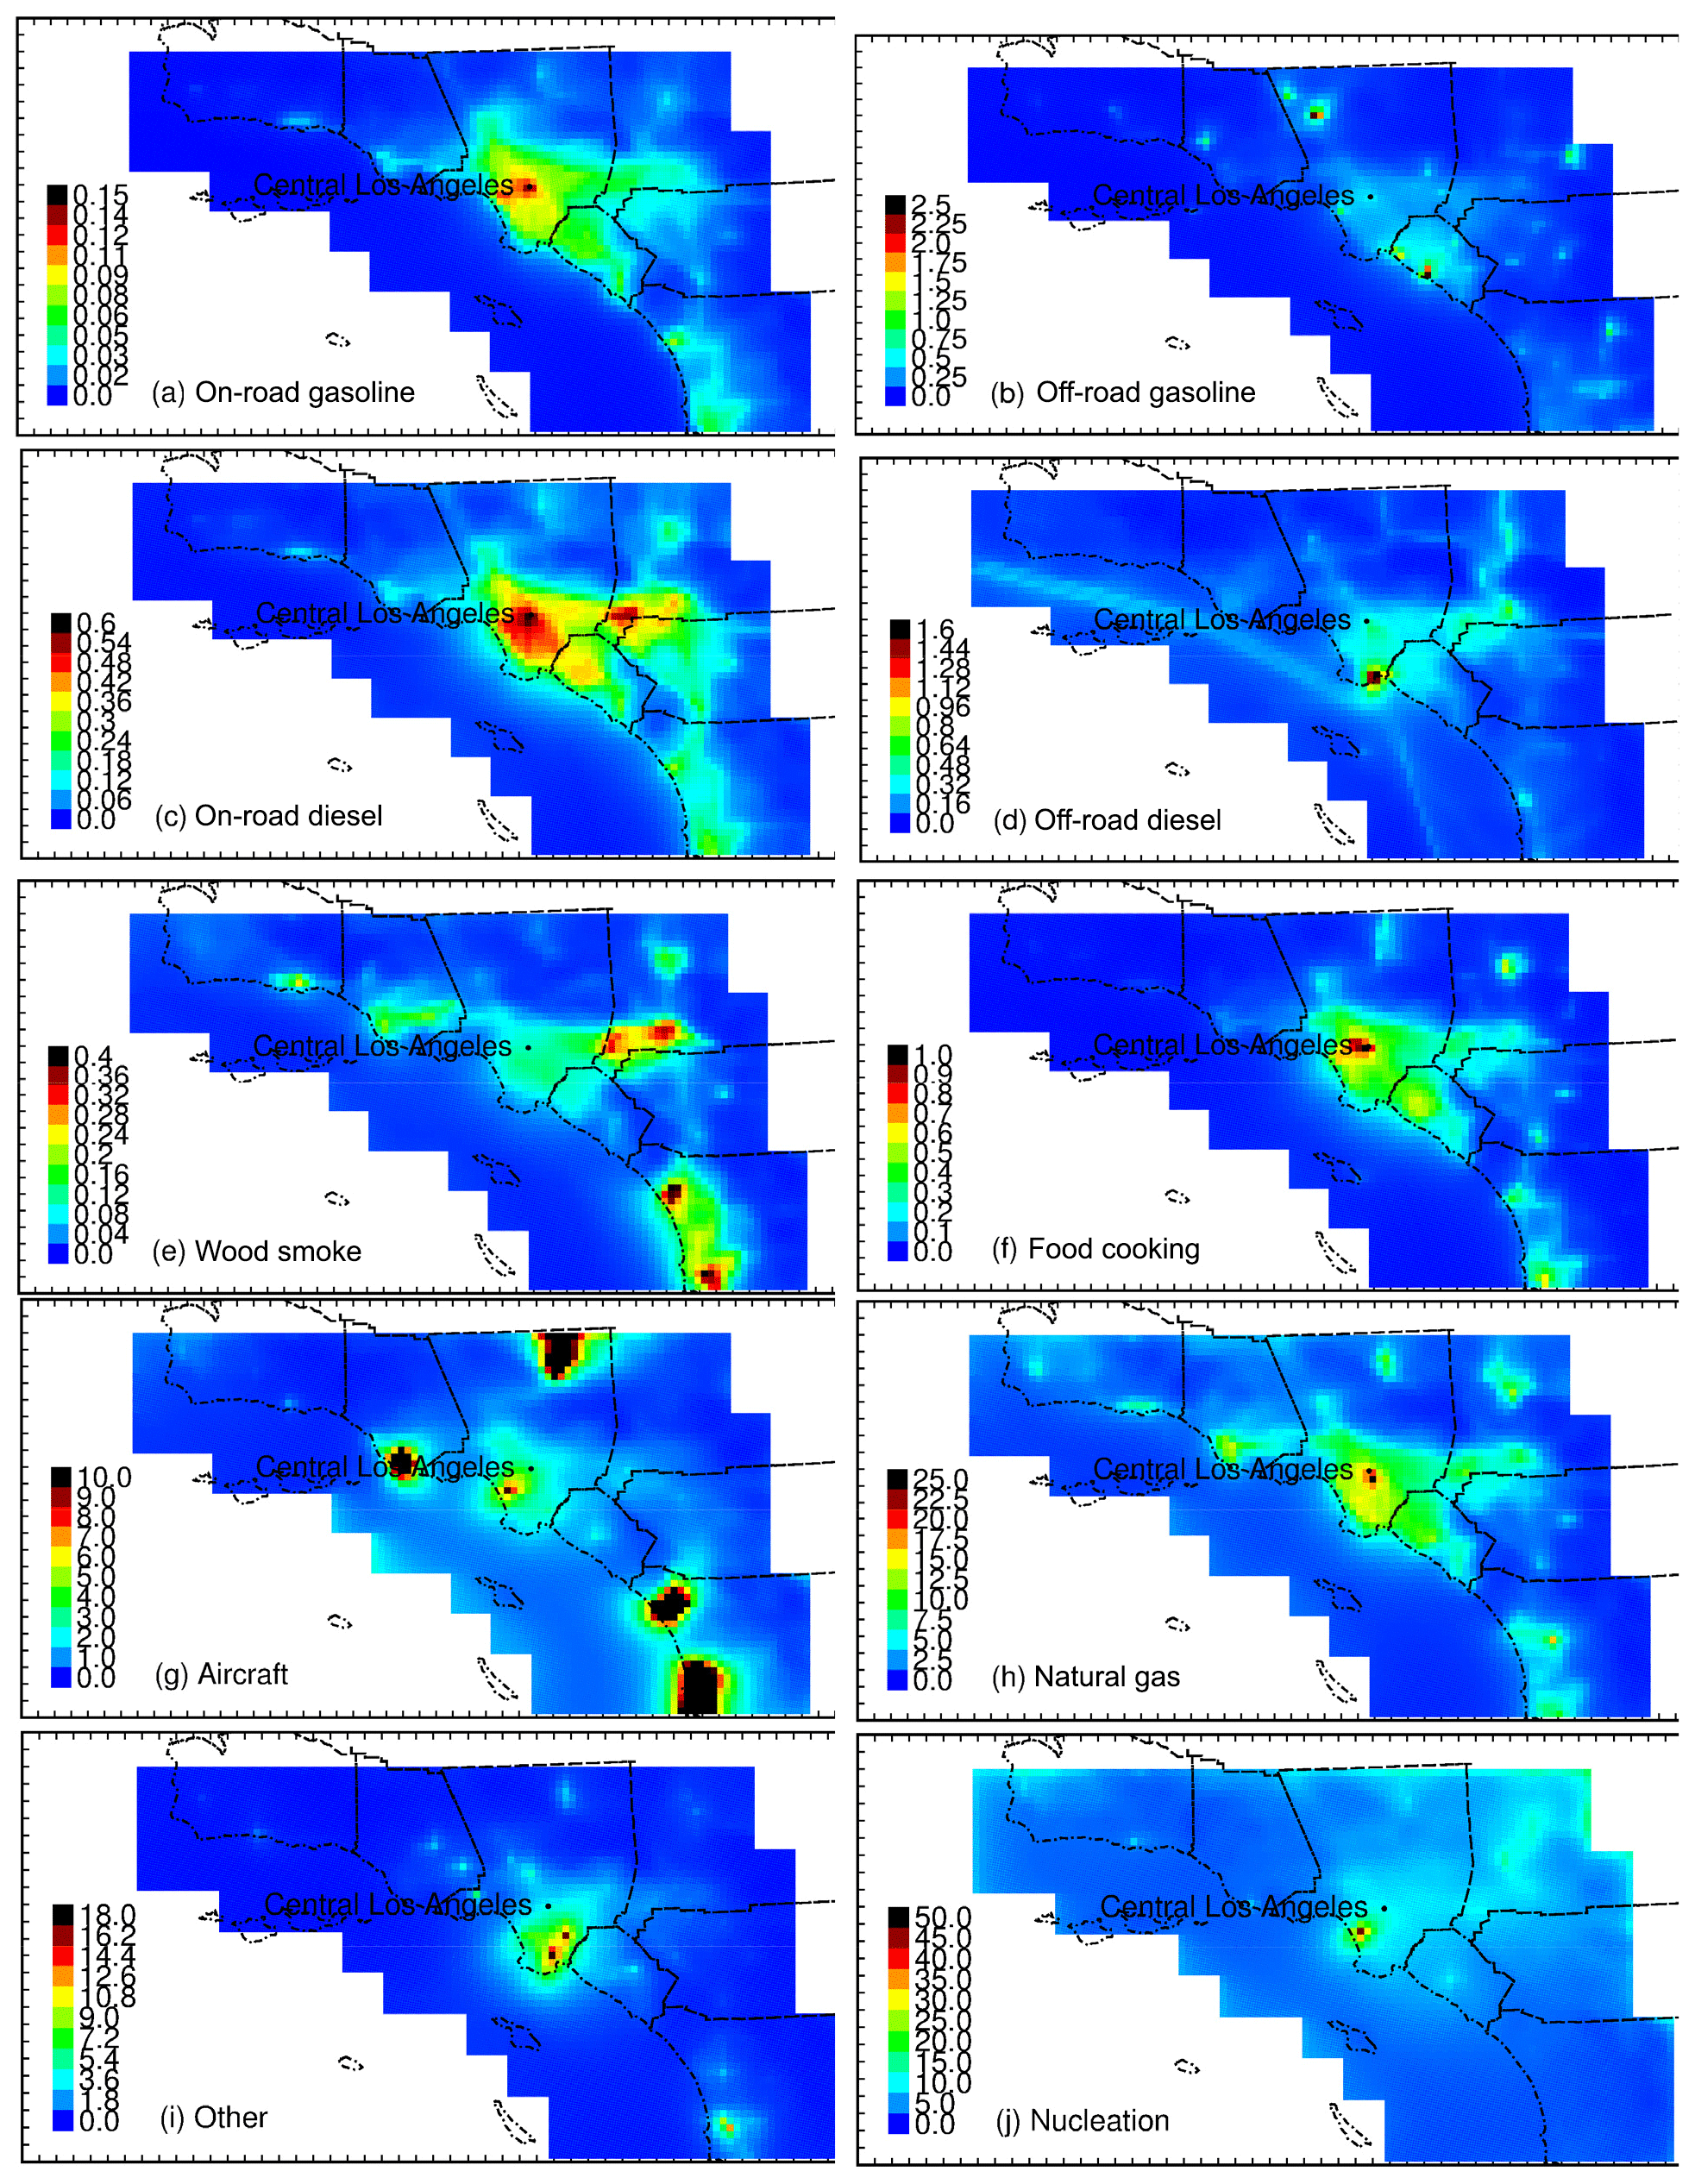
Figure 18Spatial distribution of particle number from major sources in southern California (unit: k counts cm−3).
Figures 15–17 show diurnal variations of measured N7–1000 and predicted best-fit N10 averaged over days in August and December 2012. These months span the temperature range typically experienced throughout the year in California. Measured N7–1000 diurnal patterns in August generally peak in the afternoon hours between 12:00 and 15:00 LT with an optional morning peak around 06:00 LT. The main afternoon peak appears to be related to nucleation events, while the smaller early morning peak appears to be related to early morning human activity including natural gas combustion. The predicted best-fit N10 diurnal variations in August followed the same trends as measurements at six out of 10 sites (Livermore, Anaheim, Compton, Huntington Park, Inland Valley, and Rubidoux). The model failed to capture the midday nucleation event at Redwood City and Santa Rosa possibly due to missing SO2 sources in the emissions inventory upwind from these sites. The model overestimated midday peak values at Anaheim and central Los Angeles. In December, the measured N7–1000 diurnal pattern was more distinctly bimodal with the first peak around 07:00–08:00 LT and the second peak in the evening at around 20:00 LT. This pattern reflects both the emissions activity and the mixing status of the atmosphere throughout the day. The predicted best-fit N10 concentration follows this same pattern. Nucleation continues to play a role during winter but does not dominate to the point that it produces a midday peak in N10 concentrations. Non-residential natural gas combustion is predicted to be the largest source of N10 during morning and evening peaks. The diurnal profiles of non-residential natural gas emissions are included in the Supplement (Fig. S2) along with the regional distribution of those emissions (Fig. S3). These diurnal variations of the natural gas combustion emissions were obtained directly from the emissions inventory specified by the California Air Resources Board. Industrial natural gas combustion emissions peak during the daytime, with lower values at night. Emissions from electricity generation powered by natural gas peak in the morning and evening. Commercial natural gas combustion emissions may either peak in the morning and evening or they may follow a uniform diurnal profile depending on the specific source and location.
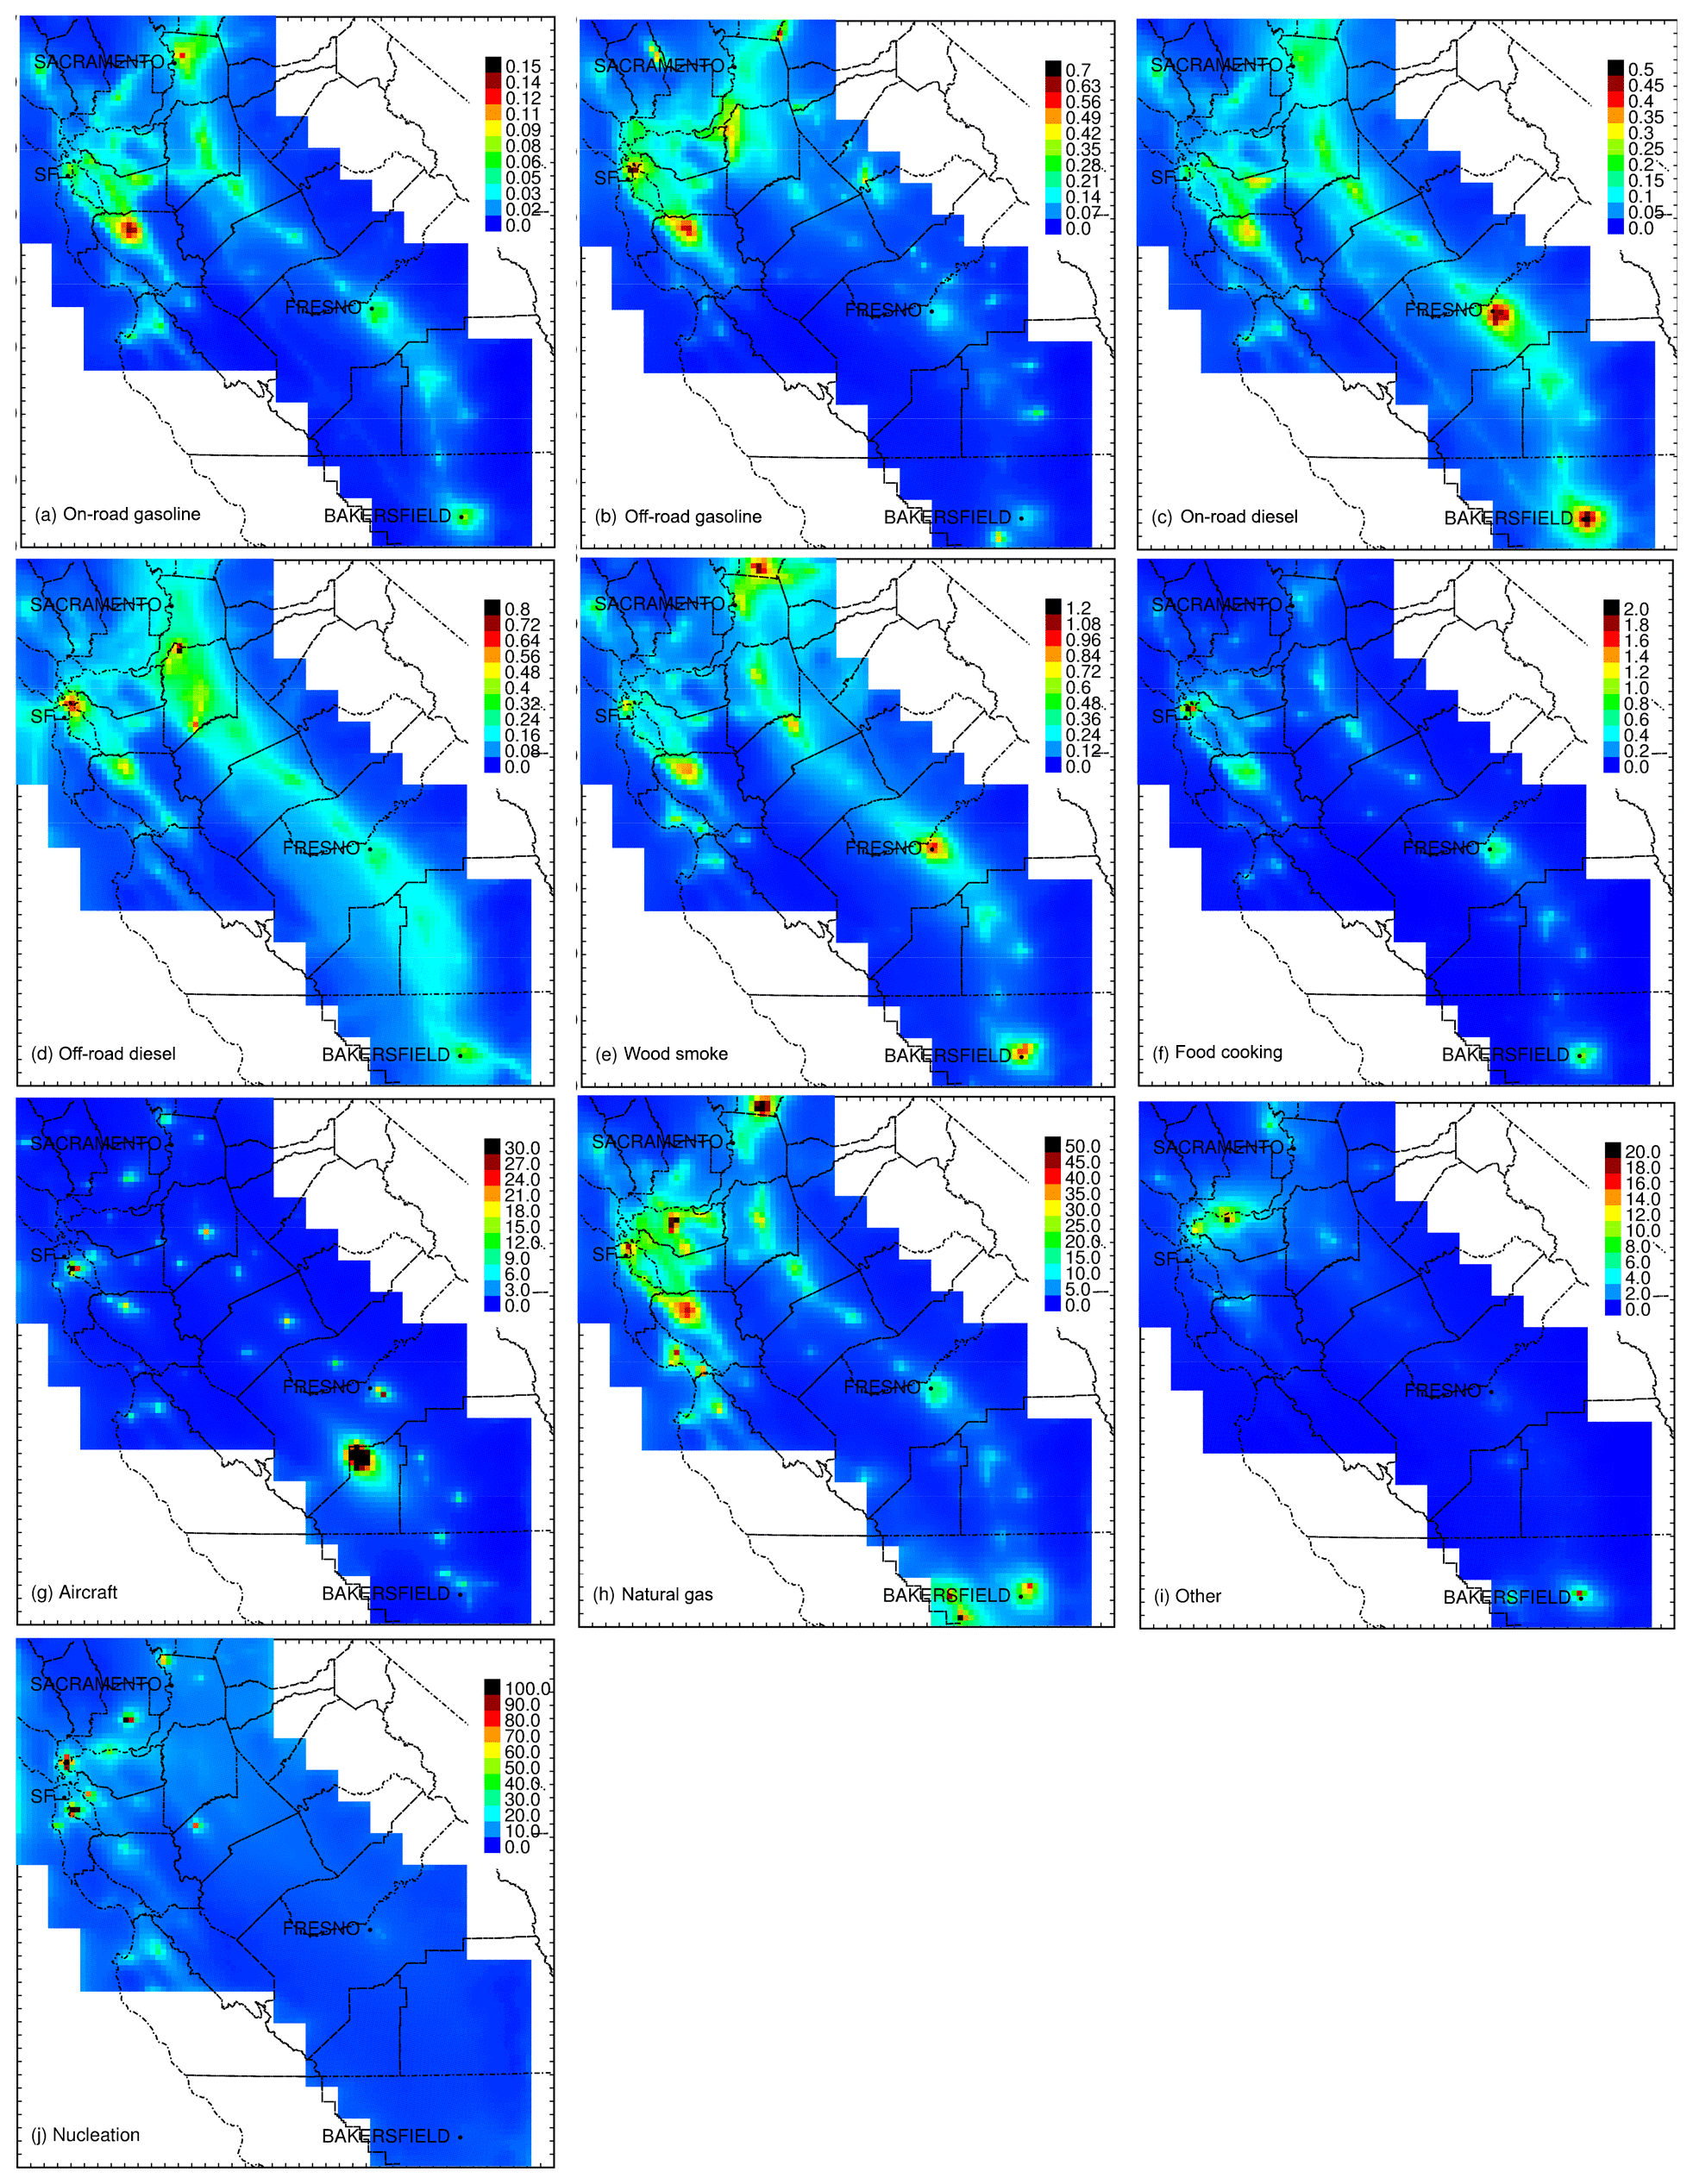
Figure 19Spatial distribution of particle number from major sources in northern California. Units are k counts cm−3).
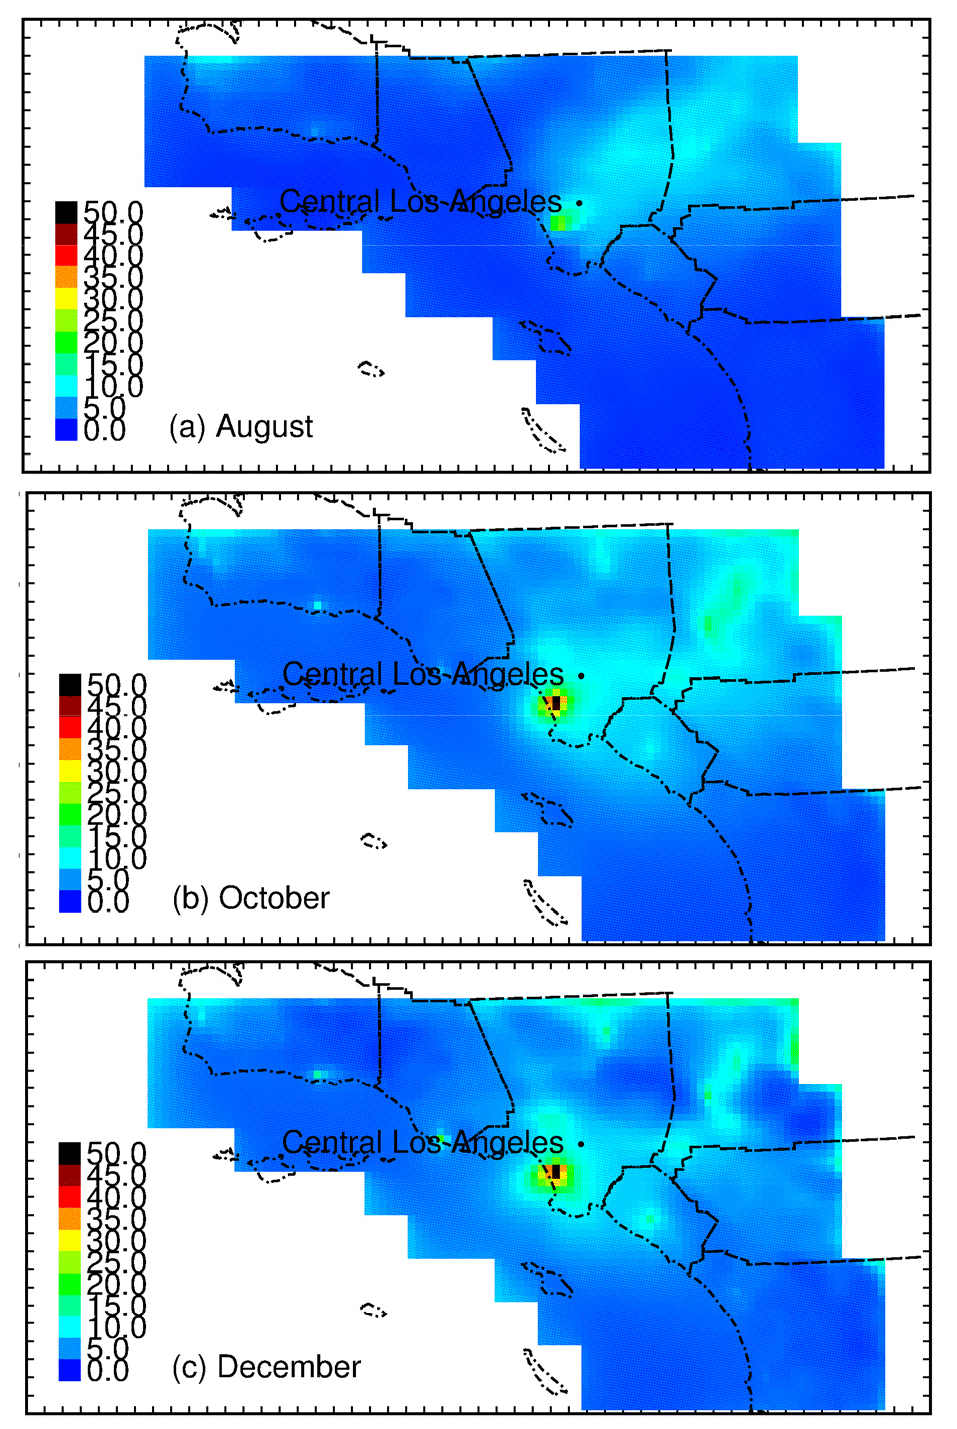
Figure 20Seasonal variation of nucleated particle concentrations in southern California. Units are k counts cm−3.
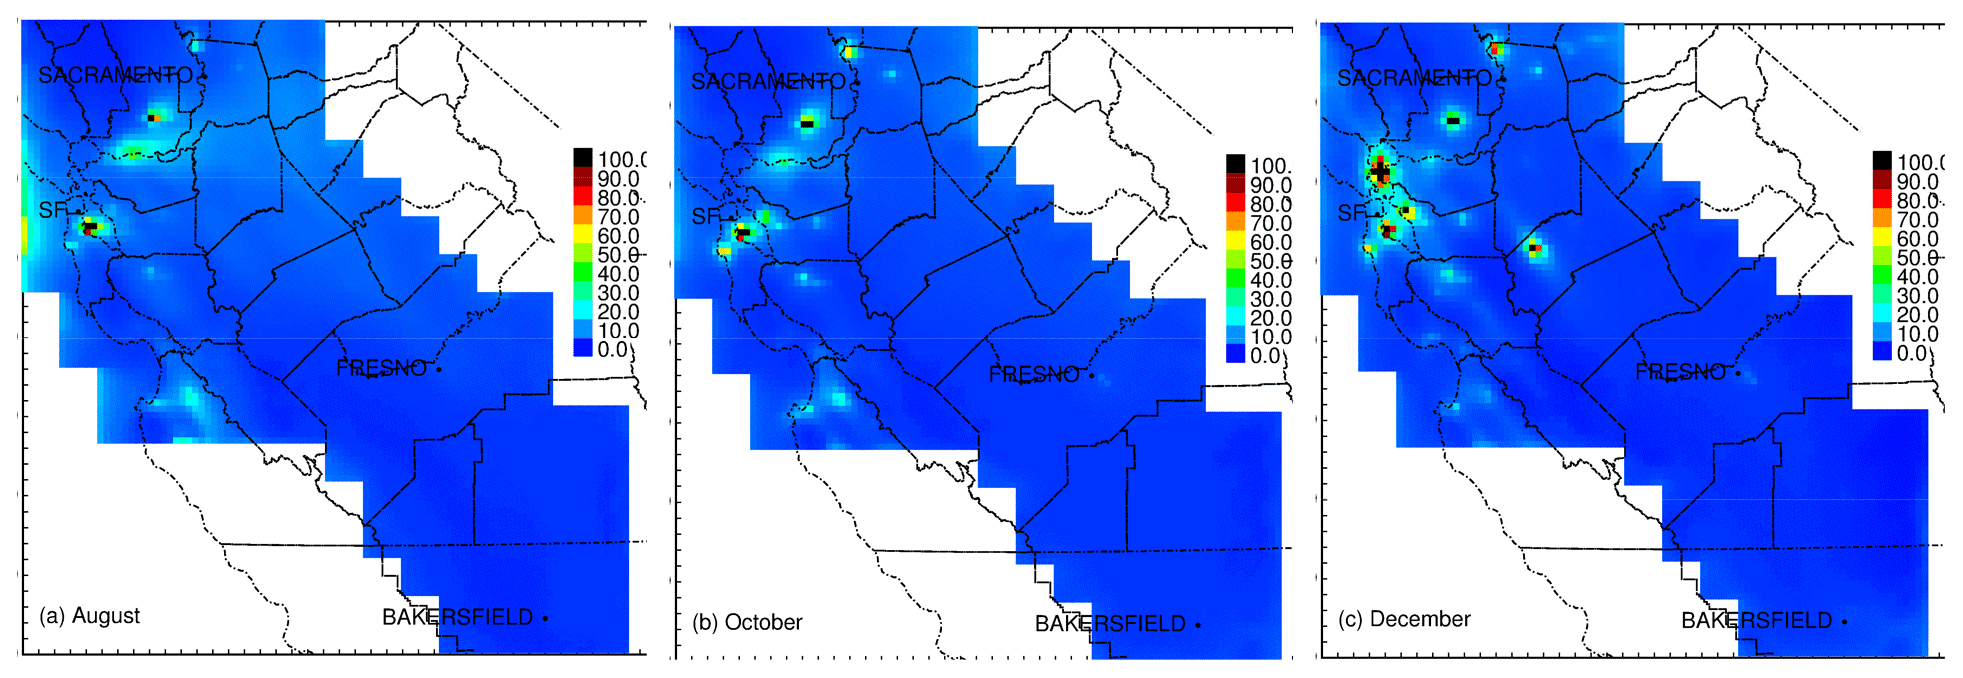
Figure 21Seasonal variation of nucleated particle concentrations in northern California. Units are k counts cm−3.
3.2.3 Regional N10–1000 source contributions in California
Figure 18 illustrates the predicted number concentration associated with primary emissions (Fig. 18a–i) and nucleation (Fig. 18j) in southern California averaged over the months of August–December 2012. Figure 18g shows that primary aircraft emissions in the plume downwind of the Los Angeles International Airport (LAX) are predicted to account for 8 k counts cm−3, and Fig. 18j shows that nucleation of aircraft emissions in the LAX plume is predicted to account for 45 k counts cm−3, yielding a total number concentration associated with LAX aircraft of approximately 53 k counts cm−3. Hudda et al. (2014) found that particle number concentrations increased by a factor of 4–8 downwind of LAX based on measurements in June–July 2013. Total ground-level number concentrations in the LAX plume reached 60–70 k counts cm−3. Given the 4 km spatial resolution of the model calculations used in the current study, the predictions and measurements of particle number concentration downwind of LAX are consistent with one another.
It is noteworthy that military airbases in Fig. 18g have significantly higher particle number concentrations due to their use of aviation fuel with higher sulfur content, but nucleation plumes are not present downwind of these locations (Fig. 18j). Particles emitted from military aircraft are represented as primary emissions in the current model calculations. Future measurements should compare particle number concentrations downwind of civilian and military airports to fully evaluate the impact of aviation fuel sulfur content on ambient ultrafine particle concentrations.
Figure 19 illustrates the predicted particle number concentrations associated with primary sources and nucleation in northern California. The relative importance of sources and the prediction of nucleation downwind of major sulfur emissions are consistent in northern and southern California. Natural gas combustion is a notably strong source of ultrafine particles in both regions due to the widespread use of this fuel in numerous residential, commercial, and industrial applications. In many cases, the natural gas combustion particles contribute strongly to the “urban background” concentrations over most California cities without the formation of individual plumes such as those found downwind of LAX. Future measurements could correlate ambient particle number concentrations and natural gas utilization across multiple cities to evaluate whether natural gas combustion is a significant source of particle number concentration.
The concentrations of nucleated particles in August, October, and December are shown in Figs. 20 (southern California) and 21 (northern California) below. Nucleation events occur in the regions where sulfur emissions are highest (typically airports, shipping ports, and refining facilities). Concentrations of nucleated particles are higher in October and December than in August because colder temperatures increase nucleation rates if the precursor H2SO4 and NH3 concentrations are relatively constant. A significant fraction of the H2SO4 in the current simulation is produced by the fast conversion of gas-phase SO3 emissions to H2SO4 in the exhaust plume near the emissions source. SO3 conversion does not depend on the presence of oxidants in the atmosphere and so the higher oxidant concentrations in the summer do not dominate the seasonal nucleation pattern.
Once H2SO4 forms in the exhaust plumes, it either condenses onto existing particles formed from lower-volatility compounds in the plume, or it mixes with NH3 in the background air and nucleates. This process is captured by dilution source sampling measurements that allow for a few minutes of aging time and so the size-resolved emissions profiles for many sources already account for the effects of nucleation within the “near-field” exhaust plume (within a few tens of meters after emission). SO3 emissions from reciprocating internal combustion engines were therefore set to zero to avoid double counting the new particle formation downwind of these sources in the current study. Regular SO2 emissions from these sources were not modified. Emissions from aircraft jet engines have high exit velocity which promotes rapid mixing with background air. SO3 emissions were left at their nominal levels (3 %–4 % of total SOx) for jet engine aircraft in the current study. The consequence of these model treatments is that predicted concentrations of nucleated particles are highest downwind of LAX, which agrees with measurements of ambient particle number concentrations (Hudda et al., 2014).
Previous researchers have used positive matrix factorization (PMF) to calculate source contributions to N7 (Sowlat et al., 2016; Morawska et al., 2008; Gu et al., 2011; Ogulei et al., 2007; Kasumba et al., 2009; Wang et al., 2013; Yue et al., 2008; Friend et al., 2013). The dominant factors resolved by these studies have been traffic, urban background, secondary aerosol, wood burning, and nucleation (Sowlat et al., 2016; Morawska et al., 2008; Gu et al., 2011; Ogulei et al., 2007; Kasumba et al., 2009; Wang et al., 2013; Yue et al., 2008; Friend et al., 2013). Particles from natural gas combustion were not separately identified by PMF because they do not contain a unique chemical tracer. It is very likely that natural gas combustion particles are artificially lumped into another source (e.g., traffic) or part of the “urban background” signal identified in previous studies. Natural gas combustion is used extensively in California for electric power, industrial, commercial, and residential use (Table S6), and so it seems plausible that this source contributes to ambient UFP concentrations.
The current UFP predictions rely on source profile measurements for wood burning, food cooking, mobile sources, and non-residential natural gas combustion (Cooper, 1989; Harley et al., 1992; Hildemann et al., 1991a, b; Houck et al., 1989; Kleeman et al., 2000, 2008a; Robert et al., 2007a, b; Schauer et al., 1999b, a, 2001, 2002a, b; Taback, 1979). All of these size distributions were measured using appropriate instruments and methods by knowledgeable researchers, but some of these past studies were conducted more than a decade ago. Size distribution information for vehicles, natural gas, etc. has been added to the Supplement (Fig. S4). Changes in fuel composition and emissions control technology in the interim years may have altered the emitted size distributions. New measurements of particle size distributions emitted from natural gas and biomethane combustion were made in parallel with the current project to confirm the source profile measurements from past studies (Xue et al., 2018a). The results of these measurements are consistent with previous size distribution results (Li and Hopke, 1993).
California has tighter air pollution standards than many other regions in the United States due to the severe air quality problems that have historically occurred in the state. California therefore has a unique combination of fuels and emissions control technology that may affect the mixture of sources that contribute to atmospheric ultrafine particle concentrations. Venecek et al. (2019) recently used the UCD/CIT air quality model with the 2011 National Emissions inventory to calculate source contributions to PM0.1 in 39 major cities across the United States during peak summer photochemical smog episodes in the year 2010. The findings from this study show that natural gas combustion is a major source of ultrafine particles in the regional atmosphere over urban areas across the United States. The public health questions associated with ultrafine particles emitted by natural gas combustion have wide-ranging implications. Similar levels of ultrafine particle concentrations will likely occur in other regions across the world that extensively use natural gas as a fuel source, although other sources of ultrafine particles may also make strong contributions depending on the total mix of fuels in each region.
Recent theories suggest that primary particulate matter composed of semi-volatile organic compounds may evaporate after release to the atmosphere, which may reduce ambient Nx. Measurements conducted in parallel with the current study confirmed that particles emitted from natural gas combustion in home appliances partially evaporated when diluted by a factor of 25 in clean air, but particles emitted from reciprocating engines did not evaporate under the same conditions (Xue et al., 2018a). Future work should verify the accuracy of the size and composition distributions for all natural gas combustion sources given their apparent importance for predicted Nx.
Evidence from both toxicology and epidemiology will be required to assess the effect of UFPs on public health. It is essential to identify and quantify UFP sources based on both mass (PM0.1) and Nx during this process (Friend et al., 2013). An accurate comparison of both PM0.1 and Nx exposure could lay the groundwork for specific assessment of health effects of UFPs and potentially more efficient control strategies for PM emission from major sources (Yue et al., 2008). Ideally, spatial exposure patterns for Nx, PM0.1, and PM2.5 will be sufficiently unique to separate their individual effects in epidemiological studies. Regression statistics for different metrics were calculated by using all grid cells in the model domain of the current study. The correlations between the various particle metrics were R2 (PM2.5 vs. N10)=0.35, R2 (PM2.5 vs. PM0.1)=0.63, R2 (PM0.1 vs. N10)=0.75. It seems likely that future epidemiological studies will be able to differentiate between the effects of PM2.5 and Nx based on the low R2 value. The potential for comparisons between PM2.5 and PM0.1 is less clear cut, but previous work helps understand what may be possible. Ostro et al. (2015) compared the associations between ischemic heart disease (IHD) mortality and PM2.5 vs. PM0.1 in the California Teachers Study (CTS) cohort. Associations between IHD mortality and the sum of PM2.5 mass (p value =0.001) were stronger than associations between IHD mortality and the sum of PM0.1 mass (p value =0.01) but individual components of mass (EC, OC, Cu, etc.) all had stronger associations with IHD mortality in the PM0.1 size fraction than the PM2.5 size fraction.
The current study focuses on outdoor exposure to UFPs that may be useful in future epidemiological studies. Indoor or in-vehicle exposure to UFPs can also be significant (Wallace and Ott, 2011; Rim et al., 2010; Bhangar et al., 2011; Weichenthal et al., 2015; Fruin et al., 2008) but characterizing these micro-environments is beyond the scope of the current paper.
The UCD/CIT regional chemical transport model has been updated with a nucleation algorithm and combined with the existing size-resolved source profiles of particulate matter emissions to predict regional source contributions to airborne particle number concentration (N10) and airborne particulate ultrafine mass (PM0.1). The predicted 24 h average N10 follows the same trend as measured N7 at 10 sites across California in summer (August) and winter (December). The predicted diurnal variation of N10 follows the same trend as measured concentrations at the majority of the evaluation sites in August and December, but the results suggest that further refinement is needed for both primary emissions and nucleation algorithms. The predicted PM0.1 source contributions follow the same trends as PM0.1 source contributions measured in a molecular marker study at four sites across California in summer (August) and winter (December) months. Natural gas combustion is the largest primary source of regional N10 at all locations outside of the immediate vicinity of other major combustion sources. Nucleation contributed strongly to particle number during both the summer and winter months. Traffic sources contributed to N10 but did not dominate over regions more than 300 m away from freeways. Combustion sources such as wood burning, food cooking, and mobile sources made stronger contributions to PM0.1 at heavily urbanized locations. Wood burning for home heating had strong seasonal patterns with peak concentrations in winter, while other sources contributed more consistently throughout the seasons. Nucleation made a negligible contribution to PM0.1 over the urban areas at the focus of the current study.
The current study identifies natural gas combustion as an important source of ultrafine particle number and mass concentrations in urban regions throughout California. The health implications of these natural gas combustion particles should be investigated in future epidemiology studies.
All of the PM0.1 and Nx outdoor exposure fields produced in the current study are available free of charge at http://webwolf.engr.ucdavis.edu/data/ (last access: November 2019), which provides a link to the most recent version of the data set (currently http://webwolf.engr.ucdavis.edu/data/soa_v3/hourly_avg/, last access: November 2019). Model source code and model input files are available to collaborators via direct email to the corresponding author at mjkleeman@ucdavis.edu.
The supplement related to this article is available online at: https://doi.org/10.5194/acp-19-14677-2019-supplement.
XY adapted the nucleation algorithm to the UCD/CIT model, performed initial model runs, and wrote the first draft of the text. MV and AK created model inputs and provided comments on the manuscript text. JH provided guidance on model configuration and provided comments on the manuscript text. ST, SC, CT, and DF provided model inputs, facilitated comparisons to ambient measurements, and provided comments on manuscript text. MK debugged model source code, revised model runs in response to reviewer comments, and performed final edits to the manuscript text.
The authors declare that they have no conflict of interest.
The authors thank Jian Xue for providing PM0.1 source apportionment measurements for comparison to model predictions. The authors thank Yiting Li for providing updated emissions data for airports.
This research has been supported by the Bay Area Air Quality Management District (grant no. 2013.218), the Coordinating Research Council (grant no. A-96), and the California Air Resources Board (grant no. 14-314).
This paper was edited by Fangqun Yu and reviewed by three anonymous referees.
Anttila, T. and Kerminen, V. M.: Condensational growth of atmospheric nuclei by organic vapours, J. Aerosol Sci., 34, 41–61, https://doi.org/10.1016/s0021-8502(02)00155-6, 2003.
Bhangar, S., Mullen, N. A., Hering, S. V., Kreisberg, N. M., and Nazaroff, W. W.: Ultrafine particle concentrations and exposures in seven residences in northern California, Indoor Air, 21, 132–144, https://doi.org/10.1111/j.1600-0668.2010.00689.x, 2011.
Boylan, J. W. and Russell, A. G.: PM and light extinction model performance metrics, goals, and criteria for three-dimensional air quality models, Atmos. Environ., 40, 4946–4959, https://doi.org/10.1016/j.atmosenv.2005.09.087, 2006.
Brunekreef, B. and Forsberg, B.: Epidemiological evidence of effects of coarse airborne particles on health, Eur. Respir. J., 26, 309–318, 2005.
Chen, J. J., Ying, Q., and Kleeman, M. J.: Source apportionment of wintertime secondary organic aerosol during the California regional PM10/PM2.5 air quality study, Atmos. Environ., 44, 1331–1340, 2010.
Cooper, J. A. E. A.: Dinal AppendixV-G,PM10 source composition library for the South Coast Air Basin, South Coast Air Quality Management District, Diamond Bar, California, 1989.
Dockery, D. W. and Stone, P. H.: Cardiovascular risks from fine particulate air pollution, New Engl. J. Med., 356, 511–513, 2007.
Dunne, E. M., Gordon, H., Kurten, A., Almeida, J., Duplissy, J., Williamson, C., Ortega, I. K., Pringle, K. J., Adamov, A., Baltensperger, U., Barmet, P., Benduhn, F., Bianchi, F., Breitenlechner, M., Clarke, A., Curtius, J., Dommen, J., Donahue, N. M., Ehrhart, S., Flagan, R. C., Franchin, A., Guida, R., Hakala, J., Hansel, A., Heinritzi, M., Jokinen, T., Kangasluoma, J., Kirkby, J., Kulmala, M., Kupc, A., Lawler, M. J., Lehtipalo, K., Makhmutov, V., Mann, G., Mathot, S., Merikanto, J., Miettinen, P., Nenes, A., Onnela, A., Rap, A., Reddington, C. L. S., Riccobono, F., Richards, N. A. D., Rissanen, M. P., Rondo, L., Sarnela, N., Schobesberger, S., Sengupta, K., Simon, M., Sipilaa, M., Smith, J. N., Stozkhov, Y., Tome, A., Trostl, J., Wagner, P. E., Wimmer, D., Winkler, P. M., Worsnop, D. R., and Carslaw, K. S.: Global atmospheric particle formation from CERN CLOUD measurements, Science, 354, 1119–1124, https://doi.org/10.1126/science.aaf2649, 2016.
Elleman, R. A. and Covert, D. S.: Aerosol size distribution modeling with the Community Multiscale Air Quality modeling system in the Pacific Northwest: 2. Parameterizations for ternary nucleation and nucleation mode processes, J. Geophys. Res.-Atmos., 114, D11207, https://doi.org/10.1029/2009JD012187, 2009a.
Elleman, R. A. and Covert, D. S.: Aerosol size distribution modeling with the Community Multiscale Air Quality modeling system in the Pacific Northwest: 1. Model comparison to observations, J. Geophys. Res.-Atmos., 114, D11206, https://doi.org/10.1029/2008JD010791, 2009b.
Fann, N., Lamson, A. D., Anenberg, S. C., Wesson, K., Risley, D., and Hubbell, B. J.: Estimating the National Public Health Burden Associated with Exposure to Ambient PM2.5 and Ozone, Risk Anal., 32, 81–95, 2012.
Fanourgakis, G. S., Kanakidou, M., Nenes, A., Bauer, S. E., Bergman, T., Carslaw, K. S., Grini, A., Hamilton, D. S., Johnson, J. S., Karydis, V. A., Kirkevåg, A., Kodros, J. K., Lohmann, U., Luo, G., Makkonen, R., Matsui, H., Neubauer, D., Pierce, J. R., Schmale, J., Stier, P., Tsigaridis, K., van Noije, T., Wang, H., Watson-Parris, D., Westervelt, D. M., Yang, Y., Yoshioka, M., Daskalakis, N., Decesari, S., Gysel-Beer, M., Kalivitis, N., Liu, X., Mahowald, N. M., Myriokefalitakis, S., Schrödner, R., Sfakianaki, M., Tsimpidi, A. P., Wu, M., and Yu, F.: Evaluation of global simulations of aerosol particle and cloud condensation nuclei number, with implications for cloud droplet formation, Atmos. Chem. Phys., 19, 8591–8617, https://doi.org/10.5194/acp-19-8591-2019, 2019.
Friend, A. J., Ayoko, G. A., Jager, D., Wust, M., Jayaratne, E. R., Jamriska, M., and Morawska, L.: Sources of ultrafine particles and chemical species along a traffic corridor: comparison of the results from two receptor models, Environ. Chem., 10, 54–63, 2013.
Fruin, S., Westerdahl, D., Sax, T., Sioutas, C., and Fine, P. M.: Measurements and predictors of on-road ultrafine particle concentrations and associated pollutants in Los Angeles, Atmos. Environ., 42, 207–219, https://doi.org/10.1016/j.atmosenv.2007.09.057, 2008.
Gauderman, W. J., Urman, R., Avol, E., Berhane, K., McConnell, R., Rappaport, E., Chang, R., Lurmann, F., and Gilliland, F.: Association of Improved Air Quality with Lung Development in Children, New Engl. J. Med., 372, 905–913, 2015.
Gu, J. W., Pitz, M., Schnelle-Kreis, J., Diemer, J., Reller, A., Zimmermann, R., Soentgen, J., Stoelzel, M., Wichmann, H. E., Peters, A., and Cyrys, J.: Source apportionment of ambient particles: Comparison of positive matrix factorization analysis applied to particle size distribution and chemical composition data, Atmos. Environ., 45, 1849–1857, 2011.
Harley, R. A., Hannigan, M. P., and Cass, G. R.: Respeciation of Organic Gas Emissions and the Detection of Excess Unburned Gasoline in the Atmosphere, Environ. Sci. Technol., 26, 2395–2408, https://doi.org/10.1021/es00036a010, 1992.
Held, T., Ying, Q., Kaduwela, A., and Kleeman, M.: Modeling particulate matter in the San Joaquin Valley with a source-oriented externally mixed three-dimensional photochemical grid model, Atmos. Environ., 38, 3689–3711, 2004.
Held, T., Ying, Q., Kleeman, M. J., Schauer, J. J., and Fraser, M. P.: A comparison of the UCD/CIT air quality model and the CMB source-receptor model for primary airborne particulate matter, Atmos. Environ., 39, 2281–2297, 2005.
Hildemann, L. M., Markowski, G. R., and Cass, G. R.: Chemical-Composition of Emissions from Urban Sources of Fine Organic Aerosol, Environ. Sci. Technol., 25, 744–759, https://doi.org/10.1021/es00016a021, 1991a.
Hildemann, L. M., Markowski, G. R., Jones, M. C., and Cass, G. R.: Submicrometer Aerosol Mass Distributions of Emissions from Boilers, Fireplaces, Automobiles, Diesel Trucks, and Meat-Cooking Operations, Aerosol Sci. Tech., 14, 138–152, https://doi.org/10.1080/02786829108959478, 1991b.
Hixson, M., Mahmud, A., Hu, J. L., Bai, S., Niemeier, D. A., Handy, S. L., Gao, S. Y., Lund, J. R., Sullivan, D. C., and Kleeman, M. J.: Influence of regional development policies and clean technology adoption on future air pollution exposure, Atmos. Environ., 44, 552–562, 2010.
Hixson, M., Mahmud, A., Hu, J., and Kleeman, M. J.: Resolving the interactions between population density and air pollution emissions controls in the San Joaquin Valley, USA, J. Air Waste Manage., 62, 566–575, https://doi.org/10.1080/10962247.2012.663325, 2012.
Houck, J. E., Chow, J. C., Watson, J. G., Simons, C. A., Prichett,, and L. C., G., J. M., and Frazier, C. A.: Determination of particle size distribution and chemical composition of particulate matter from selected sources in California, California Air Resources Board, OMNI Environment Service Incorporate, Desert Research Institute, Beaverton, Oregon, 1989.
Hu, J., Howard, C. J., Mitloehner, F., Green, P. G., and Kleeman, M. J.: Mobile source and livestock feed contributions to regional ozone formation in Central California, Environ. Sci. Technol., 46, 2781–2789, https://doi.org/10.1021/es203369p, 2012.
Hu, J., Zhang, H., Chen, S., Ying, Q., Wiedinmyer, C., Vandenberghe, F., and Kleeman, M. J.: Identifying PM2.5 and PM0.1 sources for epidemiological studies in California, Environ. Sci. Technol., 48, 4980–4990, https://doi.org/10.1021/es404810z, 2014a.
Hu, J., Zhang, H., Chen, S. H., Wiedinmyer, C., Vandenberghe, F., Ying, Q., and Kleeman, M. J.: Predicting primary PM2.5 and PM0.1 trace composition for epidemiological studies in California, Environ. Sci. Technol., 48, 4971–4979, https://doi.org/10.1021/es404809j, 2014b.
Hu, J., Zhang, H., Ying, Q., Chen, S.-H., Vandenberghe, F., and Kleeman, M. J.: Long-term particulate matter modeling for health effect studies in California – Part 1: Model performance on temporal and spatial variations, Atmos. Chem. Phys., 15, 3445–3461, https://doi.org/10.5194/acp-15-3445-2015, 2015.
Hu, J., Jathar, S., Zhang, H., Ying, Q., Chen, S.-H., Cappa, C. D., and Kleeman, M. J.: Long-term particulate matter modeling for health effect studies in California – Part 2: Concentrations and sources of ultrafine organic aerosols, Atmos. Chem. Phys., 17, 5379–5391, https://doi.org/10.5194/acp-17-5379-2017, 2017.
Hudda, N., Gould, T., Hartin, K., Larson, T. V., and Fruin, S. A.: Emissions from an International Airport Increase Particle Number Concentrations 4-fold at 10 km Downwind, Environ. Sci. Technol., 48, 6628–6635, https://doi.org/10.1021/es5001566, 2014.
Jung, J. G., Pandis, S. N., and Adams, P. J.: Evaluation of nucleation theories in a sulfur-rich environment, Aerosol Sci. Tech., 42, 495–504, 2008.
Jung, J. G., Fountoukis, C., Adams, P. J., and Pandis, S. N.: Simulation of in situ ultrafine particle formation in the eastern United States using PMCAMx-UF, J. Geophys. Res.-Atmos., 115, D03203, https://doi.org/10.1029/2009JD012313, 2010.
Kasumba, J., Hopke, P. K., Chalupa, D. C., and Utell, M. J.: Comparison of sources of submicron particle number concentrations measured at two sites in Rochester, NY, Sci. Total Environ., 407, 5071–5084, 2009.
Kerminen, V. M. and Kulmala, M.: Analytical formulae connecting the “real” and the “apparent” nucleation rate and the nuclei number concentration for atmospheric nucleation events, J. Aerosol Sci., 33, 609–622, 2002.
Kleeman, M. J. and Cass, G. R.: Source contributions to the size and composition distribution of urban particulate air pollution, Atmos. Environ., 32, 2803–2816, 1998.
Kleeman, M. J. and Cass, G. R.: A 3D Eulerian source-oriented model for an externally mixed aerosol, Environ. Sci. Technol., 35, 4834–4848, 2001.
Kleeman, M. J., Cass, G. R., and Eldering, A.: Modeling the airborne particle complex as a source-oriented external mixture, J. Geophys. Res.-Atmos., 102, 21355–21372, 1997.
Kleeman, M. J., Schauer, J. J., and Cass, G. R.: Size and composition distribution of fine particulate matter emitted from wood burning, meat charbroiling, and cigarettes, Environ. Sci. Technol., 33, 3516–3523, https://doi.org/10.1021/es981277q, 1999.
Kleeman, M. J., Schauer, J. J., and Cass, G. R.: Size and composition distribution of fine particulate matter emitted from motor vehicles, Environ. Sci. Technol., 34, 1132–1142, https://doi.org/10.1021/es981276y, 2000.
Kleeman, M. J., Ying, Q., Lu, J., Mysliwiec, M. J., Griffin, R. J., Chen, J. J., and Clegg, S.: Source apportionment of secondary organic aerosol during a severe photochemical smog episode, Atmos. Environ., 41, 576–591, 2007.
Kleeman, M. J., Robert, M. A., Riddle, S. G., Fine, P. M., Hays, M. D., Schauer, J. J., and Hannigan, M. P.: Size distribution of trace organic species emitted from biomass combustion and meat charbroiling, Atmos. Environ., 42, 3059–3075, https://doi.org/10.1016/j.atmosenv.2007.12.044, 2008a.
Kleeman, M. J., Robert, M. A., Riddle, S. G., Fine, P. M., Hays, M. D., Schauer, J. J., and Hannigan, M. P.: Size distribution of trace organic species emitted from biomass combustion and meat charbroiling, Atmos. Environ., 42, 6152–6154, 2008b.
Kuwayama, T., Collier, S., Forestieri, S., Brady, J. M., Bertram, T. H., Cappa, C. D., Zhang, Q., and Kleeman, M. J.: Volatility of Primary Organic Aerosol Emitted from Light Duty Gasoline Vehicles, Environ. Sci. Technol., 49, 1569–1577, 2015.
Laurent, O., Hu, J., Li, L., Kleeman, M. J., Bartell, S. M., Cockburn, M., Escobedo, L., and Wu, J.: A Statewide Nested Case-Control Study of Preterm Birth and Air Pollution by Source and Composition: California, 2001–2008, Environ. Health Persp., 124, 1479–1486, https://doi.org/10.1289/ehp.1510133, 2016.
Li, N., Sioutas, C., Cho, A., Schmitz, D., Misra, C., Sempf, J., Wang, M. Y., Oberley, T., Froines, J., and Nel, A.: Ultrafine particulate pollutants induce oxidative stress and mitochondrial damage, Environ. Health Persp., 111, 455–460, 2003.
Li, W. and Hopke, P. K.: Initial Size Distributions and Hygroscopicity of Indoor Combustion Aerosol Particles, Aerosol Sci. Tech., 19, 305–316, https://doi.org/10.1080/02786829308959638, 1993.
Lupascu, A., Easter, R., Zaveri, R., Shrivastava, M., Pekour, M., Tomlinson, J., Yang, Q., Matsui, H., Hodzic, A., Zhang, Q., and Fast, J. D.: Modeling particle nucleation and growth over northern California during the 2010 CARES campaign, Atmos. Chem. Phys., 15, 12283–12313, https://doi.org/10.5194/acp-15-12283-2015, 2015.
Mahmud, A., Hixson, M., Hu, J., Zhao, Z., Chen, S.-H., and Kleeman, M. J.: Climate impact on airborne particulate matter concentrations in California using seven year analysis periods, Atmos. Chem. Phys., 10, 11097–11114, https://doi.org/10.5194/acp-10-11097-2010, 2010.
May, A. A., Levin, E. J. T., Hennigan, C. J., Riipinen, I., Lee, T., Collett, J. L., Jimenez, J. L., Kreidenweis, S. M., and Robinson, A. L.: Gas-particle partitioning of primary organic aerosol emissions: 3. Biomass burning, J. Geophys. Res.-Atmos., 118, 11327–11338, 2013a.
May, A. A., Presto, A. A., Hennigan, C. J., Nguyen, N. T., Gordon, T. D., and Robinson, A. L.: Gas-particle partitioning of primary organic aerosol emissions: (1) Gasoline vehicle exhaust, Atmos. Environ., 77, 128–139, 2013b.
Mazaheri, M., Johnson, G. R., and Morawska, L.: Particle and Gaseous Emissions from Commercial Aircraft at Each Stage of the Landing and Takeoff Cycle, Environ. Sci. Technol., 43, 441–446, https://doi.org/10.1021/es8013985, 2009.
Miller, K. A., Siscovick, D. S., Sheppard, L., Shepherd, K., Sullivan, J. H., Anderson, G. L., and Kaufman, J. D.: Long-term exposure to air pollution and incidence of cardiovascular events in women, New Engl. J. Med., 356, 447–458, 2007.
Montagne, D. R., Hoek, G., Klompmaker, J. O., Wang, M., Meliefste, K., and Brunekreef, B.: Land Use Regression Models for Ultrafine Particles and Black Carbon Based on Short-Term Monitoring Predict Past Spatial Variation, Environ. Sci. Technol., 49, 8712–8720, 2015.
Morawska, L., Ristovski, Z., Jayaratne, E. R., Keogh, D. U., and Ling, X.: Ambient nano and ultrafine particles from motor vehicle emissions: Characteristics, ambient processing and implications on human exposure, Atmos. Environ., 42, 8113–8138, 2008.
Mysliwiec, M. J. and Kleeman, M. J.: Source apportionment of secondary airborne particulate matter in a polluted atmospbere, Environ. Sci. Technol., 36, 5376–5384, 2002.
Napari, I., Noppel, M., Vehkamaki, H., and Kulmala, M.: Parametrization of ternary nucleation rates for H(2)SO(4)-NH(3)-H(2)O vapors, J. Geophys. Res.-Atmos., 107, 4381, https://doi.org/10.1029/2002JD002132, 2002.
Nel, A., Xia, T., Madler, L., and Li, N.: Toxic potential of materials at the nanolevel Science, Science, 311, 622–627, 2006.
Oberdorster, G., Sharp, Z., Atudorei, V., Elder, A., Gelein, R., Lunts, A., Kreyling, W., and Cox, C.: Extrapulmonary translocation of ultrafine carbon particles following whole-body inhalation exposure of rats, J. Toxicol. Env. Heal. A, 65, 1531–1543, 2002.
Ogulei, D., Hopke, P. K., Chalupa, D. C., and Utell, M. J.: Modeling source contributions to submicron particle number concentrations measured in Rochester, New York, Aerosol Sci. Tech., 41, 179–201, 2007.
Ostro, B., Broadwin, R., Green, S., Feng, W. Y., and Lipsett, M.: Fine particulate air pollution and mortality in nine California counties: Results from CALFINE, Environ. Health Persp., 114, 29–33, 2006.
Ostro, B., Lipsett, M., Reynolds, P., Goldberg, D., Hertz, A., Garcia, C., Henderson, K. D., and Bernstein, L.: Long-Term Exposure to Constituents of Fine Particulate Air Pollution and Mortality: Results from the California Teachers Study, Environ. Health Persp., 118, 363–369, 2010.
Ostro, B., Hu, J., Goldberg, D., Reynolds, P., Hertz, A., Bernstein, L., and Kleeman, M. J.: Associations of mortality with long-term exposures to fine and ultrafine particles, species and sources: results from the California Teachers Study Cohort, Environ. Health Persp., 123, 549–556, https://doi.org/10.1289/ehp.1408565, 2015.
Otte, T. L.: The impact of nudging in the meteorological model for retrospective air quality simulations. Part II: Evaluating collocated meteorological and air quality observations, J. Appl. Meteorol. Clim., 47, 1868–1887, https://doi.org/10.1175/2007jamc1791.1, 2008a.
Otte, T. L.: The impact of nudging in the meteorological model for retrospective air quality simulations. Part I: Evaluation against national observation networks, J. Appl. Meteorol. Clim., 47, 1853–1867, https://doi.org/10.1175/2007jamc1790.1, 2008b.
Pope, C. A., Burnett, R. T., Thun, M. J., Calle, E. E., Krewski, D., Ito, K., and Thurston, G. D.: Lung cancer, cardiopulmonary mortality, and long-term exposure to fine particulate air pollution, JAMA-J. Am. Med. Assoc., 287, 1132–1141, 2002.
Pope, C. A., Burnett, R. T., Thurston, G. D., Thun, M. J., Calle, E. E., Krewski, D., and Godleski, J. J.: Cardiovascular mortality and long-term exposure to particulate air pollution – Epidemiological evidence of general pathophysiological pathways of disease, Circulation, 109, 71–77, 2004.
Pope, C. A., Ezzati, M., and Dockery, D. W.: Fine-Particulate Air Pollution and Life Expectancy in the United States, New Engl. J. Med., 360, 376–386, 2009.
Rasmussen, D. J., Hu, J. L., Mahmud, A., and Kleeman, M. J.: The Ozone-Climate Penalty: Past, Present, and Future, Environ. Sci. Technol., 47, 14258–14266, 2013.
Rim, D. H., Wallace, L., and Persily, A.: Infiltration of Outdoor Ultrafine Panicles into a Test House, Environ. Sci. Technol., 44, 5908–5913, 2010.
Robert, M. A., Kleeman, M. J., and Jakober, C. A.: Size and composition distributions of particulate matter emissions: Part 2- Heavy-duty diesel vehicles, J. Air Waste Manage., 57, 1429–1438, 2007a.
Robert, M. A., VanBergen, S., Kleeman, M. J., and Jakober, C. A.: Size and composition distributions of particulate matter emissions: Part 1 – Light-duty gasoline vehicles, J. Air Waste Manage., 57, 1414–1428, 2007b.
Schauer, J. J., Kleeman, M. J., Cass, G. R., and Simoneit, B. R. T.: Measurement of emissions from air pollution sources. 2. C-1 through C-30 organic compounds from medium duty diesel trucks, Environ. Sci. Technol., 33, 1578–1587, https://doi.org/10.1021/es980081n, 1999a.
Schauer, J. J., Kleeman, M. J., Cass, G. R., and Simoneit, B. R. T.: Measurement of emissions from air pollution sources. 1. C-1 through C-29 organic compounds from meat charbroiling, Environ. Sci. Technol., 33, 1566–1577, https://doi.org/10.1021/es980076j, 1999b.
Schauer, J. J., Kleeman, M. J., Cass, G. R., and Simoneit, B. R. T.: Measurement of emissions from air pollution sources. 3. C-1-C-29 organic compounds from fireplace combustion of wood, Environ. Sci. Technol., 35, 1716–1728, https://doi.org/10.1021/es001331e, 2001.
Schauer, J. J., Kleeman, M. J., Cass, G. R., and Simoneit, B. R. T.: Measurement of emissions from air pollution sources. 4. C-1-C-27 organic compounds from cooking with seed oils, Environ. Sci. Technol., 36, 567–575, https://doi.org/10.1021/es002053m, 2002a.
Schauer, J. J., Kleeman, M. J., Cass, G. R., and Simoneit, B. R. T.: Measurement of emissions from air pollution sources. 5. C-1-C-32 organic compounds from gasoline-powered motor vehicles, Environ. Sci. Technol., 36, 1169–1180, https://doi.org/10.1021/es0108077, 2002b.
Shet, C. S., Cholemari, M. R., and Veeravalli, S. V.: Eulerian spatial and temporal autocorrelations: assessment of Taylor's hypothesis and a model, J. Turbul., 18, 1–15, https://doi.org/10.1080/14685248.2017.1357823, 2017.
Sioutas, C., Delfino, R. J., and Singh, M.: Exposure assessment for atmospheric ultrafine particles (UFPs) and implications in epidemiologic research, Environ. Health Persp., 113, 947–955, 2005.
Sowlat, M. H., Hasheminassab, S., and Sioutas, C.: Source apportionment of ambient particle number concentrations in central Los Angeles using positive matrix factorization (PMF), Atmos. Chem. Phys., 16, 4849–4866, https://doi.org/10.5194/acp-16-4849-2016, 2016.
Taback, H. J., Brienza, A. R., Macko, J., and Brunetz, N.: Fine particle emissions from stationary and miscellaneous sources in the South Coast Air Basin, KVB Report 5806-783, KVB Incorporated, Tustin, California, 1979.
Trostl, J., Chuang, W. K., Gordon, H., Heinritzi, M., Yan, C., Molteni, U., Ahlm, L., Frege, C., Bianchi, F., Wagner, R., Simon, M., Lehtipalo, K., Williamson, C., Craven, J. S., Duplissy, J., Adamov, A., Almeida, J., Bernhammer, A. K., Breitenlechner, M., Brilke, S., Dias, A., Ehrhart, S., Flagan, R. C., Franchin, A., Fuchs, C., Guida, R., Gysel, M., Hansel, A., Hoyle, C. R., Jokinen, T., Junninen, H., Kangasluoma, J., Keskinen, H., Kim, J., Krapf, M., Kurten, A., Laaksonen, A., Lawler, M., Leiminger, M., Mathot, S., Mohler, O., Nieminen, T., Onnela, A., Petaja, T., Piel, F. M., Miettinen, P., Rissanen, M. P., Rondo, L., Sarnela, N., Schobesberger, S., Sengupta, K., Sipila, M., Smith, J. N., Steiner, G., Tome, A., Virtanen, A., Wagner, A. C., Weingartner, E., Wimmer, D., Winkler, P. M., Ye, P. L., Carslaw, K. S., Curtius, J., Dommen, J., Kirkby, J., Kulmala, M., Riipinen, I., Worsnop, D. R., Donahue, N. M., and Baltensperger, U.: The role of low-volatility organic compounds in initial particle growth in the atmosphere, Nature, 533, 527–531, https://doi.org/10.1038/nature18271, 2016.
Venecek, M. A., Yu, X., and Kleeman, M. J.: Predicted ultrafine particulate matter source contribution across the continental United States during summertime air pollution events, Atmos. Chem. Phys., 19, 9399–9412, https://doi.org/10.5194/acp-19-9399-2019, 2019.
Wallace, L. and Ott, W.: Personal exposure to ultrafine particles, J. Expo. Sci. Environ. Epidemiol., 21, 20–30, https://doi.org/10.1038/jes.2009.59, 2011.
Wang, Z. B., Hu, M., Wu, Z. J., Yue, D. L., He, L. Y., Huang, X. F., Liu, X. G., and Wiedensohler, A.: Long-term measurements of particle number size distributions and the relationships with air mass history and source apportionment in the summer of Beijing, Atmos. Chem. Phys., 13, 10159–10170, https://doi.org/10.5194/acp-13-10159-2013, 2013.
Watson, J. G., Chow, J. C., Sodeman, D. A., Lowenthal, D. H., Chang, M. C. O., Park, K., and Wang, X.: Comparison of four scanning mobility particle sizers at the Fresno Supersite, Particuology, 9, 204–209, https://doi.org/10.1016/j.partic.2011.03.002, 2011.
Weichenthal, S., Van Ryswyk, K., Kulka, R., Sun, L., Wallace, L., and Joseph, L.: In-vehicle exposures to particulate air pollution in Canadian metropolitan areas: the urban transportation exposure study, Environ. Sci. Technol., 49, 597–605, https://doi.org/10.1021/es504043a, 2015.
Westervelt, D. M., Pierce, J. R., Riipinen, I., Trivitayanurak, W., Hamed, A., Kulmala, M., Laaksonen, A., Decesari, S., and Adams, P. J.: Formation and growth of nucleated particles into cloud condensation nuclei: model–measurement comparison, Atmos. Chem. Phys., 13, 7645–7663, https://doi.org/10.5194/acp-13-7645-2013, 2013.
Xue, J., Li, Y., Peppers, J., Wan, C., Kado, N., Green, P. G., Young, T., and Kleeman, M.: Ultrafine particle emissions from natural gas, biogas and biomethane combustion, Environ. Sci. Technol., 52, 13619–13628, https://doi.org/10.1021/acs.est.8b04170, 2018a.
Xue, J., Xue, W., Sowlat, M., Sioutas, C., Lilinco, A., Hasson, A., and Kleeman, M.: Seasonal and Annual Source Appointment of Carbonaceous Ultrafine Particulate Matter (PM0.1) in Polluted California Cities, Environ. Sci. Technol., 53, 39–49, https://doi.org/10.1021/acs.est.8b04404, 2018b.
Ying, Q. and Kleeman, M. J.: Source contributions to the regional distribution of secondary particulate matter in California, Atmos. Environ., 40, 736–752, 2006.
Ying, Q., Lu, J., Allen, P., Livingstone, P., Kaduwela, A., and Kleeman, M.: Modeling air quality during the California Regional PM10/PM2.5 Air Quality Study (CRPAQS) using the UCD/CIT source-oriented air quality model – Part I. Base case model results, Atmos. Environ., 42, 8954–8966, 2008a.
Ying, Q., Lu, J., Kaduwela, A., and Kleeman, M.: Modeling air quality during the California Regional PM10/PM2.5 Air Quality Study (CPRAQS) using the UCD/CIT Source Oriented Air Quality Model – Part II. Regional source apportionment of primary airborne particulate matter, Atmos. Environ., 42, 8967–8978, 2008b.
Yu, F., Luo, G., Pryor, S. C., Pillai, P. R., Lee, S. H., Ortega, J., Schwab, J. J., Hallar, A. G., Leaitch, W. R., Aneja, V. P., Smith, J. N., Walker, J. T., Hogrefe, O., and Demerjian, K. L.: Spring and summer contrast in new particle formation over nine forest areas in North America, Atmos. Chem. Phys., 15, 13993–14003, https://doi.org/10.5194/acp-15-13993-2015, 2015.
Yue, W., Stolzel, M., Cyrys, J., Pitz, M., Heinrich, J., Kreyling, W. G., Wichmann, H. E., Peters, A., Wang, S., and Hopke, P. K.: Source apportionment of ambient fine particle size distribution using positive matrix factorization in Erfurt, Germany, Sci. Total Environ., 398, 133–144, 2008.
Zhang, H. L. and Ying, Q.: Source apportionment of airborne particulate matter in Southeast Texas using a source-oriented 3D air quality model, Atmos. Environ., 44, 3547–3557, 2010.
Zhang, K. M., Wexler, A. S., Zhu, Y. F., Hinds, W. C., and Sioutas, C.: Evolution of particle number distribution near roadways. Part II: the “road-to-ambient” process, Atmos. Environ., 38, 6655–6665, 10.1016/j.atmosenv.2004.06.044, 2004.
Zhang, K. M., Wexler, A. S., Niemeier, D. A., Zhu, Y. F., Hinds, W. C., and Sioutas, C.: Evolution of particle number distribution near roadways. Part III: Traffic analysis and on-road size resolved particulate emission factors, Atmos. Environ., 39, 4155–4166, https://doi.org/10.1016/j.atmosenv.2005.04.003, 2005.
Zhang, Y., Liu, P., Liu, X. H., Jacobson, M. Z., McMurry, P. H., Yu, F. Q., Yu, S. C., and Schere, K. L.: A comparative study of nucleation parameterizations: 2. Three-dimensional model application and evaluation, J. Geophys. Res.-Atmos., 115, D20213, https://doi.org/10.1029/2010jd014151, 2010.
Zhao, Z., Chen, S. H., Kleeman, M. J., Tyree, M., and Cayan, D.: The Impact of Climate Change on Air Quality-Related Meteorological Conditions in California. Part I: Present Time Simulation Analysis, J. Climate, 24, 3344–3361, 2011.
Zhu, Y. F., Hinds, W. C., Kim, S., Shen, S., and Sioutas, C.: Study of ultrafine particles near a major highway with heavy-duty diesel traffic, Atmos. Environ., 36, 4323–4335, https://doi.org/10.1016/s1352-2310(02)00354-0, 2002a.
Zhu, Y. F., Hinds, W. C., Kim, S., and Sioutas, C.: Concentration and size distribution of ultrafine particles near a major highway, J. Air Waste Manage., 52, 1032–1042, https://doi.org/10.1080/10473289.2002.10470842, 2002b.