the Creative Commons Attribution 4.0 License.
the Creative Commons Attribution 4.0 License.
Dimethyl sulfide and its role in aerosol formation and growth in the Arctic summer – a modelling study
Wanmin Gong
Martí Galí
Ann-Lise Norman
Stephen R. Beagley
Ayodeji Akingunola
Qiong Zheng
Alexandru Lupu
Martine Lizotte
Maurice Levasseur
W. Richard Leaitch
Atmospheric dimethyl sulfide, DMS(g), is a climatically important sulfur compound and is the main source of biogenic sulfate aerosol in the Arctic atmosphere. DMS(g) production and emission to the atmosphere increase during the summer due to the greater ice-free sea surface and higher biological activity. We implemented DMS(g) in the Environment and Climate Change Canada’s (ECCC) online air quality forecast model, GEM-MACH (Global Environmental Multiscale–Modelling Air quality and CHemistry), and compared model simulations with DMS(g) measurements made in Baffin Bay and the Canadian Arctic Archipelago in July and August 2014. Two seawater DMS(aq) datasets were used as input for the simulations: (1) a DMS(aq) climatology dataset based on seawater concentration measurements (Lana et al., 2011) and (2) a DMS(aq) dataset based on satellite detection (Galí et al., 2018). In general, GEM-MACH simulations under-predict DMS(g) measurements, which is likely due to the negative biases in both DMS(aq) datasets. However, a higher correlation and smaller bias were obtained with the satellite dataset. Agreement with the observations improved when climatological values were replaced by DMS(aq) in situ values that were measured concurrently with atmospheric observations over Baffin Bay and the Lancaster Sound area in July 2014.
The addition of DMS(g) to the GEM-MACH model resulted in a significant increase in atmospheric SO2 for some regions of the Canadian Arctic (up to 100 %). Analysis of the size-segregated sulfate aerosol in the model shows that a significant increase in sulfate mass occurs for particles with a diameter smaller than 200 nm due to the formation and growth of biogenic aerosol at high latitudes (>70∘ N). The enhancement in sulfate particles is most significant in the size range from 50 to 100 nm; however, this enhancement is stronger in the 200–1000 nm size range at lower latitudes (<70∘ N). These results emphasize the important role of DMS(g) in the formation and growth of fine and ultrafine sulfate-containing particles in the Arctic during the summertime.
- Article
(25892 KB) - Full-text XML
-
Supplement
(1067 KB) - BibTeX
- EndNote
Atmospheric aerosol plays a crucial role in climate change. Aerosol particles influence climate by absorption/scattering of short-/long-wave radiation (direct effect) and by changing the number/size of cloud droplets and altering precipitation efficiency (indirect effect) (e.g. Haywood and Boucher, 2000). Despite their importance in the atmosphere, there are many uncertainties and a lack of information/understanding regarding the estimation of their sources, composition, distribution and effects. These uncertainties are greater in the Arctic than at lower latitudes, due to the harsh environment of the Arctic that limits measurements and observations in this remote region (Bates et al., 1987; Uttal et al., 2016; Reddington et al., 2017).
The Arctic Ocean is an important source of gases and primary aerosols emitted into the atmosphere by gas exchange at the sea–air interface, bubble bursting and sea spray (e.g. Bates et al., 1987; Andreae, 1990; Yin et al., 1990; Leck and Bigg, 2005a, b; Barnes et al., 2006; Ayers and Cainey, 2007; Sharma et al., 2012). These emissions contain primary particles (such as sea spray) and gases, which may form secondary particles such as sulfate. Sulfate aerosols in the Arctic atmosphere originate from anthropogenic, sea salt, geological and biogenic sources (Norman et al., 1999; Chang et al., 2011; Rempillo et al., 2011). Anthropogenic sulfate particles are transported into the Arctic from southern latitudes during winter and spring (Sirois and Barrie, 1999; Stone et al., 2014); ship emissions, particularly in summertime, also contribute to the anthropogenic sulfate in the Arctic (e.g. Gong et al., 2018a). During summer, wet scavenging significantly reduces anthropogenic contributions (e.g. Garrett et al., 2011; Croft et al., 2016a). Sea salt enters the atmosphere via sea spray and bubble bursting, and is generally found in coarse-mode particles (Quinn et al., 2015). The geological sources include SO2 emission from volcanic and smoking hills (Yang et al., 2018; Rempillo et al., 2011). The focus of this study is the main biogenic source of sulfate aerosols in the Arctic, dimethyl sulfide (DMS), which has the chemical formula (CH3)2S.
DMS(aq) is produced by the breakdown of dimethylsulfoniopropionate (DMSP), a compound synthesized by phytoplankton (Keller, 1989; Alcolombri et al., 2015). DMSP breakdown is favoured by microbial interactions and environmental stressors, and is carried out by phytoplankton and bacterial DMSP-lyase enzymes. DMS produced in the upper mixed layer of the ocean is mostly removed by bacteria and photochemistry, and only 10–15 % enters the atmosphere in the form of DMS(g) (Galí and Simó, 2015) via processes such as turbulence, diffusion and advection (Lunden et al., 2010). During summer, DMS(aq) production and emission to the atmosphere increase due to a larger ice-free sea surface and higher bioactivities (Sharma et al., 2012; Levasseur, 2013).
The most important reaction of DMS(g) in the atmosphere is oxidation by hydroxyl and/or nitrate radicals. This addition pathway proceeds by adding the OH radical to DMS(g); its final products are dimethylsulfoxide (DMSO), dimethylsulfone (DMSO2) and methanesulfinic acid (MSIA), which are all highly soluble in water and readily condensable on existing aerosols. Oxidation of DMSO, DMSO2 and MSIA in the gas phase is not significant in the presence of clouds or high concentrations of aerosols (von Glasow and Crutzen, 2004). The abstraction pathway starts with the DMS(g) reaction with OH and NO3 radicals, and the main products are methanesulfonic acid (MSA) and SO2. The addition and abstraction pathways of DMS(g) oxidation with OH are temperature and light dependent. For example, the abstraction pathway (with a ratio of 75 % of total OH and DMS oxidation) is the dominant reaction at 300 K (Hynes et al., 1986).
The reaction of MSIA with OH may also lead to the formation of SO2 which could be considered to be the crossover point between the addition and abstraction pathways (von Glasow and Crutzen, 2004). In addition, reaction with halogens is a potential additional sink for DMS(g) in the remote marine atmosphere (von Glasow and Crutzen, 2004; Hoffmann et al., 2016). von Glasow and Crutzen (2004) focused on the oxidation of DMS(g) by halogens in the marine boundary layer (MBL) using a 1-D numerical model and reported significant uncertainty with respect to the production of DMS oxidation. Hoffmann et al. (2016) included the multiphase DMS(g) chemistry in a box model. They highlighted the role of aqueous-phase DMS(g) chemistry in the reduction of SO2 and increasing MSA production. Under certain conditions and in the presence of both amines and water vapour, MSA may form new particles (Dawson et al., 2012).
SO2 derived from DMS(g) can oxidize to sulfuric acid (H2SO4), which plays an important role in particle formation and growth. Particles composed of sulfate are relatively efficient cloud condensation nuclei (CCN), which can influence the properties of clouds. Sanchez et al. (2018) highlighted the importance of phytoplankton-produced DMS emissions in CCN budget in the northern Atlantic. They estimated the contribution of new sulfate particles in the CCN budget to be equal to 31 % and 33 % at 0.1 % supersaturation in late-autumn and late-spring respectively. Recent atmospheric observation and modelling studies suggest a significant role for DMS(g) in particle formation above oceans, especially in remote areas such as the Arctic during summer when anthropogenic aerosols are scarce and the condensation sink is low (Abbatt et al., 2019; Croft et al., 2019; Leaitch et al., 2013; Ghahremaninezhad et al., 2016; Burkart et al., 2017; Collins et al., 2017; Quinn et al., 2017).
Under the “Network on Climate and Aerosols: Addressing Key Uncertainties in Remote Canadian Environments” (NETCARE; Abbatt et al., 2019) research consortium, field campaigns employing multiple platforms were conducted in the Arctic during summer 2014, spring 2015 and summer 2016 to increase our knowledge of Arctic aerosol sources, sinks, chemical transformations and interactions with clouds. During the 2014 campaign unexpectedly high DMS(g) levels were observed (Abbatt et al., 2019; Ghahremaninezhad et al., 2017; Mungall et al., 2016) and were associated with particle nucleation and growth (Ghahremaninezhad et al., 2016; Willis et al., 2016). Using the GEOS-CHEM global chemical transport model, Mungall et al. (2016) showed that the high levels of DMS(g) observed in the marine boundary layer of the Canadian Arctic Archipelago during summer 2014 largely originated from local marine sources. In particular, measurements made during NETCARE found melt ponds over first-year sea ice had DMS(aq) concentrations comparable to the global oceanic annual average (Gourdal et al., 2018; Abbatt et al., 2019). This additional source of DMS could have significant consequences for Arctic aerosol, given the extensive coverage of melt ponds over first-year ice.
Recent modelling studies have examined the impact of DMS on Arctic aerosols. Marelle et al. (2017) updated the WRF-Chem regional model by adding DMS(g) and reported an improvement in surface sulfate estimates in the Arctic. Mahmood et al. (2019) evaluated the impact of DMS(g) emission on the formation of sulfate aerosol, CCN and cloud radiative forcing in a global climate model. Although they did not find a significant increase in sulfate aerosol, they predicted higher nucleation rates, increased sulfate deposition and an increase in the cloud droplet number concentration.
In this study, for the first time, we include DMS(g) in the ECCC's online air quality forecast model, GEM-MACH, in order to investigate (at a regional scale) the role of DMS(g) in the formation and growth of aerosols in the Arctic during summertime. Model simulations were carried out for the month of July and the beginning of August 2014, coinciding with the 2014 NETCARE field campaign in the Canadian Arctic to allow comparison with in situ measurements. In what follows, the implementation of DMS in the GEM-MACH model and the simulation set-up are described (Sect. 2), followed by a brief description of the measurement data used for model evaluation (Sect. 3). Section 4 presents the study results including (1) model simulated DMS(g) and comparison with observations, (2) DMS(g) source sensitivity tests, and (3) DMS(g) impacts on sulfur chemistry and aerosol growth/formation in the Arctic summer. The summary and conclusions of this study are reported in Sect. 5.
The base model used for this study is the Environment and Climate Change Canada (ECCC) air quality prediction model GEM-MACH (Global Environmental Multiscale model–Modelling Air quality and CHemistry). It consists of an online tropospheric chemistry module embedded within ECCC's GEM numerical weather forecast model (Côté et al., 1998a, b; Charron et al., 2012). The chemistry module includes a comprehensive representation of air quality processes, such as gas-phase, aqueous-phase, and heterogeneous chemistry and aerosol processes (e.g. Moran et al., 2013; Makar et al., 2015a, b; Gong et al., 2015). Specifically, gas-phase chemistry is represented by a modified ADOM-II mechanism with 47 species and 114 reactions (Lurmann et al., 1986; Stockwell and Lurmann, 1989); inorganic heterogeneous chemistry is parameterized by a modified version of the ISORROPIA algorithm of Nenes et al. (1999), as described in detail in Makar et al. (2003); secondary organic aerosol (SOA) formation is parameterized using a two-product, overall or instantaneous aerosol yield formation (Odum et al., 1996; Jiang, 2003; Stroud et al., 2018); aerosol microphysical processes, including nucleation and condensation (sulfate and SOA), hygroscopic growth, coagulation and dry deposition/sedimentation are parameterized as in Gong et al. (2003); the representation of cloud processing of gases and aerosols includes uptake and activation, aqueous-phase chemistry, and wet removal (Gong et al., 2006, 2015). Aerosol chemical composition is represented by eight components: sulfate, nitrate, ammonium, elemental carbon (EC), primary organic aerosol (POA), secondary organic aerosol (SOA), crustal material (CM) and sea salt; aerosol particles are assumed to be internally mixed. A sectional approach is used for representing aerosol size distribution, with either a 2-bin (0–2.5 and 2.5–10 µm) or a more detailed 12-bin (between 0.01 and 40.96 µm, logarithmically spaced: 0.01–0.02, 0.02–0.04, 0.04–0.08, 0.08–0.16, 0.16–0.32, 0.32–0.64, 0.64–1.28, 1.28–2.56, 2.56–5.12, 5.12–10.24, 10.24–20.48 and 20.48–40.96 µm) configuration. A limited area version of GEM-MACH has been in use as ECCC's operational air quality prediction model since 2009 (Moran et al., 2010). GEM-MACH with various configurations has been used in a number of studies, such as air quality and acid deposition research in the Athabasca oil sands region (e.g. Makar et al., 2018; Stroud et al., 2018; Akingunola et al., 2018), works on the feedbacks between air pollution and weather (Makar et al., 2015a, b; Gong et al., 2015), and investigations of sources and processes affecting the Arctic atmospheric composition in summertime and assessing the impact of marine shipping emissions in the Canadian Arctic (Gong et al., 2018a, b).
2.1 DMS flux and oxidation
The emission of DMS(g) from the ocean is determined by the air–sea gas exchange process. In this study, the sea-to-air flux of DMS is parameterized following Liss and Merlivat (1986) and Jeffery et al. (2010) – the latter study combines a global ocean modelling approach and experimental measurements; more details are available in Johnson (2010). Thus, the equation used to calculate the sea-to-air flux of DMS is
where Cg and Cl represent the DMS(g) concentrations in the gas and liquid phases respectively, KH is the dimensionless Henry's law constant and Kw is the transfer velocity.
Here kw and ka are the single-phase transfer velocities for the water side (Elliott, 2009) and the air side (Johnson, 2010) respectively, which depend on physical properties such as wind speed as well as air and sea surface temperatures. DMS(g) emissions are assumed to originate from the open ocean, and areas covered by sea ice are excluded from the DMS(g) flux calculation; in other words, the flux in Eq. (2) is multiplied by (1−frice), where frice is sea-ice fraction at a given model grid.
The ADOM-II mechanism does not include DMS. For this study, a DMS(g) oxidation module was added to the GEM-MACH model to account for the oxidation of DMS(g) by OH (via abstraction and addition reactions) and NO3 radicals as well as the production of SO2; the reaction mechanism is based on Seinfeld and Pandis (1998) with reaction rates from von Glasow and Crutzen (2004). The base mechanism considers SO2 production from OH abstraction and NO3 reactions, whereas the OH-addition reaction mainly leads to the formation of MSA. However, as mentioned in the introduction, the OH-addition pathway may also lead to the formation of SO2 via the MSIA–OH reaction. For example, Chin et al. (1996) considered a 75 % yield of SO2 production from the DMS OH-addition reaction. The impact of this additional SO2 production pathway is also examined in this study. No heterogeneous sink for DMS(g) is included. However, reactions of halogen oxide radicals with DMS(g) in the aqueous phase could be significant (von Glasow and Crutzen, 2004; Hoffmann et al., 2016) and need to be considered in future studies.
2.2 Seawater DMS(aq)
Two seawater DMS datasets are used in this study: (1) a gridded global monthly climatology of the surface seawater DMS concentration at a 1∘ × 1∘ resolution (Lana et al., 2011), hereafter referred to as CLIM11, and (2) a new satellite-based sea surface DMS concentration dataset at a 28 km × 28 km spacial resolution and an 8 d temporal resolution (Galí et al., 2018), hereafter referred to as SAT.
CLIM11 was developed based on the global surface ocean DMS(aq) measurements collected (mostly) between 1980 and 2009. The monthly climatology was constructed using interpolation/extrapolation techniques to project the discrete concentration data onto a first-guess field followed by further objective analysis (Lana et al., 2011). CLIM11 has been widely used as input for atmospheric chemistry and climate models (e.g. Breider et al., 2017; Marelle et al., 2017); however, there are large uncertainties in the extrapolated ocean DMS climatology over the Arctic, particularly over the Canadian polar shelf and the Baffin Bay area, due to the scarcity of measurements (Lana et al., 2011; Abbatt et al., 2019).
SAT, the satellite-based DMS(aq) dataset, was developed by Galí et al. (2018) using a remote sensing algorithm that exploits the nonlinear relationship between sea surface chlorophyll a (DMS(aq)), its phytoplanktonic precursor dimethylsulfoniopropionate (DMSPt) and plankton light exposure. The satellite algorithm allows for low- and high-DMSP phytoplankton producers (Galí et al., 2015) and for a light-enhanced DMS concentration in summer (Simó and Pedrós-Alió, 1999), which are the two major factors controlling global DMS distribution and seasonality (Lizotte et al., 2012; Galí and Simó, 2015). The dataset used here is based on the algorithm coefficients fitted for latitudes higher than 45∘ N, and is further optimized for the Arctic Ocean (Galí et al., 2019).
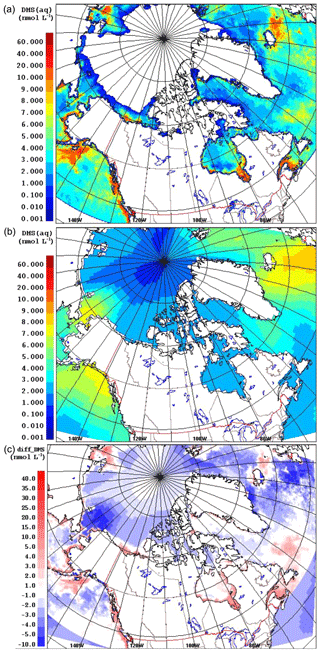
Figure 1 compares the averaged July DMS(aq) concentration over the simulation domain from the two datasets, SAT and CLIM11 (the averaged August DMS(aq) is shown in Fig. S2 in the Supplement). The same colour scales are used here to allow for direct comparison between the two; however, the maximum DMS(aq) concentrations are around 10 and 60 nmol L−1 for the CLIM11 and SAT datasets respectively. Both datasets show relatively high DMS(aq) concentrations in the North Atlantic Ocean region southeast of Greenland, in the Gulf of Alaska and in Bering Strait areas (∼10 nmol L−1). Despite broad agreement with respect to large-scale patterns, the SAT dataset shows much more spatial variability than CLIM11, reflecting the higher resolution of satellite observations. In contrast, the CLIM11 dataset shows more uniform DMS(aq) concentrations due to limited DMS(aq) measurements and a coarser resolution (555 km interpolation radius). In addition, the SAT dataset also shows high DMS(aq) areas around the Mackenzie River Delta, Hudson Bay, the Labrador Sea, Lancaster Sound and the Gulf of Saint Lawrence, which are not captured in the CLIM11 dataset. Note that over the central Arctic Ocean DMS(aq) concentrations are not available from the SAT dataset due to the limitation of satellite detection in the presence of sea ice (Fig. 1a). As a result, for the model simulation using the SAT seawater DMS, the regions where DMS(aq) is not available were filled in with DMS(aq) values from CLIM11.
2.3 Simulation set-up
GEM-MACH version 2 with the 12-bin configuration was used for this study. The model domain, centred over the Canadian Arctic on a rotated latitudinal–longitudinal grid with a horizontal resolution of about 15 km, and the model set-up are the same as in Gong et al. (2018b). The simulation was carried out for the period from 1 July to 8 August 2014 in this study. Hourly meteorological fields from the global GEM model were used to pilot GEM-MACH. The meteorology was initialized daily (at 00:00 UTC) using the Canadian Meteorological Centre's regional objective analyses. Output from a global CTM, namely MOZART-4 (Emmons et al., 2010), was obtained from http://www.acom.ucar.edu/wrf-chem/mozart.shtml for the chemical initial (last access: November 2018) as were lateral boundary conditions, including DMS(g). The anthropogenic and biogenic emissions are as described in Gong et al. (2018b); the North America wildfire emissions for the 2014 fire season, archived at the Canadian Centre for Meteorology and Environment Prediction, were used for the simulation. As discussed above, two DMS(aq) datasets were used for the model simulations. For simulations with CLIM11, constant (temporally) climatology is used, whereas for simulations using SAT, DMS(aq) is updated every 8 d. Figure S1 shows the satellite-derived DMS(aq) concentrations for the SAT time intervals, every 8 d, during July and August 2014 (1–3 July, 4–11 July, 12–19 July, 20–27 July, 28 July–4 August and 5–12 August).
The model simulations are compared with DMS(g) measurements made during the NETCARE 2014 summer field campaign, both onboard the Canadian Coast Guard Ship (CCGS) Amundsen and the Alfred Wegener Institute's Polar 6 aircraft. Figure 2 shows the Polar 6 flight tracks and the Amundsen cruise track during the NETCARE 2014 summer study. The measurements onboard Polar 6 took place from 4 to 21 July, and consisted of 11 research flights based from Resolute Bay, Nunavut; the measurements onboard Amundsen took place between 13 July and 7 August as the icebreaker sailed through the eastern Canadian Archipelago (Abbatt et al., 2019). Two independent measurements of DMS(g) were conducted on the Amundsen cruise using (1) a Hewlett Packard 5890 series gas chromatograph (GC) fitted with a Sievers model 355 sulfur chemiluminescence detector (SCD) from 11 to 24 July (hereafter referred to as GC-SCD; detection limit of 7 pptv) and (2) a high-resolution time-of-flight chemical ionization mass spectrometer, the Aerodyne HRToF-CIMS, from 15 July to 7 August (hereafter referred to as CIMS; detection limit of 4 pptv). For the former method, DMS(g) was collected on GC inlet liner packed with 170±2 mg of Tenax TA®, at the ship's bridge, around 30 m above sea level (a.s.l.). The sample collection time interval was 300±5 s with a mass flow of approximately 200±20 mL min−1. The DMS(g) samples were analysed less than 24 h after collection using GC-SCD. The inlet for the CIMS was placed in the tower around 16 m a.s.l. Detailed information regarding the collection locations, analysis of samples, and uncertainty in measurements with GC-SCD and CIMS are available in Ghahremaninezhad et al. (2017) and Mungall et al. (2016) respectively.
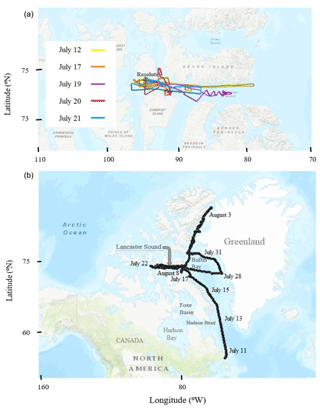
Figure 2The Polar 6 (a) and Amundsen (b) trajectories during July 2014. The base maps in this figure were created using online ArcGIS® by Esri.
Atmospheric DMS(g) samples were collected on 5 of the 11 Polar 6 research flights, from 50 to 5000 m a.m.s.l. (above mean sea level), utilizing the GC-SCD method similar to that used onboard the Amundsen. Two Teflon valves were placed before and after the Tenax tube to control the sampling interval (300±5 s) on the aircraft, and Teflon tubing was used to transfer the sample from outside to the sampler. The samples were stored in an insulated container with a freezer pack after collection and in a freezer after the flight (more information regarding the method is available in Ghahremaninezhad et al., 2017).
4.1 Simulated DMS(g) and comparison with observations
The modelled monthly averaged DMS(g) mixing ratios for July 2014, at the lowest model level (20 m), using the SAT and CLIM11 DMS(aq) datasets, are shown in Fig. 3. Broadly speaking, the two model simulations show a similar geographical distributions of atmospheric DMS over the model domain; however, there is a generally higher concentration on the western side (Bering Sea and Bering Strait) of up to 900 pptv, and a lower concentration on the eastern side, e.g. 50–200 pptv over Baffin Bay, the Labrador Sea and the North Atlantic. This general distribution pattern is consistent with the findings of Sharma et al. (1999) from measurements taken on an expedition circumnavigating North America, including an Arctic Ocean transect in summer/fall 1994; they observed the highest DMS(g) concentrations over the open waters of the Bering Sea south of the ice edge on the west side of the Arctic Ocean (with concentrations of up to 50 nmol m−3, or ∼1000 pptv), whereas lower concentrations were observed on the Atlantic side (e.g. 5–10 nmol m−3, or ∼ 100–200 pptv over Labrador Sea). The two simulations result in comparable atmospheric DMS overall. For example, the DMS(g) averaged over all ocean grids (north of 60∘ N) for the month of July is 131 pptv using the SAT dataset and 145 pptv using the CLIM11 dataset. However, the two simulations do differ on a local scale, e.g. higher DMS(g) mean mixing ratio values are evident in the figure using the SAT DMS(aq) dataset for some regions such as Hudson Bay (up to 600 pptv using SAT vs. up to 75 pptv using CLIM11) and the Canadian Arctic Archipelago (up to 200 pptv using SAT vs. up to 100 pptv using CLIM11). The differences in modelled July-averaged DMS(g) between the two simulations, shown in Fig. 3c at the lowest model level, largely reflect the differences between the two DMS(aq) datasets.
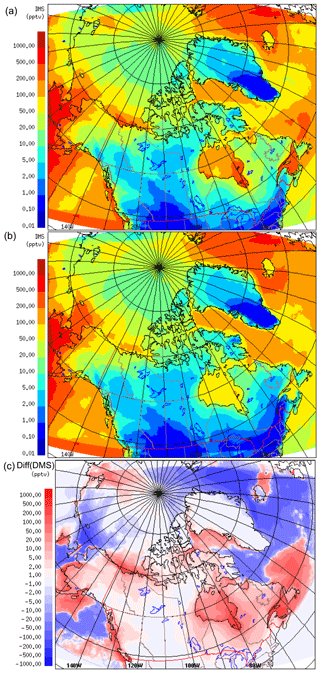
Figure 3DMS(g) mean mixing ratios for July 2014, at 20 m, the lowest model level, using SAT (a) and CLIM11 (b). Panel (c) shows the difference between SAT and CLIM11 DMS(g).
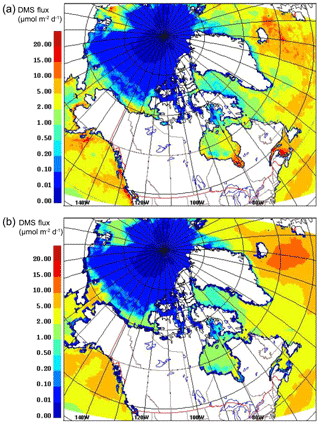
Figure 4 shows the model-averaged DMS sea–air flux for July 2014, using the SAT and CLIM11 DMS(aq) datasets. The differences between the two (SAT and CLIM11) DMS(aq) datasets (Fig. 1a, b) are reflected in the flux values (Fig. 4a, b); for example, CLIM11 flux values have less spatial variability due to the lower resolution, and SAT DMS flux values are higher (e.g. >10 µmol m−2 d−1) at some locations, such as the Mackenzie River Delta, Hudson Bay and the Gulf of Saint Lawrence.
Sharma et al. (1999) reported DMS flux values between 0.007 and 11.5 µmol m−2 d−1 over the Alaskan coast (Bering Sea) to the central Arctic Ocean (Canada Basin) during July and August 1994; Mungall et al. (2016) reported DMS flux values between 0.02 and 12 µmol m−2 d−1 over the eastern Canadian Arctic. These flux estimates, based on measurements, are comparable with the present simulations.
4.1.1 Comparison with the DMS(g) measurement onboard the Polar 6
Modelled DMS(g) from the model simulations (CLIM11, SAT and CLIM11 + ave-Obs; the later simulation is defined in Sect. 4.2.3), extracted along the Polar 6 flight path coinciding with aircraft samples, are compared with the measurements in Fig. 5. This figure includes the simulated average DMS(g) vertical profiles along the flight path. The GEM-MACH model captures DMS(g) mixing ratios close to the measurements and shows a general decay of the DMS(g) mixing ratio with height, indicating the influence of local sources of DMS. Using the same observation data, Ghahremaninezhad et al. (2017) highlighted the role of local sources in the Canadian Arctic with respect to DMS emission during summer. The observation results indicated a decrease in the DMS(g) mixing ratios with altitude up to about 3 km, and the largest mixing ratios were found near the surface above the ice edge and open water, coincident with increased particle concentrations (Burkart et al., 2017; Croft et al., 2016a, b; Ghahremaninezhad et al., 2017). The dominant influence of local sources on DMS(g) observed in the Arctic marine boundary layer during summer is further supported by the source sensitivity tests discussed in Sect. 4.2.
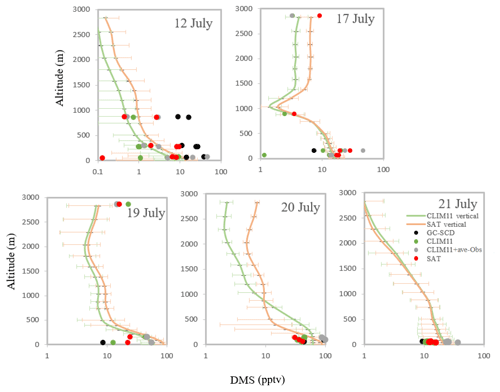
Figure 5The dots show the atmospheric DMS concentration (pptv) from the GEM-MACH model simulations (CLIM11, CLIM11 + ave-Obs and SAT; the CLIM11 + ave-Obs simulation is defined in Sect. 4.2.3) extracted along the Polar 6 flight path coincident with observation data (GC-SCD) during July 2014. The lines show the simulated average DMS(g) vertical profiles during the flights using the SAT and CLIM11 datasets. The horizontal bars indicate the standard deviations.
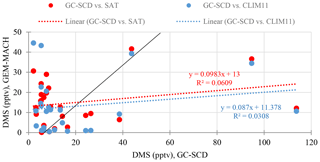
The scatter plot in Fig. 6 shows the statistical comparison of the model simulations (SAT and CLIM11) with the observation results. Overall, observation and model results are of a similar magnitude. The simulation using SAT is in slightly better agreement with the measurement based on the root-mean-squared error and mean bias values of 27.6 and −4.7 compared with 29.5 and −6.6 for the simulation using CLIM11; SAT also shows a better correlation coefficient (as shown in Table 2).
4.1.2 Comparison with the DMS(g) measurements onboard the Amundsen
Figure 7a compares the time series of modelled DMS(g) mixing ratio values from the two simulations (using SAT and CLIM11) following the Amundsen cruise track with the GC-SCD and CIMS measurements. The discrepancy between the two measurement datasets can be attributed to the different sampling locations/heights onboard the Amundsen (e.g. CIMS's inlet at 16 m a.s.l. at the bow vs. GC-SCD's inlet on the bridge at 30 m a.s.l.) and the different sampling/analysis methods. For example, the lower DMS(g) measured by GC-SCD compared with the CIMS measurement could on occasions be attributed to the vertical gradient in DMS(g). This is particularly the case when DMS(g) is mainly driven by local fluxes, e.g. the 19–21 July episode. More details are available in Mungall et al. (2016) and Ghahremaninezhad et al. (2017) respectively.
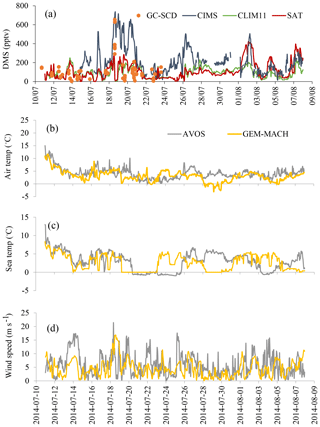
Figure 7(a) The campaign-mean DMS(g) mixing ratios for the co-sampled GEM-MACH simulations (SAT and CLIM11) and measurements onboard the Amundsen from 11 to 24 July (GC-SCD), and from 15 July to 8 August (CIMS). (b–d) Wind speed as well as sea and air temperatures from the Amundsen's AVOS system and GEM-MACH.
Relatively high DMS(g) mixing ratios were observed during the biologically productive period of July; two main high DMS(g) concentration episodes were observed during the 18–21 and 26–27 July periods while Amundsen was traversing Lancaster Sound. The modelled DMS(g) from both simulations generally tracked the observations well but both missed the two abovementioned high DMS(g) episodes, although the simulation with SAT captured the higher DMS episodes in early August well. Overall the model simulations under-predicted the measurements. A statistical evaluation against the CIMS measurements shows a model mean bias of −126.4 pptv (NMB of −57.7 %) for the simulation using CLIM11 and −95.4 pptv (NMB of −43.6 %) for the simulation using SAT. These large negative biases are mainly driven by the model under-prediction for the period when the icebreaker was travelling back and forth along Lancaster Sound. The better model results using SAT during the early part of August correspond to the icebreaker's path through the Nares Strait, where the SAT DMS(aq) concentration, which was up to 9 nmol L−1 (Fig. S1), is considerably higher than the CLIM11 DMS(aq) concentration (<3 nmol L−1) and in better agreement with the in situ DMS(aq) measurement in the area. Also shown in Fig. 7b–d are the time series of the observed (from the Amundsen's Automatic Voluntary Observing Ships System, AVOS, available onboard the ship at ∼23 m a.s.l.) and modelled surface wind speed, air temperature and sea temperature. These are the physical parameters affecting the sea–air flux. Overall the model is in good agreement with observations, given the model temporal and spatial resolution, which suggests that the main cause for the model to under-predict the high DMS(g) events likely lies in the model's representation of DMS sources.
In the next section, we look into several potential DMS source uncertainties which may contribute to the model under-prediction.
4.2 Source sensitivity tests
There is a large uncertainty in constraining seawater DMS(aq) in the Arctic due to very few measurements, such as in the CLIM11 dataset (Lana et al., 2011). Although the satellite-based estimates have the potential to address this shortcoming, they are also subject to uncertainties in retrieval techniques and algorithms. For example, satellite estimation has limitations on ice-covered or partially ice-covered ocean surfaces and suffers from uncertainty with respect to the satellite products used as input, chiefly for chlorophyll a, and from uncertainties inherent to algorithm configuration (Galí et al., 2018).
Another potential source of the discrepancies between measurements and model outputs could be the neglect of the DMS(g) emissions from ice-covered surfaces. For instance, melt ponds are potential DMS(g) sources (Gourdal et al., 2018). Mungall et al. (2016) estimated that melt ponds can contribute, on average, 20 % of atmospheric DMS over and near ice-covered regions of the Arctic during melt season. Here, we conducted a series of source sensitivity tests based on CLIM11 to examine the effects of the potential uncertainty in sources and address the discrepancy between the measurement and model results for July 2014, when both CLIM11- and SAT-based simulations showed negative biases.
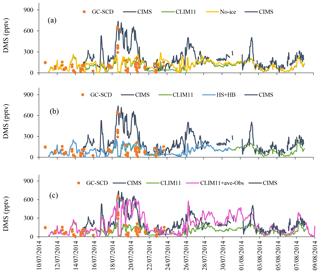
Three sensitivity tests are discussed here: (1) a “no-Ice” model run where sea-ice cover is neglected; (2) a model run with enhanced DMS(aq) in Hudson Strait and Hudson Bay; and (3) a model run with further enhancements in DMS(aq) that makes use of the in situ DMS(aq) measurement from the NETCARE campaign. Table 1 and Fig. S3 show the set-ups and the CLIM11 updated locations for these respective tests. Figure 8 shows the modelled DMS(g) along the Amundsen path from the source sensitivity tests compared with the observations as well as the results from the CLIM11 simulation.
Finally, note that DMS(g) underestimation in GEM-MACH might also arise from uncertainty in sea–air gas exchange coefficients in partially ice-covered waters (cf. Loose et al., 2014; van der Loeff et al., 2014), too much advection in the meteorological model, or DMS(g) removal in the chemical transport model that is too fast. However, as discussed in the following, results from our sensitivity tests suggest that the largest uncertainty arises from DMS(aq) concentrations in surface seawater.
4.2.1 The no-Ice sensitivity test
This sensitivity test (no-Ice) is conducted to examine the effect of neglecting sea-ice cover in the DMS(g) flux calculation. This is essentially an extreme case used to consider the potential contribution from melt ponds; this is done by assuming that the entire ice-covered portion of the Arctic ocean is covered by melt ponds, that the DMS(aq) concentrations in these melt ponds are the same as the open-water sea surface water DMS(aq) concentration and that the flux exchange is the same as over open water.
As shown in Fig. 8a, by neglecting the sea-ice cover, there is an enhancement in the model-simulated DMS(g) that mainly occurs over two periods: the 15 July – when the icebreaker was sailing along the coast of Baffin Island; and the 22–25 July – when the icebreaker was traversing the eastern end of Lancaster Sound (Fig. 2). In both instances the Amundsen was near the melt pond areas or ice edges. The sea-ice fraction in GEM-MACH (based on analysis) shows an area of sea-ice cover over Baffin Bay on 15 July and an ice edge located at the eastern end of Lancaster Sound on 22 July 2014 (see Fig. S4). However, there is no enhancement in the modelled DMS along the Amundsen path during the 18–21 and 26–27 July periods, when high DMS episodes were observed with the additional DMS sources from sea-ice-covered surfaces, indicating that the melt pond sources did not contribute to the two high DMS(g) events observed onboard the Amundsen. Figure 9a shows the impact of neglecting sea-ice cover on the modelled July mean DMS(g). The highest increase in the DMS(g) mixing ratio is around the Chukchi Sea (up to 300 pptv).
4.2.2 Hudson Strait and Hudson Bay effect (HS + HB)
This sensitivity test is inspired by the sensitivity study conducted by Mungall et al. (2016) and is based on the observation results of Ferland et al. (2011). The latter study reported that the productivity of Hudson Strait water is equal to that of the northern Baffin Bay, whereas the Hudson Bay and Foxe Basin water is about a quarter as productive as northern Baffin Bay (Ferland et al., 2011). We assumed a linear relationship between productivity and DMS(aq) formation, and set the DMS(aq) concentration values in Hudson Strait to be equal to the ship-based DMS(aq) measurement values in northern Baffin Bay (e.g. 20 nmol L−1), and the DMS(aq) in Hudson Bay and Foxe Basin to a quarter of that value. The DMS(aq) value (20 nmol L−1) is quite consistent with the SAT DMS(aq) in this region (see Fig. S1a for 1–3 July and Fig. 1b for 4–11 July; the lower SAT DMS(aq) in this region on 20 and 29 July may in part be due to the ice conditions or other limitations of satellite-based DMS(aq) measurements, e.g. potential issues near marginal ice or near the ice edge, sparse temporal coverage, and so on.).
Mungall et al. (2016) conducted this sensitivity test using the GEOS-Chem model at 2∘×2.5∘ resolution, and concluded that the Hudson Bay system contributed significantly to the high DMS(g) event observed onboard the Amundsen during the 18–19 July period. However, the results from our sensitivity test do not seem to support their findings. As seen from Fig. 8b, the enhancement in DMS(aq) in the Hudson Bay system (HB + HS) caused a very small change in modelled DMS(g) along the Amundsen path. One possible reason for the difference in model results between GEM-MACH and GEOS-Chem could be in model resolutions (e.g. GEOS-Chem model, 2∘×2.5∘ and GEM-MACH, 15 km).
The difference in the modelled July-averaged DMS(g) mixing ratios with and without the HS + HB DMS(aq) enhancement, shown in Fig. 9b, indicates that the impact of the Hudson Strait and Hudson Bay system is rather locally confined during the study period. The HS + HB DMS(aq) enhancement led to an increase in modelled DMS(g) of up to 300 pptv in the Hudson Strait area but the area of increase does not extend much beyond the area of DMS(aq) enhancement, indicating either a short DMS(g) lifetime and/or inefficient transport in this case.
4.2.3 Updated DMS(aq) in Baffin Bay and Lancaster Sound (CLIM11 + ave-Obs)
For this experiment we further updated the DMS(aq) in Baffin Bay and Lancaster Sound using the in situ measurements of the surface seawater DMS(aq) concentration onboard the Amundsen cruise (Mungall et al., 2016). The sampling area is divided into three subregions, Lancaster Sound, northern Baffin Bay–Southern Nares Strait and central Baffin Bay, each with averaged DMS(aq) measurement values of 7.9, 11.0 and 4.5 nmol L−1 respectively for July and a value of 4.0 for August. These values were used to replace the CLIM11 DMS(aq) values in the respective regions. It is worth noting that these value are comparable to the SAT DMS(aq) concentrations shown in Fig. 1. By updating DMS(aq) for the sampling region, GEM-MACH predicts the relatively higher DMS(g) mixing ratios and captures the elevated DMS(g) event days (18–22 July). These results show the importance of the local source (e.g. the Lancaster Sound region) of DMS(g) emissions during July (Fig. 8c). Figure 10 compares the CIMS DMS(g) measured data onboard the Amundsen with GEM-MACH simulations, using CLIM11, SAT and CLIM11 + ave-Obs. The statistical evaluations in Table 2 and Fig. 10 indicate a significant improvement in the model–observation comparison with this update.
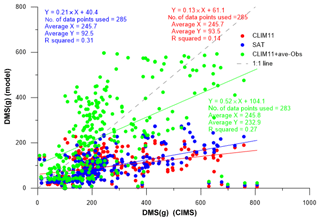
Figure 10The comparison of DMS(g) measured by CIMS onboard the Amundsen (July–August 2014) with GEM-MACH simulations, using CLIM11 (red), SAT (blue) and CLIM11 + ave-Obs (green). The linear regression method is used to obtain the correlation between observation and model results. The dashed line is the one-to-one line).
Table 2Mean bias (MB), root-mean-square errors (RMSEs) and Pearson correlation coefficient (R) for model simulations (CLIM11, SAT and CLIM11 + ave-Obs) and observation results (GC-SCD and CIMS onboard the Polar 6 and Amundsen respectively).

Figure 9c shows the difference between July mean DMS(g) mixing ratios using CLIM11 + ave-Obs and CLIM11. The DMS(g) enhancement is largely limited to the locations with the updated CLIM11 DMS(aq) concentration values. The sensitivity tests result emphasizes the role of locally emitted DMS(g) in the atmosphere particularly in the marine boundary layer.
4.3 Impact of DMS on sulfur chemistry
In this section, we examine the impact of DMS on sulfur chemistry in the Arctic summer via oxidation, the production of SO2 and sulfate aerosols. The discussions are based on the simulation results from the CLIM11 + ave-Obs run during July 2014.
4.3.1 DMS oxidation and SO2 production
DMS(g) oxidation depends on the oxidants present and the temperature at which the reactions take place. Figure 11 shows the modelled DMS(g) average chemical lifetime in the atmosphere (Fig. 11a) and the contributions (%) from each of the three main reaction pathways to DMS oxidation – abstraction with OH (Fig. 11b), addition with OH (Fig. 11c) and abstraction with NO3 (Fig. 11d) – for July 2014.
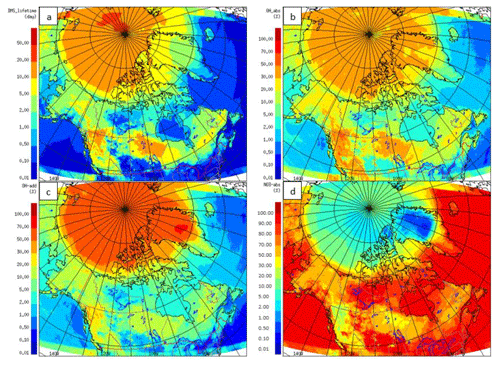
Figure 11(a) DMS(g) average lifetime for July 2014, and the percentage (%) contribution of the each pathway: (b) abstraction with OH, (c) addition with OH and (d) abstraction with NO3.
The DMS(g) atmospheric chemical lifetime (or e-folding time) shown here is based on the decay of DMS(g) due to OH and NO3 radicals in the atmosphere, and it is mostly less than 1 d in the marine environment below the Arctic circle but much longer in the Arctic (Fig. 11a). In the lower Arctic (<70∘ N), the chemical lifetime of DMS ranges from less than 1 to 5 d, and in the high Arctic (>80∘ N), the DMS chemical lifetime is between 5 and 20 d; it is longest over the central Arctic ocean where the concentrations of atmospheric oxidants are lowest. Over the Canadian Arctic Archipelago this DMS lifetime has a large range, from as short as less than half a day (e.g. over Hudson Bay and Hudson Strait, Davis Strait, and southern Baffin Bay) to >10 d (e.g. Nares Strait and western Queen Elisabeth Islands). The relatively short lifetime over Hudson Bay and Hudson Strait is consistent with the results discussed earlier from sensitivity studies, where we found that the effect of Hudson Bay DMS is mostly confined locally. The DMS(g) lifetime for the central Arctic was predicted to be 2.5 d by Leck and Persson (1996). Sharma et al. (1999), using a 1-D photochemical box model, estimated the lifetime of DMS(g) due to OH and NO3 oxidation to be around 6–8 d in the central Arctic during August. The relatively shorter lifetime of DMS(g) in Sharma et al. (1999) compared with our study may be partly due to the slightly higher OH concentration simulated by their 1-D model (e.g. 0.01–0.02 pptv in their August case vs. 0.006–0.01 pptv in this study). In addition to OH and NO3 radicals, halogenated radicals may have an important role as an additional sink for DMS(g) in the Arctic atmosphere (von Glasow et al., 2004; Hoffmann et al., 2016). The multiphase chemistry of DMS(g) and the impacts of the halogens in the DMS(g) chemistry/lifetime/products in the Arctic atmosphere need to be considered in future GEM-MACH model studies.
The NO3 concentrations, and as a result the DMS(g) oxidation by NO3, decrease sharply above 70∘ N. Conversely, oxidation by the OH radical is more important north of 70∘ N during the bright month of July. Overall, the abstraction pathway with the NO3 radical (up to 95 %) below the 70∘ N and the addition pathway with the OH radical (up to 90 %) above 70∘ N are the dominant oxidation pathways for DMS(g) in the subarctic and Arctic respectively.
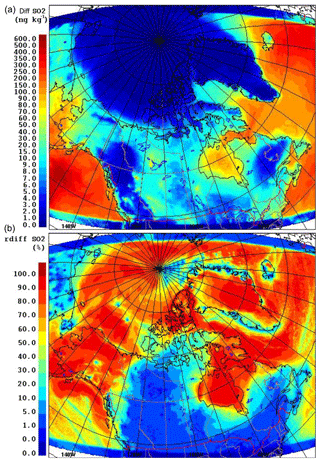
SO2 is one of the important products of DMS(g) oxidation in the atmosphere. SO2 concentrations were altered in the GEM-MACH model by including DMS(g) as a new biogenic source. The SO2 increment (July-averaged) due to DMS (or DMS-derived SO2, both absolute and relative percentage to total modelled SO2) are shown in Fig. 12. The absolute SO2 concentration difference in Fig. 12a is up to ∼600 pptv, and the relative contribution of DMS-derived SO2 to total SO2 is up to almost 100 % for some regions (Fig. 12b), which could be significant for the remote and clean Arctic environment during July. SO2 concentrations are increased in Hudson Bay and south Baffin Bay (around 100 pptv) by adding DMS(g) in the model. The absolute values of DMS-derived SO2 are small in these areas in comparison with other areas; however, due to the low background SO2 concentrations, DMS makes a significant contribution to SO2 in these areas, as shown in Fig. 12b. The relative SO2 increment plots (Fig. 12b) highlight the significant change of SO2 in the atmosphere by including DMS in the model. The SO2 concentrations are relatively low in the Arctic clean atmosphere during summer, and the relative increase in SO2 due to DMS(g) is more than 70 % over most of the Arctic Ocean.
4.3.2 Sulfate aerosols
The SO2 formed from DMS(g) oxidation will further undergo oxidation in the atmosphere by OH radical to form sulfuric acid, which can either nucleate to form new particles or condense on existing particles. In GEM-MACH, the nucleation and condensation of sulfuric acid are treated as two competing processes. The H2SO4–H2O nucleation rate is parameterized following Kulmala et al. (1998), and the condensation rate is parameterized based on the modified Fuchs–Sutugin equation (Fuchs and Sutugin, 1971). The combined nucleation–condensation equation is solved using an accelerated iterative scheme as described in Gong et al. (2003). The sulfate mass produced by nucleation is placed in the model's smallest size bin; the treatment of condensational growth of particles is handled by the same mechanism as described in Jacobson et al. (1994). As a result, the inclusion of DMS will induce changes in modelled aerosols in GEM-MACH, both in mass concentration and size distribution (Croft et al., 2016a).
Figure 13 shows the changes (both absolute and relative) in modelled July-averaged aerosol sulfate mass concentration due to DMS (or the production of biogenic sulfate) at the lowest model level. This difference is approximately in the range from 1 to 20 ng kg−1, or ∼1.50 to 25.0 ng m−3 (<10 %), in the high Arctic (<80∘ N) and is higher in the lower Arctic (e.g. up to 100 ng kg−1, or ∼125.0 ng m−3, in Baffin Bay). Moreover, the increase in sulfate mass is significant for the east and southwest of the domain with higher DMS(g) (e.g. the North Atlantic and off the coast of southern Alaska).
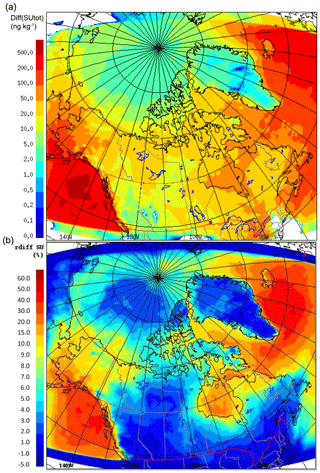
Figure 13The absolute (a) and relative (b) differences of the non-sea-salt sulfate aerosol concentrations (0.01 to 41 µm) with and without DMS(g) during July 2014.
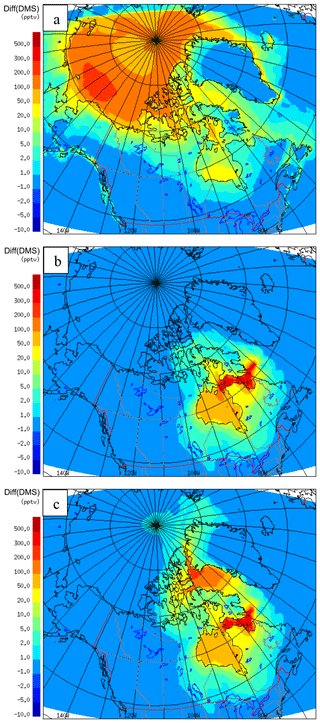
Figure 14 shows the relative mass change due to DMS chemistry in aerosol sulfate (July-average) for four different size ranges: 10–50, 50–100, 100–200 and 200–1000 nm. Examination of the different size ranges indicates that the most significant relative sulfate additions due to DMS reside in the smaller sizes (10–200 nm). It is interesting to note that the enhancement in sulfate due to DMS is more pronounced in the size range of 50 to 100 nm at higher latitudes (>70∘ N). This is in contrast to the enhancement at lower latitudes (<70∘ N) which is more evident in the size range from 200 to 1000 nm. This could be an indication for more favourable conditions for nucleation under the cleaner environment at high latitudes, whereas condensation onto existing aerosol is favoured for DMS-derived sulfuric acid at lower latitudes, as found in Leaitch et al. (2013).
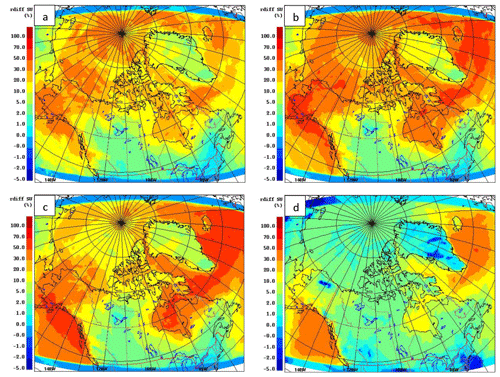
Figure 14The relative mass change of aerosol in the (a) 10–50 nm, (b) 50–100 nm, (c) 100–200 nm and (d) 200 nm–1 µm size ranges, with and without DMS(g) during July 2014.
Abbatt et al. (2019) showed the highest increase in particle number concentration to be between 15 and 50 nm at Alert, Nunavut, during July and August associated with new particle formation and growth from natural sources (see Fig. 7 of Abbatt et al., 2019). They estimated the contribution of natural sources to particles in the 30 to 50 nm size range to be around 20 % to 70 %. Figure 14 shows a 20 %–50 % and an approximate 50 % increase in sulfate particle mass between 10 and 50 nm and 50 and 100 nm respectively for July around Alert. In general, GEM-MACH suggests the enhancement of particles between 50 and 100 nm to be higher than particles between 10 and 50 nm for the high Arctic. This difference between Abbatt et al. (2019) and GEM-MACH results could be partly due to other missing natural sources (e.g. organics, see Croft et al., 2019; Burkart et al., 2017; Willis et al., 2016) in the model. Possible inadequacy in the model representation of particle nucleation processes and the over-prediction of the condensation sink may also contribute to the size discrepancy between the model and observations. For example, in the model, new particles formed via nucleation are added to the first model size bin (10–20 nm) at sizes considerably bigger than nucleating particles in the real world (e.g. Kulmala et al., 2006). In addition, the size discrepancy between the model and observations could be due in part to the role of MSA in the nucleation/growth of particles, which is not considered for this modelling study. However, recent field measurement studies have found that while MSA correlates with particle growth in the Arctic, it is not a major contributor to the mass of Aitken-mode particles or their growth (Willis et al., 2016; Tremblay et al., 2019). Furthermore, using the GEOS-Chem model, Croft et al. (2019) found that the condensation of MSA does not lead to sufficient particle growth; they were also not able to reproduce observed size distributions in the Arctic, even when particle growth by MSA condensation was included in the model. Further studies are needed to quantify the contribution of MSA in nucleation/growth of aerosol in the Arctic atmosphere.
The modelled size-resolved sulfate increments due to DMS are compared to the measurements of size-resolved biogenic sulfate onboard the Amundsen cruise during the 2014 NETCARE campaign. Size-segregated aerosol samples were collected and analysed for sulfur isotopes in order to apportion total aerosol sulfate into different origins: biogenic, anthropogenic and sea salt (Ghahremaninezhad et al., 2016). The modelled size-resolved aerosols were mapped onto the size ranges of the observation. Figure 15 shows the comparison for three smaller size ranges: <0.49, 0.49–0.95 and 0.95–1.5 µm. The aerodynamic diameters were converted to dry diameters using a dry diameter correction factor of 2.3 (Ming and Russell, 2001). Based on their analysis, Ghahremaninezhad et al. (2016) indicated that most of the biogenic sulfate resides are in the smallest size range (<0.49 µm; refer to Fig. 6c in Ghahremaninezhad et al., 2016). At higher latitudes (16 July and later), the model simulation in this study compares well with the observations and also demonstrates that a larger fraction of DMS-derived sulfate (or biogenic sulfate) is found in aerosols with sizes <0.49 µm.
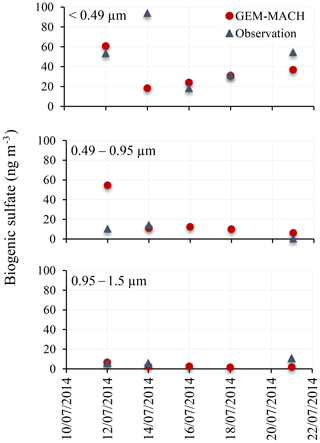
Figure 15Measured and simulated 2 d average biogenic fine sulfate aerosol (0.49, 0.49–0.95 and 0.95–1.5 µm) during July 2014.
During July 2014, Leaitch et al. (2016) found a strong influence of the particles in the size range from 20 to 100 nm in the cloud droplet number concentrations (CDNC) in liquid clouds in the eastern Arctic over the Resolute Bay area. Quinn et al. (2017) also emphasized the role of the non-sea-salt sulfate aerosol as the primary CCN between 70∘ S and 80∘ N. Furthermore, Ghahremaninezhad et al. (2016) found that biogenic sulfate particles are the dominant non-sea-salt sulfate particles during July in the Arctic atmosphere, and >63 % of non-sea-salt sulfate fine aerosol (<0.49 µm) were from a biogenic source (DMS). Our modelling results indicate the formation/growth of biogenic sulfate aerosol in the size range from 10 to 200 nm. These results suggest that the non-sea-salt sulfate aerosol in the summertime Arctic is dominated by fine and ultrafine biogenic particles, which may act as a CCN and/or influence CDNCs and play a climatic role.
4.3.3 Impact of possible SO2 formation from the OH-addition pathway
We examined the impact of possible additional SO2 formation from the OH-addition pathway via the MSIA–OH reaction, which is the crossover point between the addition and abstraction pathways (von Glasow and Crutzen, 2004). In this oxidation sensitivity test we considered a 75 % yield of SO2 from OH addition following Chin et al. (1996). Figure 16 shows the relative percentage of the July-averaged SO2 with and without the 75 % yield of SO2 from the OH-addition pathway. In this figure the difference (up to >50 % over the central Arctic, and 30 %–50 % over the Canadian Archipelago) is more pronounced above 70∘ N, where the effect of the OH-addition pathway is significant. As OH addition dominates DMS oxidation in the Arctic environment (particularly the high Arctic) due to low temperature (as discussed above), this additional SO2 formation mechanism can be important here.
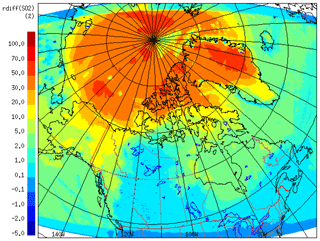
Figure 16The relative percentage of the July 2014 averaged SO2 with and without the 75 % yield of SO2.
Figure 17 shows the relative (percentage) change in the model-averaged sulfate aerosol with and without the 75 % yield of SO2 from the OH-addition pathway for different size ranges. This pathway exerts an important influence on the fine sulfate aerosol between 10 to 200 nm (mostly 50–100 nm) in size above 70∘ N. As shown in Fig. 17, the increase in sulfate aerosol mass in the size range from 10 to 200 nm is more than 30 % for some regions due to adding this pathway. These results emphasize the potential importance of the crossover point between the addition and abstraction pathways above 70∘ N.
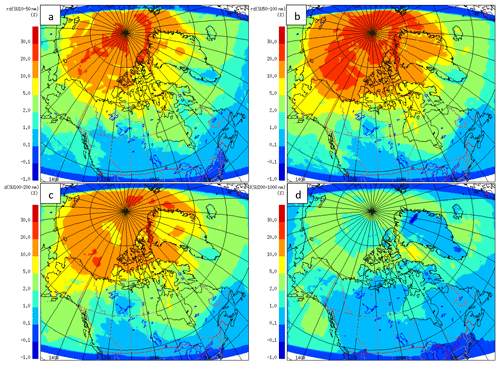
Figure 17The relative difference of aerosol in the (a) 10–50 nm, (b) 50–100 nm, (c) 100–200 nm and (d) 200 nm–1 µm size ranges, with and without the 75 % yield of SO2 from the OH-addition pathway for July 2014.
Leaitch et al. (2013) estimated the July and August averaged sulfate mass concentrations at Alert to be equal to 25 and 84 ng m−3 for the particles in the size ranges of 20–100 and 20–200 nm respectively (based on 1 year of observations and a 100 % conversion from the integrated volume concentration measured under clean conditions). However, assuming that sulfate comprises about 40 % of the submicron particles in clean air at Alert (Leaitch et al., 2018), the sulfate mass concentrations are estimated to be in the range of, at least, 10 ng m−3 for a particle size range from 20 to 100 nm, and 35 ng m−3 for a particle size range from 20 to 200 nm at Alert from natural sources. The GEM-MACH results show the increase in the July-averaged sulfate particle mass due to DMS to be slightly less than 10 ng m−3 without the 75 % yield of SO2 and more than 15 ng m−3 with the 75 % yield of SO2 in the size range from 10 to 200 nm at Alert.
In this study, we implemented a DMS representation in the GEM-MACH model for the Arctic domain. Two sets of seawater DMS(aq) data, CLIM11 and SAT, were used as the source of atmospheric DMS(g).
We compared the GEM-MACH simulation results with the DMS(g) measurements onboard the Polar 6 aircraft and the Amundsen from the NETCARE field studies on July 2014. Overall, the modelled DMS(g) from both CLIM11 and SAT simulations tracked the observations; however, both simulations under-predict the two high DMS(g) concentrations events in July. To consider the discrepancy between the measurement and model results, we conducted source sensitivity studies using the CLIM11 dataset. GEM-MACH represents better agreement with the measurement by adjusting the CLIM11 DMS(aq) dataset and using measured average DMS(aq) concentration values over Baffin Bay and the Lancaster Sound area. In general, the dominant influence of local sources on DMS(g) observed in the Arctic marine boundary layer during summer is supported by the source sensitivity tests conducted. The CLIM11 climatology clearly does not reflect the marine source well in the Arctic due to the very limited observations available. The satellite-derived sea surface water DMS dataset has the potential to address this shortcoming, as it seems to better reflect the high spatial and temporal inhomogeneity in DMS(aq) production. However, further development in retrieval algorithms is needed to address some of the limitations in the Arctic environment (IOCCG, 2015) e.g. over partially ice-covered sea surfaces (Bélanger et al., 2007) and in coastal waters with high loadings of continental materials (Mustapha et al., 2012).
Furthermore, for this first implementation of DMS in the GEM-MACH model, the DMS(g) oxidation occurs in the addition and abstraction pathways with the main oxidants, OH and NO3 radicals. The simulation results show that the abstraction pathway with the NO3 radical (up to 95 %) below 70∘ N and the addition pathway with the OH radical (up to 90 %) above 70∘ N are the dominant oxidation pathways for DMS(g) in the Arctic and subarctic. Neither aqueous phase oxidation nor halogen chemistry were included in this study. Both can be important additional DMS oxidation pathways, and further studies are needed to determine their role in the Arctic environment.
By adding DMS(g) in the GEM-MACH model, the atmospheric SO2 concentration increased (up to ∼100 % for some regions). This increase in may play a significant role in the growth and nucleation of aerosols. The enhancement of sulfate biogenic aerosols was also more pronounced in the size range from 10 to 200 nm. These fine–ultrafine particles are able to affect the climate indirectly by altering the CDNCs (e.g. Leaitch et al., 2016).
In addition, the role of SO2 formation from the OH-addition pathway via the MSIA–OH reaction was examined in the GEM-MACH model. Results indicated the importance of this pathway in the formation of SO2 and sulfate aerosol above 70∘ N.
This study highlights the importance of DMS(g) in the formation and growth of aerosols in remote areas, such as the Arctic atmosphere during summer. More broadly, our results stress the need to add interactive marine DMS emission and subsequent atmospheric processes (including oxidants) in the Intergovernmental Panel on Climate Change class of climate models, if we are to resolve ocean–atmosphere feedbacks in the changing Arctic environment and globally (Charlson et al., 1987; Levasseur, 2013). Further investigations and measurements are necessary to see the impact of DMS(g) in the SO2 concentration and sulfate aerosol distributions.
Data are available by email request from roghayeh.ghahremaninezhad@canada.ca.
The supplement related to this article is available online at: https://doi.org/10.5194/acp-19-14455-2019-supplement.
WG and RG designed the study. RG implemented DMS in the model under the supervision of WG and with assistance from SRB, AA, QZ and AL. MG and MLi provided the satellite and measurement DMS(aq) data under the supervision of MLe. RG performed the measurements under the supervision of ALN and WRL. RG prepared the paper with contributions from all co-authors.
The authors declare that they have no conflict of interest.
This article is part of the special issue “NETCARE (Network on Aerosols and Climate: Addressing Key Uncertainties in Remote Canadian Environments) (ACP/AMT/BG inter-journal SI)”. It is not associated with a conference.
We are thankful for the contribution of the Air Quality Research Division of the Environment and Climate Change of Canada in this study, especially Kenjiro Toyota, Balbir Pabla and Verica Savić-Jovčić. The measurement studies were part of the NETCARE project, and the authors would also like to thank the principal investigator Jonathan P. D. Abbatt, the crew of the Amundsen and the Polar 6, and fellow scientists.
This paper was edited by Lynn M. Russell and reviewed by four anonymous referees.
Abbatt, J. P. D., Leaitch, W. R., Aliabadi, A. A., Bertram, A. K., Blanchet, J.-P., Boivin-Rioux, A., Bozem, H., Burkart, J., Chang, R. Y. W., Charette, J., Chaubey, J. P., Christensen, R. J., Cirisan, A., Collins, D. B., Croft, B., Dionne, J., Evans, G. J., Fletcher, C. G., Galí, M., Ghahremaninezhad, R., Girard, E., Gong, W., Gosselin, M., Gourdal, M., Hanna, S. J., Hayashida, H., Herber, A. B., Hesaraki, S., Hoor, P., Huang, L., Hussherr, R., Irish, V. E., Keita, S. A., Kodros, J. K., Köllner, F., Kolonjari, F., Kunkel, D., Ladino, L. A., Law, K., Levasseur, M., Libois, Q., Liggio, J., Lizotte, M., Macdonald, K. M., Mahmood, R., Martin, R. V., Mason, R. H., Miller, L. A., Moravek, A., Mortenson, E., Mungall, E. L., Murphy, J. G., Namazi, M., Norman, A.-L., O'Neill, N. T., Pierce, J. R., Russell, L. M., Schneider, J., Schulz, H., Sharma, S., Si, M., Staebler, R. M., Steiner, N. S., Thomas, J. L., von Salzen, K., Wentzell, J. J. B., Willis, M. D., Wentworth, G. R., Xu, J.-W., and Yakobi-Hancock, J. D.: Overview paper: New insights into aerosol and climate in the Arctic, Atmos. Chem. Phys., 19, 2527–2560, https://doi.org/10.5194/acp-19-2527-2019, 2019.
Akingunola, A., Makar, P. A., Zhang, J., Darlington, A., Li, S.-M., Gordon, M., Moran, M. D., and Zheng, Q.: A chemical transport model study of plume-rise and particle size distribution for the Athabasca oil sands, Atmos. Chem. Phys., 18, 8667–8688, https://doi.org/10.5194/acp-18-8667-2018, 2018.
Alcolombri, U., Ben-Dor, S., Feldmesser, E., Levin, Y., Tawfik, D. S., and Vardi, A.: Identification of the algal dimethyl sulfide–releasing enzyme: a missing link in the marine sulfur cycle, Science, 348, 1466–1469, 2015.
Andreae, M. O.: Ocean-atmosphere interactions in the global biogeochemical sulfur cycle, Mar. Chem., 30, 1–29, 1990.
Ayers, G. P. and Cainey, J. M.: The CLAW hypothesis: a review of the major developments, Environ. Chem., 4, 366–374, 2007.
Barnes, I., Hjorth, J., and Mihalopoulos, N.: Dimethyl sulfide and dimethyl sulfoxide and their oxidation in the atmosphere, Chem. Rev., 106, 940–975, https://doi.org/10.1021/cr020529, 2006.
Bates, T. S., Charlson, R. J., and Gammon, R. H.: Evidence for climate role of marine biogenic sulphur, Nature, 329, 319–321, 1987.
Bélanger, S., Ehn, J. K., and Babin, M.: Impact of sea ice on the retrieval of water-leaving reflectance, chlorophyll a concentration and inherent optical properties from satellite ocean color data, Remote Sens. Environ., 111, 51–68, 2007.
Breider, T. J., Mickley, L. J., Jacob, D. J., Ge, C., Wang, J., Sulprizio, M. P., Croft, B., Ridley, D. A., McConnell, J. R., Sharma, S., Husain, L., Dutkiewicz, V. A., Eleftheriadis, K., Skov, H., and Hopke, P. K.: Multidecadal trends in aerosol radiative forcing over the Arctic: Contribution of changes in anthropogenic aerosol to Arctic warming since 1980, J. Geophys. Res.-Atmos., 122, 3573–3594, https://doi.org/10.1002/2016JD025321, 2017.
Burkart, J., Willis, M. D., Bozem, H., Thomas, J. L., Law, K., Hoor, P., Aliabadi, A. A., Köllner, F., Schneider, J., Herber, A., Abbatt, J. P. D., and Leaitch, W. R.: Summertime observations of elevated levels of ultrafine particles in the high Arctic marine boundary layer, Atmos. Chem. Phys., 17, 5515–5535, https://doi.org/10.5194/acp-17-5515-2017, 2017.
Chang, R. Y.-W., Sjostedt, S. J., Pierce, J. R., Papakyriakou, T. N., Scarratt, M. G., Michaud, S., Levasseur, M., Leaitch, W. R., and Abbatt, J. P. D.: Relating Atmospheric and Oceanic DMS Levels to Particle Nucleation Events During the Canadian Arctic Summer, J. Geophys. Res., 116, D00S03, https://doi.org/10.1029/2011JD015926, 2011.
Charlson, R. J., Lovelock, J. E., Andreae, M. O., and Warren, S. G.: Oceanic phytoplankton, atmospheric sulphur, cloud albedo and climate, Nature, 326, 655–661, 1987.
Charron, M., Polavarapu, S., Buehner, M., Vaillancourt, P. A., Charette, C., Roch, M., Morneau, J., Garand, L., Aparicio, J. M., MacPherson, S., Pellerin, S., St-James, J., and Heilliette, S.: The Stratospheric Extension of the Canadian Global Deterministic Medium-Range Weather Forecasting System and Its Impact on Tropospheric Forecasts, Mon. Weather Rev., 140, 1924–1944, https://doi.org/10.1175/MWR-D-11-00097.1, 2012.
Chin, M., Jacob, D. J., Gardner, G. M., Foreman Fowler, M. S., Spiro, P. A., and Savoie, D. L.: A global three dimensional model of troposphericsulfate, J. Geophys. Res., 101, 18667–18690, https://doi.org/10.1029/96JD01221, 1996.
Collins, D. B., Burkart, J., Chang, R. Y.-W., Lizotte, M., Boivin-Rioux, A., Blais, M., Mungall, E. L., Boyer, M., Irish, V. E., Massé, G., Kunkel, D., Tremblay, J.-É., Papakyriakou, T., Bertram, A. K., Bozem, H., Gosselin, M., Levasseur, M., and Abbatt, J. P. D.: Frequent ultrafine particle formation and growth in Canadian Arctic marine and coastal environments, Atmos. Chem. Phys., 17, 13119–13138, https://doi.org/10.5194/acp-17-13119-2017, 2017.
Côté, J., Gravel, S., Méthot, A., Patoine, A., Roch, M., and Staniforth, A.: The operational CMC–MRB Global Environmental Multiscale (GEM) model, Part I: Design considerations and formulation, Mon. Weather Rev., 126, 1373–1395, 1998a.
Côté, J., Desmarais, J.-G., Gravel, S., Méthot, A., Patoine, A., Roch, M., and Staniforth, A.: The operational CMC–MRB Global Environmental Multiscale (GEM) model, Part II: Results, Mon. Weather Rev., 126, 1397–1418, 1998b.
Croft, B., Martin, R. V., Leaitch, W. R., Tunved, P., Breider, T. J., D'Andrea, S. D., and Pierce, J. R.: Processes controlling the annual cycle of Arctic aerosol number and size distributions, Atmos. Chem. Phys., 16, 3665–3682, https://doi.org/10.5194/acp-16-3665-2016, 2016a.
Croft, B., Wentworth, G. R., Martin, R. V., Leaitch, W. R., Murphy, J. G., Murphy, B. N., Kodros, J. K., Abbatt, J. P., and Pierce, J. R.: Contribution of Arctic seabird-colony ammonia to atmospheric particles and cloud-albedo radiative effect, Nat. Commun., 7, 13444, https://doi.org/10.1038/ncomms13444, 2016b.
Croft, B., Martin, R. V., Leaitch, W. R., Burkart, J., Chang, R. Y.-W., Collins, D. B., Hayes, P. L., Hodshire, A. L., Huang, L., Kodros, J. K., Moravek, A., Mungall, E. L., Murphy, J. G., Sharma, S., Tremblay, S., Wentworth, G. R., Willis, M. D., Abbatt, J. P. D., and Pierce, J. R.: Arctic marine secondary organic aerosol contributes significantly to summertime particle size distributions in the Canadian Arctic Archipelago, Atmos. Chem. Phys., 19, 2787–2812, https://doi.org/10.5194/acp-19-2787-2019, 2019.
Dawson, M. L., Varner, M. E., Perraud, V., Ezell, M. J., Gerber, R. B., and Finlayson-Pitts, B. J.: Simplified mechanism for new particle formation from methanesulfonic acid, amines, and water via experiments and ab initio calculations, P. Natl. Acad. Sci. USA, 109, 18719–18724, 2012.
Elliott, S.: Dependence of DMS global sea-air flux distribution on transfer velocity and concentration field type, J. Geophys. Res.-Biogeo., 114, G02001, https://doi.org/10.1029/2008JG000710, 2009.
Emmons, L. K., Walters, S., Hess, P. G., Lamarque, J.-F., Pfister, G. G., Fillmore, D., Granier, C., Guenther, A., Kinnison, D., Laepple, T., Orlando, J., Tie, X., Tyndall, G., Wiedinmyer, C., Baughcum, S. L., and Kloster, S.: Description and evaluation of the Model for Ozone and Related chemical Tracers, version 4 (MOZART-4), Geosci. Model Dev., 3, 43–67, https://doi.org/10.5194/gmd-3-43-2010, 2010.
Ferland, J., Gosselin, M., and Starr, M.: Environmental control of summer primary production in the Hudson Bay system: The role of stratification, J. Marine Syst., 88, 385–400, https://doi.org/10.1016/j.jmarsys.2011.03.015, 2011.
Fuchs, N. A. and Sutugin, A. G.: Topics in current aerosol research, Part 2, edited by: Hidy, G. M. and Brock, J. R., Pergamon, New York, 1971.
Galí, M. and Simó, R.: A meta-analysis of oceanic DMS and DMSP cycling processes: Disentangling the summer paradox, Global Biogeochem. Cy., 29, 496–515, 2015.
Galí, M., Devred, E., Levasseur, M., Royer, S. J., and Babin, M.: A remote sensing algorithm for planktonic dimethylsulfoniopropionate (DMSP) and an analysis of global patterns, Remote Sens. Environ., 171, 171–184, 2015.
Galí, M., Levasseur, M., Devred, E., Simó, R., and Babin, M.: Sea-surface dimethylsulfide (DMS) concentration from satellite data at global and regional scales, Biogeosciences, 15, 3497–3519, https://doi.org/10.5194/bg-15-3497-2018, 2018.
Galí, M., Devred, E., Babin, M., and Levasseur, M.: Decadal increase in Arctic dimethylsulfide emission, P. Natl. Acad. Sci. USA, 116, 19311–19317, https://doi.org/10.1073/pnas.1904378116, 2019.
Garrett, T. J., Brattström, S., Sharma, S., Worthy, D. E. J., and Novelli, P.: The role of scavenging in the seasonal transport of black carbon and sulfate to the Arctic, Geophys. Res. Lett., 38, L16805, https://doi.org/10.1029/2011GL048221, 2011.
Ghahremaninezhad, R., Norman, A.-L., Abbatt, J. P. D., Levasseur, M., and Thomas, J. L.: Biogenic, anthropogenic and sea salt sulfate size-segregated aerosols in the Arctic summer, Atmos. Chem. Phys., 16, 5191–5202, https://doi.org/10.5194/acp-16-5191-2016, 2016.
Ghahremaninezhad, R., Norman, A.-L., Croft, B., Martin, R. V., Pierce, J. R., Burkart, J., Rempillo, O., Bozem, H., Kunkel, D., Thomas, J. L., Aliabadi, A. A., Wentworth, G. R., Levasseur, M., Staebler, R. M., Sharma, S., and Leaitch, W. R.: Boundary layer and free-tropospheric dimethyl sulfide in the Arctic spring and summer, Atmos. Chem. Phys., 17, 8757–8770, https://doi.org/10.5194/acp-17-8757-2017, 2017.
Gong, S. L., Barrie, L. A., Blanchet, J. P., Salzen, K. V., Lohmann, U., and Lesins, G.: Canadian Aerosol Module (CAM): a size-segregated simulation of atmospheric aerosol processes for climate and air quality models 1, Module development, J. Geophys. Res., 108, 4007, https://doi.org/10.1029/2001JD002002, 2003.
Gong, W., Dastoor, A. P., Bouchet, V. S., Gong, S.-L., Makar, P. A., Moran, M. D., Pabla, B., Ménard, S., Crevier, L.-P., Cousineau, S., and Venkatesh, S.: Cloud processing of gases and aerosols in a regional air quality model (AURAMS), Atmos. Res., 82, 248–275, 2006.
Gong, W., Makar, P. A., Zhang, J., Milbrandt, J., Gravel, S., Hayden, K. L., MacDonald, A. M., and Leaitch, W. R.: Modelling aerosolcloud- meteorology interaction: a case study with a fully coupled air quality model (GEM-MACH), Atmos. Environ., 115, 695–715, 2015.
Gong, W., Beagley, S. R., Cousineau, S., Sassi, M., Munoz-Alpizar, R., Ménard, S., Racine, J., Zhang, J., Chen, J., Morrison, H., Sharma, S., Huang, L., Bellavance, P., Ly, J., Izdebski, P., Lyons, L., and Holt, R.: Assessing the impact of shipping emissions on air pollution in the Canadian Arctic and northern regions: current and future modelled scenarios, Atmos. Chem. Phys., 18, 16653–16687, https://doi.org/10.5194/acp-18-16653-2018, 2018a.
Gong, W., Beagley, S. R., Zhang, J., Staebler, R., Aliabadi, A. A., Sharma, S., Tarasick, D., Burkart, J., Willis, M., Wentworth, G., Murphy, J., Bozem, H., Koellner, F., Schneider, J., Herber, A., Leaitch, W. R., and Abbatt, J.: Modelling Regional Air Quality in the Canadian Arctic: Simulation of an Arctic Summer Field Campaign, Air Pollution Modeling and Its Application XXV, edited by: Mensink, C. and Kallos, G., Springer, Dordrecht, 401–406, 2018b.
Gourdal, M., Lizotte, M., Massé, G., Gosselin, M., Poulin, M., Scarratt, M., Charette, J., and Levasseur, M.: Dimethyl sulfide dynamics in first-year sea ice melt ponds in the Canadian Arctic Archipelago, Biogeosciences, 15, 3169–3188, https://doi.org/10.5194/bg-15-3169-2018, 2018.
Haywood, J. and Boucher, O.: Estimates of the Direct and Indirect Radiative Forcing Due to Tropospheric Aerosols: A review, Rev. Geophys., 38, 515–543, 2000.
Hoffmann, E. H., Tilgner, A., Schrödner, R., Bräuer, P., Wolke, R., and Herrmann, H.: An advanced modeling study on the impacts and atmospheric implications of multiphase dimethyl sulfide chemistry, P. Natl. Acad. Sci. USA, 113, 11776–11781, https://doi.org/10.1073/pnas.1606320113, 2016.
Hynes, A. J., Wine, P. H., and Semmes, D. H.: Kinetics and mechanism of hydroxyl reactions with organic sulfides, J. Phys. Chem., 90, 4148–4156, https://doi.org/10.1021/j100408a062, 1986.
IOCCG: Ocean Colour Remote Sensing in Polar Seas, edited by: Babin, M., Arrigo, K., Bélanger, S., and Forget, M.-H., IOCCG Report Series, No. 16, International Ocean Colour Coordinating Group, Dartmouth, Canada, 2015.
Jacobson, M. Z., Turco, R. P., Jensen, E. J., and Toon, O. B.: Modeling coagulation among particles of different composition and size, Atmos. Environ., 28, 1327–1338, 1994.
Jeffery, C. D., Robinson, I. S., and Woolf, D. K.: Tuning a physically-based model of the air–sea gas transfer velocity, Ocean Model., 31, 28–35, https://doi.org/10.1016/j.ocemod.2009.09.001, 2010.
Jiang, W.: Instantaneous secondary organic aerosol yields and their comparison with overall aerosol yields for aromatic and biogenic hydrocarbons, Atmos. Environ., 37, 5439–5444, 2003.
Johnson, M. T.: A numerical scheme to calculate temperature and salinity dependent air-water transfer velocities for any gas, Ocean Sci., 6, 913–932, https://doi.org/10.5194/os-6-913-2010, 2010.
Kulmala, M., Laaksonen, A., and Pirjola, L.: Parameterizations for sulfuric acid/water nucleation rates, J. Geophys. Res., 103, 8301–8307, 1998.
Kulmala, M., Lehtinen, K. E. J., and Laaksonen, A.: Cluster activation theory as an explanation of the linear dependence between formation rate of 3 nm particles and sulphuric acid concentration, Atmos. Chem. Phys., 6, 787–793, https://doi.org/10.5194/acp-6-787-2006, 2006.
Lana, A., Bell, T. G., Simó, R., Vallina, S. M., Ballabrera-Poy, J., Kettle, A. J., Dachs, J., Bopp, L., Saltzman, E. S., Stefels, J., Johnson, J. E., and Liss, P. S.: An updated climatology of surface dimethlysulfide concentrations and emission fluxes in the global ocean, Global Biogeochem. Cy., 25, GB1004, https://doi.org/10.1029/2010GB003850, 2011.
Leaitch, W. R., Sharma, S., Huang, L., Toom-Sauntry, D., Chivulescu, A., Macdonald, A. M., von Salzen, K., Pierce, J. R., Bertram, A. K., Schroder, J. C., Shantz, N. C., Chang, R. Y.-W., and Norman, A.-L.: Dimethyl sulfide control of the clean summertime Arctic aerosol and cloud, Elementa: Science of the Anthropocene, 1, 000017, https://doi.org/10.12952/journal.elementa.000017, 2013.
Leaitch, W. R., Korolev, A., Aliabadi, A. A., Burkart, J., Willis, M. D., Abbatt, J. P. D., Bozem, H., Hoor, P., Köllner, F., Schneider, J., Herber, A., Konrad, C., and Brauner, R.: Effects of 20–100 nm particles on liquid clouds in the clean summertime Arctic, Atmos. Chem. Phys., 16, 11107–11124, https://doi.org/10.5194/acp-16-11107-2016, 2016.
Leaitch, W. R., Russell, L. M., Liu, J., Kolonjari, F., Toom, D., Huang, L., Sharma, S., Chivulescu, A., Veber, D., and Zhang, W.: Organic functional groups in the submicron aerosol at 82.5∘ N, 62.5∘ W from 2012 to 2014, Atmos. Chem. Phys., 18, 3269–3287, https://doi.org/10.5194/acp-18-3269-2018, 2018.
Leck, C. and Bigg, E. K.: Biogenic particles in the surface microlayer and overlaying atmosphere in the central Arctic Ocean during summer, Tellus B, 57, 305–316, 2005a.
Leck, C. and Bigg, E. K.: Source and evolution of the marine aerosol – A new perspective, Geophys. Res. Lett., 32, 1–4, 2005b.
Leck, C. and Persson, C.: The central Arctic Ocean as a source of dimethylsulphide seasonal variability in relation to biological activity, Tellus B, 48, 156–177, 1996.
Levasseur, M.: Impact of Arctic meltdown on the microbial cycling of sulfur, Nat. Geosci., 6, 691–700, 2013.
Liss, P. S. and Merlivat, L.: Air-sea gas exchange rates: Introduction and synthesis, in: The role of air-sea exchange in geochemical cycling, 113–127, Springer, D. Reidel, Hingham, Mass., 1986.
Lizotte, M., Levasseur, M., Michaud, S., Scarratt, M. G., Merzouk, A., Gosselin, M., Pommier, J., Rivkin, R. B., and Kiene, R. P.: Macroscale patterns of the biological cycling of dimethylsulfoniopropionate (DMSP) and dimethylsulfide (DMS) in the Northwest Atlantic, Biogeochemistry, 110, 183–200, 2012.
Loose, B., McGillis, W. R., Perovich, D., Zappa, C. J., and Schlosser, P.: A parameter model of gas exchange for the seasonal sea ice zone, Ocean Sci., 10, 17–28, https://doi.org/10.5194/os-10-17-2014, 2014.
Lunden, J., Svensson, G., Wisthaler, A., Tjernstrom, M., Hansel, A., and Leck, C.: The vertical distribution of atmospheric DMS(G) in the high Arctic summer, Tellus B, 62, 160–171, https://doi.org/10.1111/j.1600-0889.2010.00458.x, 2010.
Lurmann, F., Lloyd, A. C., and Atkinson, R.: A chemical mechanism for use in long-range transport/acid deposition computer modeling, J. Geophys. Res., 91, 10905–10936, 1986.
Mahmood, R., von Salzen, K., Norman, A.-L., Galí, M., and Levasseur, M.: Sensitivity of Arctic sulfate aerosol and clouds to changes in future surface seawater dimethylsulfide concentrations, Atmos. Chem. Phys., 19, 6419–6435, https://doi.org/10.5194/acp-19-6419-2019, 2019.
Marelle, L., Raut, J.-C., Law, K. S., Berg, L. K., Fast, J. D., Easter, R. C., Shrivastava, M., and Thomas, J. L.: Improvements to the WRF-Chem 3.5.1 model for quasi-hemispheric simulations of aerosols and ozone in the Arctic, Geosci. Model Dev., 10, 3661–3677, https://doi.org/10.5194/gmd-10-3661-2017, 2017.
Makar, P. A., Bouchet, V. S., and Nenes, A.: Inorganic chemistry calculations using HETV – a vectorized solver for the –– system based on the ISORROPIA algorithms, Atmos. Environ., 37, 2279–2294, 2003.
Makar, P. A., Gong, W., Milbrandt, J., Hogrefe, C., Zhang, Y., Curci, G., Zabkar, R., Im, U., Balzarini, A., Baro, R., Bianconi, R., Cheung, P., Forkel, R., Gravel, S., Hirtl, H., Honzak, L., Hou, A., Jimenz-Guerrero, P., Langer, M., Moran, M. D., Pabla, B., Perez, J. L., Pirovano, G., San Jose, R., Tuccella, P., Werhahn, J., Zhang, J., and Galmarini, S.: Feedbacks between air pollution and weather, part 1: Effects on weather, Atmos. Environ., 115, 442–469, 2015a.
Makar, P. A., Gong, W., Hogrefe, C., Zhang, Y., Curci, G., Zabkar, R., Milbrandt, J., Im, U., Balzarini, A., Baro, R., Bianconi, R., Cheung, P., Forkel, R., Gravel, S., Hirtl, H., Honzak, L., Hou, A., Jimenz-Guerrero, P., Langer, M., Moran, M. D., Pabla, B., Perez, J. L., Pirovano, G., San Jose, R., Tuccella, P., Werhahn, J., Zhang, J., and Galmarini, S.: Feedbacks between air pollution and weather, part 2: Effects on chemistry, Atmos. Environ., 115, 499–526, 2015b.
Makar, P. A., Akingunola, A., Aherne, J., Cole, A. S., Aklilu, Y.-A., Zhang, J., Wong, I., Hayden, K., Li, S.-M., Kirk, J., Scott, K., Moran, M. D., Robichaud, A., Cathcart, H., Baratzedah, P., Pabla, B., Cheung, P., Zheng, Q., and Jeffries, D. S.: Estimates of exceedances of critical loads for acidifying deposition in Alberta and Saskatchewan, Atmos. Chem. Phys., 18, 9897–9927, https://doi.org/10.5194/acp-18-9897-2018, 2018.
Keller, M. D.: Dimethyl Sulfide Production and MarinePhytoplankton: The Importance of Species Composition and Cell Size, Biological Oceanography, 6, 375–382, 1989.
Ming, Y. and Russell, L. M..: Predicted hygroscopic growth of sea salt aerosol, J. Geophys. Res.-Atmos., 106, 28259–28274, 2001.
Moran, M. D., Menard, S., Talbot, D., Huang, P., Makar, P. A., Gong, W., Landry, H., Gravel, S., Gong, S., Crevier, L.-P., Kallaur, A., and Sassi, M.: Particulate-matter forecasting with GEM-MACH15, a new Canadian air-quality forecast model, in: Air Pollution Modelling and Its Application XX, edited by: Steyn, D. G. and Rao, S. T., Springer, Dordrecht, the Netherlands, 289–292, 2010.
Moran, M., Menard, S., Gravel, S., Pavlovic, R., and Anselmo, D.: RAQDPS Versions 1.5.0 and 1.5.1: Upgrades to the CMC Operational Regional Air Quality Deterministic Prediction System Released in October 2012 and February 2013, Technical report, Canadian Meteorological Centre, Canadian Meteorological Centre, Dorval, Quebec, 2013.
Mustapha, S. B., Bélanger, S., and Larouche, P.: Evaluation of ocean color algorithms in the southeastern Beaufort Sea, Canadian Arctic: New parameterization using SeaWiFS, MODIS, and MERIS spectral bands, Can. J. Remote Sens., 38, 535–556, 2012.
Mungall, E. L., Croft, B., Lizotte, M., Thomas, J. L., Murphy, J. G., Levasseur, M., Martin, R. V., Wentzell, J. J. B., Liggio, J., and Abbatt, J. P. D.: Dimethyl sulfide in the summertime Arctic atmosphere: measurements and source sensitivity simulations, Atmos. Chem. Phys., 16, 6665–6680, https://doi.org/10.5194/acp-16-6665-2016, 2016.
Nenes, A., Pilinis, C., and Pandis, S. N.: Continued development and testing of a new thermodynamic aerosol module for urban and regional air quality models, Atmos. Environ., 33, 1553–1560, 1999.
Norman, A. L., Barrie, L. A., Toom-Sauntry, D., Sirois, A., Krouse, H. R., Li, S. M., and Sharma, S.: Sources of aerosol sulphate at Alert: apportionment using stable isotopes, J. Geophys. Res., 104, 11619–11631, 1999.
Odum, J. R., Hoffmann, T., Bowman, F., Collins, D., Flagan, R. C., and Seinfeld, J. H.: Gas/particle partitioning and secondary organic aerosol yields, Environ. Sci. Technol., 30, 2580–2585, 1996.
Quinn, P. K., Collins, D. B., Grassian, V. H., Prather, K. A., and Bates, T. S.: Chemistry and Related Properties of Freshly Emitted Sea Spray Aerosol, Chem. Rev., 115, 4383–4399, https://doi.org/10.1021/cr500713g, 2015.
Quinn, P. K., Coffman, D. J., Johnson, J. E., Upchurch, L. M., and Bates, T. S.: Small fraction of marine cloud condensation nuclei made up of sea spray aerosol, Nat. Geosci., 10, 674–679, https://doi.org/10.1038/ngeo3003, 2017.
Reddington, C. L., Carslaw, K. S., Stier, P., Schutgens, N., Coe, H., Liu, D., Allan, J., Browse, J., Pringle, K. J., Lee, L. A., Yoshioka, M., Johnson, J. S., Regayre, L. A., Spracklen, D. V., Mann, G. W., Clarke, A., Hermann, M., Henning, S., Wex, H., Kristensen, T. B., Leaitch, W. R., Pöschl, U., Rose, D., Andreae, M. O., Schmale, J., Kondo, Y., Oshima, N., Schwarz, J. P., Nenes, A., Anderson, B., Roberts, G. C., Snider, J. R., Leck, C., Quinn, P. K., Chi, X., Ding, A., Jimenez, J. L., and Zhang, Q.: The Global Aerosol Synthesis and Science Project (GASSP): Measurements and Modeling to Reduce Uncertainty, B. Am. Meteorol. Soc., 98, 1857–1877, https://doi.org/10.1175/BAMS-D-15-00317.1, 2017.
Rempillo, O., Seguin, A. M., Norman, A.-L., Scarratt, M., Michaud, S., Chang, R., Sjostedt, S., Abbatt, J., Else, B., Papakyriakou, T., Sharma, S., Grasby, S., and Levasseur, M.: Dimethyl sulfide air-sea fluxes and biogenic sulfur as a source of new aerosols in the Arctic fall, J. Geophys. Res.-Atmos., 116, D00S04, https://doi.org/10.1029/2011JD016336, 2011.
Sanchez, K. J., Chen, C.-L., Russell, L. M., Betha, R., Liu, J., Price, D. J., Massoli, P., Ziemba, L. D., Crosbie, E. C., Moore, R. H., Müller, M., Schiller, S. A., Wisthaler, A., Lee, A. K. Y., Quinn, P. K., Bates, T. S., Porter, J., Bell, T. G., Saltzman, E. S., Vaillancourt, R. D., and Behrenfeld, M. J.: Substantial Seasonal Contribution of Observed Biogenic Sulfate Particles to Cloud Condensation Nuclei, Sci. Rep.-UK, 8, 3235, https://doi.org/10.1038/s41598-018-21590-9, 2018.
Seinfeld, J. H. and Pandis, S. N.: Atmospheric Chemistry and Physics, 1326 pp., John Wiley, New York, 1998.
Sharma, S., Barrie, L. A., Plummer, D., McConnell, J. C., Brickell, P. C., Levasseur, M., Gosselin, M., and Bates, T. S.: Flux estimation of oceanic dimethyl sulfide around North America, J. Geophys. Res., 104, 21327–21342, 1999.
Sharma, S., Chan, E., Ishizawa, M., Toom-Sauntry, D., Gong, S. L., Li, S. M., Leaitch,W. R., Norman, A., Quinn, P. K., Bates, T. S., Levasseur, M., Barrie, L. A., and Maenhaut, W.: Influence of Transport and Ocean Ice 9 Extent on Biogenic Aerosol Sulfur in the Arctic Atmosphere, J. Geophys. Res.-Atmos., 117, D12209, https://doi.org/10.1029/2011JD017074, 2012.
Simó, R. and Pedrós-Alió, C.: Role of vertical mixing in controlling the oceanic production of dimethyl sulphide, Nature, 402, 396–399, 1999.
Sirois, A. and Barrie, L. A.: Arctic lower tropospheric aerosol trends and composition at Alert, Canada: 1980–1995, J. Geophys. Res., 104, 11599–11618, 1999.
Stockwell, W. R. and Lurmann, F. W.: Intercomparison of the ADOM and RADM gas-phase chemical mechanisms. Electrical Power Research Institute Topical Report, EPRI, 3412 Hillview Avenue, Paolo Alto, CA, USA, 254 pp., 1989.
Stone, R. S., Sharma, S., Herber, A., Eleftheriadis, K., and Nelson, D. W.: A characterization of Arctic aerosols on the basis of aerosol optical depth and black carbon measurements, Elementa: Science of Anthropocene, 2, 000027, https://doi.org/10.12952/journal.elementa.000027, 2014.
Stroud, C. A., Makar, P. A., Zhang, J., Moran, M. D., Akingunola, A., Li, S.-M., Leithead, A., Hayden, K., and Siu, M.: Improving air quality model predictions of organic species using measurement-derived organic gaseous and particle emissions in a petrochemical-dominated region, Atmos. Chem. Phys., 18, 13531–13545, https://doi.org/10.5194/acp-18-13531-2018, 2018.
Tremblay, S., Picard, J.-C., Bachelder, J. O., Lutsch, E., Strong, K., Fogal, P., Leaitch, W. R., Sharma, S., Kolonjari, F., Cox, C. J., Chang, R. Y.-W., and Hayes, P. L.: Characterization of aerosol growth events over Ellesmere Island during the summers of 2015 and 2016, Atmos. Chem. Phys., 19, 5589–5604, https://doi.org/10.5194/acp-19-5589-2019, 2019.
Uttal, T., Starkweather, S., Drummond, J. R., Vihma, T., Makshtas, A. P., Darby, L. S., Burkhart, J. F., Cox, C. J., Schmeisser, L. N., Haiden, T., Maturilli, M., Shupe, M. D., De Boer, G., Saha, A., Grachev, A. A., Crepinsek, S. M., Bruhwiler, L., Goodison, B., McArthur, B., Walden, V. P., Dlugokencky, E. J., Persson, P. O., Lesins, G., Laurila, T., Ogren, J. A., Stone, R., Long, C. N., Sharma, S., Massling, A., Turner, D. D., Stanitski, D. M., Asmi, E., Aurela, M., Skov, H., Eleftheriadis, K., Virkkula, A., Platt, A., Førland, E. J., Iijima, Y., Nielsen, I. E., Bergin, M. H., Candlish, L., Zimov, N. S., Zimov, S. A., O'Neill, N. T., Fogal, P. F., Kivi, R., Konopleva-Akish, E. A., Verlinde, J., Kustov, V. Y., Vasel, B., Ivakhov, V. M., Viisanen, Y., and Intrieri, J. M.: International Arctic Systems for Observing the Atmosphere: An International Polar Year Legacy Consortium, B. Am. Meteorol. Soc., 97, 1033–1056, https://doi.org/10.1175/BAMS-D-14-00145.1, 2016.
van der Loeff, M. M. R., Cassar, N., Nicolaus, M., Rabe, B., and Stimac, I.: The influence of sea ice cover on air-sea gas exchange estimated with radon-222 profiles, J. Geophys. Res.-Oceans, 119, 2735–2751, 2014.
von Glasow, R. and Crutzen, P. J.: Model study of multiphase DMS oxidation with a focus on halogens, Atmos. Chem. Phys., 4, 589–608, https://doi.org/10.5194/acp-4-589-2004, 2004.
Willis, M. D., Burkart, J., Thomas, J. L., Köllner, F., Schneider, J., Bozem, H., Hoor, P. M., Aliabadi, A. A., Schulz, H., Herber, A. B., Leaitch, W. R., and Abbatt, J. P. D.: Growth of nucleation mode particles in the summertime Arctic: a case study, Atmos. Chem. Phys., 16, 7663–7679, https://doi.org/10.5194/acp-16-7663-2016, 2016.
Yang, Y., Wang, H., Smith, S. J., Easter, R. C., and Rasch, P. J.: Sulfate aerosol in the Arctic: Source attribution and radiative forcing, J. Geophys. Res.-Atmos., 123, 1899–1918, https://doi.org/10.1002/2017JD027298, 2018.
Yin, F., Grosjean, D., and Seinfeld, J. H.: Photooxidation of dimethyl sulfide and dimethyl disulfide: I. Mechanism development, J. Atmos. Chem., 11, 309–364, https://doi.org/10.1007/BF00053780, 1990.


