the Creative Commons Attribution 4.0 License.
the Creative Commons Attribution 4.0 License.
 | 11 Nov 2019
Nitrification of the lowermost stratosphere during the exceptionally cold Arctic winter 2015–2016
Marleen Braun
Jens-Uwe Grooß
Wolfgang Woiwode
Sören Johansson
Michael Höpfner
Felix Friedl-Vallon
Hermann Oelhaf
Peter Preusse
Jörn Ungermann
Björn-Martin Sinnhuber
Helmut Ziereis
Peter Braesicke
The Arctic winter 2015–2016 was characterized by exceptionally low stratospheric temperatures, favouring the formation of polar stratospheric clouds (PSCs) from mid-December until the end of February down to low stratospheric altitudes. Observations by GLORIA (Gimballed Limb Observer for Radiance Imaging of the Atmosphere) on HALO (High Altitude and LOng range research aircraft) during the PGS (POLSTRACC–GW-LCYCLE II–SALSA) campaign from December 2015 to March 2016 allow the investigation of the influence of denitrification on the lowermost stratosphere (LMS) with a high spatial resolution. Two-dimensional vertical cross sections of nitric acid (HNO3) along the flight track and tracer–tracer correlations derived from the GLORIA observations document detailed pictures of wide-spread nitrification of the Arctic LMS during the course of an entire winter. GLORIA observations show large-scale structures and local fine structures with enhanced absolute HNO3 volume mixing ratios reaching up to 11 ppbv at altitudes of 13 km in January and nitrified filaments persisting until the middle of March. Narrow coherent structures tilted with altitude of enhanced HNO3, observed in mid-January, are interpreted as regions recently nitrified by sublimating HNO3-containing particles. Overall, extensive nitrification of the LMS between 5.0 and 7.0 ppbv at potential temperature levels between 350 and 380 K is estimated. The GLORIA observations are compared with CLaMS (Chemical Lagrangian Model of the Stratosphere) simulations. The fundamental structures observed by GLORIA are well reproduced, but differences in the fine structures are diagnosed. Further, CLaMS predominantly underestimates the spatial extent of HNO3 maxima derived from the GLORIA observations as well as the overall nitrification of the LMS. Sensitivity simulations with CLaMS including (i) enhanced sedimentation rates in case of ice supersaturation (to resemble ice nucleation on nitric acid trihydrate (NAT)), (ii) a global temperature offset, (iii) modified growth rates (to resemble aspherical particles with larger surfaces) and (iv) temperature fluctuations (to resemble the impact of small-scale mountain waves) slightly improved the agreement with the GLORIA observations of individual flights. However, no parameter could be isolated which resulted in a general improvement for all flights. Still, the sensitivity simulations suggest that details of particle microphysics play a significant role for simulated LMS nitrification in January, while air subsidence, transport and mixing become increasingly important for the simulated HNO3 distributions towards the end of the winter.
- Article
(8135 KB) - Full-text XML
- BibTeX
- EndNote


The processes of denitrification and nitrification are well-known phenomena occurring in the polar winter stratosphere (Fahey et al., 1990). They involve the condensation, growth, sedimentation and sublimation of nitric acid (HNO3)-containing polar stratospheric cloud (PSC) particles and result in an irreversible vertical redistribution of HNO3. Denitrification is known to affect polar winter ozone loss (Fahey et al., 1990; Waibel, 1999). Denitrification at higher layers (i.e. around 16 to 22 km) attenuates fast deactivation of catalytically active chlorine species into the reservoir species chlorine nitrate (ClONO2). However, chlorine deactivation can be fostered at lower layers enriched in HNO3 (i.e. nitrified) by evaporating nitric acid trihydrate (NAT) particles (Fischer et al., 1997). Observational evidence for particles other than NAT involved in denitrification is sparse (e.g. Tabazadeh and Toon, 1996; Kim et al., 2006). Nitrification of the lowermost stratosphere is of particular interest since the chemical budget of reactive nitrogen (NOy) and, thereby, its possible effects on ozone are modified in a region important for the radiative budget of the atmosphere (Riese et al., 2012).
While fundamental processes in connection with PSCs are well understood, there are still uncertainties concerning the formation of NAT particles and their characteristics that influence the processes of denitrification and nitrification. Chemistry-transport and global-chemistry models including simplified microphysical properties of NAT are generally successful in simulating denitrification of the polar winter stratosphere (Carslaw, 2002; Grooß et al., 2005, 2014; Khosrawi et al., 2017; Zhu et al., 2017, and references therein). However, parametrizations resulting in agreement with observed size distributions of NAT particles, particularly extremely large NAT particles, and reproducing fine structures of observed denitrification patterns remain an issue (e.g. Molleker et al., 2014; Woiwode et al., 2014).
Hemispheric differences in nitrification are observed due to different conditions in Antarctic and Arctic winter vortices. In the Antarctic, cold and stable vortices result in widespread PSC coverage and denitrification over wide vertical ranges. PSCs are observed less frequently in the Arctic, and the degree of denitrification varies from winter to winter (Santee et al., 1999; Pitts et al., 2018, and references therein). Increasing greenhouse gas emissions could lead to lower stratospheric temperatures (e.g. Rex et al., 2006), which likely cause stronger denitrification of the Arctic stratosphere.
Numerous studies addressed denitrification in Arctic winters, especially in cold winters, e.g. 1994–1995 (Waibel, 1999), 1999–2000 (Popp et al., 2001), 2004–2005 (Jin et al., 2006), 2009–2010 (Khosrawi et al., 2011; Woiwode et al., 2014), 2010–2011 (Sinnhuber et al., 2011) and 2015–2016 (Khosrawi et al., 2017). While most of these studies focused on the denitrification at altitudes higher than roughly 15 km, less attention was paid to the associated nitrification of lower layers. Dibb et al. (2006) reported nitrification at potential temperature levels above 340 K (around 12 km) at the end of January 2005. Further, Hübler et al. (1990) interpreted enhanced mixing ratios of up to 12 ppbv at altitudes between 10 and 12.5 km in the Arctic winter 1988–1989 as resulting from nitrification. Tuck et al. (1997) found indications for nitrification in the Antarctic at levels above 400 K in the Antarctic winter 1994. Particularly, nitrification of the Arctic lowermost stratosphere (LMS) has hardly been investigated. This is due to the fact that cold winters with strong denitrification were rare events in the Arctic stratosphere in the past and that the observational capabilities to resolve nitrification of the LMS with sufficient coverage and vertical resolution are sparse. For example, limb sounders, like MLS (Microwave Limb Sounder; Waters et al., 2006) or MIPAS (Michelson Interferometer for Passive Atmospheric Sounding; Fischer et al., 2008) typically have vertical resolutions of around 3–5 km making it difficult to resolve fine-scale structures of NOy redistribution.
The process of vertical HNO3 redistribution is very sensitive to temperature. NAT particle nucleation may begin as soon as temperatures fall below NAT equilibrium temperature TNAT. However, clear evidence of the precise nucleation conditions of NAT particles is still lacking. NAT particles are nucleated heterogeneously with low number densities on foreign nuclei such as meteoritic dust particles (Hoyle et al., 2013). Below TNAT, these particle grow and sediment downward, and they evaporate as temperatures rise above TNAT. A simulation of this process is challenging as it depends both on the nucleation parametrization and on the precise reproduction of the temperatures around TNAT. This is especially the case during the onset of this process. At a later time, to nucleate new NAT particles in denitrified air, lower temperatures are needed because of the already decreased HNO3 mixing ratios. This results in a maximum potential denitrification for a given temperature. Since both the nucleation process and the mesoscale temperature modulations (e.g. by gravity waves) are not well known, it is especially difficult to simulate the small-scale structure of HNO3 during the onset period.
Here, we present observations of nitrification of the LMS in the unusually cold Arctic winter 2015–2016 by the airborne limb-imaging Fourier transform infrared (FTIR) spectrometer GLORIA (Gimballed Limb Observer for Radiance Imaging of the Atmosphere, Friedl-Vallon et al., 2014; Riese et al., 2014). In that winter, an extraordinarily cold and stable polar vortex (Matthias et al., 2016; Manney and Lawrence, 2016) promoted a long-lasting PSC phase from mid-December until the end of February with a large vertical extent (Pitts et al., 2018; Voigt et al., 2018) reaching down into the LMS.
Using the GLORIA observations and simulations by the Chemical Lagrangian Model of the Stratosphere (CLaMS; Grooß et al., 2014, references therein), we investigate following research questions.
-
How are HNO3 distributions structured in the LMS during the course of the cold Arctic winter 2015–2016? How do HNO3 distributions, which are affected by nitrification, compare with the stratospheric tracer ozone? How do observed small-scale spatial patters compare with a model (CLaMS)?
-
Do tracer–tracer correlations constructed from GLORIA HNO3 and O3 indicate nitrification of the LMS? How does nitrification inferred from the GLORIA observations compare with that inferred from CLaMS? Can we identify a critical model parameter which results in a significant overall improvement of the agreement?
Thereby, we attempt to quantify the observed nitrification, which is particularly difficult because the LMS composition is influenced by air masses originating from the Arctic vortex, the extra-vortex stratosphere and the troposphere (Werner et al., 2010; Gettelman et al., 2011; Krause et al., 2018). ClONO2 also contributed significantly to lowermost stratospheric total NOy during the Arctic winter 2015–2016. This aspect is addressed within a separate study by Johansson et al. (2019). Here we focus only on gas-phase HNO3, which is the direct product of nitrification by sublimating NAT particles.
We compare the GLORIA data with simulations by the CLaMS. To test how well different parametrizations within the same model reproduce the GLORIA observations, four sensitivity studies were performed. Those sensitivity simulations investigated the impact of (i) enhanced sedimentation rates in case of ice supersaturation, (ii) a global temperature offset, (iii) modified growth rates and (iv) temperature fluctuations.
2.1 POLSTRACC–GW-LCYCLE II–SALSA
The GLORIA observations analysed in this study were obtained during the combined POLSTRACC (POLar STRAtosphere in a Changing Climate), GW-LCYCLE II (Gravity Wave Life Cycle Experiment) and SALSA (Seasonality of Air mass transport and origin in the Lowermost Stratosphere using the HALO Aircraft) campaigns (PGS). Starting from Oberpfaffenhofen, Germany, or from Kiruna, Sweden, 18 research flights were carried out by the German research aircraft HALO (High Altitude and LOng range research aircraft) between December 2015 and March 2016. The flights probed an entire winter period in the LMS at high northern latitudes. For this study five research flights between December and March were used. The selection of the flight data was based on data availability and scientific requirements. Data availability was limited to flight sections where GLORIA was operated in the high spectral resolution “chemistry mode” (Friedl-Vallon et al., 2014) used in this study (see Sect. 2.2) and sufficiently cloud-free conditions allowing for the retrieval of HNO3. From the scientific point of view, flights with long continuous chemistry mode measurements were chosen to show how patterns in the lowermost stratospheric HNO3 distribution change during the winter. We furthermore focus on flights in January, where PSCs reached down to the LMS and where the most notable changes are found in the observed HNO3 distributions. Since we use ozone as stratospheric tracer to quantify nitrification, flights in January are preferable since only little chemical ozone loss was diagnosed at this time of the winter when compared to February and March (see Johansson et al., 2019). Further GLORIA chemistry mode observations can be found in the supplementary information of Johansson et al. (2018a) and at the HALO Database (https://halo-db.pa.op.dlr.de/, last access: 4 November 2019).
2.2 GLORIA
GLORIA is an airborne infrared limb imaging spectrometer (Friedl-Vallon et al., 2014). During PGS, GLORIA has been operated on board the HALO aircraft and pointed to the right-hand side of the flight path. GLORIA combines a Michelson interferometer with an imaging HgCdTe detector which records 128 vertical and 48 horizontal interferograms simultaneously. All interferograms are transformed into spectra. The spectra from horizontal detector rows are averaged for noise reduction prior to the atmospheric parameter retrieval (Kleinert et al., 2014). In high spectral resolution mode, which is used in this study, the spectrometer covers the range from 780 to 1400 cm−1 with a spectral sampling of 0.0625 cm−1. For the retrieval, the radiative transfer code KOPRA (Karlsruhe Optimized and Precise Radiative transfer Algorithm; Stiller et al., 2002) and the inversion tool KOPRAFIT (Höpfner et al., 2001) were used. Estimated uncertainties of the GLORIA retrieval results are typically 1–2 K for temperature and 10 %–20 % for trace gases. Typical vertical resolutions of the retrieved profiles are about 400 m at flight altitude and decrease to about 1000 m around the lowest tangent points. A detailed description and validation of the dataset used in this study is given by Johansson et al. (2018a).
2.3 CLaMS
The Chemical Lagrangian Model of the Stratosphere (CLaMS) (McKenna, 2002a, b) is a chemistry transport model based on trajectory calculations for an ensemble of air parcels. CLaMS includes modules simulating Lagrangian trajectories, mixing, chemical processes and Lagrangian particle sedimentation. The CLaMS simulations used here were performed with a special setup for the POLSTRACC campaign with a horizontal resolution of about 100 km and a vertical resolution of about 500–900 m in the lower stratosphere above 10 km altitude decreasing to about 2 km below 9 km altitude. Further, this configuration includes a comprehensive stratospheric chemistry as described by Grooß et al. (2014). The simulations were performed for the entire winter and were based on meteorological wind and temperature data from the ECMWF ERA interim reanalysis (Dee et al., 2011) employing a horizontal resolution of 1 degree×1 degree and a time step of 6 h. To simulate processes connected to NAT particles, particle parcels are implemented (Grooß et al., 2005, 2014). Particle size and number concentration are assigned to each particle parcel so that various particle parcels in one air parcel determine the particle size distribution. NAT and ice nucleation is temperature and saturation dependent and is parameterized by the scheme by Hoyle et al. (2013) and Engel et al. (2013), respectively. Particle growth and evaporation are calculated along particle trajectories based on Carslaw (2002) assuming the characteristics of spherical particles (Tritscher et al., 2019). Comparisons with PSC observations (Tritscher et al., 2019) show that the parametrization of nucleation and sedimentation of NAT and ice particles in CLaMS is capable to reproduce the main features of PSC observations. Also, vortex averages of the vertical redistribution of HNO3 and H2O have been reproduced (Tritscher et al., 2019).
3.1 GLORIA vertical cross sections of atmospheric parameters
The GLORIA retrieval results in vertical profiles of atmospheric parameters. These vertical profiles are combined to two-dimensional quasi-vertical cross sections along the flight paths and show mesoscale atmospheric structures (Johansson et al., 2018a). Since the observations are performed in limb mode, the distance of the tangent points (i.e where the major information about atmospheric parameters stems from) gradually increases from the observer for the lower limb views. This is reflected by the tangent point distributions discussed in Sect. 4.1 to 4.3. The GLORIA data are filtered for cloud-affected observations, and data points with a vertical resolution worse than 2 km or above flight altitude are neglected for further analysis.
3.2 Simulated cross sections from CLaMS
For comparison with GLORIA, the CLaMS data were interpolated to the retrieval grid geolocations, characterized by altitude, latitude, longitude and time of the tangent points. The temporal interpolation with respect to atmospheric dynamics is performed by trajectory calculations. CLaMS output is typically saved daily at 12:00 UTC. Therefore forward trajectories are calculated for points between 00:00 and 12:00 until 12:00 UTC. The corresponding 12:00 UTC volume mixing ratio is then assumed as concentration of the original geolocation based on the assumption that chemical and physical changes in volume mixing ratios during the time of the trajectory calculations are negligible for the chemical species considered here. For points between 12:00 and 00:00 UTC backward trajectories are calculated analogously.
3.3 Identification of sub-vortex air
The altitude range of GLORIA observations in this study typically lies within the LMS, ranging from the tropopause to the 380 K isentrope (see Werner et al., 2010, and references therein). It has to be pointed out that robust identification of vortex air in the LMS is not possible due to dynamical disturbances, transport and in-mixing of air masses from different origins. In fact, the sub-vortex region in the LMS has a more filamentary character and is affected by interaction with air masses from the extra-vortex stratospheric overworld, the extra-tropical transition layer (ExTL) and the troposphere (Gettelman et al., 2011). Two filters have been applied to select data points associated with the sub-vortex region.
The first filter applied is the criterion by Nash et al. (1996) at the 370 K isentrope and is based on the potential vorticity (PV) field obtained from the MERRA-2 reanalysis (Gelaro et al., 2017). Grid points with latitude–longitude pairs outside the polar vortex at the potential temperature (θ) level of 370 K are classified as non-vortex points. Secondly, data are filtered by scaled potential vorticity (sPV) calculated from MERRA-2 reanalysis data with a threshold of s−1. sPV is calculated by dividing the potential vorticity (PV) by to obtain similar PV ranges for all isentropic levels that are investigated (Manney et al., 1994; Dunkerton and Delisi, 1986). Therefore this filter takes the altitude information of the grid points into account. Data points in the tracer correlations (see below) are attributed to sub-vortex air, if both criteria are met.
3.4 Quantification of nitrification based on tracer–tracer correlations using relative normalized frequency distributions
To quantify nitrification in the LMS tracer–tracer correlations of HNO3 and O3 associated with sub-vortex air are analysed. Here, we use ozone as an approximation of a passive reference tracer, since ozone is well accessible with GLORIA and shows a sufficient vertical gradient in the LMS region. The choice of ozone as a passive tracer is based on the assumption that ozone depletion is small in January as the air is hardly exposed to sunlight. The model study by Khosrawi et al. (2017) supports this assumption. Two aspects can affect the correlation: (1) mixing with extra-vortex air masses not affected by nitrification would lead to an underestimation of HNO3 introduced into the LMS by nitrification and (2) potential ozone depletion would shift higher HNO3 mixing ratios to lower ozone values, thus enhancing estimated nitrification.
As correlation scatter plots of measured data for several flights are difficult to assess due to the large number of individual points, estimates of relative normalized frequency distributions (RNFDs), as described by Eckstein et al. (2018), are used in this study. This method calculates a scaled two-dimensional histogram on a volume mixing ratio grid. In this study a grid of 0.070 ppmv O3 × 0.35 ppbv HNO3 is chosen, which is motivated by the total estimated error of the trace gases (Johansson et al., 2018a). GLORIA data points with a calculated relative error larger than 20 % are neglected in this study. Besides a clearer presentation of the data points, RNFDs filter out single data points with very high HNO3 volume mixing ratios. Therefore, in the context of a challenging vortex identification, this method offers an additional filter, as single data points that are differing significantly and are erroneously identified as vortex air are filtered out. Here it has to be pointed out that also local non-erroneous points with very high HNO3 values within the vortex are filtered out applying this method. However, in this study we aim to quantify the overall nitrification of the LMS, while local nitrification is highly inhomogeneous and can reach significantly higher values. The RNFD contour line used for quantification in this study includes points within 2 % of the histograms maximum density. An example of a RNFD for the HNO3–O3 correlation during flight 8 is given in Fig. 1. We also show alternative isolines including 1 % and 4 % of the maximum density of the histogram to visualize weaker and stronger thresholds for statistical outliers. In all cases, the isolines show a similar pattern in general. However, stronger threshold values limit the vertical range of the analysis and filter out valuable significant data points.

Figure 1Correlation of HNO3 with O3 measured by GLORIA during flight 8 on 20 January 2016. The correlation is shown as single points and as a RNFD (solid, dashed and dash-dotted lines; see legend).
To investigate how the observed HNO3 distribution is affected by nitrification, three research flights have been selected. The first flight was carried out on 20 January 2016 during the coldest phase of the winter (Manney and Lawrence, 2016), with PSCs ranging down to flight level. The second flight took place on 31 January 2016 after a strong PSC phase. The last flight was carried out on 18 March 2016 at a late state of the winter – about 2 weeks after the final warming (5–6 March; Manney and Lawrence, 2016).
The observed patterns in the HNO3 distributions are compared with the observed patterns in the ozone distribution. Since ozone and HNO3 are effected by the same dynamical processes, the different patterns in the observed distributions are likely caused by processes that effect only one species (i.e. nitrification due to sublimation of NOy-containing particles sedimented from higher altitudes). Therefore, the local HNO3 enhancements seen in comparing adjacent air masses at a given height level and the deviations of their pattern from the pattern seen in the ozone distribution are interpreted qualitatively as a result of nitrification.
4.1 Flight 8 on 20 January 2016
Applying the Nash criterion on 20 January 2016, a relatively coherent vortex region is found, with all GLORIA tangent points located inside the vortex region at θ=370 K (Fig. 2a). Since clouds complicate a robust trace gas retrieval, a number of GLORIA observations were removed by cloud filtering. As a consequence, only limited GLORIA nitric acid data are available in flight sections with sufficiently transparent conditions (Fig. 2b). Further, particulate NOy (i.e. the difference between measured total NOy and gas-phase NOy) was simultaneously measured in situ by using a chemiluminescence detector in combination with a converter for NOy species (Stratmann et al., 2016). Similar observations have also been made during other aircraft campaigns in the Arctic (Northway et al., 2002).
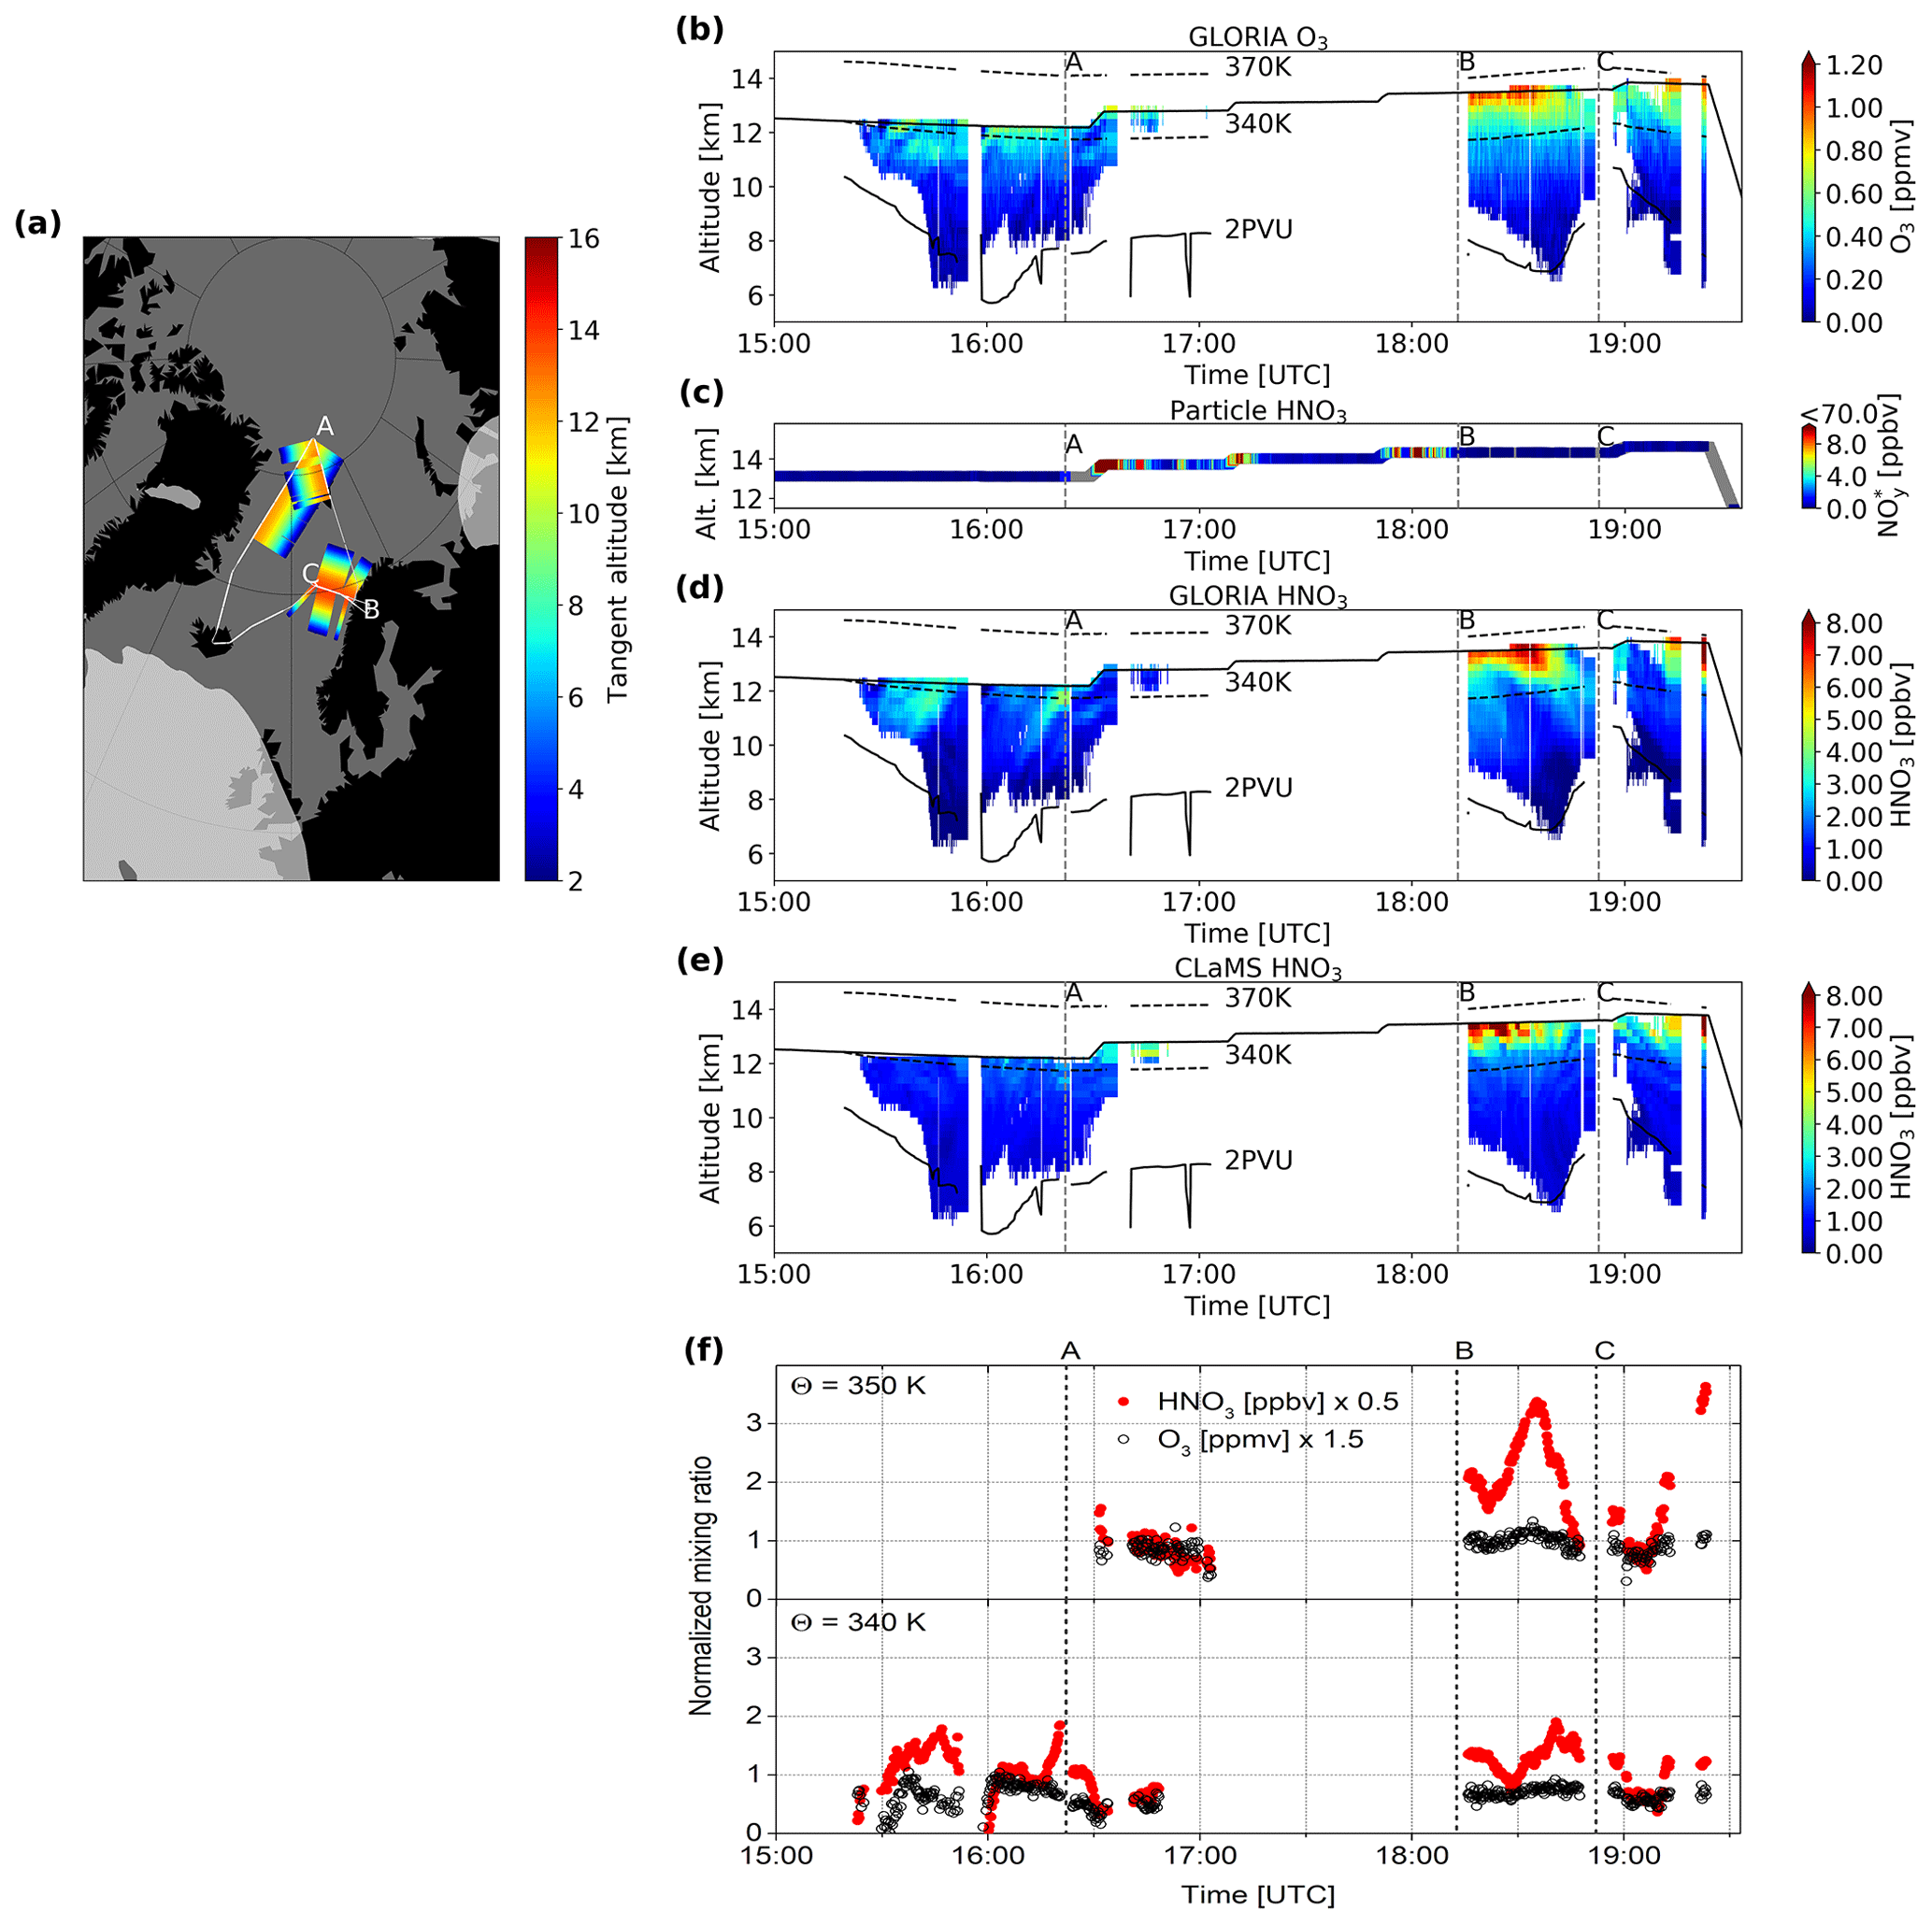
Figure 2(a) Flight path and vortex filtering according to the Nash criterion at 370 K for flight 8 on 20 January 2016. White line: flight track with characteristic waypoints (A, B, C); dark grey shading: areas that are associated with the polar vortex. (b) Cross section of O3 distribution derived from GLORIA. Flight altitude (bold black line), characteristic waypoints (A, B, C), 340 and 370 K potential temperature levels (MERRA-2, dashed black lines), and 2 PVU level (MERRA-2, black line). (c) In situ measurements of gas-phase equivalent (not enhancement corrected) as a proxy for particulate HNO3 at flight altitude. (d) Cross section of HNO3 distribution derived from GLORIA and (e) HNO3 distribution simulated by CLaMS. Flight altitude (bold black line), characteristic waypoints (A, B, C), 340 and 370 K potential temperature levels (MERRA-2, dashed black lines), and 2 PVU level (MERRA-2, black line). (f) Normalized HNO3 and O3 mixing ratios along selected isentropes. The whole flight was carried out in air masses attributed to the sub-vortex region.
The measurements shown in Fig. 2c are based on the sub-isokinetic sampling of particles with a forward-looking inlet (e.g. Fahey et al., 1989; Ziereis et al., 2004). Particles larger than a few tenths of a micrometre are sampled with enhanced efficiency and are detected as gas-phase equivalent . The efficiency factor depends, among others, on the ratio between aircraft and sampling velocity, pressure, temperature, and particle size (e.g. Fahey et al., 1989; Feigl et al., 1999). The maximum enhancement factor may be achieved for particle sizes larger than about 10 µm and is on the order of several tens, depending on the actual combination of the above mentioned parameters. Here, only equivalent that was not corrected for enhancement is shown as a qualitative proxy for particulate HNO3. As absolute values cannot be obtained, we only use the data as a proxy for condensed HNO3-containing particles present at flight altitude. The in situ data clearly confirm the presence of HNO3-containing PSC particles at flight altitude and mainly between waypoints A and B in close vicinity to gas-phase HNO3 maxima detected by GLORIA.
The vertical cross sections of O3 and HNO3 volume mixing ratios along the HALO flight track derived from GLORIA are depicted in Fig. 2b and d. The ozone distribution shows increasing volume mixing ratios with altitude reaching 1.1 ppmv at 13 km. The observed O3 volume mixing ratios vary only moderately at fixed altitude levels during the whole flight in agreement with the location of the measurements within the vortex and the homogeneity inside the vortex. Compared to the ozone distribution, the HNO3 volume mixing ratios are varying significantly at fixed altitudes. The HNO3 distribution shows high HNO3 volume mixing ratios particularly in the flight segment between the waypoints B and C, reaching up to 8 ppbv at a flight altitude of 13 km compared to 3 ppbv observed in adjacent air around waypoint C. Differences of this maximum structure from the corresponding O3 distribution are interpreted qualitatively as nitrified air. Further, local maxima are forming coherent structures tilted with altitude and are observed down to 11 km in that flight segment. In addition, small-scale fine structures with enhanced HNO3 volume mixing ratios appear between 15:30 and 17:00 UTC and reach down to 10 km. The pattern of continuous and slightly tilted vertical bands differ significantly from the ozone distribution and show enhanced values compared to adjacent air masses at a given height level, thus suggesting their formation by redistribution of HNO3.
To test this hypothesis, we show normalized GLORIA HNO3 and O3 data along selected isentropes in Fig. 2f. Normalization factors are chosen in a way such that the mixing ratios of both gases are close to 1 in air masses which are not affected by nitrification. In particular, HNO3 volume mixing ratios (in ppbv) were multiplied by a constant factor of 0.5, and O3 volume mixing ratios (in ppmv) were multiplied by a constant factor of 1.5 to result in the shown unitless normalized mixing ratios. The same factors were applied for the subsequent flights. In unaffected air masses, the normalized mixing ratios of these gases are expected to show the same pattern. In nitrified air masses, locally enhanced HNO3 and different modulations are expected relative to O3. In fact, such local maxima in the HNO3 mixing ratios can be identified at 340 K around 15:45, 16:25, 18:20 and 18:40 UTC, and are more pronounced at 350 K around 18:35 and after 19:10 UTC. The maxima clearly coincide with local maxima seen in the HNO3 cross sections. Thus, the simultaneous presence of confined local gas phase HNO3 maxima in the GLORIA data and HNO3-containing particles detected in situ in regions close to the equilibrium temperature of NAT, well above the equilibrium temperature of ice (see GLORIA temperature data shown in Johansson et al., 2018a), suggests that an ongoing nitrification process was probed.
The vertical cross section of HNO3 volume mixing ratios modelled by CLaMS is shown in Fig. 2e. HNO3 volume mixing ratios reach maximum values of 8 ppbv at flight altitude in the flight segment between B and C. While maximum HNO3 volume mixing ratios in this flight are well represented by CLaMS, slight differences in the location of the maximum occur. Overall HNO3 mixing ratios are clearly underestimated by CLaMS, and CLaMS mostly misses the vertical fine structure.
4.2 Flight 12 on 31 January 2016
At the end of January 2016, applying the Nash criterion at θ=370 K, a more disturbed lower vortex region is observed. As shown in Fig. 3a, a large region between Greenland, central Europe and northern Siberia fulfilled the vortex criterion. However, filaments of lower PV are found from Greenland to southern Scandinavia and around the eastern rim of Scandinavia. Flight 12 was carried out starting and ending in Kiruna on 31 January and intersected several times with filaments outside the vortex.
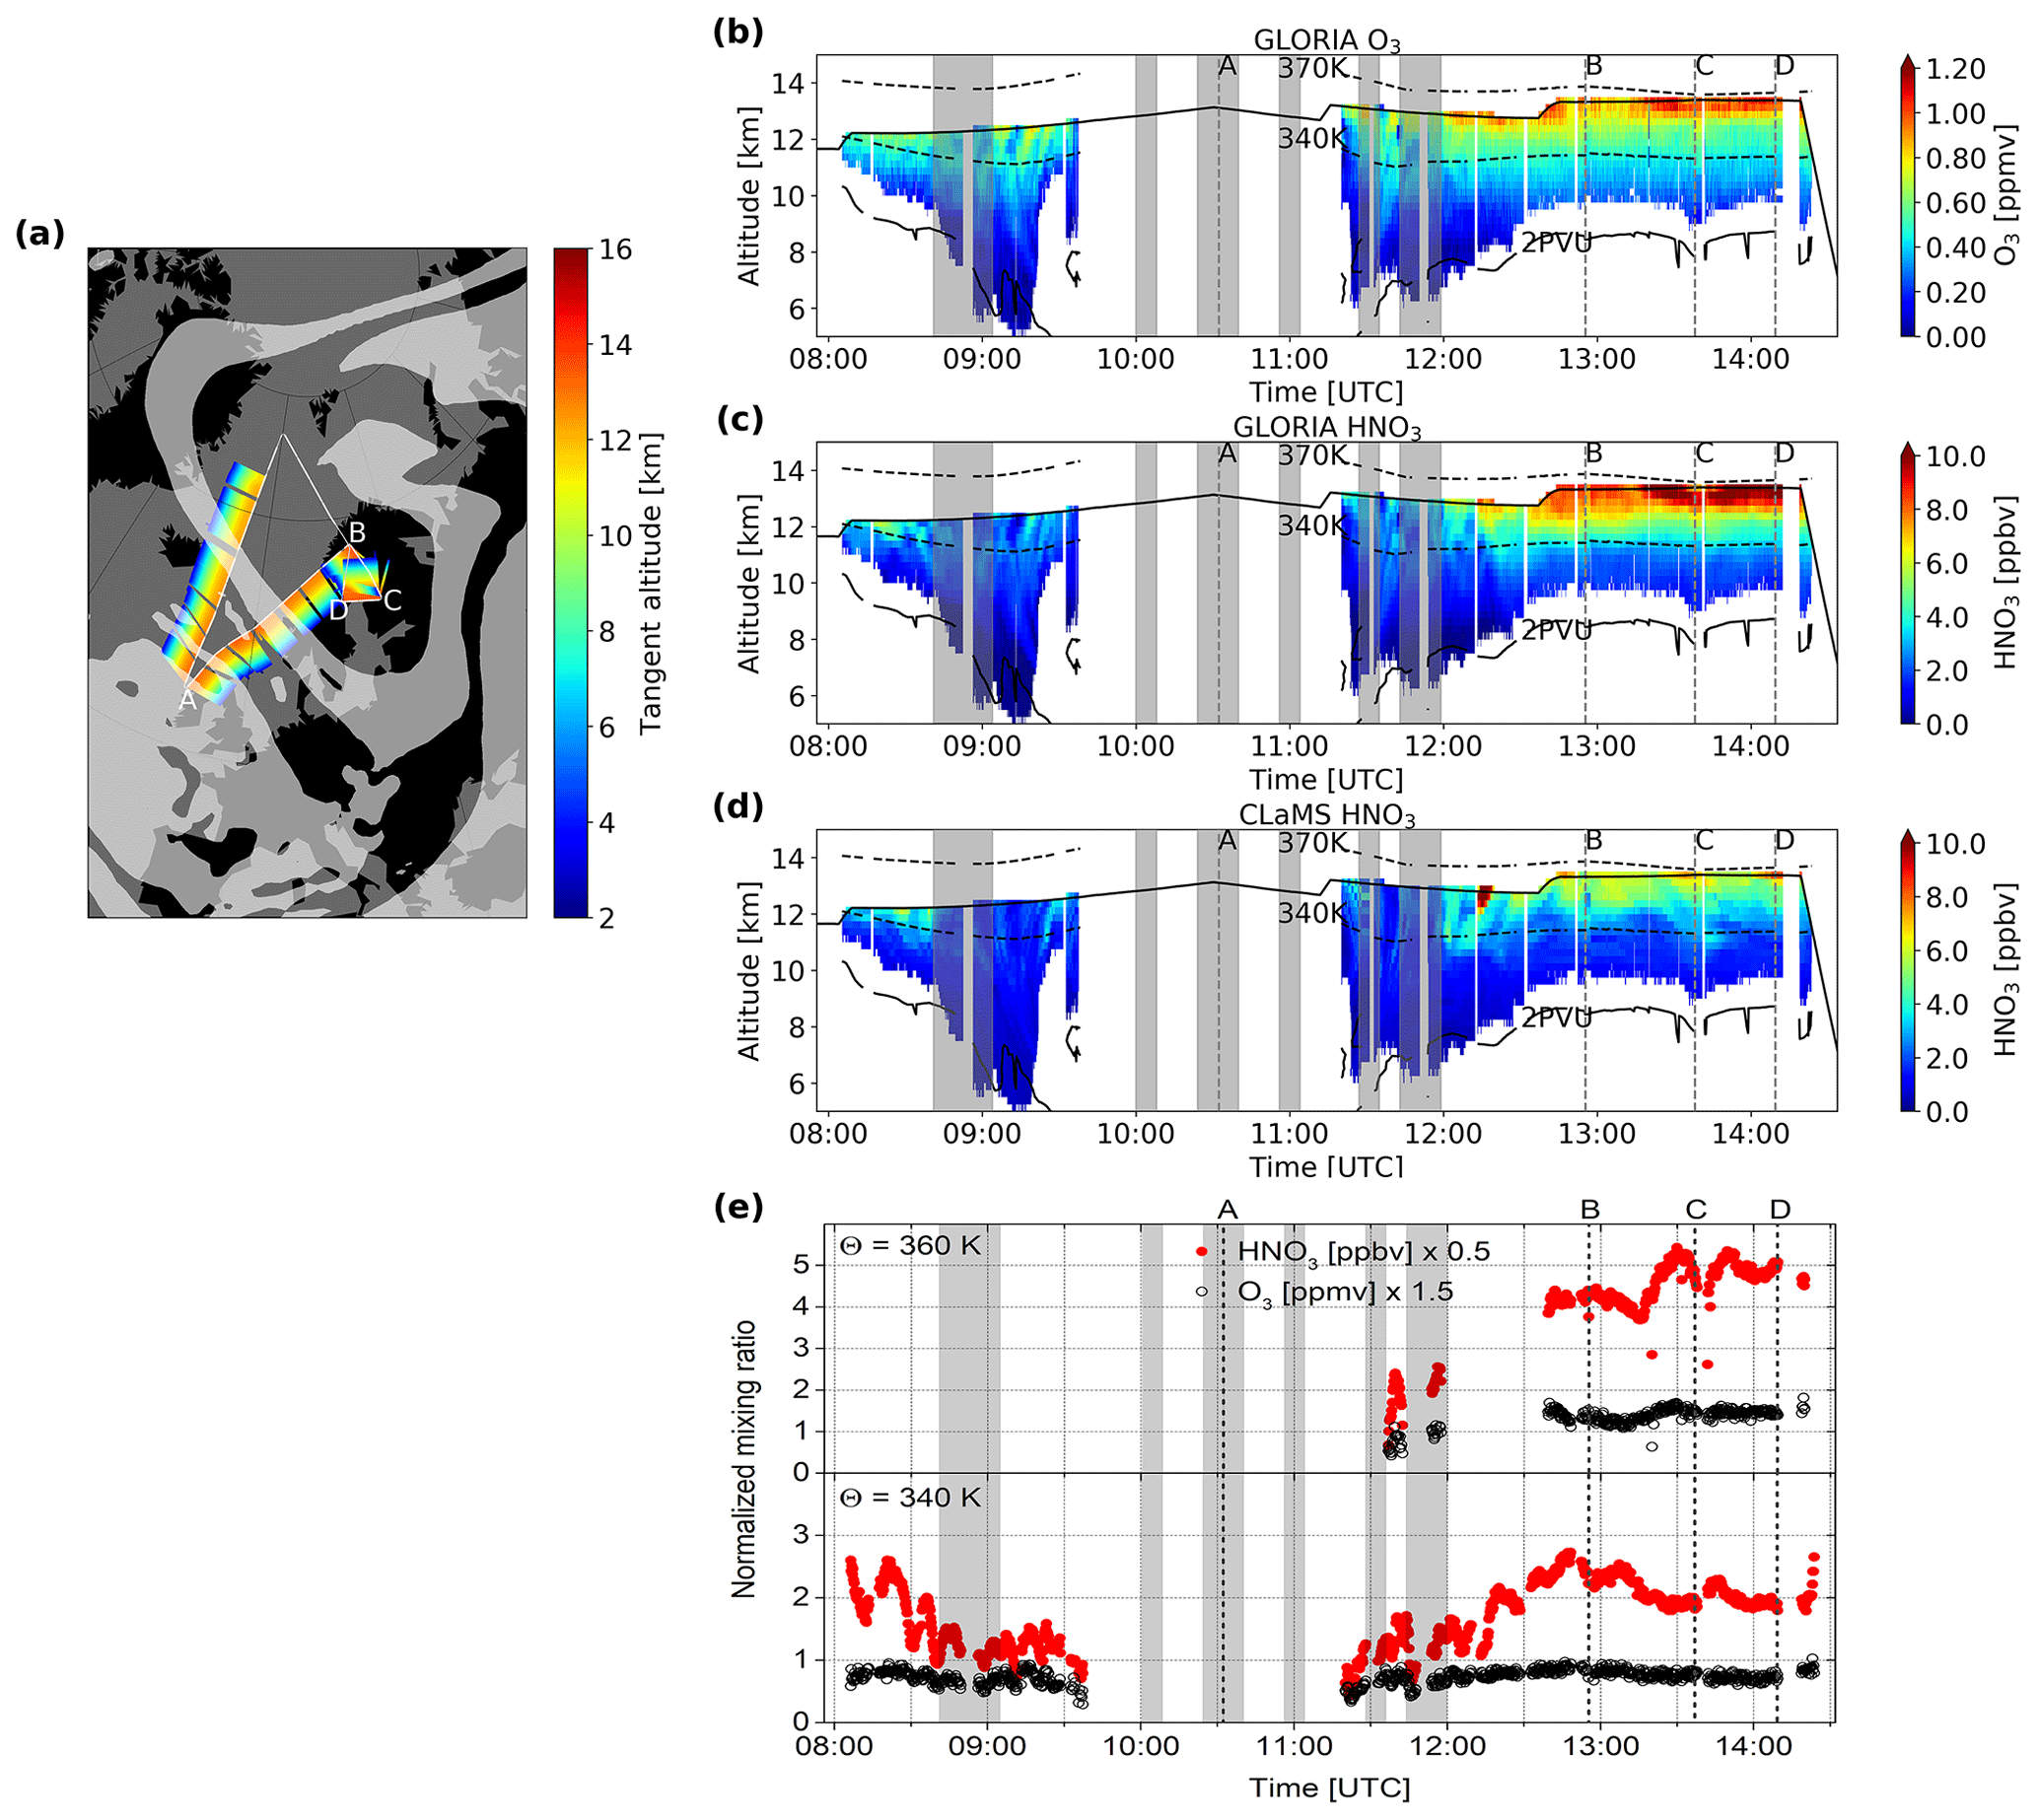
Figure 3(a) Flight path and vortex filtering according to the Nash criterion at 370 K for flight 12 on 31 January 2016. White line: flight track with characteristic waypoints (A, B, C, D); dark grey shading: areas that are associated with the polar vortex. Cross sections of (b) O3 and (c) HNO3 distribution derived from GLORIA and (d) HNO3 distribution simulated by CLaMS. Flight altitude (bold black line), characteristic waypoints (A, B, C, D), 340 and 370 K potential temperature levels (MERRA-2, dashed black lines), and 2 PVU level (MERRA-2, black line). Please note the changed colour bar for HNO3 compared to Figs. 2 and 4. (e) Normalized HNO3 and O3 mixing ratios along selected isentropes. Passages attributed to non-sub-vortex air are shaded in grey.
Measured cross sections of O3 and HNO3 volume mixing ratios are depicted in Fig. 3b and c. Except for flight segments between 08:40 and 09:20 UTC, as well as between 11:30 and 11:50 UTC, that are associated with the vortex edge or non-vortex air (indicated by grey shading in Fig. 3b–e), ozone values increasing with height are observed. Compared to the ozone values only varying slightly along an isentrope, the HNO3 volume mixing ratios show larger variations at levels of constant potential temperature and suggest local enhancements by nitrification. Again, the analysis of normalized HNO3 and O3 along the selected isentropes clearly shows enhanced and more variable HNO3 mixing ratios relative to O3 inside air masses attributed to the sub-vortex region (Fig. 3e, for normalization see Sect. 4.1). During this flight, high local maximum values of HNO3 well above 10 ppbv are found between 13:30 and 14:30 UTC in the GLORIA observations.
The HNO3 distribution modelled by CLaMS is shown in Fig. 3d. When compared to GLORIA, locally more confined and weaker HNO3 maxima are modelled after 12:15 UTC reaching down to altitudes of 12 km. Maximum HNO3 volume mixing ratios are found at flight altitude showing narrow peaks up to 10 ppbv at 12:15 UTC and 8 ppbv at 12:50 UTC, at waypoints C and D. Overall, CLaMS shows a higher spatial variability and underestimates the maximum values during large parts of the flight.
4.3 Flight 21 on 18 March 2016
For the flight on 18 March 2016, the PV distribution shows a patchy pattern of regions inside the remains of the vortex according to Nash et al. (1996) around Scandinavia, with the GLORIA observations being located partly inside and outside these regions (Fig. 4a).
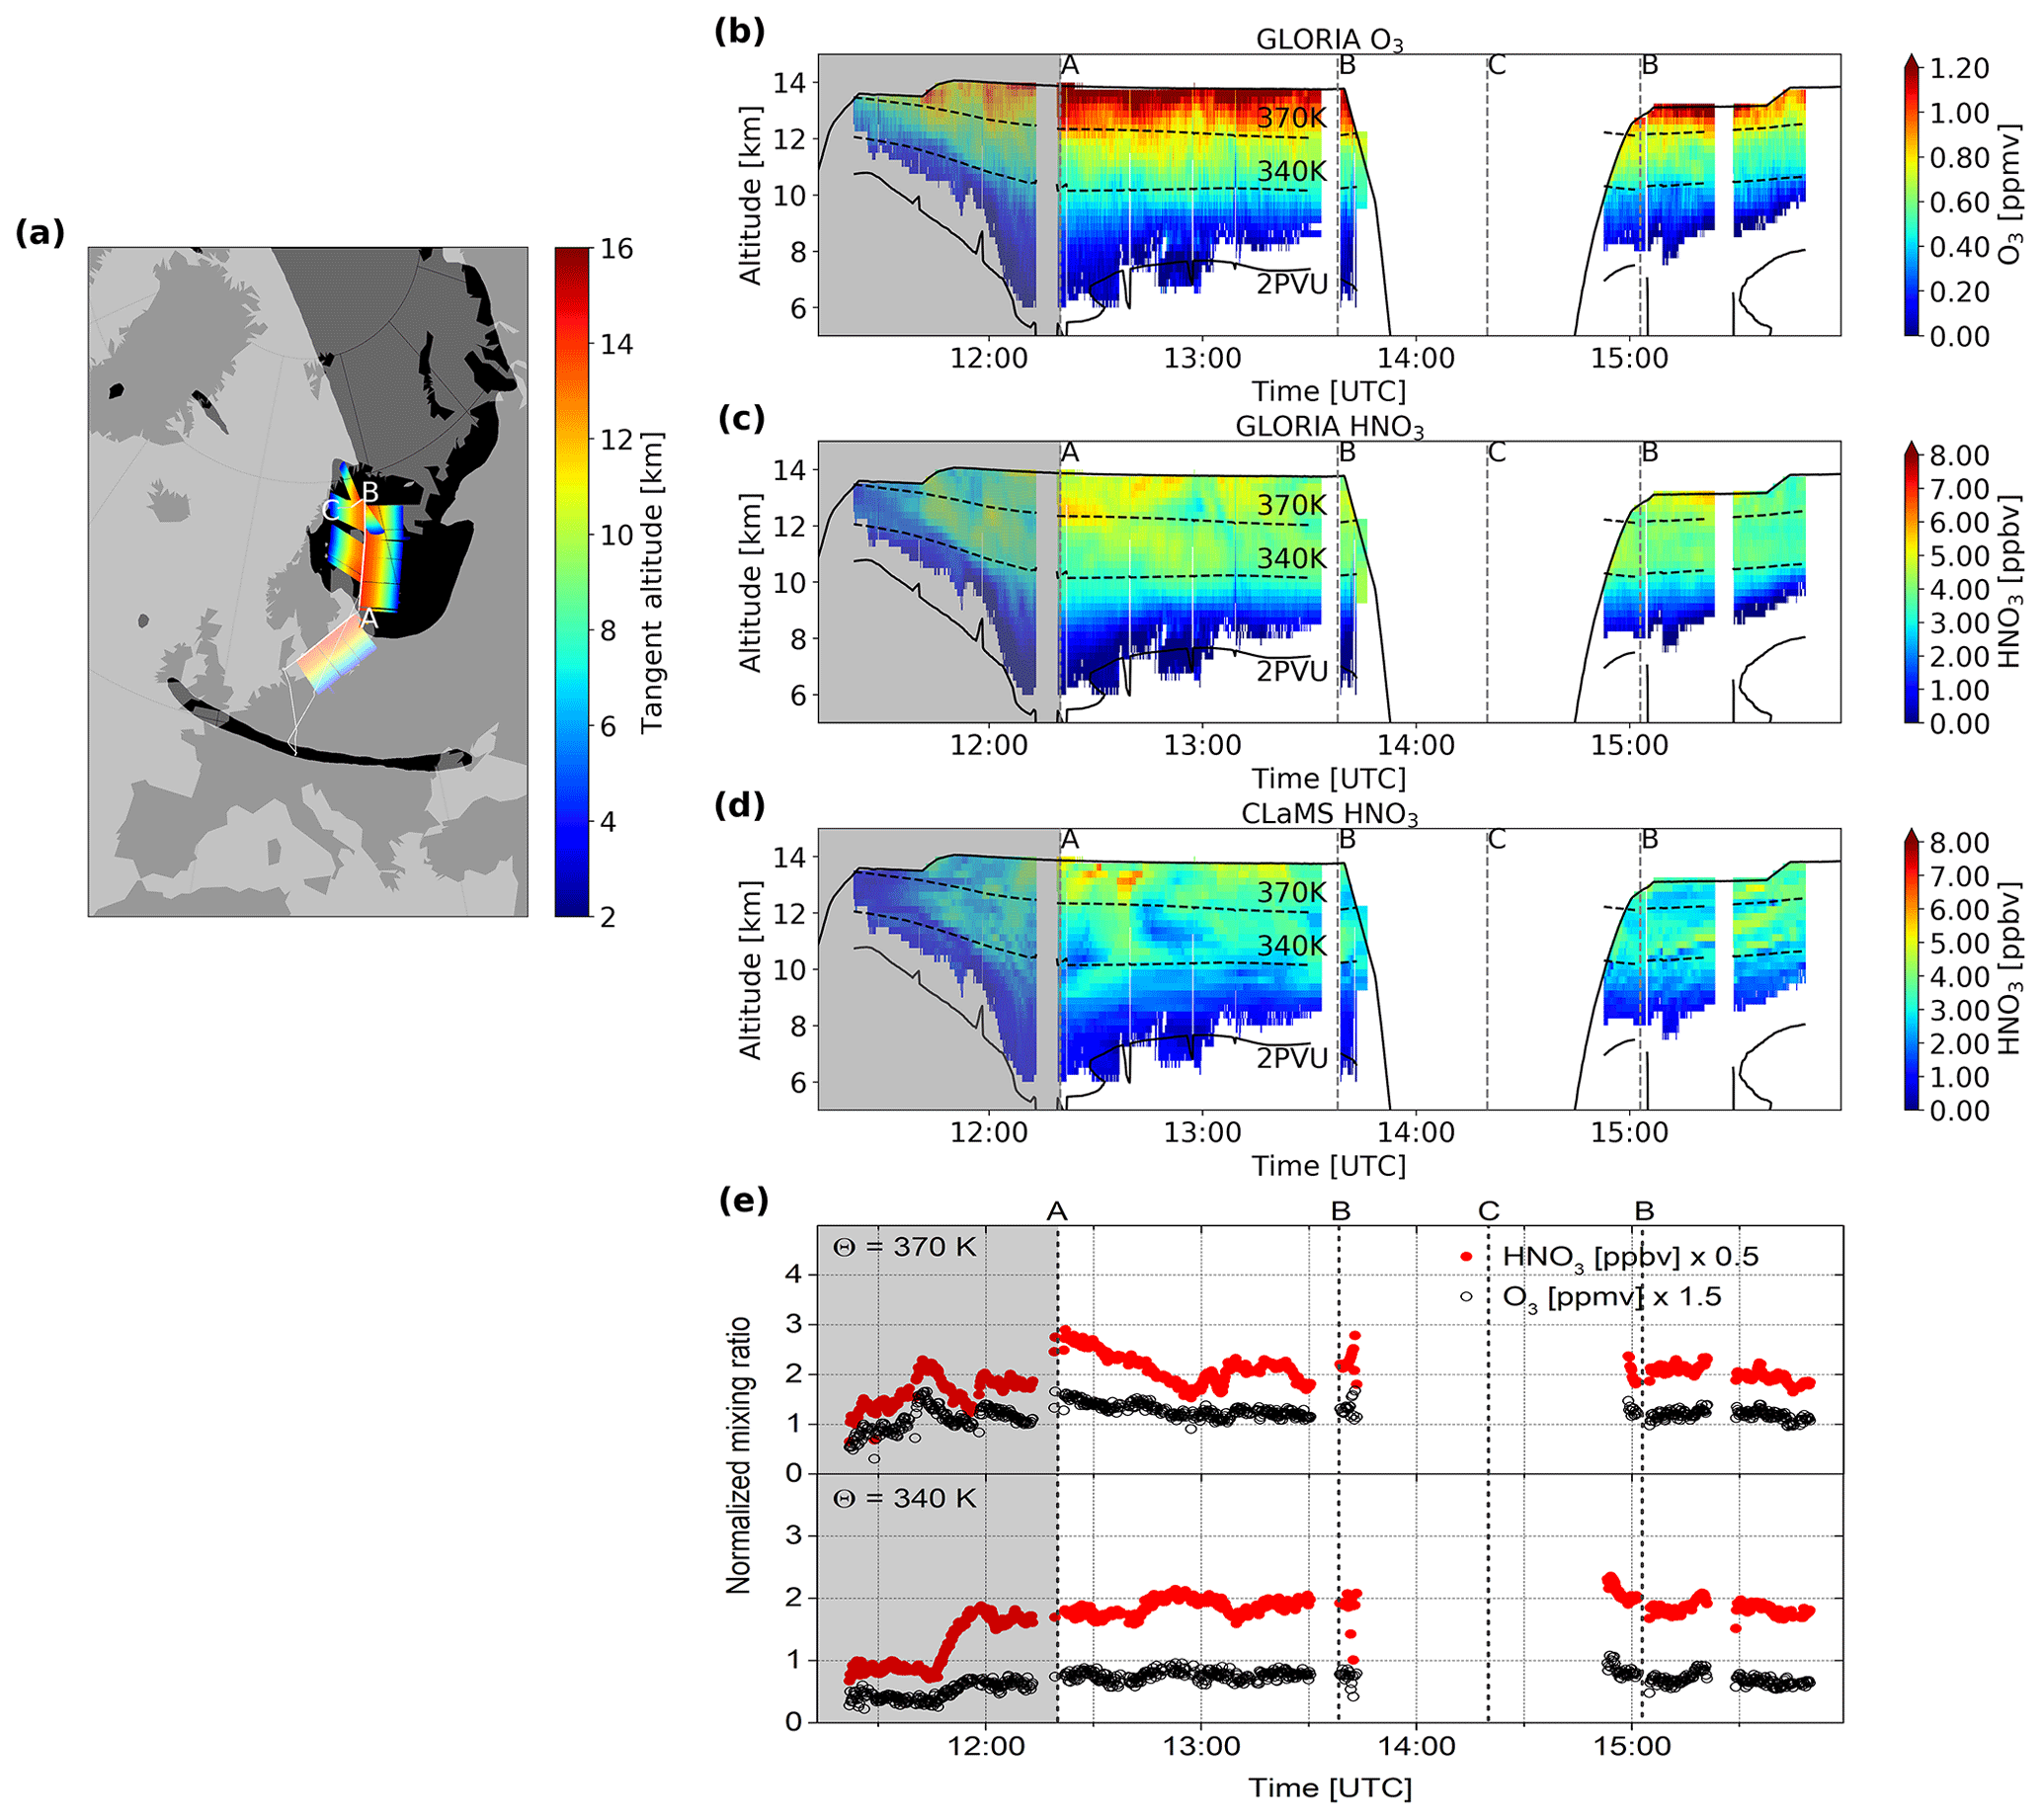
Figure 4(a) Flight path and vortex filtering according to the Nash criterion at 370 K for flight 21 on 18 March 2016. White line: flight track with characteristic waypoints (A, B, C); dark grey shading: areas that are associated with the polar vortex. Cross sections of (b) O3 and (c) HNO3 distribution derived from GLORIA and (d) HNO3 distribution simulated by CLaMS for flight 21. Flight altitude (bold black line), characteristic waypoints (A, B, C), 340 and 370 K potential temperature levels (MERRA-2, dashed black lines), and 2 PVU level (MERRA-2, black line). (e) Normalized HNO3 and O3 mixing ratios along selected isentropes. The passage attributed to non-sub-vortex air is shaded in grey.
The measured O3 distribution (Fig. 4b) shows increasing values with altitude and reaches values of 1.2 ppmv at flight level. Ozone values along the isentropes vary only slightly. The measured HNO3 distribution (Fig. 4c) shows a slightly higher variability along the isentropes with local maxima for altitudes higher than 9 km reaching maximum values of up to 6 ppbv at flight altitude embedded in background values of 2 to 3 ppbv. Filamentation and mixing following the earlier vortex break-up (Manney and Lawrence, 2016) resulted in less spatial variability when compared to the previous flights. Since flight 21 was carried out after the vortex break-up and the correlation of HNO3 and O3 was altered by in-mixing of extra-vortex air, this flight is included in the model comparisons in Sect. 6 but not in the quantification of nitrification of the LMS in Sect. 5. However, well-defined local maxima qualitatively attributed to result from nitrification by the comparison with the ozone distribution still persisted in this late stage of the winter. The analysis of normalized HNO3 and O3 along isentropes shows enhanced and slightly more variable HNO3 mixing ratios relative to O3 in the sub-vortex region and its vicinity, thus supporting that these patterns are remnants of nitrification (Fig. 4e, for normalization see Sect. 4.1).
CLaMS (Fig. 4d) shows HNO3 volume mixing ratios for altitudes higher than 9 km corresponding well with GLORIA observations. Maximum values of locally 6 ppbv are modelled around 12:30 UTC at 13 km. Again, CLaMS slightly underestimates overall HNO3 mixing ratios when compared to GLORIA.
To quantify nitrification in the LMS from December 2015 to January 2016 we applied the method described in Sect. 3.4 using selected flights in this period. Figure 5a depicts the distributions for flights 5, 6, 8 and 12 derived from GLORIA observations. Flight 5 (only limited GLORIA data available, see Appendix A) was carried out on 21 December 2015, at the beginning of the winter, with no significant hints to nitrification. Therefore this flight was chosen as the early winter reference. Due to a limited number of points associated with vortex air and since sub-vortex and non-vortex data points show a compact correlation for flight 5, non-vortex points are also included here to extend the available data. For all other flights, only data points associated with vortex air are used. Flight 6 (see Appendix A) covered a broad range of latitudes in the sub-vortex region and below PSCs (Pitts et al., 2018).
HNO3 volume mixing ratios for flight 5 range up to 3.2 ppbv with an approximately linear relationship to the observed ozone values. In case of flight 6, enhanced HNO3 volume mixing ratios compared to flight 5 are observed for all ozone values. Flight 8 shows a similar enhancement throughout the whole range of ozone mixing ratios observed. While the enhancement is similar to flight 6, minimum HNO3 values for ozone values higher than 0.7 ppmv are higher than those for the flights before. For flight 12, the HNO3 volume mixing ratios reach higher values than those for the previous flights. Altogether, comparing maximum values with the early winter reference, an ongoing nitrification is observed between December 2015 and January 2016 reaching up to 7 ppbv at ozone values of 1 ppmv and 5 ppbv at ozone values of 0.6 ppmv.
Johansson et al. (2019) estimated an ozone depletion by 0.15 ppmv at 380 K for ozone values around 1.15 ppmv by the end of January 2016. Assuming this potential ozone depletion of 15 % (dashed profile in Fig. 5a) in the LMS during the given time frame, the estimated nitrification would reduce to 6 ppbv at 1 ppmv O3 and 3.5 ppbv at ozone values of 0.6 ppmv. This is a lower-limit estimation, especially considering the contrary effect by mixing of non-vortex air masses.
Correlation-based approaches are also suitable for model comparisons. The exact reproduction of complex fine structures by models cannot be expected because of uncertainties in measurements and the model. Differences in the meteorological fields used for modelling, especially the temperature, can result in differing local structures. Since the investigated flights probed a wide range of the sub-vortex region, the obtained correlations can be regarded as representative for the (Arctic) sub vortex and allows the comparison between model and measurement. We point out that observed differences in RNFDs can be caused by an inaccurate representation of processes influencing both HNO3 and O3 volume mixing ratios.
The distributions simulated by CLaMS are shown in Fig. 5b. For flight 5, the HNO3 volume mixing ratios range up to 2.5 ppbv in an approximately linear relationship. Flight 6 shows enhanced HNO3 volume mixing ratios that are significantly lower than those for the GLORIA observations. CLaMS models a further enhancement for flight 8 with a small patch reaching the maximum values observed by GLORIA. Similar to the GLORIA measurements, flight 12 displays the highest HNO3 volume mixing ratios of all flights. However, the maximum values observed by CLaMS are 2 ppbv lower. Beneath 0.3 ppmv O3 hardly any enhancement is observed over the duration of the flights. Overall, CLaMS is able to reproduce the general enhancement of HNO3 during the winter leading to a nitrification of up to 4 ppbv for ozone values of 0.8 to 1 ppmv, which is by 3 ppbv HNO3 lower than the GLORIA observations.
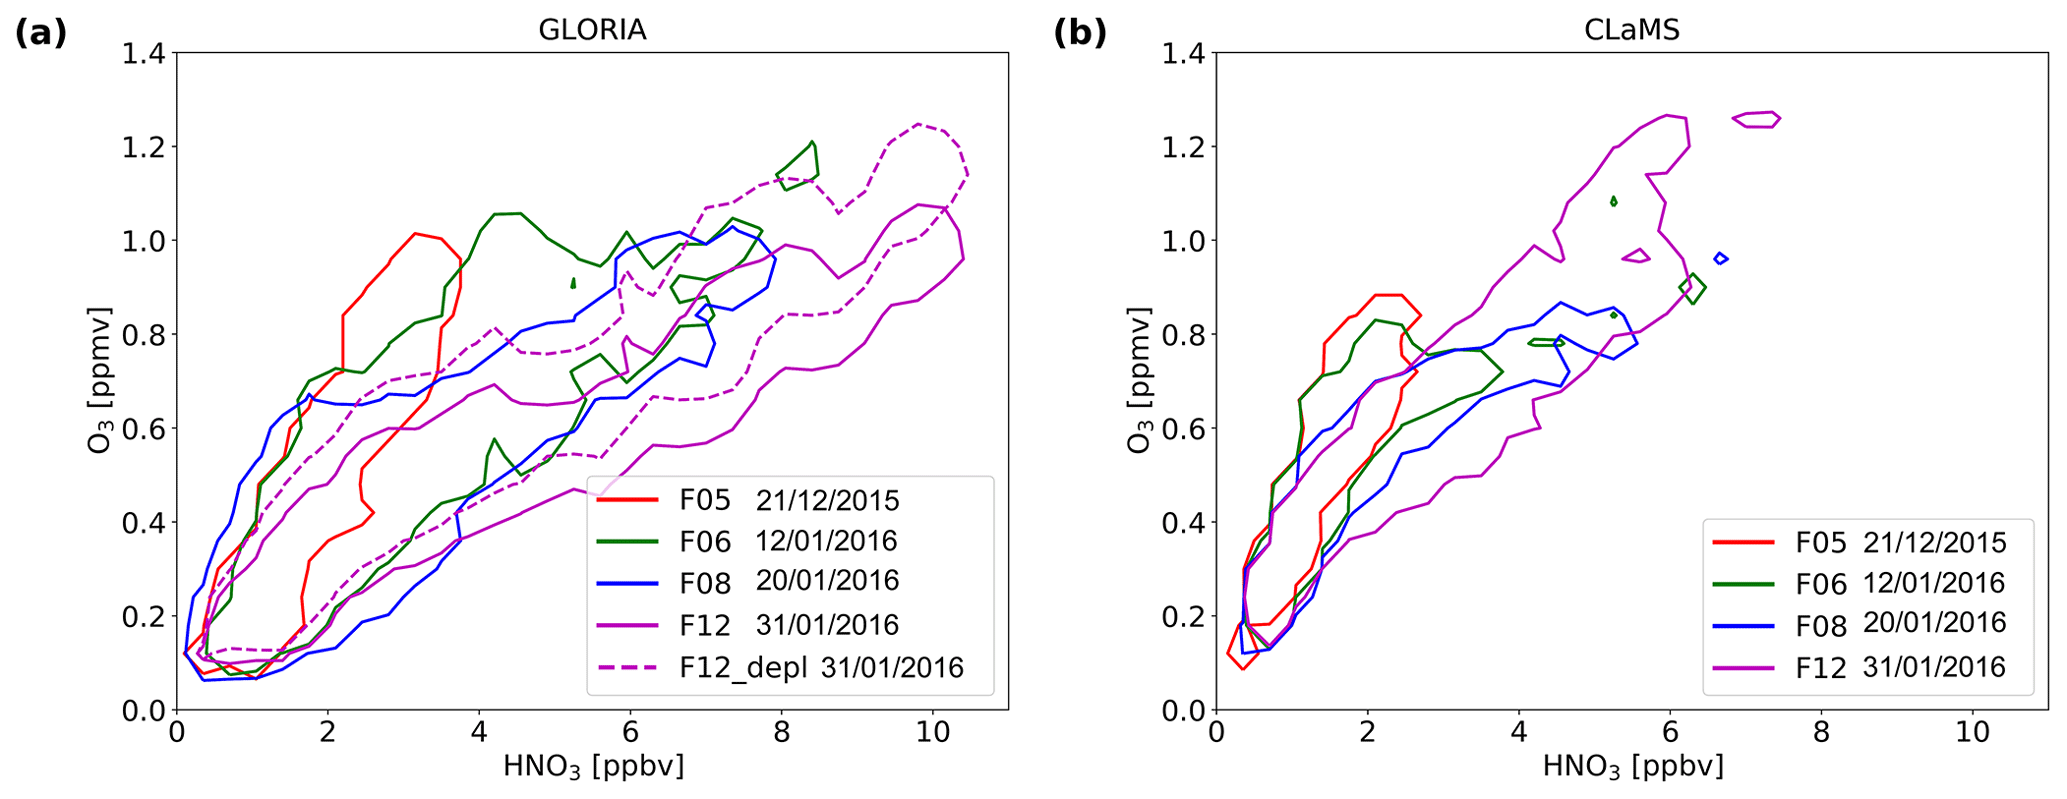
Figure 5Isolines (contours at 0.02) of the normalized frequency distribution of the O3–HNO3 correlation for December 2015–January 2016 derived from (a) GLORIA measurements and (b) CLaMS simulations. The dashed line for flight 12 includes a compensation of a potential ozone loss of 15 %.
Four sensitivity simulations have been performed to investigate processes and aspects that have not been represented in the model so far. These sensitivity simulations were performed based on assumptions concerning particle formation and shape. Besides the formation of NAT on ice particles, ice can possibly accumulate on NAT particles (Voigt et al., 2018) resulting in larger particles with an enhanced settling velocity. Therefore in the “ice settling” simulation the computed ice settling velocity (computed as described by Tritscher et al., 2019) was increased by a factor of 1.5 at all locations where the saturation ratio of ice, SIce, is larger than 1.2. Since NAT formation is temperature dependent, a sensitivity simulation is performed with a global temperature offset of 1 K. Particle growth in CLaMS is based on the assumption of growth rates of spherical particles. However, Woiwode et al. (2016) found indications for highly aspherical particles with an enhanced surface compared to spherical particles of the same volume. Since the HNO3 uptake depends on the surface, a faster particle growth would occur. A 1.5 times enhanced particle growth was implemented in the “aspherical particle” simulation. Changes in settling velocities due to different shapes have not been taken into account here. Several studies suggest a connection between orographically induced gravity waves and NAT formation (Davies et al., 2005; Carslaw et al., 1998; Höpfner et al., 2006). However small-scale temperature fluctuations are not resolved by ERA interim temperatures. Therefore, artificial fluctuations according to Tritscher et al. (2019) have been added in the “temperature fluctuations” simulation.
The comparison is based on the RNFDs depicted for the individual flights in Fig. 6. The model cross sections compared to measurements of flights 6, 8, 12 and 21 can be found in the Appendix B (Figs. B1, B2, B3, B4).
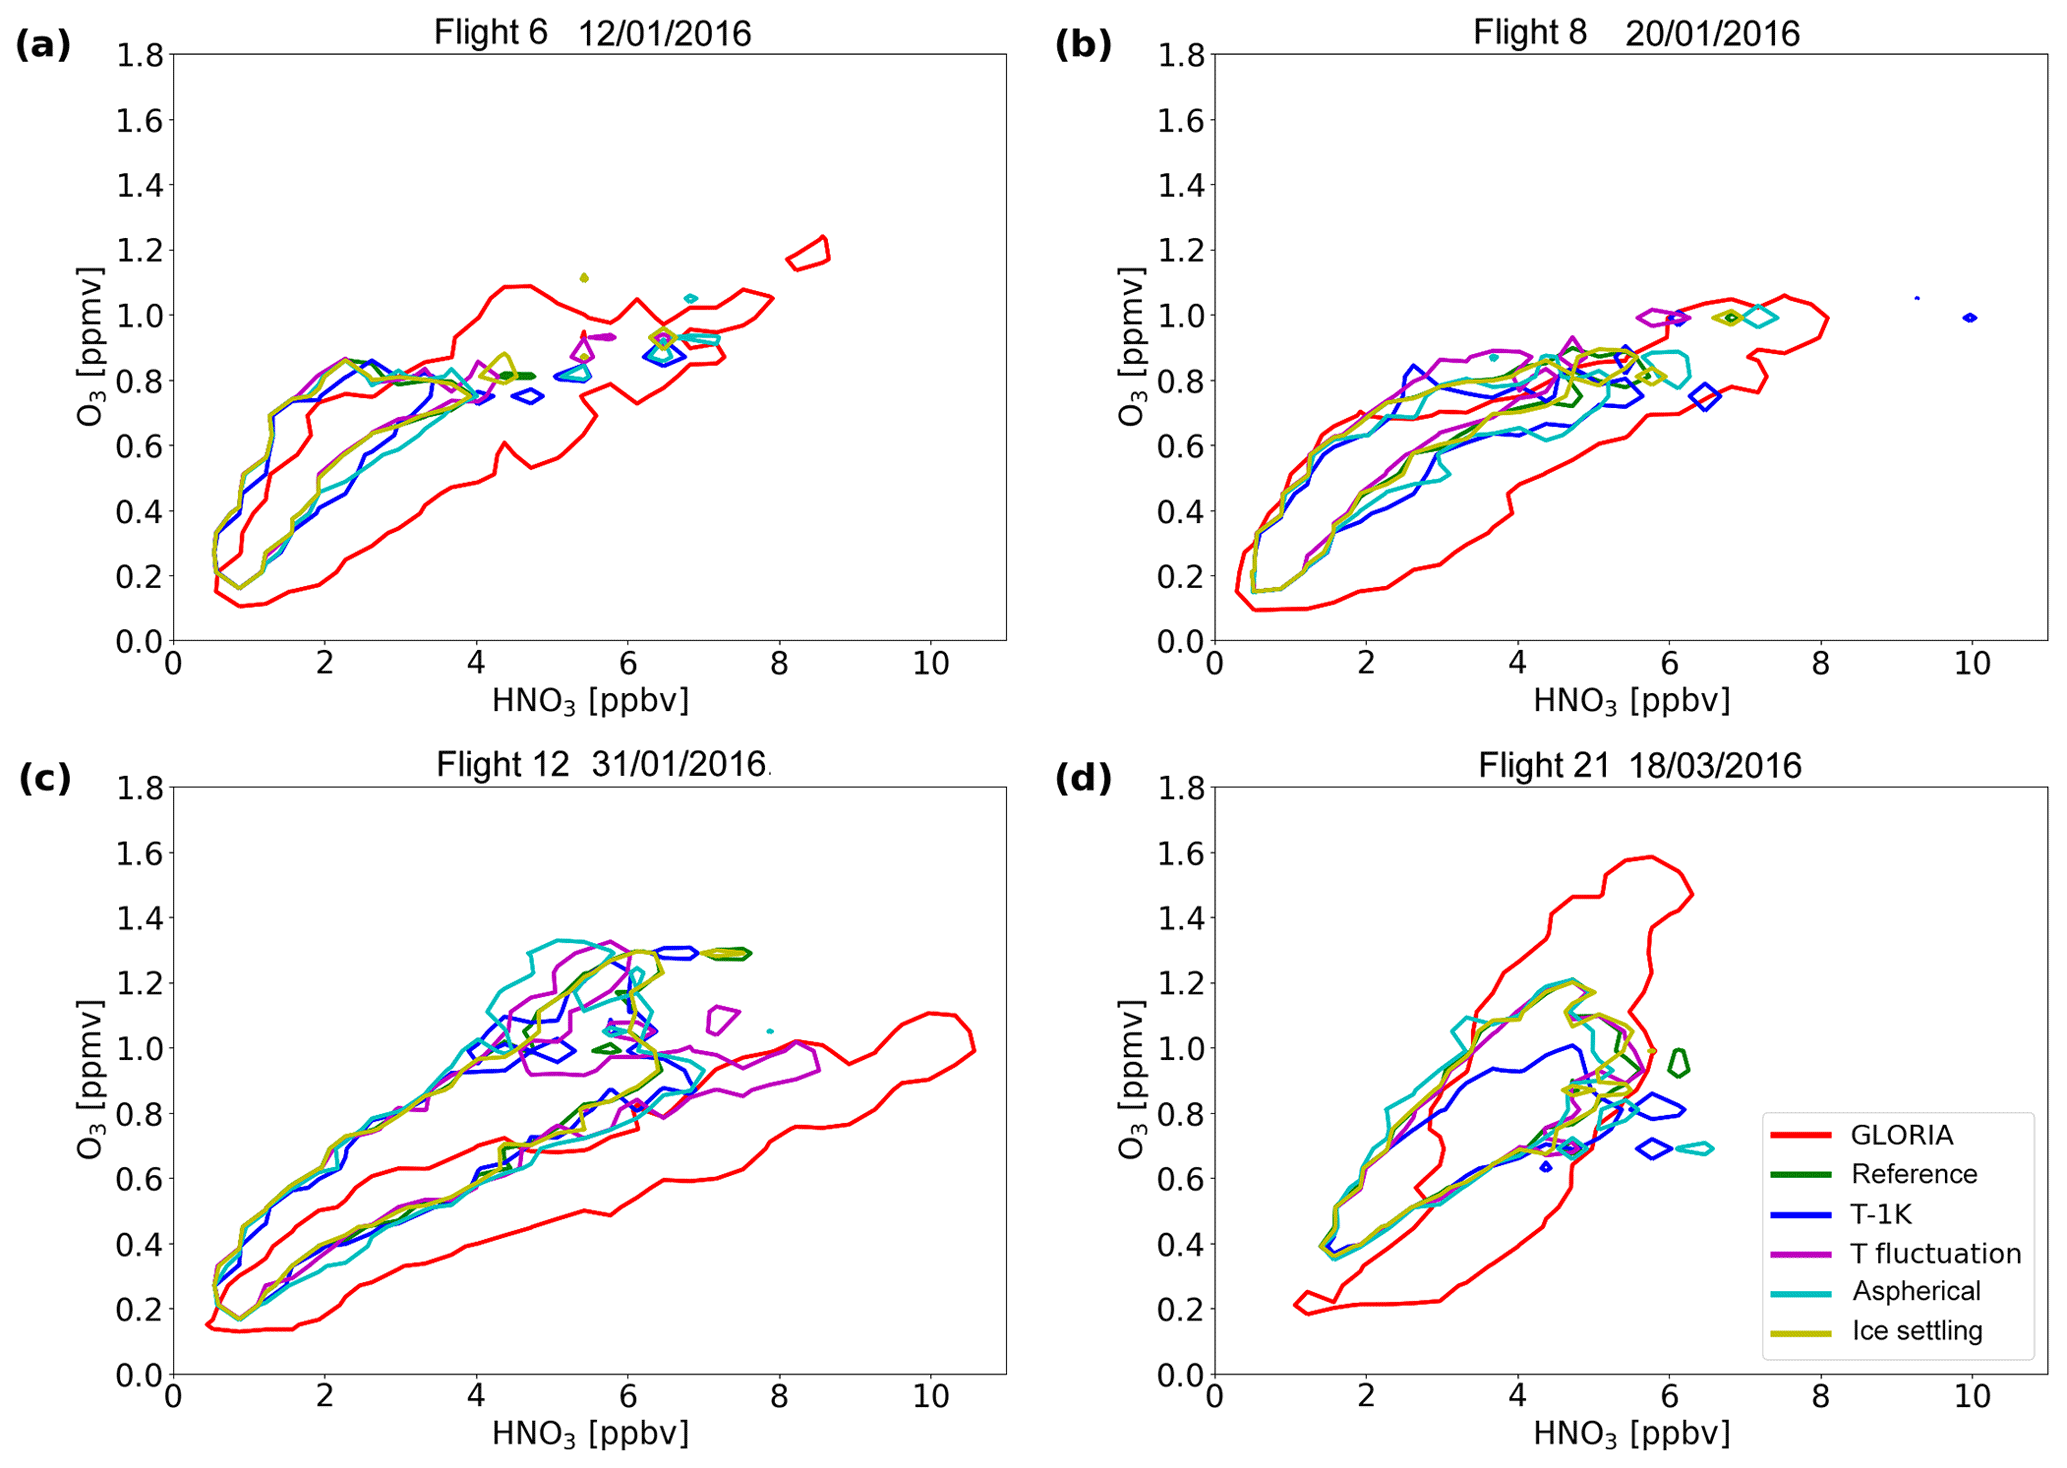
Figure 6Isolines (contours at 0.02) of the normalized frequency distribution of the O3–HNO3 correlation for (a) flight 6 on 12 January 2016, (b) flight 8 on 20 January 2016, (c) flight 12 on 31 January 2016, (d) flight 21 on 18 March 2016 derived from GLORIA measurements (red) and CLaMS simulations. The reference in the panels corresponds to model reference run without perturbations.
The ice settling simulation (yellow) delivers nearly identical results as the reference simulation for all flights. For the “T-1K” simulation (dark blue), enhanced HNO3 volume mixing ratios are observed down to lower O3 volume mixing ratios compared to the reference simulations for flight 6 and 8, but they are still not reaching down to the ozone values noticed by GLORIA. The high HNO3 volume mixing ratios measured by GLORIA are still underestimated here. While there are only slight changes compared to the reference simulation for flight 12, the T-1K simulation is clearly deteriorating for flight 21. Here, lower ozone volume mixing ratios are observed. For this flight none of the CLaMS simulations are able to reproduce the high ozone volume mixing ratios observed by GLORIA, which is possibly caused by weaker subsidence in the model. Further, lower absolute HNO3 values might occur due to stronger mixing in CLaMS. The aspherical particle case results in enhanced values observed down to lower altitudes than for the reference simulation for the flights 6, 8 and 12. Further, it shows higher maximum HNO3 values than for the reference for flights 6 and 8. However, the absolute values are still underestimated compared to the GLORIA observations. For the flights 12 and 21, indications for points with lower HNO3 values compared to the reference are found. The RNFD structure of temperature fluctuation simulation for flight 6 and 21 are nearly identical to the reference simulation. For flight 8, lower HNO3 volume mixing ratios are observed. In contrast to that, the temperature fluctuation simulation for flight 12 shows the best agreement with the observations. However, even though the lower branch is consistent with GLORIA, an upper branch with values lower than the reference simulation and far lower than GLORIA exists.
Nitrification of the LMS in the Arctic winter 2015–2016 was analysed based on GLORIA measurements during the PGS campaign. Vertical cross sections of HNO3 volume mixing ratios for several flights throughout the winter show complex fine-scale structures and enhanced values at altitudes down to 9 km. Flight 8 on 20 January 2016 was carried out under cold conditions with PSC observations at flight altitude. For this flight, coherent structures tilted with altitude of locally enhanced HNO3 volume mixing ratios are observed that most likely indicate defined regions where settled HNO3-containing particles recently sublimated. This is supported by simultaneous in situ observations of HNO3-containing particles. The net effect of proceeding nitrification and dynamical processes in the LMS is observed for flight 12 at the end of January with a pronounced pattern of enhanced HNO3 volume mixing ratios well exceeding 10 ppbv. Nitrified filaments with HNO3 volume mixing ratios up to 6 ppbv persisted until flight 21 in March 2016. While cross sections provide a qualitative insight on local nitrification patterns for selected flights, the extent of overall nitrification has been quantified based on HNO3–O3 correlations. Nitrification reached an extent of up to 7 ppbv at ozone values of 1 ppmv (θ≈370 K) and up to 5 ppbv at ozone values of 0.6 ppmv (θ≈350 K). A conservative correction, assuming a 15 % ozone loss on the correlations would reduce these numbers to 6 and 3.5 ppbv, respectively.
The comparison of GLORIA observations with the chemistry transport model CLaMS confirms the model's ability to reproduce nitrification of the LMS. Large-scale structures are reproduced by the model that also resolves complex fine structures, although differing from measured patterns. CLaMS predominantly underestimates the enhanced values observed by GLORIA. Enhanced values are found less frequently in the simulation and are limited to narrow regions. Further, modelled HNO3 enhancements reach less far down on 12 and 20 January 2016 when compared with GLORIA. The CLaMS simulations result in a weaker nitrification of up to 4 ppbv for the period of December to January for ozone mixing ratios between 0.8 to 1 ppmv, which is by ∼3 ppbv lower than observed by GLORIA. For flight 21 in March, CLaMS underestimates the observed ozone volume mixing ratios, potentially indicating insufficient subsidence and stronger mixing in the model (Johansson et al., 2019). Sensitivity studies with CLaMS considering (i) ice formation on NAT particles, (ii) a 1 K global temperature offset, (iii) growth rates of aspherical particles or (iv) temperature fluctuations were performed. While the “ice formation” simulation shows only slight differences, the other cases show noticeable differences during individual flights. The temperature fluctuation simulation provides improved agreement for the flight on 31 January 2016 but also worsens the results for the flight on 20 January 2016. The T-1K simulation improves the results for the flights 6 and 8 in January but deteriorates the results for the flight in the late winter on 18 March 2016. This shows the sensitivity of the simulation results on temperature. Potentially, a higher resolution in time and space would result in more realistic temperature fluctuations and could improve the simulations. The aspherical particle case shows slightly more pronounced improvements for the flights in mid-January. Even though the sensitivity simulations partially improve the results, distinct differences between model and measurements remain. Therefore, we conclude that a more comprehensive change in the model representations is required. However, the sensitivity simulations suggest that particle microphysics play a significant role for LMS nitrification in January. Increasing discrepancies from the observations towards the end of the winter are attributed to simulated air subsidence, transport and mixing processes.
Several studies investigated nitrification in previous cold winters, although mainly with a focus on higher altitudes. Hübler et al. (1990) interpreted enhanced NOy values of up to 12 ppbv at altitudes between 10 and 12.5 km in the Arctic winter 1988–1989 as a result of nitrification. For the Arctic winter 2002–2003 Grooß et al. (2005) modelled a nitrification of less than 1 ppbv for potential temperatures lower than 360 K. For the Arctic winter 2004–2005, Dibb et al. (2006) observed nitrification of up to 3 ppbv for potential temperatures between 360 and 340 K. Jin et al. (2006) reported an average nitrification of less than 2 ppbv for potential temperatures lower than 370 K for the same winter. Further, during the Arctic winter 2009–2010 (Grooß et al., 2014) modelled a nitrification of less than 1 ppbv for potential temperatures lower than 360 K, while (Woiwode et al., 2014) found no significant indications for nitrification below 370 K. Since Arctic winters might show a tendency towards colder stratospheric temperatures (Rex et al., 2006), disturbances of the LMS NOy budget by nitrification are likely becoming more frequent. During the Arctic winter 2015–2016 exceptionally low stratospheric temperatures occurred, and the vortex was sufficiently stable to allow formation of PSCs down to lowest stratospheric altitudes. Those conditions were the prerequisites for the strong nitrification observed and presented here. The measurements obtained by GLORIA during the POLSTRACC campaign document in detail a strong impact of nitrification on the LMS during an entire Arctic winter.
The discussed GLORIA data set is available at the HALO database at https://halo-db.pa.op.dlr.de/ (last access: 4 November 2019) and at the KITopen repository (https://doi.org/10.5445/IR/1000086506, Johansson et al., 2018b). NASA MERRA-2 reanalysis data are available at https://disc.gsfc.nasa.gov/ (last access: 4 November 2019).
Figure A1a shows the flight track and GLORIA tangent of points of flight 5 on 21 December 2015. The flight accessed air masses associated with the sub-vortex and its vicinity in the region around Scandinavia. Figure A1b and c show the associated vertical cross sections of O3 and HNO3 derived from the GLORIA observations.

Figure A1(a) Flight path and vortex filtering according to the Nash criterion at 370 K for flight 5 on 21 December 2015. White line: flight track with characteristic waypoint (A); dark grey shading: areas that are associated with the polar vortex. Cross sections of (b) O3 and (c) HNO3 distribution derived from GLORIA. Flight altitude (bold black line), characteristic waypoint (A), 340 and 370 K potential temperature levels (MERRA-2, dashed black lines), and 2 PVU level (MERRA-2, black line). Passages attributed to non-sub-vortex air are shaded in grey.
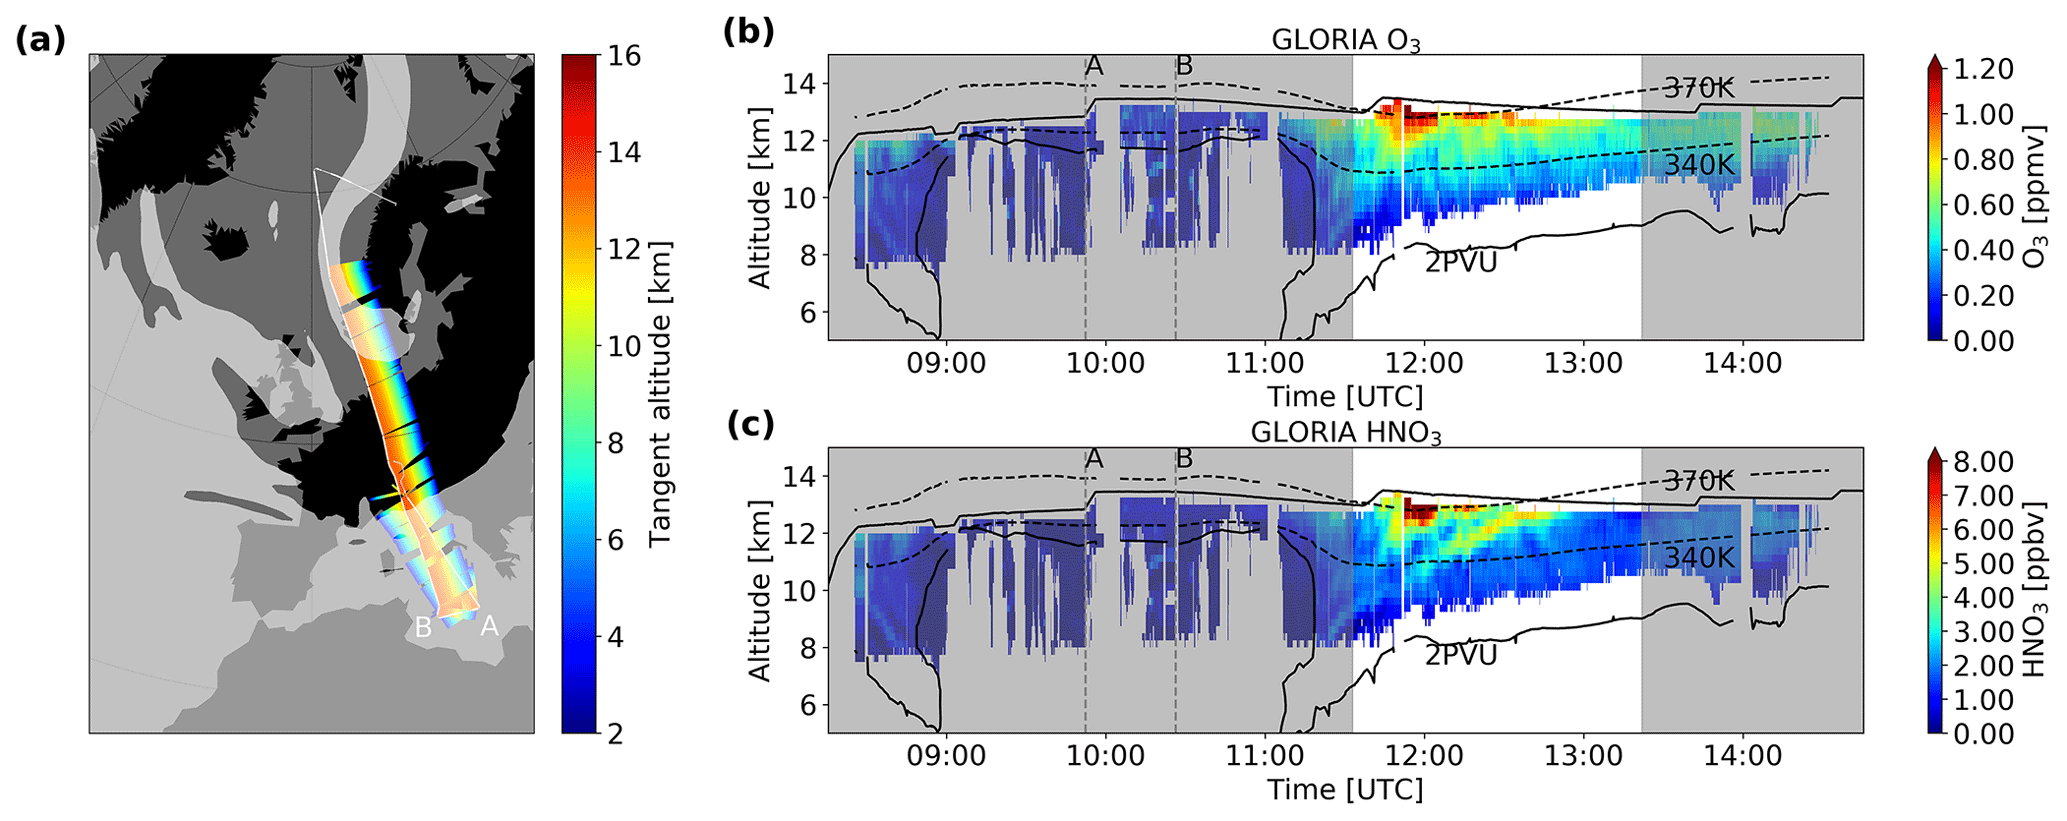
Figure A2(a) Flight path and vortex filtering according to the Nash criterion at 370 K for flight 6 on 12 January 2016. White line: flight track with characteristic waypoint (A, B); dark grey shading: areas that are associated with the polar vortex. Cross sections of (b) O3 and (c) HNO3 distribution derived from GLORIA. Flight altitude (bold black line), characteristic waypoints (A, B), 340 and 370 K potential temperature levels (MERRA-2, dashed black lines), and 2 PVU level (MERRA-2, black line). Passages attributed to non-sub-vortex air are shaded in grey.
Figure A2a shows the flight track and GLORIA tangent of points of flight 6 on 12 January 2016. The flight crossed the polar front jet stream above Italy and accessed sub-vortex air masses between northern Italy and Scandinavia. The associated vertical cross sections of O3 and HNO3 derived from the GLORIA observations are shown in Fig. A2b and c.
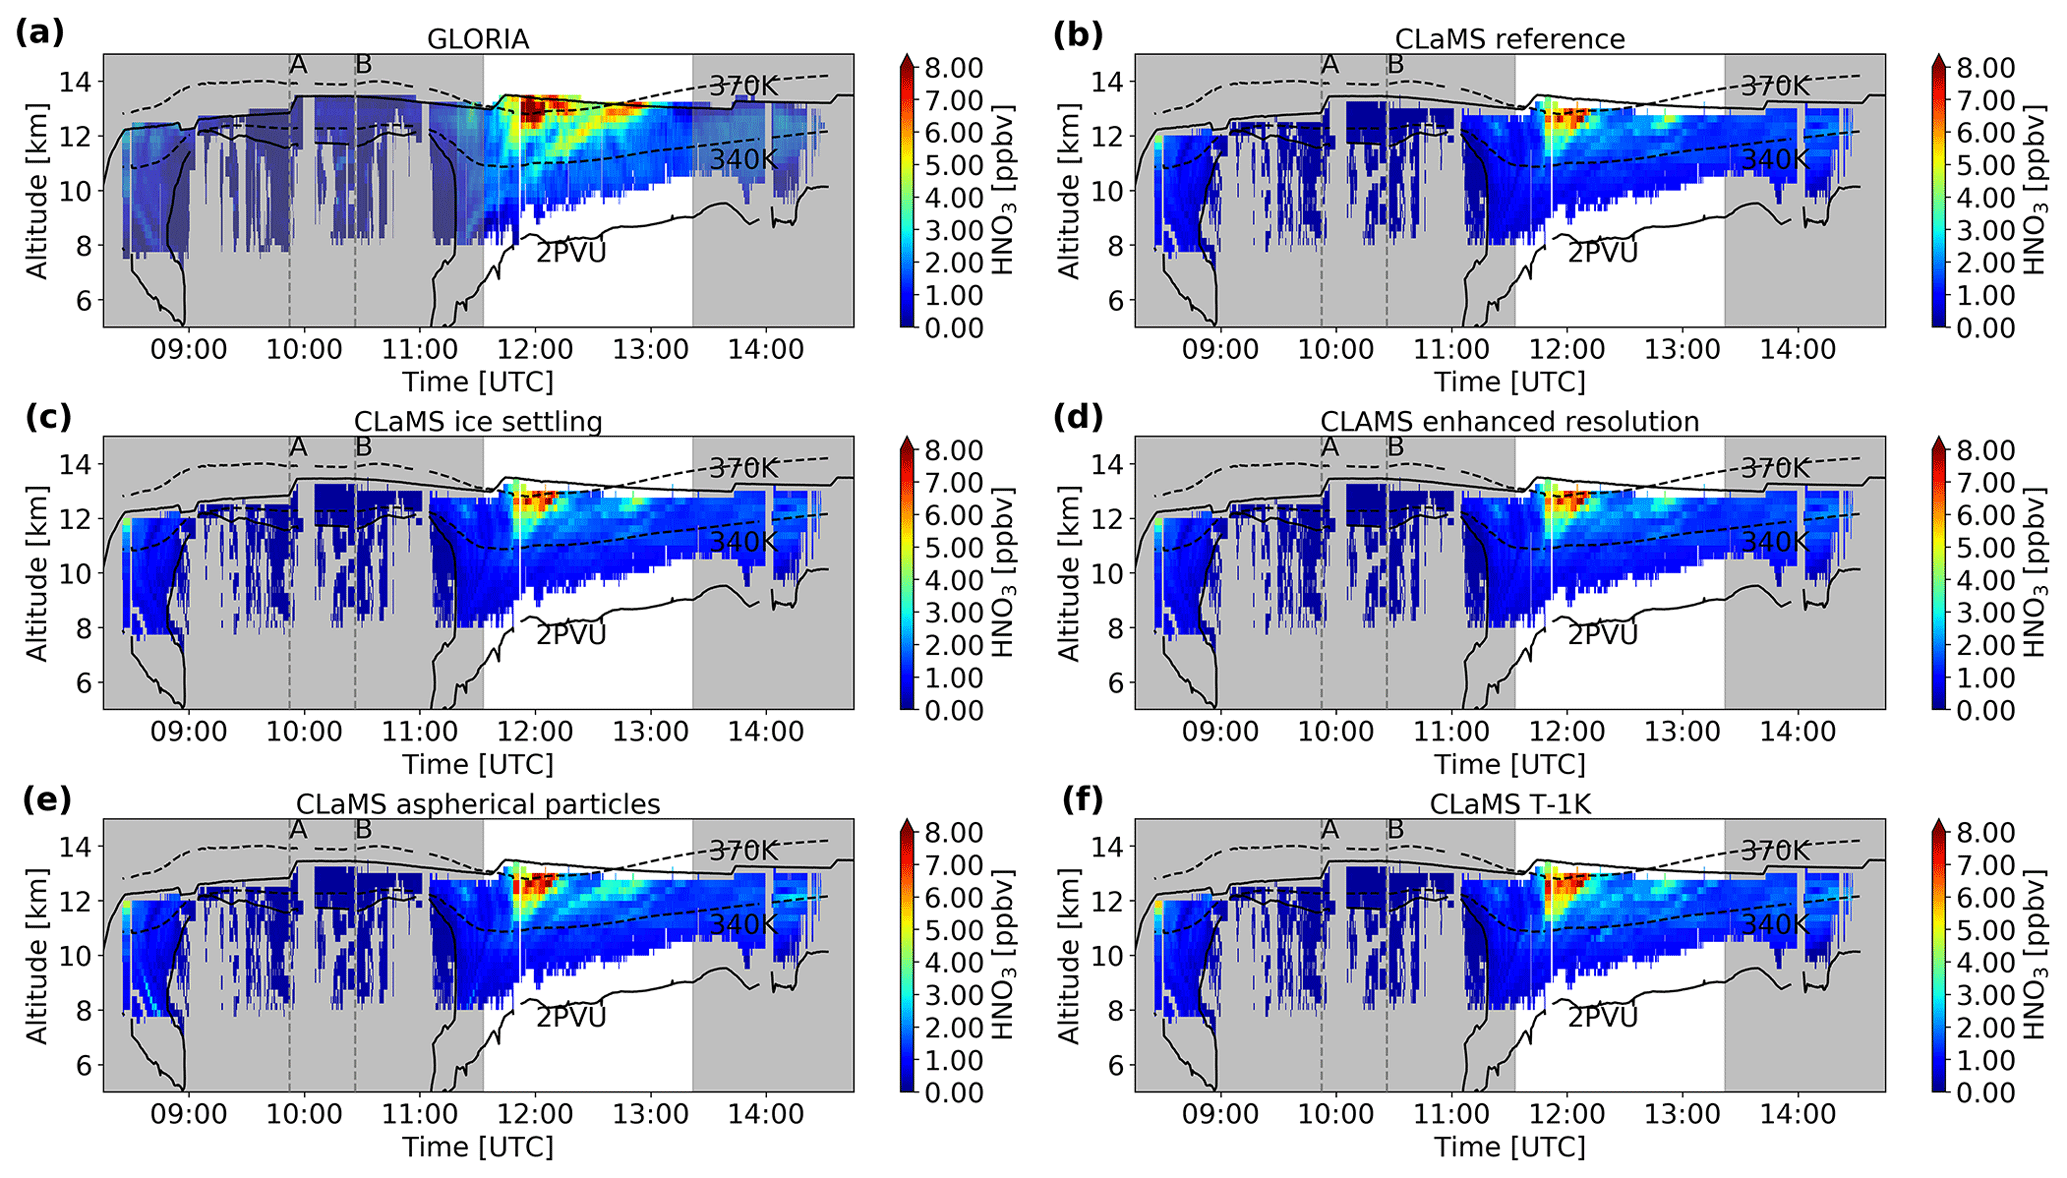
Figure B1Cross sections of HNO3 volume mixing ratio distribution for flight 6 on 12 January 2016 derived by GLORIA (a) and modelled by the CLaMS reference simulation (b), and sensitivity simulations considering (c) ice formation on NAT particles, (d) temperature fluctuations, (e) growth rates of aspherical particles and (f) 1 K global temperature offset. Flight altitude (bold black line), characteristic waypoints (A, B, C), 340 and 370 K potential temperature levels (MERRA-2, dashed black lines), and 2 PVU level (MERRA-2, black line).
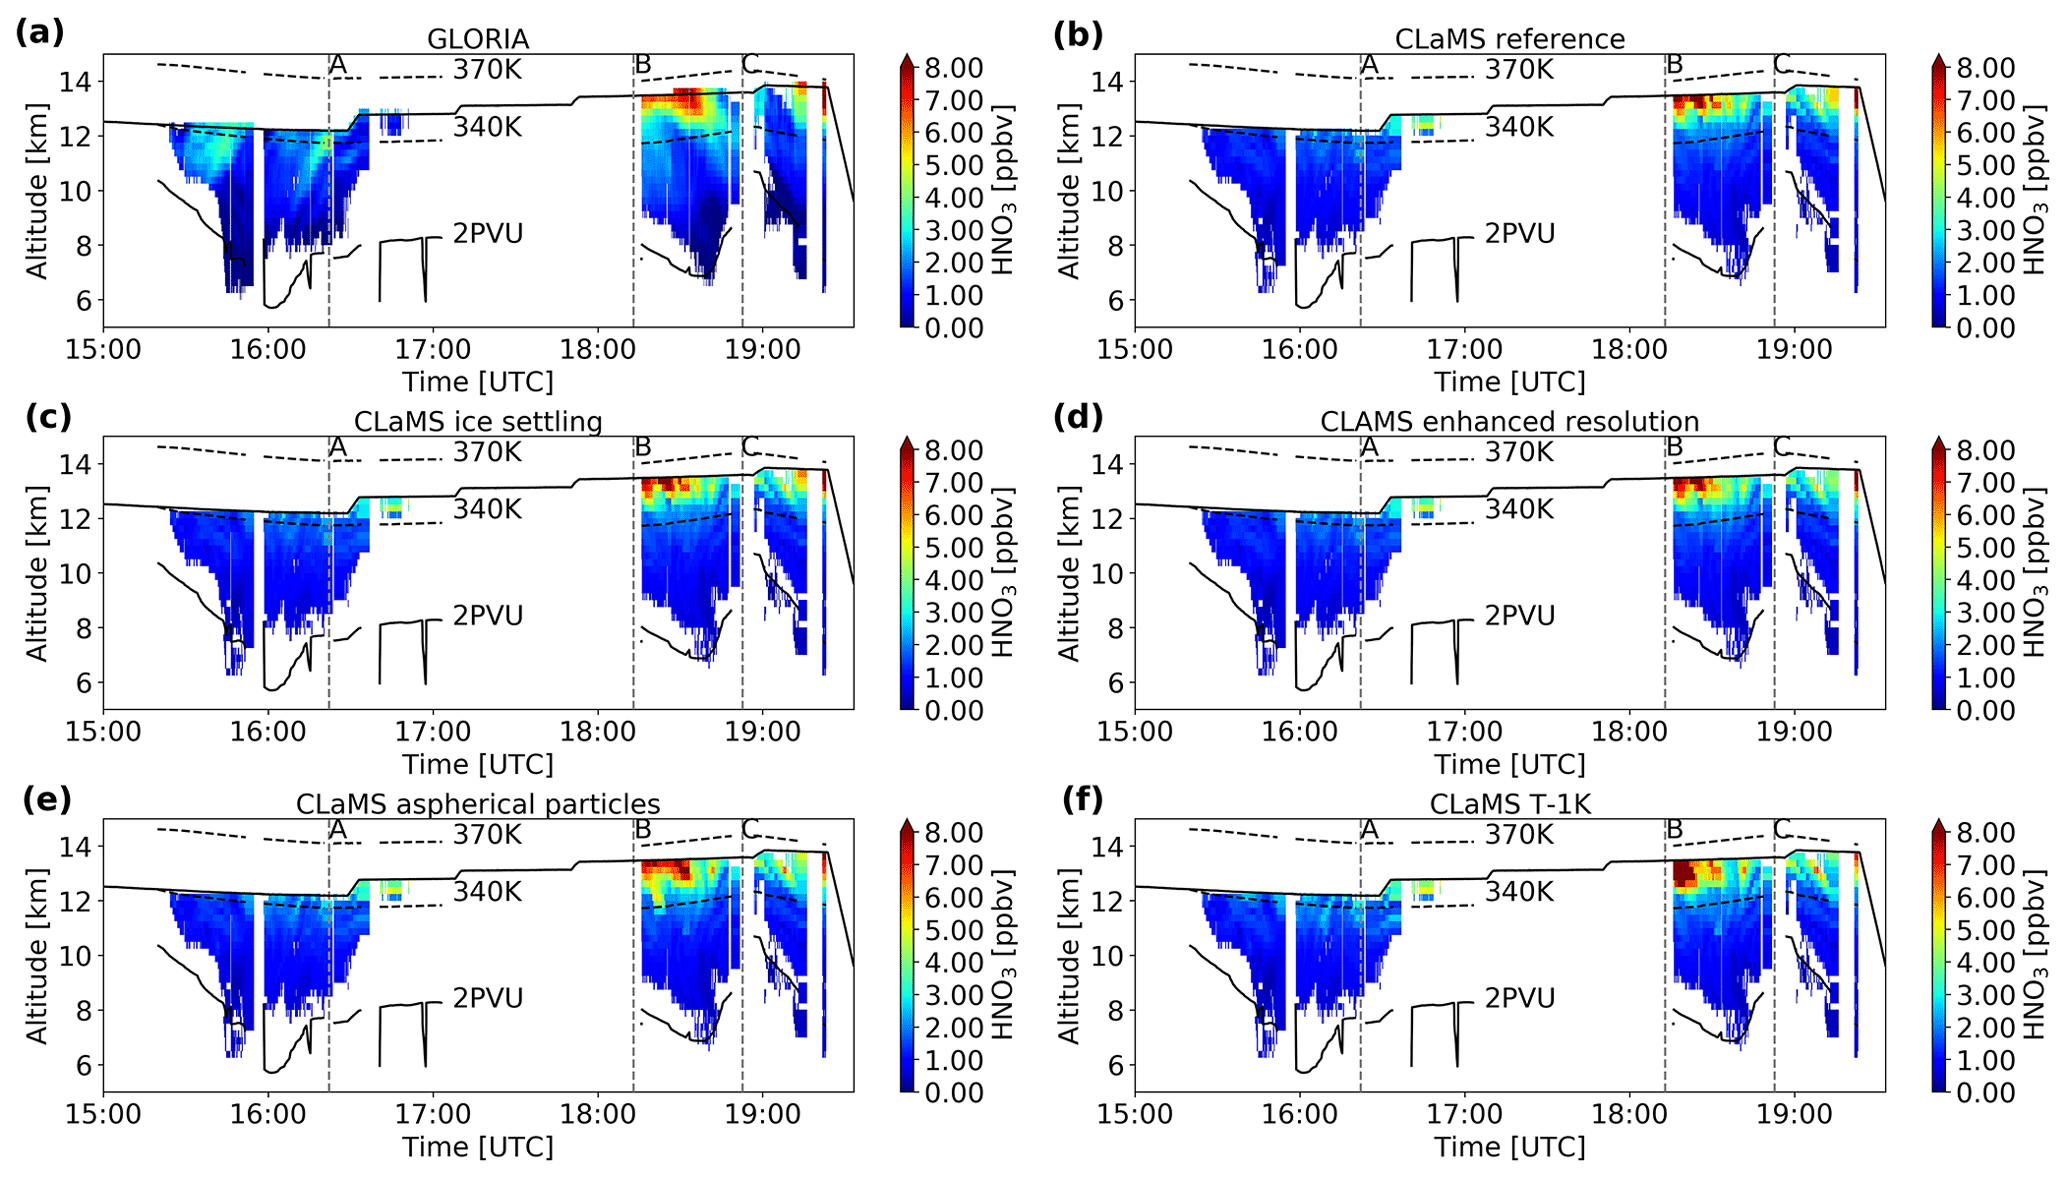
Figure B2Cross sections of HNO3 volume mixing ratio distribution for flight 8 on 20 January 2016 derived by GLORIA (a) and modelled by the CLaMS reference simulation (b), and sensitivity simulations considering (c) ice formation on NAT particles, (d) temperature fluctuations, (e) growth rates of aspherical particles and (f) 1 K global temperature offset. Flight altitude (bold black line), characteristic waypoints (A, B, C), 340 and 370 K potential temperature levels (MERRA-2, dashed black lines), and 2 PVU level (MERRA-2, black line).
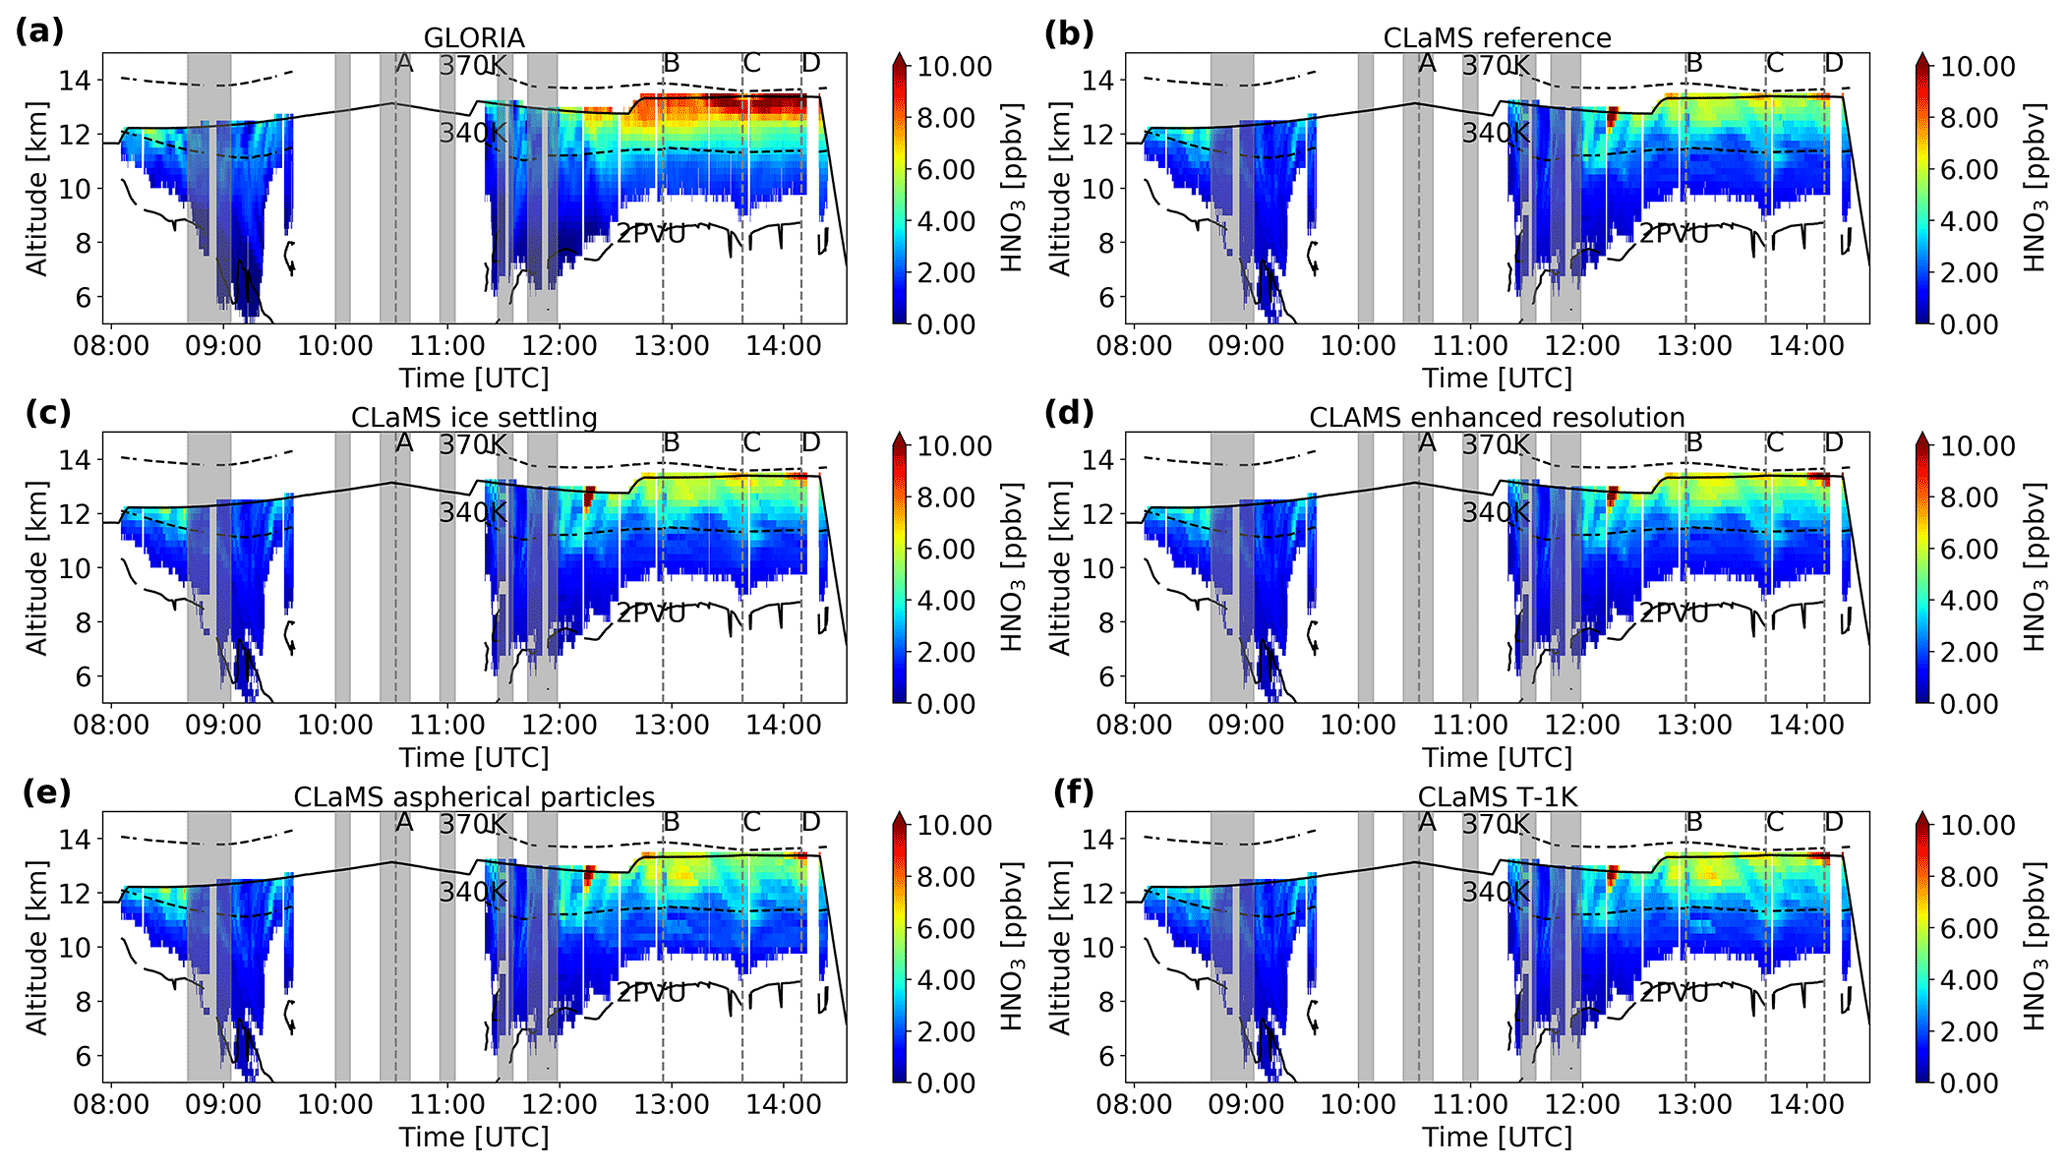
Figure B3Cross sections of HNO3 volume mixing ratio distribution for flight 12 on 31 January 2016 derived by GLORIA (a) and modelled by the CLaMS reference simulation (b), and sensitivity simulations considering (c) ice formation on NAT particles, (d) temperature fluctuations, (e) growth rates of aspherical particles and (f) 1 K global temperature offset. Flight altitude (bold black line), characteristic waypoints (A, B, C, D), 340 and 370 K potential temperature levels (MERRA-2, dashed black lines), and 2 PVU level (MERRA-2, black line). Please note the changed colour bar compared to Figs. B1, B2, B4.

Figure B4Cross sections of HNO3 volume mixing ratio distribution for flight 21 on 18 March 2016 derived by GLORIA (a) and modelled by the CLaMS reference simulation (b), and sensitivity simulations considering (c) ice formation on NAT particles, (d) temperature fluctuations, (e) growth rates of aspherical particles and (f) 1 K global temperature offset. Flight altitude (bold black line), characteristic waypoints (A, B, C), 340 and 370 K potential temperature levels (MERRA-2, dashed black lines), and 2 PVU level (MERRA-2, black line).
MB conducted the analysis and interpretation of GLORIA level-2 data and model simulations, and prepared the paper with contributions from all co-authors. JUG performed the CLaMS model simulations. SJ, JU and WW performed the level-1 and level-2 analyses of GLORIA data. MH contributed to the GLORIA data analysis and interpretation. FFV and PP coordinated the GLORIA operations during the PGS campaign. HO and BMS coordinated the PGS field campaign. HZ provided the particle HNO3 data. PB contributed to the interpretation and the paper preparation.
The authors declare that they have no conflict of interest.
This article is part of the special issue “The Polar Stratosphere in a Changing Climate (POLSTRACC) (ACP/AMT inter-journal SI)”. It is not associated with a conference.
We thank the PGS coordination team and the DLR-FX for successfully conducting the field campaign. The results are based on the efforts of all members of the GLORIA team, including the technology institutes ZEA-1 and ZEA-2 at Forschungszentrum Jülich. We thank NASA for providing their MERRA-2 meteorological reanalysis data set.
We acknowledge the computing time for the CLaMS 5 simulations granted on the supercomputer JURECA at Jülich Supercomputing Centre (JSC) under the VSR project ID JICG11. This work was supported by the German Research Foundation (Deutsche Forschungsgemeinschaft, DFG Priority Program SPP 1294). Research by Wolfgang Woiwode is supported by the DFG grant WO 2160/1-1. Sören Johansson
has received funding from the European Commission's Seventh Framework Programme (FP7/2007–2013) under grant agreement 603557. Further support was received by the German research initiative ROMIC (Role of the Middle Atmosphere in Climate) and by the German Ministry of Research and Education (BMBF) project
“Investigation of the life cycle of gravity waves” (GW-LCYCLE, subproject 2, 01LG1206B). We acknowledge support by the Deutsche Forschungsgemeinschaft and the Open Access Publishing Fund of the Karlsruhe Institute of Technology.
The article processing charges for this open-access
publication were covered by a Research
Centre of the Helmholtz Association.
This paper was edited by Martyn Chipperfield and reviewed by two anonymous referees.
Carslaw, K. S.: A vortex-scale simulation of the growth and sedimentation of large nitric acid hydrate particles, J. Geophys. Res., 107, SOL 43-1–SOL 43–16, https://doi.org/10.1029/2001JD000467, 2002. a, b
Carslaw, K. S., Wirth, M., Tsias, A., Luo, B. P., Dörnbrack, A., Leutbecher, M., Volkert, H., Renger, W., Bacmeister, J. T., and Peter, T.: Particle microphysics and chemistry in remotely observed mountain polar stratospheric clouds, J. Geophys. Res.-Atmos., 103, 5785–5796, https://doi.org/10.1029/97JD03626, 1998. a
Davies, S., Mann, G. W., Carslaw, K. S., Chipperfield, M. P., Kettleborough, J. A., Santee, M. L., Oelhaf, H., Wetzel, G., Sasano, Y., and Sugita, T.: 3-D microphysical model studies of Arctic denitrification: comparison with observations, Atmos. Chem. Phys., 5, 3093–3109, https://doi.org/10.5194/acp-5-3093-2005, 2005. a
Dee, D. P., Uppala, S. M., Simmons, A. J., Berrisford, P., Poli, P., Kobayashi, S., Andrae, U., Balmaseda, M. A., Balsamo, G., Bauer, P., Bechtold, P., Beljaars, A. C. M., van de Berg, L., Bidlot, J., Bormann, N., Delsol, C., Dragani, R., Fuentes, M., Geer, A. J., Haimberger, L., Healy, S. B., Hersbach, H., Hólm, E. V., Isaksen, L., Kållberg, P., Köhler, M., Matricardi, M., McNally, A. P., Monge-Sanz, B. M., Morcrette, J.-J., Park, B.-K., Peubey, C., de Rosnay, P., Tavolato, C., Thépaut, J.-N., and Vitart, F.: The ERA-Interim reanalysis: configuration and performance of the data assimilation system, Q. J. Roy. Meteor. Soc., 137, 553–597, https://doi.org/10.1002/qj.828, 2011. a
Dibb, J. E., Scheuer, E., Avery, M., Plant, J., and Sachse, G.: In situ evidence for renitrification in the Arctic lower stratosphere during the polar aura validation experiment (PAVE), Geophys. Res. Lett., 33, L12815, https://doi.org/10.1029/2006GL026243, 2006. a, b
Dunkerton, T. J. and Delisi, D. P.: Evolution of potential vorticity in the winter stratosphere of January-February 1979, J. Geophys. Res., 91, 1199, https://doi.org/10.1029/JD091iD01p01199, 1986. a
Eckstein, J., Ruhnke, R., Pfahl, S., Christner, E., Diekmann, C., Dyroff, C., Reinert, D., Rieger, D., Schneider, M., Schröter, J., Zahn, A., and Braesicke, P.: From climatological to small-scale applications: simulating water isotopologues with ICON-ART-Iso (version 2.3), Geosci. Model Dev., 11, 5113–5133, https://doi.org/10.5194/gmd-11-5113-2018, 2018. a
Engel, I., Luo, B. P., Pitts, M. C., Poole, L. R., Hoyle, C. R., Grooß, J.-U., Dörnbrack, A., and Peter, T.: Heterogeneous formation of polar stratospheric clouds – Part 2: Nucleation of ice on synoptic scales, Atmos. Chem. Phys., 13, 10769–10785, https://doi.org/10.5194/acp-13-10769-2013, 2013. a
Fahey, D. W., Kelly, K. K., Ferry, G. V., Poole, L. R., Wilson, J. C., Murphy, D. M., Loewenstein, M., and Chan, K. R.: In situ measurements of total reactive nitrogen, total water, and aerosol in a polar stratospheric cloud in the Antarctic, J. Geophys. Res.-Atmos., 94, 11299–11315, https://doi.org/10.1029/JD094iD09p11299, 1989. a, b
Fahey, D. W., Kelly, K. K., Kawa, S. R., Tuck, A. F., Loewenstein, M., Chan, K. R., and Heidt, L. E.: Observations of denitrification and dehydration in the winter polar stratospheres, Nature, 344, 321–324, https://doi.org/10.1038/344321a0, 1990. a, b
Feigl, C., Schlager, H., Ziereis, H., Curtius, J., Arnold, F., and Schiller, C.: Observation of NOy uptake by particles in the Arctic tropopause region at low temperatures, Geophys. Res. Lett., 26, 2215–2218, https://doi.org/10.1029/1999GL900338, 1999. a
Fischer, H., Waibel, A. E., Welling, M., Wienhold, F. G., Zenker, T., Crutzen, P. J., Arnold, F., Bürger, V., Schneider, J., Bregman, A., Lelieveld, J., and Siegmund, P. C.: Observations of high concentrations of total reactive nitrogen (NOy) and nitric acid (HNO3) in the lower Arctic stratosphere during the Stratosphere-Troposphere Experiment by Aircraft Measurements (STREAM) II campaign in February 1995, J. Geophys. Res.-Atmos., 102, 23559–23571, https://doi.org/10.1029/97JD02012, 1997. a
Fischer, H., Birk, M., Blom, C., Carli, B., Carlotti, M., von Clarmann, T., Delbouille, L., Dudhia, A., Ehhalt, D., Endemann, M., Flaud, J. M., Gessner, R., Kleinert, A., Koopman, R., Langen, J., López-Puertas, M., Mosner, P., Nett, H., Oelhaf, H., Perron, G., Remedios, J., Ridolfi, M., Stiller, G., and Zander, R.: MIPAS: an instrument for atmospheric and climate research, Atmos. Chem. Phys., 8, 2151–2188, https://doi.org/10.5194/acp-8-2151-2008, 2008. a
Friedl-Vallon, F., Gulde, T., Hase, F., Kleinert, A., Kulessa, T., Maucher, G., Neubert, T., Olschewski, F., Piesch, C., Preusse, P., Rongen, H., Sartorius, C., Schneider, H., Schönfeld, A., Tan, V., Bayer, N., Blank, J., Dapp, R., Ebersoldt, A., Fischer, H., Graf, F., Guggenmoser, T., Höpfner, M., Kaufmann, M., Kretschmer, E., Latzko, T., Nordmeyer, H., Oelhaf, H., Orphal, J., Riese, M., Schardt, G., Schillings, J., Sha, M. K., Suminska-Ebersoldt, O., and Ungermann, J.: Instrument concept of the imaging Fourier transform spectrometer GLORIA, Atmos. Meas. Tech., 7, 3565–3577, https://doi.org/10.5194/amt-7-3565-2014, 2014. a, b, c
Gelaro, R., McCarty, W., Suárez, M. J., Todling, R., Molod, A., Takacs, L., Randles, C. A., Darmenov, A., Bosilovich, M. G., Reichle, R., Wargan, K., Coy, L., Cullather, R., Draper, C., Akella, S., Buchard, V., Conaty, A., da Silva, A. M., Gu, W., Kim, G.-K., Koster, R., Lucchesi, R., Merkova, D., Nielsen, J. E., Partyka, G., Pawson, S., Putman, W., Rienecker, M., Schubert, S. D., Sienkiewicz, M., and Zhao, B.: The Modern-Era Retrospective Analysis for Research and Applications, Version 2 (MERRA-2), J. Climate, 30, 5419–5454, https://doi.org/10.1175/JCLI-D-16-0758.1, 2017. a
Gettelman, A., Hoor, P., Pan, L. L., Randel, W. J., Hegglin, M. I., and Birner, T.: THE EXTRATROPICAL UPPER TROPOSPHERE AND LOWER STRATOSPHERE, Rev. Geophys., 49, RG3003, https://doi.org/10.1029/2011RG000355, 2011. a, b
Grooß, J.-U., Günther, G., Müller, R., Konopka, P., Bausch, S., Schlager, H., Voigt, C., Volk, C. M., and Toon, G. C.: Simulation of denitrification and ozone loss for the Arctic winter 2002/2003, Atmos. Chem. Phys., 5, 1437–1448, https://doi.org/10.5194/acp-5-1437-2005, 2005. a, b, c
Grooß, J.-U., Engel, I., Borrmann, S., Frey, W., Günther, G., Hoyle, C. R., Kivi, R., Luo, B. P., Molleker, S., Peter, T., Pitts, M. C., Schlager, H., Stiller, G., Vömel, H., Walker, K. A., and Müller, R.: Nitric acid trihydrate nucleation and denitrification in the Arctic stratosphere, Atmos. Chem. Phys., 14, 1055–1073, https://doi.org/10.5194/acp-14-1055-2014, 2014. a, b, c, d, e
Höpfner, M., Larsen, N., Spang, R., Luo, B. P., Ma, J., Svendsen, S. H., Eckermann, S. D., Knudsen, B., Massoli, P., Cairo, F., Stiller, G., v. Clarmann, T., and Fischer, H.: MIPAS detects Antarctic stratospheric belt of NAT PSCs caused by mountain waves, Atmos. Chem. Phys., 6, 1221–1230, https://doi.org/10.5194/acp-6-1221-2006, 2006. a
Höpfner, M., Blom, C. E., Echle, G., Glatthor, N., Hase, F., Stiller, G. P., Karlsruhe, F., and Karlsruhe, U. G.: Retrieval simulations for MIPAS-STR measurements, in: IRS 2000: Current Problems in Atmospheric Radiation, Proc. of the Internat. Radiation Symp., St.Petersburg, DEEPAK Publ., 2001. a
Hoyle, C. R., Engel, I., Luo, B. P., Pitts, M. C., Poole, L. R., Grooß, J.-U., and Peter, T.: Heterogeneous formation of polar stratospheric clouds – Part 1: Nucleation of nitric acid trihydrate (NAT), Atmos. Chem. Phys., 13, 9577–9595, https://doi.org/10.5194/acp-13-9577-2013, 2013. a, b
Hübler, G., Fahey, D. W., Kelly, K. K., Montzka, D. D., Carroll, M. A., Tuck, A. F., Heidt, L. E., Pollock, W. H., Gregory, G. L., and Vedder, J. F.: Redistribution of reactive odd nitrogen in the lower Arctic stratosphere, Geophys. Res. Lett., 17, 453–456, https://doi.org/10.1029/GL017i004p00453, 1990. a, b
Jin, J. J., Semeniuk, K., Manney, G. L., Jonsson, A. I., Beagley, S. R., McConnell, J. C., Rinsland, C. P., Boone, C. D., Walker, K. A., and Bernath, P. F.: Denitrification in the Arctic winter 2004/2005: Observations from ACE-FTS, Geophys. Res. Lett., 33, L15S01, https://doi.org/10.1029/2006GL027687, 2006. a, b
Johansson, S., Woiwode, W., Höpfner, M., Friedl-Vallon, F., Kleinert, A., Kretschmer, E., Latzko, T., Orphal, J., Preusse, P., Ungermann, J., Santee, M. L., Jurkat-Witschas, T., Marsing, A., Voigt, C., Giez, A., Krämer, M., Rolf, C., Zahn, A., Engel, A., Sinnhuber, B.-M., and Oelhaf, H.: Airborne limb-imaging measurements of temperature, HNO3, O3, ClONO2, H2O and CFC-12 during the Arctic winter 2015/2016: characterization, in situ validation and comparison to Aura/MLS, Atmos. Meas. Tech., 11, 4737–4756, https://doi.org/10.5194/amt-11-4737-2018, 2018a. a, b, c, d, e
Johansson, S., Woiwode, W., and Höpfner, M.: GLORIA Chemistry Mode temperature and trace gas retrievals from the POLSTRACC/GW-LCYCLEII/GWEX/SALSA campaigns 2015/2016, KIT Bibliothek, https://doi.org/10.5445/IR/1000086506, 2018b. a
Johansson, S., Santee, M. L., Grooß, J.-U., Höpfner, M., Braun, M., Friedl-Vallon, F., Khosrawi, F., Kirner, O., Kretschmer, E., Oelhaf, H., Orphal, J., Sinnhuber, B.-M., Tritscher, I., Ungermann, J., Walker, K. A., and Woiwode, W.: Unusual chlorine partitioning in the 2015/16 Arctic winter lowermost stratosphere: observations and simulations, Atmos. Chem. Phys., 19, 8311–8338, https://doi.org/10.5194/acp-19-8311-2019, 2019. a, b, c, d
Khosrawi, F., Urban, J., Pitts, M. C., Voelger, P., Achtert, P., Kaphlanov, M., Santee, M. L., Manney, G. L., Murtagh, D., and Fricke, K.-H.: Denitrification and polar stratospheric cloud formation during the Arctic winter 2009/2010, Atmos. Chem. Phys., 11, 8471–8487, https://doi.org/10.5194/acp-11-8471-2011, 2011. a
Khosrawi, F., Kirner, O., Sinnhuber, B.-M., Johansson, S., Höpfner, M., Santee, M. L., Froidevaux, L., Ungermann, J., Ruhnke, R., Woiwode, W., Oelhaf, H., and Braesicke, P.: Denitrification, dehydration and ozone loss during the 2015/2016 Arctic winter, Atmos. Chem. Phys., 17, 12893–12910, https://doi.org/10.5194/acp-17-12893-2017, 2017. a, b, c
Kim, Y., Choi, W., Lee, K., Park, J. H., Massie, S. T., Sasano, Y., Nakajima, H., and Yokota, T.: Polar stratospheric clouds observed by the ILAS‐II in the Antarctic region: Dual compositions and variation of compositions during June to August of 2003, J. Geophys. Res.-Atmos., 111, D13S90, https://doi.org/10.1029/2005JD006445, 2006. a
Kleinert, A., Friedl-Vallon, F., Guggenmoser, T., Höpfner, M., Neubert, T., Ribalda, R., Sha, M. K., Ungermann, J., Blank, J., Ebersoldt, A., Kretschmer, E., Latzko, T., Oelhaf, H., Olschewski, F., and Preusse, P.: Level 0 to 1 processing of the imaging Fourier transform spectrometer GLORIA: generation of radiometrically and spectrally calibrated spectra, Atmos. Meas. Tech., 7, 4167–4184, https://doi.org/10.5194/amt-7-4167-2014, 2014. a
Krause, J., Hoor, P., Engel, A., Plöger, F., Grooß, J.-U., Bönisch, H., Keber, T., Sinnhuber, B.-M., Woiwode, W., and Oelhaf, H.: Mixing and ageing in the polar lower stratosphere in winter 2015–2016, Atmos. Chem. Phys., 18, 6057–6073, https://doi.org/10.5194/acp-18-6057-2018, 2018. a
Manney, G. L. and Lawrence, Z. D.: The major stratospheric final warming in 2016: dispersal of vortex air and termination of Arctic chemical ozone loss, Atmos. Chem. Phys., 16, 15371–15396, https://doi.org/10.5194/acp-16-15371-2016, 2016. a, b, c, d
Manney, G. L., Zurek, R. W., O'Neill, A., and Swinbank, R.: On the Motion of Air through the Stratospheric Polar Vortex, J. Atmos. Sci., 51, 2973–2994, https://doi.org/10.1175/1520-0469(1994)051<2973:OTMOAT>2.0.CO;2, 1994. a
Matthias, V., Dörnbrack, A., and Stober, G.: The extraordinarily strong and cold polar vortex in the early northern winter 2015/2016, Geophys. Res. Lett., 43, 12287–12294, https://doi.org/10.1002/2016GL071676, 2016. a
McKenna, D. S.: A new Chemical Lagrangian Model of the Stratosphere (CLaMS) 1. Formulation of advection and mixing, J. Geophys. Res., 107, 1435, https://doi.org/10.1029/2000JD000114, 2002a. a
McKenna, D. S.: A new Chemical Lagrangian Model of the Stratosphere (CLaMS) 2. Formulation of chemistry scheme and initialization, J. Geophys. Res., 107, 4256, https://doi.org/10.1029/2000JD000113, 2002b. a
Molleker, S., Borrmann, S., Schlager, H., Luo, B., Frey, W., Klingebiel, M., Weigel, R., Ebert, M., Mitev, V., Matthey, R., Woiwode, W., Oelhaf, H., Dörnbrack, A., Stratmann, G., Grooß, J.-U., Günther, G., Vogel, B., Müller, R., Krämer, M., Meyer, J., and Cairo, F.: Microphysical properties of synoptic-scale polar stratospheric clouds: in situ measurements of unexpectedly large HNO3-containing particles in the Arctic vortex, Atmos. Chem. Phys., 14, 10785–10801, https://doi.org/10.5194/acp-14-10785-2014, 2014. a
Nash, E. R., Newman, P. A., Rosenfield, J. E., and Schoeberl, M. R.: An objective determination of the polar vortex using Ertel's potential vorticity, J. Geophys. Res.-Atmos., 101, 9471–9478, https://doi.org/10.1029/96JD00066, 1996. a
Northway, M. J., Gao, R. S., Popp, P. J., Holecek, J. C., Fahey, D. W., Carslaw, K. S., Tolbert, M. A., Lait, L. R., Dhaniyala, S., Flagan, R. C., Wennberg, P. O., Mahoney, M. J., Herman, R. L., Toon, G. C., and Bui, T. P.: An analysis of large HNO3-containing particles sampled in the Arctic stratosphere during the winter of 1999/2000, J. Geophys. Res.-Atmos., 107, SOL 41-1–SOL 41-22, https://doi.org/10.1029/2001JD001079, 2002. a
Pitts, M. C., Poole, L. R., and Gonzalez, R.: Polar stratospheric cloud climatology based on CALIPSO spaceborne lidar measurements from 2006 to 2017, Atmos. Chem. Phys., 18, 10881–10913, https://doi.org/10.5194/acp-18-10881-2018, 2018. a, b, c
Popp, P. J., Northway, M. J., Holecek, J. C., Gao, R. S., Fahey, D. W., Elkins, J. W., Hurst, D. F., Romashkin, P. A., Toon, G. C., Sen, B., Schauffler, S. M., Salawitch, R. J., Webster, C. R., Herman, R. L., Jost, H., Bui, T. P., Newman, P. A., and Lait, L. R.: Severe and extensive denitrification in the 1999–2000 Arctic winter stratosphere, Geophys. Res. Lett., 28, 2875–2878, https://doi.org/10.1029/2001GL013132, 2001. a
Rex, M., Salawitch, R. J., Deckelmann, H., von der Gathen, P., Harris, N. R. P., Chipperfield, M. P., Naujokat, B., Reimer, E., Allaart, M., Andersen, S. B., Bevilacqua, R., Braathen, G. O., Claude, H., Davies, J., de Backer, H., Dier, H., Dorokhov, V., Fast, H., Gerding, M., Godin-Beekmann, S., Hoppel, K., Johnson, B., Kyrö, E., Litynska, Z., Moore, D., Nakane, H., Parrondo, M. C., Risley, A. D., Skrivankova, P., Stübi, R., Viatte, P., Yushkov, V., and Zerefos, C.: Arctic winter 2005: Implications for stratospheric ozone loss and climate change, Geophys. Res. Lett., 33, 221, https://doi.org/10.1029/2006GL026731, 2006. a, b
Riese, M., Ploeger, F., Rap, A., Vogel, B., Konopka, P., Dameris, M., and Forster, P.: Impact of uncertainties in atmospheric mixing on simulated UTLS composition and related radiative effects, J. Geophys. Res.-Atmos., 117, D16305, https://doi.org/10.1029/2012JD017751, 2012. a
Riese, M., Oelhaf, H., Preusse, P., Blank, J., Ern, M., Friedl-Vallon, F., Fischer, H., Guggenmoser, T., Höpfner, M., Hoor, P., Kaufmann, M., Orphal, J., Plöger, F., Spang, R., Suminska-Ebersoldt, O., Ungermann, J., Vogel, B., and Woiwode, W.: Gimballed Limb Observer for Radiance Imaging of the Atmosphere (GLORIA) scientific objectives, Atmos. Meas. Tech., 7, 1915–1928, https://doi.org/10.5194/amt-7-1915-2014, 2014. a
Santee, M. L., Manney, G. L., Froidevaux, L., Read, W. G., and Waters, J. W.: Six years of UARS Microwave Limb Sounder HNO3 observations: Seasonal, interhemispheric, and interannual variations in the lower stratosphere, J. Geophys. Res.-Atmos., 104, 8225–8246, https://doi.org/10.1029/1998JD100089, 1999. a
Sinnhuber, B.-M., Stiller, G., Ruhnke, R., von Clarmann, T., Kellmann, S., and Aschmann, J.: Arctic winter 2010/2011 at the brink of an ozone hole, Geophys. Res. Lett., 38, L24814, https://doi.org/10.1029/2011GL049784, 2011. a
Stiller, G. P., von Clarmann, T., Funke, B., Glatthor, N., Hase, F., Höpfner, M., and Linden, A.: Sensitivity of trace gas abundances retrievals from infrared limb emission spectra to simplifying approximations in radiative transfer modelling, J. Quant. Spectrosc. Ra., 72, 249–280, https://doi.org/10.1016/S0022-4073(01)00123-6, 2002. a
Stratmann, G., Ziereis, H., Stock, P., Brenninkmeijer, C., Zahn, A., Rauthe-Schöch, A., Velthoven, P., Schlager, H., and Volz-Thomas, A.: NO and NOy in the upper troposphere: Nine years of CARIBIC measurements onboard a passenger aircraft, Atmos. Environ., 133, 93–111, https://doi.org/10.1016/j.atmosenv.2016.02.035, 2016. a
Tabazadeh, A. and Toon, O. B.: The presence of metastable HNO3∕H2O solid phases in the stratosphere inferred from ER 2 data, J. Geophys. Res.-Atmos., 101, 9071–9078, https://doi.org/10.1029/96JD00062, 1996. a
Tritscher, I., Grooß, J.-U., Spang, R., Pitts, M. C., Poole, L. R., Müller, R., and Riese, M.: Lagrangian simulation of ice particles and resulting dehydration in the polar winter stratosphere, Atmos. Chem. Phys., 19, 543–563, https://doi.org/10.5194/acp-19-543-2019, 2019. a, b, c, d, e
Tuck, A. F., Baumgardner, D., Chan, K. R., Dye, J. E., Elkins, J. W., Hovde, S. J., Kelly, K. K., Loewenstein, M., Margitan, J. J., May, R. D., Podolske, J. R., Proffitt, M. H., Rosenlof, K. H., Smith, W. L., Webster, C. R., and Wilson, J. C.: The Brewer‐Dobson Circulation In the Light of High Altitude In Situ Aircraft Observations, Q. J. Roy. Meteor. Soc., 123, 1–69, https://doi.org/10.1002/qj.49712353702, 1997. a
Voigt, C., Dörnbrack, A., Wirth, M., Groß, S. M., Pitts, M. C., Poole, L. R., Baumann, R., Ehard, B., Sinnhuber, B.-M., Woiwode, W., and Oelhaf, H.: Widespread polar stratospheric ice clouds in the 2015–2016 Arctic winter – implications for ice nucleation, Atmos. Chem. Phys., 18, 15623–15641, https://doi.org/10.5194/acp-18-15623-2018, 2018. a, b
Waibel, A. E.: Arctic Ozone Loss Due to Denitrification, Science, 283, 2064–2069, https://doi.org/10.1126/science.283.5410.2064, 1999. a, b
Waters, J. W., Froidevaux, L., Harwood, R. S., Jarnot, R. F., Pickett, H. M., Read, W. G., Siegel, P. H., Cofield, R. E., Filipiak, M. J., Flower, D. A., Holden, J. R., Lau, G. K., Livesey, N. J., Manney, G. L., Pumphrey, H. C., Santee, M. L., Wu, D. L., Cuddy, D. T., Lay, R. R., Loo, M. S., Perun, V. S., Schwartz, M. J., Stek, P. C., Thurstans, R. P., Boyles, M. A., Chandra, K. M., Chavez, M. C., Chen, G.-S., Chudasama, B. V., Dodge, R., Fuller, R. A., Girard, M. A., Jiang, J. H., Jiang, Y., Knosp, B. W., LaBelle, R. C., Lam, J. C., Lee, K. A., Miller, D., Oswald, J. E., Patel, N. C., Pukala, D. M., Quintero, O., Scaff, D. M., van Snyder, W., Tope, M. C., Wagner, P. A., and Walch, M. J.: The Earth observing system microwave limb sounder (EOS MLS) on the aura Satellite, IEEE T. Geosci. Remote Sens., 44, 1075–1092, https://doi.org/10.1109/TGRS.2006.873771, 2006. a
Werner, A., Volk, C. M., Ivanova, E. V., Wetter, T., Schiller, C., Schlager, H., and Konopka, P.: Quantifying transport into the Arctic lowermost stratosphere, Atmos. Chem. Phys., 10, 11623–11639, https://doi.org/10.5194/acp-10-11623-2010, 2010. a, b
Woiwode, W., Grooß, J.-U., Oelhaf, H., Molleker, S., Borrmann, S., Ebersoldt, A., Frey, W., Gulde, T., Khaykin, S., Maucher, G., Piesch, C., and Orphal, J.: Denitrification by large NAT particles: the impact of reduced settling velocities and hints on particle characteristics, Atmos. Chem. Phys., 14, 11525–11544, https://doi.org/10.5194/acp-14-11525-2014, 2014. a, b, c
Woiwode, W., Höpfner, M., Bi, L., Pitts, M. C., Poole, L. R., Oelhaf, H., Molleker, S., Borrmann, S., Klingebiel, M., Belyaev, G., Ebersoldt, A., Griessbach, S., Grooß, J.-U., Gulde, T., Krämer, M., Maucher, G., Piesch, C., Rolf, C., Sartorius, C., Spang, R., and Orphal, J.: Spectroscopic evidence of large aspherical β-NAT particles involved in denitrification in the December 2011 Arctic stratosphere, Atmos. Chem. Phys., 16, 9505–9532, https://doi.org/10.5194/acp-16-9505-2016, 2016. a
Zhu, Y., Toon, O. B., Pitts, M. C., Lambert, A., Bardeen, C., and Kinnison, D. E.: Comparing simulated PSC optical properties with CALIPSO observations during the 2010 Antarctic winter, J. Geophys. Res.-Atmos., 122, 1175–1202, https://doi.org/10.1002/2016JD025191, 2017. a
Ziereis, H., Minikin, A., Schlager, H., Gayet, J. F., Auriol, F., Stock, P., Baehr, J., Petzold, A., Schumann, U., Weinheimer, A., Ridley, B., and Ström, J.: Uptake of reactive nitrogen on cirrus cloud particles during INCA, Geophys. Res. Lett., 31, L05115, https://doi.org/10.1029/2003GL018794, 2004. a
- Abstract
- Introduction
- Aircraft campaign and data
- Methods
- GLORIA observations and CLaMS simulations of selected flights from January to March 2016
- Quantification of nitrification of the LMS from December 2015 to January 2016
- Comparison of GLORIA results with CLaMS sensitivity simulations
- Discussion and conclusion
- Data availability
- Appendix A
- Appendix B
- Author contributions
- Competing interests
- Special issue statement
- Acknowledgements
- Financial support
- Review statement
- References