the Creative Commons Attribution 4.0 License.
the Creative Commons Attribution 4.0 License.
 | 24 Oct 2019
Role of black carbon mass size distribution in the direct aerosol radiative forcing
Gang Zhao
Jiangchuan Tao
Chuanyang Shen
Yingli Yu
Chunsheng Zhao
Large uncertainties exist when estimating radiative effects of ambient black carbon (BC) aerosol. Previous studies about the BC aerosol radiative forcing mainly focus on the BC aerosols' mass concentrations and mixing states, while the effects of BC mass size distribution (BCMSD) were not well considered. In this paper, we developed a method of measuring the BCMSD by using a differential mobility analyzer in tandem with an Aethalometer. A comprehensive method of multiple charging corrections was proposed and implemented in measuring the BCMSD. Good agreement was obtained between the BC mass concentration integrated from this system and that measured in the bulk phase, demonstrating the reliability of our proposed method. Characteristics of the BCMSD and corresponding radiative effects were studied based on a field measurement campaign conducted in the North China Plain by using our own measurement system. Results showed that the BCMSD had two modes and the mean peak diameters of the modes were 150 and 503 nm. The BCMSD of the coarser mode varied significantly under different pollution conditions with peak diameter varying between 430 and 580 nm, which gave rise to significant variation in aerosol bulk optical properties. The direct aerosol radiative forcing was estimated to vary by 8.45 % for different measured BCMSDs of the coarser mode, which shared the same magnitude with the variation associated with assuming different aerosol mixing states (10.5 %). Our study reveals that the BCMSD as well as its mixing state in estimating the direct aerosol radiative forcing matters. Knowledge of the BCMSD should be fully considered in climate models.
- Article
(4398 KB) - Full-text XML
-
Supplement
(988 KB) - BibTeX
- EndNote


Atmospheric black carbon (BC) is the second strongest absorbing component in the atmosphere (Bond et al., 2013) but the magnitudes of the warming effects are poorly quantified. When emitted to the surroundings, BC particles transform their morphology from fractal to spherical and then grow as fully compact particles with other components depositing on the BC aerosol (Peng et al., 2016). The variation in the shapes of BC aerosols, together with the variation in the mixing states, can lead to substantial changes in aerosol optical properties (Liu et al., 2017; China et al., 2013; Wu et al., 2016, 2018). BC aerosols also have a significant influence on the climate by interacting with clouds (Koch and Del Genio, 2010; Roberts et al., 2008; Stevens and Feingold, 2009), ice and snow (Bond et al., 2013). A recent study shows that the solar absorption of BC can suppress the turbulence in the atmospheric boundary layer (Wilcox et al., 2016). It is found that BC emissions may be responsible for the increase in droughts and floods in China and India (Menon et al., 2002). In addition, BC can pose a serve threat to human health through inhalation (Nichols et al., 2013; Janssen et al., 2011).
Comprehensive studies have been carried out to evaluate the climatic effect of BC based on the measurement of BC mass concentrations (mBC) (Koch et al., 2009; Ramanathan and Carmichael, 2008). The mBC values near the ground have been well characterized (Ramachandran and Rajesh, 2007; Ran et al., 2016b; Reddington et al., 2013; Song et al., 2013), and the BC vertical distributions are widely measured and evaluated as well (Ran et al., 2016a; Babu et al., 2011; Ferrero et al., 2011). Despite these measurements, more insights into the BC microphysical properties can help to estimate the influence of BC aerosols on visibility (Zhang et al., 2008), climate (Jacobson, 2001) and human health (Lippmann and Albert, 1969). These microphysical properties include BC morphology (Zhang et al., 2016), density (Zhang et al., 2016), complex refractive index (Bond et al., 2013), hygroscopicity (Zhang et al., 2008; Peng et al., 2017), mixing states (Moffet et al., 2016; Raatikainen et al., 2017), and particularly the mass size distribution (BCMSD) (Cheng et al., 2012; Cheng and Yang, 2016; Gong et al., 2016). Knowledge of BCMSD is not only helpful to study the mixing state of BC aerosols (Raatikainen et al., 2017) but also essential to model the role of BC in evaluating regional and global climate accurately. BC radiative effects are highly sensitive to the emitted BC particle size distribution (Matsui et al., 2018). The health impacts of BC are significantly related to the BCMSD (Turner et al., 2015). Furthermore, the information of BCMSD can help to study the source, the evolution and the mixing state of ambient BC aerosols (Yu et al., 2010).
Many methods have been proposed to measure BCMSD. For instance, the BCMSD was measured by sampling the aerosol in the size range from about 50 nm to several micrometers on quartz fiber filter substrates using a micro-orifice uniform deposit impactor (MOUDI) (Venkataraman and Friedlander, 1994; Guo, 2016). Cheng et al. (2014) developed a method to measure the BCMSD by employing two Aethalometers in parallel, with one to measure total mBC and the other to measure mBC below specific particle sizes using a size cutoff inlet. The two abovementioned methods measure the BCMSD corresponding to the aerodynamic diameter. The single-particle soot photometer (SP2) instrument is developed and widely used because it provides single-particle information, hence the BCMSD and the mixing state of the atmospheric aerosols can be derived directly (Schwarz et al., 2006; Gao et al., 2007; Huang et al., 2012; Singh et al., 2016). The BCMSD corresponding to the ambient aerosol mobility diameter can be measured by using a differential mobility analyzer (DMA) in tandem with SP2 (Raatikainen et al., 2017). However, the laser-induced incandescence method cannot provide reliable information about the particles beyond the range of 70 and 400 nm (Moteki and Kondo, 2010), which results in a lack of the knowledge on the BCMSD characteristics for these aerosols over 400 nm. The results from MOUDI find that a large amount of BC locates at the aerodynamic diameter range of between 370 and 1000 nm (Hu et al., 2012; Huang and Yu, 2008). However, the measurements of MOUDI cannot give detailed information on the BCMSD evolution due to the low temporal and diameter resolutions (Hu et al., 2012; Huang and Yu, 2008). The characteristics of the BCMSD larger than 370 nm is not well studied due to the limitations of the instrument.
Recently, Ning et al. (2013) and Stabile et al. (2012) proposed a new method to measure the BCMSD by using a differential mobility analyzer (DMA) in tandem with an Aethalometer (AE). This method has the potential of measuring the BCMSD from 20 to 584 nm with high time resolution. We develop and validate the BCMSD measurement system based on the works of Ning et al. (2013). The developed measurement system was employed in a field campaign in the North China Plain. The characteristics of the measured BCMSD were studied based on the field measurements. Furthermore, the effects of BCMSD variations on the aerosol optical properties and corresponding direct aerosol radiative properties were evaluated. The aerosol optical properties were calculated by using the Mie scattering theory. The direct aerosol radiative forcing (DARF) was estimated by using the Santa Barbara DISORT (discrete ordinates radiative transfer) Atmospheric Radiative Transfer (SBDART) model.
The structure of this paper is organized as follows. Section 2 gives the information about the instrument setup and field measurements. Section 3 gives the detailed method used in this study, which contains (1) conducting multiple charging corrections when deriving the aerosol BCMSD and (2) evaluating the aerosol optical and radiative properties for different BCMSDs. Results and discussions are shown in Sect. 4. The conclusion is drawn in the last part.
The measurement system setup was based on the works of Stabile et al. (2012) and Ning et al. (2013) as schematically shown in Fig. 1. The ambient sample aerosol particles were firstly dried to below a relative humidity of 30 % through a Nafion drying tube before passing through to the DMA (Model 3081, TSI, USA). The DMA scanned aerosol particles with diameter ranges from 12.3 to 697 nm over a period of 285 s and started another scanning after a pause of 15 s, so one complete cycle took 5 min. The sheath and sample flow rates of the DMA were 3 and 0.5 L min−1, respectively. The quasi-monodisperse aerosols that passed through the DMA were further divided into two flows: one led to an Aethalometer (AE51, model 51, microAeth, USA) with a flow rate of 0.2 L min−1 to measure the absorption coefficient (σabs) at 1 s time resolution and the other one with a flow rate of 0.3 L min−1 flow directed to a condensation particle counter (CPC, model 3772, TSI, USA), which counted particle number concentrations at 0.1 s resolution. Clean air with a flow rate of 0.7 L min−1 was used to compensate for the CPC inlet flow, which had a default flow rate of 1 L min−1. Overall, the combined system of DMA, CPC and AE51 could provide one particle number size distribution (PNSD) and size-resolved σabs scan every 5 min. If the mass absorption coefficient (MAC) at a given diameter is known, the BCMSD can be derived correspondingly.

An Aethalometer (AE33, model 33, Magee, USA) was used to measure the σabs or mBC with a time resolution of 1 min. The mass concentration of particles with diameters smaller than 2.5 µm (PM2.5) was concurrently measured with a time resolution of 1 min during the field observations by the tapered element oscillating microbalance (TEOM) dichotomous ambient particulate monitor (1405-DF), which was an indicator of the pollution conditions.
From 21 March to 9 April 2017, an intensive field measurement was conducted to characterize the ambient dry aerosol BCMSD corresponding to aerosol mobility diameters at the AERONET BEIJING_PKU station (39∘59′ N, 116∘18′ E). This station was located on a roof of Peking University campus in the northwest of Beijing, China. There were two main streets that surrounding the station: Chengfu Road to the south and Zhongguancun Street to the west. The aerosol sampled at this station were mainly composed of urban roadside aerosols (Zhao et al., 2018).
3.1 Retrieving the BCMSD
Five steps were involved in calculating the BCMSD using the raw data from the measurement system: (1) correcting the “loading effect” and “multiple scattering effect” of σabs measured by AE51; (2) matching the instrument time between the AE51 and CPC; (3) matching the measured σabs and diameter to get the raw size-resolve σabs that is not involved in multiple charging corrections; (4) conducting the multiple charging corrections of the measured raw size-resolved σabs; and (5) transforming the size-resolved σabs into BCMSD.
3.1.1 Obtaining the raw size-resolved σabs
The Aethalometer (AE51 and AE33) is a well-developed and widely used instrument to measure the σabs (Drinovec et al., 2015; Hansen et al., 1984). When absorbing aerosols accumulate on the sample filter of the Aethalometer continuously, the σabs can be determined by concurrently measuring the light intensities I after the fiber filter and the light intensities I0 transmitted through a reference spot, which is free of aerosol loading. The light attenuation (ATN) is defined as
The total σabs of the loaded particle on the filter is given by
where A is the sample spot area on the filter. The instantaneous σabs can be calculated through the increment of σabs,tot:
where F is the flow rate and ΔATN is the ATN variation during the time period of Δt. The σabs,tot can be transformed to mBC when the mass attenuation cross section (MAC) of BC is known. Traditionally, a constant MAC of 7.7 m2 g−1 was used to deduce the mBC (Drinovec et al., 2015).
Corrections to the measured σabs are necessary because a systematic bias exists due to the prevailingly known “loading effect” and the multiple scattering effect (Drinovec et al., 2015; Virkkula et al., 2007, 2015). The AE33 can directly provide the corrected σabs values through measuring two light intensities of two spots with different BC load efficiencies (Drinovec et al., 2015). For AE51, The correcting method in Virkkula et al. (2007) was adopted:
where k is the correction factor and a constant value of 0.004 is employed in this study to correct the σabs from AE51. In the first part of the Supplement, we show that the loading effect corrections of σabs from AE51 were essential and the value of σabs from AE33 could be used as a reference for the measured BCMSD. As for the multiple scattering corrections, Zhang et al. (2018) compared the measured σabs measured by AE33 and by multiangle absorption photometer (MAAP) at Tsinghua University, which is about 2 km away from our measurement site. They recommended a compensation factor of 2.6 to be used and we adopted the same factor in our study.
Time correction was needed because time gaps between voltages implied on the DMA (particle size) and sample particles measured by different instruments were not the same. The time correction procedures were conducted every day during the field measurement to ensure that the time deviations of the CPC and the AE51 were constrained within 2 s.
Figure S3 gives the time series diagram of scanned aerosol diameters by DMA, measured σabs from AE51 and the aerosol number concentrations counted by CPC. The aerosol PNSD (or size-resolved σabs) could be calculated by matching the DMA diameter and the measured aerosol number concentrations (or measured σabs) by simply using the single-particle charge ratio for each electrical mobility diameter. These measured PNSD and size-resolved σabs did not consider the effect of multiple-charging corrections and are labeled as raw aerosol PNSD and raw aerosol size-resolved σabs.
3.1.2 Multiple charging corrections of raw size-resolved σabs
In the work of Ning et al. (2013), a lot of effort was made to evaluate the performance of the instrument. They considered the diffusion corrections and particle charging corrections. However, the particle charging corrections were limited to single-particle charge ratio as they mentioned that they simplified the particle charge correction by applying the peak electrical mobility for the calculation of representative particle size for each mobility bin and single-particle charge ratio for each primary mobility. They ignored the fact that the aerosol samples selected by the DMA were quasi-monodisperse with different charges and different diameters.
We propose a new algorithm for the multi-charge corrections of the size-resolved σabs. Multi-charge corrections to the measured size distribution were prevailing when the DMA was used to scan the aerosol sizes. When the DMA and CPC are used together to measure the aerosol particle number size distribution (PNSD), the multi-charging corrected aerosol PNSD can be significantly different from the raw measured one (Bau et al., 2014; He and Dhaniyala, 2013; He et al., 2015). As shown in the results part of this study, the multi-charge corrections of the size-resolved σabs could cause differences in both the magnitude and shape of the size-resolved σabs. Therefore, it is necessary to perform multi-charge corrections on the size-resolved σabs. This study developed a new algorithm to correct the size-resolved σabs from measured values based on the work of Hagen and Alofs (2007) and Deng et al. (2011).
When the DMA is charged with a negative voltage, those aerosols with a small range of electrical mobility (ZP) can pass through the DMA:
where qsh is the sheath air flow rate; V is the average voltage on the inner center rod; r1 and r2 are the outer and inner radius of annular space, respectively. The ZP is related to Dp by elementary charge (e), number of elementary charges on the particle (n), and gas viscosity poise (μ) with
where C(Dp) is the Cunningham slip correction:
where τ is the gas mean free path. From Eq. (7), aerosol particles can have the same ZP despite that they have different n and Dp. At the same time, there exists a relatively larger portion of multiple charged particles for those particles with diameters between 100 and 400 nm when the ambient aerosols pass through the X-ray (Tigges et al., 2015; Wiedensohler and Fissan, 1988). Through the above discussion, the selected aerosols by DMA at a given electrical mobility can have different charges which will correspond to different diameters.
When the scan diameter is set as for the singly charged particles and the respective voltage of DMA is Vi (), aerosol particles with an electrical mobility of Zp,i () can pass through the DMA and the observed σabs by AE51 can be expressed as
where x is the scale parameter with the definition of ; A(x) is the average σabs of a single particle for scale parameter x; and is aerosol PNSD that is the multiple charging corrected results from the measured aerosol PNSD. We define the kernel function G(i,x), which is crucial to the algorithm, as
where (x,v) is the probability of particles that are charged with v charges at the scale parameter of x (Wiedensohler, 1988). is the probability of particles that can pass through the DMA with v charges at the scale parameter x (Knutson and Whitby, 1975). In this study, the maximum value of v is 10.
The multiple charging corrections can be expressed as computing the , in which is the predetermined scale parameter from the DMA. To get the numerical integration results of Eq. (9), the diameter interval that is 1∕50 of the measured diameter is used. Thus, Eq. (9) can be written as
where ; xi,j is the jth () parameter that locates at the parameter xi and xi+1; and A(xi,j) (; ), the BC mass ratio at scale parameter xi,j, is expressed as the linear interpolation of the values at the measured diameters.
where Pi is the slope of the linear interpolation result of
refers to these five diameters that are nearest to the predetermined scale parameter xi and C is the intercept of the linear interpolation result.
With , Eq. (11) can be written as
where ,
and
By letting the
this equation is then expressed as
or
where S and A are I×1 vectors and Q is an I×I matrix. This matrix can be solved by using the non-negative least square method.
Finally, the A(x) can be determined and the corresponding size-resolved σabs that is multiple charging corrected can be calculated.
3.1.3 Transform the size-resolved σabs into BCMSD
MAC of different size ranges is necessary when transforming the size-resolved σabs into BCMSD. The MAC at different sizes should be different. When the size-resolved σabs is converted into BCMSD with a constant MAC, the derived BCMSD would be biased.
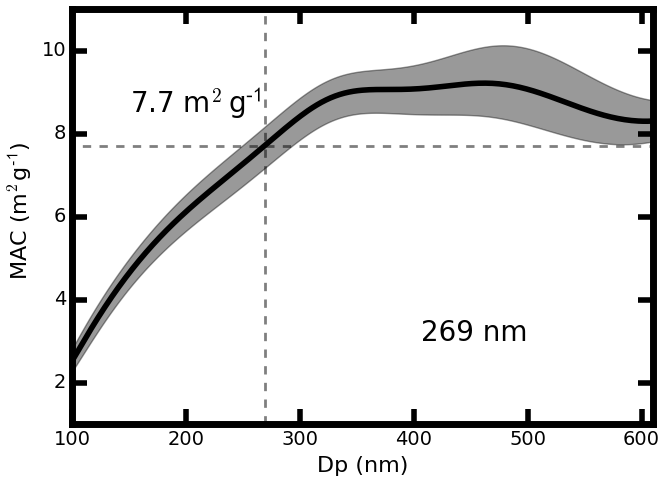
The size-resolved MAC was calculated using the Mie scattering model (Bohren and Huffman, 2007). Based on the Mie scattering theory, MAC values vary for different aerosol core diameter and different total diameter. Results from SP2 measurements show that the size distribution of the BC core diameter peaked at around 120 nm in Beijing (Zhang et al., 2017). For each aerosol diameter, the MAC value with core diameter of 120 nm was used to transform the size-resolved absorption coefficient into the BCMSD. MAC values with core diameter at 120±15 nm were calculated and shown in Fig. 2. From Fig. 2, the MAC varied significantly between 3.6 and 9.2 m2 g−1. The constant MAC values of 7.7 m2 g−1 corresponded to the aerosol diameter of 269 nm. The calculated mean MAC values in Fig. 2 under different diameter were used in this study.
3.1.4 Validation of the multiple charging corrections
An example of the multiple charging corrections of the size-resolved σabs is shown in Fig. 3. The corrections of aerosol PNSD are based on the work of Hagen and Alofs (2007). As shown in Fig. 2a, the corrected aerosol PNSD was significantly different from the original uncorrected one. About half of the measured particles have multiple elementary charge in the size range between 100 and 200 nm. The raw, uncorrected aerosol PNSD had a peak value of 10 920 cm−3 at 98 nm while the corrected aerosol PNSD reached its peak value of 8450 cm−3 at 98 nm. The peak positions of the raw aerosol particle mass size distribution (PMSD, dm∕dlog Dp) peaked at 322 nm with a peak value of 86.3 µg m−3 and the corrected aerosol PMSD had a peak value of 53 µg m−3 at 461 nm. The peak position of the aerosol PMSD shifted a lot before and after the multiple charging corrections. A similar case for the size-resolved σabs is shown in Fig. 2b. The shape of size-resolved σabs changed substantially due to the multiple charging corrections. The measured raw BCMSD had a peak diameter near 320 nm and the magnitude of size-resolved σabs plateau reached 34.3 Mm−1, which is in accordance with the results of Ning et al. (2013), where the multiple charging corrections were not involved. However, the corrected size-resolved σabs peaks near 410 nm with a peak value of about 29.5 Mm−1. According to the result, a small amount of σabs remained in particles with diameter between 100 and 200 nm. The measured size-resolved σabs changed a lot when multiple charging corrections were implemented, which highlighted the necessity of the implementation of appropriate multiple charging corrections.
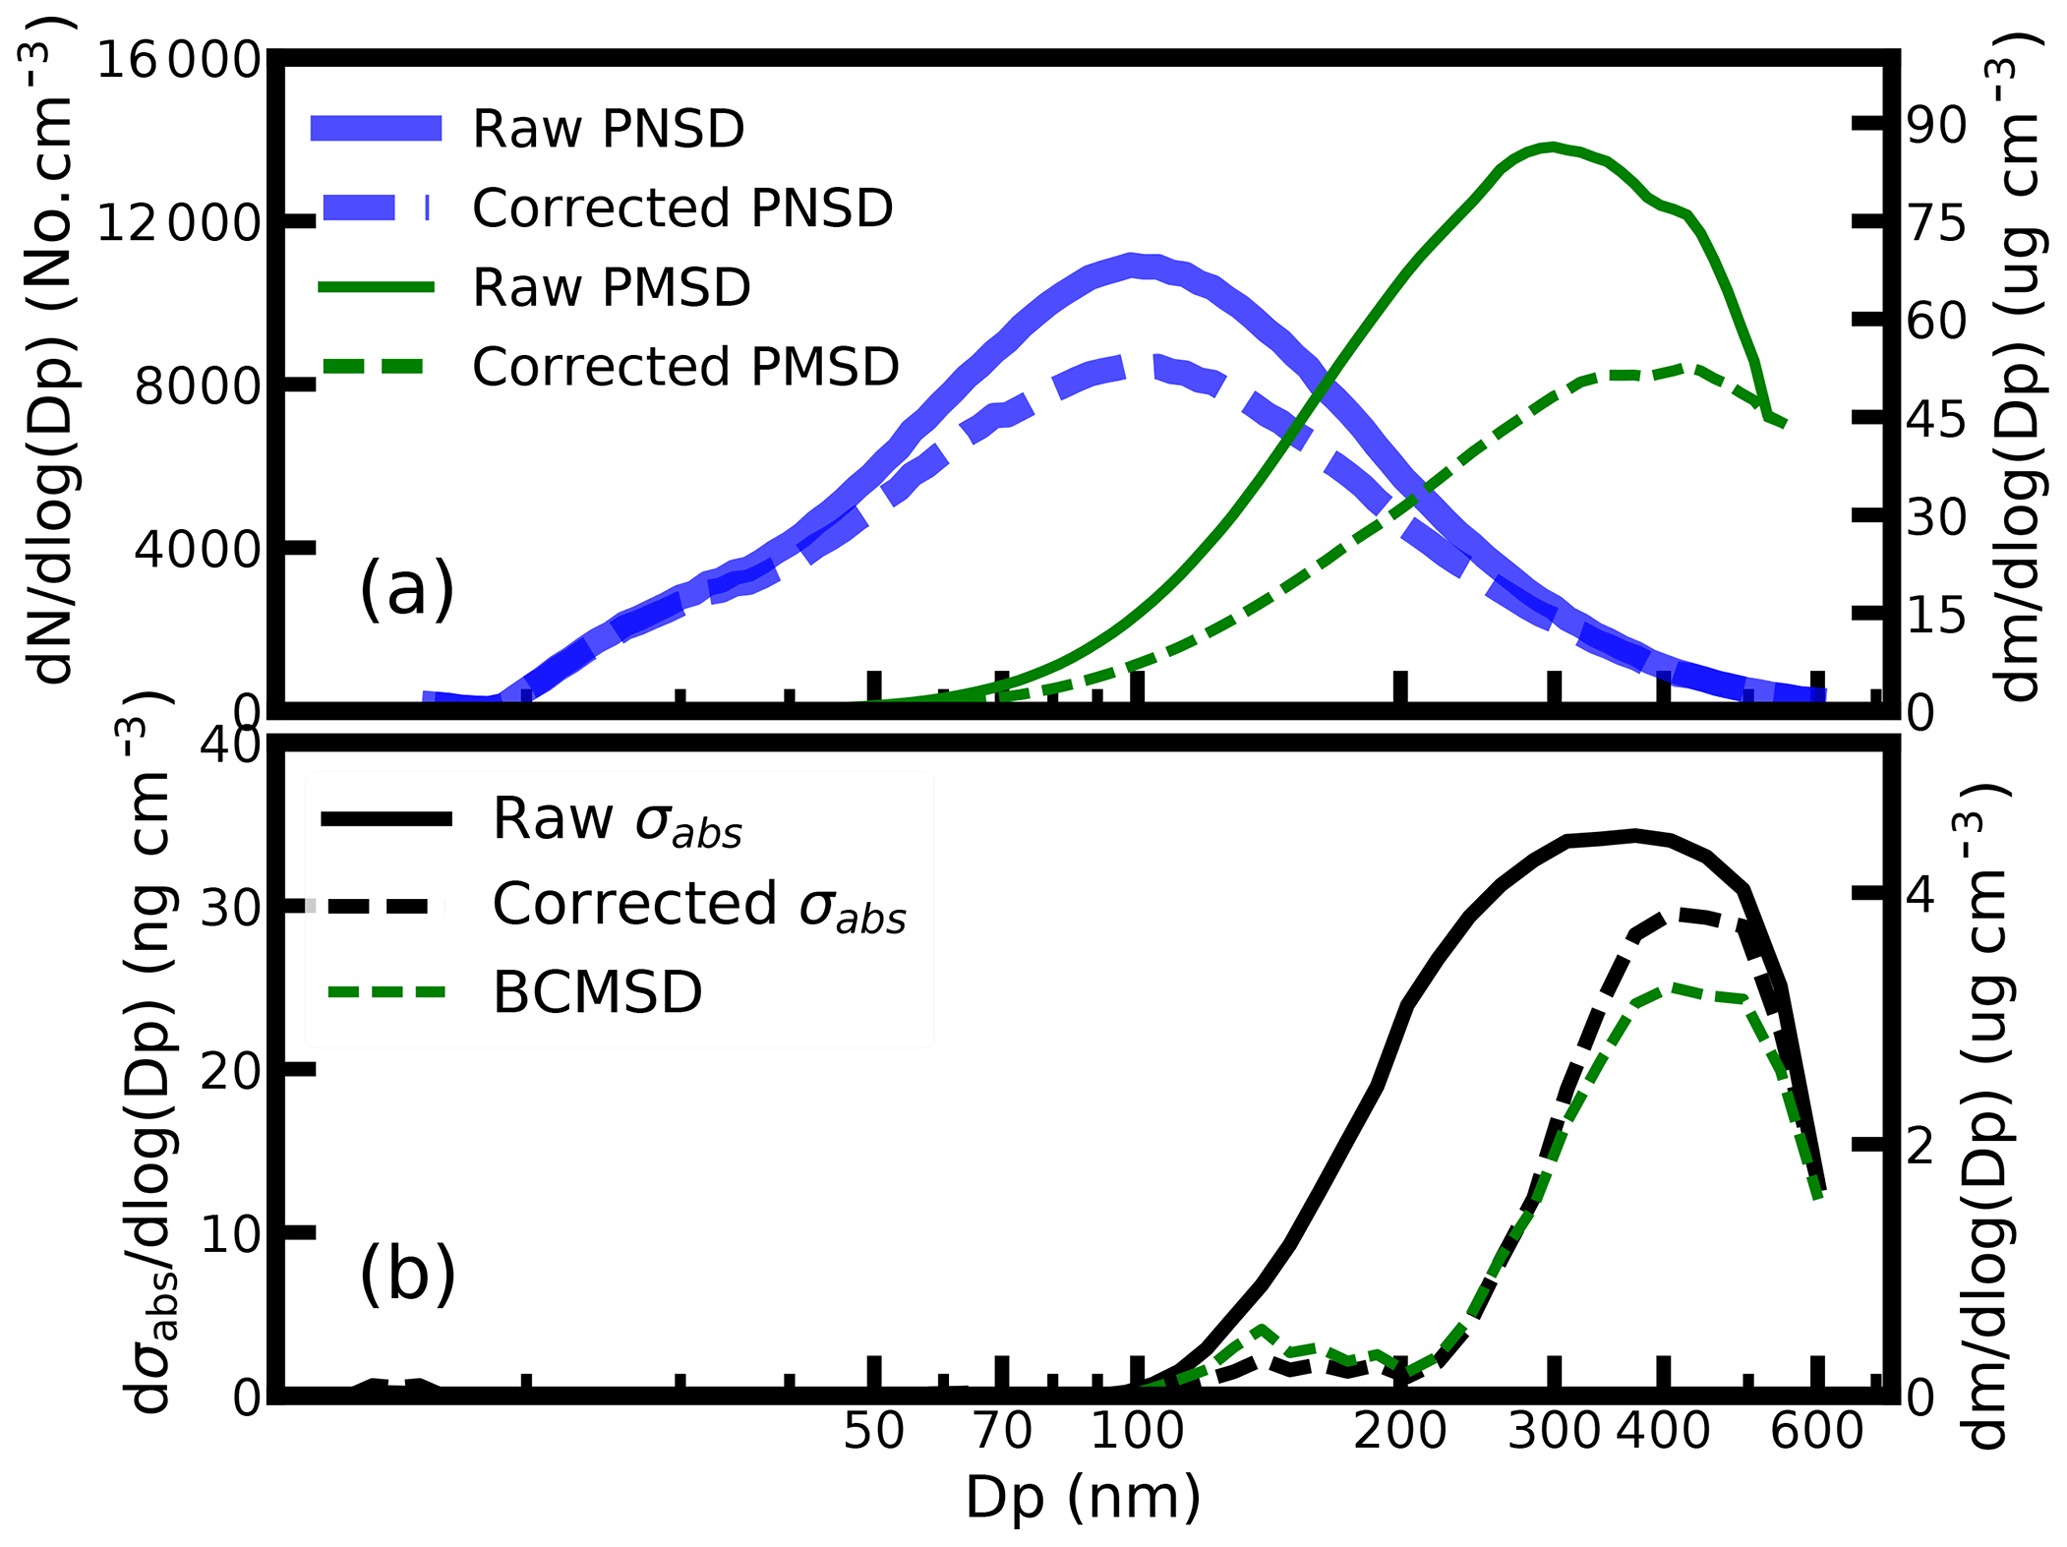
Figure 3Case of multiple charging correction processing. (a) The multiple charging correction of the aerosol PNSD and aerosol PMSD; (b) the multiple charging correction of the size-resolved σabs. The solid line is the measured results without multiple charging corrections and the dotted line is the multiple charging corrections results.
The σabs integrated from measured size-resolved σabs changed after multiple charging corrections. Figure S4 shows the comparison results of the σabs measured by AE33 and the σabs integrated from AE51 measurements. The σabs integrated from uncorrected and corrected size-resolved σabs versus σabs measured by AE33 are shown in Fig. S4a and b, respectively. Before multiple charging corrections, the σabs from uncorrected size-resolved σabs increased linearly with the σabs from AE33, with R2 equaling 0.87, but it was 2.37 times that of AE33 on average. As a comparison, the overall magnitude of σabs integrated from corrected size-resolved σabs agreed better with that from AE33 with a slope of 1.2. With the discussion above, multiple charging corrections were essential for size-resolved σabs and BCMSD measurements.
3.2 Fitting the BCMSD by using two lognormal models
Based on the measurement results, the BCMSD had two modes for most of the conditions. The BCMSDs are assumed to be of two lognormal distributions as
where Dp is the diameter of the aerosols; mi is the mass of mode i (); GSDi is the geometric standard deviation at mode i (); and Dm,i is the geometric mean diameter of the mode i (). The GSDi and Dm,i can be determined by using the least square method with the objective function as
where is the measured mass distribution at , while is the fit mass distribution at .
3.3 Estimating aerosol optical properties with different BCMSD
The Mie scattering model was used to study the influence of the BCMSD variation on the aerosol optical properties. When running the Mie model, aerosol PNSD and BC data were necessary. In this study, The BCMSD was assumed to be a lognormal distributed. Dm of the BCMSD was set to vary from 100 to 600 nm. Geometric standard deviation (GSD) of the BCMSD was set to be in the range between 1.3 and 1.8. BC was treated as partially externally mixed and the remaining aerosol was treated as core-shell mixed. The ratio of externally mixed mBC to core-shell mBC was determined by the method introduced in Ma et al. (2012) and a mean ratio of 0.51 was used. The density and refractive index of BC were set as 1.5 g cm−3 and 1.8+0.54i (Kuang et al., 2015), respectively. The complex refractive index of non-absorbing aerosols was (Wex et al., 2002) at the wavelength of 525 nm. For more details on calculating the aerosol optical properties by using the aerosol PNSD and BCMSD, users can refer to Kuang et al. (2016).
The aerosol PNSD and mBC used here are the mean result of aerosol PNSD and mBC over the whole field measurement, respectively. The amount of BC particles adopted in this study is the mean value of the mBC measured by AE33. For each BCMSD, the extinction coefficient (σext), the scattering coefficient (σsca), the single scattering albedo (SSA) and the asymmetry factor (g) could be obtained from the output of the Mie scattering model.
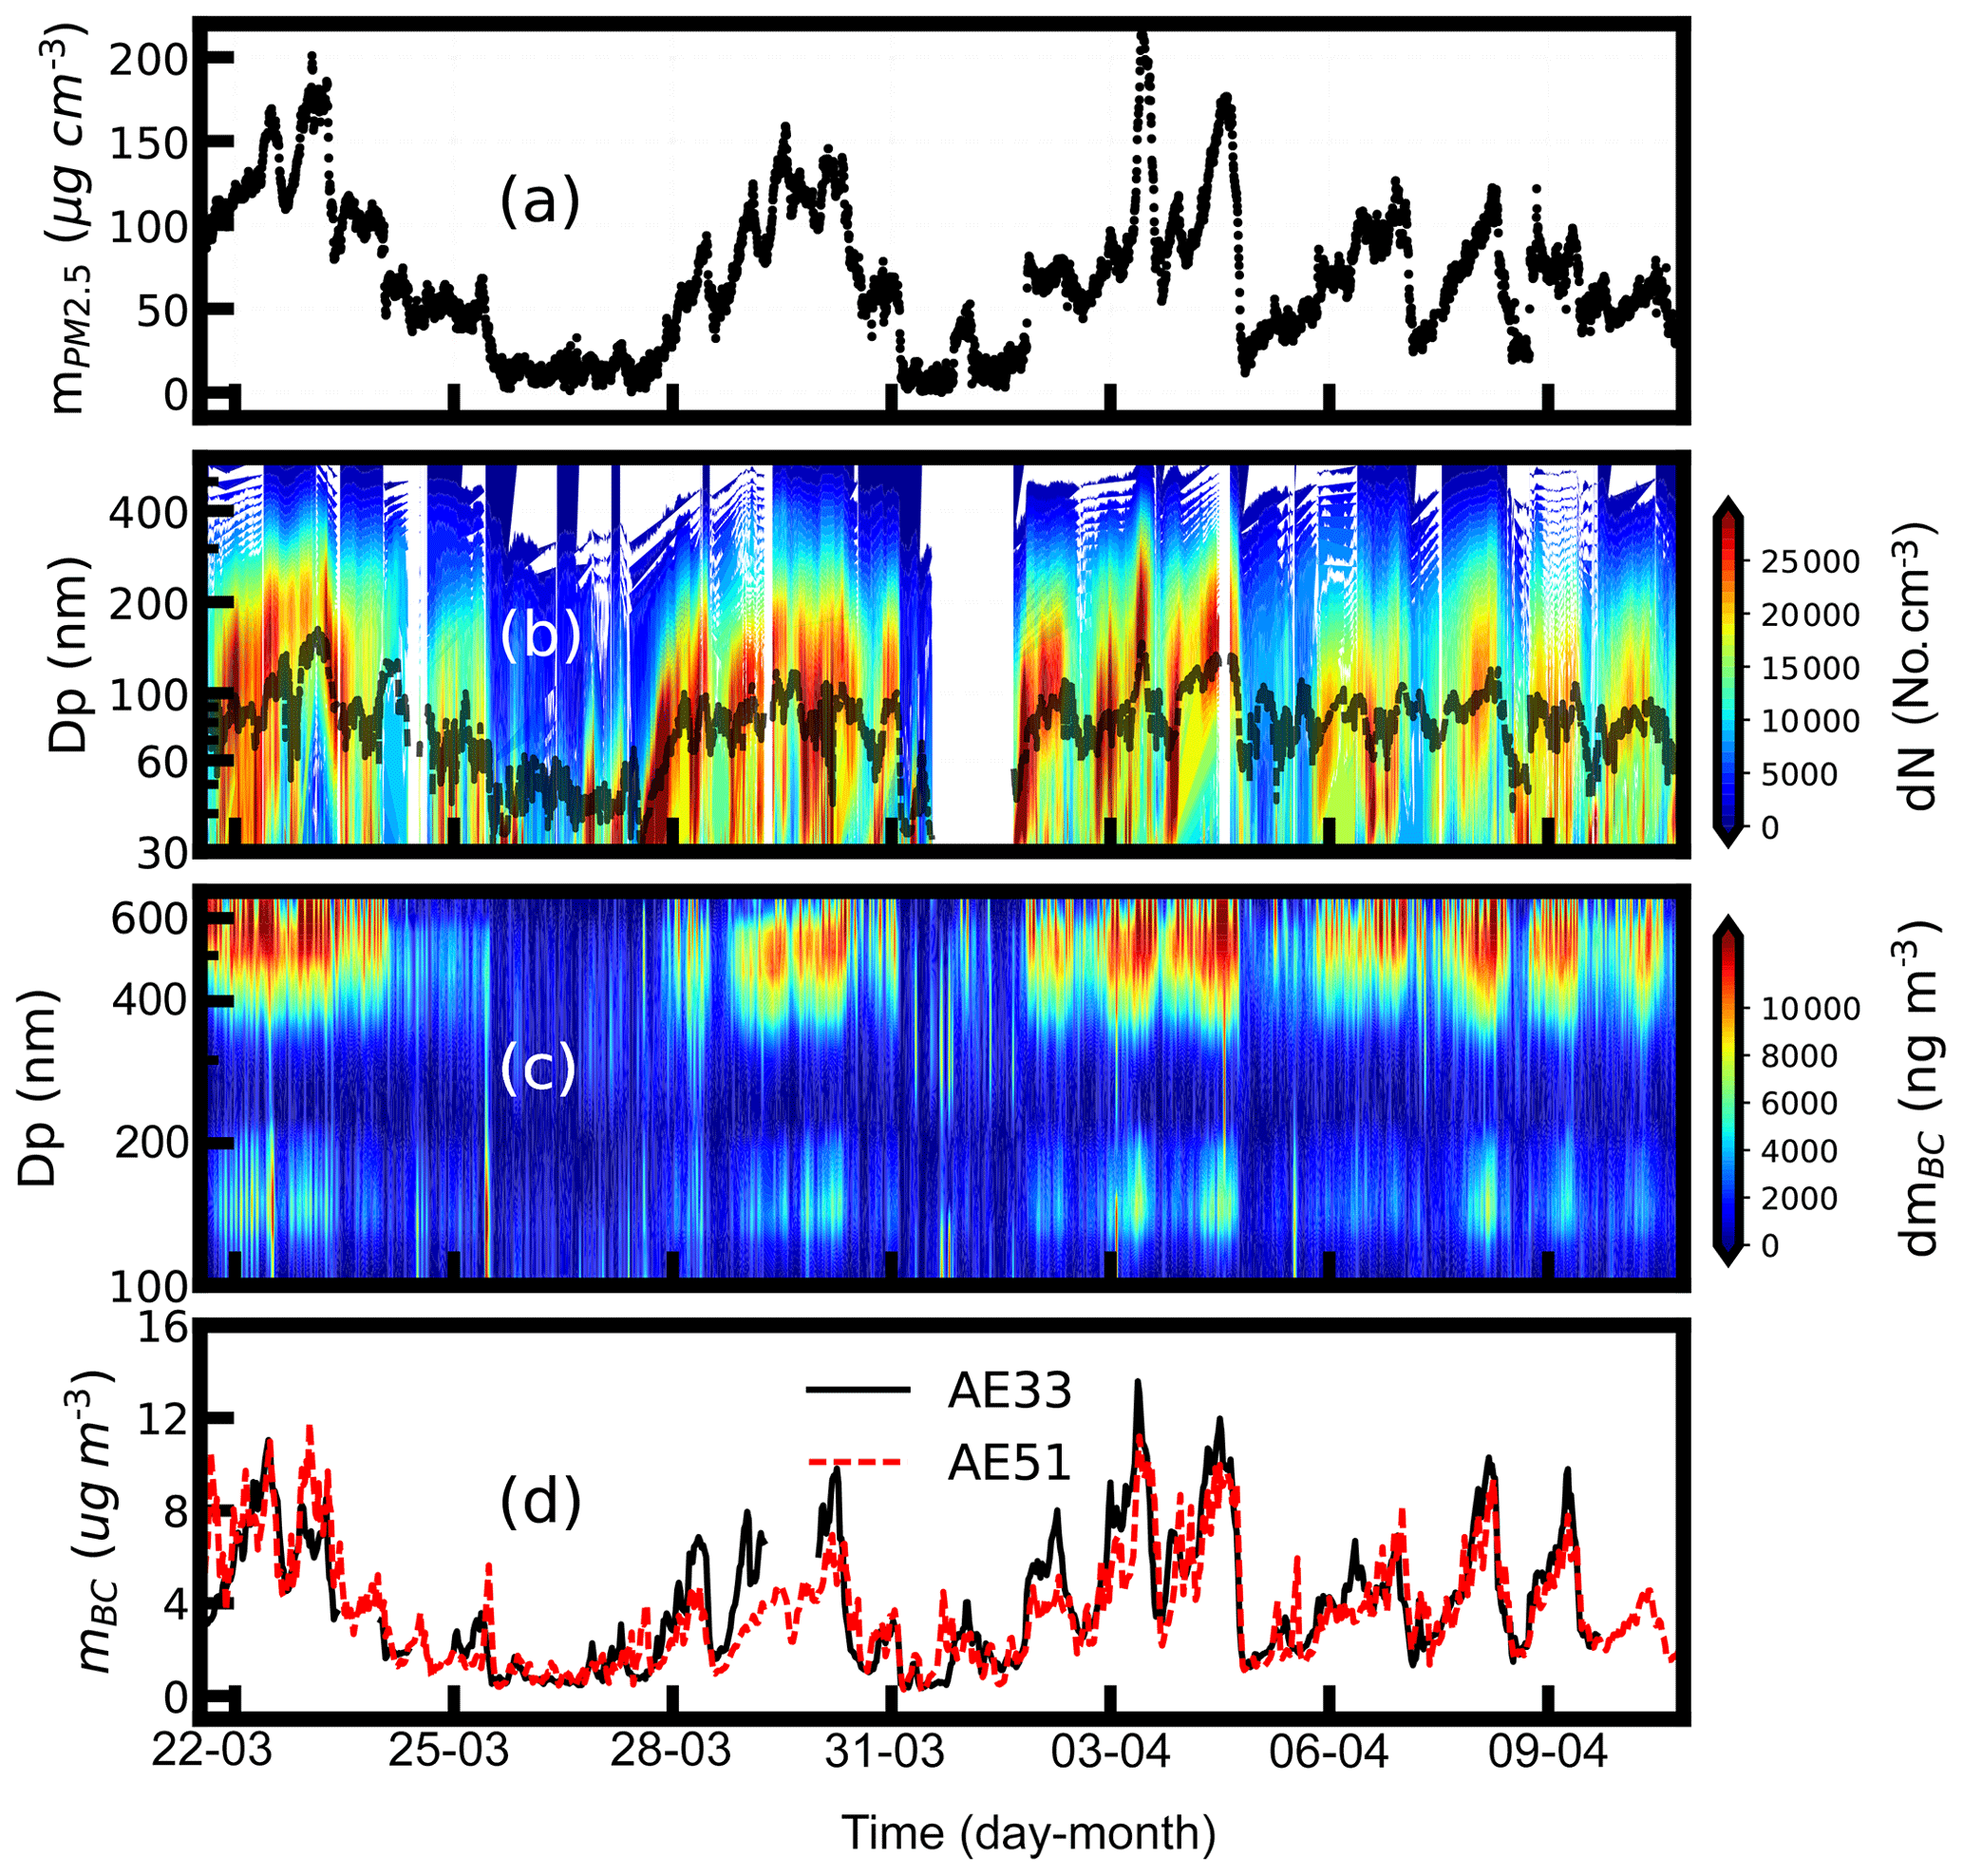
Figure 4The measured time series of mass concentrations for (a) the PM2.5; (b) the aerosol PNSD in filled color, the geometric median diameter in dotted line; (c) the BCMSD; and (d) the mBC by AE33 (black) and mBC from integrated BCMSD from AE51 (red).
3.4 Evaluating the DARF with different BCMSD
In this study, the SBDART model (Ricchiazzi et al., 1998) was employed to estimate the DARF. In our study, the instantaneous DARF for cloud-free conditions at the top of atmosphere was calculated for an irradiance wavelength range from 0.25 to 4 µm. Input of the model required the profiles of aerosol σext, SSA and g. These profiles were calculated from the parameterization of the aerosol vertical distributions. For details on calculating the σext, SSA and g profiles, the user can refer to Sect. S5 in the Supplement. In brief, the aerosol σext, SSA and g profiles were calculated based on the given aerosol PNSD and BCMSD. The DARF can be estimated using the above aerosol optical profiles.
The aerosol optical properties and the corresponding aerosol optical profiles vary with different BCMSD. Then the DARF should be different for different BCMSDs. By estimating the DARF using different aerosol BCMSDs, the influence of BCMSD on the aerosol radiative properties can be studied.
4.1 Measurement results of the BCMSD
The time series of measured PM2.5, aerosol PNSD and BCMSD are shown in Fig. 3. During the observation period, the PM2.5 varied from 0.06 to 220 µg m−3, with a mean value of 71.5±52.56 µg m−3. Three periods of heavy PM2.5 loading were observed: (1) PM2.5 increased from around 100 to 200 µg m−3 and decreased slowly to 1 µg m−3 in the period 21–26 March; (2) the PM2.5 accumulated slowly from 28 to 30 March and dissipated quickly from 30 March to 1 April; (3) the rapid accumulation and dissipation of PM2.5 happened during 2 to 5 April. During the last 5 d, PM2.5 fluctuated between 20 and 120 µg m−3. For each pollution condition, both the aerosol total number concentrations and the aerosol median diameter increased. The aerosol median diameter varied between 31 and 169 nm with a mean value of 78±31 nm.
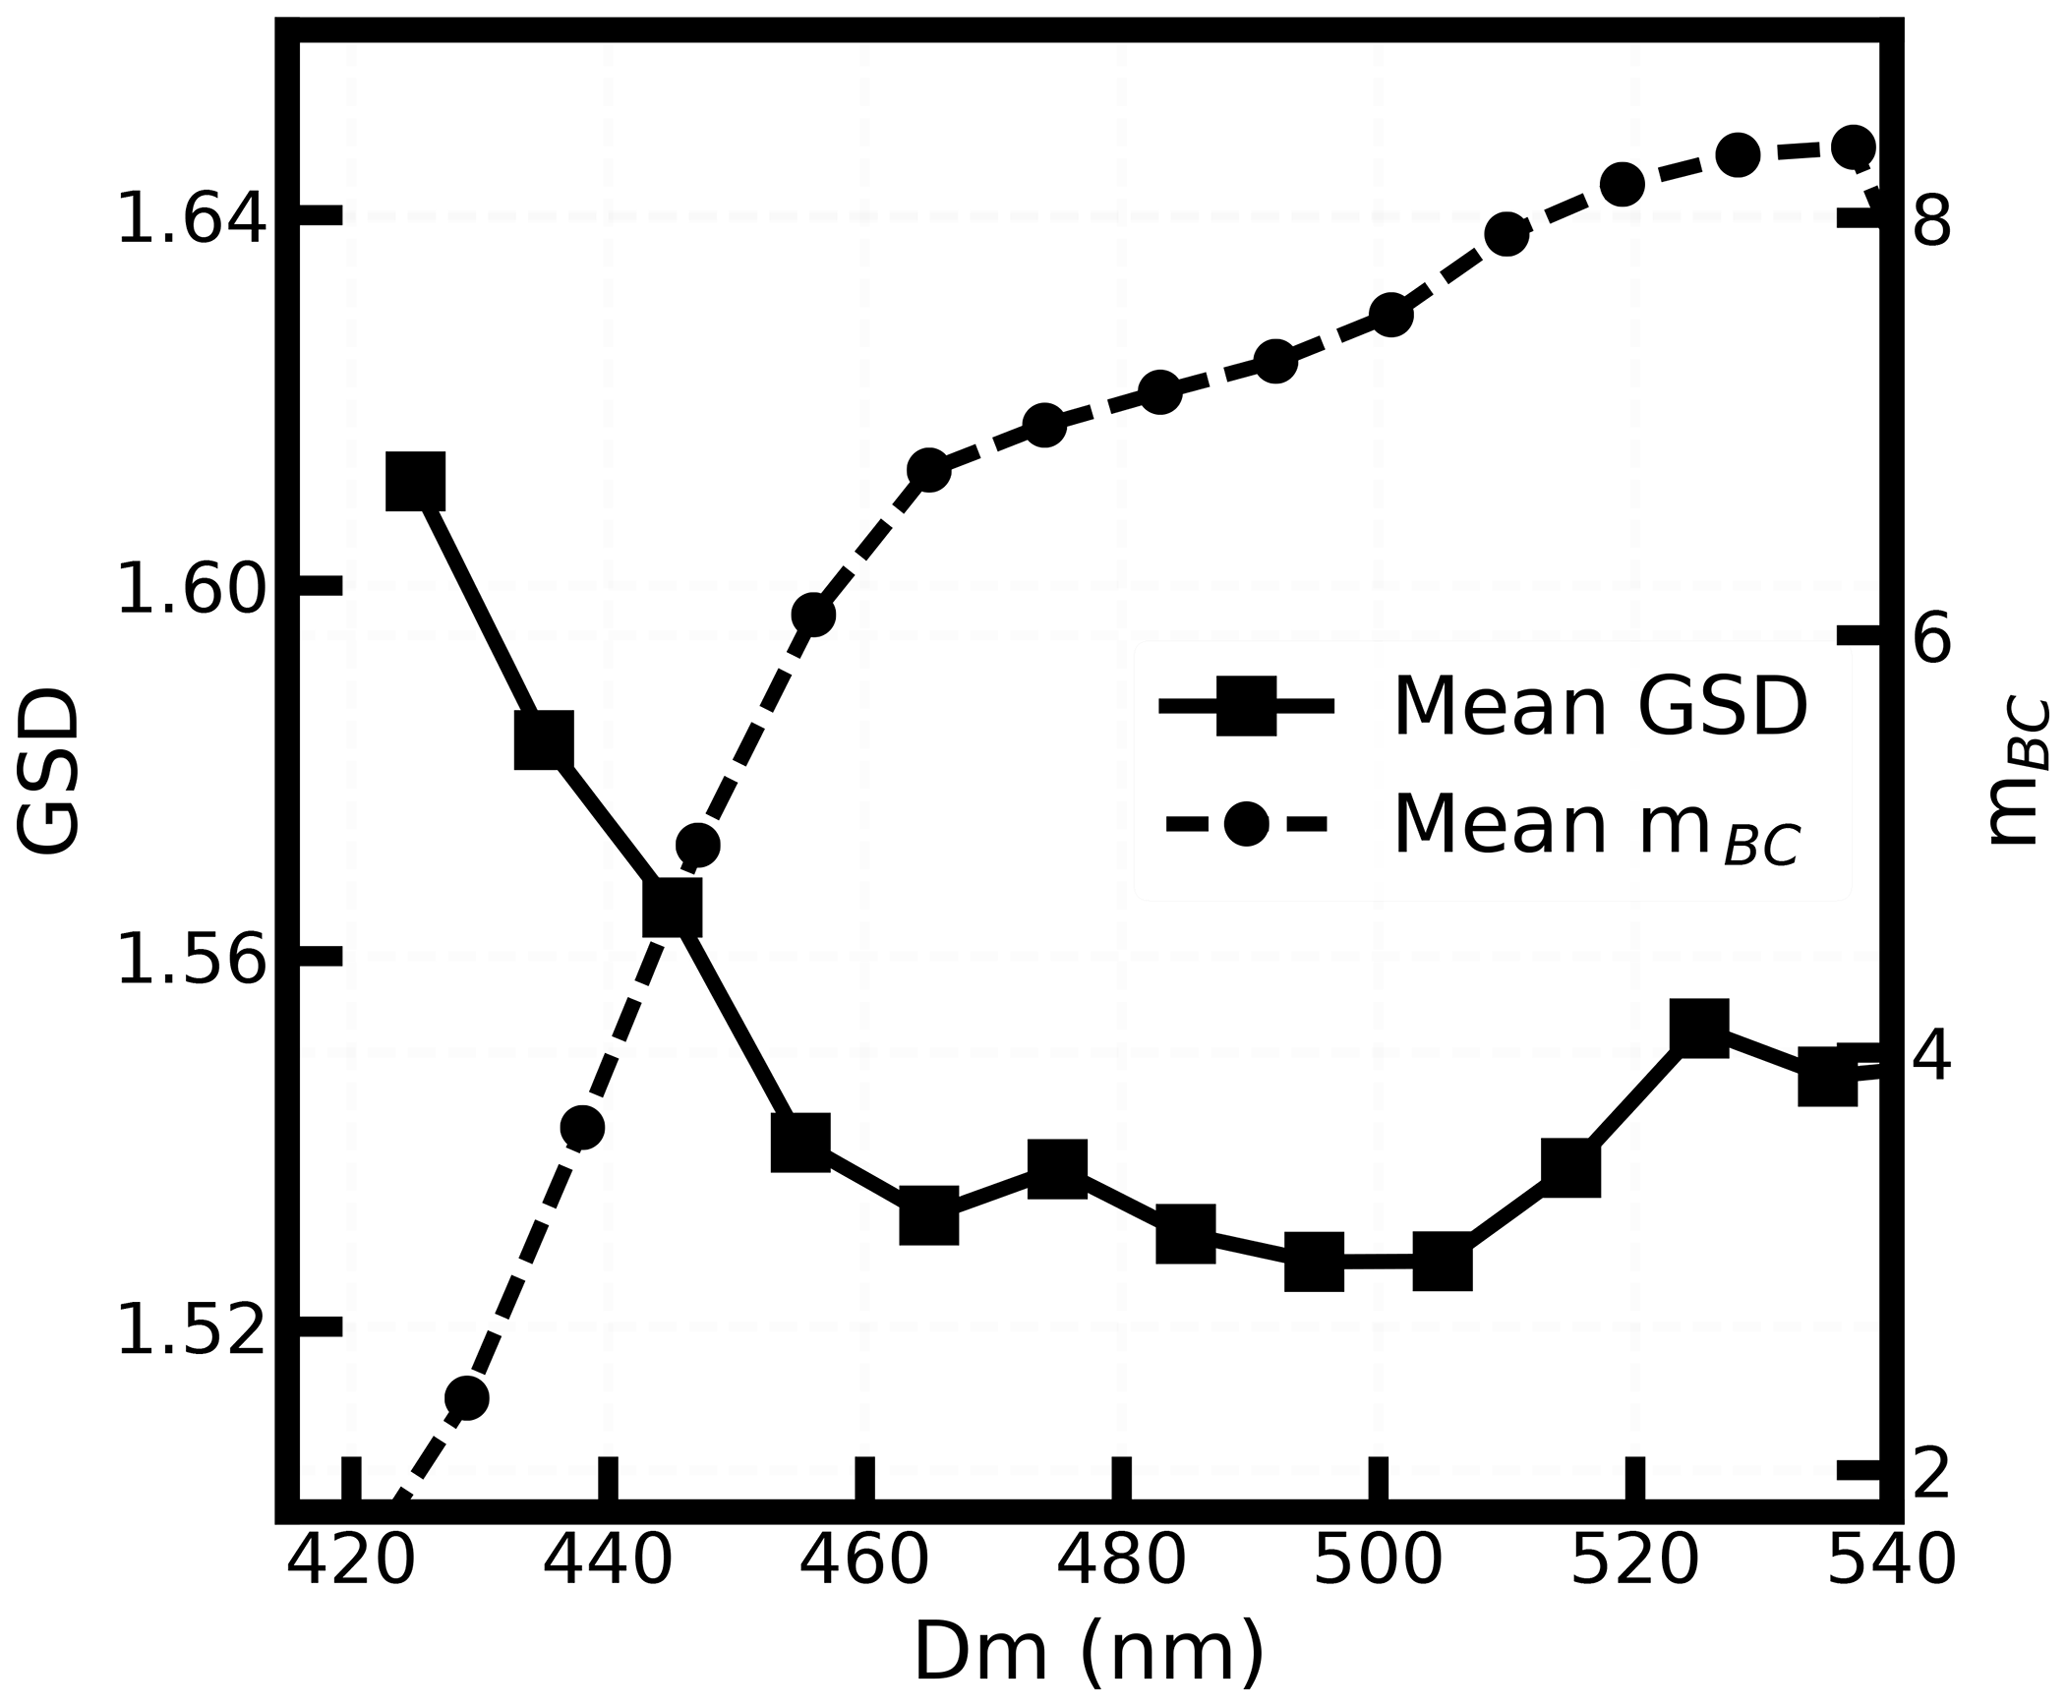
Figure 5The relationship between the Dm and the GSD. The black line with dots shows the mean results of the GSD for different Dm. The black line marked with square symbols shows the variation in mean mBC with the Dm.
Our measurements show that the BCMSD had two modes with the coarser mode ranging between 430 and 580 nm in mobility diameter. Many field measurements have revealed that most of the BC mass locates in the aerodynamic diameter range of 320 and 560 nm using the MOUDI (Hu et al., 2012; Huang and Yu, 2008). When the aerodynamic diameter was transformed into mobility diameter with assumption of an aerosol effective density of 1.3, the measured BC aerodynamic diameter range corresponded to mobility diameter range of 280 and 491 nm. Therefore, the measured size range for coarser mode of BCMSD agreed well with the previous measurement.
The measured aerosol in the field site was representative of the urban aerosol. The BC particles emitted by vehicles contributed significantly to the total aerosol BC mass. These BC particles were rarely coated or thinly coated, and the BC core diameter peaked around 120 nm (Zhang et al., 2017). Therefore, the BCMSD of the finer mode measured in our study corresponded to these uncoated or thinly coated particles.
The total mBC measured by AE33 ranged from 0.1 to 14 µg m−3 with an average of 5.04±2.64 µg m−3. Good consistence was achieved between mBC measured by AE33 and mBC calculated from measured BCMSD as shown in Fig. 3d.
4.2 Evolution of the BCMSD under different polluting conditions
A lognormal distribution was used to fit each mode of the BCMSD by using the least square method as introduced in Sect. 3.2. For each mode, the geometric mean diameter (Dm) and the geometric standard deviation (GSD) of the BCMSD were studied.
During the measurement period, both Dm and GSD of the two modes have changed significantly as shown in Fig. S7. The Dm of the first and second modes varied from 139 to 161 nm and from 420 to 597 nm, respectively. The corresponding mean Dm was 151 and 520 nm. The Dm of the two modes was found to be positively correlated in Fig. S7a. When the pollution was released from the beginning to 27 March, the Dm decreased from 597 to 420 nm and from 160 to 140 nm for the coarser mode and the finer mode, respectively. The BC-containing aerosols tended to be aged and grew larger when the surrounding air was polluted.
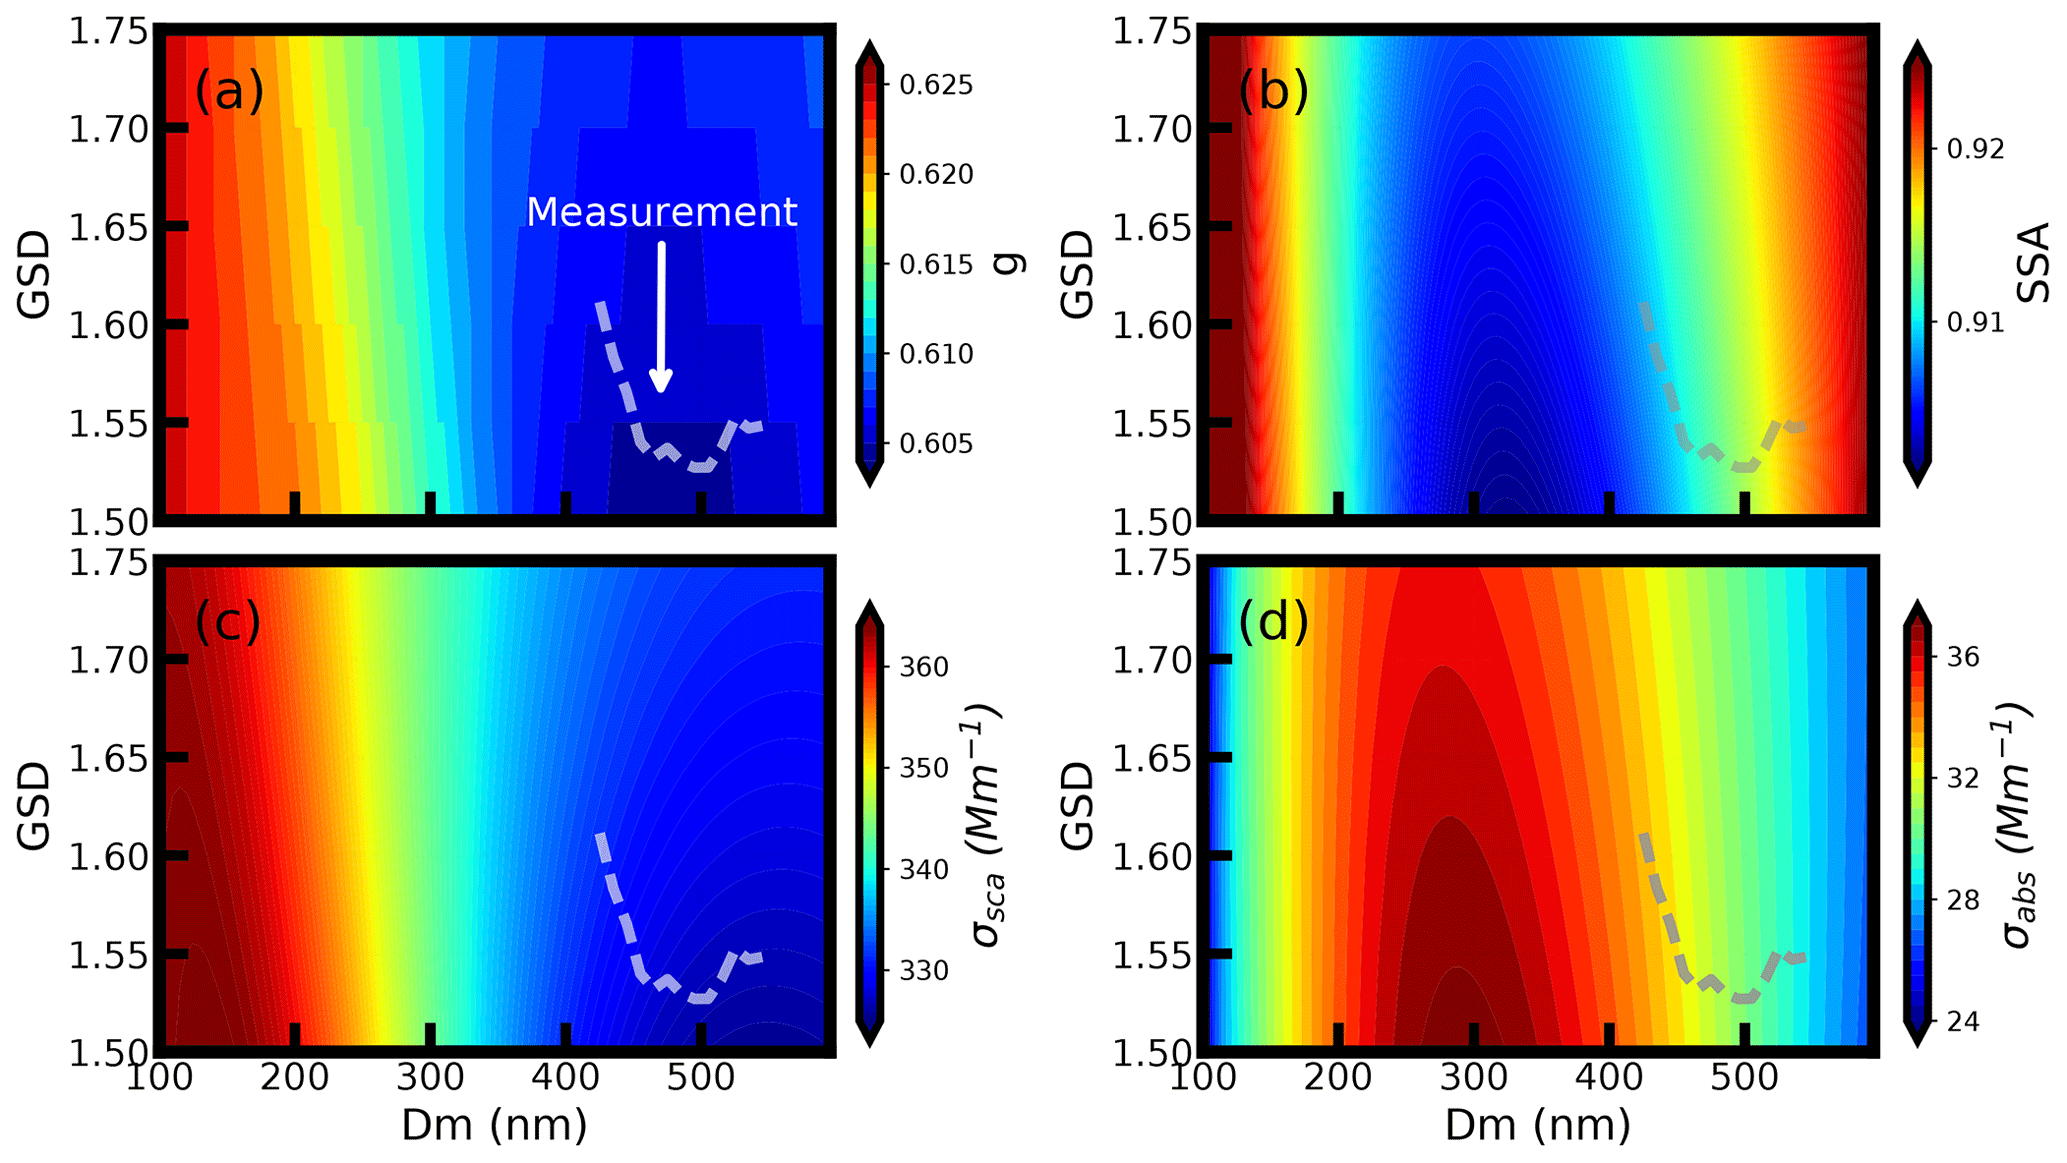
Figure 6Variations of aerosol optics properties using the measured mean aerosol PNSD and mBC under different BCMSD conditions, which are represented by different Dm and GSD values: (a) aerosol asymmetry factor, (b) single scatter albedo, (c) scattering coefficient and (d) extinction coefficient. The dotted gray lines in the figure show the evolution path of the BCMSD according to results of field measurements.
GSD for the coarser mode and the finer mode showed very different properties as shown in Fig. S7b. For the second mode, GSD varied from around 1.49 to 1.68 with a mean value of 1.57. The GSD became decreased with the changing pollution condition, which indicated that BC-containing aerosols tend to accumulate to a small range of diameters during the aging process. This phenomenon was consistent with the fact that larger particles grew relatively slower in diameter because the growth ratio of small aerosol particles is proportional to the negative power of it's diameter. For the first mode, GSD ranged from 1.41 to around 1.86 with a mean value of 1.63. However, the GSD of the finer mode tended to be larger when the surrounding air was cleaner, which might be related to the complex sources of the BC emission. A small amount of freshly-emitted BC particles can have substantial influence on the mass size distribution of the finer mode because the BC concentrations of the finer mode were small, especially under clean conditions. In general, the GSD of the coarser mode was a good indicator of the BC aging process and that of the finer mode could partially reflect the complex sources of the BC fine particles.
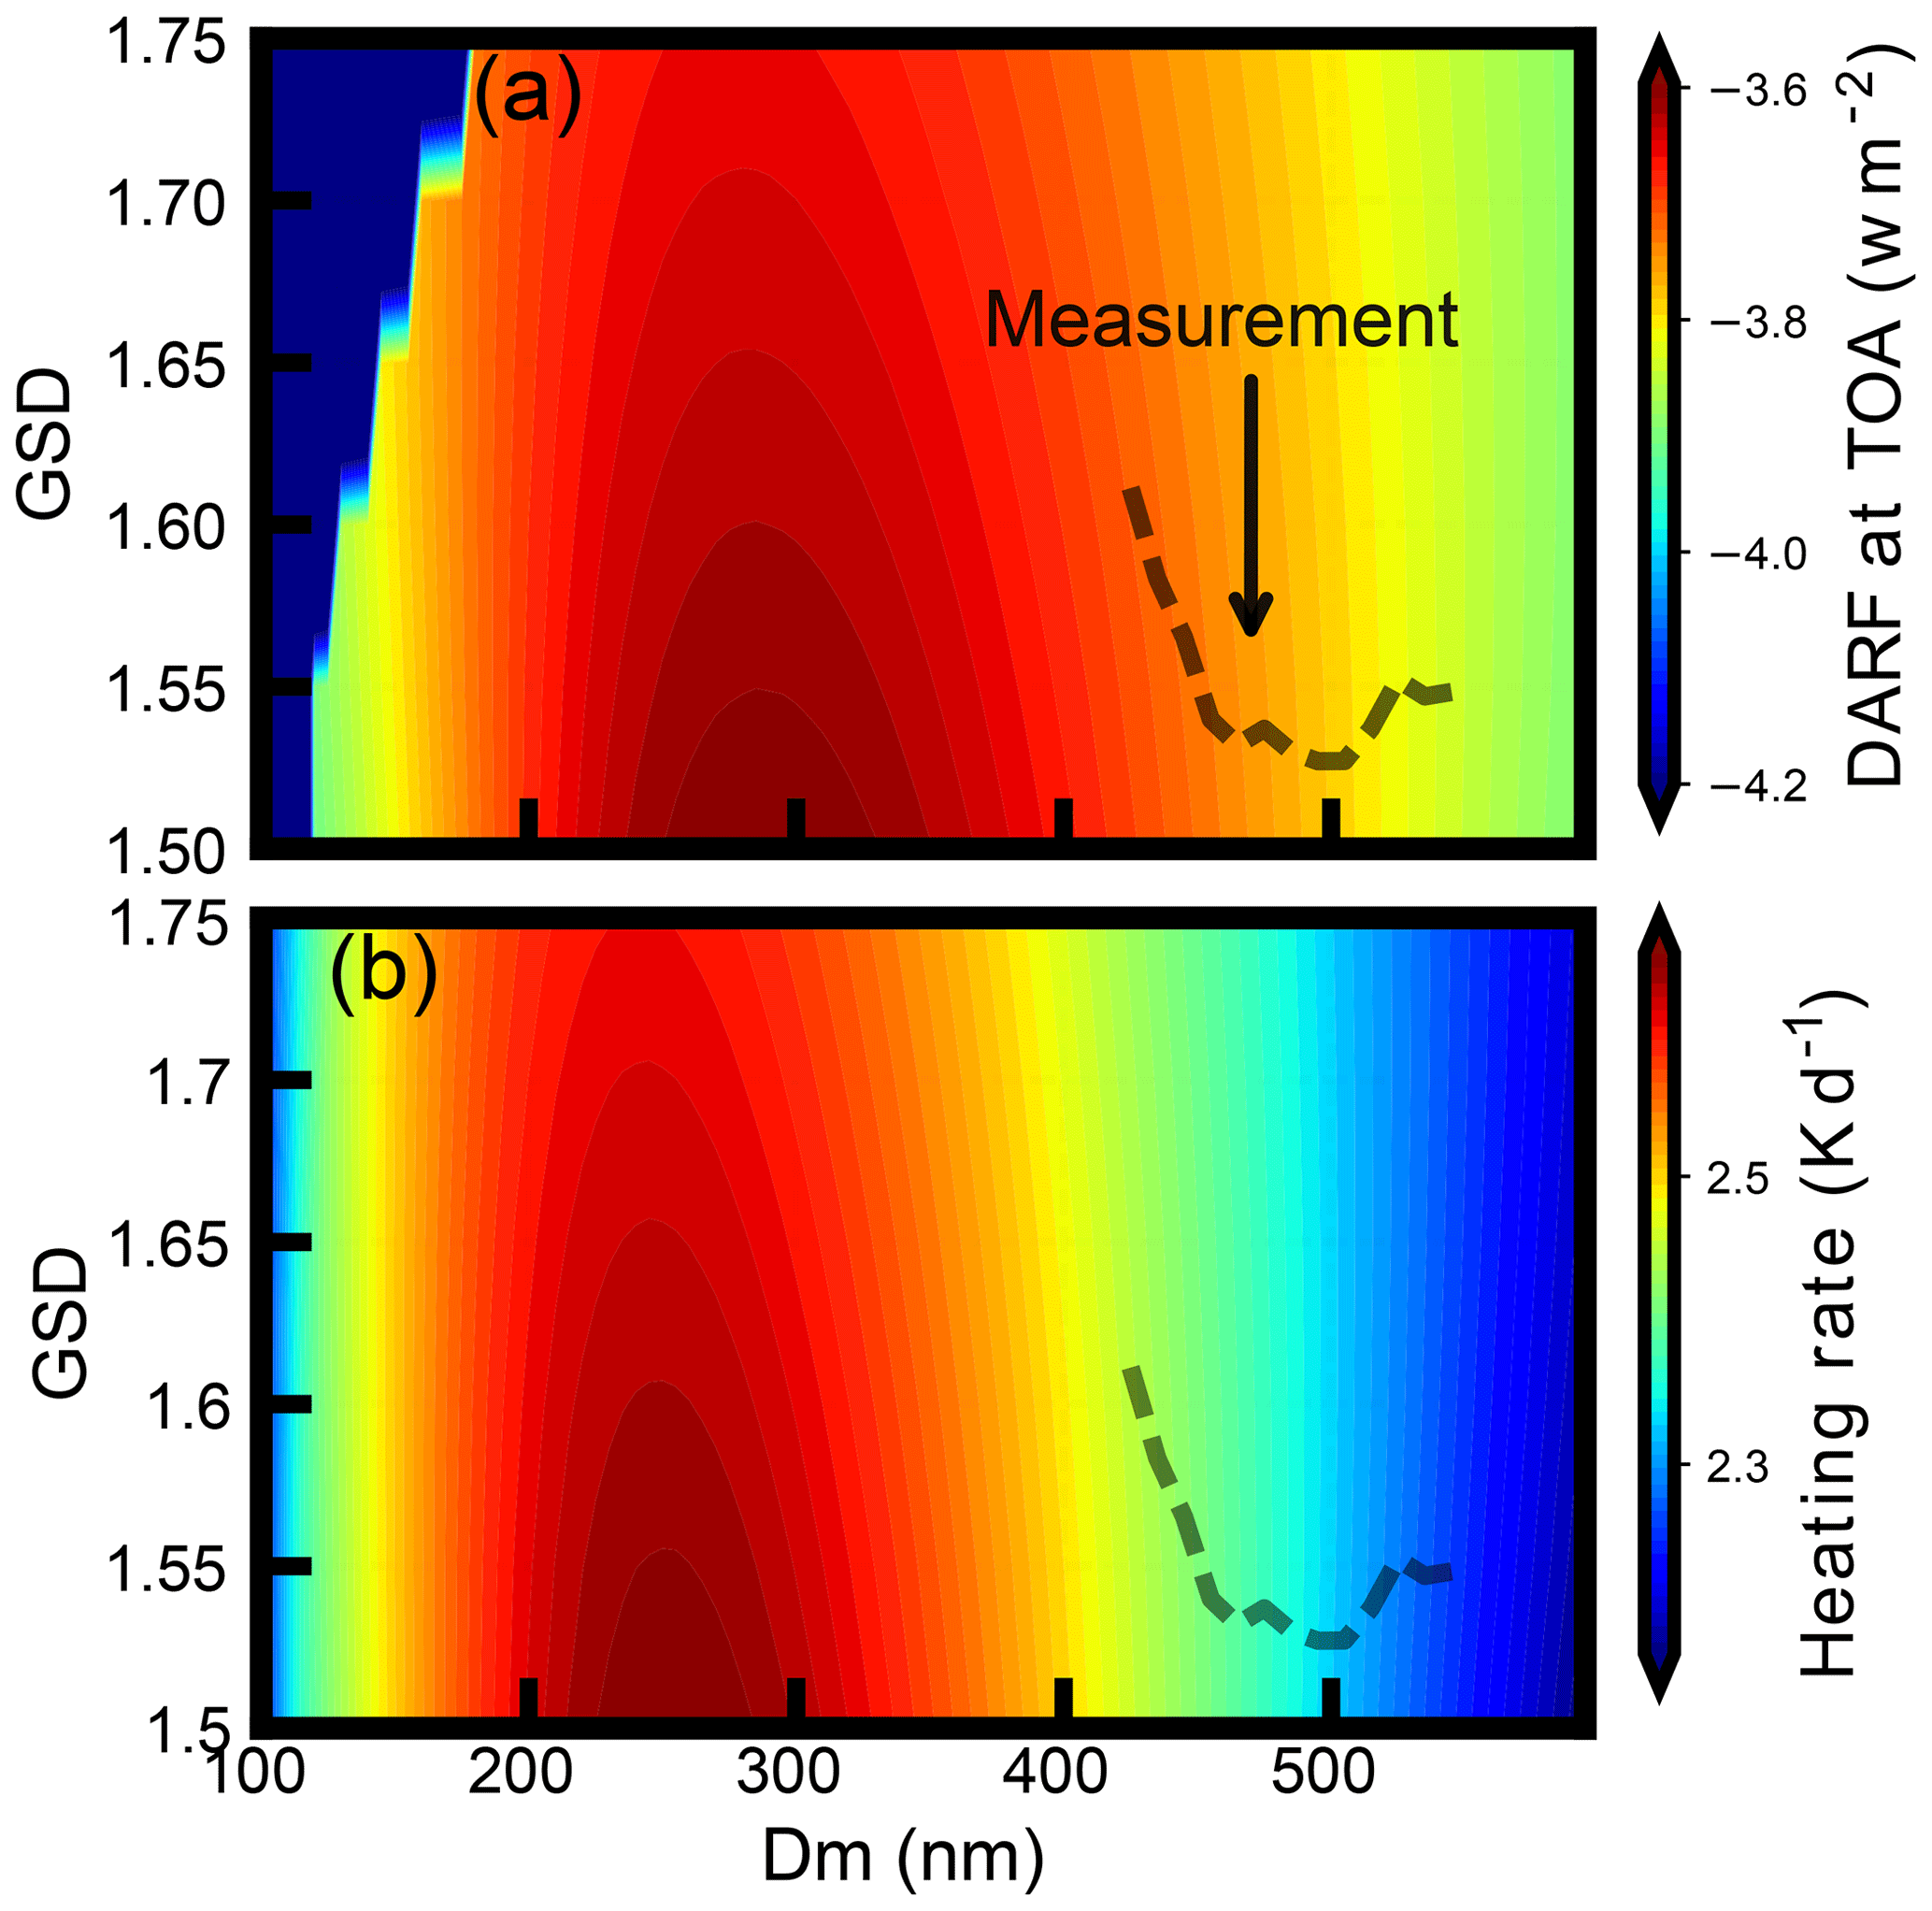
Figure 7Variations in (a) DARF and (b) heating rate under different BCMSD conditions, which are represented by different Dm and GSD values. The dotted black line in the figure shows the evolution path of the BCMSD according to results of field measurements.
The relationship between the Dm and the GSD for the coarser mode was further analyzed by analyzing the distribution of the Dm and GSD. The GSD and Dm had opposite trends as shown in Fig. 5. With the increment of the Dm from 420 to 540 nm, the mean value of GSD decreased from around 1.608 to 1.528, while the mBC increased with the Dm. The statistical relationship between Dm and GSD offered a reasonable representation of the BCMSD under different polluting conditions. In the following work, mean values of the GSD at different Dm were used to for further discussion. The mBC and GSD is positively correlated. The mBC increased from 2.4 to 8.3 µg m−3 when the Dm increased from 420 to 540 nm.
Note that the GSD get slightly increased with the increment of Dm when Dm was larger than 520 nm. This might be caused by the limited diameter range of the BCMSD measuring system, which is from 20 to 680 nm. The multiple charge corrections applied to the BCMSD could influence the BCMSD when Dm of the BCMSD was near the end of the scanned diameter and may lead to significant uncertainties to the BCMSD. The measurement results indicated that cases of measured Dm of BCMSD larger than 520 nm were few, demonstrating that this multiple correction effect influenced little on shape of measured BCMSD in most cases.
4.3 Influence of BCMSD variation on the aerosol optical properties
The aerosol optical parameters using the measured mean aerosol PNSD and mean mBC corresponding to different GSD and Dm values are shown in Fig. 6. In Fig. 6a, the aerosol g varied from 0.603 to 0.627 (variation of 4 %). Recent work by Zhao et al. (2017) showed that the aerosol g value in the North China Plain may vary at a range of 10 % due to the change of aerosol PNSD. Aerosol g was more sensitive to Dm when the geometric mean diameter of the BCMSD was lower than 400 nm. However, when the Dm was larger than 400 nm, the g become sensitive to both the Dm and the GSD of BCMSD. Overall, the g varied a little bit (0.02 to 0.609) under the representative conditions during the measurement period. For the aerosol SSA, it was sensitive to the Dm over the whole range as shown in Fig. 6b. SSA varied between 0.90 and 0.94 under the representative measurement conditions. The σsca had large changes from 325.6 to 364.4 Mm−1. The σsca was quite sensitive to variations in BCMSD when the Dm was larger than 450 nm as shown in Fig. 6c. In addition, variations in σsca relied more on the variations in Dm when Dm was lower than 400 nm. Within the measurement conditions of BCMSD, the σsca varied from 328 to 345 Mm−1. The measured GSD under different Dm went along with the gradient direction of the σsca, which mean that the evolution of BCMSD in the atmosphere influenced substantially on σsca. As for the σabs, it changed from 24.06 to 37.27 Mm−1 and the corresponding mass absorption cross section (MAC) was estimated to be in the range of 5.44 to 8.08 m2 g−1, suggesting that MAC of the BC aerosols should be carefully studied under different BCMSD conditions.
4.4 Influence of BCMSD on the direct aerosol radiative forcing
The estimated DARF values for different GSD and Dm conditions were estimated. When estimating the DARF, the measured mean aerosol PNSD and mean BC mass concentration were used. The results of estimated DARF are shown in Fig. 7a. DARF at the surface varied from −4.3 to −3.59 W m−2 for different BCMSD. Within the measured BCMSD range, the DARF varied from −3.97 to −3.67 W m−2, which corresponding to 8.45 % of variation. The heating rate within the mixed layer was a powerful indicator of the BC particles' absorbing effects, which may help evaluate the development of the boundary layer. The calculated mean heating rate within the mixed layer changed from 2.16 to 2.65 K d−1 for different Dm and GSD, as shown in Fig. 7b. The heating rate with the measured BCMSD range could change from 2.24 to 2.50 K d−1 with a variation of 11.6 %.
Table 1Comparison of the DARF and heating rate values under different BC mixing states and different BCMSD conditions.
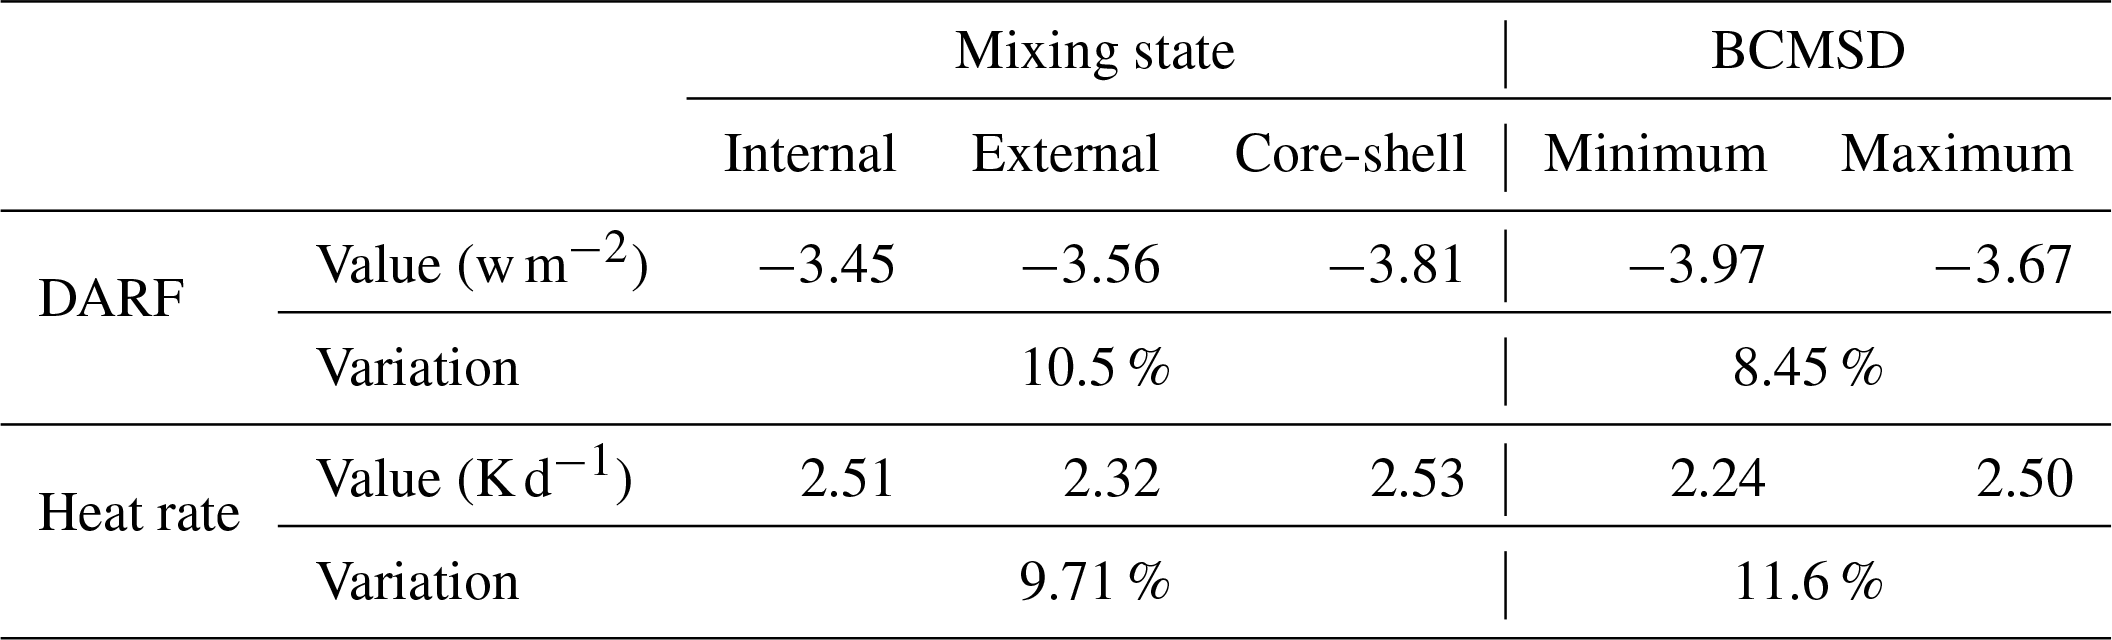
Mixing states of BC play significant roles in calculations of aerosol optical properties and estimations of DARF (Jacobson, 2001). As a comparison, we estimated the DARF under different conditions of BC mixing state: (1) internally mixed, (2) externally mixed and (3) core-shell mixed. Table 1 gives the estimated DARF and mean heating rate within the mixed layer under different mixing state conditions. Results showed that the DARF under different BC mixing state conditions may change by 10.50 %, which shared the same magnitude with 8.45 % variation in DARF caused by BCMSD variations. In addition, the heating rate was estimated to vary by 9.71 %. These results highlighted that the BCMSD plays significant roles in variations of aerosol optical properties and estimations of DARF as well as the air heating rate caused by the existence of BC particles. It was recommended that a real-time measured BCMSD be used when estimating the aerosol DARF instead of a constant one. The BCMSD is as important as that of the BC mixing states.
Knowledge of the BC microphysical properties especially the size-dependent information can help reduce the uncertainties when estimating the aerosol radiative effects. BCMSD is an important quantity in its own right, being directly and indirectly applicable to the determination of the sources, aging processes and mixing states of BC aerosols. In this study, the characteristics of BCMSD were studied from the field measurement results by using our own developed measurement algorithm.
The BCMSD measurement system was developed and validated based on the works of Ning et al. (2013) by using a differential mobility analyzer (DMA) in tandem with an Aethalometer (AE). When deriving the BCMSD, a comprehensive multiple charging correction algorithm was proposed and implied. This algorithm was validated by closure study between the measured total mBC from AE33 and the mBC integrated from the measured BCMSD using the datasets from field measurements. Results showed that the multiple charging corrections could significantly change the shapes and magnitudes of the raw measured BCMSD. Accurate BCMSD characteristics could be obtained by our proposed method in this paper.
The developed measurement system was employed in a field campaign in the North China Plain from 21 March to 9 April 2017. The BCMSD was found to have two quasi-lognormal modes with peaks at around 150 and 500 nm. These two modes were consistent with the previous measurement results by MOUDI (Wang et al., 2015; Hu et al., 2012). The BC mass concentrations for the coarser-mode peaks were about twice that of the finer mode.
The characteristics of the BCMSD were studied by fitting the shape of BCMSD with a binormal distribution. The relationships between the fitted Dm and GSD were statistically studied. During the aging process, the opposite trends for Dm and GSD were found for the coarser mode. This is the first time that the coarser mode of the BCMSD was synthetically studied. The BCMSD of the coarser mode varied significantly under different pollution conditions with peak diameters changing between 430 and 580 nm. However, the relationship between Dm and GSD for the finer-mode BC aerosols was more complex due to the complex sources.
When the BCMSDs changed with the polluting conditions, the corresponding aerosol optical properties changed significantly. Sensitivity studies found that the aerosol g varies from 0.603 to 0.627 due to the variations in BCMSD. Aerosol g was more sensitive to Dm when the geometric mean diameter of the BCMSD is in the range of 300 and 370 nm. The SSA changed from 0.90 to 0.94. The σsca experienced a significant change with variation in BCMSD from 325.6 to 364.4 Mm−1 and the σabs changed in the range between 24.064 and 37.27 Mm−1. The corresponding BC MAC was calculated to be in the range between 5.44 and 8.08 m2 g−1.
The variations in DARF were estimated to be due to the variations in the BCMSD by using the SBDART model. Results showed that the DARF can vary by about 8.45 % for different BCMSDs and the heating rate for different measured BCMSD conditions could change from 2.24 to 2.50 K d−1, corresponding to a variation of 11.6 %. At the same time, the variations in DARF due to the variations in the BC mixing state was estimated to be 10.5 % and that of the heating rate was 8.45 %. Thus, the variations in the BCMSDs may have significant influence on the aerosol radiative budget, and an accurate measurement of BCMSD is very necessary.
The data used in this study are available by requesting them from the authors.
The supplement related to this article is available online at: https://doi.org/10.5194/acp-19-13175-2019-supplement.
GZ, CZ, JT and YK designed and conducted the experiments; CS, YY, CZ and GZ discussed the results.
The authors declare that they have no conflict of interest.
This research has been supported by the National Key R&D Program of China (grant no. 2016YFA0602001) and the National Natural Science Foundation of China (grant no. 41590872).
This paper was edited by Veli-Matti Kerminen and reviewed by two anonymous referees.
Babu, S. S., Sreekanth, V., Moorthy, K. K., Mohan, M., Kirankumar, N. V. P., Subrahamanyam, D. B., Gogoi, M. M., Kompalli, S. K., Beegum, N., Chaubey, J. P., Kumar, V. H. A., and Manchandab, R. K.: Vertical profiles of aerosol black carbon in the atmospheric boundary layer over a tropical coastal station: Perturbations during an annular solar eclipse, Atmos. Res., 99, 471–478, https://doi.org/10.1016/j.atmosres.2010.11.019, 2011.
Bau, S., Bemer, D., Grippari, F., Appert-Collin, J.-C., and Thomas, D.: Determining the effective density of airborne nanoparticles using multiple charging correction in a tandem DMA/ELPI setup, J. Nanopart. Res., 16, 2629–2642, https://doi.org/10.1007/s11051-014-2629-2, 2014.
Bohren, C. F. and Huffman, D. R.: Absorption and Scattering by a Sphere, in: Absorption and Scattering of Light by Small Particles, Wiley-VCH Verlag GmbH, 82–129, 2007.
Bond, T. C., Doherty, S. J., Fahey, D. W., Forster, P. M., Berntsen, T., DeAngelo, B. J., Flanner, M. G., Ghan, S., Karcher, B., Koch, D., Kinne, S., Kondo, Y., Quinn, P. K., Sarofim, M. C., Schultz, M. G., Schulz, M., Venkataraman, C., Zhang, H., Zhang, S., Bellouin, N., Guttikunda, S. K., Hopke, P. K., Jacobson, M. Z., Kaiser, J. W., Klimont, Z., Lohmann, U., Schwarz, J. P., Shindell, D., Storelvmo, T., Warren, S. G., and Zender, C. S.: Bounding the role of black carbon in the climate system: A scientific assessment, J. Geophys. Res.-Atmos., 118, 5380–5552, https://doi.org/10.1002/jgrd.50171, 2013.
Cheng, Y. F., Su, H., Rose, D., Gunthe, S. S., Berghof, M., Wehner, B., Achtert, P., Nowak, A., Takegawa, N., Kondo, Y., Shiraiwa, M., Gong, Y. G., Shao, M., Hu, M., Zhu, T., Zhang, Y. H., Carmichael, G. R., Wiedensohler, A., Andreae, M. O., and Pöschl, U.: Size-resolved measurement of the mixing state of soot in the megacity Beijing, China: diurnal cycle, aging and parameterization, Atmos. Chem. Phys., 12, 4477–4491, https://doi.org/10.5194/acp-12-4477-2012, 2012.
Cheng, Y. H. and Yang, L. S.: Characteristics of Ambient Black Carbon Mass and Size-Resolved Particle Number Concentrations during Corn Straw Open-Field Burning Episode Observations at a Rural Site in Southern Taiwan, Int. J. Environ. Res. Public Health, 13, https://doi.org/10.3390/ijerph13070688, 2016.
Cheng, Y. H., Liao, C. W., Liu, Z. S., Tsai, C. J., and Hsi, H. C.: A size-segregation method for monitoring the diurnal characteristics of atmospheric black carbon size distribution at urban traffic sites, Atmos. Environ., 90, 78–86, 2014.
China, S., Mazzoleni, C., Gorkowski, K., Aiken, A. C., and Dubey, M. K.: Morphology and mixing state of individual freshly emitted wildfire carbonaceous particles, Nat. Commun., 4, 2122, https://doi.org/10.1038/ncomms3122, 2013.
Deng, Z. Z., Zhao, C. S., Ma, N., Liu, P. F., Ran, L., Xu, W. Y., Chen, J., Liang, Z., Liang, S., Huang, M. Y., Ma, X. C., Zhang, Q., Quan, J. N., Yan, P., Henning, S., Mildenberger, K., Sommerhage, E., Schäfer, M., Stratmann, F., and Wiedensohler, A.: Size-resolved and bulk activation properties of aerosols in the North China Plain, Atmos. Chem. Phys., 11, 3835–3846, https://doi.org/10.5194/acp-11-3835-2011, 2011.
Drinovec, L., Močnik, G., Zotter, P., Prévôt, A. S. H., Ruckstuhl, C., Coz, E., Rupakheti, M., Sciare, J., Müller, T., Wiedensohler, A., and Hansen, A. D. A.: The ”dual-spot” Aethalometer: an improved measurement of aerosol black carbon with real-time loading compensation, Atmos. Meas. Tech., 8, 1965–1979, https://doi.org/10.5194/amt-8-1965-2015, 2015.
Ferrero, L., Mocnik, G., Ferrini, B. S., Perrone, M. G., Sangiorgi, G., and Bolzacchini, E.: Vertical profiles of aerosol absorption coefficient from micro-Aethalometer data and Mie calculation over Milan, Sci. Total Environ., 409, 2824–2837, https://doi.org/10.1016/j.scitotenv.2011.04.022, 2011.
Gao, R. S., Schwarz, J. P., Kelly, K. K., Fahey, D. W., Watts, L. A., Thompson, T. L., Spackman, J. R., Slowik, J. G., Cross, E. S., Han, J. H., Davidovits, P., Onasch, T. B., and Worsnop, D. R.: A Novel Method for Estimating Light-Scattering Properties of Soot Aerosols Using a Modified Single-Particle Soot Photometer, Aerosol Sci. Technol., 41, 125–135, https://doi.org/10.1080/02786820601118398, 2007.
Gong, X., Zhang, C., Chen, H., Nizkorodov, S. A., Chen, J., and Yang, X.: Size distribution and mixing state of black carbon particles during a heavy air pollution episode in Shanghai, Atmos. Chem. Phys., 16, 5399–5411, https://doi.org/10.5194/acp-16-5399-2016, 2016.
Guo, Y.: Characteristics of size-segregated carbonaceous aerosols in the Beijing–Tianjin–Hebei region, Environ. Sci. Pollut. Res., 23, 13918–13930, https://doi.org/10.1007/s11356-016-6538-z, 2016.
Hagen, D. E. and Alofs, D. J.: Linear Inversion Method to Obtain Aerosol Size Distributions from Measurements with a Differential Mobility Analyzer, Aerosol Sci. Technol., 2, 465–475, https://doi.org/10.1080/02786828308958650, 2007.
Hansen, A. D. A., Rosen, H., and Novakov, T.: The aethalometer – An instrument for the real-time measurement of optical absorption by aerosol particles, Sci. Total Environ., 36, 191–196, https://doi.org/10.1016/0048-9697(84)90265-1, 1984.
He, M. and Dhaniyala, S.: A multiple charging correction algorithm for scanning electrical mobility spectrometer data, J. Aerosol Sci., 61, 13–26, https://doi.org/10.1016/j.jaerosci.2013.03.007, 2013.
He, M., Dhaniyala, S., and Wagner, M.: Aerosol Filtration with Mobility-Classified Particles: Role of Multiply Charged Particles in Skewing Penetration Measurements, Aerosol Sci. Technol., 49, 704–715, https://doi.org/10.1080/02786826.2015.1062467, 2015.
Hu, M., Peng, J., Sun, K., Yue, D., Guo, S., Wiedensohler, A., and Wu, Z.: Estimation of size-resolved ambient particle density based on the measurement of aerosol number, mass, and chemical size distributions in the winter in Beijing, Environ. Sci. Technol., 46, 9941–9947, https://doi.org/10.1021/es204073t, 2012.
Huang, X.-F., Sun, T.-L., Zeng, L.-W., Yu, G.-H., and Luan, S.-J.: Black carbon aerosol characterization in a coastal city in South China using a single particle soot photometer, Atmos. Environ., 51, 21–28, https://doi.org/10.1016/j.atmosenv.2012.01.056, 2012.
Huang, X.-F. and Yu, J. Z.: Size distributions of elemental carbon in the atmosphere of a coastal urban area in South China: characteristics, evolution processes, and implications for the mixing state, Atmos. Chem. Phys., 8, 5843–5853, https://doi.org/10.5194/acp-8-5843-2008, 2008.
Jacobson, M. Z.: Strong radiative heating due to the mixing state of black carbon in atmospheric aerosols, Nature, 409, 695–697, 2001.
Janssen, N. A. H., Hoek, G., Simic-Lawson, M., Fischer, P., van Bree, L., ten Brink, H., Keuken, M., Atkinson, R. W., Anderson, H. R., Brunekreef, B., and Cassee, F. R.: Black Carbon as an Additional Indicator of the Adverse Health Effects of Airborne Particles Compared with PM10 and PM2.5, Environ. Health Persp., 119, 1691–1699, https://doi.org/10.1289/ehp.1003369, 2011.
Knutson, E. O. and Whitby, K. T.: Aerosol classification by electric mobility: apparatus, theory, and applications, Jo. Aerosol Sci., 6, 443–451, 1975.
Koch, D. and Del Genio, A. D.: Black carbon semi-direct effects on cloud cover: review and synthesis, Atmos. Chem. Phys., 10, 7685–7696, https://doi.org/10.5194/acp-10-7685-2010, 2010.
Koch, D., Schulz, M., Kinne, S., McNaughton, C., Spackman, J. R., Balkanski, Y., Bauer, S., Berntsen, T., Bond, T. C., Boucher, O., Chin, M., Clarke, A., De Luca, N., Dentener, F., Diehl, T., Dubovik, O., Easter, R., Fahey, D. W., Feichter, J., Fillmore, D., Freitag, S., Ghan, S., Ginoux, P., Gong, S., Horowitz, L., Iversen, T., Kirkevåg, A., Klimont, Z., Kondo, Y., Krol, M., Liu, X., Miller, R., Montanaro, V., Moteki, N., Myhre, G., Penner, J. E., Perlwitz, J., Pitari, G., Reddy, S., Sahu, L., Sakamoto, H., Schuster, G., Schwarz, J. P., Seland, Ø., Stier, P., Takegawa, N., Takemura, T., Textor, C., van Aardenne, J. A., and Zhao, Y.: Evaluation of black carbon estimations in global aerosol models, Atmos. Chem. Phys., 9, 9001–9026, https://doi.org/10.5194/acp-9-9001-2009, 2009.
Kuang, Y., Zhao, C. S., Tao, J. C., and Ma, N.: Diurnal variations of aerosol optical properties in the North China Plain and their influences on the estimates of direct aerosol radiative effect, Atmos. Chem. Phys., 15, 5761–5772, https://doi.org/10.5194/acp-15-5761-2015, 2015.
Kuang, Y., Zhao, C. S., Tao, J. C., Bian, Y. X., and Ma, N.: Impact of aerosol hygroscopic growth on the direct aerosol radiative effect in summer on North China Plain, Atmos. Environ., 147, 224–233, 2016.
Lippmann, M. and Albert, R. E.: The Effect of Particle Size on the Regional Deposition of Inhaled Aerosols in the Human Respiratory Tract, Am. Indust. Hyg. Assoc. J., 30, 257–275, https://doi.org/10.1080/00028896909343120, 1969.
Liu, D., Whitehead, J., Alfarra, M. R., Reyes-Villegas, E., Spracklen, Dominick, V., Reddington, Carly, L., Kong, S., Williams, P. I., Ting, Y.-C., Haslett, S., Taylor, J. W., Flynn, M. J., Morgan, W. T., McFiggans, G., Coe, H., and Allan, J. D.: Black-carbon absorption enhancement in the atmosphere determined by particle mixing state, Nat. Geosci., 10, 184–188, https://doi.org/10.1038/ngeo2901, 2017.
Ma, N., Zhao, C. S., Müller, T., Cheng, Y. F., Liu, P. F., Deng, Z. Z., Xu, W. Y., Ran, L., Nekat, B., van Pinxteren, D., Gnauk, T., Müller, K., Herrmann, H., Yan, P., Zhou, X. J., and Wiedensohler, A.: A new method to determine the mixing state of light absorbing carbonaceous using the measured aerosol optical properties and number size distributions, Atmos. Chem. Phys., 12, 2381–2397, https://doi.org/10.5194/acp-12-2381-2012, 2012.
Matsui, H., Hamilton, D. S., and Mahowald, N. M.: Black carbon radiative effects highly sensitive to emitted particle size when resolving mixing-state diversity, Nat. Commun., 9, 3446, https://doi.org/10.1038/s41467-018-05635-1, 2018.
Menon, S., Hansen, J., Nazarenko, L., and Luo, Y.: Climate effects of black carbon aerosols in China and India, Science, 297, 2250–2253, https://doi.org/10.1126/science.1075159, 2002.
Moffet, R. C., O'Brien, R. E., Alpert, P. A., Kelly, S. T., Pham, D. Q., Gilles, M. K., Knopf, D. A., and Laskin, A.: Morphology and mixing of black carbon particles collected in central California during the CARES field study, Atmos. Chem. Phys., 16, 14515–14525, https://doi.org/10.5194/acp-16-14515-2016, 2016.
Moteki, N. and Kondo, Y.: Dependence of Laser-Induced Incandescence on Physical Properties of Black Carbon Aerosols: Measurements and Theoretical Interpretation, Aerosol Sci. Technol., 44, 663–675, https://doi.org/10.1080/02786826.2010.484450, 2010.
Nichols, J. L., Owens, E. O., Dutton, S. J., and Luben, T. J.: Systematic review of the effects of black carbon on cardiovascular disease among individuals with pre-existing disease, Int. J. Publ. Health, 58, 707–724, 2013.
Ning, Z., Chan, K. L., Wong, K. C., Westerdahl, D., Moènik, G., Zhou, J. H., and Cheung, C. S.: Black carbon mass size distributions of diesel exhaust and urban aerosols measured using differential mobility analyzer in tandem with Aethalometer, Atmos. Environ., 80, 31–40, https://doi.org/10.1016/j.atmosenv.2013.07.037, 2013.
Peng, J., Hu, M., Guo, S., Du, Z., Zheng, J., Shang, D., Levy Zamora, M., Zeng, L., Shao, M., Wu, Y.-S., Zheng, J., Wang, Y., Glen, C. R., Collins, D. R., Molina, M. J., and Zhang, R.: Markedly enhanced absorption and direct radiative forcing of black carbon under polluted urban environments, P. Natl. Acad. Sci. USA, 113, 201602310, https://doi.org/10.1073/pnas.1602310113, 2016.
Peng, J., Hu, M., Guo, S., Du, Z., Shang, D., Zheng, J., Zheng, J., Zeng, L., Shao, M., Wu, Y., Collins, D., and Zhang, R.: Ageing and hygroscopicity variation of black carbon particles in Beijing measured by a quasi-atmospheric aerosol evolution study (QUALITY) chamber, Atmos. Chem. Phys., 17, 10333–10348, https://doi.org/10.5194/acp-17-10333-2017, 2017.
Raatikainen, T., Brus, D., Hooda, R. K., Hyvärinen, A.-P., Asmi, E., Sharma, V. P., Arola, A., and Lihavainen, H.: Size-selected black carbon mass distributions and mixing state in polluted and clean environments of northern India, Atmos. Chem. Phys., 17, 371–383, https://doi.org/10.5194/acp-17-371-2017, 2017.
Ramachandran, S. and Rajesh, T. A.: Black carbon aerosol mass concentrations over Ahmedabad, an urban location in western India: Comparison with urban sites in Asia, Europe, Canada, and the United States, J. Geophys. Res.-Atmos., 112, D06211, https://doi.org/10.1029/2006jd007488, 2007.
Ramanathan, V. and Carmichael, G.: Global and regional climate changes due to black carbon, Nat. Geosci., 1, 221–227, doi10.1038/ngeo156, 2008.
Ran, L., Deng, Z., Xu, X., Yan, P., Lin, W., Wang, Y., Tian, P., Wang, P., Pan, W., and Lu, D.: Vertical profiles of black carbon measured by a micro-aethalometer in summer in the North China Plain, Atmos. Chem. Phys., 16, 10441–10454, https://doi.org/10.5194/acp-16-10441-2016, 2016a.
Ran, L., Deng, Z. Z., Wang, P. C., and Xia, X. A.: Black carbon and wavelength-dependent aerosol absorption in the North China Plain based on two-year aethalometer measurements, Atmos. Environ., 142, 132–144, https://doi.org/10.1016/j.atmosenv.2016.07.014, 2016b.
Reddington, C. L., McMeeking, G., Mann, G. W., Coe, H., Frontoso, M. G., Liu, D., Flynn, M., Spracklen, D. V., and Carslaw, K. S.: The mass and number size distributions of black carbon aerosol over Europe, Atmos. Chem. Phys., 13, 4917–4939, https://doi.org/10.5194/acp-13-4917-2013, 2013.
Ricchiazzi, P., Yang, S., Gautier, C., and Sowle, D.: SBDART: A Research and Teaching Software Tool for Plane-Parallel Radiative Transfer in the Earth's Atmosphere, B. Am. Meteor. Soc., 79, 2101–2114, https://doi.org/10.1175/1520-0477(1998)079<2101:sarats>2.0.co;2, 1998.
Roberts, G. C., Ramana, M. V., Corrigan, C., Kim, D., and Ramanathan, V.: Simultaneous observations of aerosol-cloud-albedo interactions with three stacked unmanned aerial vehicles, P. Natl. Acad. Sci. USA, 105, 7370–7375, https://doi.org/10.1073/pnas.0710308105, 2008.
Schwarz, J. P., Gao, R. S., Fahey, D. W., Thomson, D. S., Watts, L. A., Wilson, J. C., Reeves, J. M., Darbeheshti, M., Baumgardner, D. G., Kok, G. L., Chung, S. H., Schulz, M., Hendricks, J., Lauer, A., Kärcher, B., Slowik, J. G., Rosenlof, K. H., Thompson, T. L., Langford, A. O., Loewenstein, M., and Aikin, K. C.: Single-particle measurements of midlatitude black carbon and light-scattering aerosols from the boundary layer to the lower stratosphere, J. Geophys. Res., 111, https://doi.org/10.1029/2006jd007076, 2006.
Singh, S., Fiddler, M. N., and Bililign, S.: Measurement of size-dependent single scattering albedo of fresh biomass burning aerosols using the extinction-minus-scattering technique with a combination of cavity ring-down spectroscopy and nephelometry, Atmos. Chem. Phys., 16, 13491–13507, https://doi.org/10.5194/acp-16-13491-2016, 2016.
Song, S., Wu, Y., Xu, J., Ohara, T., Hasegawa, S., Li, J., Yang, L., and Hao, J.: Black carbon at a roadside site in Beijing: Temporal variations and relationships with carbon monoxide and particle number size distribution, Atmos. Environ., 77, 213–221, https://doi.org/10.1016/j.atmosenv.2013.04.055, 2013.
Stabile, L., Fuoco, F. C., and Buonanno, G.: Characteristics of particles and black carbon emitted by combustion of incenses, candles and anti-mosquito products, Build. Environ., 56, 184–191, https://doi.org/10.1016/j.buildenv.2012.03.005, 2012.
Stevens, B. and Feingold, G.: Untangling aerosol effects on clouds and precipitation in a buffered system, Nature, 461, 607–613, https://doi.org/10.1038/nature08281, 2009.
Tigges, L., Wiedensohler, A., Weinhold, K., Gandhi, J., and Schmid, H. J.: Bipolar charge distribution of a soft X-ray diffusion charger, J. Aerosol Sci., 90, 77–86, https://doi.org/10.1016/j.jaerosci.2015.07.002, 2015.
Turner, M. D., Henze, D. K., Hakami, A., Zhao, S. L., Resler, J., Carmichael, G. R., Stanier, C. O., Baek, J., Sandu, A., Russell, A. G., Nenes, A., Jeong, G. R., Capps, S. L., Percell, P. B., Pinder, R. W., Napelenok, S. L., Bash, J. O., and Chai, T. F.: Differences Between Magnitudes and Health Impacts of BC Emissions Across the United States Using 12 km Scale Seasonal Source Apportionment, Environ. Sci. Technol., 49, 4362–4371, https://doi.org/10.1021/es505968b, 2015.
Venkataraman, C. and Friedlander, S. K.: Size distributions of polycyclic aromatic hydrocarbons and elemental carbon, 2, Ambient measurements and effects of atmospheric processes, Environ. Sci. Technol., 28, 563, https://doi.org/10.1021/es00053a006, 1994.
Virkkula, A., Makela, T., Hillamo, R., Yli-Tuomi, T., Hirsikko, A., Hameri, K., and Koponen, I. K.: A simple procedure for correcting loading effects of aethalometer data, J. Air Waste Manag. Assoc., 57, 1214–1222, https://doi.org/10.3155/1047-3289.57.10.1214, 2007.
Virkkula, A., Chi, X., Ding, A., Shen, Y., Nie, W., Qi, X., Zheng, L., Huang, X., Xie, Y., Wang, J., Petäjä, T., and Kulmala, M.: On the interpretation of the loading correction of the aethalometer, Atmos. Meas. Tech., 8, 4415–4427, https://doi.org/10.5194/amt-8-4415-2015, 2015.
Wang, Q. Y., Huang, R.-J., Cao, J. J., Tie, X. X., Ni, H. Y., Zhou, Y. Q., Han, Y. M., Hu, T. F., Zhu, C. S., Feng, T., Li, N., and Li, J. D.: Black carbon aerosol in winter northeastern Qinghai–Tibetan Plateau, China: the source, mixing state and optical property, Atmos. Chem. Phys., 15, 13059–13069, https://doi.org/10.5194/acp-15-13059-2015, 2015.
Wex, H., Neusüß, C., Wendisch, M., Stratmann, F., Koziar, C., Keil, A., Wiedensohler, A., and Ebert, M.: Particle scattering, backscattering, and absorption coefficients: An in situ closure and sensitivity study, J. Geophys. Res.-Atmos., 107, LAC 4-1-LAC 4-18, https://doi.org/10.1029/2000jd000234, 2002.
Wiedensohler, A.: An approximation of the bipolar charge distribution for particles in the submicron size range, J. Aerosol Sci., 19, 387–389, 1988.
Wiedensohler, A. and Fissan, H. J.: Aerosol charging in high purity gases, J. Aerosol Sci., 19, 867–870, 1988.
Wilcox, E. M., Thomas, R. M., Praveen, P. S., Pistone, K., Bender, F. A. M., and Ramanathan, V.: Black carbon solar absorption suppresses turbulence in the atmospheric boundary layer, P. Natl. Acad. Sci. USA, 113, 11794–11799, https://doi.org/10.1073/pnas.1525746113, 2016.
Wu, Y., Cheng, T., Zheng, L., and Chen, H.: Effect of morphology on the optical properties of soot aggregated with spheroidal monomers, J. Quant. Spectrosc. Ra., 168, 158–169, 2016.
Wu, Y., Cheng, T., Liu, D., Allan, J. D., Zheng, L., and Chen, H.: Light Absorption Enhancement of Black Carbon Aerosol Constrained by Particle Morphology, Environ. Sci. Technol., 52, 6912–6919, https://doi.org/10.1021/acs.est.8b00636, 2018.
Yu, H., Wu, C., Wu, D., and Yu, J. Z.: Size distributions of elemental carbon and its contribution to light extinction in urban and rural locations in the pearl river delta region, China, Atmos. Chem. Phys., 10, 5107–5119, https://doi.org/10.5194/acp-10-5107-2010, 2010.
Zhang, R., Khalizov, A. F., Pagels, J., Zhang, D., Xue, H., and McMurry, P. H.: Variability in morphology, hygroscopicity, and optical properties of soot aerosols during atmospheric processing, P. Natl. Acad. Sci. USA, 105, 10291–10296, https://doi.org/10.1073/pnas.0804860105, 2008.
Zhang, Y., Zhang, Q., Cheng, Y., Su, H., Kecorius, S., Wang, Z., Wu, Z., Hu, M., Zhu, T., Wiedensohler, A., and He, K.: Measuring the morphology and density of internally mixed black carbon with SP2 and VTDMA: new insight into the absorption enhancement of black carbon in the atmosphere, Atmos. Meas. Tech., 9, 1833–1843, https://doi.org/10.5194/amt-9-1833-2016, 2016.
Zhang, Y., Su, H., Kecorius, S., Wang, Z., Hu, M., Zhu, T., He, K., Wiedensohler, A., Zhang, Q., and Cheng, Y.: Mixing State of Refractory Black Carbon of the North China Plain Regional Aerosol Combining a Single Particle Soot Photometer and a Volatility Tandem Differential Mobility Analyzer, Atmos. Chem. Phys. Discuss., https://doi.org/10.5194/acp-2017-222, 2017.
Zhang, Y., Zhang, Q., Cheng, Y., Su, H., Li, H., Li, M., Zhang, X., Ding, A., and He, K.: Amplification of light absorption of black carbon associated with air pollution, Atmos. Chem. Phys., 18, 9879–9896, https://doi.org/10.5194/acp-18-9879-2018, 2018.
Zhao, G., Zhao, C., Kuang, Y., Bian, Y., Tao, J., Shen, C., and Yu, Y.: Calculating the aerosol asymmetry factor based on measurements from the humidified nephelometer system, Atmos. Chem. Phys., 18, 9049–9060, https://doi.org/10.5194/acp-18-9049-2018, 2018.