the Creative Commons Attribution 4.0 License.
the Creative Commons Attribution 4.0 License.
 | 23 Oct 2019
Black carbon physical and optical properties across northern India during pre-monsoon and monsoon seasons
James Brooks
Dantong Liu
James D. Allan
Paul I. Williams
Jim Haywood
Ellie J. Highwood
Sobhan K. Kompalli
S. Suresh Babu
Sreedharan K. Satheesh
Andrew G. Turner
Black carbon (BC) is known to have major impacts on both climate and human health and is therefore of global importance, particularly in regions close to large populations that have strong sources. The size-resolved mixing state of BC-containing particles was characterised using a single-particle soot photometer (SP2). The study focusses on the Indo-Gangetic Plain (IGP) during the pre-monsoon and monsoon seasons. Data presented are from the UK Facility for Airborne Atmospheric Measurements BAe-146 research aircraft that performed flights during the pre-monsoon (11 and 12 June) and monsoon (30 June to 11 July) seasons of 2016.
Over the IGP, BC mass concentrations were greater (1.95 µg m−3) compared to north-west India (1.50 µg m−3) and north-east India (0.70 µg m−3) during the pre-monsoon season. Across northern India, two distinct BC modes were recorded; a mode of small BC particles (core diameter <0.16 µm and coating thickness <50 nm) and a mode of moderately coated BC (core diameter <0.22 µm and coating thickness of 50–200 nm). The IGP and north-east India locations exhibited moderately coated black carbon particles with enhanced coating thicknesses, core sizes, mass absorption cross sections, and scattering enhancement values compared to much lower values present in the north-west. The coating thickness and mass absorption cross section increased with altitude (13 %) compared to those in the boundary layer. As the monsoon arrived across the region, mass concentration of BC decreased over the central IGP and north-east locations (38 % and 28 % respectively), whereas for the north-west location BC properties remained relatively consistent. Post-monsoon onset, the coating thickness, core size, mass absorption cross section, and scattering enhancement values were all greatest over the central IGP much like the pre-monsoon season but were considerably reduced over both north-east and north-west India. Increases in mass absorption cross section through the atmospheric column were still present during the monsoon for the north-west and central IGP locations, but less so over the north-east due to lack of long-range transport aerosol aloft. Across the Indo-Gangetic Plain and north-east India during the pre-monsoon and monsoon seasons, solid-fuel (wood burning) emissions form the greatest proportion of BC with moderately coated particles. However, as the monsoon develops in the north-east there was a switch to small uncoated BC particles indicative of traffic emissions, but the solid-fuel emissions remained in the IGP into the monsoon. For both seasons in the north-west, traffic emissions form the greatest proportion of BC particles.
Our findings will prove important for greater understanding of the BC physical and optical properties, with important consequences for the atmospheric radiative forcing of BC-containing particles. The findings will also help constrain the regional aerosol models for a variety of applications such as space-based remote sensing, chemistry transport modelling, air quality, and BC source and emission inventories.
- Article
(10452 KB) - Full-text XML
- BibTeX
- EndNote


Increased anthropogenic emissions into the atmosphere, especially over south Asia, have led to severe air quality issues (Schnell et al., 2018). Understanding, identifying, and characterising air pollution sources and their effect on local and regional areas is important for health impact studies as well as radiative forcing assessments on local and global scales (Lawrence et al., 2007). Black carbon (BC) is one of the crucial components of ambient aerosol released into the atmosphere due to the incomplete combustion of fossil fuels, biofuels, and biomass burning (IPCC, 2013; Bansal et al., 2018). Due to its strong absorption at a wide range of wavelengths, BC is considered to be a prime contributor to radiative heating of the atmosphere (Marinoni et al., 2010; Bond et al., 2013). Strong light absorption from BC coupled with its longer atmospheric lifetime makes BC an important aerosol constituent affecting regional climate (Bansal et al., 2018).
India is currently the second-largest BC emitter in the world after Africa (Bond et al., 2013), with emissions projected to rise steadily in the coming decades (Rana et al., 2019). Unlike the USA, UK, and Europe, where aerosol BC is predominantly sourced from on-road and off-road diesel engines (Bond et al., 2013) with a shift towards solid-fuel burning in winter (Liu et al., 2014), Indian BC emissions are overwhelmingly from low-efficiency combustion of domestic fuels (47 %) followed by industrial emissions (22 %), transportation (17 %), and open burning (12 %), which is dominated by crop residue burning (Paliwal et al., 2016). The Indo-Gangetic Plain (IGP) in northern India is one such polluted region in south Asia (Pawar et al., 2015; Singh et al., 2017) that undergoes these significant seasonal variations (Banerjee et al., 2015; Singh et al., 2017) with dust dominating during pre-monsoon months (Gautam et al., 2009; Vaishya et al., 2018). Regional BC emission inventories have considerable variability owing to the emission factors, unreliability of fuel consumption estimates, and general lack of detailed in situ measurements (Bond et al., 2013; Rana et al., 2019). Most previous emission inventory studies provide yearly emission analysis but lack the seasonal temporal emission variability, as explained by Paliwal et al. (2016) and Moorthy et al. (2013). Additional uncertainties are sourced from variable physio-chemical and optical properties of BC aerosol (Koch et al., 2009; Lee et al., 2013). The ageing and internal mixing of BC aerosol in the atmosphere with components such as sulfate, organic carbon, and secondary organic aerosol can enhance BC light absorption by 30 %–100 % compared to an external mixture (Liu et al., 2017; Rana et al., 2019). Therefore, the BC mixing properties are of importance for further study and clarification across India, especially northern India where BC mass concentrations are known to be significant (Bond et al., 2013; Brooks et al., 2019).
Environmental regulation targeted emissions from fossil fuel combustion by transport, power plants, and a variety of industrial activities. However, residential solid-fuel burning for space-heating purposes (such as coal or wood burning) has received less attention in terms of enforcement or regulation during the past decade (Liu et al., 2014). Especially for Europe, there have been a growing number of studies that highlight the importance of residential burning and their contribution to particulate matter (PM) loadings, with emphasis on wintertime studies when domestic heating activities are high and boundary layer mixing is suppressed (Herich et al., 2011; Liu et al., 2011; Laborde et al., 2013; Crippa et al., 2014). Organic mass fractions in submicron aerosols contributed by solid-fuel sources reported in these studies ranged from 15 % to 50 % consistently using receptor-based source apportionment methodologies, highlighting the importance of wood burning as a source contribution (Herich et al., 2014). The methodologies outlined above have mostly focussed on the organic carbon content of solid-fuel sources. However, as Liu et al. (2014) explains, the source information for black carbon (BC) aerosols is sparse in part due to the difficulties of measuring the refractory component in the aerosols. Given BC is the principal source of particulate light absorption in the atmosphere (Bond et al., 2013) with adverse effects on human health (e.g. Jansen et al., 2005; Mordukhovich et al., 2009), it is of great importance to understand BC sources and how its properties are dictated by those sources.
Prior to our study, only a few surface-based measurements of BC using a single-particle soot photometer (SP2) had been made (Raatikainen et al., 2017; Thamban et al., 2017; Kompalli et al., 2019). The data presented in this work represent the first vertically resolved measurements of BC mass and mixing state using an SP2 during the pre-monsoon and monsoon seasons over northern India. Previous studies (Rana et al., 2019) have been unable to identify particular sources of BC from ambient measurements, though some insight into larger BC particles has been possible (Kumar et al., 2011; Vadrevu et al., 2012; Kaskaoutis et al., 2014). Previously SP2 data from urban environments such as London and China have been used to determine contributions to BC from different sources based on the core size and coating thickness, the latter being represented as scattering enhancement (Liu et al., 2014, 2019). Over London during winter, two distinct BC sources were observed, one of small BC core diameters with low scattering enhancement that was identified as being from traffic emissions and the second of larger BC core diameters with increased scattering enhancement (solid-fuel-type emissions). These sources could be clearly separated since the measurements were made in close proximity and the BC types were distinctly different (Liu et al., 2014, 2019).
In view of the large variations associated with BC emission inventories in the Indian region, model outputs of BC mass and single site location studies need to be validated against high-temporal and spatial airborne atmospheric measurements (Rana et al., 2019). This paper presents the first airborne measurements of BC physical properties over northern India using the SP2 instrument and is the first time that BC physical properties are measured quantitatively at such temporal and spatial scales, providing detailed insights into source-specific BC properties during the pre-monsoon and monsoon seasons.
Table 1Flight summary for operations included in this study. All flights were conducted in northern India in the pre-monsoon (PM) and monsoon (M) seasons (PM–M season refers to transition period of when the monsoon was arriving in northern India). The dates of the flights are shown, with their respective region of study.

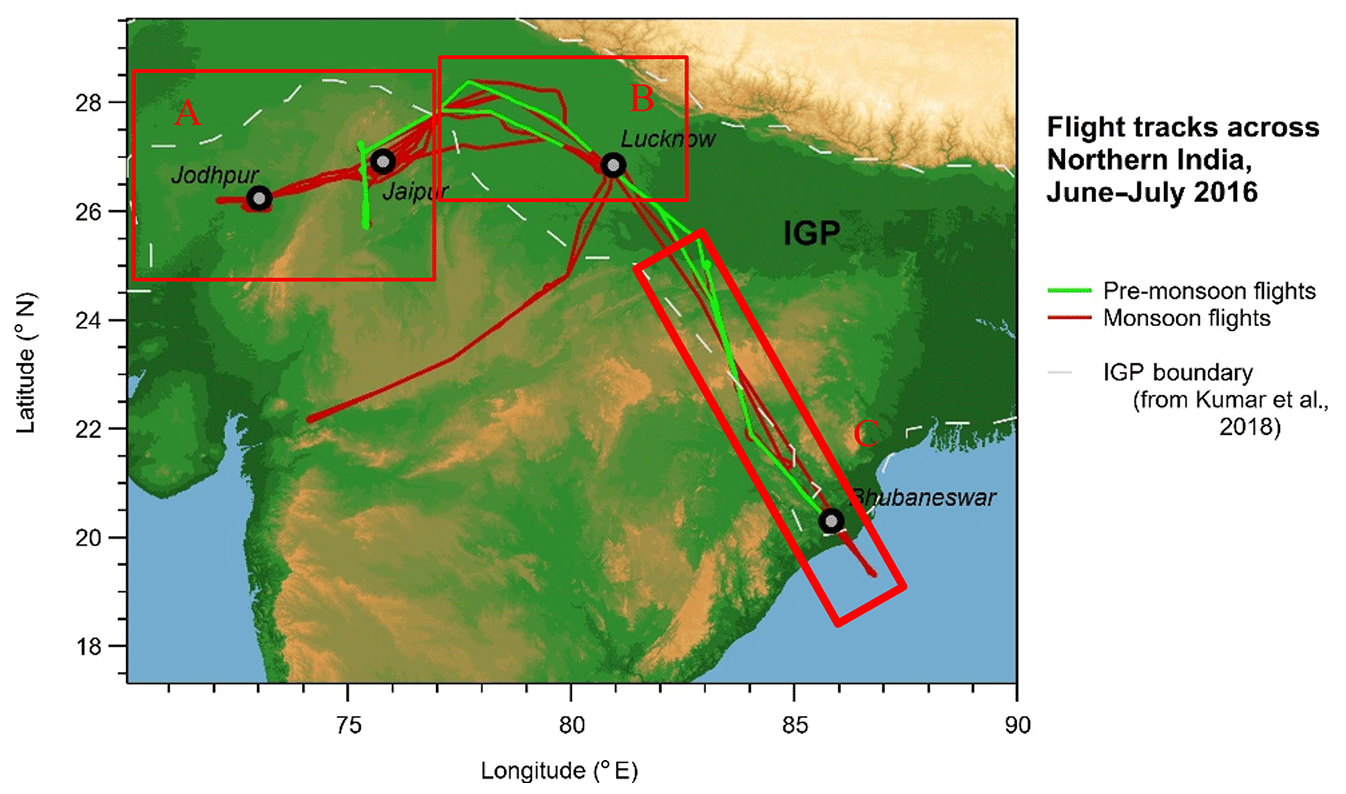
Figure 1Flight tracks of the BAe-146 aircraft for the campaign across India during the pre-monsoon and monsoon seasons of 2016. The flight paths considered by this analysis are described in the main text and Table 1. Straight-level run (SLR) boundary layer sections are split by region (A) west of IGP in NW India, (B) IGP, and (C) south-east of IGP in NE India. Map terrain created using Global multi-resolution terrain elevation data 010 (GMTED2010) (http://www.usgs.gov, last access: 21 October 2019).
A total of 10 science flights form this study and were conducted by the UK Facility for Airborne Atmospheric Measurement (FAAM) BAe-146 research aircraft with the flight tracks highlighted in Fig. 1 and flight summaries in Table 1. The flights took place during two periods: the pre-monsoon season (11 and 12 June 2016) and the monsoon onset period (30 June to 11 July 2016), based at Lucknow (LKN; 26.85∘ N, 80.95∘ E). The aircraft flew with a comprehensive instrument suite, capable of measuring aerosols, cloud physics, chemical tracers, radiative fluxes, and meteorological fields; however only instruments used in this analysis are discussed further. The FAAM BAe-146 has a typical range of ∼3000 km and an altitude ceiling of over 10 km, with an aircraft science speed of ∼100 m s−1. From the operating base, the aircraft typically covered radial distances of ∼200–300 km in 4.5–5 h of flight time, resulting in over 120 h of flying completed throughout the campaign (89 h of science measurement flying). Based on the likely synoptic and local conditions on the day, different types of science flights were conducted: radiation flights and survey flights. Both flight types consisted of long-leg duration flights covering the NE Bay of Bengal (BBA) area and Indo-Gangetic Plain (IGP) regions, delivering the main part of the aerosol characterisation. In addition, profiles to high altitudes when taking off from Lucknow and in selected other locations were carried out in order to build up a statistical picture of the vertical structure. Low-altitude straight-level runs (SLRs) were also carried out at heights of around 0.5–1.0 km.
Instrumentation
The physical properties of individual refractory BC (rBC; Petzold et al., 2013) particles were characterised using a single-particle soot photometer (SP2) manufactured by Droplet Measurement Technologies (DMT) Inc. (Boulder, CO, USA). The SP2 data were corrected to standard temperature and pressure (STP) of 273.15 K and 1013.25 hPa respectively. The instrument operation and data interpretation procedures are covered in detail elsewhere (Liu et al., 2010; McMeeking et al., 2010). Briefly, the SP2 uses an intra-cavity Nd:YAG laser at 1064 nm to determine the optical size of a single particle by light scattering and, if material within the particle absorbs at the laser wavelength, the refractory mass of the particle is quantified by detection of the laser-induced incandescence radiation. In the atmosphere the main light-absorbing component at this wavelength is BC (Liu et al., 2014). The SP2 incandescence signal was to obtain single-particle rBC mass after calibration using Aquadag sample black carbon particle standards (Aqueous Deflocculated Acheson Graphite, manufactured by Acheson Inc., USA), with a correction value of 0.75 required to fully represent ambient particles (Moteki and Kondo, 2010; Laborde et al., 2012; Baumgardner et al., 2012). The measured rBC mass is converted to a mass equivalent diameter (1.8 g cm−3 for atmospheric BC; Bond and Bergstrom, 2006), which is termed the BC core diameter (Dc), which is the diameter of a sphere containing the same mass of rBC as measured in the particles. The scattering signal of a BC particle will be distorted during its transit through the laser beam because of the mass loss of a BC particle by laser heating; thus the leading-edge scattering signal before the onset of volatilisation is extrapolated to reconstruct the scattering signal of a BC-containing particle (Gao et al., 2007).
The physical properties, such as the coating thickness for a given single BC particle, are obtained by using an inverse Mie scattering model in conjunction with the BC core size. As described by Taylor et al. (2014), this technique will obtain the equivalent diameter of a sphere with the BC assumed to be a concentric spherical inclusion with the same scattering cross section as the measured particle after leading-edge-only (LEO) fitting. The technical details for the method of leading-edge-only (LEO) fitting can be found in Liu et al. (2014). The optical diameter of a BC particle or the coated BC size (Dp) is derived by inputting the LEO-fitted scattering signal and BC core size into Mie calculations, and using a core refractive index (m) (Moteki et al., 2010) and a coating refractive index . The relative or absolute coating thickness of a BC particle is calculated as Dp∕Dc and ( respectively, with the absolute coating thickness presented in this study. The optical size of a non-BC particle is again calculated using Mie theory using ; thus the optical sizes of coated BC and non-BC are directly comparable using the analysis here. Given the coating thickness for individual particles is Dc size dependent, a bulk coating thickness is evaluated as the cubed root of the total volume of the BC particles divided by the total volume of BC cores, as expressed in Eq. (1):
where Dp and Dc are the coated BC diameter and BC core diameters respectively; i denotes the ith single BC particle. The volume-weighted bulk Dp∕Dc is considered to be a representative diagnostic for the overall mixing state of the entire population of BC particles.
To best illustrate the BC core and coating methodology, a parameter of scattering enhancement, Esca, can be introduced, which is defined by Eq. (2):
where Scoated is the scattering signal measured from the SP2 and then LEO fitted. is the scattering signal of the corresponding BC core, with the asterisk denoting it is calculated using the Mie single-particle scattering solutions. Following this methodology, a value of Esca=1 refers to a BC particle that scatters equivalently to that containing only a BC core, in other words the BC particle has zero coating (). However, as Liu et al. (2014) explains, particles with any associated coatings will scatter more than the core; thus Esca will be >1. Scoated will also be subject to instrument measurement uncertainty; therefore a fraction of particles of Es<1 would be expected. An increase in Esca will coincide with a thicker coating thickness for a specified Dc.
The volume-weighted coated BC size (Dp) size distribution is calculated as the product of the bulk relative coating thickness and the mass median diameter (MMD) of the BC cores to indicate the mean coated BC size (Eq. 3):
The mass absorption coefficient (MAC) at λ=880 nm to avoid the influence of brown carbon (BrC) absorption at shorter wavelengths is calculated for each single particle by assuming the refractive index of rBC core as 1.95±0.79i (Bond and Bergstrom, 2006; Laborde et al., 2013) and coating thickness refractive index as 1.50±0i (Liu et al., 2015), using the Mie core–shell approach (Bohren and Huffman, 2008). The MAC in bulk for a given time is calculated as the integrated absorption coefficient (MAC×mrBC) for all particles divided by the integrated particle masses, expressed by Eq. (4):
where MACi and mrBCi are the MAC and rBC mass for each single particle respectively. The calculation is performed for each type of BC. The MAC is an important property for BC particles as it has important ramifications for radiative transfer simulations. The MAC is size dependent, resulting in larger values for particles with thicker coatings or associated water at high relative humidity (Schnaiter et al., 2005). Instrument limitations have in the past led to large discrepancies in MAC values throughout the literature (Bond and Bergstrom, 2006); however the SP2 measures the refractory BC mass independently of the mixing state (Laborde et al., 2013). Our analysis involving BC properties is not affected by coarse-mode dust; the possible coating of BC on coarse-mode dust is not applicable to this study. The largest size bin has been removed from the analysis due to any potential dust particles measured that exceed the size cut-off maximum of which the SP2 is capable. This would only have a minimal effect on the pre-monsoon flights due to dust washout as the monsoon arrives. More information on this can be found in Liu et al. (2018) regarding removal of haematite dust influence on BC data.
The analysis presented below first outlines the BC characteristics within the boundary layer from the straight-level run (SLR) measurements during the pre-monsoon-to-monsoon transition period across northern India, followed by the vertical profile analysis (Sect. 3.1). Further analysis presents the semi-direct climatic impact potential of the BC across northern India, highlighting the various properties and scattering enhancement potential the BC exhibits (Sect. 3.2) along with the BC mass absorption cross section (MAC; Sect. 3.3). The pre-monsoon (11–12 June, flights of B956 and B957) and monsoon (30 June–11 July, flights of B968-B976) seasons are considered separately. Of this second category, the first few flights can be regarded as occurring during the monsoon transition phase, since the monsoon has arrived at some locations but not others. For example, during B968 (30 June) the monsoon was seen to be influencing the IGP but not Jaipur in NW India. More information on the monsoon development can be seen in Appendix Fig. A1 (in this example for 30 June, the monsoon progression isochrone for 2016 still lies to the south and east of Jaipur), Fig. A2 for mean pre-monsoon and monsoon wind directions in and above the boundary layer, and in Brooks et al. (2019).
As highlighted in Brooks et al. (2019), the aerosol burden over northern India has a distinct structure in the pre-monsoon season. An elevated aerosol layer is present between 3 and 6 km, particularly over north-west India with somewhat decreased extent in the far north-east of India. The aerosol chemical composition remained largely similar as the monsoon season progressed (sulfate aerosol dominating outside the IGP compared to organic aerosol inside the IGP), but the total aerosol mass concentrations decreased by ∼50 % as the rainfall arrived; the pre-monsoon average total mass concentration was 30 µg m−3 compared to a monsoon average total mass concentration of 10–20 µg m−3. However, this mass concentration decrease was less noteworthy (∼20 %–30 %) over the IGP, likely due to the strength of emission sources in this region. In the aerosol vertical profile, inside the IGP during the pre-monsoon, organic aerosol and absorbing aerosol species dominated in the lower atmosphere (<1.5 km) with sulfate, dust, and other scattering aerosol species enhanced in an elevated aerosol layer above 1.5 km with maximum aerosol height ∼6 km. As the monsoon progressed into this region, the elevated aerosol layer diminished, the aerosol maximum height reduced to ∼2 km, and the total mass concentrations decreased by ∼50 %.
3.1 BC physical properties
3.1.1 Boundary layer BC
Summary statistics of boundary layer aerosol chemical composition for northern India can be found in Fig. 2, and more detailed analysis can be found in Fig. 4. The boundary layer was predominantly above 1500 m, such that the straight-level run (SLR) data presented are within the boundary layer throughout.
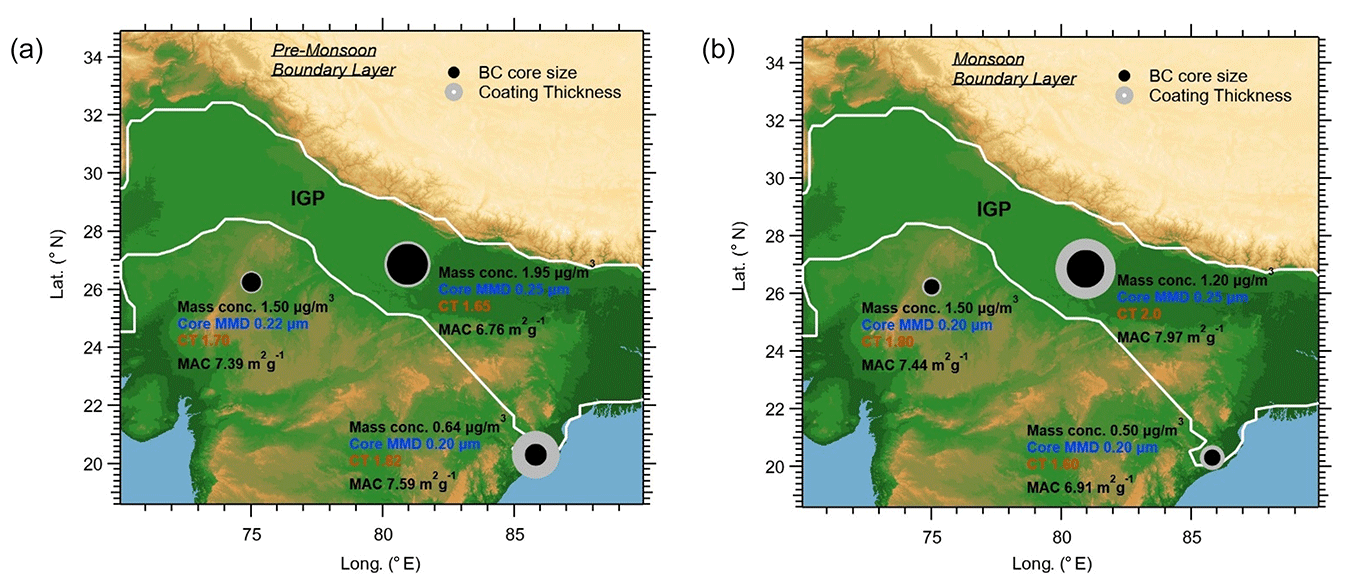
Figure 2Pre-monsoon (a) and monsoon (b) average boundary layer (BL) black carbon optical and physical properties, across northern India. The BC core and coating information is presented for NW India between Jaipur and Jodhpur, the central IGP, and NE India near Bhubaneswar. The IGP boundary (white line) is from Kumar et al. (2018). Map terrain created using Global multi-resolution terrain elevation data 010 (GMTED2010) (http://www.usgs.gov).
The greatest black carbon mass concentrations were present inside the IGP (average 1.95 µg m−3), with decreased mass concentrations outside in both the NW (1.5 µg m−3) and NE of India (0.7 µg m−3). The BC core MMD was larger inside the IGP (0.25 µm) compared to the NW (0.22 µm) and NE (0.22 µm) of India. The coating thickness of the BC particles shows some similarity between the NW and IGP regions, with a slightly larger average outside the IGP in the NW (1.7) compared to inside the IGP (1.65). Over NE India, the coating thickness was significantly larger with an average of 1.9 witnessed. A reason for these large coating thicknesses may be due to the air mass arriving in the north-east having been strongly influenced by long-range transport that has undergone significant ageing mechanisms, as well as entrainment of solid-fuel aerosol particles as the air mass travels across the IGP.
Moving into the monsoon onset period, there were changes but also similarities seen in the BC physical properties across northern India. Black carbon mass concentrations decreased somewhat across all regions but remained relatively consistent compared to the pre-monsoon season. Over the IGP, mass concentrations decreased by ∼25 %–40 % as the monsoon progresses across the region, with average mass concentrations of ∼1.2 µg m−3. In NW India, mass concentrations fluctuated significantly between flights but overall no significant decrease in average concentrations occurred. This is potentially due to the NW region witnessing consistent wind directions from the west from Pakistan and beyond, therefore bringing similar air masses from the same source to the region. In the NE region of India, the BC mass concentrations were lower than over the IGP, with decreases witnessed as the monsoon progressed. Concentrations were somewhat elevated over locations close to the built-up region of Bhubaneswar (0.50 µg m−3) and close to the IGP boundary during B975 (0.50 µg m−3) compared to mass concentrations of ∼0.25 µg m−3 in between.
With monsoon progression came increases in the coating thicknesses of particles across northern India, especially over the IGP. Increases of up to 35 % were witnessed in the absolute coating thicknesses of BC particles from ∼1.6 to ∼2. An increase in absolute coating thicknesses was also witnessed over NW India, albeit smaller than the increases over the IGP, with coating thickness averages increasing from ∼1.7 to ∼1.8. Over NE India close to the IGP boundary, coating thicknesses were similar to the central IGP coating thickness values (∼2), whereas over Bhubaneswar the coating thicknesses were much smaller, ∼1.6, during the monsoon flights. This could be due to the wind directions between the locations, with NE India influenced by local sources as the wind originates mostly from the Bay of Bengal, whereas closer to the IGP the air mass had greater influence from the larger, solid-fuel-type sources of the IGP.
Regarding core size regional characteristics, outside the IGP in the NW, core mass median diameters were relatively constant with averages of ∼0.2 µm throughout the monsoon progression period, likely due to a consistent wind direction from west of the region. Over the IGP, no significant changes were seen in core size, with averages in both the PM and monsoon progression period at 0.25 µm. Over the NE of India, core MMD values varied with monsoon progression with averages of ∼0.22 µm during the PM and ∼0.20 µm in the monsoon period.
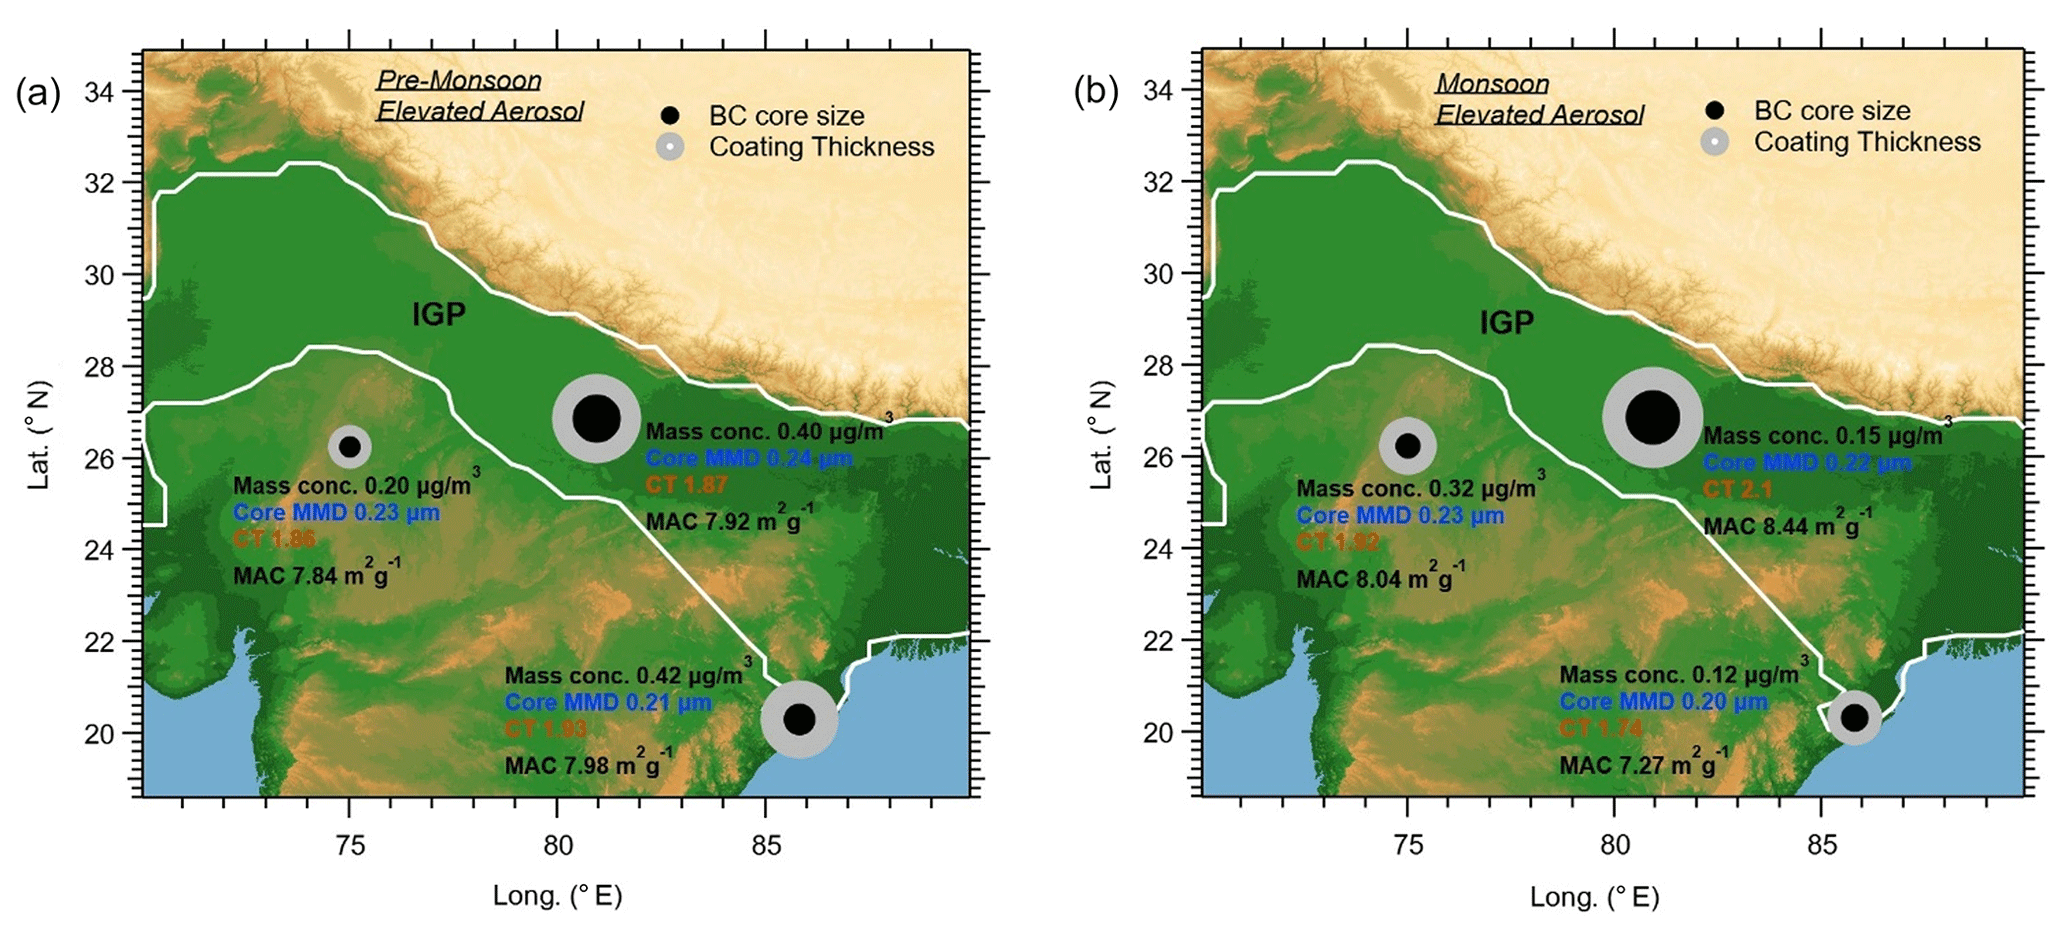
Figure 3Pre-monsoon (a) and monsoon (b) average elevated aerosol above the boundary layer black carbon optical and physical properties, across northern India. The BC core and coating information is presented for NW India between Jaipur and Jodhpur, the central IGP, and NE India near Bhubaneswar. The IGP boundary (white line) is from Kumar et al. (2018). Map terrain created using Global multi-resolution terrain elevation data 010 (GMTED2010) (http://www.usgs.gov).
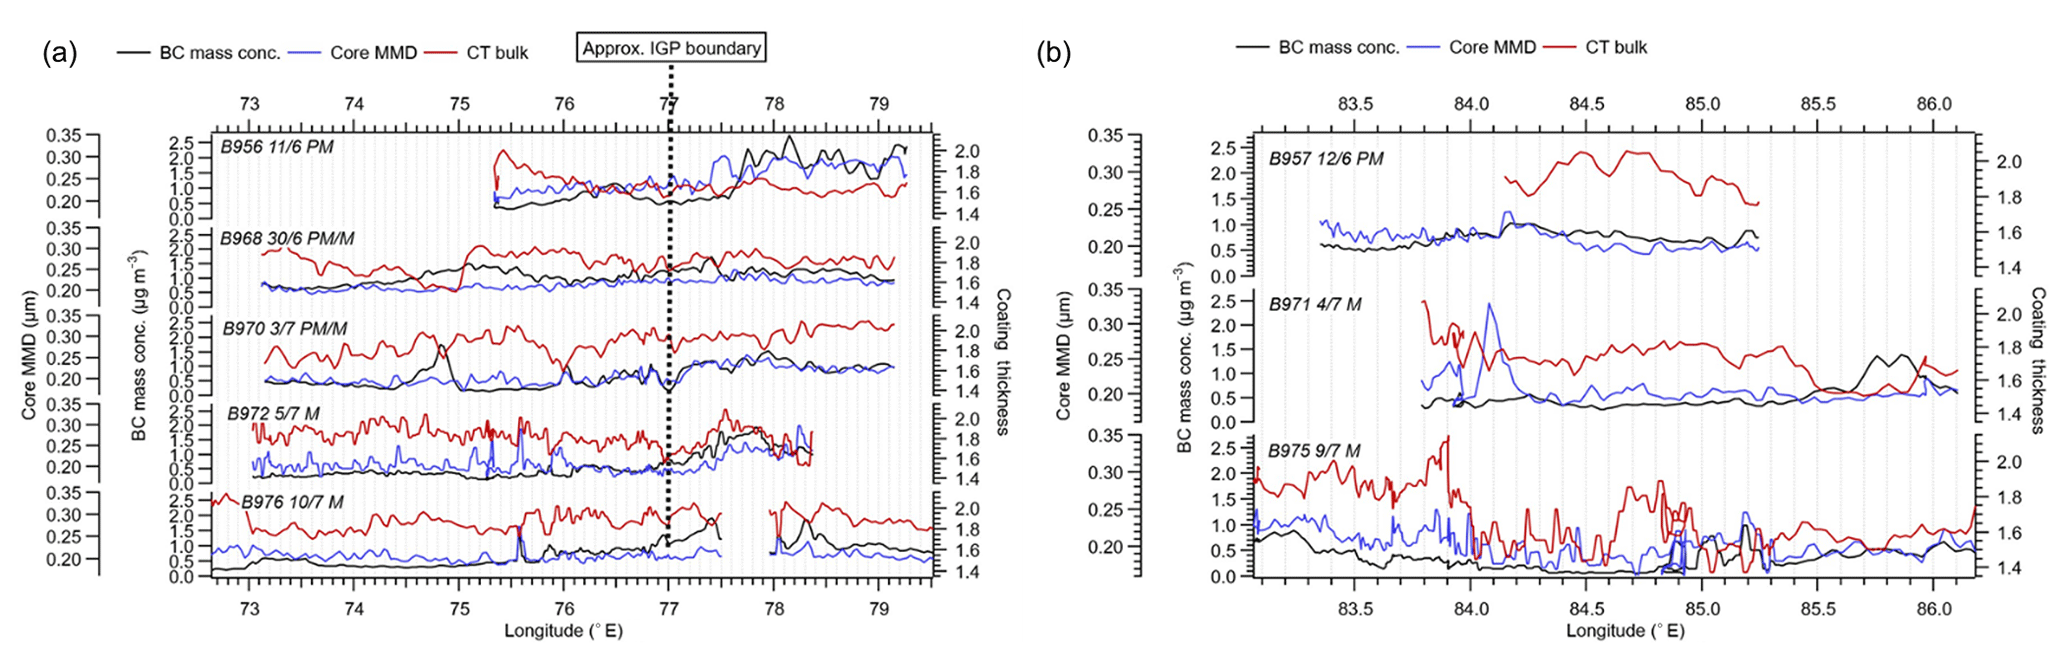
Figure 4Horizontal spatial BC physical properties for pre-monsoon (PM) and monsoon (M) seasons in northern India, from LKN to JAI–JOD (a) and from LKN to BBA (b). The plots highlight the IGP region (77∘ E) and outside the IGP (73–77∘ E) separated by the vertical black dashed line. The monsoon progression is indicated by the blue shaded region.
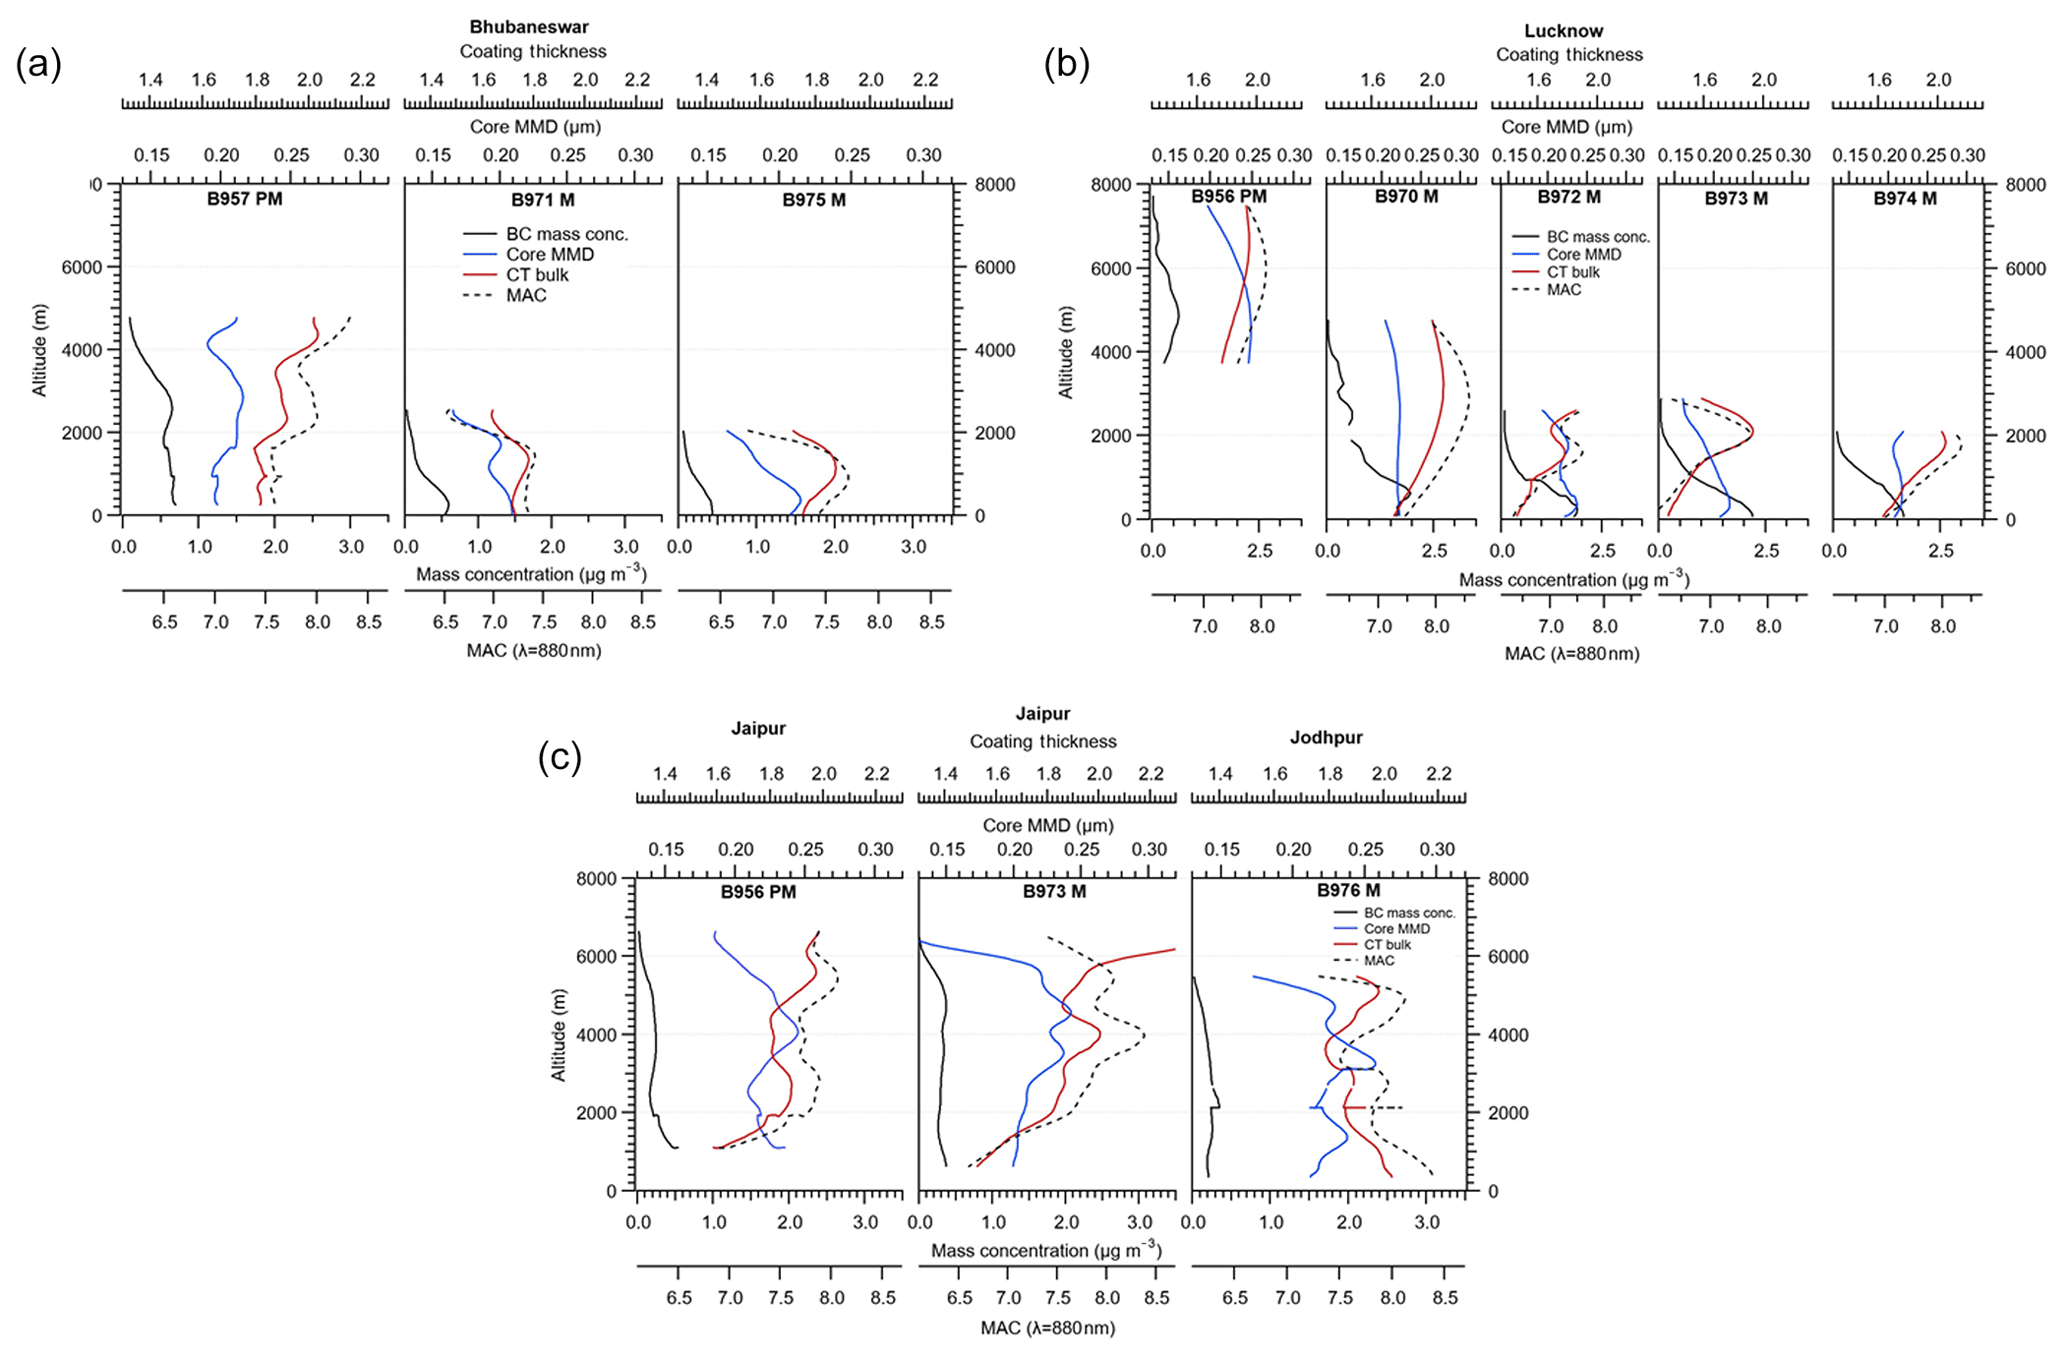
Figure 5Vertical profile BC physical properties for (a) Jaipur–Jodhpur in NW India, (b) Lucknow in the IGP, and (c) Bhubaneswar in NE India. Data presented are for the pre-monsoon (PM) and monsoon (M) seasons.
3.1.2 Vertical distribution of BC
Vertical profiles were also carried out using the aircraft in NW India (Jaipur (26.91∘ N 75.79∘ E) and Jodhpur (26.24∘ N 73.02∘ E)), the IGP (Lucknow (26.85∘ N 80.95∘ E)), and NE India (Bhubaneswar (20.30∘ N 85.83∘ E)) during both the pre-monsoon and monsoon transition periods, as shown in the summary plots for the boundary layer (BL, Fig. 3) and aloft (Fig. 4), and in Fig. 5. The BL height during the pre-monsoon season is chosen as 2 km and during the monsoon is 1.5 km, following the explanation in Brooks et al. (2019).
Throughout the vertical profile, distinct structure can be seen in the black carbon mass concentration and the black carbon physical properties. In the pre-monsoon season in NW India, black carbon mass concentrations were consistent through the profile with averages of ∼0.25 µg m−3. Black carbon core MMD also showed consistent values through the aerosol profile in NW India, with averages of ∼0.22 µm. Black carbon coating thickness, however, displayed increasing values with altitude, with values of ∼1.60 in the boundary layer compared to ∼1.9 aloft at 3 km. Inside the IGP, the black carbon mass concentration in an elevated aerosol layer (EAL) was of a similar order to NW India with an average of 0.50 µg m−3, with a core MMD average of 0.25 µm and coating thickness average of 1.85. A similar pattern occurred over NE India at Bhubaneswar, with black carbon mass concentrations of ∼0.6 µg m−3 in the boundary layer, with similar concentrations aloft. Aloft, however, there was a clear EAL highlighted in the black carbon core MMD and coating thickness information. In the BL, core MMD was ∼0.19 µm and coating thickness was 1.80. In the EAL increases were witnessed in both parameters with core MMD of ∼0.21 µm and coating thickness of 1.90.
Progressing into the monsoon onset period, variations were witnessed in the mass concentrations and the physical properties of BC. In the NW region, however, few changes are seen to the BC properties and mass due to the later monsoon arrival. Mass concentrations were consistent at pre-monsoon levels ∼0.25 µg m−3 with core MMD averages also similar at 0.22 µm. Coating thickness, however, did show some variations, with values greater in the boundary layer of ∼2 and ∼1.82 aloft from 2 to 4 km.
Changes were witnessed over the IGP though as the monsoon progressed over the region. BC mass concentrations decreased most significantly in the EAL. The maximum aerosol height was reduced from ∼7 km during the pre-monsoon season to ∼1.5–2 km during the monsoon, with mass concentrations decreasing from ∼0.5 µg m−3 in the EAL to negligible levels during the monsoon. In the boundary layer, decreases also occurred but not as significantly as aloft, with averages of ∼2 µg m−3 in the early monsoon (B970/B972) onset and of ∼1 µg m−3 as the monsoon is more developed over the region (B973/B974). The BC core MMD values remained consistent despite monsoon arrival, with averages of 0.20 µm. From B970 to B973, coating thickness increased with altitude (∼1.55 in BL compared to ∼1.9 aloft between 1.5 and 3 km), but overall decreased throughout the profile as the monsoon progressed. The coating thickness did however increase during B974 compared to the previous flights (∼1.6 in BL and ∼2.05 aloft). Similar changes were seen over BBA in the NE region as the monsoon progressed. The maximum aerosol height decreased from ∼5 km during the pre-monsoon to ∼2.5 km during the monsoon season, with mass concentrations decreasing in the EAL from ∼0.6 µg m−3 to negligible levels due to EAL removal. In the boundary layer, mass concentrations were also witnessed from ∼0.6 µg m−3 in the pre-monsoon to ∼0.3 µg m−3 during the monsoon season. BC coating thickness still displayed some increases with altitude during the monsoon season, but of less significance compared to the pre-monsoon season. The core MMD values decreased with altitude during the monsoon season, with values of ∼0.20 µm in the BL and of ∼0.17 µm aloft between 1.5 and 3 km.
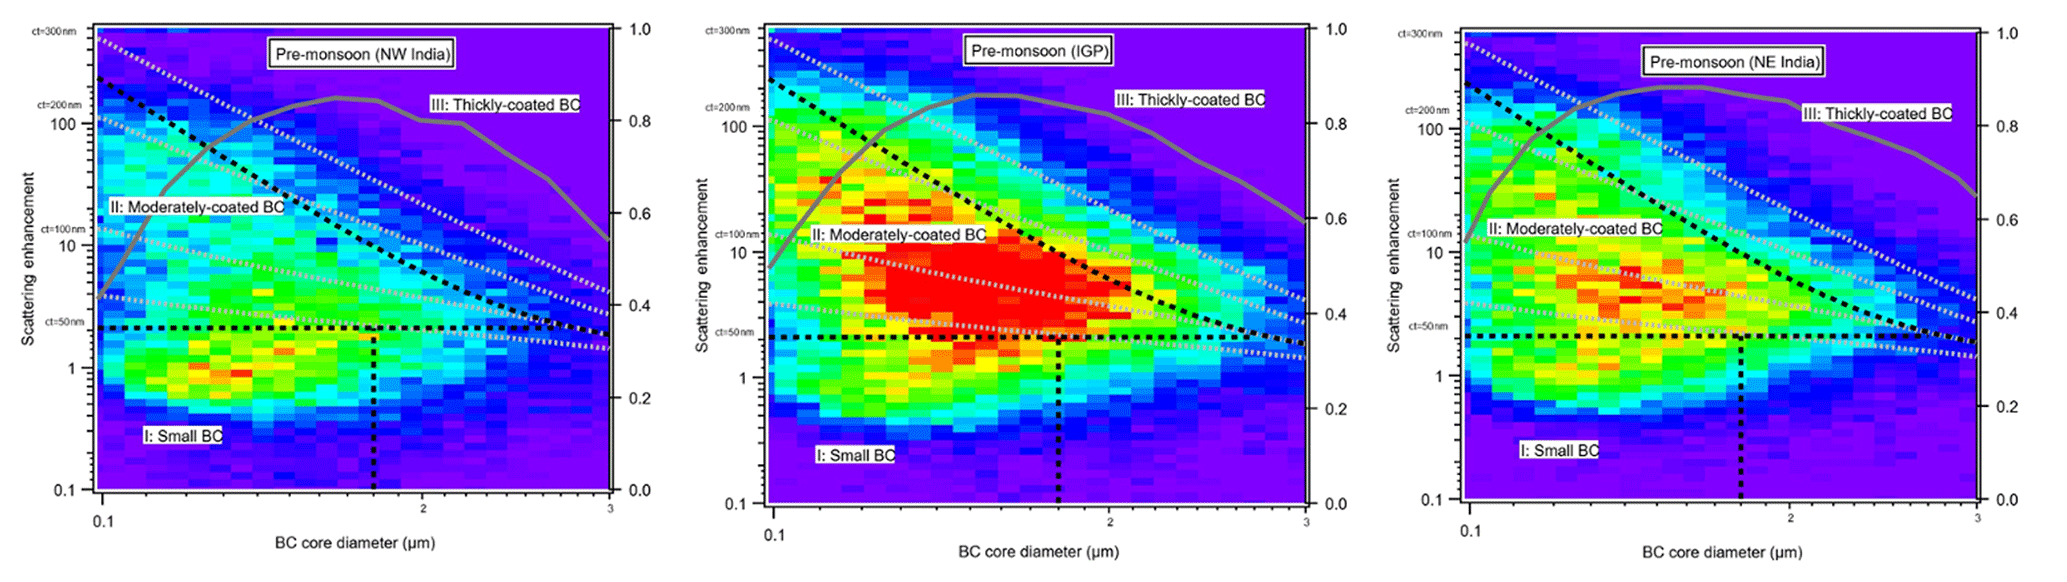
Figure 6BC optical properties the pre-monsoon (PM) season with the location sampled highlighted in the plot title. The plots present the scattering enhancement (Es) as a function of BC core diameter (Dc). The image plot is a two-dimensional histogram for the detected particles. The dashed grey contours show the absolute coating thickness (nm, ). The solid grey line, with corresponding scale on right axis, shows the number fraction of BC particles that were successfully determined according to their scattering signal at each Dc size.

Figure 7BC optical properties for the monsoon (M) season with the location sampled highlighted in the plot title. The plots present the scattering enhancement (Es) as a function of BC core diameter (Dc). The image plot is a two-dimensional histogram for the detected particles. The dashed grey contours show the absolute coating thickness (nm, ). The solid grey line, with corresponding scale on right axis, shows the number fraction of BC particles that were successfully determined according to their scattering signal at each Dc size.
3.2 BC scattering enhancement and size distributions
The variation in scattering enhancement (Esca) as a function of BC core diameter (Dc) is shown in Figs. 6 and 7, with BC core diameter (Dc) and coated diameter (Dp) size distributions in Figs. 8 and 9 respectively.
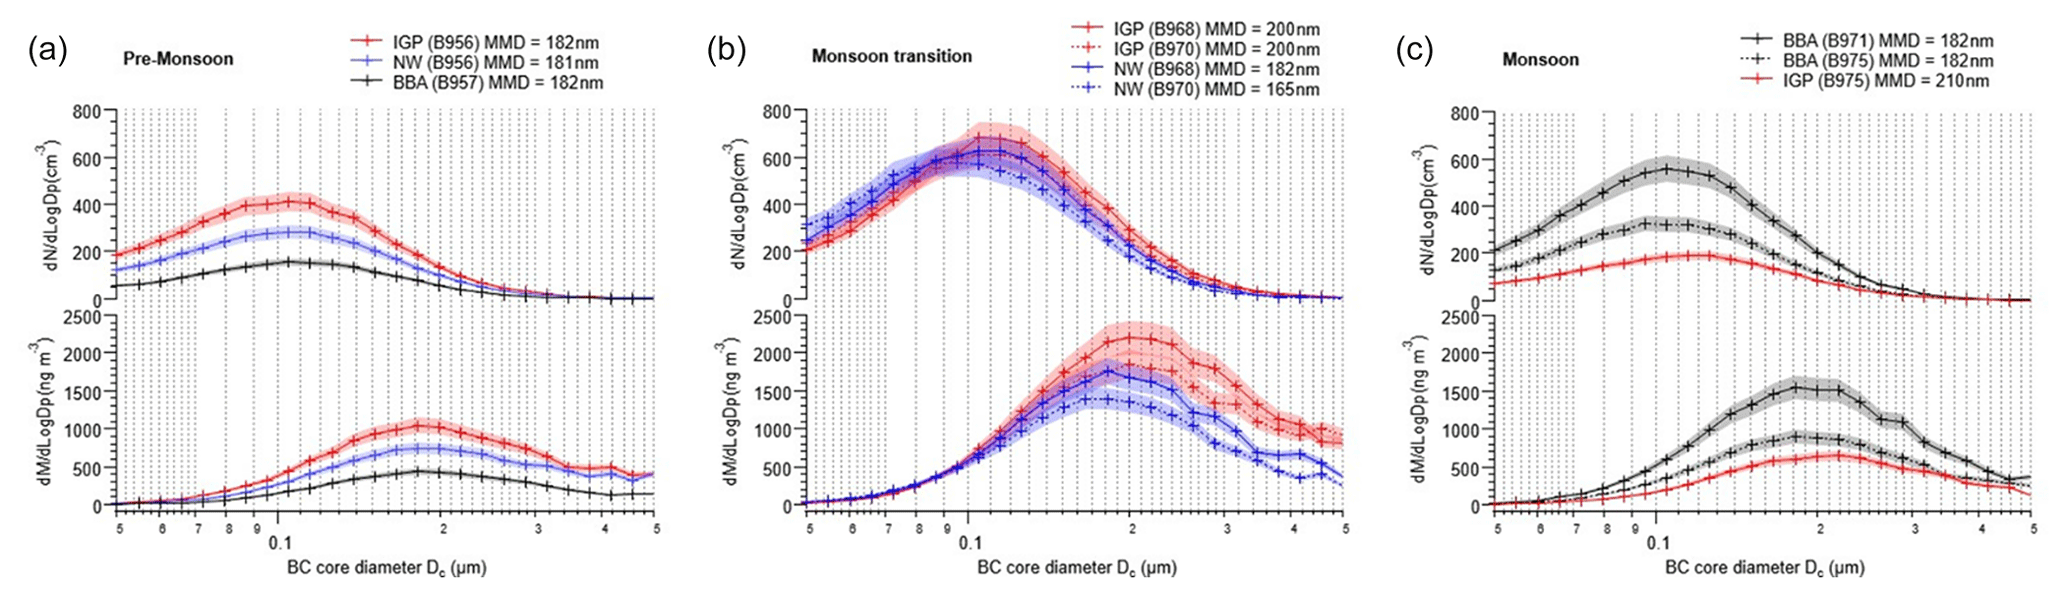
Figure 8BC core diameter (Dc) size distributions classified by (a) pre-monsoon, (b) monsoon transition, and (c) monsoon season. The shading is the square root (%) errors for each distribution. Orange represents the IGP, with blue representing NW India (JAI–JOD) and black NE India (BBA).
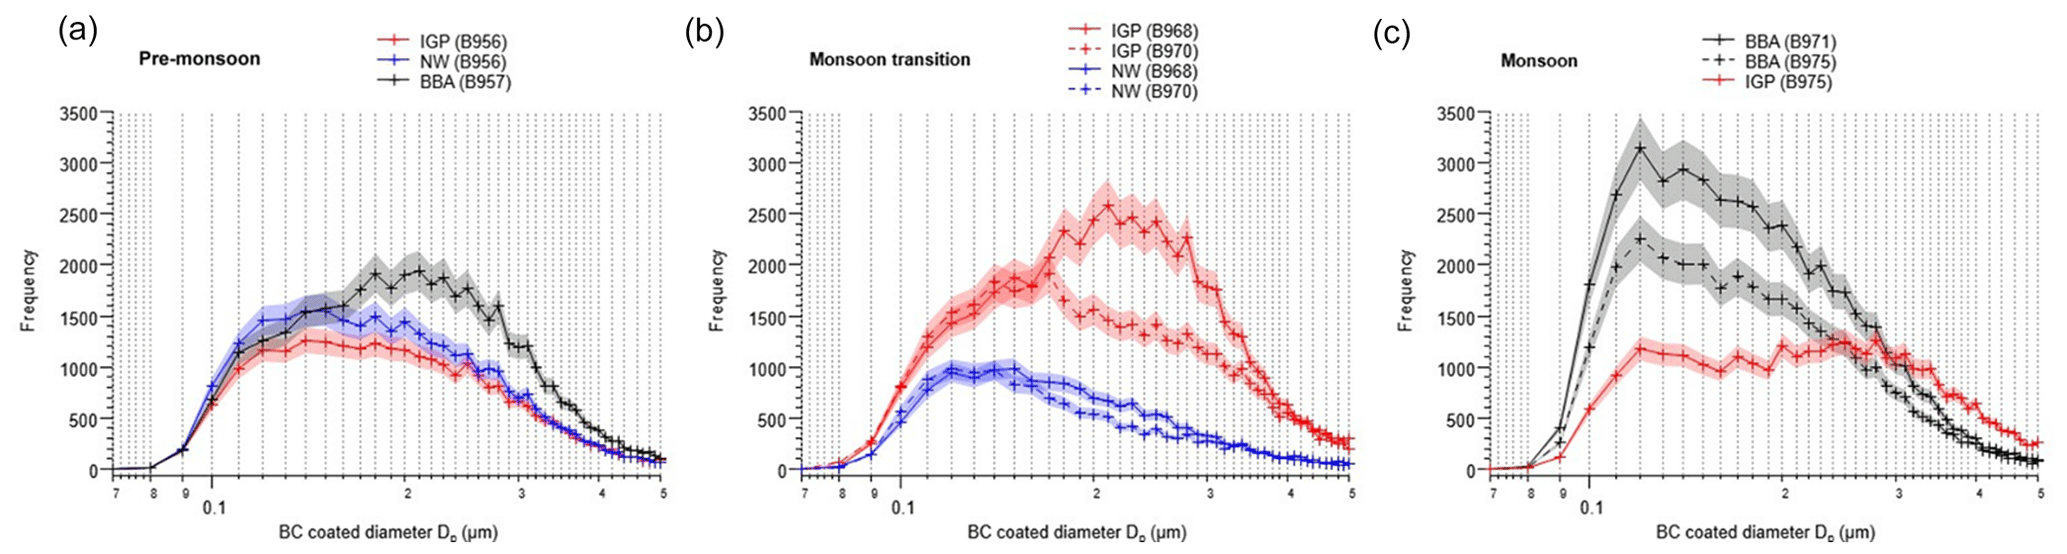
Figure 9BC coated diameter (Dp) histograms for (a) pre-monsoon season, (b) monsoon transition, and (c) monsoon season. The shading shows the square root (%) errors for data series. Orange represents the IGP, with blue representing NW India (JAI–JOD) and black NE India (BBA).
During the pre-monsoon season, the NW location showed small BC particles with very little coating (<50 nm). The IGP and NE India, however, show a greater proportion of the BC particles with a greater scattering enhancement, with an increase in core diameter and coating thickness (∼100 nm). The wind directions in Appendix Fig. A2 can shed some light on these features. During the pre-monsoon season, the IGP air mass is transported eastwards, carrying the BC generated in the region into the north-east of India. As a result, there is a similar distribution of scattering enhancement observed across both locations. For the NW India location, however, the wind direction is from the west, receiving air from areas such as the Thar Desert. The BC core diameter (Dc), size distribution, and coated BC (Dp) histogram provide consistency with other findings in our study. During the pre-monsoon season, the BC number and mass BC core size distributions are significantly enhanced in the IGP region compared with the NW and NE regions, which are lower in number and mass. Across the three regions, the peak BC core diameter was similar at ∼182 nm. The coated diameter (Dp) histogram was consistent with the Esca information, with the BC-containing particles over NE India being larger and more coated (0.21 µm) compared to NW India (0.15 µm).
During the monsoon, the NW region was influenced by the monsoon progression, resulting in a reduction in the number of BC particles and to a lesser extent in the scattering enhancement, though small BC particles with very little coating (<50 nm) were again dominant as in the pre-monsoon season. The distribution of Esca for black carbon particles in the IGP region during the monsoon was similar to that of the pre-monsoon season but with much reduced particle numbers indicative of monsoon washout and change of wind direction (see Appendix Fig. A2). Increased scattering enhancements compared to the NW, with moderately coated BC particles (∼100 nm) were observed similar to in the pre-monsoon season. The scattering enhancement values were much different in the north-east with the monsoon arrival. The prevailing wind direction in the region was from the marine environment in the Bay of Bengal with some influence from air masses travelling from middle India and there was little influence from the IGP region. This is reflected in the scattering enhancements, with much lower quantities of moderately coated BC particles, with the environment of Bhubaneswar dominated by small BC particles with small absolute coating thicknesses (<50 nm). The BC core diameter (Dc) size distribution and coated BC (Dp) histogram present changes as the monsoon developed in the regions sampled. For NE India during the monsoon, the BC core diameter mass size distributions are consistent across B971 and B975 (182 nm respectively), with the IGP BC core MMD larger at 210 nm. This is similar to the other IGP BC core diameter mass size distributions for the monsoon transition and monsoon flights, due in part to the consistent wind direction. During B975 compared to B971, however, decreases were seen in the BC mass concentration and core diameter size distribution during the monsoon period, a feature also observed in the BC core diameter number concentrations. The BC coated diameter (Dp) histogram is consistent with this, with the peak in the distribution occurring at a diameter of 0.25 µm in the IGP compared to 0.12 µm for both monsoon flights over NE India. This highlights the stark differences in BC properties between NE India and the central IGP locations.
We have shown that increased scattering enhancements are present over the IGP and NE India during the pre-monsoon season, compared to lower scattering enhancements over all locations during the monsoon season. Instances of high (low) scattering enhancement coincide with large (small) MAC and CT values. We have presented sources similar to those in previous research in our dataset (Liu et al., 2014, 2019), but with clear increased mixing between sources due to the high amounts of secondary aerosol formation and photochemical ageing across northern India.
In the north-west region, the BC properties highlight that the greatest proportion of particles are small in core diameter and thinly coated. These types of BC particles have been shown to be traffic-dominated emissions in previous research (Liu et al., 2014). The north-east of India BC in the monsoon season sees a large proportion from such traffic emissions due to the prevailing wind direction from the Bay of Bengal, meaning that BC particles witnessed are likely to be from the urban environment around Bhubaneswar where the aerosol was sampled. Previous research has highlighted which showed that traffic emissions can form a large proportion of BC particles in east coast regions (Ramachandran, 2005). In the IGP during the pre-monsoon and monsoon seasons, and north-east India during the pre-monsoon season, moderately coated BC particles are present in our analysis. This BC source can be appointed to solid-fuel (wood burning) emissions, as explained in Liu et al. (2014, 2019). Despite monsoon arrival, the IGP BC characteristics remained similar despite some BC removal, with moderately coated BC particles prevailing. This is consistent with the fuel use patterns (including forest fires/biomass-burning episodes) across the IGP at this time of year (Kumar et al., 2011; Vadrevu et al., 2012; Kaskaoutis et al., 2014).
A source of BC that is not presented in the Esca plots across northern India is the large-core-size, thinly coated BC particles (BC core size >180 nm and coating thickness <50 nm). Work by Liu et al. (2019) in China explains that these BC particles have large core diameters with low scattering enhancements and are indicative of coal-burning emissions. These do not appear to be present across northern India during the pre-monsoon and monsoon seasons in significant quantities. A reason could be that the BC particles from coal combustion are different from the China coal emissions in characteristics. Coal-burning characteristics may vary between countries, so more detailed in situ analysis would be required to understand more regarding Indian coal burning. Liu et al. (2019) do explain that this type of BC particle may be uniquely present in urban Beijing, as it is not present in the UK or surrounding areas.
3.3 Mass absorption coefficient
The mass absorption coefficient (MAC) observed for the different regions across northern India is shown in Fig. 2. During the pre-monsoon season, the three locations of NW India, the central IGP, and NE India show distinct MAC properties. In the NW boundary layer, MAC averaged 7.39 m2 g−1 (σ0.36 m2 g−1) compared to 6.76 m2 g−1 (σ0.47 m2 g−1) inside the IGP and 8.08 m2 g−1 (σ0.33 m2 g−1) over NE India. The MAC was lower in the IGP compared to other locations potentially due to the close proximity to the aerosol sources, with the MAC value being high in the NE due to the long-distance transport of IGP aerosol to the NE in the prevailing pre-monsoon flow. A distinct vertical structure in the MAC was observed during the PM. Throughout all locations sampled in northern India, greater MAC values were observed aloft (∼7.5 to 8.5 m2 g−1) compared to the BL (∼6.5 to 7.5 m2 g−1; see Fig. 4). Knox et al. (2009) explain that coatings that build up on BC can act as a lens, focussing light into the BC core, increasing absorption per mass of BC. Also, mixing state is a function of particle age amongst other factors. Aloft over the IGP the BC present will have undergone atmospheric ageing and experienced long-range transport, therefore providing a potential reason for the larger MAC values.
As the monsoon developed, changes in the MAC were evident for some but not all locations. For the NW region, BC MAC was consistent with pre-monsoon values at 7.44 m2 g−1 (σ0.23 m2 g−1), likely due to the lack of full monsoon development in this region and consistency in emission sources, as stated in Brooks et al. (2019). Conversely, the central IGP and NE regions showed significant changes as the monsoon progressed. The MAC in the central IGP increases by 15 % with an average of 7.97 m2 g−1 (σ0.29 m2 g−1) in the monsoon compared to the pre-monsoon values, whereas NE India witnessed decreases in MAC by 17 % to 6.91 m2 g−1 (σ0.38 m2 g−1). During the monsoon the vertical profiles of MAC at the NW India locations and the IGP increased aloft compared to the BL. However, over the NE there was clear removal of aerosol aloft so BC mass concentrations, and therefore MAC values, are only retrieved inside the BL (see Fig. 5).
During the pre-monsoon season, Kompalli et al. (2014) showed that strong thermal convection increases the boundary layer height compared to other seasons, and coupled with high wind speed, results in highly dispersed aerosol particles in both the vertical and horizontal directions, reducing near-surface concentrations. Our observations show that the BC mass concentrations are less than half over NE India than those are in the central IGP during the pre-monsoon season (0.70 and 1.95 µg m−3 respectively), a spatial pattern consistent with Thamban et al. (2017). The IGP BC mass concentrations are elevated somewhat compared to other locations across northern India due to the strength of the emissions sources as well as being in close proximity to the local emissions (Brooks et al., 2019). Our BC mass concentrations are comparable to mean values reported for urban regions, by Kompalli et al. (2019) in north-east India (∼0.8 µg m−3) and Liu et al. (2014) in London (∼1.3 µg m−3), and greater than values in the city of Paris (∼0.9 µg m−3) in Laborde et al. (2013). However, they are much lower than those reported in Chinese cities, such as Beijing (∼5.5 µg m−3; Wu et al., 2016) and Shenzhen (∼4.1 µg m−3; Huang et al., 2012), though the earlier studies are from urban surface sites and not regional aircraft measurements.
Our study provides new information on aerosol absorption over NE India. Previous work by Vaishya et al. (2018) observed moderately high single-scattering albedo (SSA) values (0.8) decreasing with altitude, indicating increased aerosol absorption in the lower free troposphere. BC physical and optical properties are important in the quantification of the aerosol semi-direct effect, with large coating thicknesses and the associated absorption enhancement being particularly implicated (Bond et al., 2013). Larger, thickly coated BC particles with large MAC values over the IGP could have an increased warming potential, affecting the climate impact of BC over northern India, particularly if present at elevated altitudes. Our observations show that thickly coated BC particles are present at high altitudes in the vertical profiles over the IGP and NE India in the pre-monsoon season (see Fig. 5) and are therefore likely to exert a strong warming effect. We observe that the BC layer is associated with an increase in coating thickness, core size, and MAC over NE India during the pre-monsoon season coincident with the larger particles observed by Vaishya et al. (2018). Taken together these observations suggest that solid-fuel burning is the likely source of these BC particles that are subsequently transported long distances from the IGP across to the NE India region. Vaishya et al. (2018) showed that the absorption over Bhubaneswar in the pre-monsoon season was enhanced. However, since their measurements were carried out using an Aethalometer they were unable to account for coating thickness or lensing effects. Liu et al. (2014) showed that enhanced BC coating thickness and increased lensing effects resulted in increased absorption. Our measurements therefore highlight that the absorption occurring over BBA could be of even greater magnitude than those presented by Vaishya et al. (2018).
The scattering enhancement (Esca) results are consistent with the BC optical properties presented, and aid in reinforcing the BC sources outlined. The BC mass absorption coefficient (MAC) is one such optical property that presents consistencies with the Esca and coating thickness. Laborde et al. (2013) explain that MAC is often <7.5 when under strong influence from urban emissions and >8 for aged air masses. During periods where Esca presents strong traffic emission sources, such as in the north-west during pre-monsoon and monsoon seasons and the north-east during the monsoon, the Esca values suggest an urban influence due to the small coating thicknesses on the small-core-diameter BC particles, consistent with MAC values <7.5. Inside the IGP for the pre-monsoon and monsoon seasons, Esca analysis suggests solid-fuel sources of BC with the moderately coated particles and large MAC values. During the shift in air mass direction over the north-east as the monsoon progresses, the BC optical properties change as the Esca undergoes changes with the aerosol aloft removed. Rather than an air mass arriving over north-east India from the north-west travelling through the IGP, south-easterly winds from the marine background of the Bay of Bengal prevailed; therefore the aerosol measured over north-east India was likely to be from local urban emission sources. This could explain the reduction in MAC from aged air mass values (>8) to more urban emissions (<7.5), the reduction in core diameter, and reduced coating thickness, all indicative of urban traffic emissions (Laborde et al., 2013). The BC optical properties also prove useful for identifying the solid-fuel-burning BC particles over the IGP, consistent with previous literature where wood-burning stoves, open fires, and agricultural-residue-based stoves are known to be widespread across the IGP (Banerjee et al., 2015; Paliwal et al., 2016; Singh et al., 2017; Fleming et al., 2018). Solid fuel, as outlined by Liu et al. (2014), is characteristic of larger core sizes, thicker coating thicknesses, and larger MAC values. All these features listed are present in the IGP, as shown in Figs. 2 and 3, for the pre-monsoon and monsoon seasons, producing the large proportion of solid-fuel BC particles.
Most previous studies analysing BC properties and characteristics over India have been based on analysis of satellite data, ground-based remote sensing, or climate model simulations. However, there is currently large model-to-model variability suggestive of considerable uncertainty in model aerosol representation. A model comparison carried out by Myhre et al. (2013) found a wide range of direct radiative forcing scenarios in modelling efforts. It was concluded that this ambiguity arose from uncertainty behind the vertical distribution of aerosol, especially absorbing aerosol, and its distribution relative to cloud cover. In addition to large model-to-model variability, model analysis when compared to observational studies has shown underprediction of various variables over India. It has been found that BC mass concentrations and radiative forcing estimates need significant adjustments in model work (Bond et al., 2013), and aerosol optical depth (AOD) values are often underestimated by models (Govardhan et al., 2019; Xian et al., 2019) and when compared to remote sensing studies (Pan et al., 2015). The work of this paper builds upon recent experimental data on the mixing state of BC from the eastern coast of India from Kompalli et al. (2019) and includes new information on BC throughout northern India. By providing high-temporal- and high-spatial-resolution data for the pre-monsoon and monsoon seasons, future model work will have better informed mass concentrations and mixing state information. The data also help improve understanding of regional BC characteristics and their climate implications.
The observations of the physical properties of atmospheric black carbon in India presented in this work are the first of their kind over the Indian subcontinent but the results are consistent and build upon previous understanding regarding BC properties over northern India. An aircraft campaign was conducted from 11 June to 11 July 2016 to characterise black carbon optical and physical properties, during both the pre-monsoon and monsoon seasons. The study represented the north-west, central IGP, and north-east of India across the two seasons. Exhaustive measurements of the black carbon mass concentration, mixing state, and source properties were carried out. As we move from outside to inside the IGP, the BC mass concentrations increase from 0.70 µg m−3 in the north-east and 1.50 µg m−3 in the north-west to 1.95 µg m−3 in the IGP region. As the monsoon progressed over northern India, BC mass concentration decreased over the IGP and north-east India (by 38 % and 28 % respectively), except for north-west India where mass concentrations remained relatively consistent.
BC aerosol across the IGP presented thinly coated particles (1.65), core size (0.25 µm), and mass absorption coefficient (6.76 m2 g−1), indicative of solid-fuel-burning particles. In the north-east the BC particles display small core sizes (0.20 µm) and moderately coated particles (1.82). In the north-west, however, the BC particles are small (0.22 µm) with moderate coating (1.70) and a low mass absorption coefficient (7.39), suggestive of traffic emissions. As the monsoon progressed over northern India, alterations in the atmospheric BC properties were witnessed. Over the north-east region, BC underwent changes to small particles (0.20 µm) with very little coating (1.60), mainly due to a switch in wind direction from the Bay of Bengal, resulting in very few solid-fuel particles being transported from the IGP compared to the pre-monsoon season. The IGP presented moderately coated BC particles (2.0) showing solid-fuel sources into the monsoon season due to strong emission sources, with the north-west dominated by small BC particles (0.20 µm) from traffic sources consistent with the pre-monsoon environment. Vertical structure was found in the BC properties with the coating thickness and mass absorption cross section increasing by 13 % with altitude compared to the boundary layer across northern India, during the pre-monsoon and monsoon seasons. Relating this to previous research highlights the large absorption potential of the BC aerosol over northern India, especially aloft.
The spatial distribution of black carbon properties has been characterised here based upon airborne measurements throughout the vertical column across northern India, during the pre-monsoon and monsoon seasons. Aerosol source analysis in the literature can provide useful context for the black carbon presented. As Brooks et al. (2019) explain, across the IGP the residential sector provides the greatest particulate emissions, over double the emissions from large industry and transport (Pandey et al., 2014). Black carbon aerosol (kerosene lamps, woodstoves, and agricultural-residue-based stoves) is known to arise largely from residential fuel-burning activities (Fleming et al., 2018), consistent with our findings as these practices are seen widely across the IGP region where BC mass concentrations are greatest and reflect solid-fuel-type emissions.
This BC source information, coupled with the extensive in situ measurements, will prove pivotal in improving understanding of potential radiative forcing from BC-containing particles over India and emission inventory work.
Processed data are available through the SWAAMI and parent FAAM archives at the Centre for Environmental Data Analysis (CEDA) (http://data.ceda.ac.uk/badc/faam, last access: 21 October 2019, FAAM, 2016).

Figure A1Advance of the Indian summer monsoon of 2016 (India Meteorological Department, Ministry of Earth Sciences, India).
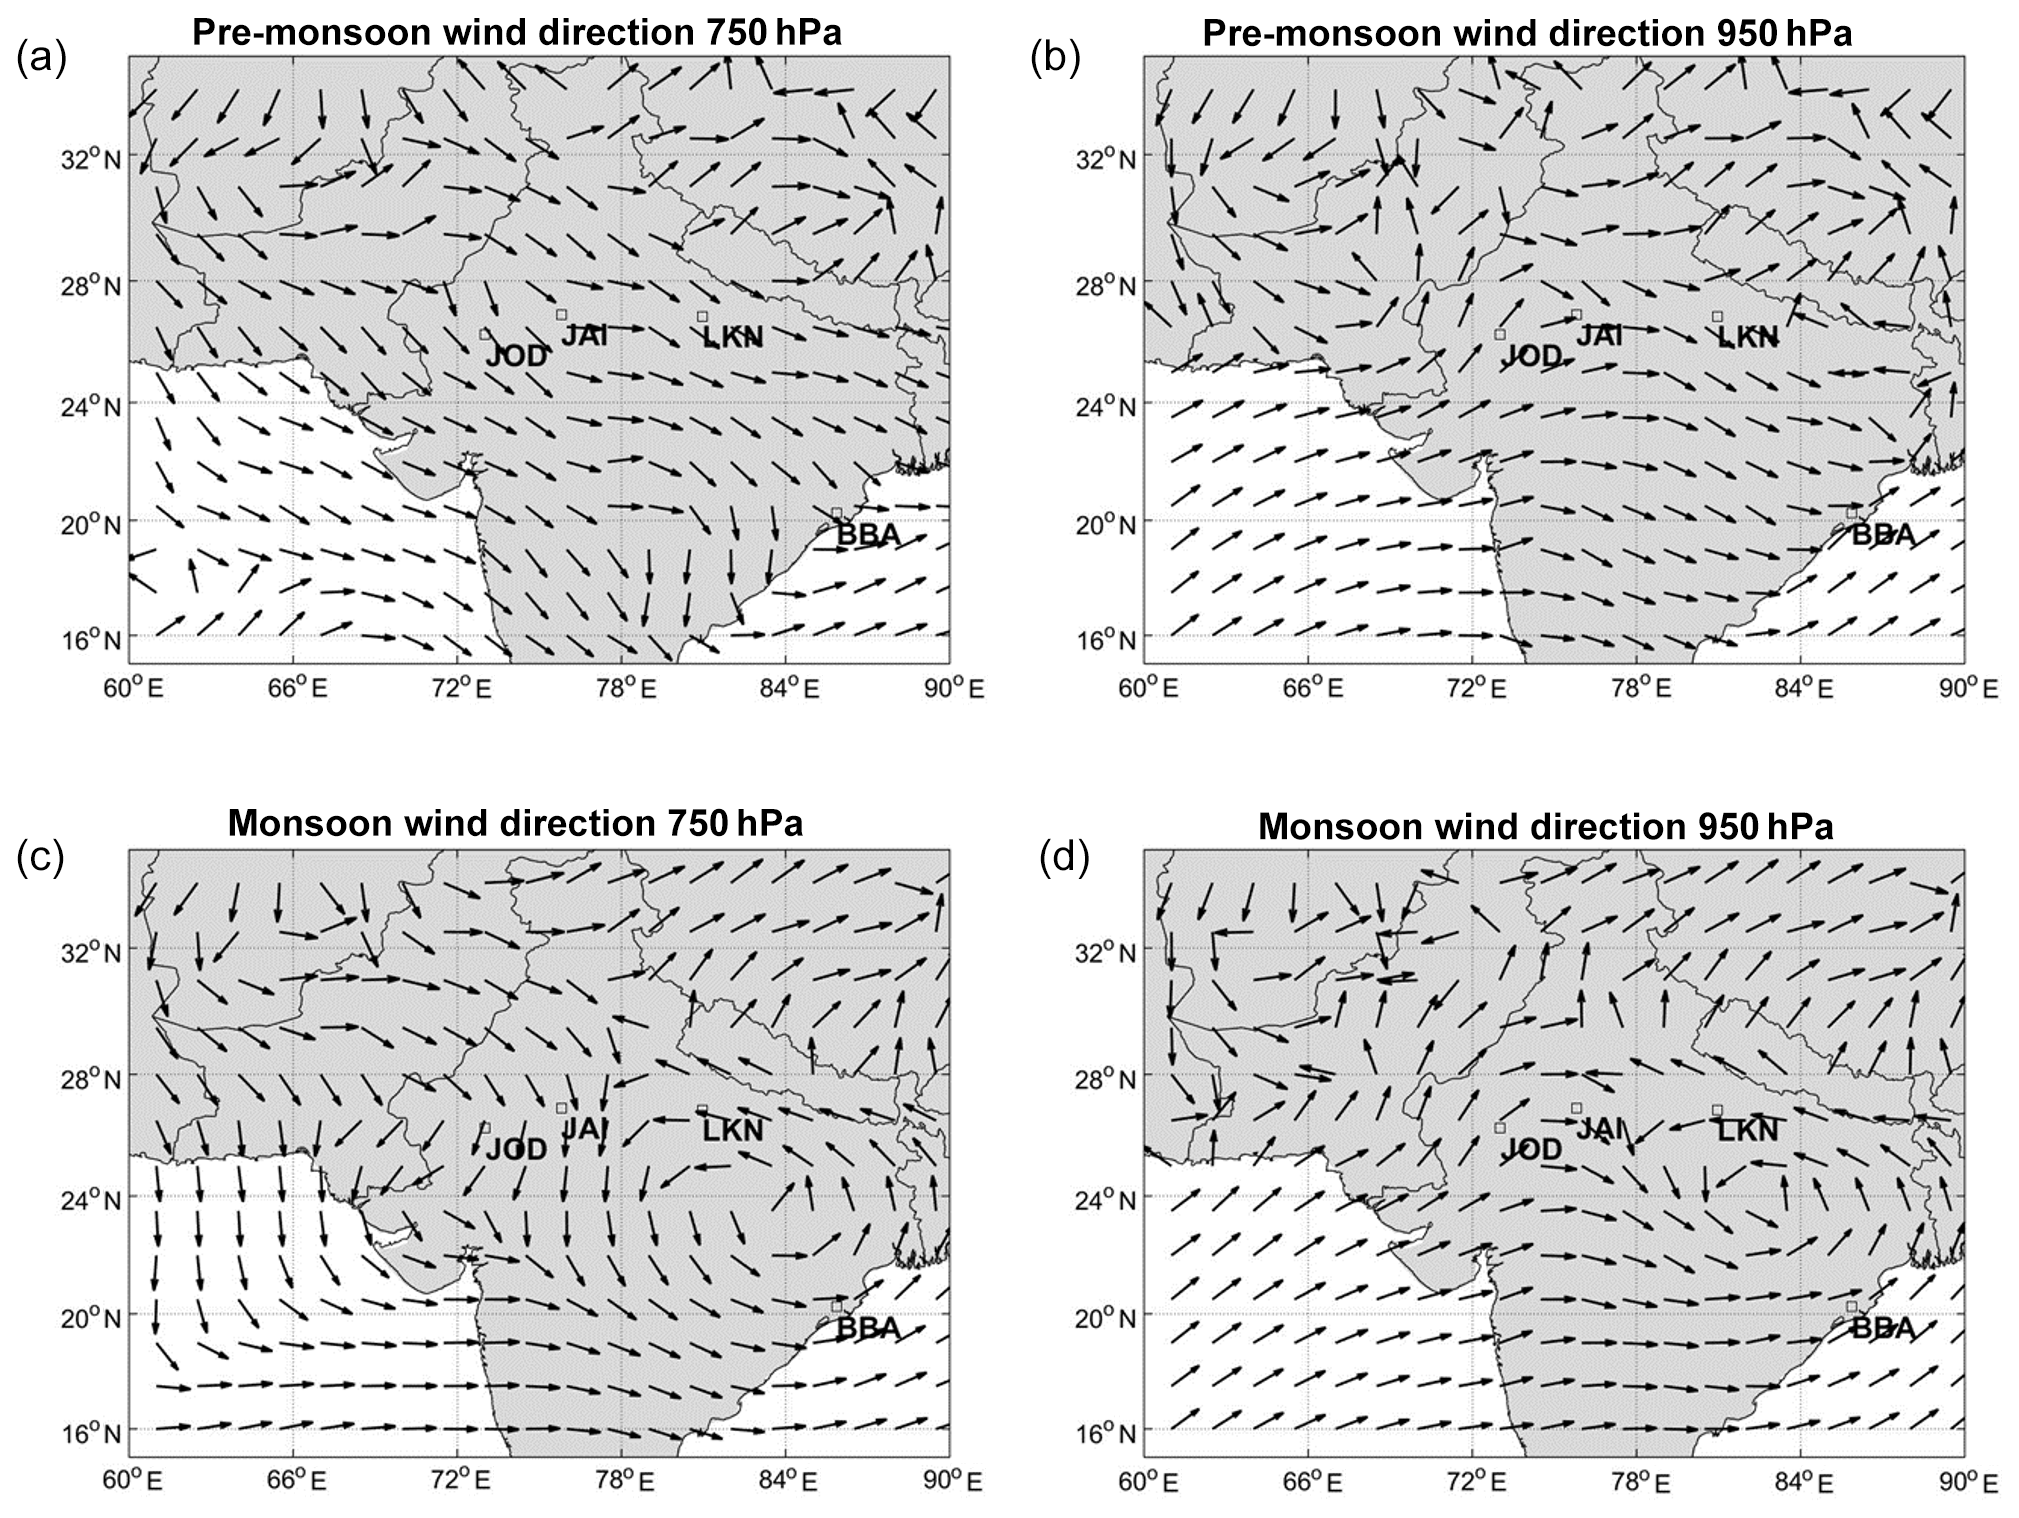
Figure A2Mean wind direction conditions during the pre-monsoon (a, b) and monsoon seasons (c, d). The data used in the maps are from ERA-Interim (Dee et al., 2011).
JB was responsible for the SP2 instrument operation in the field, data processing, data analysis, and the writing of this paper. HC contributed to the writing of the paper. JDA and PIW were responsible for the maintenance and running of the AMS prior to and during the campaign. DL supplied expertise and operation of the SP2 prior to and during the campaign and assisted with the data analysis. SKK also contributed to the operation of the SP2 in the field. JH, EJH, SSB, SKS, AGT, and HC were the project investigators for this campaign.
The authors declare that they have no conflict of interest.
This article is part of the special issue “Interactions between aerosols and the South West Asian monsoon”. It is not associated with a conference.
We would like to thank those involved in the SWAAMI project, which is part of the larger MONSOON project. This includes the Facility for Airborne Atmospheric Measurements (FAAM) and Airtask, who manage and operate the BAe-146 Atmospheric Research Aircraft, which is jointly funded by the Natural Environmental Research Council (NERC) and the Met Office. SWAAMI conducted a major aircraft study of aerosol properties across the Indo-Gangetic Plain and northern Bay of Bengal immediately before the monsoon onset (May 2016) and during its development (June 2016), to determine the key aerosol physical and chemical properties and assess their spatial distribution. Bringing these together provides an improved characterisation of aerosol pollution across India. SWAAMI will also seek to quantify the radiative effect of aerosol across the region, to allow testing of model predictions against in situ measurements. Aircraft, ground-based, and satellite platforms were utilised during SWAAMI. A number of institutions were involved in logistics, planning, and support of the MONSOON campaign: the Met Office, University of Reading, Vikram Sarabhai Space Centre India, and the Indian Institute of Science India. ERA-Interim wind field data were provided courtesy of ECMWF.
This research has been supported by the NERC (grant nos. NE/L002469/1, NE/L013886/1, NR/L01386X/1, and NE/P003117/1).
This paper was edited by B. V. Krishna Murthy and reviewed by two anonymous referees.
Banerjee, T., Murari, V., Kumar, M., and Raju, M. P.: Source apportionment of airborne particulates through receptor modeling: Indian scenario, Atmos. Res., 164, 167–187, 2015.
Bansal, O., Singh, A., and Singh, D.: Characteristics of Black Carbon aerosols over Patiala Northwestern part of the IGP: Source apportionment using cluster and CWT analysis, Atmos. Pollut. Res., 10, 244–256, https://doi.org/10.1016/j.apr.2018.08.001, 2018.
Baumgardner, D., Popovicheva, O., Allan, J., Bernardoni, V., Cao, J., Cavalli, F., Cozic, J., Diapouli, E., Eleftheriadis, K., Genberg, P. J., Gonzalez, C., Gysel, M., John, A., Kirchstetter, T. W., Kuhlbusch, T. A. J., Laborde, M., Lack, D., Müller, T., Niessner, R., Petzold, A., Piazzalunga, A., Putaud, J. P., Schwarz, J., Sheridan, P., Subramanian, R., Swietlicki, E., Valli, G., Vecchi, R., and Viana, M.: Soot reference materials for instrument calibration and intercomparisons: a workshop summary with recommendations, Atmos. Meas. Tech., 5, 1869–1887, https://doi.org/10.5194/amt-5-1869-2012, 2012.
Bohren, C. F. and Huffman, D. R.: Absorption and scattering of light by small particles, John Wiley & Sons, USA, 2008.
Bond, T. C. and Bergstrom, R. W.: Light absorption by carbonaceous particles: An investigative review, Aerosol Sci. Technol., 40, 27–67, 2006.
Bond, T. C., Doherty, S. J., Fahey, D. W., Forster, P. M., Berntsen, T., Deangelo, B. J., and Zender, C. S.: Bounding the role of black carbon in the climate system: A scientific assessment, J. Geophys. Res.-Atmos., 118, 5380–5552, https://doi.org/10.1002/jgrd.50171, 2013.
Brooks, J., Allan, J. D., Williams, P. I., Liu, D., Fox, C., Haywood, J., Langridge, J. M., Highwood, E. J., Kompalli, S. K., O'Sullivan, D., Babu, S. S., Satheesh, S. K., Turner, A. G., and Coe, H.: Vertical and horizontal distribution of submicron aerosol chemical composition and physical characteristics across northern India during pre-monsoon and monsoon seasons, Atmos. Chem. Phys., 19, 5615–5634, https://doi.org/10.5194/acp-19-5615-2019, 2019.
Crippa, M., Canonaco, F., Lanz, V. A., Äijälä, M., Allan, J. D., Carbone, S., Capes, G., Ceburnis, D., Dall'Osto, M., Day, D. A., DeCarlo, P. F., Ehn, M., Eriksson, A., Freney, E., Hildebrandt Ruiz, L., Hillamo, R., Jimenez, J. L., Junninen, H., Kiendler-Scharr, A., Kortelainen, A.-M., Kulmala, M., Laaksonen, A., Mensah, A. A., Mohr, C., Nemitz, E., O'Dowd, C., Ovadnevaite, J., Pandis, S. N., Petäjä, T., Poulain, L., Saarikoski, S., Sellegri, K., Swietlicki, E., Tiitta, P., Worsnop, D. R., Baltensperger, U., and Prévôt, A. S. H.: Organic aerosol components derived from 25 AMS data sets across Europe using a consistent ME-2 based source apportionment approach, Atmos. Chem. Phys., 14, 6159–6176, https://doi.org/10.5194/acp-14-6159-2014, 2014.
Dee, D. P., Uppala, S. M., Simmons, A. J., Berrisford, P., Poli, P., Kobayashi, S., Andrae, U., Balmaseda, M. A., Balsamo, G., Bauer, D. P., and Bechtold, P.: The ERA-Interim reanalysis: Configuration and performance of the data assimilation system, Q. J. Roy. Meteor. Soc., 137, 553–597, 2011.
Fleming, L. T., Lin, P., Laskin, A., Laskin, J., Weltman, R., Edwards, R. D., Arora, N. K., Yadav, A., Meinardi, S., Blake, D. R., Pillarisetti, A., Smith, K. R., and Nizkorodov, S. A.: Molecular composition of particulate matter emissions from dung and brushwood burning household cookstoves in Haryana, India, Atmos. Chem. Phys., 18, 2461–2480, https://doi.org/10.5194/acp-18-2461-2018, 2018.
Gao, R. S., Schwarz, J. P., Kelly, K. K., Fahey, D. W., Watts, L. A., Thompson, T. L., Spackman, J. R., Slowik, J. G., Cross, E. S., Han, J. H., Davidovits, P., Onasch, T. B., and Worsnop, D. R.: A novel method for estimating light-scattering properties of soot aerosols using a modified single-particle soot photometer, Aerosol Sci. Technol., 41, 125–135, 2007.
Gautam, R., Liu, Z., Singh, R. P., and Hsu, N. C.: Two contrasting dust-dominant periods over India observed from MODIS and CALIPSO data, Geophys. Res. Lett., 36, https://doi.org/10.1029/2008GL036967, 2009.
Govardhan, G., Satheesh, S. K., Moorthy, K. K., and Nanjundiah, R.: Simulations of black carbon over the Indian region: improvements and implications of diurnality in emissions, Atmos. Chem. Phys., 19, 8229–8241, https://doi.org/10.5194/acp-19-8229-2019, 2019.
Herich, H., Hueglin, C., and Buchmann, B.: A 2.5 year's source apportionment study of black carbon from wood burning and fossil fuel combustion at urban and rural sites in Switzerland, Atmos. Meas. Tech., 4, 1409–1420, https://doi.org/10.5194/amt-4-1409-2011, 2011.
Herich, H., Gianini, M. F. D., Piot, C., Mocnik, G., Jaffrezo, J.-L., Besombes, J.-L., Prévôt, A. S. H., and Hueglin, C.: Overview of the impact of wood burning emissions on carbonaceous aerosols and PM in large parts of the Alpine region, Atmos. Environ., 89, 64–75, 2014.
Huang, X. F., Sun, T. L., Zeng, L. W., Yu, G. H., and Luan, S. J.: Black carbon aerosol characterization in a coastal city in South China using a single particle soot photometer, Atmos. Environ., 51, 21–28, https://doi.org/10.1016/j.atmosenv.2012.01.056, 2012.
IPCC: Climate Change 2013: The Physical Science Basis. Contribution of Working Group I to the Fifth Assessment Report of the Intergovernmental Panel on Climate Change, United Kingdom and New York, 1535 pp., 2013.
Jansen, K. L., Larson, T. V., Koenig, J. Q., Mar, T. F., Fields, C., Stewart, J., and Lippmann, M.: Associations between health effects and particulate matter and black carbon in subjects with respiratory disease, Environ. Health Persp., 113, 1741–1746, 2005.
Kaskaoutis, D. G., Kumar, S., Sharma, D., Singh, R. P., Kharol, S. K., Sharma, M., Singh, A. K., Singh, S., Singh, A., and Singh, D.: Effects of crop residue burning on aerosol properties, plume characteristics, and long-range transport over northern India, J. Geophys. Res.-Atmos., 119, 5424–5444, 2014.
Knox, A., Evans, G. J., Brook, J. R., Yao, X., Jeong, C. H., Godri, K. J., Sabaliauskas, K., and Slowik, J. G.: Mass absorption cross-section of ambient black carbon aerosol in relation to chemical age, Aerosol Sci. Technol., 43, 522–532, 2009.
Koch, D., Schulz, M., Kinne, S., McNaughton, C., Spackman, J. R., Balkanski, Y., Bauer, S., Berntsen, T., Bond, T. C., Boucher, O., Chin, M., Clarke, A., De Luca, N., Dentener, F., Diehl, T., Dubovik, O., Easter, R., Fahey, D. W., Feichter, J., Fillmore, D., Freitag, S., Ghan, S., Ginoux, P., Gong, S., Horowitz, L., Iversen, T., Kirkevåg, A., Klimont, Z., Kondo, Y., Krol, M., Liu, X., Miller, R., Montanaro, V., Moteki, N., Myhre, G., Penner, J. E., Perlwitz, J., Pitari, G., Reddy, S., Sahu, L., Sakamoto, H., Schuster, G., Schwarz, J. P., Seland, Ø., Stier, P., Takegawa, N., Takemura, T., Textor, C., van Aardenne, J. A., and Zhao, Y.: Evaluation of black carbon estimations in global aerosol models, Atmos. Chem. Phys., 9, 9001–9026, https://doi.org/10.5194/acp-9-9001-2009, 2009.
Kompalli, S. K., Babu, S. S., Moorthy, K. K., Manoj, M. R., Kumar, N. K., Shaeb, K. H. B., and Joshi, A. K.: Aerosol black carbon characteristics over Central India: Temporal variation and its dependence on mixed layer height, Atmos. Res., 147, 27–37, 2014.
Kompalli, S. K., Suresh Babu, S. N., Satheesh, S. K., Krishna Moorthy, K., Das, T., Boopathy, R., Liu, D., Darbyshire, E., Allan, J., Brooks, J., Flynn, M., and Coe, H.: Seasonal contrast in size distributions and mixing state of black carbon and its association with PM1.0 chemical composition from the eastern coast of India, Atmos. Chem. Phys. Discuss., https://doi.org/10.5194/acp-2019-376, in review, 2019.
Kumar, R., Naja, M., Satheesh, S. K., Ojha, N., Joshi, H., Sarangi, T., Pant, P., Dumka, U. C., Hegde, P., and Venkataramani, S.: Influences of the springtime northern Indian biomass burning over the central Himalayas, J. Geophys. Res.-Atmos., 116, D19, https://doi.org/10.1029/2010JD015509, 2011.
Kumar, M., Parmar, K. S., Kumar, D. B., Mhawish, A., Broday, D. M., Mall, R. K., and Banerjee, T.: Long-term aerosol climatology over Indo-Gangetic Plain: Trend, prediction and potential source fields, Atmos. Environ., 180, 37–50, 2018.
Laborde, M., Mertes, P., Zieger, P., Dommen, J., Baltensperger, U., and Gysel, M.: Sensitivity of the Single Particle Soot Photometer to different black carbon types, Atmos. Meas. Tech., 5, 1031–1043, https://doi.org/10.5194/amt-5-1031-2012, 2012.
Laborde, M., Crippa, M., Tritscher, T., Jurányi, Z., Decarlo, P. F., Temime-Roussel, B., Marchand, N., Eckhardt, S., Stohl, A., Baltensperger, U., Prévôt, A. S. H., Weingartner, E., and Gysel, M.: Black carbon physical properties and mixing state in the European megacity Paris, Atmos. Chem. Phys., 13, 5831–5856, https://doi.org/10.5194/acp-13-5831-2013, 2013.
Lawrence, M. G., Butler, T. M., Steinkamp, J., Gurjar, B. R., and Lelieveld, J.: Regional pollution potentials of megacities and other major population centers, Atmos. Chem. Phys., 7, 3969–3987, https://doi.org/10.5194/acp-7-3969-2007, 2007.
Lee, Y. H., Lamarque, J.-F., Flanner, M. G., Jiao, C., Shindell, D. T., Berntsen, T., Bisiaux, M. M., Cao, J., Collins, W. J., Curran, M., Edwards, R., Faluvegi, G., Ghan, S., Horowitz, L. W., McConnell, J. R., Ming, J., Myhre, G., Nagashima, T., Naik, V., Rumbold, S. T., Skeie, R. B., Sudo, K., Takemura, T., Thevenon, F., Xu, B., and Yoon, J.-H.: Evaluation of preindustrial to present-day black carbon and its albedo forcing from Atmospheric Chemistry and Climate Model Intercomparison Project (ACCMIP), Atmos. Chem. Phys., 13, 2607–2634, https://doi.org/10.5194/acp-13-2607-2013, 2013.
Liu, D., Quennehen, B., Darbyshire, E., Allan, J. D., Williams, P. I., Taylor, J. W., Bauguitte, S. J.-B., Flynn, M. J., Lowe, D., Gallagher, M. W., Bower, K. N., Choularton, T. W., and Coe, H.: The importance of Asia as a source of black carbon to the European Arctic during springtime 2013, Atmos. Chem. Phys., 15, 11537–11555, https://doi.org/10.5194/acp-15-11537-2015, 2015.
Liu, D., Flynn, M., Gysel, M., Targino, A., Crawford, I., Bower, K., Choularton, T., Jurányi, Z., Steinbacher, M., Hüglin, C., Curtius, J., Kampus, M., Petzold, A., Weingartner, E., Baltensperger, U., and Coe, H.: Single particle characterization of black carbon aerosols at a tropospheric alpine site in Switzerland, Atmos. Chem. Phys., 10, 7389–7407, https://doi.org/10.5194/acp-10-7389-2010, 2010.
Liu, D., Allan, J., Corris, B., Flynn, M., Andrews, E., Ogren, J., Beswick, K., Bower, K., Burgess, R., Choularton, T., Dorsey, J., Morgan, W., Williams, P. I., and Coe, H.: Carbonaceous aerosols contributed by traffic and solid fuel burning at a polluted rural site in Northwestern England, Atmos. Chem. Phys., 11, 1603–1619, https://doi.org/10.5194/acp-11-1603-2011, 2011.
Liu, D., Allan, J. D., Young, D. E., Coe, H., Beddows, D., Fleming, Z. L., Flynn, M. J., Gallagher, M. W., Harrison, R. M., Lee, J., Prevot, A. S. H., Taylor, J. W., Yin, J., Williams, P. I., and Zotter, P.: Size distribution, mixing state and source apportionment of black carbon aerosol in London during wintertime, Atmos. Chem. Phys., 14, 10061–10084, https://doi.org/10.5194/acp-14-10061-2014, 2014.
Liu, D., Whitehead, J., Alfarra, M. R., Reyes-Villegas, E., Spracklen, D. V., Reddington, C. L., Kong, S., Williams, P. I., Ting, Y. C., Haslett, S., and Taylor, J. W.: Black-carbon absorption enhancement in the atmosphere determined by particle mixing state, Nat. Geosci., 10, 184–188, 2017.
Liu, D., Taylor, J. W., Crosier, J., Marsden, N., Bower, K. N., Lloyd, G., Ryder, C. L., Brooke, J. K., Cotton, R., Marenco, F., Blyth, A., Cui, Z., Estelles, V., Gallagher, M., Coe, H., and Choularton, T. W.: Aircraft and ground measurements of dust aerosols over the west African coast in summer 2015 during ICE-D and AER-D, Atmos. Chem. Phys., 18, 3817–3838, https://doi.org/10.5194/acp-18-3817-2018, 2018.
Liu, D., Joshi, R., Wang, J., Yu, C., Allan, J. D., Coe, H., Flynn, M. J., Xie, C., Lee, J., Squires, F., Kotthaus, S., Grimmond, S., Ge, X., Sun, Y., and Fu, P.: Contrasting physical properties of black carbon in urban Beijing between winter and summer, Atmos. Chem. Phys., 19, 6749–6769, https://doi.org/10.5194/acp-19-6749-2019, 2019.
Marinoni, A., Cristofanelli, P., Laj, P., Duchi, R., Calzolari, F., Decesari, S., Sellegri, K., Vuillermoz, E., Verza, G. P., Villani, P., and Bonasoni, P.: Aerosol mass and black carbon concentrations, a two year record at NCO-P (5079 m, Southern Himalayas), Atmos. Chem. Phys., 10, 8551–8562, https://doi.org/10.5194/acp-10-8551-2010, 2010.
McMeeking, G. R., Hamburger, T., Liu, D., Flynn, M., Morgan, W. T., Northway, M., Highwood, E. J., Krejci, R., Allan, J. D., Minikin, A., and Coe, H.: Black carbon measurements in the boundary layer over western and northern Europe, Atmos. Chem. Phys., 10, 9393–9414, https://doi.org/10.5194/acp-10-9393-2010, 2010.
Moorthy, K. K., Beegum, S. N., Srivastava, N., Satheesh, S. K., Chin, M., Blond, N., Babu, S. S., and Singh, S.: Performance evaluation of chemistry transport models over India, Atmos. Environ., 71, 210–225, 2013.
Mordukhovich, I., Wilker, E. H., Suh, H., Wright, R. O., Sparrow, D., Vokonas, P. S., and Schwartz, J.: Black carbon exposure, oxidative stress genes, and blood pressure in a repeated measures study, Environ. Health Persp., 117, 1767–1772, 2009.
Moteki, N. and Kondo, Y.: Dependence of Laser-Induced Incandescence on physical properties of black carbon aerosols: measurements and theoretical interpretation, Aerosol Sci. Technol., 44, 663–675, 2010.
Moteki, N., Kondo, Y., and Nakamura, S.: Method to measure refractive indices of small nonspherical particles: application to black carbon particles, J. Aerosol. Sci., 41, 513–521, 2010.
Myhre, G., Samset, B. H., Schulz, M., Balkanski, Y., Bauer, S., Berntsen, T. K., Bian, H., Bellouin, N., Chin, M., Diehl, T., Easter, R. C., Feichter, J., Ghan, S. J., Hauglustaine, D., Iversen, T., Kinne, S., Kirkevåg, A., Lamarque, J.-F., Lin, G., Liu, X., Lund, M. T., Luo, G., Ma, X., van Noije, T., Penner, J. E., Rasch, P. J., Ruiz, A., Seland, Ø., Skeie, R. B., Stier, P., Takemura, T., Tsigaridis, K., Wang, P., Wang, Z., Xu, L., Yu, H., Yu, F., Yoon, J.-H., Zhang, K., Zhang, H., and Zhou, C.: Radiative forcing of the direct aerosol effect from AeroCom Phase II simulations, Atmos. Chem. Phys., 13, 1853–1877, https://doi.org/10.5194/acp-13-1853-2013, 2013.
Paliwal, U., Sharma, M., and Burkhart, J. F.: Monthly and spatially resolved black carbon emission inventory of India: uncertainty analysis, Atmos. Chem. Phys., 16, 12457–12476, https://doi.org/10.5194/acp-16-12457-2016, 2016.
Pan, X., Chin, M., Gautam, R., Bian, H., Kim, D., Colarco, P. R., Diehl, T. L., Takemura, T., Pozzoli, L., Tsigaridis, K., Bauer, S., and Bellouin, N.: A multi-model evaluation of aerosols over South Asia: common problems and possible causes, Atmos. Chem. Phys., 15, 5903–5928, https://doi.org/10.5194/acp-15-5903-2015, 2015.
Pandey, A., Sadavarte, P., Rao, A. B., and Venkataraman, C.: Trends in multi-pollutant emissions from a technology-linked inventory for India: II. Residential, agricultural and informal industry sectors, Atmos. Environ., 99, 341–352, https://doi.org/10.1016/j.atmosenv.2014.09.080, 2014.
Pawar, H., Garg, S., Kumar, V., Sachan, H., Arya, R., Sarkar, C., Chandra, B. P., and Sinha, B.: Quantifying the contribution of long-range transport to particulate matter (PM) mass loadings at a suburban site in the north-western Indo-Gangetic Plain (NW-IGP), Atmos. Chem. Phys., 15, 9501–9520, https://doi.org/10.5194/acp-15-9501-2015, 2015.
Petzold, A., Ogren, J. A., Fiebig, M., Laj, P., Li, S.-M., Baltensperger, U., Holzer-Popp, T., Kinne, S., Pappalardo, G., Sugimoto, N., Wehrli, C., Wiedensohler, A., and Zhang, X.-Y.: Recommendations for reporting “black carbon” measurements, Atmos. Chem. Phys., 13, 8365–8379, https://doi.org/10.5194/acp-13-8365-2013, 2013.
Raatikainen, T., Brus, D., Hooda, R. K., Hyvärinen, A.-P., Asmi, E., Sharma, V. P., Arola, A., and Lihavainen, H.: Size-selected black carbon mass distributions and mixing state in polluted and clean environments of northern India, Atmos. Chem. Phys., 17, 371–383, https://doi.org/10.5194/acp-17-371-2017, 2017.
Ramachandran, S.: Aerosol radiative forcing over Bay of Bengal and Chennai: Comparison with maritime, continental, and urban aerosol models, J. Geophys. Res.-Atmos., 110, 1–9, https://doi.org/10.1029/2005JD005861, 2005.
Rana, A., Jia, S., and Sarkar, S.: Black carbon aerosol in India: A comprehensive review of current status and future prospects, Atmos. Res., 218, 207–230, https://doi.org/10.1016/j.atmosres.2018.12.002, 2019.
Schnaiter, M., Linke, C., Mohler, O., Naumann, K.H., Saathoff, H., Wagner, R., Schurath, U., and Wehner, B.: Absorption amplification of black carbon internally mixed with secondary organic aerosol. J. Geophys. Res., 110, D19204, https://doi.org/10.1029/2005JD006046, 2005.
Schnell, J. L., Naik, V., Horowitz, L. W., Paulot, F., Mao, J., Ginoux, P., Zhao, M., and Ram, K.: Exploring the relationship between surface PM2.5 and meteorology in Northern India, Atmos. Chem. Phys., 18, 10157–10175, https://doi.org/10.5194/acp-18-10157-2018, 2018.
Singh, N., Mhawish, A., Deboudt, K., Singh, R. S., and Banerjee, T.: Organic aerosols over Indo-Gangetic Plain: Sources, distributions and climatic implications, Atmos. Environ., 157, 69–74, https://doi.org/10.1016/j.atmosenv.2017.03.008, 2017.
Taylor, J. W., Allan, J. D., Allen, G., Coe, H., Williams, P. I., Flynn, M. J., Le Breton, M., Muller, J. B. A., Percival, C. J., Oram, D., Forster, G., Lee, J. D., Rickard, A. R., Parrington, M., and Palmer, P. I.: Size-dependent wet removal of black carbon in Canadian biomass burning plumes, Atmos. Chem. Phys., 14, 13755–13771, https://doi.org/10.5194/acp-14-13755-2014, 2014.
Thamban, N. M., Tripathi, S. N., Moosakutty, S. P., Kuntamukkala, P., and Kanawade, V. P.: Internally mixed black carbon in the Indo-Gangetic Plain and its effect on absorption enhancement, Atmos. Res., 197, 211–223, 2017.
Vadrevu, K. P., Ellicott, E., Giglio, L., Badarinath, K. V. S., Vermote, E., Justice, C., and Lau, W. K.: Vegetation fires in the himalayan region–Aerosol load, black carbon emissions and smoke plume heights, Atmos. Environ., 47, 241–251, 2012.
Vaishya, A., Babu, S. N. S., Jayachandran, V., Gogoi, M. M., Lakshmi, N. B., Moorthy, K. K., and Satheesh, S. K.: Large contrast in the vertical distribution of aerosol optical properties and radiative effects across the Indo-Gangetic Plain during the SWAAMI–RAWEX campaign, Atmos. Chem. Phys., 18, 17669–17685, https://doi.org/10.5194/acp-18-17669-2018, 2018.
Wu, Y., Zhang, R., Tian, P., Tao, J., Hsu, S.-C., Yan, P., Wang, Q., Cao, J., Zhang, X., and Xia, X.: Effect of ambient humidity on the light absorption amplification of black carbon in Beijing during January 2013, Atmos. Environ., 124, 217–223, https://doi.org/10.1016/j.atmosenv.2015.04.041, 2016.
Xian, P., Reid, J. S., Hyer, E. J., Sampson, C. R., Rubin, J. I., Ades, M., Asencio, N., Basart, S., Benedetti, A., Bhattacharjee, P. S., and Brooks, M. E.: Current state of the global operational aerosol multi‐model ensemble: An update from the International Cooperative for Aerosol Prediction (ICAP), Q. J. Roy. Meteor. Soc., 145, 176–209, https://doi.org/10.1002/qj.3497, 2019.