the Creative Commons Attribution 4.0 License.
the Creative Commons Attribution 4.0 License.
 | 18 Oct 2019
Quantitative impacts of meteorology and precursor emission changes on the long-term trend of ambient ozone over the Pearl River Delta, China, and implications for ozone control strategy
Leifeng Yang
Huihong Luo
Zibing Yuan
Junyu Zheng
Zhijiong Huang
Cheng Li
Xiaohua Lin
Peter K. K. Louie
Duohong Chen
Yahui Bian
China is experiencing increasingly serious ambient ozone pollution, including the economically developed Pearl River Delta (PRD) region. However, the underlying reasons for the ozone increase remain largely unclear, leading to perplexity regarding formulating effective ozone control strategies. In this study, we quantitatively examine the impacts of meteorology and precursor emissions from within and outside of the PRD on the evolution of ozone during the past decade by developing a statistical analysis framework combining meteorological adjustment and source apportionment. We found that meteorological conditions mitigated ozone increase, and that their variation can account for a maximum of 15 % of the annual ozone concentration in the PRD. Precursor emissions from outside the PRD (“nonlocal”) have the largest contribution to ambient ozone in the region and show a consistently increasing trend, whereas emissions from within the PRD (“local”) show a significant spatial heterogeneity and play a more important role during ozone episodes over the southwest of the region. Under general conditions, the impact on the northeastern PRD is positive but decreasing, and in the southwest it is negative but increasing. During ozone episodes, the impact on the northeastern PRD is negative and decreasing, whereas in the southwestern PRD it is positive but decreasing. The central and western PRD are the only areas with an increasing local ozone contribution. The spatial heterogeneity in both the local ozone contribution and its trend under general conditions and during ozone episodes is well interpreted by a conceptual diagram that collectively takes ozone precursor emissions and their changing trends, ozone formation regimes, and the monsoonal and microscale synoptic conditions over different subregions of the PRD into consideration. In particular, we conclude that an inappropriate NOx∕VOC control ratio within the PRD over the past few years is most likely responsible for the ozone increase over southwest of this region, both under general conditions and during ozone episodes. By investigating the ozone evolution influenced by emission changes within and outside of the PRD during the past decade, this study highlights the importance of establishing a dichotomous ozone control strategy to tackle general conditions and pollution events separately. NOx emission control should be further strengthened to alleviate the peak ozone level during episodes. Detailed investigation is needed to retrieve appropriate NOx∕VOC ratios for different emission and meteorological conditions, so as to maximize the ozone reduction efficiency in the PRD.
- Article
(3314 KB) - Full-text XML
-
Supplement
(2497 KB) - BibTeX
- EndNote


Thanks to a series of stringent air pollution control measures, most types of air pollutants, including SO2, NOx, CO, PM10, and PM2.5, have exhibited decreasing concentrations over the past 6 years (2013–2018) in China, with the only exception being ozone (Souri et al., 2017; Koukouli et al., 2018; Lin et al., 2018; Lu et al., 2018; Wang et al., 2018; Zhang et al., 2018). During the 2015–2018 period, ozone concentrations in the three major city clusters, Beijing–Tianjin–Hebei, the Yangtze River Delta, and the Pearl River Delta (PRD), increased by 20 %, 4 %, and 14 %, respectively (Report on the State of the Environment in China, http://english.mee.gov.cn/Resources/Reports/soe/, last access: 8 October 2019). Although they have comparable median ozone concentrations, the magnitude and frequency of high-ozone events are much higher in China than those in Japan, South Korea, Europe, and the United States (Lu et al., 2018). Ozone will become one of the major air pollution control targets in China in the near future in order to protect public health.
Ozone control is far more difficult than particulate matter (PM) control, based on the experiences in Los Angeles and Mexico City (Madronich, 2014). The difficulties regarding ozone control are due to two major aspects. First, ozone can be contributed by both local formation and nonlocal transport, and their relative importance is largely driven by meteorological conditions and precursor emission characteristics (Elminir, 2005; Beaver and Palazoglu, 2009; Kovač-Andrić et al., 2009). Second, ozone is a secondary pollutant with a nonlinear relationship with its precursors, NOx and volatile organic compounds (VOCs) (Stevenson et al., 2013; Thompson et al., 2014). Thus, synergistic control with a desirable NOx∕VOC reduction ratio is required for ozone reduction. However, such a ratio is hard to determine and to practically implement due to our limited understanding of VOC emissions, especially fugitive emissions (Ou et al., 2016). The appropriate NOx∕VOC reduction ratio may also vary greatly under different meteorological conditions. Therefore, from an ozone control point of view, it is fundamental to quantitatively understand the roles of meteorology and precursor emissions in shaping local and nonlocal ozone contributions, and their evolution over a long timescale in response to meteorological and emission changes.
Meteorology could either strengthen or dampen the efforts of precursor emission control on ozone reduction (Elminir, 2005; Beaver and Palazoglu, 2009; Kovač-Andrić et al., 2009). Hence, in order to investigate the effectiveness of precursor control over a long period, it is a common practice to homogenize meteorological conditions. In numerical simulation studies, this is implemented by using a set of scenarios with different meteorological and emission conditions (Gilliland et al., 2008; Godowitch et al., 2008; Wu et al., 2008; Foley et al., 2015). Differences in ozone levels between scenarios with the same meteorological conditions (emissions) are attributed to emission (meteorological) changes. Statistical models are also widely applied to establish a relationship between ozone and meteorological variables so as to remove the meteorological impact, which is usually called “meteorological adjustment” (Lu and Chang, 2005; Zheng et al., 2007; Foley et al., 2015). After meteorological adjustment, ozone changes are solely attributed to emission changes.
Both local and nonlocal emission changes contribute to ambient ozone levels in a particular region. From an ozone control point of view, it is also essential to quantitatively differentiate local and nonlocal contributions. Source apportionment modules coupled to chemical transport models, e.g., the ozone source apportionment technology (OSAT) in the Comprehensive Air-quality Model with Extensions (CAMx) and the integrated source apportionment method (ISAM) in the Community Multiscale Air Quality (CMAQ) model, are widely used to attribute ambient ozone concentrations at a particular place into different (local and nonlocal) source regions and categories (Li et al., 2013; Kwok et al., 2015). As numerical simulations suffer from uncertainties in emission inventories and are largely constrained with respect to time span due to computing resources, statistical models, e.g., the lowest-as-background method (Nielsen-Gammon et al., 2005; Xue et al., 2014) and the empirical orthogonal function (EOF) method (Langford et al., 2009; Berlin et al., 2013), are preferentially adopted when long-term monitoring data are available. They apportion local and nonlocal contributions by examining the variability and co-variability of ozone concentrations at multiple monitoring sites. However, without meteorological adjustment, source apportionment using both of the respective methods only reflects the absolute contribution from local and nonlocal sources/processes and cannot directly link them with local and nonlocal emissions of ozone precursors. Therefore, the combined application of meteorological adjustment and source apportionment is indispensable for investigating the effects of local and nonlocal emission changes on long-term ambient ozone variations. A combined application such as this has not been reported in previous studies.
In this study, the PRD is used as a research target area. After restraining its annual PM2.5 concentration below 35 µg m−3 (China's National Ambient Air Quality Standard for annual PM2.5) for 4 consecutive years (2015–2018), the PRD is the first major city cluster in China to transfer its main air pollution control target to ozone. By utilizing continuous ozone monitoring at multiple stations across the PRD that has been underway since 2007, we investigated the impacts of meteorology and local (within PRD) and nonlocal (outside PRD) emission changes on the long-term trend of ambient ozone using the framework of meteorological adjustment followed by local and nonlocal contribution differentiation. Ozone contributions from meteorology and local and nonlocal emissions are quantitatively demonstrated in 2016 and 2017 with a significant ozone increase. We further develop a conceptual diagram depicting the impact of emission control within the PRD to the ambient ozone, both under general conditions and during ozone pollution episodes. Evaluation of the effectiveness of ozone precursor control measures within and outside of the PRD over the past decade could shed light on potential future control efforts which would hopefully shorten the ozone abatement paths observed in Europe and the United States.
2.1 Ozone and meteorological data set
Hourly ozone monitoring data at 15 monitoring stations across the PRD from 2007 to 2017 are used to calculate maximum daily 8 h average (MDA8) ozone concentrations in this study. Missing data are filled by taking the yearly, monthly, weekly, and hourly mean into account, otherwise they are replaced by the ozone data at the nearest monitoring station (Zheng et al., 2007). The geographical distribution of the monitoring stations is illustrated in Fig. 1, and the latitudes/longitudes and the types of functional areas that the stations are located in are provided in Table 1.
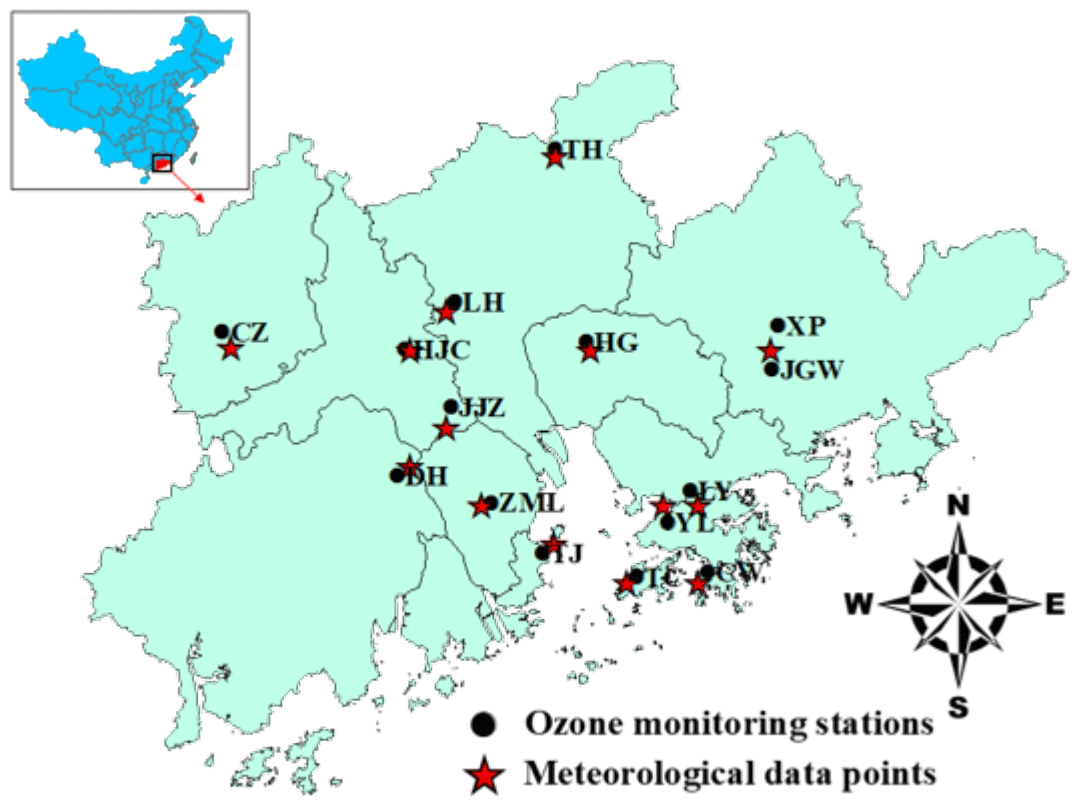
Figure 1Distribution of the ozone monitoring stations and meteorological data points in the Pearl River Delta.
Table 1Location of 15 ozone monitoring stations across the Pearl River Delta and their environmental background.

The meteorological data from the same period, including the daily maximum 2 m temperature (T, ∘), the daily minimum relative humidity (RH, %), the total net surface solar radiation (SSR, J M−2), and the 10 m mean wind direction and speed (u and v: the absolute values show wind speed in meters per second, while positive and negative signs of u and v indicate westerly/southerly and easterly/northerly wind directions, respectively), are retrieved from the European Center for Medium-Range Weather Forecast (ECMWF) simulations for meteorological adjustment. The temporal and spatial resolutions are 3 h and 0.125∘ × 0.125∘, respectively. The meteorological conditions at the ozone monitoring station are represented by the simulation data at the closest point to the station, as illustrated in Fig. 1. In this study, we composed an ozone and meteorological data set comprising 4018 d at 15 stations.
2.2 Meteorological adjustment
In this study, a statistical analysis framework combining meteorological adjustment and source apportionment is developed to identify ozone changes attributable to meteorology and local and nonlocal emissions. Long-term trends of ozone changes due to meteorological conditions and local and nonlocal emissions are subsequently evaluated using trend analysis. In this study, local emissions refer to those from within the PRD, whereas nonlocal emissions refer to those from outside the PRD. A conceptual diagram highlighting the major calculation procedures of the statistical analysis framework is shown in Fig. 2.
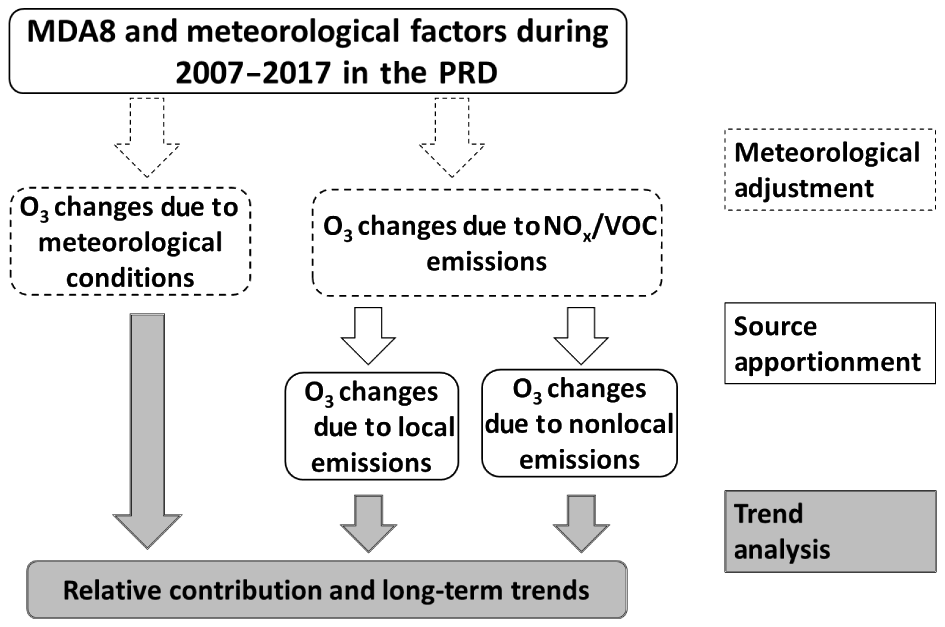
Figure 2Flowchart of the statistical analysis framework to identify the long-term impacts of meteorology and local and nonlocal emissions on ambient ozone.
In meteorological adjustment, a Kolmogorov–Zurbenko (KZ) filter is firstly used to separate the raw ozone and meteorological data into long-term, seasonal, and short-term data (Rao and Zurbenko, 1994a, b). A KZ filter can be expressed as follows:
where X(t) denotes the raw time series data, LT(t) reflects the long-term trend on a timescale of years, SE(t) is the seasonal variation on a timescale of months, and ST(t) refers to short-term component on a timescale of days.
The KZ filter repeats the iterations of a moving average to remove the high-pass signal defined by
where k is the number of values included on each side, the window length , i is interval time, j is window variables, and Y is the input time-series. Thus the output of the ith pass becomes the input for the i+1th pass, and so on. Different scales of motion are obtained by changing the window length and the number of the iterations (Milanchus et al., 1998; Eskridge et al., 1997). The filter periods of less than N days can be calculated with window length m and the number of iterations p, as follows:
Therefore, a KZ (15, 5) filter with the window length of 15 with 5 iterations removes cycles of 33 d. The ozone and meteorological time series by KZ (15, 5) refer to their baseline variations which are the sum of long-term LT (t) and seasonal components SE (t).
The long-term trend is separated from the raw data by KZ (365, 3) with the periods being > 632 d, and then the seasonal and the short-term component ST(t) can be derived by
After KZ filtering, meteorological adjustment is conducted by stepwise regression between the ozone concentration and meteorological factors such as T, RH, and SSR (Flaum et al., 1996; Wise and Comrie, 2005; Papanastasiou et al., 2012).
Equations (7) and (8) are the multivariate regression models between baseline and short-term ozone and meteorological factors, respectively. AST(t) and AST(t) are the baseline and short-term components of ozone, and MBL and MST are the baseline and short-term components of meteorological factors. The parameters a and b are the fitted parameters, and i is time points (days). ϵ(t) is the residual term. The average meteorological conditions of the same calendar date over the 11 years is used as the base condition for that date, and the meteorological adjustment is conducted against the base condition. By doing so, the interannual variation of meteorology is removed while the annual variation is largely reserved. With the homogenized annual variation of meteorological conditions, Aad(t) in Eq. (10) represents the meteorologically adjusted ozone variations, and the difference between X(t) and Aad(t) reflects the meteorological impact. It is noted that, by using the average meteorological conditions as the base condition, the average ozone concentration over the 11 years remains unchanged.
2.3 Source apportionment of ozone contributions from local and nonlocal emissions
In this study, the EOF and absolute principal component scores (APCS) are applied to apportion meteorologically adjusted ozone concentration into local and nonlocal emission sources. The EOF transforms a large number of variables into a new set of uncorrelated, orthogonal principal components (PCs). The few new variables contain most of the information from the original variables, and the new variables represent different processes contributing to ambient ozone levels. Here we present a brief description of the EOF and APCS. Detailed information regarding the method can be found in Langford et al. (2009) and Berlin et al. (2013).
EOF analysis is performed on the correlation matrix from the meteorologically adjusted ozone data set (4018 d × 15 stations), without further rotation of the PCs. The first step is to normalize the ozone data (Thurston and Spengler, 1985; Guo et al., 2004).
where Cik is the concentration of ozone in sample k of the station i, Ci is the arithmetic mean value of ozone in station i, and Si is the standard deviation.
where Lip is loadings of the EOF without rotation and Ppk is scores.
As the factor scores are normalized with the mean set to be zero, true zero is calculated by introducing an artificial sample with a zero concentration. The APCS are then estimated by subtracting the artificial sample from the true samples.
The regression between the APCS and the ozone concentration estimate source contributions to Ci is calculated by
where (b0)i is the constant term at station i, bpi is the coefficient of the source p, and ∑APCSp is the scaled value of the factor p. Multiplication of ∑APCSp and bpi gives the contribution from source p to the ozone concentration. Local and nonlocal sources are determined according to the temporal and spatial distribution characteristics of source contributions across the PRD.
3.1 Long-term trend of meteorological impact on ozone concentration
Figure 3a shows the long-term trends of ambient ozone, meteorologically adjusted ozone, and the meteorological impact in the PRD during the 2007–2017 period. The ambient ozone concentration in the PRD increased from 76 µg m−3 in 2007 to 89 µg m−3 in 2017, corresponding to an annual increase rate of 1.2 µg m−3. Previous studies have also evidenced an ozone increase in the PRD (e.g., Li et al., 2014), and here we demonstrate that such an increase has been occurring for more than a decade. After meteorological adjustment, the ozone concentration increases from 68 µg m−3 in 2007 to 90 µg m−3 in 2017, corresponding to an annual increase rate of 2.0 µg m−3. The higher increase rate of meteorologically adjusted ozone implies that if the meteorological conditions remained unchanged over the 11 years, the ambient ozone concentration would increase more significantly. As shown in Fig. 3a, meteorological conditions are generally favorable for ozone pollution during the 2007–2011 period, and are responsible for a maximum of 6 µg m−3 of the ozone increase. During the 2012–2017 period, the meteorological conditions became unfavorable for ozone pollution, leading to an ozone reduction of up to 6 µg m−3. Comparing the most favorable (2007) and the most unfavorable (2016) years, the meteorological conditions changed the ozone concentration by 12 µg m−3 at most, which roughly corresponds to 15 % of the annual ozone concentration.
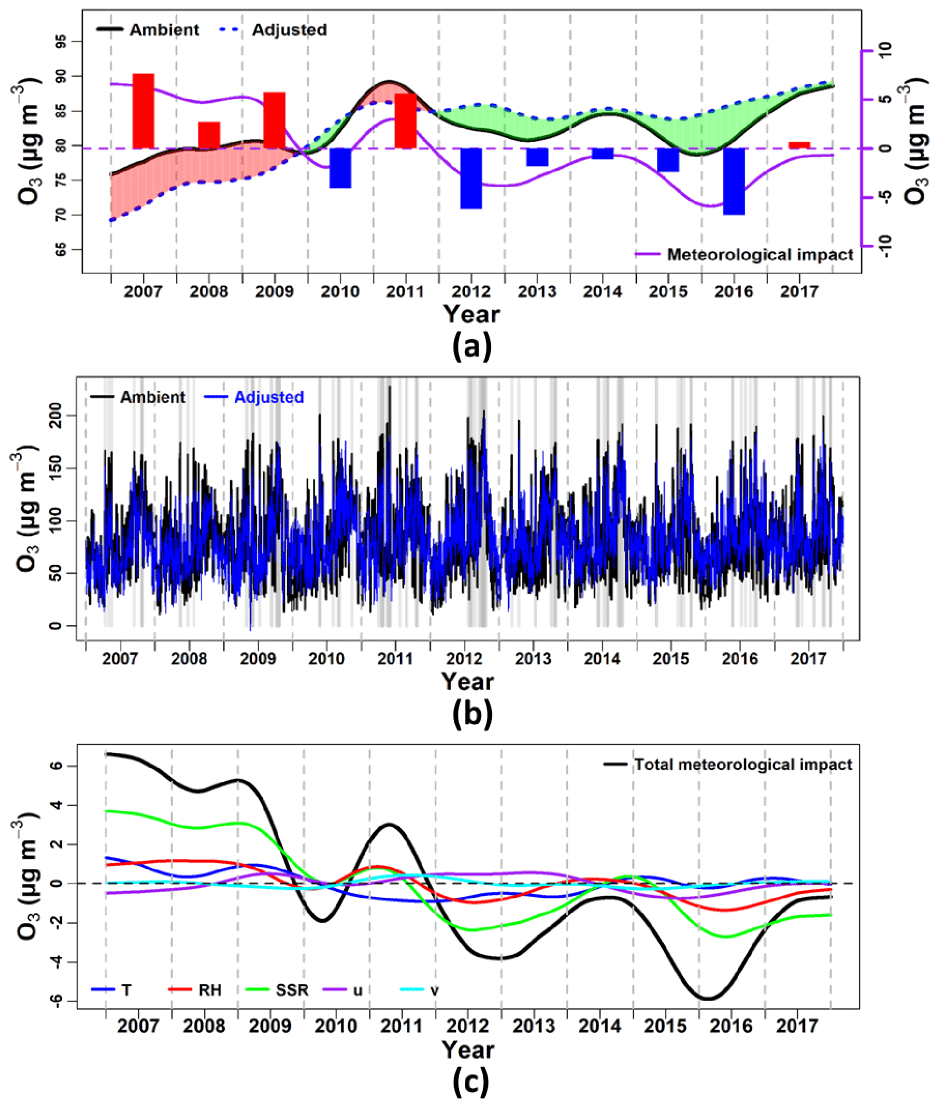
Figure 3(a) Long-term trends of ambient ozone (left y axis), meteorologically adjusted ozone (left y axis), and the meteorological impact (right y axis) in the Pearl River Delta during the 2007–2017 period. Periods with positive and negative meteorological impacts are shaded using red and green, respectively. Red and blue bars represent respective ozone increases and reductions attributed to meteorology in each year. (b) The ozone concentration time series before (black) and after (blue) meteorological adjustment. Gray areas represent periods with ozone concentrations over 160 µg m−3. (c) Long-term variations of the meteorological impact of different meteorological factors.
It should be noted that meteorological adjustment does not change the overall increasing trend of the ozone concentration, indicating that emission change is the primary driving factor for the long-term ozone trend. However, as shown in Fig. 3a, the fluctuation of the ozone concentration is suppressed by meteorological adjustment, indicating that meteorology plays an important role in the interannual fluctuation of the ozone concentration, especially during the 2011–2015 period when ozone changes due to emissions are minor. This is largely caused by emission changes within and outside of the PRD. The emissions inventory in the PRD (Fig. S1 in the Supplement) shows that the increase in VOC emissions started to alleviate in 2011, while NOx emissions showed significant reduction starting from 2013. As the PRD is generally in a VOC-limited ozone formation regime, reduction in the magnitude of the increase in VOC emissions is likely responsible for the minor changes in ozone during the 2011–2015 period. During some specific periods, meteorology plays a greater role in governing ozone changes than emissions, such as from 2016 to 2017, as will be discussed in Sect. 3.4. As shown in Fig. 3b, variations of ozone before (black lines) and after (blue lines) meteorological adjustment demonstrated that meteorological adjustment significantly reduces the magnitude of ozone spikes, indicating that meteorological conditions are one of the most important driving factors for ozone episodes in the PRD. Therefore, ozone precursor emission control should be strengthened during adverse weather conditions to lower peak ozone levels.
Figure 3c shows the impacts of different meteorological factors (T, RH, SSR, and u and v) on the ozone concentration. Overall, the SSR is the most crucial factor and its variation follows that of the total meteorological impact well. The contributions of the other four factors are comparable and relatively insignificant. As expected, a higher SSR, a higher T, and lower RH are favorable for ozone production.
3.2 Spatial distribution of meteorological impact
We further examine the spatial distribution of meteorological impacts. Figure 4a shows the spatial distribution of the averaged ozone concentration in the PRD and the annual ozone concentration changes before and after meteorological adjustment. Although the northeastern PRD region has the overall highest ozone concentrations, the central and western areas show the most rapid ozone increase over the 11 years (black bars), and such increases are further substantiated if the meteorological impact is removed (green bars). There are two subregions in the PRD with decreased ozone concentrations overall: one in the northeast (TH and JGW) and the other in the southwest (ZML and TJ). The ozone decrease is largely mitigated or, at ZML, even reversed after meteorological adjustment. The different mechanisms leading to the ozone increase in these two subregions are explained by a conceptual diagram in Sect. 3.6.
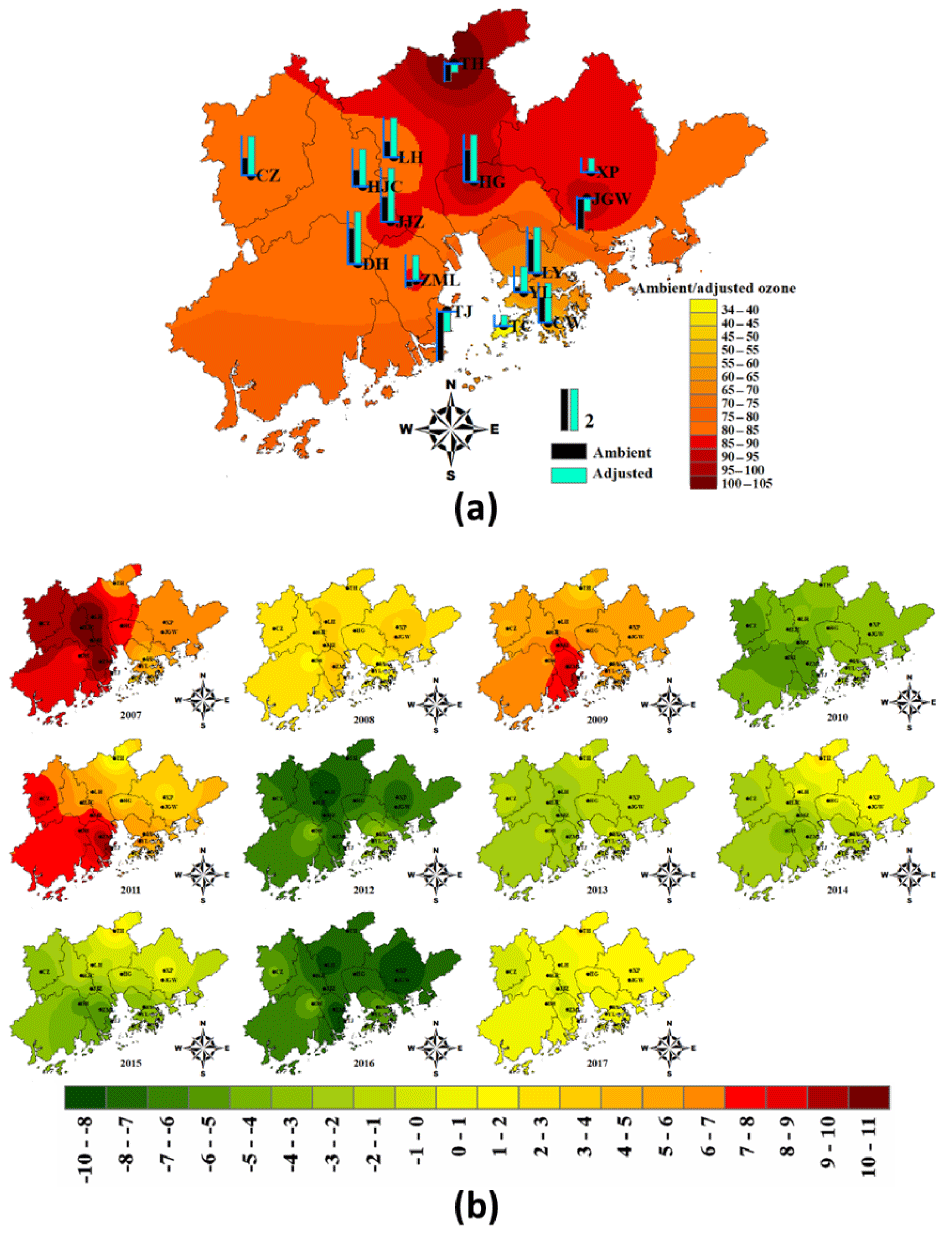
Figure 4(a) The spatial distribution of averaged ozone concentrations (µg m−3) in the Pearl River Delta and annual ozone changes (µg m−3 yr−1) before and after meteorological adjustment over the 15 monitoring stations during the 2007–2017 period. The bar length in the legend corresponds to an annual increase of 2 µg m−3. (b) The annual variation of the meteorological impact on the ozone concentration (µg m−3) over the Pearl River Delta during the 2007–2017 period. The legend of the colored contours in (a) refers to the ozone concentration (µg m−3) isopleths before and after meteorological adjustment.
The spatial distribution of the meteorological impact in each year during the 2007–2017 period is illustrated in Fig. 4b. It is noted that when the meteorological conditions favor ozone pollution in the PRD, the concentration increases more in the central and western areas. On the contrary, when the ozone concentration in the PRD decreases, the central and western PRD regions are also the areas with the larger decreases in most years. Therefore, the central and western PRD areas are meteorology-sensitive regions with respect to ozone pollution. Generally, areas with higher pollutant emissions are more sensitive to changes in meteorological conditions (Seo et al., 2014). Various studies have shown that the central and western PRD regions are the areas with the most intense VOC and NOx emissions (e.g., Zheng et al., 2009a); therefore, these areas are more sensitive to meteorological conditions. Thus, the formulation of an ozone control strategy in this region needs to consider meteorological impacts.
3.3 Identification of ozone changes resulting from local and nonlocal emissions
The long-term variation of meteorologically adjusted ozone reflects the impacts of precursor (VOC and NOx) emission changes. As ozone can be contributed from both local production and long-range transport, it is important to quantitatively separate these sources from an emission control point of view. Considering the PRD's monsoonal synoptic conditions and the fact that most local emissions are concentrated in the central and western PRD areas, local (within PRD) emissions tend to have contrasting impacts on different subregions in different seasons, whereas the impacts of nonlocal (outside PRD) emissions on a relatively larger scale tend to be spatially similar over the PRD. We use this philosophy to examine the PCs derived from the EOF analysis.
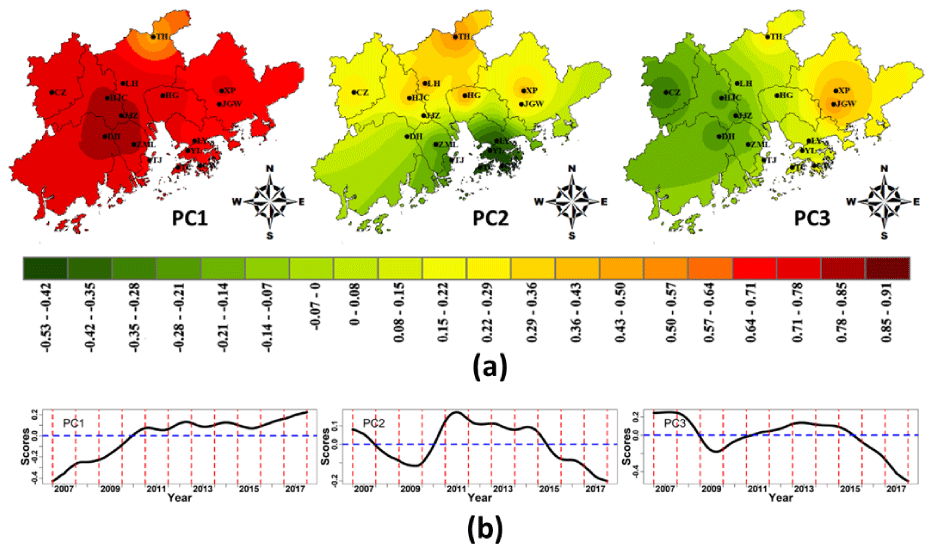
Figure 5(a) The spatial distribution of principal component loadings in the Pearl River Delta, and (b) the long-term variation of principal component scores during the 2007–2017 period. PC1 reflects nonlocal emission impacts, whereas PC2 and PC3 refer to impacts from different local emissions.
According to Kaiser's rule (Wilks, 2006), three PCs are retained in the EOF analysis, explaining 53 %, 16 %, and 7 % of total variance, respectively. Figure 5a shows the interpolated PC loadings in the PRD, and Fig. 5b shows the long-term variation of PC scores over the 11 years. PC1 shows a relatively consistent spatial distribution across PRD, with its loadings ranging from 0.47 at TH to 0.84 at JJZ. Further examination of the relationship between the PC scores and wind direction uncovered that the score of PC1 is higher when ozone concentrations are high in the PRD, and is associated with northeasterly winds (Fig. 6a). Situated along the southeastern coast of China, the PRD has two main prevailing winds: northeasterly, mainly during winter and spring, and southwesterly, mainly during summer and fall. Northeasterly winds tend to transport emissions from inland to the PRD, whereas southwesterly winds that originate from the ocean are relatively clean. All of the evidence presented above supports the notion that PC1 is associated with nonlocal impact from continental long-range transport. Higher impact in the central PRD region may be caused by the rough land use and microscale circulation in this urbanized region that increases the residence time of nonlocal ozone. The score of PC1 (Fig. 5b) increases almost consistently over the 11 years, indicating an increased ozone contribution from long-range transport. It should be noted that meteorological adjustment is conducted against the base condition which is the average meteorological conditions of the same calendar date throughout the 11 years in question. Therefore, meteorological adjustment removes the interannual variation of meteorological conditions, while preserving seasonal variation and making it consistent in all years. Therefore, the monsoonal characteristics (northerly or northeasterly winds in winter and southerly and southwesterly winds in summer) still remain and act as an important justification for PC determination.

Figure 6Scatterplot between principal component scores (a–c: PC1-3) and wind (u and v). u and v are the east–west and north–south components of wind (u: +west/-east; v: +south/-north). Red points refer to samples with high ozone concentrations (over the 90th percentile).
In comparison, PC2 and PC3 loadings show significant spatial variations. PC2 loadings have an obvious north–south gradient with different signs, indicating that the impact of PC2 on the northern and southern PRD are reversed at all times. Further examination of their relationship with wind direction, as shown in Fig. 6b and c, indicates that PC2 score tends to be positive with southerly winds and negative with northerly winds during high ozone periods. Under southerly wind conditions, the northern PRD receives the highest impact from PC2, leading to increased ozone concentration. On the contrary, the southern PRD receives the highest impact (negative score and negative loading) under northerly wind conditions. This precisely reflects the impact of emissions within the PRD posed by the north–south components of the prevailing winds. Similarly, PC3 is associated with the impact of local emissions due to the west–east components of the prevailing winds. Therefore, PC2 and PC3 collectively reflect the impact of local emissions on ozone formation. PC2 and PC3 scores show a bimodal pattern and are higher in 2007 and 2011–2014 (Fig. 5b). This suggests that local emissions display a higher ozone contribution to the northern and eastern PRD during 2007 and 2011–2014 and to the southern and western PRD during 2008–2010 and 2015–2017.
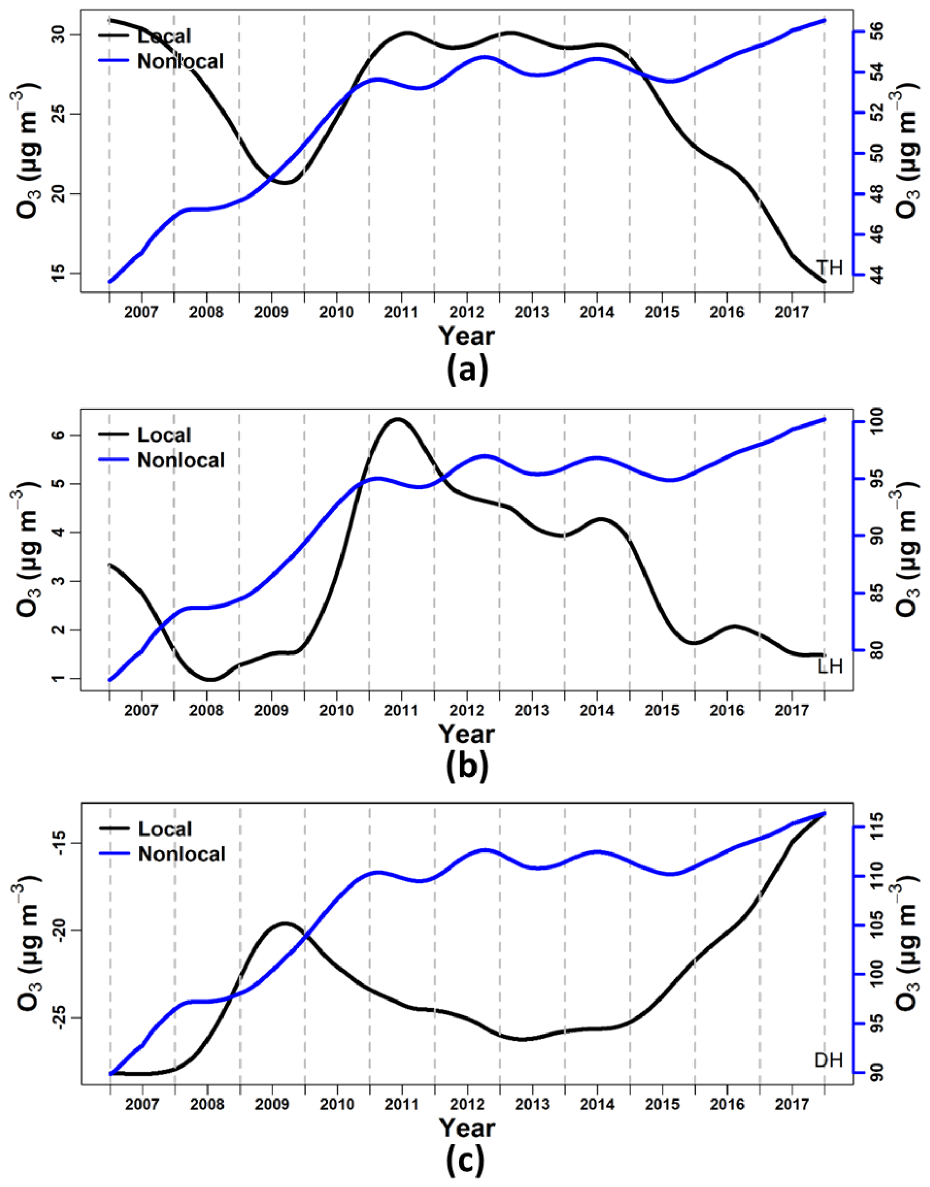
Figure 7Long-term trend of ozone contributed by local (black) and nonlocal (blue) emission sources from 2007 to 2017 at (a) TH, (b) LH, and (c) DH stations.
The PC loadings and scores may reflect the spatial distributions and the temporal variations of the PCs, respectively. However, as they are normalized values, the APCS calculation is conducted to quantify the absolute ozone contributions from local and nonlocal emission sources. As explained earlier, the impacts from nonlocal ozone due to long-range transport tend to be spatially more consistent within the PRD, whereas those from local ozone are more spatially inconsistent. With such a philosophy, we select Tianhu (TH) in the north, Luhu (LH) in the center, and Donghu (DH) in the south of the PRD to study the long-term trend of ozone contributed by local and nonlocal emission sources in different areas, as shown in Fig. 7. Ozone contributions from local and nonlocal sources at the other stations are provided in Fig. S2. A first glance at this figure reveals identical and consistently increasing nonlocal trends at all three stations. Actually, the ozone level in most areas of China has increased over the past few years, which has inevitably led to an increase in the nonlocal contribution to ozone over the PRD (Lu et al., 2018). Nonlocal emission contributions at DH have reached 90–115 µg m−3, which is more than double those of 44–56 µg m−3 at TH. As previously explained, such spatial heterogeneity is mainly caused by the longer residence time of nonlocal ozone in urbanized areas. In comparison, local emission contributions show differences in both magnitude and trend over the three stations. The local emission contribution for ozone ranges from 15 to 30 µg m−3 at TH, 1 to 6 µg m−3 at LH, and −30 to −15 µg m−3 at DH. As the net effect of ozone production and loss, the positive or negative sign of local emission contributions reflects the relative strengths of ozone production by HOx and ROx cycles and ozone loss by NO titration and deposition. As nonlocal emission contributions dominate over their local counterpart at all stations, the consistently increasing trend of these contributions determines the meteorologically adjusted ozone trend over the 11 years.
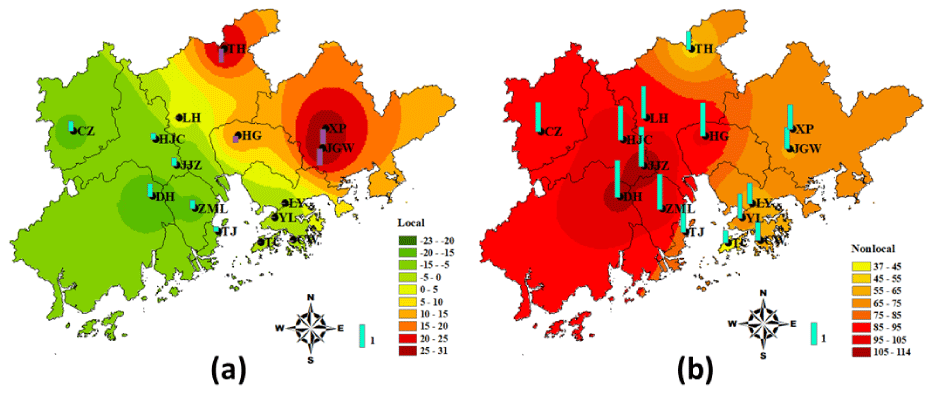
Figure 8The spatial distribution of the ozone contributions from (a) local and (b) nonlocal emissions (µg m−3) at each station and their annual change rate in the Pearl River Delta. Bars in blue (above) and purple (below) the station point indicate the respective increasing and decreasing contributions. The bar length in the legend corresponds to an annual increase of 1 µg m−3. Ozone contributions from local emissions show a positive but decreasing trend in the northeast and a negative but increasing trend in the southwest. Ozone contributions from nonlocal emissions are positive and increasing region-wide.
We further plot the spatial distribution of the ozone contribution from local and nonlocal emissions and its long-term changes over the PRD, as shown in Fig. 8. Local emissions have a positive contribution in the northeast, with the largest contribution of 31 µg m−3 observed at JGW, and they have a negative contribution in the southwest, with the largest contribution of −23 µg m−3 observed at DH. Furthermore, apart from the reversed ozone contribution from local emissions, the northeastern and southwestern PRD also exhibit reversed trends of changes in the ozone contribution from local emissions during the 11 years, as illustrated by the bars in Fig. 8. The most significant increasing trend is found over the southwestern PRD, with the maximum increase rate of 0.6 µg m−3 yr−1 observed at DH, whereas the most significant decreasing trend is found over the northeastern PRD, with the maximum decrease rate of 0.8 µg m−3 yr−1 observed at JGW. The underlying mechanism resulting in the opposite trends in both the local ozone contribution and its long-term changes between the northeastern and southwestern PRD are explained using a conceptual diagram in Sect. 3.6. In comparison, the ozone contributions from nonlocal emissions are relatively consistent over the PRD, and nonlocal emissions have an increasing influence on ozone over the entire region.
3.4 Identification of driving factors for ozone changes in 2016 and 2017
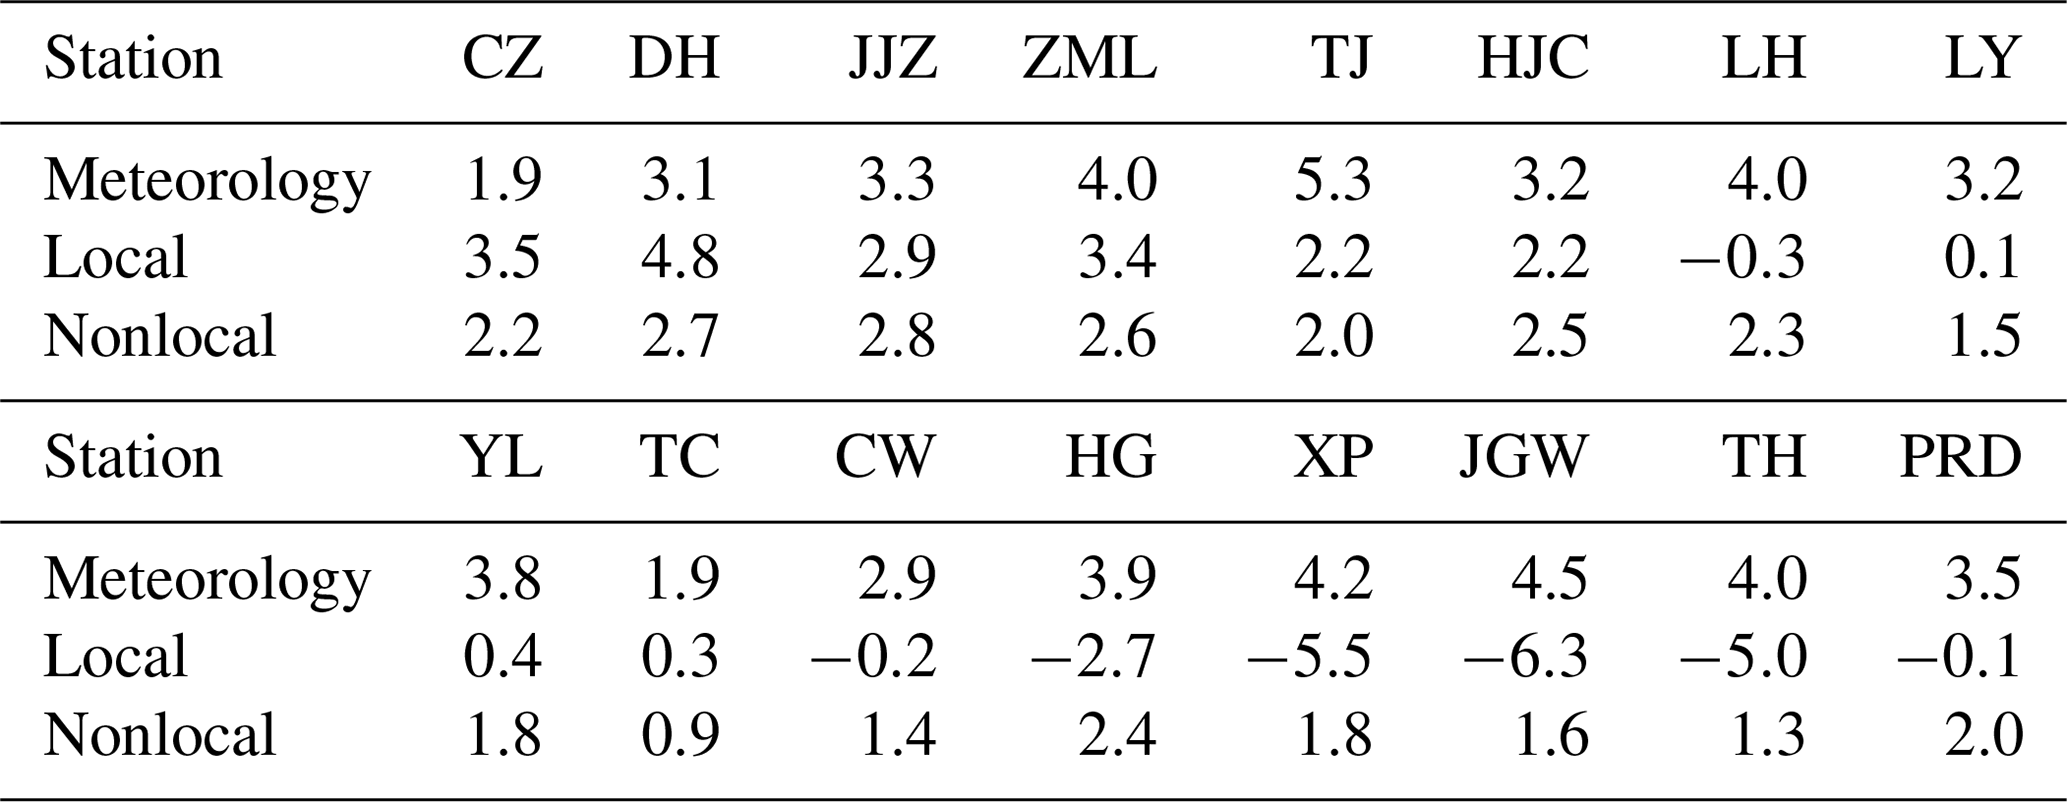
With meteorological adjustment and source apportionment, the contributions from meteorology and local and nonlocal emissions to the ambient ozone changes can be quantitatively analyzed for all years at all stations. Due to the space limitations, here we select 2 recent years, 2016 and 2017, and demonstrate this capability by analyzing the relative importance of meteorology and local and nonlocal emissions to the ozone changes during this 2-year period. Significant ozone level increases are revealed at most stations during the 2 years, with the average concentration rising from 81 µg m−3 in 2016 to 87 µg m−3 in 2017. It is found that meteorology, local emissions, and nonlocal emissions contribute to around 3.5, −0.1, and 2.0 µg m−3 to the ozone increase, respectively. Overall, meteorology plays a greater role in elevating ozone levels during these 2 years.
Contributions from meteorology and local and nonlocal emissions are further analyzed at each monitoring station, as listed in Table 2. Under general conditions, comparison with local and nonlocal emissions, meteorology has the highest contribution to ozone changes at all stations except for CZ and DH, the two southwestern-most stations. In addition, local emissions have higher contributions than nonlocal emissions at CZ, DH, JJZ, ZML, and TJ, the cluster of stations in the southwestern PRD. Therefore, the ozone increase over the southwestern PRD during these 2 years is most attributable to local emission changes, whereas the ozone increase in other parts of the PRD is firstly driven by meteorological condition changes, followed by nonlocal emission changes. This suggests that in order to reduce ozone levels in the southwestern PRD, strengthening local VOC emission controls should be the top priority, in order to prevent ozone titration from decreasing further.
Table 2Contributions of meteorology and local and nonlocal emission changes to the ozone concentration change (µg m−3) in 2016–2017 at 15 monitoring stations in the Pearl River Delta under general conditions.
3.5 Impact of meteorology and emission changes during ozone episodes
In this section, we examine the impacts of meteorology and local and nonlocal emission changes on the ambient ozone level during ozone episodes. Ozone episodes are defined as days with an MDA8 ozone concentration greater than 160 µg m−3 at five stations or more across the PRD. Over 14 years, there are a total of 442 d identified as ozone episodes. The number of ozone episodes is much lower than that under general conditions; therefore, the results below might be associated with larger uncertainties than those under general conditions.
Ozone levels during episodes are highest in the central PRD, mainly Guangzhou and Foshan, as shown in Fig. S3. Figure S4 shows the long-term trends of ambient ozone, meteorologically adjusted ozone, and the meteorological impact in the PRD during ozone episodes in 2007–2017. The ambient ozone concentration during episodes increases from 150 µg m−3 in 2007 to 161 µg m−3 in 2017, corresponding to an annual increase rate of 1.0 µg m−3. It is noteworthy that meteorological adjustment does not alter the ozone concentration much, with the largest change being only 3 µg m−3. This implies that meteorology does not vary significantly during ozone episodes across all years, although there is significant variation under general conditions. Thus, changes in precursor emissions are the driving factor for long-term ozone variations during ozone episodes. Slightly different behavior is discovered in 2017, as meteorology is the major culprit for ozone increase during this period. Without meteorological impact, the ozone level during episodes would be lower than that in 2016.
We further differentiate ozone changes into those due to local and nonlocal emissions using the EOF/APCS approach. Four principal components are discovered, and they are assigned to local or nonlocal emissions by their spatial variations, as shown in Fig. S3. Figure 9 illustrates the long-term trend of the ozone contribution due to local and nonlocal emissions during ozone episodes at TH, LH, and DH stations. At TH and LH, nonlocal emissions have a dominant contribution to ozone, whereas local emissions pose negative impacts; contributions from local and nonlocal emissions are comparable at DH. In contrast to general conditions, during which the nonlocal contribution shows a consistently increasing trend, the nonlocal contribution fluctuates greatly during ozone episodes and presents a bimodal behavior. Since 2014, the ozone contribution from nonlocal emissions has leveled off and gradually decreased. This may be related to the VOC and NOx emissions in the non-PRD area in Guangdong (Fig. S1) and further upwind, and deserves further study.
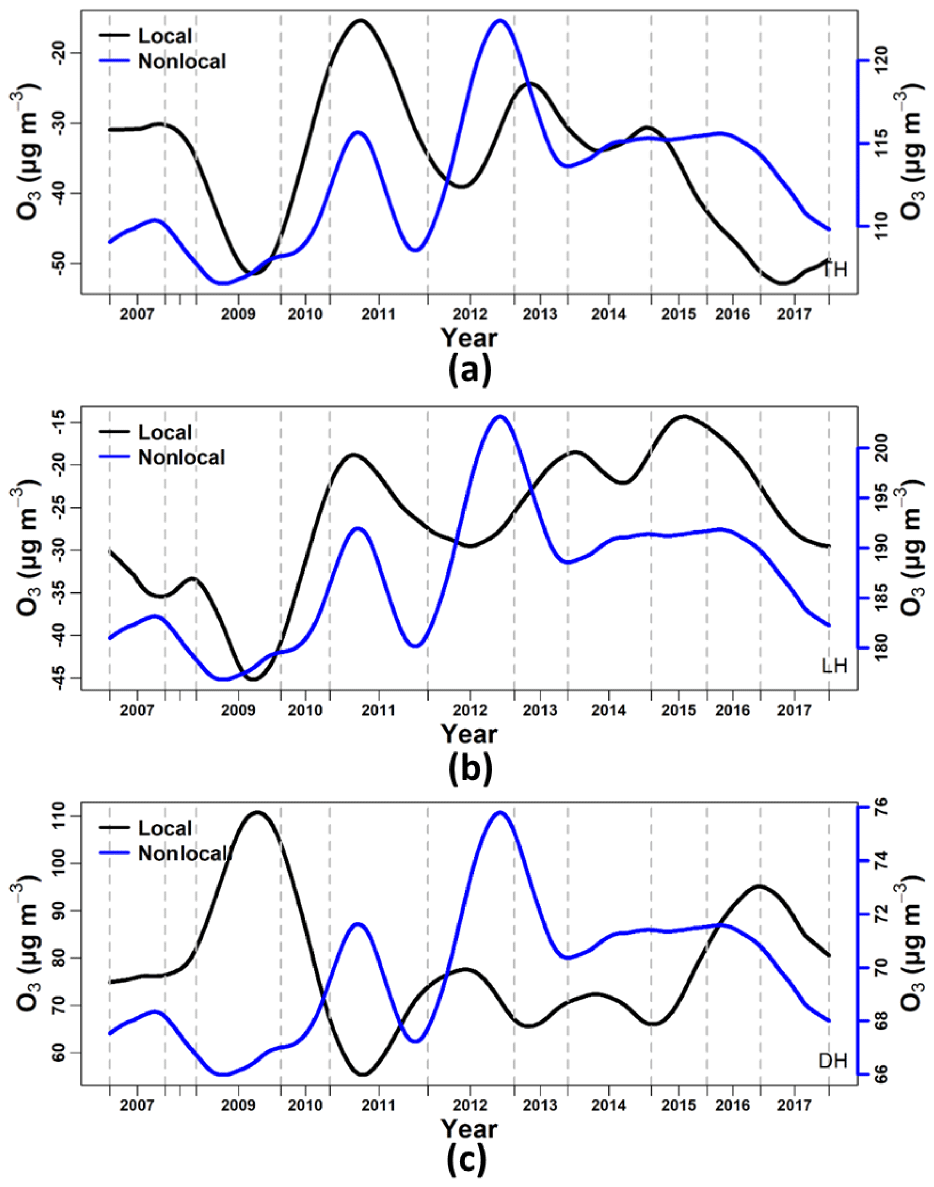
Figure 9Long-term trend of ozone contributed by local (black) and nonlocal (blue) emission sources from 2007 to 2017 at (a) TH, (b) LH, and (c) DH stations during ozone episodes.
The local emission contribution to ozone during episodes differs greatly in different areas. As shown in Fig. 10a, local emissions have a positive contribution in the southwestern PRD, with the largest average contribution of 78 µg m−3 observed at DH. However, they have a negative contribution in the northeastern PRD, with the largest contribution of −36 µg m−3 observed at TH and HG. A spatial distribution such as this is contrary to seen under general conditions, as illustrated in Fig. 8a. Stations over the central PRD show an increasing trend, with the largest increase rate of 1.9 µg m−3 yr−1 observed at HG, whereas stations surrounding the central and western PRD show a decreasing trend, with the largest decrease rate of 3.5 µg m−3 yr−1 observed at JGW. In comparison, ozone contributions from nonlocal emissions are relatively consistent over the PRD, with the hot spot shifted from the central and western PRD under general conditions (Fig. 8b) to the central and eastern PRD during ozone episodes (Fig. 10b). The entire PRD experienced an increasing ozone contribution from nonlocal emissions. In comparison with nonlocal emissions, the ozone contribution from local emissions and their trend show significant spatial heterogeneity. We develop a conceptual diagram to explain, in detail, the underlying mechanisms resulting in the distinct spatial distribution of local ozone contribution and the trend of this spacial distribution between general conditions and ozone episodes, as elaborated on in Sect. 3.6.
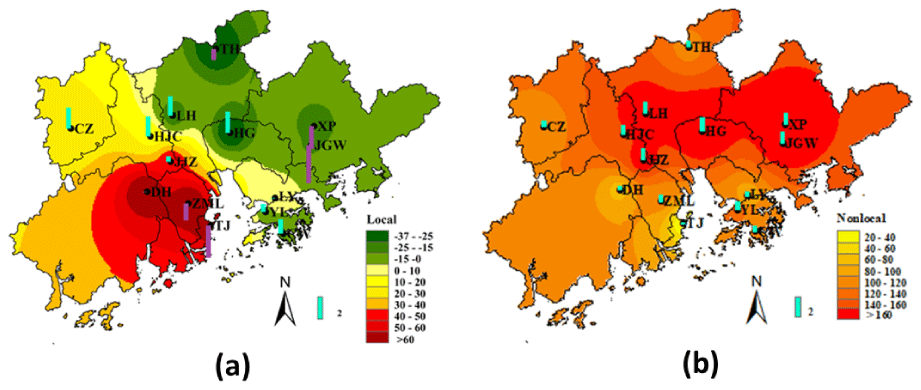
Figure 10The spatial distribution of the ozone contribution from (a) local and (b) nonlocal emissions (µg m−3) at each station and their annual rate of change in the Pearl River Delta during ozone episodes. Bars in blue (above) and in purple (below) the station point indicate the respective increasing and decreasing contribution trends. The bar length in the legend corresponds to an annual increase of 2 µg m−3. Ozone contributions from local emissions are positive in the southwestern PRD and negative in the northeastern PRD. The central PRD is the only area with an increasing local ozone contribution trend. Ozone contributions from nonlocal emissions are positive and increasing region-wide.
3.6 A conceptual diagram describing the impact of local emission changes for ozone in the Pearl River Delta
As discussed in Sect. 3.3 and 3.5, the spatial pattern of ozone contribution from local (within PRD) emissions and its long-term changes in the PRD under general conditions and during ozone episodes present different behaviors. Under general conditions, local emissions have a positive and decreasing contribution to ozone over the northeastern PRD and a negative and increasing contribution over the southwestern PRD (Fig. 8a). In contrast, during ozone episodes, local emissions have a negative and decreasing contribution over the northeastern PRD and a positive and decreasing contribution over the southwestern PRD. The central and western PRD are the only regions that have a slight increasing local ozone contribution during episodes (Fig. 10a). In this section, we aim to provide a detailed explanation of such phenomena by developing a conceptual diagram that collectively takes ozone precursor emissions and their changing trends, ozone formation regimes, and the monsoonal and microscale synoptic conditions over different subregions of the PRD into account.
3.6.1 General conditions
The PRD has distinct VOC and NOx emission characteristics across its different subregions, leading to different prevailing ozone formation regimes (OFRs). The central PRD, essentially western and southern Guangzhou, Foshan, and western Dongguan, is the area with the most significant economic and industrial activities. The central PRD is associated with a significant amount of VOC and NOx emissions (Zheng et al., 2009b; Zhong et al., 2018), and is mostly in a VOC-limited OFR (Ye et al., 2016). The polluted air masses can be transported to different areas of the PRD under different prevailing wind conditions, and largely determine the ozone behaviors over those areas. Over the past few years, NOx emissions have been decreasing due to stringent control measures, while VOC emissions have been increasing, as shown in Fig. S1.
The northeastern PRD is mainly a rural area with plenty of vegetation coverage. Significant VOC emissions from biogenic sources make it a primarily NOx-limited OFR, especially in summer (Ye et al., 2016). In summer and fall, southwesterly winds that originate from the South China Sea prevail, transporting the NOx-laden air masses from central PRD to the downwind NOx-limited northeast and increasing ozone levels over TH, XP, and JGW stations. However, the NOx∕VOC ratio in the air masses has been decreasing over the past few years due to emission control measures that have preferentially targeted NOx emissions. A lower NOx∕VOC ratio would inhibit ozone production in the NOx-limited northeastern PRD, leading to a downward ozone trend. In contrast, the southwestern PRD shows relatively higher NOx∕VOC emission ratios, and is mostly in a VOC-limited OFR (Ye et al., 2016). The OFR would shift to be more VOC-limited in winter due to the suppressed biogenic VOC emissions and reduced reaction rate of the HOx and ROx cycles. In winter and spring, northeasterly winds that originate from the Eurasian continent prevail, transporting the NOx-laden air masses from the central PRD into the southwest. The NOx-laden air masses would preferentially react with ozone in the VOC-limited southwestern PRD, thereby decreasing the ozone levels at CZ, DH, and ZML stations. Due to the strengthened NOx emission control that has reduced NOx∕VOC ratio from the central PRD, ozone titration is largely mitigated; this has led to an upward ozone trend over the southwestern PRD over the past few years. Figure 11 provides a conceptual diagram of the impact of local emission control on ozone concentrations and their changing trends over the PRD.
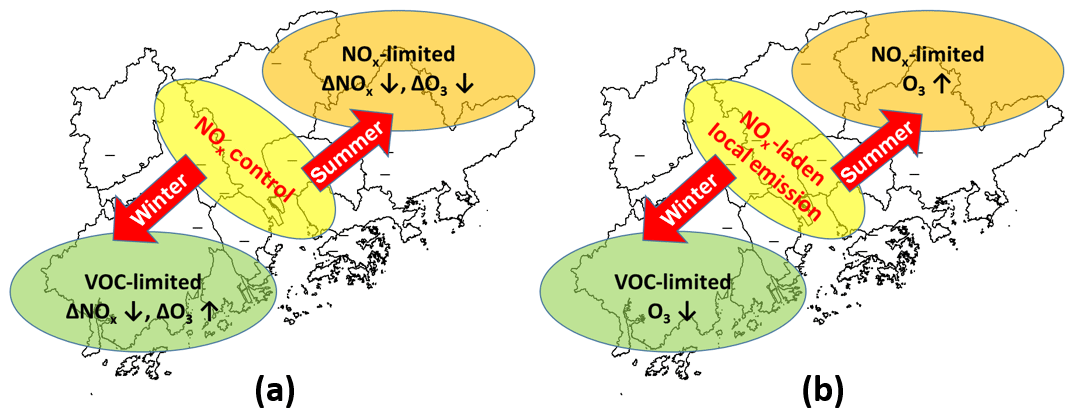
Figure 11A conceptual diagram of the impacts of local emissions on (a) ozone concentrations and (b) their changing trends over the Pearl River Delta. Local NOx-laden emissions increase the ozone level (O3↑) in the downwind northeastern PRD in summer and fall, but the increase is suppressed due to the preferential NOx control (ΔNOx↓), leading to a net ozone decrease (ΔO3↓). In comparison, local emissions decrease the ozone level (O3↓) in the downwind southwestern PRD in winter and spring, but the decrease is also mitigated due to NOx control (ΔNOx↓), leading to a net ozone increase (ΔO3↑). Such a phenomenon is essentially governed by different ozone formation regimes in the northeastern (NOx-limited) and southwestern PRD (VOC-limited).
Hence, the combined influences of reduced ozone titration from local emissions and increased ozone import from nonlocal emissions mean that the southwestern region is the area currently undergoing the most rapid ozone increase over the PRD. In order to curb the ozone increase in the southwest of the region, VOC emission control within the PRD must be strengthened to elevate the NOx∕VOC ratio to a level that would not further reduce ozone titration. With decreased influence from local emissions, the northeastern PRD shows the lowest ozone increase.
3.6.2 Ozone pollution episodes
Both meteorology and precursor emissions exhibit significant differences during ozone episodes in comparison with general conditions. Ozone episodes typically occur in summer and fall with hot and sunny weather and weakened background wind, which is very often associated with a high-pressure ridge or the approach of a tropical cyclone (Huang et al., 2006). The temperature very often rises above 32 ∘C with abundant sunshine, leading to more intense biogenic VOC emissions over the PRD. Considering NOx emissions are insensitive to temperature rise and the high reactivity of biogenic VOCs, the effective NOx∕VOC ratio becomes much lower. As a result, the NOx-limited OFR over the northeastern PRD is intensified, and the VOC-limited OFR over the southwest shifts to a NOx-limited regime. The VOC-limited area shrinks to cover only the central PRD and the magnitude is largely weakened (Wang et al., 2011; Jin and Holloway, 2015). Due to significant NOx emissions, the urban central PRD region is probably the last area to become NOx-limited due to enhanced biogenic VOC emissions during ozone episodes.
In addition, the prevailing wind direction changes from northeasterly/southwesterly to easterly, as shown in Fig. S6. With weakened background wind, microscale circulations such as a land–sea breeze develop around the Pearl River Estuary (PRE), and become an effective mechanism for trapping and mixing up pollutants emitted from regions surrounding the PRE (Lo et al., 2006). Microscale circulations increase the residence time of pollutants over the PRE and, thus, expedite chemical reactions to produce ozone. High ozone produced around the PRE is transported to the southwestern PRD (a “sink” region) by weak easterly winds, thereby increasing ozone levels at DH, ZML, and TJ stations. In contrast, under easterly wind conditions, the northeastern PRD receives little impact from the central PRD ozone hot spot and instead serves as a “source” region (ozone imported from further east is accounted for as impact from nonlocal emissions), thereby providing a negative contribution to TH, XP, JGW, HG, and LH stations.
With higher biogenic VOC emissions and a higher VOC oxidation rate, the OFR distribution over the PRD during ozone episodes varies from that under general conditions. The preferential NOx emission reduction due to stringent control would lead to a downward trend in the local ozone contribution over the northeast, due to the intensified NOx-limited OFR, as well as a downward trend over the southwest, due to the shift from a VOC-limited to a NOx-limited OFR (Jin and Holloway, 2015). An upward trend is only discovered over the central and western PRD (HG, LH, HJC, and ZH) where NOx emissions are very strong and still persist under a VOC-limited OFR. Figure 12 provides a conceptual diagram on the impact of local emission control on ozone concentrations and their changing trends over the PRD during ozone episodes.
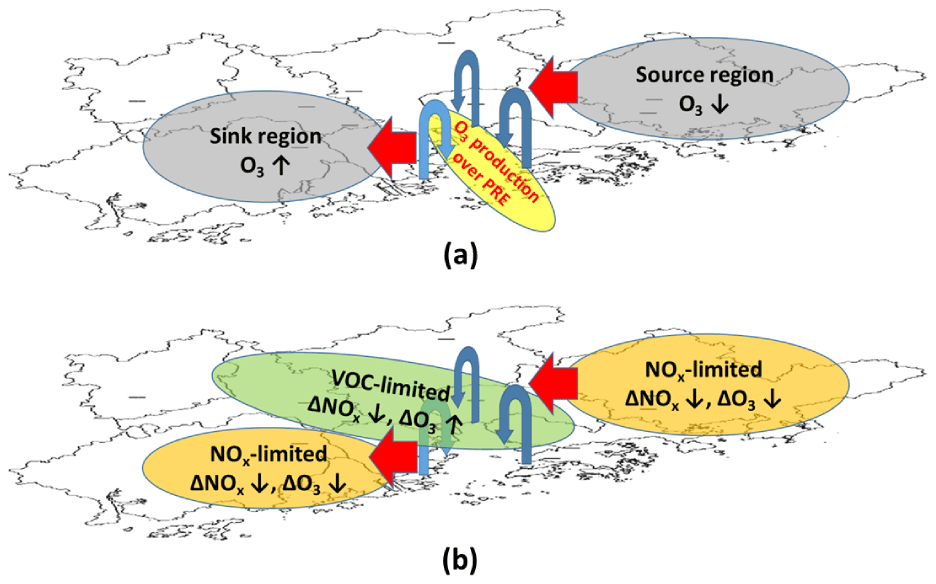
Figure 12A conceptual diagram of the impact of local emissions on (a) ozone concentrations and (b) their changing trends in the Pearl River Delta during ozone pollution episodes. The blue curved arrows indicate microscale circulations, such as a land–sea breeze, that have developed around the Pearl River Estuary (PRE). The microscale circulations lead to a high ozone area around the PRE due to effective mixing and reaction between VOCs and NOx. High ozone is transported to the southwestern PRD by easterly winds, increasing the local ozone contribution. In comparison, the northeastern PRD is a source region for ozone; therefore, the local contribution from this region is negative. With higher biogenic VOC emissions and a higher VOC oxidation rate during ozone episodes, most of the PRD is in the NOx-limited OFR except for urban central PRD which is still VOC-limited due to intense NOx emissions. Therefore, reduced NOx emissions (ΔNOx↓) lead to a decreasing ozone level (ΔO3↓) over both the northeastern and southwestern PRD and an increasing ozone level over central PRD (ΔO3↑).
Hence, even with different formation mechanisms compared with general conditions, the southwestern PRD, mainly Zhongshan, Zhuhai, and eastern Jiangmen, is still the area with the most significant impact from local emissions during ozone episodes. However, with lower NOx emissions than the central PRD, the OFR over the southwest of the region has shifted from a VOC-limited to a NOx-limited regime, leading to a reduced local ozone contribution. Comparison of different trends between the central and southwestern PRD actually highlights the fact that NOx emission control is one of the possible means of reducing ozone levels over the region, especially during ozone episodes with significantly enhanced biogenic VOC emissions. Further reduction of NOx emissions, after bypassing the optimal effective NOx∕VOC ratio leading to the highest ozone concentration, would rapidly pull the peak ozone level down and eventually bring it into attainment (Ou et al., 2016). Different OFR characteristics under general conditions and during ozone episodes also highlight the importance of formulating dynamic control measures tailored for different emission and meteorological conditions.
The ambient ozone level in a particular area is determined by the interaction between meteorology and the emissions of ozone precursors, VOCs and NOx. The differentiation of their impacts is important to evaluate the effectiveness of emission control measures in the past and to shed light on directions for future control plans. In this study, we develop a statistical analysis framework to identify ozone changes attributable to meteorology and local and nonlocal emissions in the PRD. The framework is essentially a combination of meteorological adjustment and source apportionment by EOF. We found that meteorology does not alter the increasing trend of ozone during the 2007–2017 period, but significantly mitigates the magnitude of the increase. Ozone increase solely due to precursor emission changes would have been more significant.
In comparison with nonlocal precursor emissions, the impacts of local precursor emissions on ambient ozone present significant spatial and temporal heterogeneity over the PRD. The Northeastern and southwestern regions of the PRD exhibit different net ozone production and loss characteristics under general conditions and during ozone episodes. In response to the preferential NOx emission control over the past few years, the local ozone contribution has decreased over the northeast and increased over the southwest under general conditions, whereas decreases over both the northeast and southwest and increases over the central and western PRD have been seen during ozone episodes. Such complex characteristics can be well interpreted by a conceptual diagram that collectively takes ozone precursor emissions and their changing trends, ozone formation regimes, and the monsoonal and microscale synoptic conditions over different subregions of the PRD into account. In particular, an OFR shift during ozone episodes in response to higher biogenic VOC emissions and a higher VOC oxidation rate is the fundamental cause of different trends both spatially and temporally. We conclude that the past control measures that have preferentially targeted NOx are most likely responsible for the ozone increase in the PRD, especially over the southwest region of the PRD due to reduced ozone titration. However, the OFR has started to shift from VOC-limited to NOx-limited over the southwest of the region, especially during ozone episodes. Therefore, NOx emission control should be further strengthened to alleviate peak ozone levels.
By investigating the ozone evolution influenced by emission changes within and outside of the PRD over the past decade, this study highlights the complexity of ozone pollution control in region. The complexity regarding ozone control is based on three aspects. First, ozone control should be location-specific. The northeastern PRD is the area that has benefited most from the current control measures in the region, and the main focus should be on co-prevention and co-control involving further northeastern areas, e.g., Jiangxi and Fujian, to reduce long-range transport; central and southwestern PRD should pay more attention to VOC control to elevate the NOx∕VOC ratio to a level that would not further reduce ozone titration. Second, ozone control should be temporally dynamic and largely dependent upon meteorological conditions. The OFR may change greatly under different meteorological conditions which would influence the effective control strategy and, thus, requires more in-depth investigation. In particular, precursor emissions surrounding the PRE should be preferentially controlled during ozone episodes as they may contribute greatly to ozone formation when trapped over PRE by microscale circulations. They are responsible for the ozone hot spot over the southwestern PRD which shows a drastically increasing trend. Last but not least, under every circumstance, the most desirable NOx∕VOC ratio for emission control should be investigated in detail. For example, control measures during ozone episodes should preferentially target NOx in the context of significantly enhanced biogenic VOC emissions. Comparison of different trends between the central and southwestern PRD regions perfectly highlights the effect of NOx control. Further reduction of NOx emissions, after bypassing the optimal effective NOx∕VOC ratio leading to the highest ozone concentration, would rapidly pull the peak ozone level down and eventually bring it into attainment (Ou et al., 2016).
The code for the empirical orthogonal function (EOF) method is available in the “psych” package in R (version 3.5.1). Air pollutant concentration data are available at the Guangdong-Hong Kong-Macau Regional Air Quality Real-time Releasing Platform (http://113.108.142.147:20047, last access: 8 October 2019). Meteorological reanalysis data are available at https://www.ecmwf.int/en/forecasts/datasets/browse-reanalysis-datasets (last access: 8 October 2019).
The supplement related to this article is available online at: https://doi.org/10.5194/acp-19-12901-2019-supplement.
ZY and JZ designed the experiments and LY, HL, XL, and YB carried them out. PKKL and DC provided ozone monitoring data and contributed to the discussion of the results. LY and ZY wrote the paper, with all co-authors contributing to subsequent enhancements.
The authors declare that they have no conflict of interest.
The authors are grateful to Guangdong Environmental Monitoring Center and Hong Kong Environmental Protection Department for providing ozone monitoring data of the PRD for use in this study.
This research has been supported by the National Natural Science Foundation of China (grant no. 91644221) and the National Key Research and Development Program of China (grant no. 2016YFC0202201).
This paper was edited by Ronald Cohen and reviewed by two anonymous referees.
Beaver, S. and Palazoglu, A.: Influence of synoptic and mesoscale meteorology on ozone pollution potential for San Joaquin Valley of California, Atmos. Environ., 43, 1779–1788, https://doi.org/10.1016/j.atmosenv.2008.12.034, 2009.
Berlin, S. R., Langford, A. O., Estes, M., Dong, M., and Parrish, D. D.: Magnitude, decadal changes, and impact of regional background ozone transported into the greater Houston, Texas, Area, Environ. Sci. Technol., 47, 13985–13992, https://doi.org/10.1021/es4037644, 2013.
Elminir, H. K.: Dependence of urban air pollutants on meteorology, Sci. Total Environ., 350, 225–237, https://doi.org/10.1021/es4037644, 2005.
Eskridge, R. E., Ku, J. Y., Rao, S. T., Porter, P. S., and Zurbenko, I. G.: Separating different scales of motion in time series of meteorological variables, B. Am. Meteorol. Soc., 78, 1473–1483, https://doi.org/10.1175/1520-0477(1997)078<1473:SDSOMI>2.0.CO;2, 1997.
Flaum, J. B., Rao, S. T., and Zurbenko, I. G.: Moderating the Influence of Meteorological Conditions on Ambient Ozone Concentrations, J. Air Waste Manage. Assoc., 46, 35–46, https://doi.org/10.1080/10473289.1996.10467439, 1996.
Foley, K. M., Hogrefe, C., Pouliot, G., Possiel, N., Roselle, S. J., Simon, H., and Timin, B.: Dynamic evaluation of CMAQ part I: Separating the effects of changing emissions and changing meteorology on ozone levels between 2002 and 2005 in the eastern US, Atmos. Environ., 103, 247–255, https://doi.org/10.1016/j.atmosenv.2014.12.038, 2015.
Gilliland, A. B., Pinder, H. R. W., Godowitch, J. M., Foley, K. L., and Rao, S. T.: Dynamic evaluation of regional air quality models: Assessing changes in O3 stemming from changes in emissions and meteorology, Atmos. Environ., 42, 5110–5123, https://doi.org/10.1016/j.atmosenv.2008.02.018, 2008.
Godowitch, J. M., Gilliland, A. B., Draxler, R. R., and Rao, S. T.: Modeling assessment of point source NOx emission reductions on ozone air quality in the eastern United States, Atmos. Environ., 42, 87–100, https://doi.org/10.1016/j.atmosenv.2007.09.032, 2008.
Guo, H., Wang, T., and Louie, P. K. K.: Source apportionment of ambient non-methane hydrocarbons in Hong Kong : Application of a principal component analysis/absolute principal component scores (PCA/APCS) receptor model, Environ. Pollut., 129, 489–498, https://doi.org/10.1016/j.envpol.2003.11.006, 2004.
Huang, J. P., Fung, J. C. H., and Lau, A. K. H.: Integrated processes analysis and systematic meteorological classification of ozone episodes in Hong Kong, J. Geophys. Res.-Atmos., 111, D20, https://doi.org/10.1029/2005JD007012, 2006.
Jin, X. and Holloway, T.: Spatial and temporal variability of ozone sensitivity over China observed from the Ozone Monitoring Instrument, J. Geophys. Res.-Atmos., 120, 7229–7246, https://doi.org/10.1002/2015JD023250, 2015.
Kovač-Andrić, E., Brana, J., and Gvozdić, V.: Impact of meteorological factors on ozone concentrations modelled by time series analysis and multivariate statistical methods, Ecol. Info., 4, 117–122, https://doi.org/10.1016/j.ecoinf.2009.01.002, 2009.
Koukouli, M. E., Theys, N., Ding, J., Zyrichidou, I., Mijling, B., Balis, D., and van der A, R. J.: Updated SO2 emission estimates over China using OMI/Aura observations, Atmos. Meas. Tech., 11, 1817–1832, https://doi.org/10.5194/amt-11-1817-2018, 2018.
Kwok, R. H. F., Baker, K. R., Napelenok, S. L., and Tonnesen, G. S.: Photochemical grid model implementation and application of VOC, NOx, and O3 source apportionment, Geosci. Model Dev., 8, 99–114, https://doi.org/10.5194/gmd-8-99-2015, 2015.
Langford, A., Senff, C., Banta, R., Hardesty, R., Alvarez, R., Sandberg, S. P., and Darby, L. S.: Regional and local background ozone in Houston during Texas Air Quality Study 2006, J. Geophys. Res.-Atmos., 114, D00F12, https://doi.org/10.1029/2008JD011687, 2009.
Li, J. F., Lu, K. D., Lv, W., Li, J., Zhong, L. J., Ou, Y. B., Chen, D. H., Huang, X., and Zhang, Y. H.: Fast increasing of surface ozone concentration in Pearl River Delta characterized by a regional air quality monitoring network during 2006–2011, J. Environ. Sci., 26, 23–36, https://doi.org/10.1016/S1001-0742(13)60377-0, 2014.
Li, Y., Lau, A. K. H., Fung, J. C. H., Ma, H., and Tse, Y.: Systematic evaluation of ozone control policies using an Ozone Source Apportionment method, Atmos. Environ., 76, 136–146, https://doi.org/10.1016/j.atmosenv.2013.02.033, 2013.
Lin, H., Tao, J., Kan, H., Qian, Z., Chen, A., Du, Y., Liu, T., Zhang, Y., Qi, Y., and Ye, J.: Ambient particulate matter air pollution associated with acute respiratory distress syndrome in Guangzhou, China, J. Expo. Sci. Env. Epid., 28, 392–399, https://doi.org/10.1038/s41370-018-0034-0, 2018.
Lo, J. C. F., Lau, A. K. H., Fung, J. C. H., and Chen, F.: Investigation of enhanced cross-city transport and trapping of air pollutants by costal and urban land-sea breeze circulations, J. Geophys. Res.-Atmos., 111, D14104, https://doi.org/10.1029/2005JD006837, 2006.
Lu, H. C. and Chang, T. S.: Meteorologically adjusted trends of daily maximum ozone concentrations in Taipei, Taiwan, Atmos. Environ., 39, 6491–6501, https://doi.org/10.1016/j.atmosenv.2005.06.007, 2005.
Lu, X., Hong, J., Zhang, L., Cooper, O. R., Schultz, M., Xu, X., Wang, T., Gao, M., Zhao, Y., and Zhang, Y.: Severe surface ozone pollution in China: a global perspective, Environ. Sc. Tech. Lett., 487–494, https://doi.org/10.1021/acs.estlett.8b00366, 2018.
Madronich, S.: Atmospheric chemistry: Ethanol and ozone, Nat. Geosci., 7, 395, https://doi.org/10.1038/ngeo2168, 2014.
Milanchus, M. L., Rao, S. T., and Zurbenko, I. G.: Evaluating the effectiveness of ozone management efforts in the presence of meteorological variability, J. Air Waste Manage. Assoc., 48, 201–215, https://doi.org/10.1080/10473289.1998.10463673, 1998.
Nielsen-Gammon, J., Tobin, J., and McNeel, A.: A Conceptual Model for Eight-Hour Ozone Exceedances in Houston, Texas Part II: Eight-Hour Ozone Exceedances in the Houston-Galveston Metropolitan Area, available at: http://oaktrust.library.tamu.edu/bitstream/handle/1969.1/158249/houzone3.pdf;jsessionid=42649DA5524B3AADD72167B704333F23?sequence=1, (last access: 8 October 2019), 2005.
Ou, J., Yuan, Z., Zheng, J., Huang, Z., Shao, M., Li, Z., Huang, X., Guo, H., and Louie, P. K. K.: Ambient Ozone Control in a Photochemically Active Region: Short-Term Despiking or Long-Term Attainment?, Environ. Sci. Technol., 50, 5720, https://doi.org/10.1021/acs.est.6b00345, 2016.
Papanastasiou, D. K., Melas, D., Bartzanas, T., and Kittas, C.: Estimation of Ozone Trend in Central Greece, Based on Meteorologically Adjusted Time Series, Environ. Model. Assess., 17, 353–361, https://doi.org/10.1007/s10666-011-9299-6, 2012.
Rao, S. T. and Zurbenko, I. G.: Detecting and Tracking Changes in Ozone Air Quality, Air Waste, 44, 1089, https://doi.org/10.1080/10473289.1994.10467303, 1994a.
Rao, S. T. and Zurbenko, I. G.: Detecting and tracking changes in ozone air quality, Air Waste, 44, 1089–1092, https://doi.org/10.1080/10473289.1994.10467303, 1994b.
Report on the state of the environment in China 2015–2017, http://english.mee.gov.cn/Resources/Reports/soe/, last access: 8 October 2019.
Seo, J., Youn, D., Kim, J. Y., and Lee, H.: Extensive spatiotemporal analyses of surface ozone and related meteorological variables in South Korea for the period 1999–2010, Atmos. Chem. Phys., 14, 6395–6415, https://doi.org/10.5194/acp-14-6395-2014, 2014.
Souri, A. H., Choi, Y., Jeon, W., Woo, J. H., Zhang, Q., and Kurokawa, J. I.: Remote sensing evidence of decadal changes in major tropospheric ozone precursors over East Asia, J. Geophys. Res.-Atmos., 122, 2474–2492, https://doi.org/10.1002/2016JD025663, 2017.
Stevenson, D. S., Young, P. J., Naik, V., Lamarque, J.-F., Shindell, D. T., Voulgarakis, A., Skeie, R. B., Dalsoren, S. B., Myhre, G., Berntsen, T. K., Folberth, G. A., Rumbold, S. T., Collins, W. J., MacKenzie, I. A., Doherty, R. M., Zeng, G., van Noije, T. P. C., Strunk, A., Bergmann, D., Cameron-Smith, P., Plummer, D. A., Strode, S. A., Horowitz, L., Lee, Y. H., Szopa, S., Sudo, K., Nagashima, T., Josse, B., Cionni, I., Righi, M., Eyring, V., Conley, A., Bowman, K. W., Wild, O., and Archibald, A.: Tropospheric ozone changes, radiative forcing and attribution to emissions in the Atmospheric Chemistry and Climate Model Intercomparison Project (ACCMIP), Atmos. Chem. Phys., 13, 3063–3085, https://doi.org/10.5194/acp-13-3063-2013, 2013.
Thompson, A. M., Balashov, N. V., Witte, J. C., Coetzee, J. G. R., Thouret, V., and Posny, F.: Tropospheric ozone increases over the southern Africa region: bellwether for rapid growth in Southern Hemisphere pollution?, Atmos. Chem. Phys., 14, 9855–9869, https://doi.org/10.5194/acp-14-9855-2014, 2014.
Thurston, G. D. and Spengler, J. D.: A quantitative assessment of source contributions to inhalable particulate matter pollution in metropolitan Boston, Atmos. Environ., 19, 9–25, https://doi.org/10.1016/0004-6981(85)90132-5, 1985.
Wang, X., Zhang, Y., Hu, Y., Zhou, W., Zeng, L. M., Hu, M., Cohan, D. S., and Russell, A. G.: Decoupled Direct Sensitivity Analysis of Regional Ozone Pollution over the Pearl River Delta during the PRIDE-PRD2004 Campaign, Atmos. Environ., 45, 4941–4949, https://doi.org/10.1016/j.atmosenv.2011.06.006, 2011.
Wang, Z., Zheng, F., Zhang, W., and Wang, S.: Analysis of SO2 Pollution Changes of Beijing-Tianjin-Hebei Region over China Based on OMI Observations from 2006 to 2017, Adv. Meteorol., 2018, 8746068, https://doi.org/10.1155/2018/8746068, 2018.
Wilks, D. S.: Statistical Methods in Atmospheric Science: An Introduction, Publ. Am. Stat. Assoc., 102, 380–380, https://doi.org/10.1198/jasa.2007.s163, 2006.
Wise, E. K. and Comrie, A. C.: Extending the Kolmogorov–Zurbenko Filter: Application to Ozone, Particulate Matter, and Meteorological Trends, J. Air Waste Manage. Assoc., 55, 1208, https://doi.org/10.1080/10473289.2005.10464718, 2005.
Wu, S., Mickley, L. J., Jacob, D. J., Rind, D., and Streets, D. G.: Effects of 2000–2050 Changes in Climate and Emissions on Global Tropospheric Ozone and the Policy-Relevant Background Surface Ozone in the United States, J. Geophys. Res.-Atmos., 113, D18, https://doi.org/10.1029/2007jd009639, 2008.
Xue, L., Wang, T., Louie, P. K., Luk, C. W., Blake, D. R., and Xu, Z.: Increasing external effects negate local efforts to control ozone air pollution: a case study of Hong Kong and implications for other Chinese cities, Environ. Sci. Technol., 48, 10769, https://doi.org/10.1021/es503278g, 2014.
Ye, L., Wang, X., Fan, S., Chen, W., Chang, M., Zhou, S., Wu, Z., and Fan, Q.: Photochemical indicators of ozone sensitivity: application in the Pearl River Delta, China, Front. Environ. Sci. Eng., 10, 15, https://doi.org/10.1007/s11783-016-0887-1, 2016.
Zhang, X., Zhang, W., Lu, X., Liu, X., Chen, D., Liu, L., and Huang, X.: Long-term trends in NO2 columns related to economic developments and air quality policies from 1997 to 2016 in China, Sci. Total Environ., 639, 146–155, https://doi.org/10.1016/j.scitotenv.2018.04.435, 2018.
Zheng, J., Swall, J. L., Cox, W. M., and Davis, J. M.: Interannual variation in meteorologically adjusted ozone levels in the eastern United States: A comparison of two approaches, Atmos. Environ., 41, 705–716, https://doi.org/10.1016/j.atmosenv.2006.09.010, 2007.
Zheng, J., Shao, M., Che, W. W., Zhang, L., Zhong, L., Zhang, Y., and Streets, D.: Speciated VOC emission inventory and spatial patterns of ozone formation potential in the Pearl River Delta, China, Environ. Sci. Technol., 43, 8580–8586, https://doi.org/10.1021/es901688e, 2009a.
Zheng, J., Zhang, L., Che, W., Zheng, Z., and Yin, S.: A highly resolved temporal and spatial air pollutant emission inventory for the Pearl River Delta region, China and its uncertainty assessment, Atmos. Environ., 43, 5112–5122, https://doi.org/10.1016/j.atmosenv.2009.04.060, 2009b.
Zhong, Z., Zheng, J., Zhu, M., Huang, Z., Zhang, Z., Jia, G., Wang, X., Bian, Y., Wang, Y., and Li, N.: Recent developments of anthropogenic air pollutant emission inventories in Guangdong province, China, Sci. Total Environ., 627, 1080–1092, https://doi.org/10.1016/j.scitotenv.2018.01.268, 2018.