the Creative Commons Attribution 4.0 License.
the Creative Commons Attribution 4.0 License.
 | 14 Oct 2019
Integration of airborne and ground observations of nitryl chloride in the Seoul metropolitan area and the implications on regional oxidation capacity during KORUS-AQ 2016
Daun Jeong
Roger Seco
Youngro Lee
Benjamin A. Nault
Christoph J. Knote
Tom Mcgee
John T. Sullivan
Jose L. Jimenez
Pedro Campuzano-Jost
Donald R. Blake
Dianne Sanchez
Alex B. Guenther
David Tanner
L. Gregory Huey
Russell Long
Bruce E. Anderson
Samuel R. Hall
Kirk Ullmann
Hye-jung Shin
Scott C. Herndon
Youngjae Lee
Danbi Kim
Joonyoung Ahn
Nitryl chloride (ClNO2) is a radical reservoir species that releases chlorine radicals upon photolysis. An integrated analysis of the impact of ClNO2 on regional photochemistry in the Seoul metropolitan area (SMA) during the Korea–United States Air Quality Study (KORUS-AQ) 2016 field campaign is presented. Comprehensive multiplatform observations were conducted aboard the NASA DC-8 and at two ground sites (Olympic Park, OP; Taehwa Research Forest, TRF), representing an urbanized area and a forested suburban region, respectively. Positive correlations between daytime Cl2 and ClNO2 were observed at both sites, the slope of which was dependent on O3 levels. The possible mechanisms are explored through box model simulations constrained with observations. The overall diurnal variations in ClNO2 at both sites appeared similar but the nighttime variations were systematically different. For about half of the observation days at the OP site the level of ClNO2 increased at sunset but rapidly decreased at around midnight. On the other hand, high levels were observed throughout the night at the TRF site. Significant levels of ClNO2 were observed at both sites for 4–5 h after sunrise. Airborne observations, box model calculations, and back-trajectory analysis consistently show that these high levels of ClNO2 in the morning are likely from vertical or horizontal transport of air masses from the west. Box model results show that chlorine-radical-initiated chemistry can impact the regional photochemistry by elevating net chemical production rates of ozone by ∼25 % in the morning.
- Article
(7487 KB) - Full-text XML
-
Supplement
(2161 KB) - BibTeX
- EndNote


Nitryl chloride (ClNO2) is a nighttime radical reservoir that generates chlorine radicals (Cl•) upon sunrise Reaction (R1), with a lifetime () of around 30 min at midday in the Northern Hemisphere midlatitude summer, under clear-sky conditions ( s−1; Madronich and Flocke, 1998). It is produced through heterogeneous reaction of chloride-containing aerosols and dinitrogen pentoxide (N2O5(g)), which is generated from an equilibrium reaction with gas-phase nitrate radical () and nitrogen dioxide (NO2) (Reactions R2–R4; Finlayson-Pitts et al., 1989). In acidic aerosols (≈ pH 1.8), uptake of N2O5 (g) can also produce gas-phase chlorine (Cl2, Reaction R5), resulting from an enhanced ClNO2 uptake coefficient of up to 3–4 orders of magnitude higher than neutral pH (Roberts et al., 2008). However, this reaction has yet to be proven in ambient conditions. During the day, N2O5 exists at low levels due to its thermal instability (Malko and Troe, 1982) and the short lifetime of NO3 ( s) from photolysis and reaction with NO (Wayne et al., 1991). Particulate Cl− and chlorine-containing gas species can come from both natural sources such as sea salt and biomass burning (Blanchard, 1985; Woodcock, 1953) and anthropogenic sources such as steel making, incineration, bleaching processes, and coal-fired power plants (Hov, 1985; Reff et al., 2009; Tanaka et al., 2000; Lee et al., 2018; Fu et al., 2018). The efficiency of ClNO2 production depends on heterogeneous loss of N2O5, which is a function of the N2O5 aerosol uptake coefficient (), aerosol surface area, and N2O5 mean molecular speed, as well as the yield of ClNO2 () (e.g., Thornton et al., 2003; Schweitzer et al., 1998; Behnke et al., 1997; Hu and Abbatt, 1997; Bertram and Thornton, 2009). Many recent studies have reported discrepancies between field-derived and laboratory-parameterized (e.g., Brown et al., 2009; Chang et al., 2016; Morgan et al., 2015; Phillips et al., 2016; McDuffie et al., 2018b; Tham et al., 2016; X. Wang et al., 2017; Z. Wang et al., 2017) and (e.g., McDuffie et al., 2018a; Riedel et al., 2013; Ryder et al., 2015; Tham et al., 2018; Thornton et al., 2010; Wagner et al., 2013; X. Wang et al., 2017; Z. Wang et al., 2017). In a nocturnal boundary layer, ClNO2 can accumulate to significant levels due to its long lifetime ( h) with slow loss mechanisms through heterogeneous uptake (Behnke et al., 1997; Frenzel et al., 1998; George et al., 1995). At sunrise, ClNO2 rapidly photolyzes to generate chlorine radicals (Cl•), which can react with most volatile organic compounds (VOCs). For alkanes, Cl• has up to 1–2 orders of magnitude larger rate constants than hydroxyl radicals (e.g., , at 298 K) (Atkinson, 1997; Atkinson and Arey, 2003). Therefore, Cl• can potentially influence the radical pool (HOx-ROx) and ozone (O3) level, which can also affect the formation of secondary aerosols. This influence can be most prominent in the morning when concentrations of other oxidants are low (i.e., and •OH) (Finlayson-Pitts, 1993; Hov, 1985; Young et al., 2014).
The first ambient measurements of ClNO2 were carried out by Osthoff et al. (2008), from a ship sampling along the southeastern US coast in 2006. In that study, ClNO2 was observed up to ∼1 ppbv at nighttime, particularly during the time period influenced by urban pollution and ship plumes of the Houston ship channel. Since then, a growing number of measurements reported significant levels of ClNO2, especially in polluted coastal regions with sources from natural and anthropogenic chloride and nitrogen oxides. Riedel et al. (2012) measured up to ∼2 ppbv of ClNO2 off the coast of Santa Monica Bay, on board the research vessel Atlantis. Recent studies show that high levels of ClNO2 are also present in mid-continental regions. Thornton et al. (2010) measured up to ∼400 pptv in Boulder, Colorado, which is ∼1400 km away from the coastline. Mielke et al. (2011) reported up to ∼250 pptv in Calgary, Alberta, Canada, during spring, which is ∼800 km from the coastline. Back-trajectory analysis results showed that the observations were most likely not influenced by marine air masses. More recently (in the past 5 years), an increasing number of ClNO2 observations have been conducted in Asia, consistently showing significant levels of ClNO2 present in the boundary layer (e.g., Tham et al., 2016, 2018; Wang et al., 2016; Z. Wang et al., 2017; Wang et al., 2014; Yun et al., 2018; Liu et al., 2017). ClNO2 observations at semirural (Wangdu of Hebei Province) and urban (Hong Kong, Jinan) regions in China have measured up to 2 ppbv and 776 pptv, respectively (Tham et al., 2016; X. Wang et al., 2017). At the mountaintop (957 m above sea level) in Hong Kong, up to 4.7 ppbv of ClNO2 was reported (Wang et al., 2016). The high levels of ClNO2 in these studies were mostly correlated with continental pollution in the vicinity (e.g., power plant plumes, biomass burning). A recent study by Yun et al. (2018) reported the highest-recorded mixing ratio of ClNO2 (8.3 ppb), during a severe haze event at a semirural site downwind of the Pearl River Delta in the winter. Overall, observations have shown that ClNO2 is ubiquitous in the tropospheric boundary layer. However, measurements are still limited, as discrepancies remain between global chemical transport models and observations. Uncertainties in model-simulated ClNO2 can arise from limited emission inventories, low resolution of the grid, uncertainties in and parameterization, complexity of the terrain, and meteorological conditions, and these have been explored in previous studies (e.g., Zhang et al., 2017; McDuffie et al., 2018a, b; Lowe et al., 2015; Sarwar et al., 2012, 2014; Sherwen et al., 2017). For instance, smoothing out local ClNO2 peaks by diluting local NOx emissions will result in limited NO3 and N2O5 production. According to Sarwar et al. (2012, 2014), the Community Multiscale Air Quality (CMAQ) model with a finer grid (i.e., 12 km) simulated ClNO2 that corresponded better to the observations, compared to the model runs with coarser grid size (i.e., 108 km), embedded with similar chemistry. Another modeling study by Sherwen et al. (2017) compared the ClNO2 levels between the GEOS-Chem simulations and observations in inland areas (i.e., London, UK, and a mountaintop near Frankfurt, Germany) during the summer of 2015. Compared to observations, the simulations underestimated the ClNO2 maxima levels by ∼7 times in inland areas (Sherwen et al., 2017). Modeling studies have consistently suggested the significance of Cl•-initiated reactions in regional and global O3 production and in the lifetime of VOCs in the troposphere (Knipping and Dabdub, 2003; Tanaka et al., 2000, 2003; Sarwar et al., 2014; Sherwen et al., 2016; Simon et al., 2009). Sarwar et al. (2014) explored the production of ClNO2 from sea salt and biomass burning and its impact in the Northern Hemisphere by including ClNO2 formation chemistry in the CMAQ model. The results showed that, compared to the simulations without ClNO2 formation, monthly 8 h wintertime maximum O3 and •OH increased up to 15 % and 20 %, respectively. The impact was the largest in China and western Europe. In the Hong Kong–Pearl River Delta (HK–PRD) region, Li et al. (2016) simulated up to ∼1 ppbv of ClNO2 originating from sea salt, biomass burning, and anthropogenic emissions (e.g., coal combustion) with the Weather Research and Forecasting model coupled with Chemistry (WRF-Chem). This resulted in an ∼16 % O3 increase in the planetary boundary layer. Another modeling study of WRF-Chem embedded with an updated chlorine chemistry, simulated 3 %–6 % of surface O3 increase in the North China Plain and Yangtze River Delta during the summer (Zhang et al., 2017). A recent study by Wang et al. (2019) updated the standard version of the GEOS-Chem (Chen et al., 2017; Sherwen et al., 2016) to better track partitioning between aerosol chloride and gas-phase chlorine species. Comparison between their model simulations with and without ClNO2 production showed enhanced O3 up to 8 ppb during the winter season in Europe.
East Asian countries are of particular interest due to the rapid economic growth in the past decades with high anthropogenic emissions from densely populated megacities (e.g., Shanghai, Guangzhou, Beijing, Tokyo, Seoul). The majority of the world's megacities are situated in coastal regions (Neumann et al., 2015) with high NOx emissions and abundant sources of chloride from both anthropogenic and natural origin. These regional characteristics likely promote ClNO2 production. Moreover, considering that nearly half the population in the world lives near the coast, defined as <100 km from the coastline (Hinrichsen, 1998), a careful evaluation of the impact of ClNO2 on local tropospheric chemistry is crucial. In this study, we present ClNO2 observation results from the Korea–United States Air Quality (KORUS-AQ) study conducted in the Seoul metropolitan area (SMA), South Korea, during late spring (2 May to 12 June 2016). The field campaign was an international collaboration between the National Institute of Environmental Research (NIER) of South Korea and the National Aeronautics and Space Administration (NASA) of the United States with the aim to better understand the impact of a megacity on regional air quality. A comprehensive suite of measurements was deployed at two super sites (Olympic Park site, OP; Taehwa Research Forest, TRF) and aboard the NASA DC-8 to make airborne observations over the South Korean peninsula and the Yellow Sea. We present observational and box model results to evaluate the impact of ClNO2 on regional air quality in the SMA.
2.1 KORUS-AQ 2016 field campaign and observation sites
We present observations carried out at Olympic Park, (OP; lat: 37∘30′32.904′′ N, long: 127∘7′20.136′′ E), Taehwa Research Forest (TRF; lat: 37∘19′14.484′′ N, long: 127∘18′32.58′′ E), and on the NASA DC-8. The two ground sites were within the SMA region, which is the second largest metropolitan area in the world with a population of ∼24 million (Park et al., 2017). As shown in Fig. 1a, the OP site is located in the southern part of Seoul, surrounded by high-rise residence buildings and close to major freeways. The TRF site is in the middle of a forested area, ∼26 km southeast of the OP site. Previous studies have shown that the TRF site is affected by both aged anthropogenic air masses from the city and fresh biogenic emissions from the forest (Kim et al., 2015, 2016). Both sites were ∼50 km to the east of the nearest coastline. Figure 1b shows the flight tracks of the NASA DC-8, during the KORUS-AQ campaign. Spiral patterns were conducted near the TRF site to measure a vertical profile of the troposphere. Airborne observations were carried out during the daytime, between 08:00 and 17:00 local time. A summary of the analytical techniques of the measurements presented in this study are shown in Table 1. Meteorology during the observation period can be classified into dynamic (4–16 May), stagnation (17–22 May), transport (25–31 May), and blocking periods. During the stagnant period, a high-pressure system was persistent over the Korean peninsula, resulting in local air masses being more dominant within the SMA compared to the dynamic and transport (25–31 May) periods. Rex block patterns were observed during the blocking period (1–6 June). During this period, a high-pressure system was adjacent to a low-pressure system over the Korean peninsula, resulting in more local influence with occasional stagnation.
Table 1Summary of the measurements carried out during the KORUS-AQ 2016 field campaign, used in this study.

a Chemiluminescence with a molybdenum converter (Thermo Scientific 42i - TL). b Chemiluminescence detector (Federal Reference Method, Teledyne T200U). c NCAR four-channel chemiluminescence (Weinheimer et al., 1994). d Cavity ring-down spectroscopy (Los Gatos Research NO2 analyzer). e Cavity attenuated phase shift spectroscopy (Teledyne T500U CAPS analyzer). f NASA TROPospheric OZone DIfferential Absorption Lidar (Sullivan et al., 2014). g UV photometric method (2B 211). h Pulsed fluorescence method (Thermo Scientific 43i-HL). i UV florescence method (KENTEK). j Infrared CO analyzer (Thermo Scientific 48i-HL). k Nondispersive infrared CO analyzer (KENTEK). l Chemical ionization mass spectrometer (Slusher et al., 2004). m Proton-transfer-reaction time-of-flight mass spectrometer (IONICON Analytik). n Tunable infrared laser direct absorption spectroscopy (Aerodyne). o Quantum cascade laser spectrometer (Aerodyne). p University of Oslo and University of Innsbruck proton-transfer-reaction time-of-flight mass spectrometer (Müller et al., 2014). q Whole-air sampler (Colman et al., 2001). r Aerosol mass spectrometer (Aerodyne). s University of Colorado, Boulder, aerosol mass spectrometer (Nault et al., 2018). t NASA, scanning mobility particle sizer. u NASA, laser aerosol spectrometer. v NCAR, charge-coupled device actinic flux spectroradiometer (Shetter and Müller, 1999).
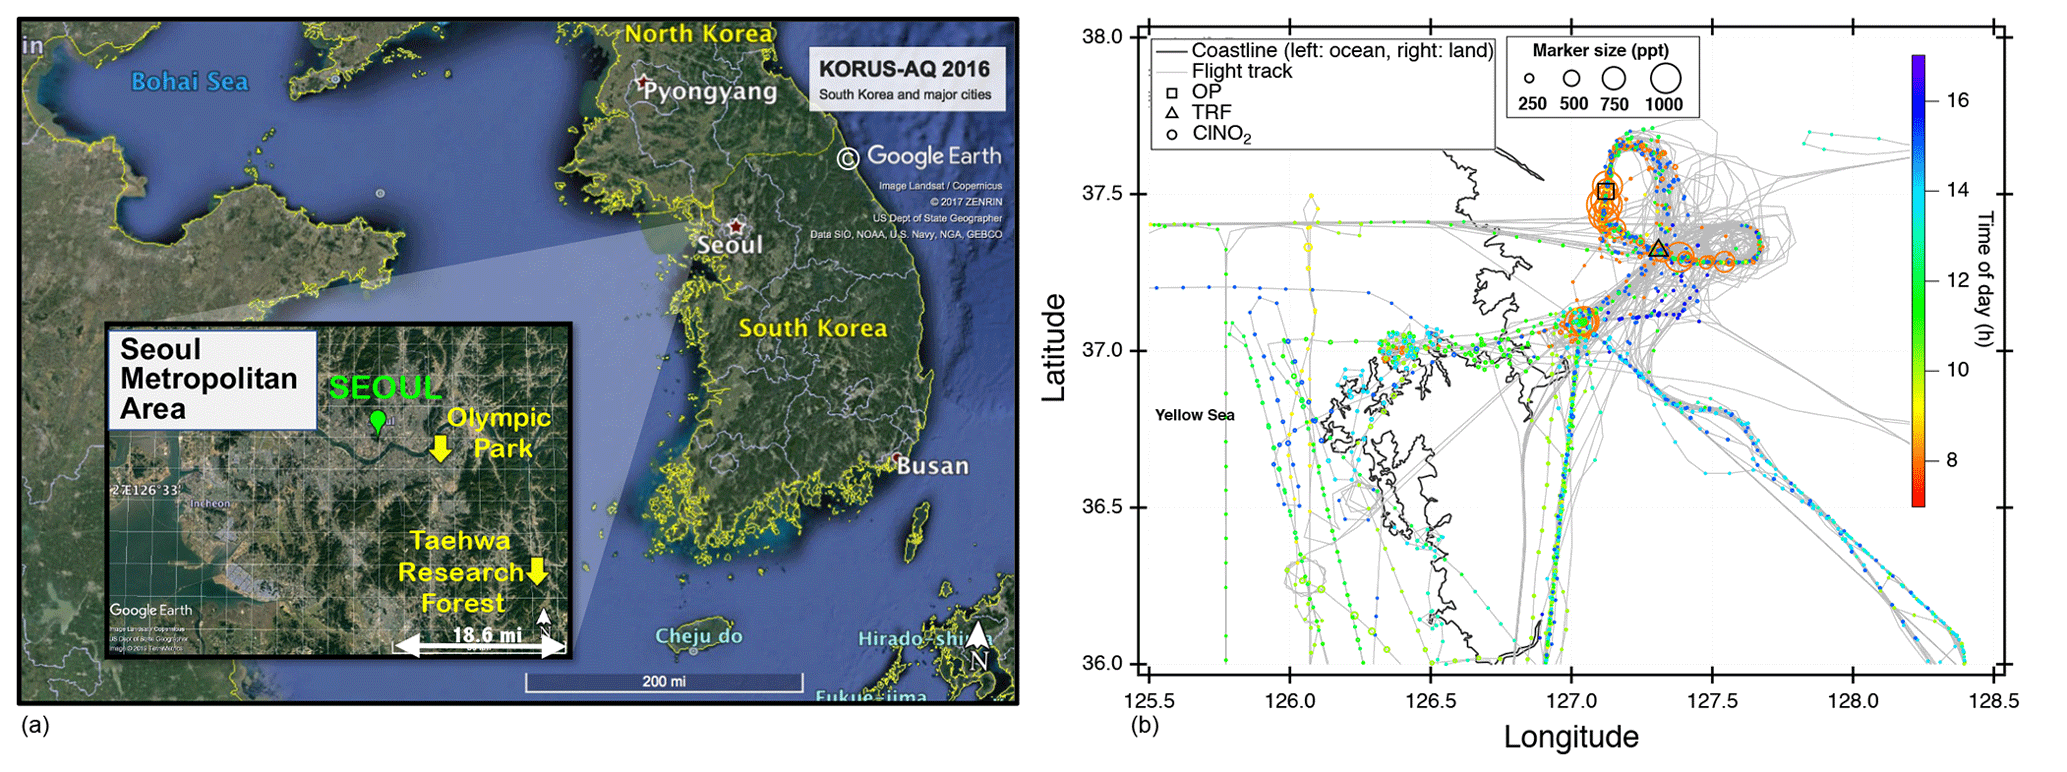
Figure 1(a) Location of two ground sites (Taehwa Research Forest and Olympic Park) where the chemical ionization mass spectrometer (CIMS) was installed during the KORUS-AQ 2016 field campaign. (b) Airborne measurements of ClNO2 and DC-8 flight tracks during the whole campaign. The ClNO2 data points are 60 s averaged and color coded by time of day of the measurement. The marker size is proportional to the mixing ratio of ClNO2.
2.2 Chemical ionization mass spectrometry and calibration
A THS Instruments LLC chemical ionization mass spectrometer (CIMS), using iodide (I−) as the reagent ion, was used for measuring Cl2 and ClNO2 at the two ground supersites and on the NASA DC-8. The system was similar to what is described in Slusher et al. (2004) and Liao et al. (2011), and the inlet configuration during the campaign is shown in Fig. S1 in the Supplement. Ambient air was sampled through a stainless-steel donut-shaped inlet at TRF and a polytetrafluoroethylene (PTFE) tube inlet at OP. The stainless-steel donut inlet has been shown to effectively avoid wall loss of reactive halogens during previous campaigns (Liao et al., 2011). The lengths of the inlet lines of the three CIMS systems were 20–30 cm. The PTFE inlet line at the TRF site was washed on a weekly basis and the ones at OP and the DC-8 were not washed routinely during the campaign due to difficulties detaching the inlet. The potential bias of interactions of Cl2 and ClNO2 inside the inlet were not tested but the artifacts have been shown to be negligible in various field conditions (Riedel et al., 2012; Thornton et al., 2010; Liao et al., 2014). Therefore, the use of different types of inlets (e.g., the use of the donut), described above, at the two ground sites and on the DC-8 is not expected to be an issue for the quantitative comparisons in this study. The sampled air went through the first three-way valves to be delivered to an ambient or charcoal scrubber mode for background, alternating every 5 min. The second three-way valve was for heated (150 ∘C) and unheated cycles. ClNO2 and Cl2 were only quantified during the unheated cycles to avoid any potential artifacts as described in Liu et al. (2017). A total of 3000 standard liters per minute (slpm) was drawn in with a blower with an additional flow of 4 slpm drawn at the end of the inlet to reduce the residence time and 1 slpm was sampled into the CIMS. All the inlet parts, after the blower, including the fittings and tubings, were made of PTFE. In the flow tube, the target compounds form clusters with I− (Reactions R5–R6; Huey, 2007; Huey et al., 1995; McNeill et al., 2006), which were generated by flowing 1 slpm N2 through a methyl iodide (CH3I) permtube oven maintained at 50 ∘C. Polonium (NRD LLC, Static Master; model: 2U500; activity: 20 mCi) was used as the radioactive source for ionization. Clusters of Cl2 isotopes were detected at the mass-to-charge ratio (m∕z) of 197 and 199, and ClNO2 was measured at 208 and 210. The natural abundance of Cl2 and ClNO2 isotopes is approximately () and 3:1 (35ClNO2:37ClNO2), respectively. Mass 201 (37Cl37Cl) was not considered in the data processing due to artifacts.
Calibrations of Cl2 and ClNO2 were carried out during and after the campaign. Cl2 in a cylinder (Airgas, 10 ppm in N2) was diluted with zero air to be sampled in either ambient or scrubber (charcoal) mode (Fig. S1 in the Supplement). The Cl2 in the cylinder was quantified through the method described by Liao et al. (2012) and was 8.84±0.43 ppm. ClNO2 was synthesized, based on Thaler et al. (2011). Briefly, Cl2 gas in N2 was passed through a pyrex reservoir (diameter = 1.3 cm, length = 5.5 cm) containing a bed of NaCl (MACRON) and NaNO2 (Sigma Aldrich) with a molar ratio of 10 to 1. This slurry mixture contains that reacts with the flowing Cl2 to generate ClNO2. The output flow was further diluted with 4 L min−1 of zero air in order to sufficiently provide gas flow. The flow containing synthesized ClNO2 was then analyzed at m∕z of 208 and 210 with the CIMS. NO2 and NO-NOy were simultaneously measured with a cavity ring-down spectrometer (CRDS, Los Gatos Research, detection limit: 10 pptv, precision: 50 pptv at 1σ, model: 907-0009-0002) and chemiluminescence (CL, Thermo Scientific, detection limit: 50 pptv, model: 42 i), respectively. ClNO2 is detected as NOy in the CL through conversion to NO on the heated (325 ∘C) molybdenum catalytic converter (Williams et al., 1998). The efficiency of the conversion was assumed to be unity. Therefore, ClNO2 could be determined by comparing the three instruments and subtracting the byproducts (HONO and NO2) from the total NOy. The averaged sensitivity of Cl2 was 31.5±11.2 Hz ppt−1 and ClNO2 was 19.7±1.5 Hz ppt−1 . The two sigma detection limits of Cl2 and ClNO2 were 2.9 and 1.5 ppt, respectively, over 30 min.
2.3 Modeling
We used Framework for 0-D Atmospheric Modeling (F0AM v3.1) for simulating three types of simulations: (1) daytime Cl2 production (Fig. 5), (2) in situ ClNO2 production in the morning (Fig. 8), and (3) the impact of measured ClNO2 on the regional tropospheric chemistry (Fig. 10). F0AM is a MATLAB-based open-source box model. Detailed descriptions of the model can be found in Wolfe et al. (2016). Each step of the model was constrained with the averaged meteorology parameters (e.g., pressure, temperature, relative humidity) and trace gases observed at the two ground sites during the campaign. The constrained trace gases include ClNO2, Cl2, O3, NO, NO2, CO, CH4, and 20 non-methane hydrocarbons including eight alkanes (i.e., ethane, propane, iso-butane, n-butane, iso-pentane, n-pentane, n-hexane, and n-heptane), that have relatively high reaction rate constants with Cl•. A constant meteorology and trace gas observation set, collected at the corresponding time period, was constrained throughout the 72 h model simulation presented in Fig. 5. Then, the Cl2 concentrations at the end of the 72 h simulation are compared to simultaneously observed mixing ratios of ClNO2 in Fig. 5. Simulations in Fig. 8 were constrained similarly to those in Fig. 5 but allow ClNO2 concentrations to vary with time in order to assess ClNO2 production predicted by the model. The model simulation presented in Fig. 10 was constrained with a diurnal variation in the parameters. A full diurnal cycle of the model was for 24 h consisting of a total of 864 steps and each step was integrated for 100 s. Each step of the model was constrained with observations measured at that time of day. To assess the impact of ClNO2 chemistry on net O3 production, all species were constrained except for NO2 and O3, which were initialized with observed values and allowed to vary in time. Photolysis rate constants were derived through the hybrid method (Wolfe et al., 2016) in the F0AM box model. This method uses clear-sky solar spectra from the tropospheric ultraviolet and visible radiation model (TUV v 5.2) and cross sections and quantum yields suggested by IUPAC. To capture the effects of pollution on photolysis rates, the ratio of the measured to the F0AM-modeled was calculated. This ratio was then applied to other photolysis rate constants calculated in the model. Measured was taken from the DC-8 actinic flux measurements (charge-coupled device actinic flux spectroradiometer; CAFS) when flying near the SMA at altitudes under 1 km. A diurnal cycle was applied to the DC-8 measurement to determine j values at other times of day. Photolysis rate constants of ClNO2, Cl2, and ClONO2 were not present in the F0AM model and were therefore taken directly from the DC-8 measurements to be used in the model runs in this study. The Master Chemical Mechanism v3.3.1 (MCM) was taken from http://mcm.leeds.ac.uk/MCM (last access: 10 July 2019) and embedded in the box model. MCM v3.3.1 has a detailed gas photochemistry (i.e., 5832 species and 17 224 reactions), including the oxidation of CH4 and 142 non-methane primary emitted VOCs (Jenkin et al., 2015). Since MCM v3.3.1 only includes Cl• reactions with alkane species, additional chlorine chemistry was embedded in the model, similar to what Riedel et al. (2014) reported. This was done by including multiple Cl• precursors (e.g., Cl2, ClNO2, HCl, ClONO2, HOCl) and Cl• reactions with non-alkane VOCs, such as alkene, alcohol, aromatics, alkynes, ketones, organic acids, and nitrates. All the reactions embedded in the model can be found in the supplementary material of Riedel et al. (2014) and Wolfe et al. (2016). Boundary layer height, emissions, and depositions were not considered in the model. More details on the setup of the box model are in the Supplement (S3). The FLEXible PARTicle dispersion model (FLEXPART v9.1, https://www.flexpart.eu, last access: 10 July 2019) was used for the air mass source contribution (Fig. 3) and backward trajectory analysis (Fig. 9). The backward trajectories reported in our study were initialized at 09:00 LST at TRF, going 24 h back in time. Only the center of the mass-weighted particles is shown in Fig. 9 and clusters are included in the supporting information. These clusters represent fractional contributions of air masses (Fig. S10). The trajectories were driven by the National Centers for Environmental Prediction (NCEP) Global Forecast System (GFS) with a 0.25∘ resolution. Influence of air mass originating from the ocean at TRF and OP was calculated every 6 h following an air mass 5 d back in time. Meteorology was driven by WRF with a 5 km horizontal resolution. Since emissions of CO are very low in the ocean, and assumed to be inert in the model, it was used as a tracer for contribution of air originating from the ocean within a given air mass at each ground site.
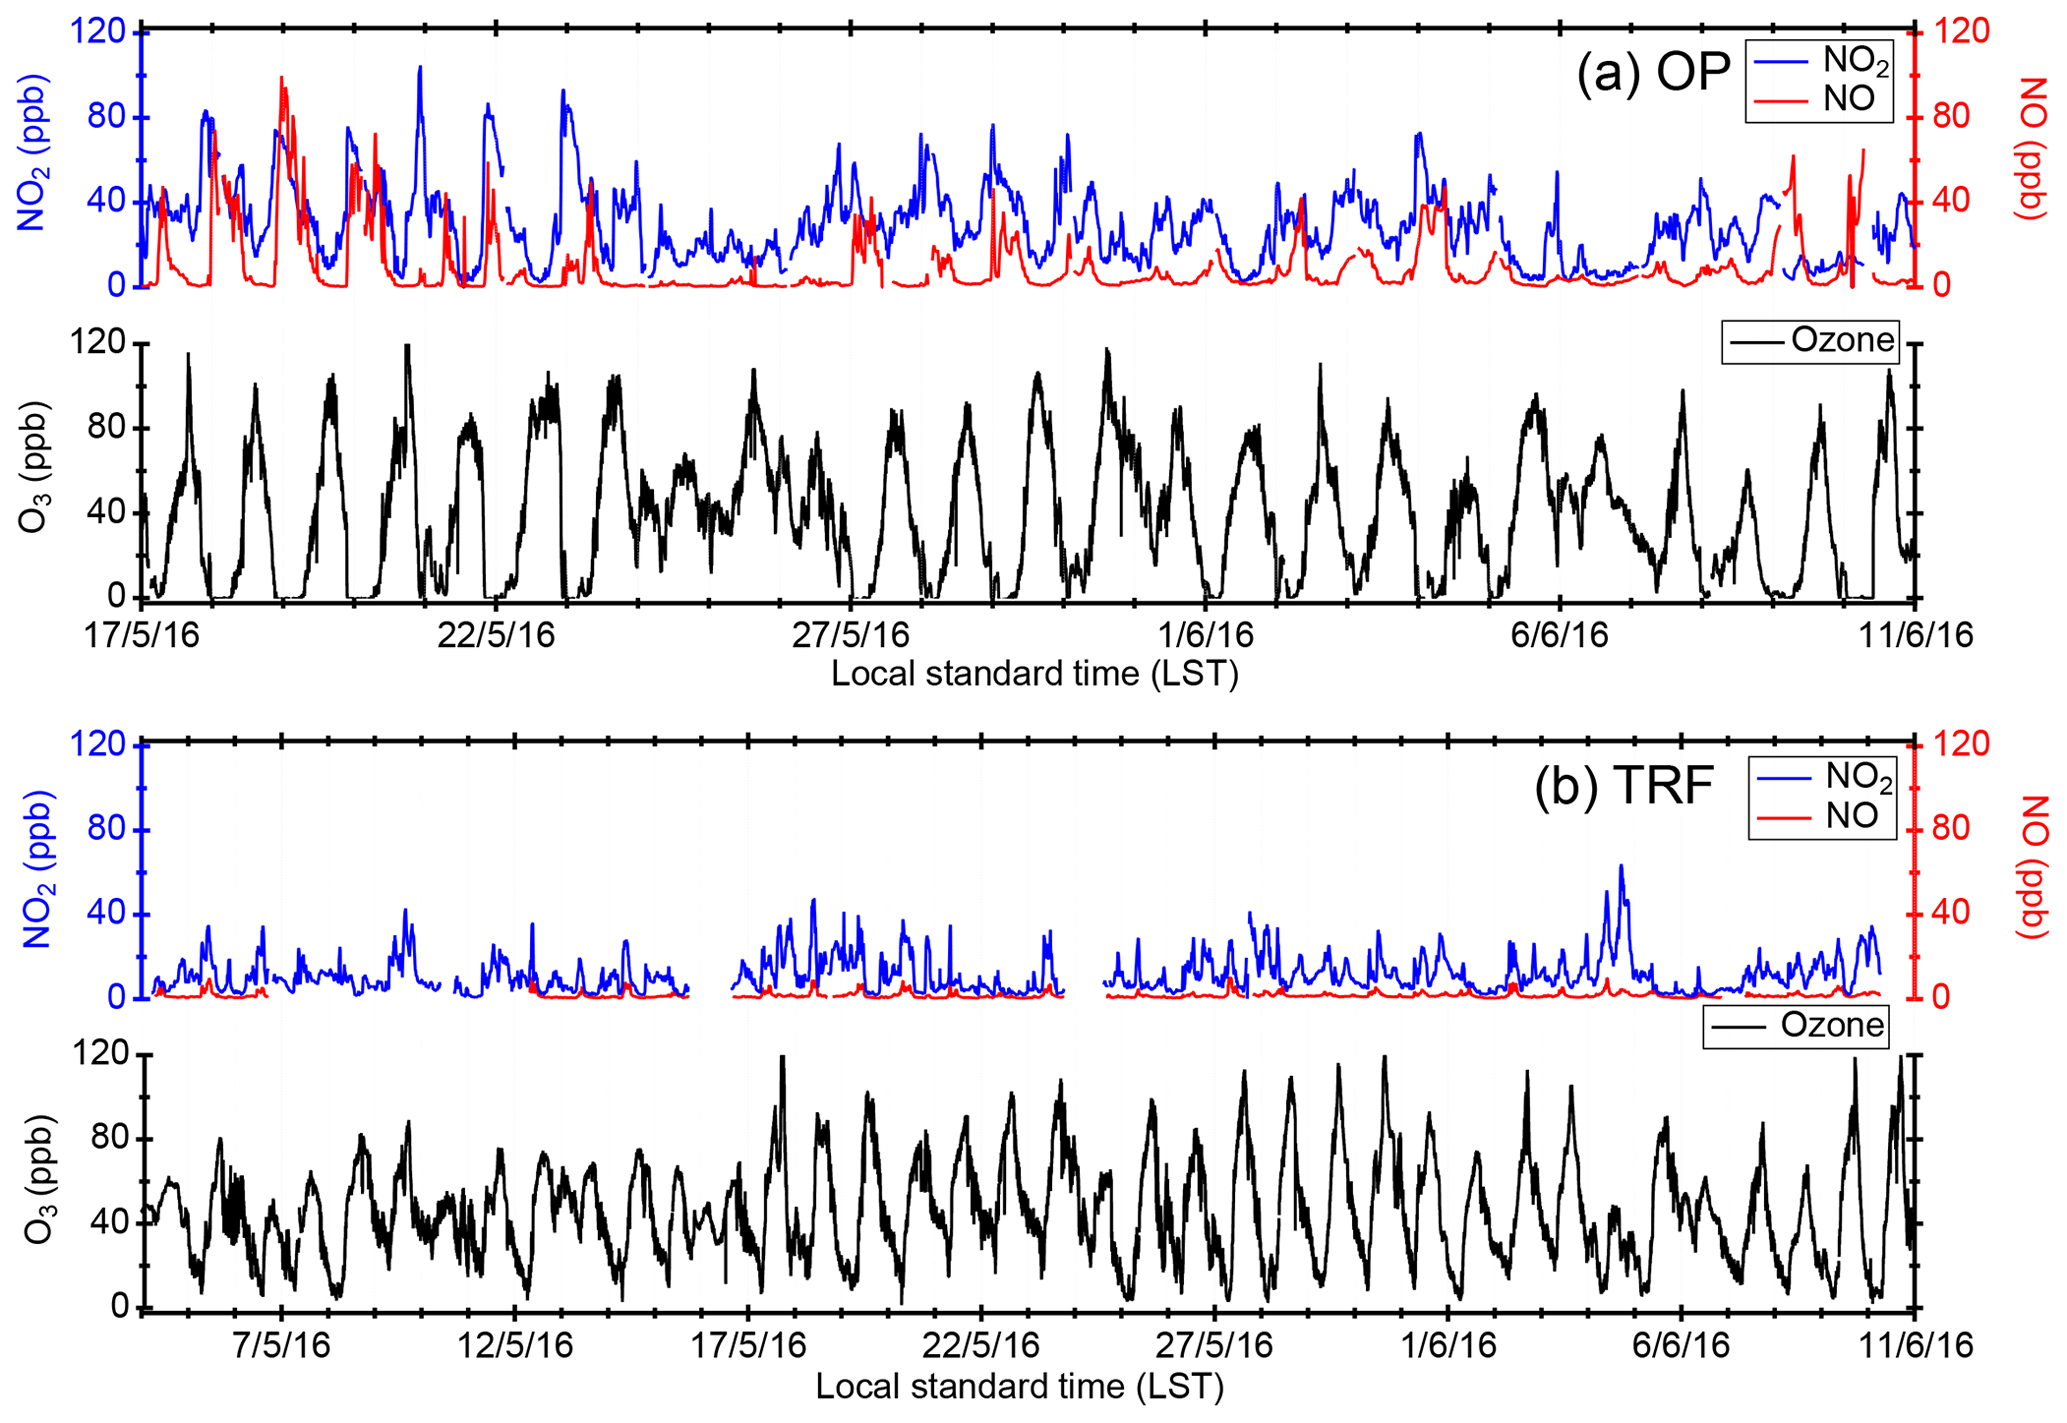
Figure 2Temporal variation in trace gases measured at the (a) Olympic Park site (OP) and (b) Taehwa Research Forest (TRF). For both OP and TRF, the frequency of the averaged data is 10 min for NOx and 1 min for O3.
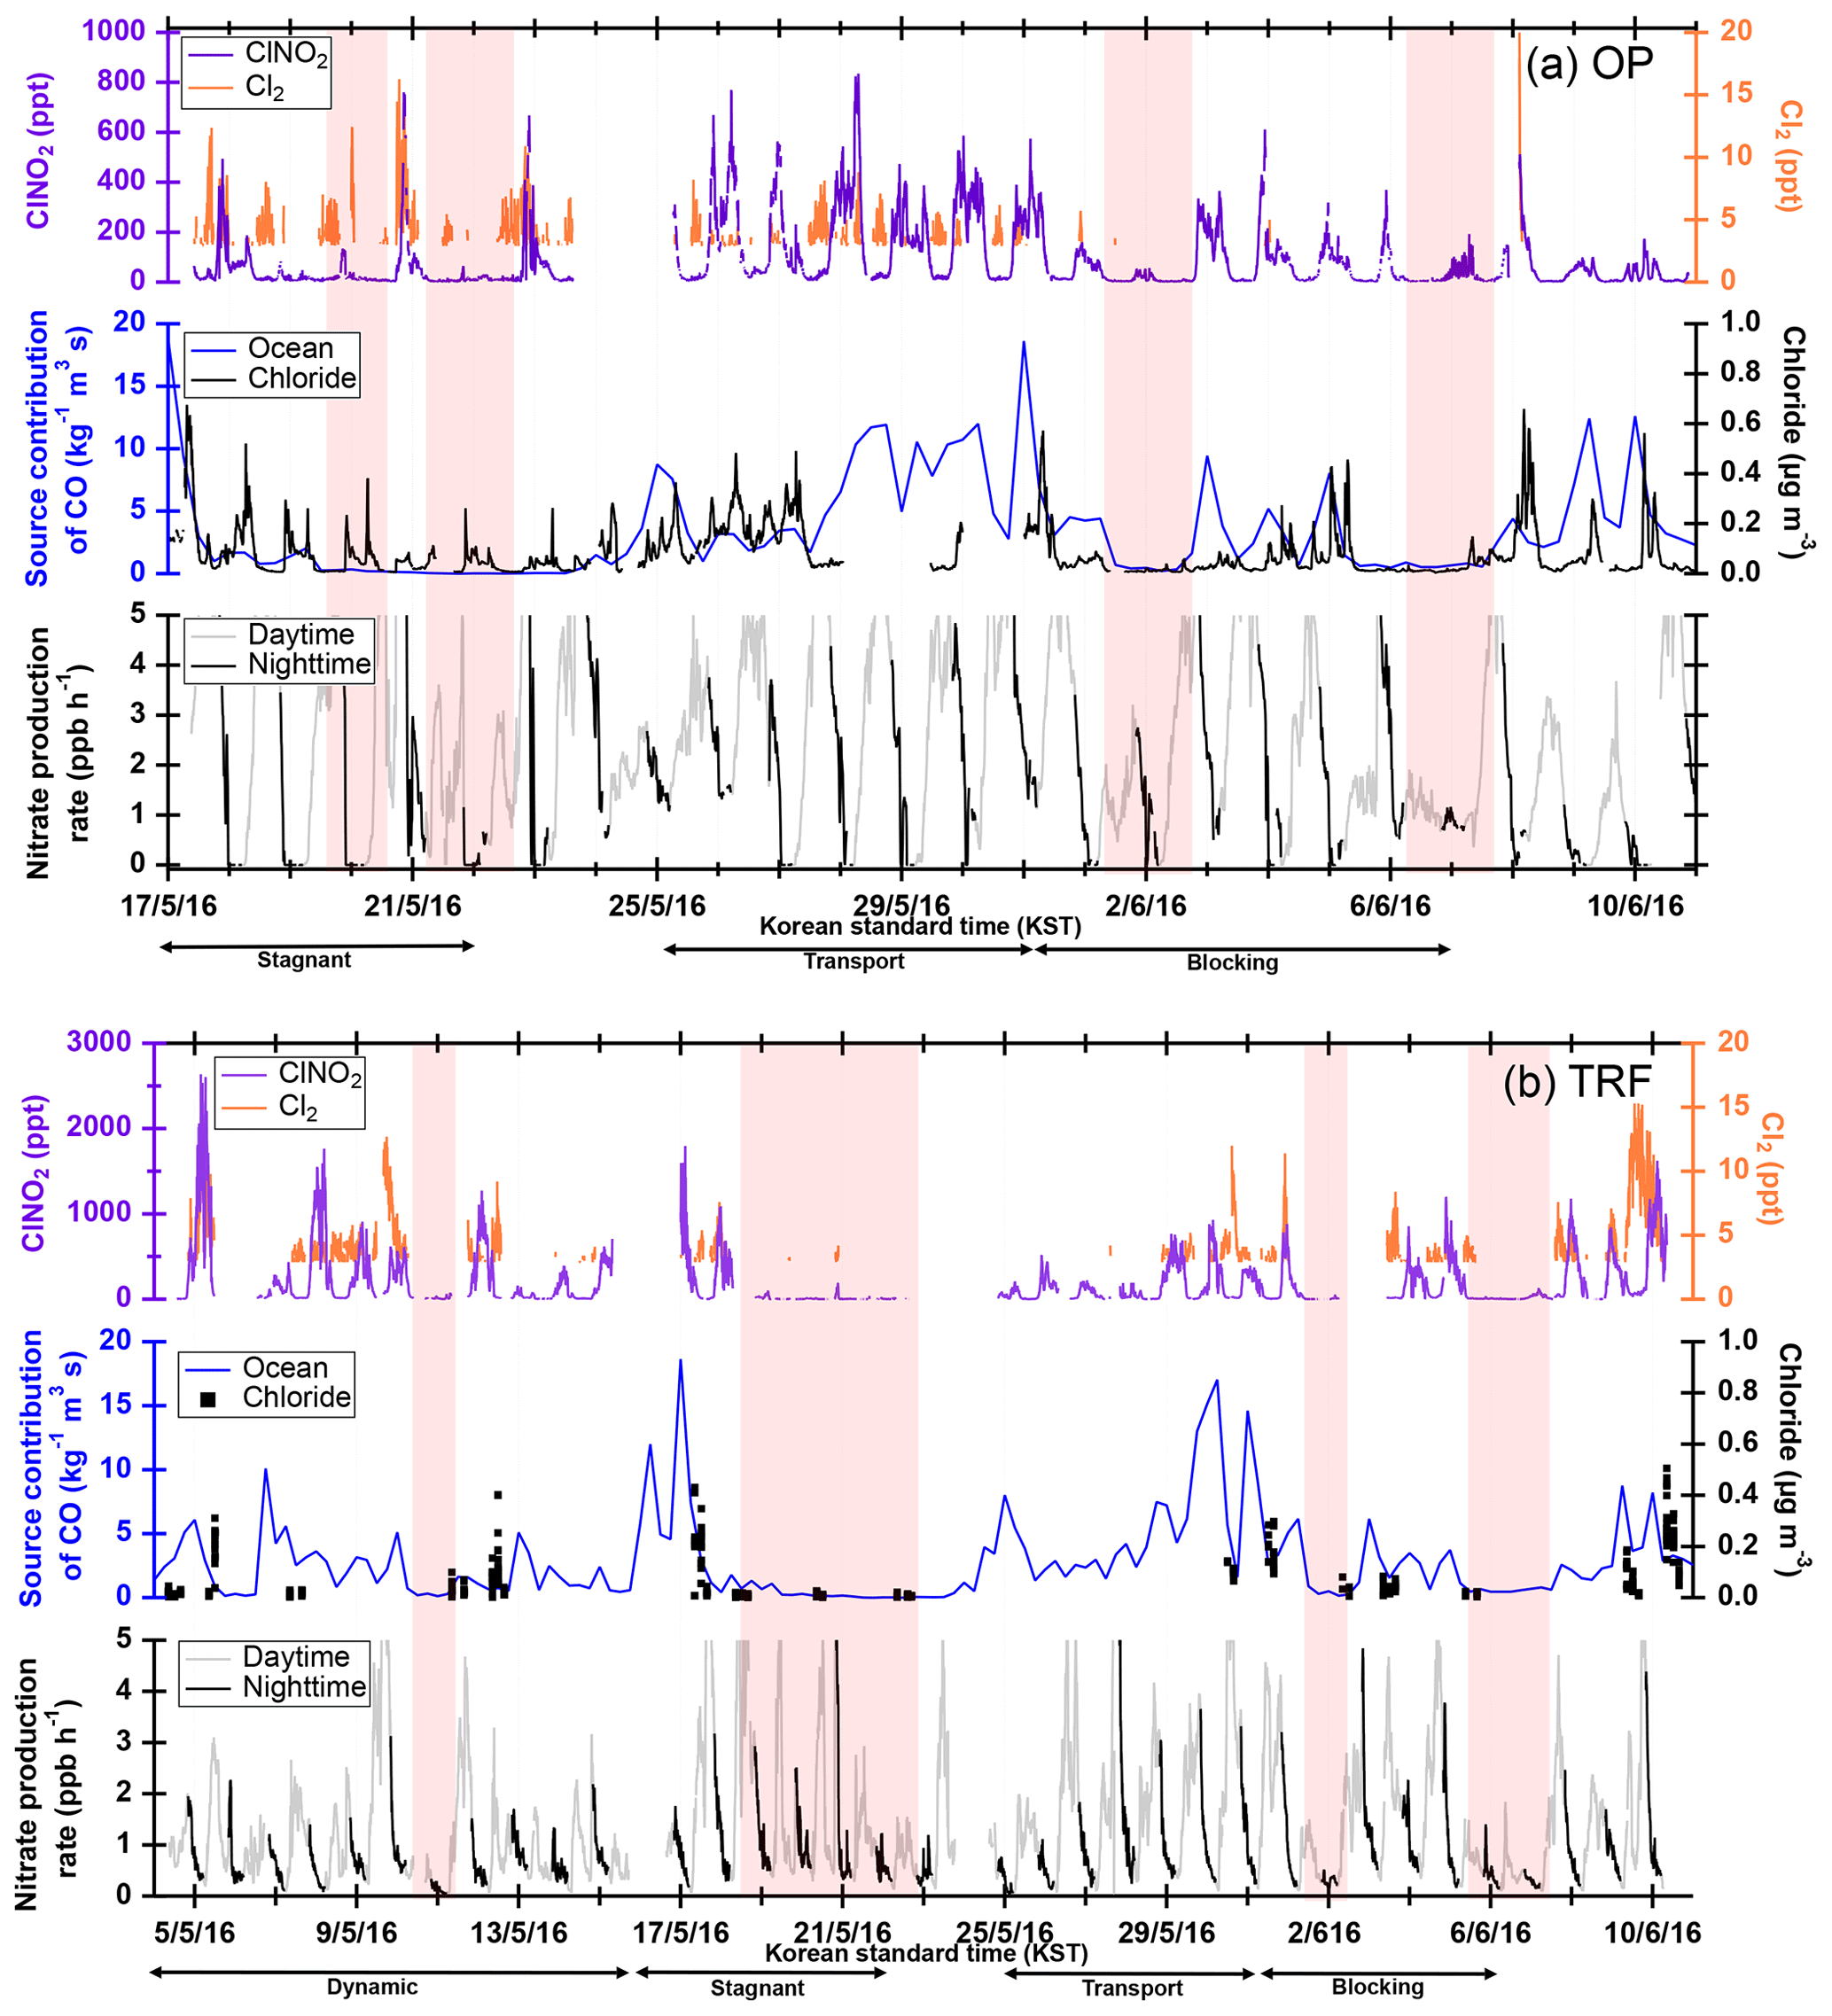
Figure 3ClNO2 and Cl2 observation results at (a) OP and (b) TRF averaged over 5 min. FLEXPART back-trajectory analyses were made for source contribution of CO-like substances originating from the ocean, assuming inert CO. Aerosol chloride mass concentration (ambient micrograms per cubic meter) was measured at the ground for the OP site and on the NASA DC-8 for TRF. For the airborne chloride, measurements below 1 km over the TRF site are shown. Red shades are the time frames with limited ClNO2 production. The time frames for each meteorological condition that dominated during the observation period are shown as black arrows at the bottom of (a) and (b).
3.1 ClNO2 observations
Figure 2 shows the temporal variation in trace gases measured during the campaign at (a) the OP site (17 May–11 June) and (b) the TRF site (5 May–11 June). The OP site, which was located near heavy traffic, showed high levels of NOx throughout the campaign. During most nights (except for 24–26, 30–31 May, and 6–7 June), O3 was completely titrated by NO. On the other hand, at the TRF site, which is a forested region downwind of the urban area, O3 remained at ∼30 ppbv throughout the night. During the measurement period, measurable amounts of ClNO2 were observed at both ground sites (Fig. 3). The maximum observed ClNO2 was ∼800 pptv (5 min averaged) and ∼2.5 ppbv (5 min averaged) at the OP and TRF sites, respectively. At both sites, ClNO2 started accumulating at sunset and rapidly photolyzed upon sunrise, which was ∼ 05:30 local standard time (LST) during the campaign. The nighttime relationship between ClNO2 and Cl2 varied day by day and did not show a clear correlation. This implies that the sources or loss processes of Cl2 and ClNO2 were not consistent at night. This is similar to Riedel et al. (2012), where they reported a wide range of correlation between Cl2 and ClNO2 off the coast of Los Angeles.
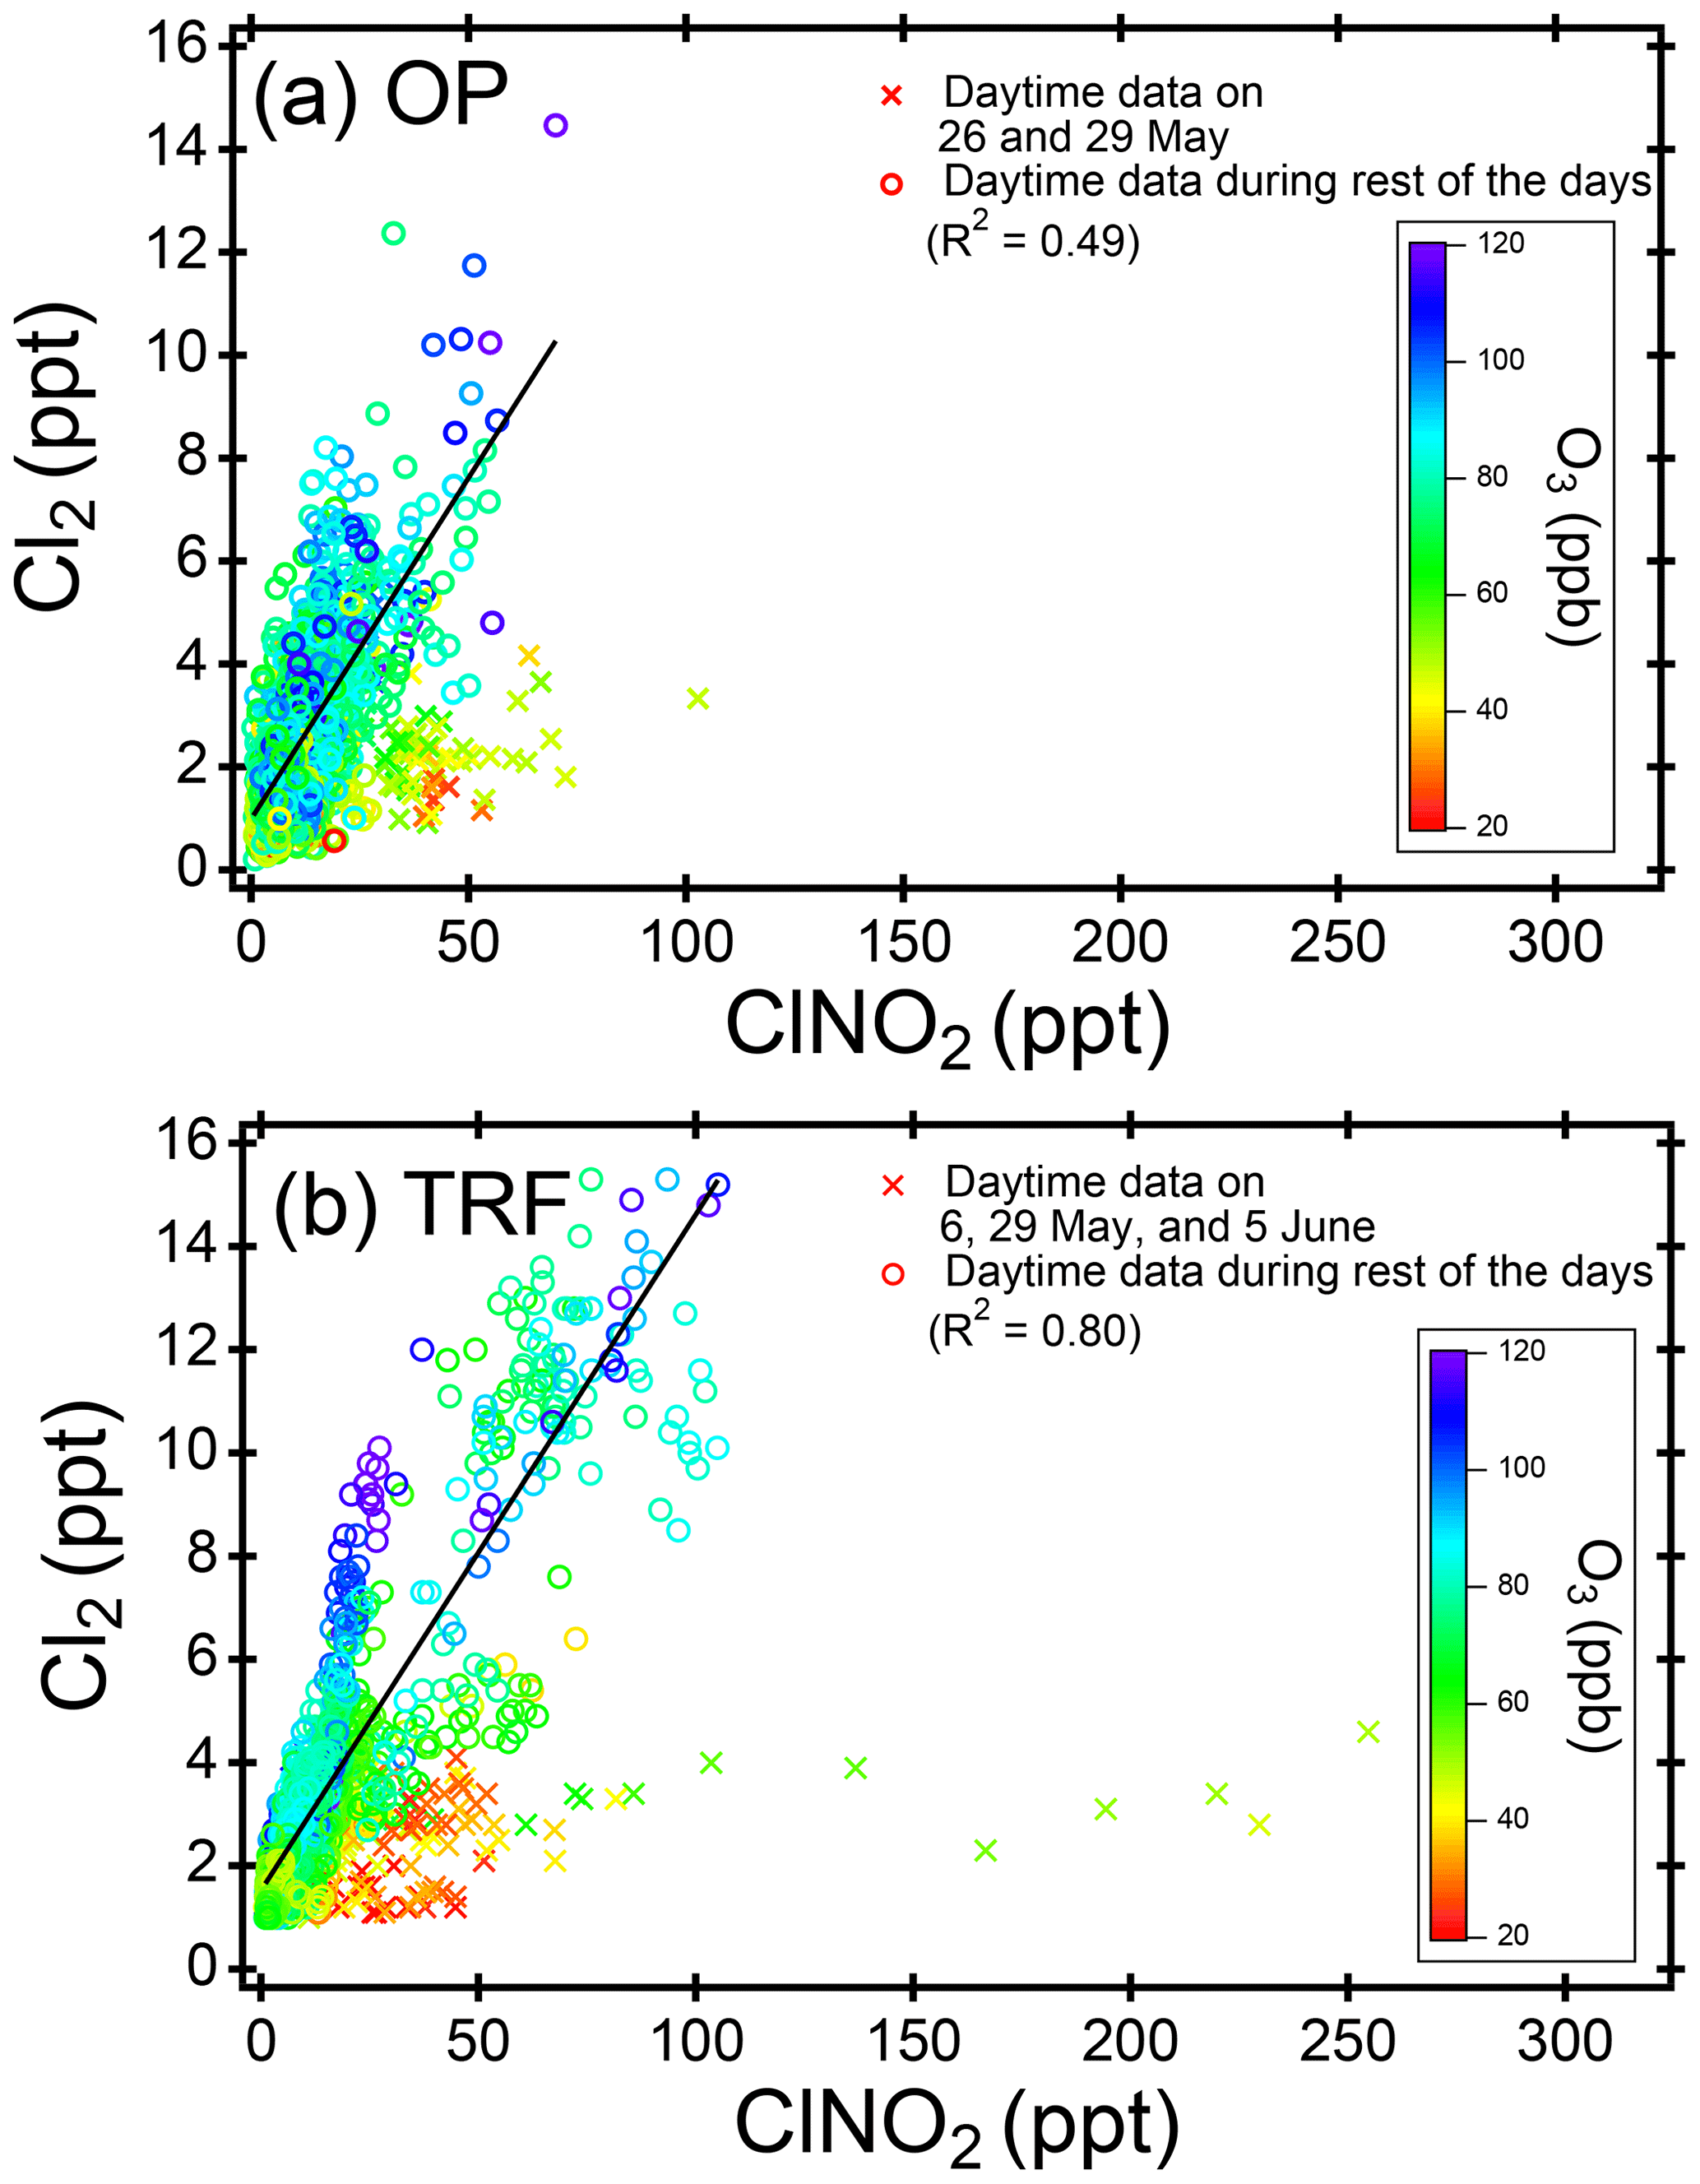
Figure 4Scatter plot of daytime (11:00–18:00 local time) ClNO2 and Cl2 at (a) OP and (b) TRF, color coded with measured O3. The 5 min averaged data for the whole campaign were used for both sites. Data points of Cl2 below detection limit (2.9 ppt, 2σ, over 30 min) are shown for the purpose of comparison to observed ClNO2 levels.
Daytime (11:00–18:00, LST) ClNO2 was up to ∼100 pptv at OP and ∼250 pptv at TRF (Fig. 4). The level showed a positive correlation with Cl2, especially in relatively high O3 conditions (>50 ppbv). When O3 was relatively low (<50 ppbv), Cl2 production was suppressed, while ClNO2 was not necessarily limited. Excluding the days with low O3 (i.e., 26 and 29 May for OP and 6, 29 May and 4 June for TRF), the relationship between daytime ClNO2 and Cl2 showed positive correlation with R2 of 0.49 and 0.80 for OP and TRF, respectively. This positive correlation is consistent with the results reported by Liu et al. (2017) in the North China Plain. In their study, up to ∼450 pptv of both Cl2 and ClNO2 was measured during the daytime (10:00–20:00, LST), with strong correlation of R2=0.83. Cl2 levels were also suppressed in low O3 and OH conditions during low solar radiation periods. Therefore, the authors suggested that daytime Cl2 levels could be positively related to photochemical activities. Considering the short lifetime of Cl2 and ClNO2 during the day (i.e., 11:00–18:00 LST in our study), the levels we observed are likely affected through local production. According to Liu et al. (2017), the air mass showed moderate correlation to SO2 with possible influences from power plants. However, in this study, the ClNO2 measured at both the OP and TRF sites was weakly correlated with SO2 (R2=0.02), which implies that the air masses that we sampled are not fresh emissions from coal combustion activities such as power plants.
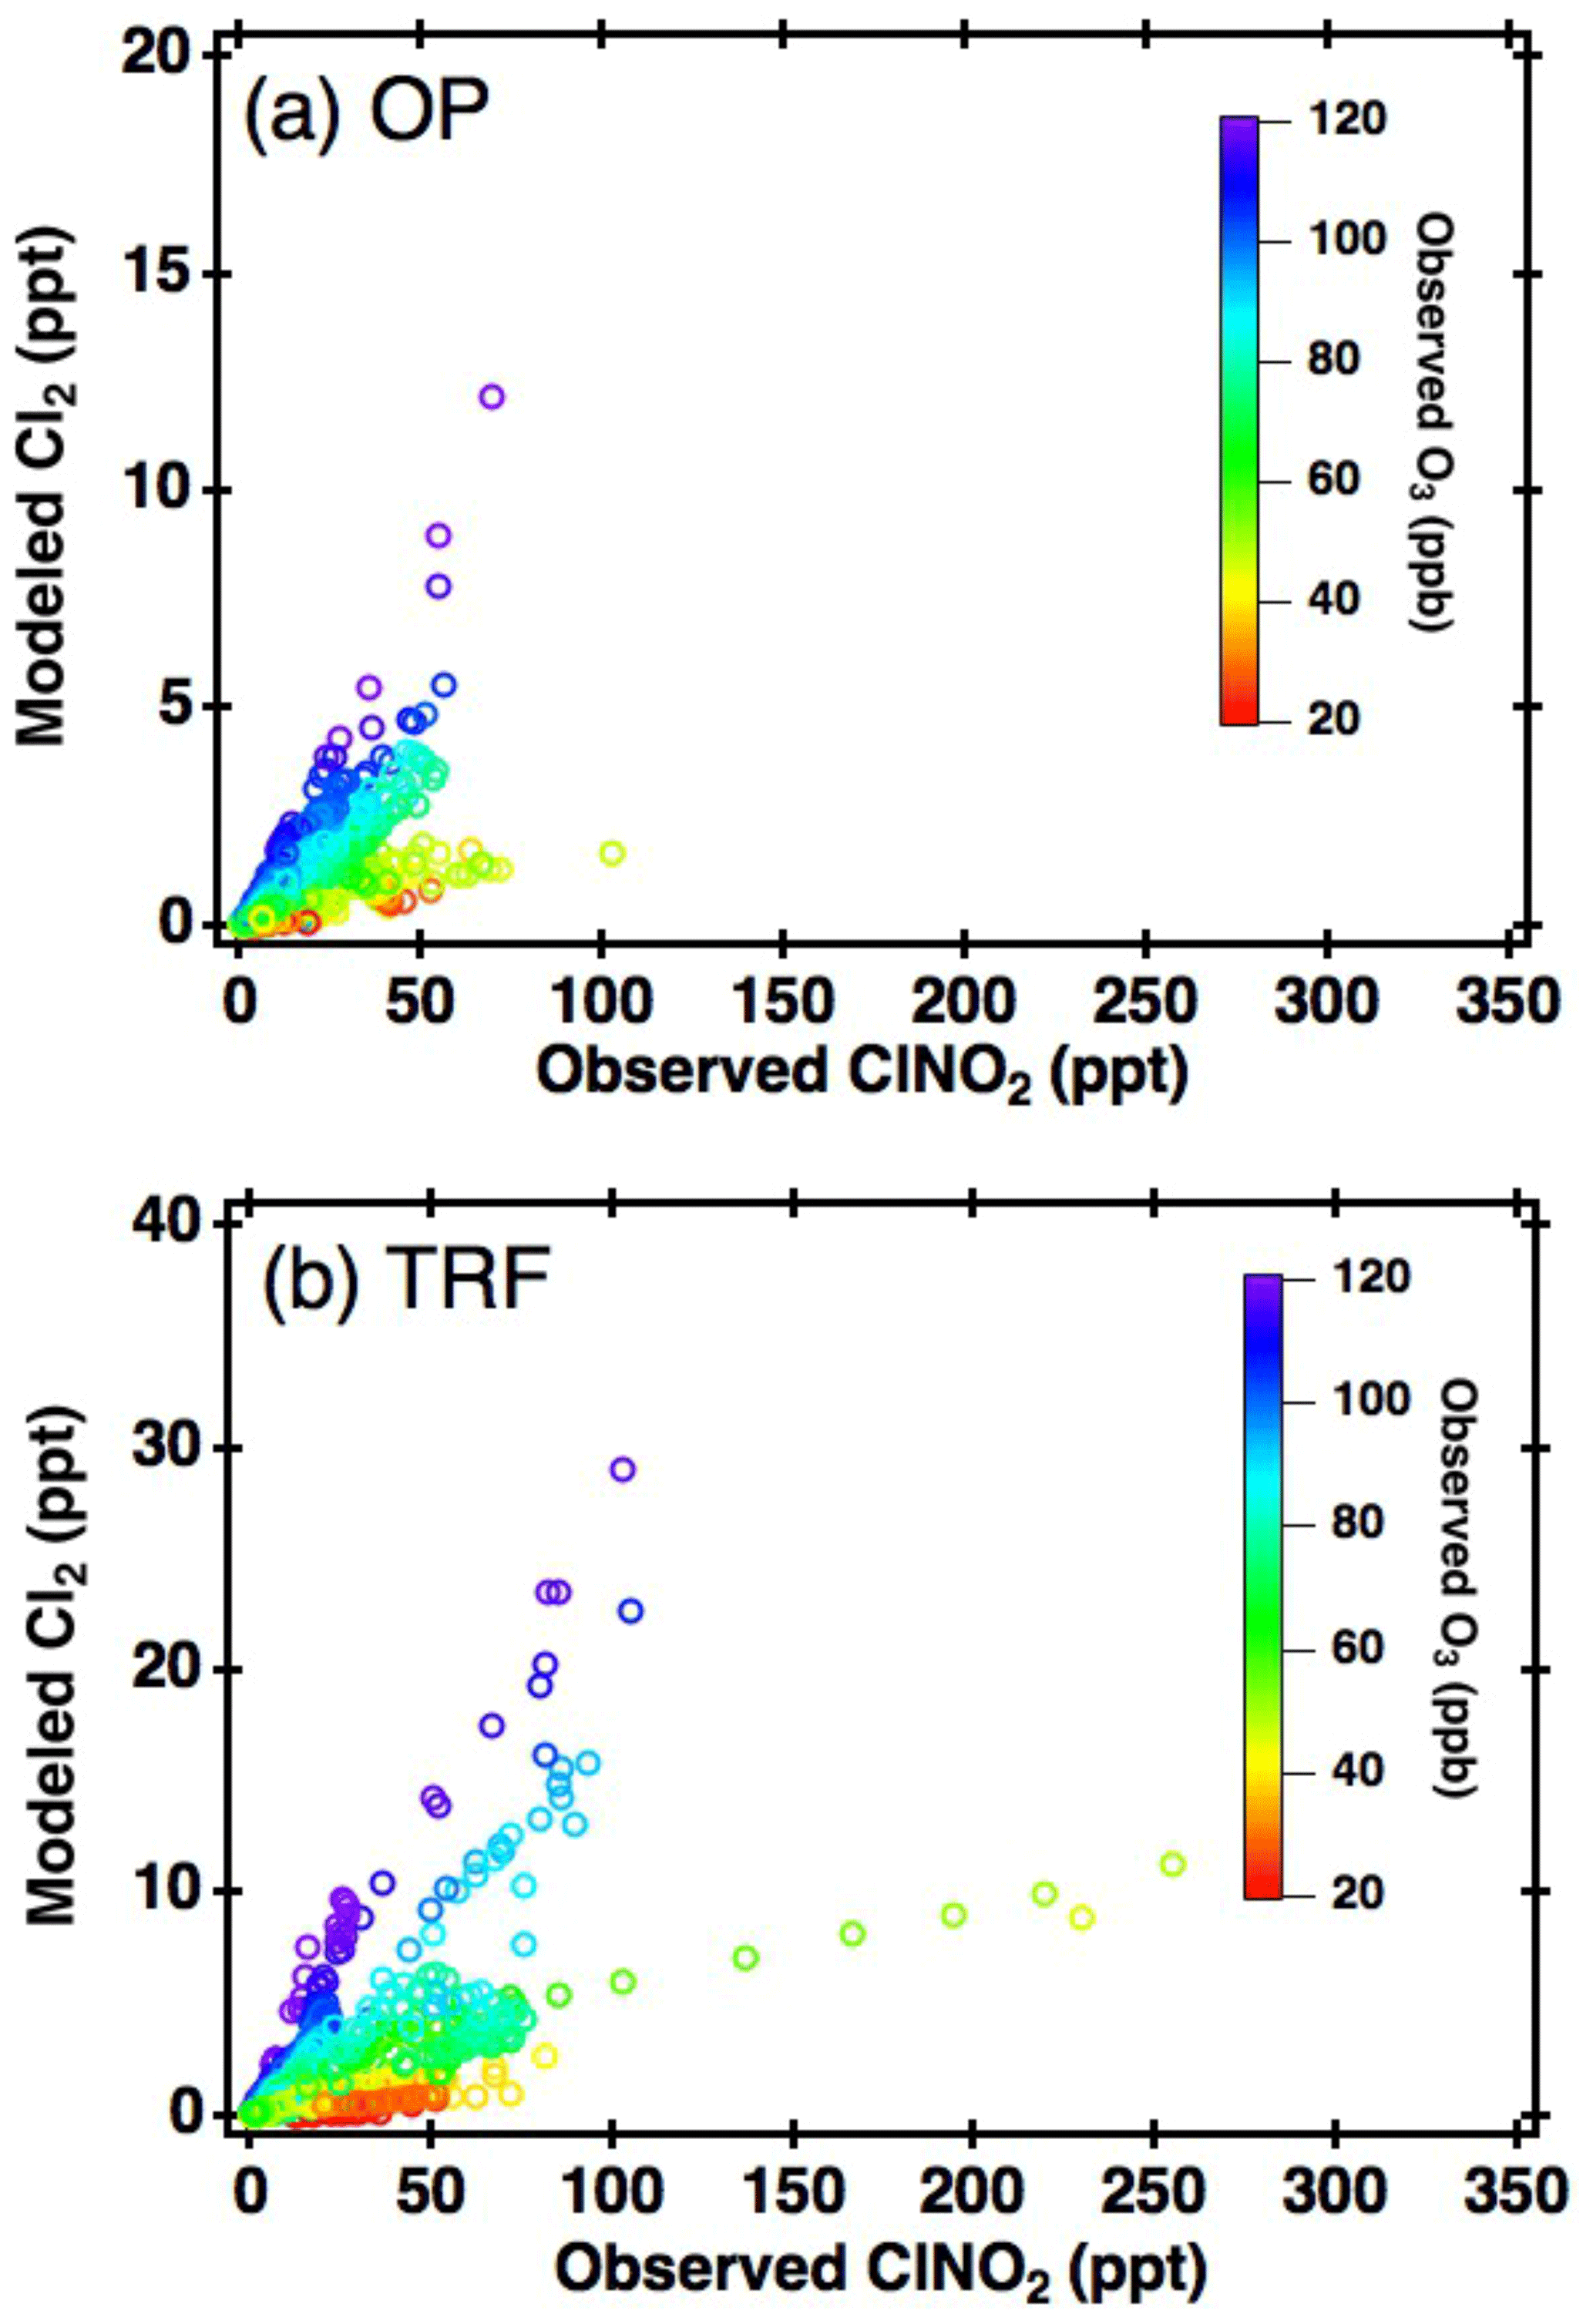
Figure 5Correlation between box-model-simulated daytime (11:00–18:00 local time) Cl2 and measured ClNO2 at (a) OP and (b) TRF, color coded with measured O3.
The first possibility we explored is the direct generation of Cl2 from reactions in acidic particles. ClNO2 is very insoluble ( Rossi, 2003) in near-neutral pH. However, according to Roberts et al. (2008), can increase up to 3 orders of magnitude on acidic surfaces (∼ pH 1.8), leading to direct production of gas-phase Cl2. Aerosol acidity was mostly below pH 2 during the campaign, based on thermodynamic calculations, constrained with airborne observations (Fig. S3). Therefore, the efficiency of this reaction in ambient conditions requires further investigation. Another possibility is the autocatalytic production of Cl2 from heterogeneous reactions of gas-phase ClONO2 (i.e., , Gebel and Finlayson-Pitts, 2001; Deiber et al., 2004) and HOCl (i.e., ; Vogt et al., 1996) on particles. These reactions are also favored as particle acidity increases. In order to further investigate its possibility, daytime Cl2 was simulated by constraining the box model with measurements of ClNO2 and other trace gases corresponding to each data point in Fig. 4. Based on the availability of parameters, we were able to simulate 1680 and 1229 runs for OP and TRF, respectively. This corresponds to more than 96 % of the daytime data points shown in Fig. 4. and γHOCl were set to 0.06 (Deiber et al., 2004; Hanson et al., 1994; Hanson and Ravishankara, 1994), which is an upper limit of previous laboratory studies, and the yields were assumed to be unity. HCl generation from hydrogen abstraction of VOCs by Cl• were included in the mechanisms used in the model runs. The end points of the 72 h simulation results are presented in Fig. 5. As shown in the figure, the box model simulations were able to reproduce the positive correlation between Cl2 and ClNO2. Moreover, modeled Cl2 was suppressed in low-O3 conditions, which corresponds to the observations. This can be explained by Cl• reacting with O3, producing ClO•, leading to gas-phase ClONO2 and HOCl production. These can react on acidic aerosols to generate Cl2. Sources of Cl• could be from photolabile gas-phase chlorine compounds (e.g., Cl2, ClNO2, ClONO2, HOCl) or oxidation of gas-phase HCl by OH. Although the reaction between HCl and OH is relatively slow ( cm3 molecule−1 s−1 at 298 K; Atkinson et al., 2007), it has been reported to be a significant source of Cl• in the daytime (Riedel et al., 2012). A sensitivity test was carried out by comparing modeled Cl2 between runs with and without HCl production from oxidation of VOCs by Cl• (Fig. S4c, d). The results show that production of Cl2 was suppressed by 40 %–70 % when HCl was not generated in the model. This significant contribution of gas-phase HCl as a Cl• source should be an upper limit as the deposition of HCl was not considered in the model. Nonetheless, our analysis leads us to conclude that the mechanisms we have explored could be the main contributors of the daytime Cl2 production during KORUS-AQ.
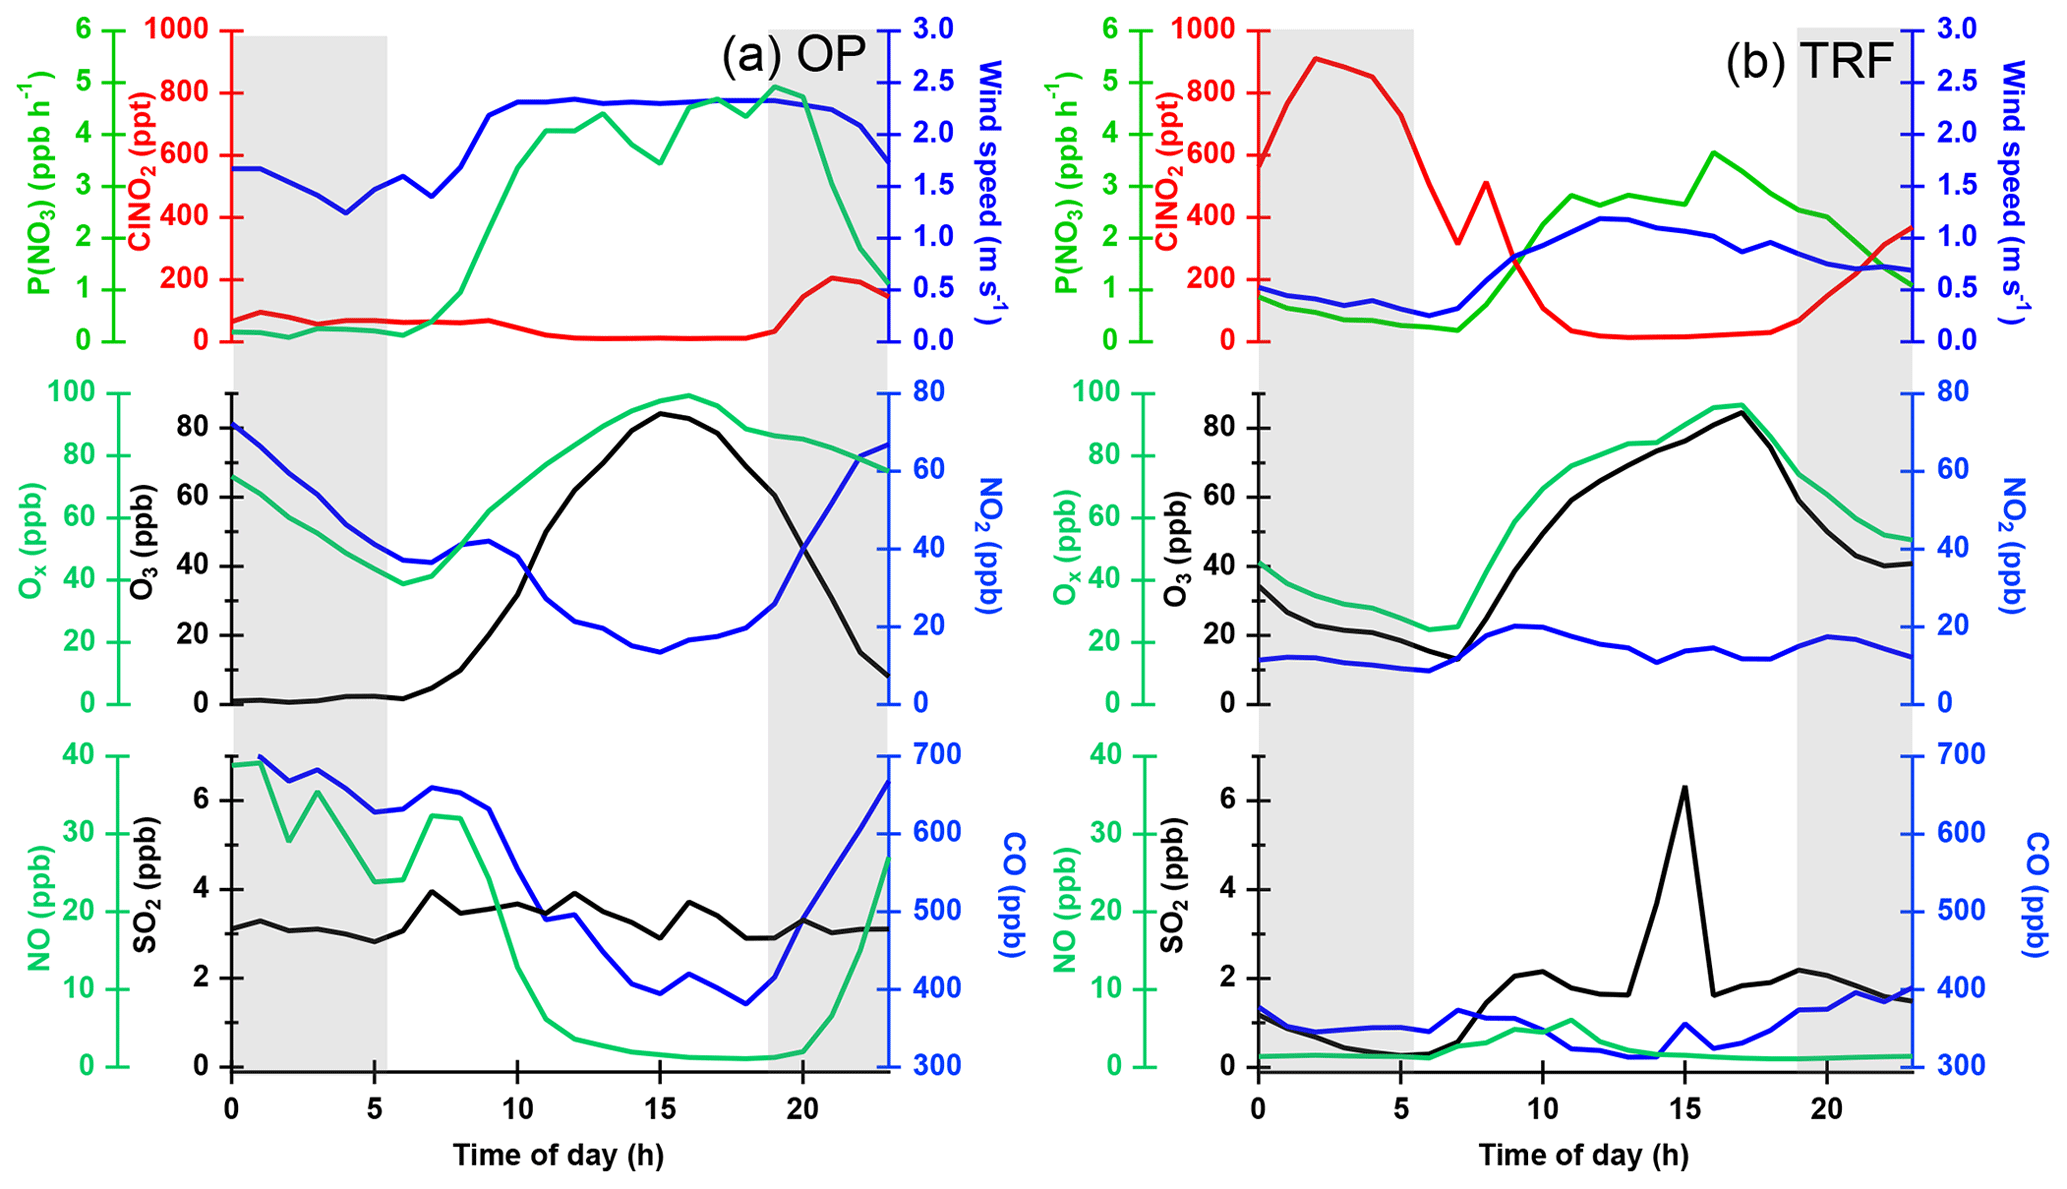
Figure 6Diurnal variation in ClNO2 and other trace gases measured during the campaign and averaged over selected days at (a) OP (7 d) and (b) TRF (9 d). Nighttime is shown as grey shades.
3.2 Sources of ClNO2
FLEXPART source contribution analysis shows that the level of ClNO2 at the ground sites was highly correlated with the origin of the air mass (Fig. 3). During the nights shaded in red in Fig. 3 (OP: 20, 22 May, 2 and 7 June; TRF: 11, 19–22 May, 2 and 6–7 June), there was limited production of ClNO2 at the surface. These periods mostly corresponded to meteorological conditions of stagnation or blocking events, which both resulted in localized air masses to be more dominant with limited influence from the west coast. Stagnation events can be characterized by low wind speeds and increased atmospheric stability, possibly leading to enhanced levels of pollutants like NOx. Previous studies have shown that stagnant conditions can result in enhanced levels of N2O5 driven by high ozone and NO2. However, ClNO2 production was limited during stagnation events in this study. This is likely due to limited availability of chloride as shown in submicron particle measurements with an aerosol mass spectrometer (AMS) at the ground site for OP and airborne over TRF (Fig. 3). Whether the chloride is from the ocean or anthropogenic emissions is uncertain since large point sources, such as power plants or petrochemical facilities, are also present along the west coast of the SMA. On the nights of 20 and 22 May, rapid changes in air quality were observed with fast shifts in O3, SO2, and CO. This corresponded with changes in ClNO2 and Cl2 (Fig. S7). These events suggest the importance of boundary layer advection in controlling the ClNO2 levels in the region.
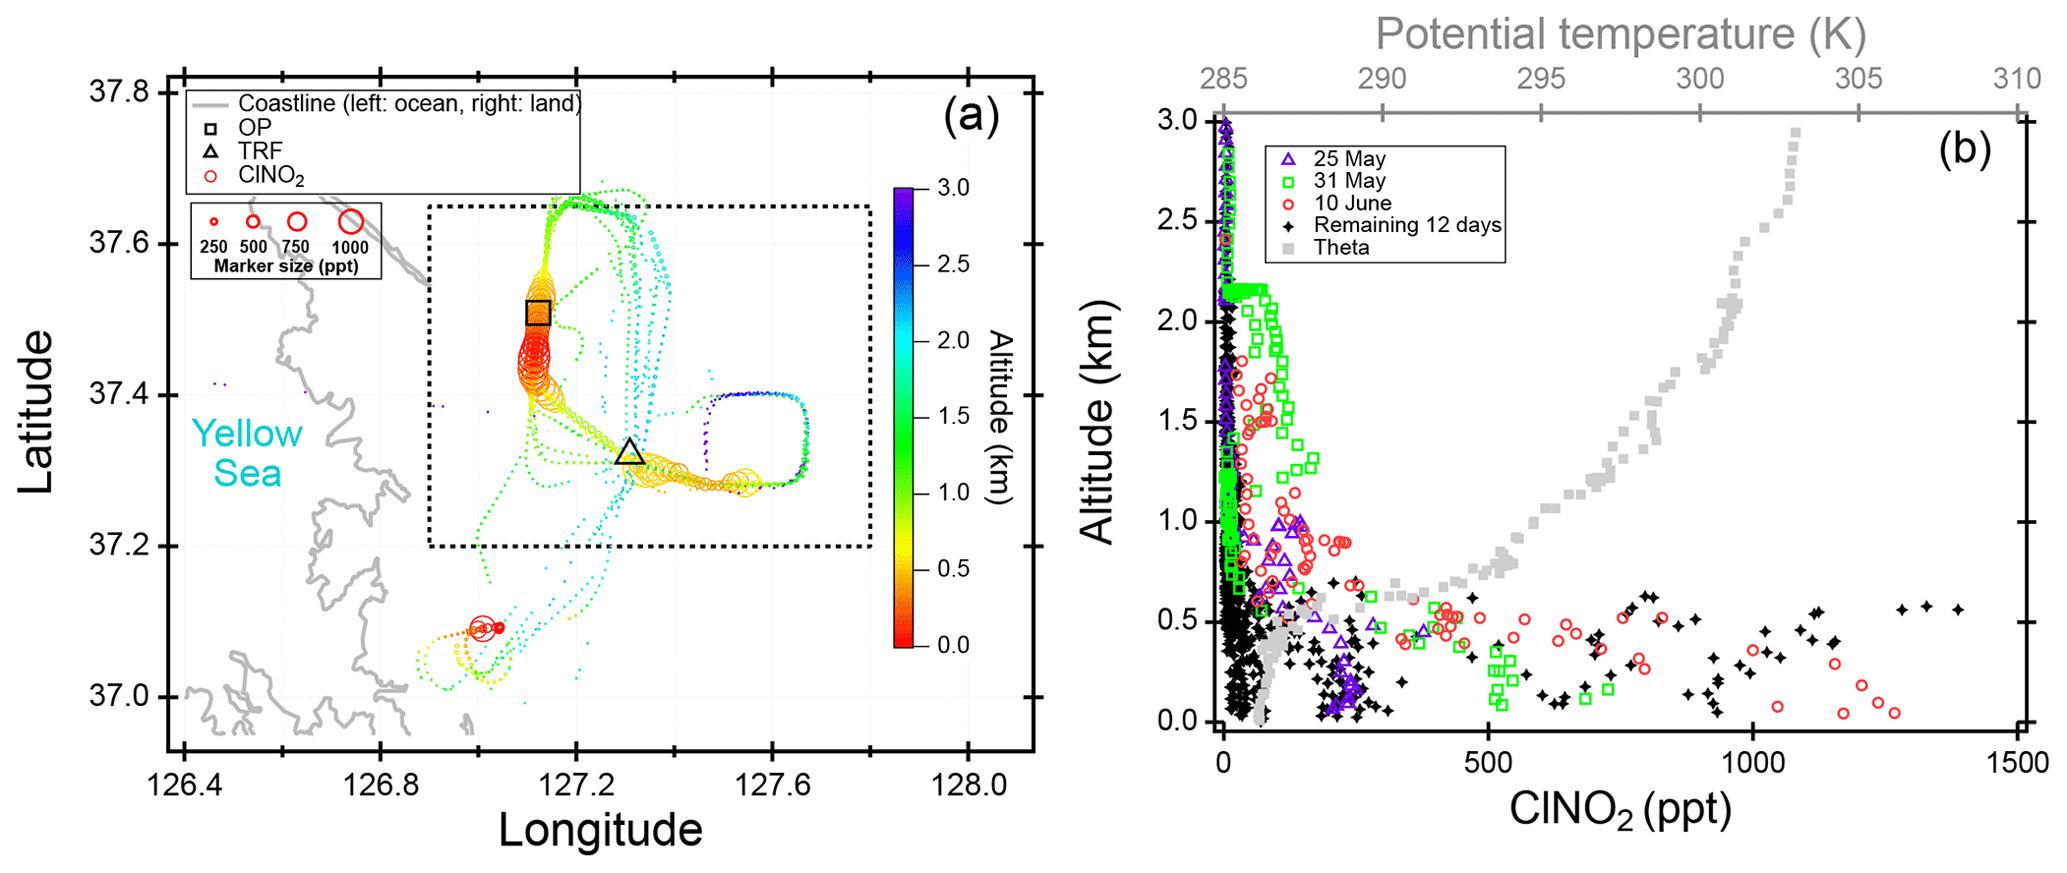
Figure 7(a) Regional and (b) vertical distribution of airborne ClNO2 measured over the Seoul metropolitan region (SMA) in the morning (08:00–08:30 local time).
Different diurnal variations in ClNO2 were observed between OP and TRF (Fig. 6). The measurements were averaged over selected days (OP: 18–20, 22, 23, 29 May, 4 June; TRF: 5, 8, 9, 12, 17, 18, 30 May, 8, 10, June) that showed these two distinct profiles at each site. At the TRF site (Fig. 6b), far from direct NO emissions, significant levels of ClNO2 were sustained throughout the night during most of the observation period with rapid photolysis upon sunrise. On the other hand, at OP (Fig. 6a), ClNO2 started to increase upon sunset, followed by a rapid drop at around 22:00 LST. The trend was consistent with slower nitrate radical production rate (, where at 298 K; Atkinson et al., 2004) as O3 was titrated to zero by NO close to midnight. The wind direction, SO2, and CO did not correlate. This suppressed ClNO2 production in urbanized regions with high NO levels has also been reported by Osthoff et al. (2018). However, significant levels of N2O5 and ClNO2 could have been present in the upper part of the surface layer as shown in previous studies (Baasandorj et al., 2017; Young et al., 2012; Yun et al., 2018). According to Baasandorj et al. (2017), O3 was completely titrated at the surface in Salt Lake Valley, Utah, while elevated mixing ratios of N2O5 were observed at 155 m a.g.l., at a site along the valley wall. On the other hand, airborne measurements at the Los Angeles basin (Young et al., 2012) showed a relatively uniform ClNO2 profile throughout the nocturnal boundary layer as O3 did not change significantly within the observed altitude range (<600 m). During the 2015 Megacity Air Pollution Study (MAPS, Seoul, 2015), a cavity ring-down spectrometer (CRDS) was installed on top of the Seoul tower in May–June that measured N2O5, NOx, and O3 (Brown et al., 2017). The elevation of the measurement site was 360 m above sea level (m a.s.l.), allowing for sampling further away from direct NO emissions. In their study, the average nighttime O3 mixing ratio was around 50 ppbv and N2O5 was observed most nights, with mixing ratios reaching up to 5 ppbv. Therefore, it is very likely that ClNO2 levels higher than the surface measurements could have been present at higher elevation during the observation period.

Figure 8Steady-state ClNO2, simulated from a box model constrained with airborne measurements (blue) and ground site data from TRF (red), when there was a morning ClNO2 peak. Averaged values of the model runs are shown here with standard deviations.

Figure 9FLEXPART back trajectories from Taehwa Research Forest. Trajectories were initialized at 09:00 local time and extended 24 h backwards. Only the center trajectories with the highest percentage of air masses are presented. Trajectories for days with high levels of ClNO2 (>500 pptv) at night are in red and the remaining days are shown in sky blue.
At both sites, ClNO2 levels started to increase or were sustained after the first 2–3 h of rapid net loss upon sunrise. In the morning, ClNO2 positively correlated to Cl2 levels, but did not follow the nitrate production rate at the site (Fig. S8). Box model simulations, initially constrained with observed ClNO2 levels, showed rapid photolysis upon sunrise (Fig. S5, red dashed line). At TRF, this corresponded to the measurements until 07:00–08:00 LST, when a second ClNO2 peak was observed (Fig. 6b). This ClNO2 peak in the morning was observed about half the observation days during the campaign. With the net ClNO2 production rate from the observation, and the loss rate from the simulated ClNO2 from photolysis, a production rate of 400 pptv h−1 would be required to reconcile the observation. In the case of ClNO2 observed on 5 May at TRF (an insert of Fig. S6b), a maximum of 2.5 ppbv h−1 of ClNO2 production rate was required in the morning to reconcile the observations. At OP, 18 pptv h−1 was required for the 7 averaged days. The ClNO2 production rate required in the morning at TRF was much higher than the previous studies that have also reported high sustained levels of ClNO2 in the morning (i.e., 20–200 pptv h−1) (Faxon et al., 2015; Bannan et al., 2015; Tham et al., 2016). In these previous studies, three possibilities have been suggested that could explain the high sustained levels of ClNO2 in the early morning: (1) in situ generation of ClNO2, (2) transport of ClNO2 within the boundary layer, and (3) entrainment of ClNO2 from the residual layer. Each possibility is explored below.
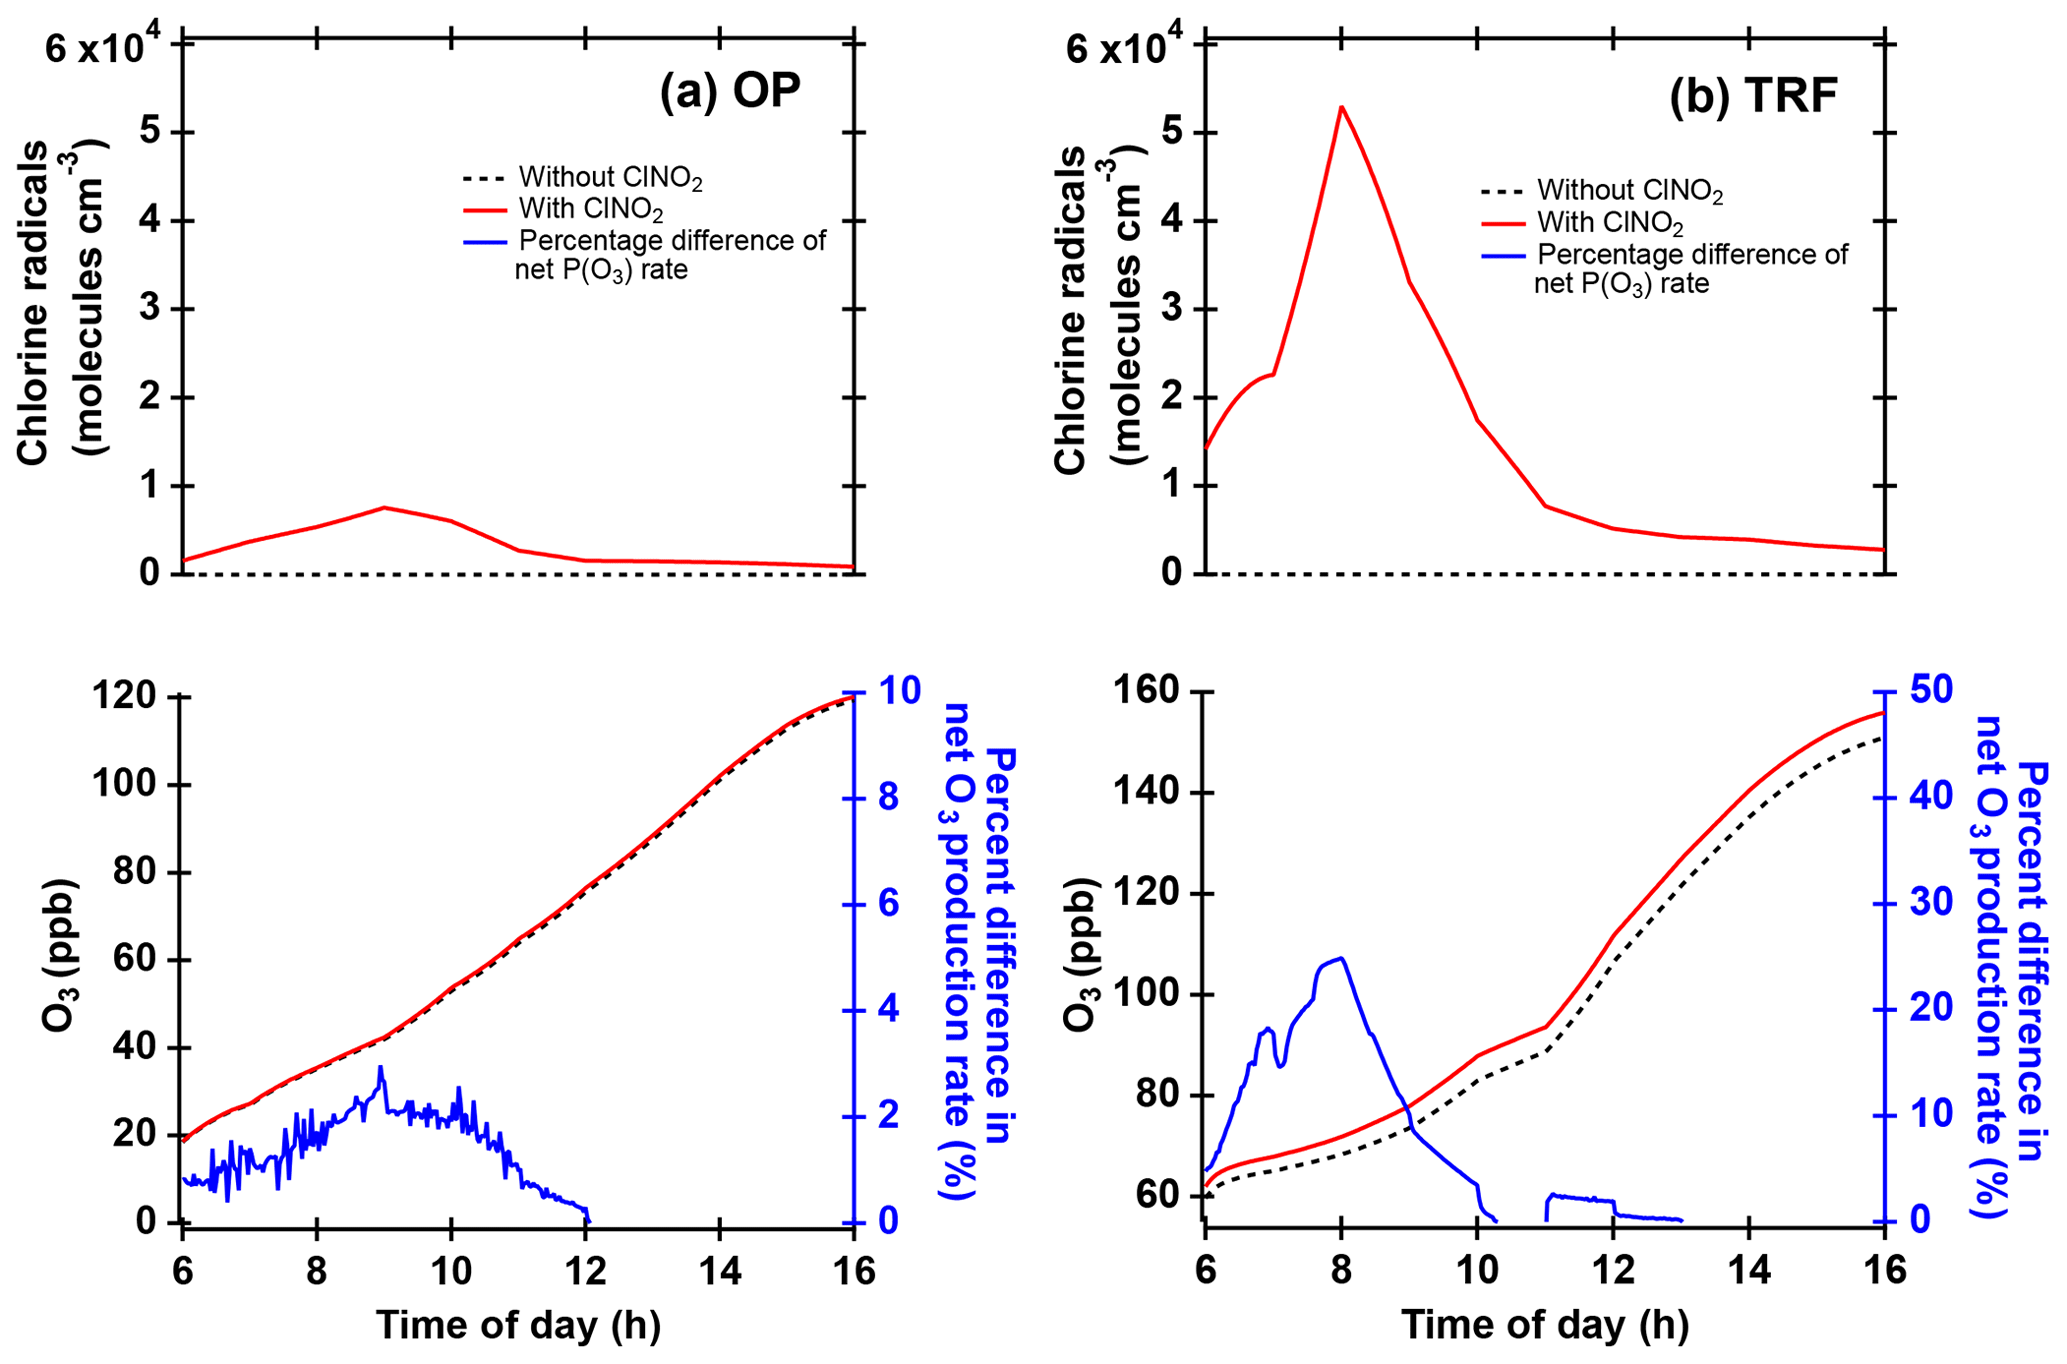
Figure 10Box model simulations of chlorine radicals and O3 at (a) OP and (b) TRF, constrained with ClNO2 and other trace gases observed during the field campaign. Percent difference of net O3 production rate (NetP(O3), blue line) was calculated from the difference of the NetP(O3) between simulations with and without ClNO2 constrained in the model (i.e., .
In order to explore the possibility of in situ formation, box model simulations of ClNO2 production from heterogeneous reaction of N2O5 and chloride-containing aerosols were conducted. N2O5 was calculated assuming a photostationary state of (Brown et al., 2005). Aerosol surface area was taken from airborne observations over TRF. Based on the box model results in Fig. 8, even with an assumption of 100 % yield, ClNO2 from heterogeneous reaction was not able to reconcile the observed level. Using the dry surface area for the first-order loss of N2O5 on aerosols certainly could result in an underestimation of ClNO2 production in the model. Kim et al. (2017, 2018) observed a hygroscopic growth factor of less than 1.5 in the SMA region for particles below 150 nm during the KORUS campaign period. In other words, the discrepancy between observed and modeled ClNO2 of more than 50-fold cannot be reconciled by this underestimation. The box model simulation on gas-phase production of ClNO2 (i.e., ) showed at most 2–10 pptv of ClNO2 and ClONO (Fig. S6).
Therefore, horizontal or vertical transport from local sources would be the most likely explanation for the high ClNO2 in the morning. Although ClNO2 readily photolyzes during the day ( min at midday), the lifetime could be significantly long enough in the early morning to allow for transport of ClNO2 to the ground sites. Based on the NCAR TUV v5.2 model, the lifetime of ClNO2, averaged between 05:30 and 08:30 LST was ∼2 h under clear-sky conditions. Figure 9 shows back trajectory analysis initiated at 09:00 local time at TRF. On high ClNO2 days with the morning peaks, most of the air masses were from the west. During KORUS, the DC-8 did not fly to the west of the SMA in the early morning. However, there are large point sources, such as petrochemical facilities and industries, and vehicular emissions to the west and southwest of the SMA region. Sullivan et al. (2019) reported that this resulted in enhanced levels of O3 in receptor regions (i.e., Taehwa Research Forest) downwind when westerlies were prevalent. Therefore, favorable conditions such as high chloride content in aerosols from both anthropogenic and natural sources and high levels of NOx–O3 could have led to significant levels of ClNO2 to build up and be transported to TRF before being completely photolyzed. During the campaign, influence of large biomass burning was negligible as reported in Tang et al. (2018, 2019).
At nighttime, the nocturnal boundary layer is decoupled from the residual layer (Stull, 1988), where the pollution from the previous day resides. Being removed from direct NO emissions near the surface, N2O5 can effectively accumulate in the residual layer, with the major loss process being heterogeneous reaction on aerosols. Therefore, high levels of NO2 and O3 formed during the day can be trapped in the residual layer, resulting in significant levels of ClNO2 persisting throughout the night. Figure 7 shows (a) regional and (b) vertical distribution of airborne ClNO2 throughout the campaign in the morning (08:00–08:30 LST) over the SMA region (lat: 37∘12′0′′–37∘38′60′′ N, long: 126∘54′0′′–127∘47′60′′ E). During three flights (i.e., 25, 31 May and 10 June), ClNO2 was observed in the residual layer with a max of ∼230 pptv. However, the remaining flights observed an average of 17±56 pptv of ClNO2 (black circles). Even on the 3 d (i.e., 25, 31 May and 10 June) when ClNO2 was observed in the residual layer, the level (max 230 pptv) could not reconcile the observed levels at the TRF site, which was 342±330 pptv when averaged over the corresponding 3 d at 08:00–08:30 LST. However, it is possible that the air mass that was measured by the DC-8 was not representative of the air mass aloft at the west side of the ground observation sites. Back-trajectory analysis initialized at 09:00 local time showed that the TRF site was affected by both the residual layer and below (Fig. S10). The enhancement of O3 and SO2 concurrent to elevation of ClNO2 could be due to the transport from the residual layer where pollution from high point sources from the other day was trapped within. From the current dataset, it would be difficult to derive a clear conclusion on whether the cause of the significant ClNO2 in the morning was dominantly horizontal or vertical transport or both.
3.3 Impacts of ClNO2 on O3
Cl• produced from ClNO2 photolysis can influence the local air quality through reactions with VOCs followed by enhanced production of O3. The possible impact of Cl•-initiated reactions on the local chemistry was investigated by running box model simulations constrained with measured ClNO2. A 24 h diurnal variation in ClNO2 was averaged over the same selected days as in Fig. 6, and these were constrained throughout the model simulations. The results illustrate that when the model was constrained with ClNO2- and Cl•-initiated chemistry, higher levels of O3 were simulated (Fig. 10) compared to the base runs without ClNO2. The averaged net O3 production rate was enhanced by up to 2 % and 25 % at OP and TRF in the morning and by 1 % and 2 % when averaged during the day. The OP had 7 times lower Cl• than the TRF site due to low ClNO2 levels (∼60 pptv) in the morning. Since the box model simulations in our study did not take into consideration boundary layer height dynamics, emission, and deposition, this net production rate is the result of just chemical production and loss. For •OH, the net production rate at TRF increased by 2 % in the morning. The results from TRF in particular are comparable with the previous study at the mountaintop site in Hong Kong, China (Wang et al., 2016). The enhancement of O3 (max–min) was higher than their moderate ClNO2 case (11 %) but lower than the high-ClNO2 plume case (41 %).
Comprehensive measurements of ClNO2, Cl2, other trace gases, and aerosol concentrations and properties have been conducted on the NASA DC-8 and at two ground sites during the KORUS-AQ 2016 field campaign. The observed averaged diurnal variations are largely consistent with the previous observations and our understanding on the photochemistry of ClNO2. The presence of ClNO2 was substantially suppressed during strong stagnation events, which could have prevented the transport of chloride near the coast. During the night, Cl2 and ClNO2 levels were not correlated while moderate to strong positive relationships were observed in the daytime. Through box model simulations, we presented a quantitative analysis of the daytime observations. The results showed that heterogeneous reactions of ClONO2 and HOCl in acidic aerosols may be responsible for the positive correlation between Cl2 and ClNO2, as well as its dependency on O3. The second ClNO2 peak in the morning, observed 4–5 h after sunrise, required a significant source of ClNO2 (up to 2.5 ppbv h−1). Previous studies have attributed high sustained ClNO2 in the morning to transport from the residual layer (Tham et al., 2016; Wang et al., 2016). In this study, box model runs of heterogeneous and gas-phase production of ClNO2 could not reconcile the observed levels. Airborne observations near the ground sites in the early morning showed negligible ClNO2 levels in the residual layer on most of the days. However, there is still a possibility of the contribution of vertical transport from the residual layer. Although the current dataset is limited for us to pinpoint the vertical locations (i.e., boundary layer vs. residual layer), back trajectories illustrate that ClNO2-rich air masses were mostly transported from the west, where there are significant sources of precursors. This shows that different meteorological or chemical conditions of the sites can lead to various causes of high ClNO2 levels in the early morning. Finally, box model simulations constrained with observations suggest that Cl•-initiated chemistry can lead to an ∼25 % increase in net chemical O3 production rate in the morning.
Dataset used in this study is open to the public and can be downloaded at https://www-air.larc.nasa.gov/missions/korus-aq/ (last access: 17 April 2019).
The supplement related to this article is available online at: https://doi.org/10.5194/acp-19-12779-2019-supplement.
DJ, RS, DG, YL, DT, SK, and GH designed and executed field measurements for collecting ClNO2 and Cl2; BAN, JLJ, and PCJ provided the airborne AMS data; CK ran the FLEXPART analysis; TM and JS provided O3 measurements; DRB provided the WAS data; DS and AG provided the PTR-ToF-MS data; RL provided NOx and O3 data; BA provided the data from LARGE; SRH and KU provided data from CAFS; HS provided AMS data at OP; SH provided HCHO measurements at TRF; YL, DK, and JA provided CO measurements at TRF. DJ and SK prepared the original paper, and all other authors contributed in editing the paper.
The authors declare that they have no conflict of interest.
This study is supported by NIER, NASA, and the Ministry of Science and ICT of South Korea. We thank the Wisthaler research group (University of Oslo, University of Innsbruck) for providing airborne VOC data, John Crounse and Paul Wennberg (CALTECH) for the HNO3 data, Hwajin Kim (Korea Institute of Science and Technology) for the discussions on aerosol composition, and Siyuan Wang (NCAR) for discussions on box model simulations. The authors appreciate logistical support from the research and supporting staff at Taehwa Research Forest, operated by Seoul National University.
This research has been supported by the National Aeronautics and Space Administration (grant no. NNX15AT90G). The CU HR-AMS measurements and pH and aerosol liquid water calculations (BAN, PCJ, and JLJ) were supported by NASA (grant nos. NNX15AT96G and 80NSSC18K0630).
This paper was edited by Steven Brown and reviewed by two anonymous referees.
Atkinson, R.: Gas-Phase Tropospheric Chemistry of Volatile Organic Compounds: 1. Alkanes and Alkenes, J. Phys. Chem. Ref. Data, 26, 215–290, https://doi.org/10.1063/1.556012, 1997. a
Atkinson, R. and Arey, J.: Gas-phase tropospheric chemistry of biogenic volatile organic compounds: A review, Atmos. Environ., 37, 197–219, https://doi.org/10.1016/S1352-2310(03)00391-1, 2003. a
Atkinson, R., Baulch, D. L., Cox, R. A., Crowley, J. N., Hampson, R. F., Hynes, R. G., Jenkin, M. E., Rossi, M. J., and Troe, J.: Evaluated kinetic and photochemical data for atmospheric chemistry: Volume I – gas phase reactions of Ox, HOx, NOx and SOx species, Atmos. Chem. Phys., 4, 1461–1738, https://doi.org/10.5194/acp-4-1461-2004, 2004. a
Atkinson, R., Baulch, D. L., Cox, R. A., Crowley, J. N., Hampson, R. F., Hynes, R. G., Jenkin, M. E., Rossi, M. J., and Troe, J.: Evaluated kinetic and photochemical data for atmospheric chemistry: Volume III – gas phase reactions of inorganic halogens, Atmos. Chem. Phys., 7, 981–1191, https://doi.org/10.5194/acp-7-981-2007, 2007. a
Baasandorj, M., Hoch, S. W., Bares, R., Lin, J. C., Brown, S. S., Millet, D. B., Martin, R., Kelly, K., Zarzana, K. J., Whiteman, C. D., Dube, W. P., Tonnesen, G., Jaramillo, I. C., and Sohl, J.: Coupling between Chemical and Meteorological Processes under Persistent Cold-Air Pool Conditions: Evolution of Wintertime PM2.5 Pollution Events and N2O5 Observations in Utah's Salt Lake Valley, Environ. Sci. Technol., 51, 5941–5950, https://doi.org/10.1021/acs.est.6b06603, 2017. a, b
Bannan, T. J., Booth, A. M., Bacak, A., Muller, J. B. A., Leather, K. E., Breton, M. L., Jones, B., Young, D., Coe, H., Allan, J., Visser, S., Slowik, J. G., Furger, M., Prévôt, A. S. H., Lee, J., Dunmore, R. E., Hopkins, J. R., Hamilton, J. F., Lewis, A. C., Whalley, L. K., Sharp, T., Stone, D., Heard, D. E., Fleming, Z. L., Leigh, R., Shallcross, D. E., and Percival, C. J.: The first UK measurements of nitryl chloride using a chemical ionization mass spectrometer in central London in the summer of 2012, and an investigation of the role of Cl atom oxidation, J. Geophys. Res.-Atmos., 120, 5638–5657, https://doi.org/10.1002/2014JD022629, 2015. a
Behnke, W., George, C., Scheer, V., and Zetzsch, C.: Production and decay of ClNO2 from the reaction of gaseous N2O5 with NaCl solution: Bulk and aerosol experiments, J. Geophys. Res.-Atmos., 102, 3795–3804, https://doi.org/10.1029/96JD03057, 1997. a, b
Bertram, T. H. and Thornton, J. A.: Toward a general parameterization of N2O5 reactivity on aqueous particles: the competing effects of particle liquid water, nitrate and chloride, Atmos. Chem. Phys., 9, 8351–8363, https://doi.org/10.5194/acp-9-8351-2009, 2009. a
Blanchard, D.: The oceanic production of atmospheric sea salt, J. Geophys. Res., 90, 961–963, https://doi.org/10.1029/JC090iC01p00961, 1985. a
Brown, S. S., Osthoff, H. D., Stark, H., Dubé, W. P., Ryerson, T. B., Warneke, C., de Gouw, J. A., Wollny, A. G., Parrish, D. D., Fehsenfeld, F. C., and Ravishankara, A. R.: Aircraft observations of daytime NO3 and N2O5 and their implications for tropospheric chemistry, J. Photochem. Photobiol. A Chem., 176, 270–278, https://doi.org/10.1016/j.jphotochem.2005.10.004, 2005. a
Brown, S. S., Dubé, W. P., Fuchs, H., Ryerson, T. B., Wollny, A. G., Brock, C. A., Bahreini, R., Middlebrook, A. M., Neuman, T. A., Atlas, E., Roberts, J. M., Osthoff, H. D., Trainer, M., Fehsenfeld, F. C., and Ravishankara, A. R.: Reactive uptake coefficients for N2O5 determined from aircraft measurements during the Second Texas Air Quality Study: Comparison to current model parameterizations, J. Geophys. Res., 114, 1–16, https://doi.org/10.1029/2008JD011679, 2009. a
Brown, S. S., An, H. J., Lee, M., Park, J. H., Lee, S. D., Fibiger, D. L., McDuffie, E. E., Dubé, W. P., Wagner, N. L., and Min, K. E.: Cavity enhanced spectroscopy for measurement of nitrogen oxides in the Anthropocene: results from the Seoul tower during MAPS 2015, Faraday Dicuss., 200, 529–557, https://doi.org/10.1039/C7FD00001D, 2017. a
Chang, W. L., Brown, S. S., Stutz, J., Middlebrook, A. M., Bahreini, R., Wagner, N. L., Dubé, W. P., Pollack, I. B., Ryerson, T. B., and Riemer, N.: Evaluating N2O5 heterogeneous hydrolysis parameterizations for CalNex 2010, J. Geophys. Res., 121, 5051–5070, https://doi.org/10.1002/2015JD024737, 2016. a
Chen, Q., Schmidt, J. A., Shah, V., Jaeglé, L., Sherwen, T., and Alexander, B.: Sulfate production by reactive bromine: Implications for the global sulfur and reactive bromine budgets, Geophys. Res. Lett., 44, 7069–7078, https://doi.org/10.1002/2017GL073812, 2017. a
Colman, J. J., Swanson, A. L., Meinardi, S., Sive, B. C., Blake, D. R., and Rowland, F. S.: Description of the analysis of a wide range of volatile organic compounds in whole air samples collected during PEM-Tropics A and B, Anal. Chem., 73, 3723–3731, https://doi.org/10.1021/ac010027g, 2001. a
Deiber, G., George, Ch., Le Calvé, S., Schweitzer, F., and Mirabel, Ph.: Uptake study of ClONO2 and BrONO2 by Halide containing droplets, Atmos. Chem. Phys., 4, 1291–1299, https://doi.org/10.5194/acp-4-1291-2004, 2004. a, b
Faxon, C. B., Bean, J. K., and Ruiz, L. H.: Inland Concentrations of Cl2 and ClNO2 in Southeast Texas Suggest Chlorine Chemistry Significantly Contributes to Atmospheric Reactivity, Atmosphere, 6, 1487–1506, https://doi.org/10.3390/atmos6101487, 2015. a
Finlayson-Pitts, B. J.: Chlorine Atoms as a Potential Tropospheric Oxidant in the Marine Boundary Layer, Res. Chem. Intermediat., 19, 235–249, https://doi.org/10.1163/156856793X00091, 1993. a
Finlayson-Pitts, B. J., Ezell, M. J., and Pitts Jr, J. N.: Formation of chemically active chlorine compounds by reactions of atmospheric NaCl particles with gaseous N2O5 and ClONO2, Nature, 337, 241–244, https://doi.org/10.1038/337241a0, 1989. a
Frenzel, A., Scheer, V., Sikorski, R., George, C., Behnke, W., and Zetzsch, C.: Heterogeneous Interconversion Reactions of BrNO2, ClNO2, BrO2, and ClO2, J. Phys. Chem. A, 102, 1329–1337, https://doi.org/10.1021/jp973044b, 1998. a
Fu, X., Wang, T., Wang, S., Zhang, L., Cai, S., Xing, J., and Hao, J.: Anthropogenic emissions of hydrogen chloride and fine particulate chloride in China, Environ. Sci. Technol., 52, 1644–1654, https://doi.org/10.1021/acs.est.7b05030, 2018. a
Gebel, M. E. and Finlayson-Pitts, B. J.: Uptake and reaction of ClONO2 on NaCl and synthetic sea salt, J. Phys. Chem. A, 105, 5178–5187, https://doi.org/10.1021/jp0046290, 2001. a
George, C., Behnke, W., Scheer, V., Zetzsch, C., Magi, L., Ponche, J. L., and Mirabel, P.: Fate of ClNO2 over aqueous solutions containing iodide, Geophys. Res. Lett., 22, 1505–1508, https://doi.org/10.1029/95GL01417, 1995. a
Hanson, D. R. and Ravishankara, A. R.: Reactive Uptake of ClONO2 onto Sulfuric Acid Due to Reaction with HCl and H2O, J. Phy. Chem., 98, 5728–5735, https://doi.org/10.1021/j100073a026, 1994. a
Hanson, D. R., Ravishankara, A. R., and Solomon, S.: Heterogeneous reactions in sulfuric acid aerosols: A framework for model calculations, J. Geophys. Res., 99, 3615, https://doi.org/10.1029/93JD02932, 1994. a
Hinrichsen, D.: Coastal Waters of the World: Trends, Threats, and Strategies, Island Press, Washington, DC, available at: http://arp.sagepub.com/content/30/4/473 (last access: 17 April 2019), 1998. a
Hov, O.: The effect of chlorine on the formation of photochemical oxidants in Southern Telemark, Norway, Atmos. Environ., 19, 471–485, https://doi.org/10.1016/0004-6981(85)90168-4, 1985. a, b
Hu, J. H. and Abbatt, J. P. D.: Reaction probabilities for N2O5 hydrolysis on sulfuric acid and ammonium sulfate aerosols at room temperature, J. Phys. Chem. A, 101, 871–878, https://doi.org/10.1021/jp9627436, 1997. a
Huey, L. G.: Measurement of Trace Atmospheric Species by Chemical Ionization Mass Spectrometry: Speciation of Reactive Nitrogen and Future Directions, Mass Spectrom. Rev., 26, 166–184, https://doi.org/10.1002/mas.20118, 2007. a
Huey, L. G., Hanson, D. R., and Howard, C. J.: Reactions of and I− with atmospheric trace gases, J. Geophys. Res., 99, 5001–5008, https://doi.org/10.1021/j100014a021, 1995. a
Jenkin, M. E., Young, J. C., and Rickard, A. R.: The MCM v3.3.1 degradation scheme for isoprene, Atmos. Chem. Phys., 15, 11433–11459, https://doi.org/10.5194/acp-15-11433-2015, 2015. a
Kim, N., Park, M., Yum, S. S., Park, J. S., Song, I. H., Shin, H. J., Ahn, J. Y., Kwak, K. H., Kim, H., Bae, G. N., and Lee, G.: Hygroscopic properties of urban aerosols and their cloud condensation nuclei activities measured in Seoul during the MAPS-Seoul campaign, Atmos. Environ., 153, 217–232, https://doi.org/10.1016/j.atmosenv.2017.01.034, 2017. a
Kim, N., Park, M., Yum, S. S., Park, J. S., Shin, H. J., and Ahn, J. Y.: Impact of urban aerosol properties on cloud condensation nuclei (CCN) activity during the KORUS-AQ field campaign, Atmos. Environ., 185, 221–236, https://doi.org/10.1016/j.atmosenv.2018.05.019, 2018. a
Kim, S., Kim, S.-Y., Lee, M., Shim, H., Wolfe, G. M., Guenther, A. B., He, A., Hong, Y., and Han, J.: Impact of isoprene and HONO chemistry on ozone and OVOC formation in a semirural South Korean forest, Atmos. Chem. Phys., 15, 4357–4371, https://doi.org/10.5194/acp-15-4357-2015, 2015. a
Kim, S., Sanchez, D., Wang, M., Seco, R., Jeong, D., Hughes, S., Barletta, B., Blake, D. R., Jung, J., Kim, D., Lee, G., Lee, M., Ahn, J., Lee, S. D., Cho, G., Sung, M. Y., Lee, Y. H., Kim, D. B., Kim, Y., Woo, J. H., Jo, D., Park, R., Park, J. H., Hong, Y. D., and Hong, J. H.: OH reactivity in urban and suburban regions in Seoul, South Korea-an East Asian megacity in a rapid transition, Faraday Dicuss., 189, 231–251, https://doi.org/10.1039/c5fd00230c, 2016. a
Knipping, E. M. and Dabdub, D.: Impact of chlorine emissions from sea-salt aerosol on coastal urban ozone, Environ. Sci. Technol., 37, 275–284, https://doi.org/10.1021/es025793z, 2003. a
Lee, B. H., Lopez-Hilfiker, F. D., Schroder, J. C., Campuzano-Jost, P., Jimenez, J. L., McDuffie, E. E., Fibiger, D. L., Veres, P. R., Brown, S. S., Campos, T. L., Weinheimer, A. J., Flocke, F. F., Norris, G., O'Mara, K., Green, J. R., Fiddler, M. N., Bililign, S., Shah, V., Jaegle, L., and Thornton, J. A.: Airborne observations of reactive inorganic chlorine and bromine species in the exhaust of coal-fired power plants, J. Geophys. Res.-Atmos., 123, 11225–11237, https://doi.org/10.1029/2018JD029284, 2018. a
Li, Q., Zhang, L., Wang, T., Tham, Y. J., Ahmadov, R., Xue, L., Zhang, Q., and Zheng, J.: Impacts of heterogeneous uptake of dinitrogen pentoxide and chlorine activation on ozone and reactive nitrogen partitioning: improvement and application of the WRF-Chem model in southern China, Atmos. Chem. Phys., 16, 14875–14890, https://doi.org/10.5194/acp-16-14875-2016, 2016. a
Liao, J., Sihler, H., Huey, L. G., Neuman, J. A., Tanner, D. J., Friess, U., Platt, U., Flocke, F. M., Orlando, J. J., Shepson, P. B., Beine, H. J., Weinheimer, A. J., Sjostedt, S. J., Nowak, J. B., Knapp, D. J., Staebler, R. M., Zheng, W., Sander, R., Hall, S. R., and Ullmann, K.: A comparison of Arctic BrO measurements by chemical ionization mass spectrometry and long path-differential optical absorption spectroscopy, J. Geophys. Res.-Atmos., 116, D00R02, https://doi.org/10.1029/2010JD014788, 2011. a, b
Liao, J., Huey, L. G., Tanner, D. J., Flocke, F. M., Orlando, J. J., Neuman, J. A., Nowak, J. B., Weinheimer, A. J., Hall, S. R., Smith, J. N., Fried, A., Staebler, R. M., Wang, Y., Koo, J. H., Cantrell, C. A., Weibring, P., Walega, J., Knapp, D. J., Shepson, P. B., and Stephens, C. R.: Observations of inorganic bromine (HOBr, BrO, and Br2) speciation at Barrow, Alaska, in spring 2009, J. Geophys. Res.-Atmos., 117, D00R16, https://doi.org/10.1029/2011JD016641, 2012. a
Liao, J., Huey, L. G., Liu, Z., Tanner, D. J., Cantrell, C. A., Orlando, J. J., Flocke, F. M., Shepson, P. B., Weinheimer, A. J., Hall, S. R., Ullmann, K., Beine, H. J., Wang, Y., Ingall, E. D., Stephens, C. R., Hornbrook, R. S., Apel, E. C., Riemer, D., Fried, A., Mauldin, R. L., Smith, J. N., Staebler, R. M., Neuman, J. A., and Nowak, J. B.: High levels of molecular chlorine in the Arctic atmosphere, Nat. Geosci., 7, 91–94, https://doi.org/10.1038/ngeo2046, 2014. a
Liu, X., Qu, H., Huey, L. G., Wang, Y., Sjostedt, S., Zeng, L., Lu, K., Wu, Y., Hu, M., Shao, M., Zhu, T., and Zhang, Y.: High Levels of Daytime Molecular Chlorine and Nitryl Chloride at a Rural Site on the North China Plain, Environ. Sci. Technol., 51, 9588–9595, https://doi.org/10.1021/acs.est.7b03039, 2017. a, b, c, d
Lowe, D., Archer-Nicholls, S., Morgan, W., Allan, J., Utembe, S., Ouyang, B., Aruffo, E., Le Breton, M., Zaveri, R. A., Di Carlo, P., Percival, C., Coe, H., Jones, R., and McFiggans, G.: WRF-Chem model predictions of the regional impacts of N2O5 heterogeneous processes on night-time chemistry over north-western Europe, Atmos. Chem. Phys., 15, 1385–1409, https://doi.org/10.5194/acp-15-1385-2015, 2015. a
Madronich, S. and Flocke, S.: The role of solar radiation in atmospheric chemistry, in: Handbook of Environmental Chemistry, 1–26, Springer Verlag, Heidelberg, 1998. a
Malko, M. W. and Troe, J.: Analysis of the unimolecular reaction , Int. J. Chem. Kinet., 14, 399–416, https://doi.org/10.1002/kin.550140407, 1982. a
McDuffie, E. E., Fibiger, D. L., Dubé, W. P., Lopez Hilfiker, F., Lee, B. H., Jaeglé, L., Guo, H., Weber, R. J., Reeves, J. M., Weinheimer, A. J., Schroder, J. C., Campuzano-Jost, P., Jimenez, J. L., Dibb, J. E., Veres, P., Ebben, C., Sparks, T. L., Wooldridge, P. J., Cohen, R. C., Campos, T., Hall, S. R., Ullmann, K., Roberts, J. M., Thornton, J. A., and Brown, S. S.: ClNO2 Yields From Aircraft Measurements During the 2015 WINTER Campaign and Critical Evaluation of the Current Parameterization, J. Geophys. Res.-Atmos., 123, 12994–13015, https://doi.org/10.1029/2018JD029358, 2018a. a, b
McDuffie, E. E., Fibiger, D. L., Dubé, W. P., Lopez-Hilfiker, F., Lee, B. H., Thornton, J. A., Shah, V., Jaeglé, L., Guo, H., Weber, R. J., Michael Reeves, J., Weinheimer, A. J., Schroder, J. C., Campuzano-Jost, P., Jimenez, J. L., Dibb, J. E., Veres, P., Ebben, C., Sparks, T. L., Wooldridge, P. J., Cohen, R. C., Hornbrook, R. S., Apel, E. C., Campos, T., Hall, S. R., Ullmann, K., and Brown, S. S.: Heterogeneous N2O5 uptake during winter: Aircraft measurements during the 2015 WINTER campaign and critical evaluation of current parameterizations, J. Geophys. Res.-Atmos., 123, 4345–4372, https://doi.org/10.1002/2018JD028336, 2018b. a, b
McNeill, V. F., Patterson, J., Wolfe, G. M., and Thornton, J. A.: The effect of varying levels of surfactant on the reactive uptake of N2O5 to aqueous aerosol, Atmos. Chem. Phys., 6, 1635–1644, https://doi.org/10.5194/acp-6-1635-2006, 2006. a
Mielke, L. H., Furgeson, A., and Osthoff, H. D.: Observation of ClNO2 in a mid-continental urban environment, Environ. Sci. Technol., 45, 8889–8896, https://doi.org/10.1021/es201955u, 2011. a
Morgan, W. T., Ouyang, B., Allan, J. D., Aruffo, E., Di Carlo, P., Kennedy, O. J., Lowe, D., Flynn, M. J., Rosenberg, P. D., Williams, P. I., Jones, R., McFiggans, G. B., and Coe, H.: Influence of aerosol chemical composition on N2O5 uptake: airborne regional measurements in northwestern Europe, Atmos. Chem. Phys., 15, 973–990, https://doi.org/10.5194/acp-15-973-2015, 2015. a
Müller, M., Mikoviny, T., Feil, S., Haidacher, S., Hanel, G., Hartungen, E., Jordan, A., Märk, L., Mutschlechner, P., Schottkowsky, R., Sulzer, P., Crawford, J. H., and Wisthaler, A.: A compact PTR-ToF-MS instrument for airborne measurements of volatile organic compounds at high spatiotemporal resolution, Atmos. Meas. Tech., 7, 3763–3772, https://doi.org/10.5194/amt-7-3763-2014, 2014. a
Nault, B. A., Campuzano-Jost, P., Day, D. A., Schroder, J. C., Anderson, B., Beyersdorf, A. J., Blake, D. R., Brune, W. H., Choi, Y., Corr, C. A., de Gouw, J. A., Dibb, J., DiGangi, J. P., Diskin, G. S., Fried, A., Huey, L. G., Kim, M. J., Knote, C. J., Lamb, K. D., Lee, T., Park, T., Pusede, S. E., Scheuer, E., Thornhill, K. L., Woo, J.-H., and Jimenez, J. L.: Secondary organic aerosol production from local emissions dominates the organic aerosol budget over Seoul, South Korea, during KORUS-AQ, Atmos. Chem. Phys., 18, 17769–17800, https://doi.org/10.5194/acp-18-17769-2018, 2018. a
Neumann, B., Vafeidis, A. T., Zimmermann, J., and Nicholls, R. J.: Future coastal population growth and exposure to sea-level rise and coastal flooding – A global assessment, PLoS ONE, 10, e0118571, https://doi.org/10.1371/journal.pone.0118571, 2015. a
Osthoff, H. D., Roberts, J. M., Ravishankara, A. R., Williams, E. J., Lerner, B. M., Sommariva, R., Bates, T. S., Coffman, D., Quinn, P. K., Dibb, J. E., Stark, H., Burkholder, J. B., Talukdar, R. K., Meagher, J., Fehsenfeld, F. C., and Brown, S. S.: High levels of nitryl chloride in the polluted subtropical marine boundary layer, Nat. Geosci., 1, 324–328, https://doi.org/10.1038/ngeo177, 2008. a
Osthoff, H. D., Odame-Ankrah, C. A., Taha, Y. M., Tokarek, T. W., Schiller, C. L., Haga, D., Jones, K., and Vingarzan, R.: Low levels of nitryl chloride at ground level: nocturnal nitrogen oxides in the Lower Fraser Valley of British Columbia, Atmos. Chem. Phys., 18, 6293–6315, https://doi.org/10.5194/acp-18-6293-2018, 2018. a
Park, M.-S., Park, S.-H., Chae, J.-H., Choi, M.-H., Song, Y., Kang, M., and Roh, J.-W.: High-resolution urban observation network for user-specific meteorological information service in the Seoul Metropolitan Area, South Korea, Atmos. Meas. Tech., 10, 1575–1594, https://doi.org/10.5194/amt-10-1575-2017, 2017. a
Phillips, G. J., Thieser, J., Tang, M., Sobanski, N., Schuster, G., Fachinger, J., Drewnick, F., Borrmann, S., Bingemer, H., Lelieveld, J., and Crowley, J. N.: Estimating N2O5 uptake coefficients using ambient measurements of NO3, N2O5, ClNO2 and particle-phase nitrate, Atmos. Chem. Phys., 16, 13231–13249, https://doi.org/10.5194/acp-16-13231-2016, 2016. a
Reff, A., Bhave, P. V., Simon, H., Pace, T. G., Pouliot, G. A., Mobley, J. D., and Houyoux, M.: Emissions Inventory of PM2.5 Trace Elements across the United States, Environ. Sci. Technol., 43, 5790–5796, https://doi.org/10.1021/es802930x, 2009. a
Riedel, T. P., Bertram, T. H., Crisp, T. A., Williams, E. J., Lerner, B. M., Vlasenko, A., Li, S. M., Gilman, J., De Gouw, J., Bon, D. M., Wagner, N. L., Brown, S. S., and Thornton, J. A.: Nitryl chloride and molecular chlorine in the coastal marine boundary layer, Environ. Sci. Technol., 46, 10463–10470, https://doi.org/10.1021/es204632r, 2012. a, b, c, d
Riedel, T. P., Wagner, N. L., Dubé, W. P., Middlebrook, A. M., Young, C. J., Öztürk, F., Bahreini, R., Vandenboer, T. C., Wolfe, D. E., Williams, E. J., Roberts, J. M., Brown, S. S., and Thornton, J. A.: Chlorine activation within urban or power plant plumes: Vertically resolved ClNO2 and Cl2 measurements from a tall tower in a polluted continental setting, J. Geophys. Res.-Atmos., 118, 8702–8715, https://doi.org/10.1002/jgrd.50637, 2013. a
Riedel, T. P., Wolfe, G. M., Danas, K. T., Gilman, J. B., Kuster, W. C., Bon, D. M., Vlasenko, A., Li, S.-M., Williams, E. J., Lerner, B. M., Veres, P. R., Roberts, J. M., Holloway, J. S., Lefer, B., Brown, S. S., and Thornton, J. A.: An MCM modeling study of nitryl chloride (ClNO2) impacts on oxidation, ozone production and nitrogen oxide partitioning in polluted continental outflow, Atmos. Chem. Phys., 14, 3789–3800, https://doi.org/10.5194/acp-14-3789-2014, 2014. a, b
Roberts, J. M., Osthoff, H. D., Brown, S. S., and Ravishankara, A. R.: N2O5 oxidizes chloride to Cl2 in acidic atmospheric aerosol, Science, 321, 1059, https://doi.org/10.1126/science.1158777, 2008. a, b
Rossi, M. J.: Heterogeneous Reactions on Salts, Chem. Rev., 103, 4823–4882, https://doi.org/10.1021/cr020507n, 2003. a
Ryder, O. S., Campbell, N. R., Shaloski, M., Al-Mashat, H., Nathanson, G. M., and Bertram, T. H.: Role of Organics in Regulating ClNO2 Production at the Air–Sea Interface, J. Phys. Chem. A, 119, 8519–8526, https://doi.org/10.1021/jp5129673, 2015. a
Sarwar, G., Simon, H., Bhave, P., and Yarwood, G.: Examining the impact of heterogeneous nitryl chloride production on air quality across the United States, Atmos. Chem. Phys., 12, 6455–6473, https://doi.org/10.5194/acp-12-6455-2012, 2012. a, b
Sarwar, G., Simon, H., Xing, J., and Mathur, R.: Importance of tropospheric ClNO2 chemistry across the Northern Hemisphere, Geophys. Res. Lett., 41, 4050–4058, https://doi.org/10.1002/2014GL059962, 2014. a, b, c, d
Schweitzer, F., Mirabel, P., and George, C.: Multiphase Chemistry of N2O5, ClNO2, and BrNO2, J. Phys. Chem. A, 102, 3942–3952, https://doi.org/10.1021/jp980748s, 1998. a
Sherwen, T., Schmidt, J. A., Evans, M. J., Carpenter, L. J., Großmann, K., Eastham, S. D., Jacob, D. J., Dix, B., Koenig, T. K., Sinreich, R., Ortega, I., Volkamer, R., Saiz-Lopez, A., Prados-Roman, C., Mahajan, A. S., and Ordóñez, C.: Global impacts of tropospheric halogens (Cl, Br, I) on oxidants and composition in GEOS-Chem, Atmos. Chem. Phys., 16, 12239–12271, https://doi.org/10.5194/acp-16-12239-2016, 2016. a, b
Sherwen, T., Evans, M. J., Sommariva, R., Hollis, L. D., Ball, S. M., Monks, P. S., Reed, C., Carpenter, L. J., Lee, J. D., Forster, G., Bandy, B., Reeves, C. E., and Bloss, W. J.: Effects of halogens on European air-quality, Faraday Dicuss., 200, 75–100, https://doi.org/10.1039/c7fd00026j, 2017. a, b, c
Shetter, R. E. and Müller, M.: Photolysis frequency measurements using actinic flux spectroradiometry during the PEM-Tropics mission: Instrumentation description and some results , J. Geophys. Res.-Atmos., 104, 5647–5661, https://doi.org/10.1029/98JD01381, 1999. a
Simon, H., Kimura, Y., McGaughey, G., Allen, D. T., Brown, S. S., Osthoff, H. D., Roberts, J. M., Byun, D., and Lee, D.: Modeling the impact of ClNO2 on ozone formation in the Houston area, J. Geophys. Res., 114, D00F03, https://doi.org/10.1029/2008JD010732, 2009. a
Slusher, D. L., Huey, L. G., Tanner, D. J., Flocke, F. M., and Roberts, J. M.: A thermal dissociation – Chemical ionization mass spectrometry (TD-CIMS) technique for the simultaneous measurement of peroxyacyl nitrates and dinitrogen pentoxide, J. Geophys. Res., 109, D19315, https://doi.org/10.1029/2004JD004670, 2004. a, b
Stull, R. B.: An introduction to boundary layer meteorology, vol. 13, Kluwer Academic Publishers, Dordrecht, Boston, 1988. a
Sullivan, J. T., McGee, T. J., Sumnicht, G. K., Twigg, L. W., and Hoff, R. M.: A mobile differential absorption lidar to measure sub-hourly fluctuation of tropospheric ozone profiles in the Baltimore–Washington, D.C. region, Atmos. Meas. Tech., 7, 3529–3548, https://doi.org/10.5194/amt-7-3529-2014, 2014. a
Sullivan, J. T., McGee, T. J., Stauffer, R. M., Thompson, A. M., Weinheimer, A., Knote, C., Janz, S., Wisthaler, A., Long, R., Szykman, J., Park, J., Lee, Y., Kim, S., Jeong, D., Sanchez, D., Twigg, L., Sumnicht, G., Knepp, T., and Schroeder, J. R.: Taehwa Research Forest: a receptor site for severe domestic pollution events in Korea during 2016, Atmos. Chem. Phys., 19, 5051–5067, https://doi.org/10.5194/acp-19-5051-2019, 2019. a
Tanaka, P. L., Oldfield, S., Neece, J. D., Mullins, C. B., and Allen, D. T.: Anthropogenic sources of chlorine and ozone formation in urban atmospheres, Environ. Sci. Technol., 34, 4470–4473, https://doi.org/10.1021/es991380v, 2000. a, b
Tanaka, P. L., Riemer, D. D., Chang, S., Yarwood, G., McDonald-Buller, E. C., Apel, E. C., Orlando, J. J., Silva, P. J., Jimenez, J. L., Canagaratna, M. R., Neece, J. D., Mullins, C. B., and Allen, D. T.: Direct evidence for chlorine-enhanced urban ozone formation in Houston, Texas, Atmos. Environ., 37, 1393–1400, https://doi.org/10.1016/S1352-2310(02)01007-5, 2003. a
Tang, W., Arellano, A. F., DiGangi, J. P., Choi, Y., Diskin, G. S., Agustí-Panareda, A., Parrington, M., Massart, S., Gaubert, B., Lee, Y., Kim, D., Jung, J., Hong, J., Hong, J.-W., Kanaya, Y., Lee, M., Stauffer, R. M., Thompson, A. M., Flynn, J. H., and Woo, J.-H.: Evaluating high-resolution forecasts of atmospheric CO and CO2 from a global prediction system during KORUS-AQ field campaign, Atmos. Chem. Phys., 18, 11007–11030, https://doi.org/10.5194/acp-18-11007-2018, 2018. a
Tang, W., Emmons, L. K., Arellano Jr., A. F., Gaubert, B., Knote, C., Tilmes, S., Buchholz, R. R., Pfister, G. G., Diskin, G. S., Blake, D. R., Blake, N. J., Meinardi, S., DiGangi, J. P., Choi, Y., Woo, J.-H., He, C., Schroeder, J. R., Suh, I., Lee, H.-J., Jo, H.-Y., Kanaya, Y., Jung, J., Lee, Y., and Kim, D.: Source contributions to carbon monoxide concentrations during KORUS-AQ based on CAM-chem model applications, J. Geophys. Res.-Atmos., 124, 1–27, https://doi.org/10.1029/2018jd029151, 2019. a
Thaler, R. D., Mielke, L. H., and Osthoff, H. D.: Quantification of nitryl chloride at part per trillion mixing ratios by thermal dissociation cavity ring-down spectroscopy, Anal. Chem., 83, 2761–2766, https://doi.org/10.1021/ac200055z, 2011. a
Tham, Y. J., Wang, Z., Li, Q., Yun, H., Wang, W., Wang, X., Xue, L., Lu, K., Ma, N., Bohn, B., Li, X., Kecorius, S., Größ, J., Shao, M., Wiedensohler, A., Zhang, Y., and Wang, T.: Significant concentrations of nitryl chloride sustained in the morning: investigations of the causes and impacts on ozone production in a polluted region of northern China, Atmos. Chem. Phys., 16, 14959–14977, https://doi.org/10.5194/acp-16-14959-2016, 2016. a, b, c, d, e
Tham, Y. J., Wang, Z., Li, Q., Wang, W., Wang, X., Lu, K., Ma, N., Yan, C., Kecorius, S., Wiedensohler, A., Zhang, Y., and Wang, T.: Heterogeneous N2O5 uptake coefficient and production yield of ClNO2 in polluted northern China: roles of aerosol water content and chemical composition, Atmos. Chem. Phys., 18, 13155–13171, https://doi.org/10.5194/acp-18-13155-2018, 2018. a, b
Thornton, J. A., Braban, C. F., and Abbatt, J. P. D.: N2O5 hydrolysis on sub-micron organic aerosols: the effect of relative humidity, particle phase, and particle size, Phys. Chem. Chem. Phys., 5, 4593–4603, https://doi.org/10.1039/b307498f, 2003. a
Thornton, J. A., Kercher, J. P., Riedel, T. P., Wagner, N. L., Cozic, J., Holloway, J. S., Dubé, W. P., Wolfe, G. M., Quinn, P. K., Middlebrook, A. M., Alexander, B., and Brown, S. S.: A large atomic chlorine source inferred from mid-continental reactive nitrogen chemistry, Nature, 464, 271–274, https://doi.org/10.1038/nature08905, 2010. a, b, c
Vogt, R., Crutzen, P., and Sander, R.: A mechanism for halogen release from sea-salt, Nature, 383, 327–331, https://doi.org/10.1038/383327a0, 1996. a
Wagner, N. L., Riedel, T. P., Young, C. J., Bahreini, R., Brock, C. A., Dubé, W. P., Kim, S., Middlebrook, A. M., Öztürk, F., Roberts, J. M., Russo, R., Sive, B., Swarthout, R., Thornton, J. A., VandenBoer, T. C., Zhou, Y., and Brown, S. S.: N2O5 uptake coefficients and nocturnal NO2 removal rates determined from ambient wintertime measurements, J. Geophys. Res.-Atmos., 118, 9331–9350, https://doi.org/10.1002/jgrd.50653, 2013. a
Wang, T., Tham, Y. J., Xue, L., Li, Q., Zha, Q., Wang, Z., Poon, S. C. N., Dubé, W. P., Blake, D. R., Louie, P. K. K., Luk, C. W. Y., Tsui, W., and Brown, S. S.: Observations of nitryl chloride and modeling its source and effect on ozone in the planetary boundary layer of southern China, J. Geophys. Res.-Atmos., 121, 2476–2489, https://doi.org/10.1002/2015JD024556, 2016. a, b, c, d
Wang, X., Wang, T., Yan, C., Tham, Y. J., Xue, L., Xu, Z., and Zha, Q.: Large daytime signals of N2O5 and NO3 inferred at 62 amu in a TD-CIMS: chemical interference or a real atmospheric phenomenon?, Atmos. Meas. Tech., 7, 1–12, https://doi.org/10.5194/amt-7-1-2014, 2014. a
Wang, X., Wang, H., Xue, L., Wang, T., Wang, L., Gu, R., Wang, W., Tham, Y. J., Wang, Z., Yang, L., Chen, J., and Wang, W.: Observations of N2O5 and ClNO2 at a polluted urban surface site in North China: High N2O5 uptake coefficients and low ClNO2 product yields, Atmos. Environ., 156, 125–134, https://doi.org/10.1016/j.atmosenv.2017.02.035, 2017. a, b, c
Wang, X., Jacob, D. J., Eastham, S. D., Sulprizio, M. P., Zhu, L., Chen, Q., Alexander, B., Sherwen, T., Evans, M. J., Lee, B. H., Haskins, J. D., Lopez-Hilfiker, F. D., Thornton, J. A., Huey, G. L., and Liao, H.: The role of chlorine in global tropospheric chemistry, Atmos. Chem. Phys., 19, 3981–4003, https://doi.org/10.5194/acp-19-3981-2019, 2019. a
Wang, Z., Wang, W., Tham, Y. J., Li, Q., Wang, H., Wen, L., Wang, X., and Wang, T.: Fast heterogeneous N2O5 uptake and ClNO2 production in power plant and industrial plumes observed in the nocturnal residual layer over the North China Plain, Atmos. Chem. Phys., 17, 12361–12378, https://doi.org/10.5194/acp-17-12361-2017, 2017. a, b, c
Wayne, R. P., Barnes, I., Biggs, P., Burrows, J. P., Canosa-Mas, C. E., Hjorth, J., Le Bras, G., Moortgat, G. K., Perner, D., Poulet, G., Restelli, G., and Sidebottom, H.: The nitrate radical: Physics, chemistry, and the atmosphere, Atmos. Environ., 25, 1–203, https://doi.org/10.1016/0960-1686(91)90192-A, 1991. a
Weinheimer, A. J., Walega, J. G., Ridley, B. A., Gary, B. L., Blake, D. R., Blake, N. J., Rowland, F. S., Sachse, G. W., Anderson, B. E., and Collins, J. E.: Meridional distributions of NOx, NOy, and other species in the lower stratosphere and upper troposphere during AASE II, Geophys. Res. Lett., 21, 2583–2586, https://doi.org/10.1029/94GL01897, 1994. a
Williams, E., Baumann, K., Roberts, J. M., Bertman, S. B., Norton, R. B., Fehsenfeld, C., Springston, S. R., Nunnermacker, L. J., Newman, L., Olszyna, K., Meagher, J., Hartsell, B., Edgerton, E., Pearson, J. R., and Rodgers, M. O.: Intercomparison of ground-based NOy measurement techniques, J. Geophys. Res., 103, 22261–22280, 1998. a
Wolfe, G. M., Marvin, M. R., Roberts, S. J., Travis, K. R., and Liao, J.: The Framework for 0-D Atmospheric Modeling (F0AM) v3.1, Geosci. Model Dev., 9, 3309–3319, https://doi.org/10.5194/gmd-9-3309-2016, 2016. a, b, c
Woodcock, A. H.: Salt Nuclei in Marine Air As a Function of Altitude and Wind Force, J. Meteorol., 10, 362–371, https://doi.org/10.1175/1520-0469(1953)010<0366:SNIMAA>2.0.CO;2, 1953. a
Young, C. J., Washenfelder, R. A., Roberts, J. M., Mielke, L. H., Osthoff, H. D., Tsai, C., Pikelnaya, O., Stutz, J., Veres, P. R., Cochran, A. K., Vandenboer, T. C., Flynn, J., Grossberg, N., Haman, C. L., Lefer, B., Stark, H., Graus, M., De Gouw, J., Gilman, J. B., Kuster, W. C., and Brown, S. S.: Vertically resolved measurements of nighttime radical reservoirs in los angeles and their contribution to the urban radical budget, Environ. Sci. Technol., 46, 10965–10973, https://doi.org/10.1021/es302206a, 2012. a, b
Young, C. J., Washenfelder, R. A., Edwards, P. M., Parrish, D. D., Gilman, J. B., Kuster, W. C., Mielke, L. H., Osthoff, H. D., Tsai, C., Pikelnaya, O., Stutz, J., Veres, P. R., Roberts, J. M., Griffith, S., Dusanter, S., Stevens, P. S., Flynn, J., Grossberg, N., Lefer, B., Holloway, J. S., Peischl, J., Ryerson, T. B., Atlas, E. L., Blake, D. R., and Brown, S. S.: Chlorine as a primary radical: evaluation of methods to understand its role in initiation of oxidative cycles, Atmos. Chem. Phys., 14, 3427–3440, https://doi.org/10.5194/acp-14-3427-2014, 2014. a
Yun, H., Wang, W., Wang, T., Xia, M., Yu, C., Wang, Z., Poon, S. C. N., Yue, D., and Zhou, Y.: Nitrate formation from heterogeneous uptake of dinitrogen pentoxide during a severe winter haze in southern China, Atmos. Chem. Phys., 18, 17515–17527, https://doi.org/10.5194/acp-18-17515-2018, 2018. a, b, c
Zhang, L., Li, Q., Wang, T., Ahmadov, R., Zhang, Q., Li, M., and Lv, M.: Combined impacts of nitrous acid and nitryl chloride on lower-tropospheric ozone: new module development in WRF-Chem and application to China, Atmos. Chem. Phys., 17, 9733–9750, https://doi.org/10.5194/acp-17-9733-2017, 2017. a, b