the Creative Commons Attribution 4.0 License.
the Creative Commons Attribution 4.0 License.
 | 07 Oct 2019
Growth in mid-monsoon dry phases over the Indian region: prevailing influence of anthropogenic aerosols
Rohit Chakraborty
Bijay Kumar Guha
Shamitaksha Talukdar
Madineni Venkat Ratnam
Animesh Maitra
A detailed investigation on the potentially drought-prone regions over India is presented in this study based on the balance between precipitation and potential evapotranspiration (PET) during the southwest Asian mid-monsoon season. We introduce a parameter named dry day frequency (DDF) which is found suitable to present the drought index (DI) in mid-monsoon season, hence strongly associated with the possibility of drought occurrences. The present study investigates the probable aspects which influence the DDF over these regions, revealing that the abundance of anthropogenic aerosols especially over urbanized locations has a prevailing role in the growth of DDF during the last few decades. The prominent increasing trend in DDF over Lucknow (26.84∘ N, 80.94∘ E), a densely populated urban location situated in the Indo-Gangetic Plain, strongly reflects the dominant association of anthropogenic aerosols with the increasing dry phase occurrences. Increase in DDF (∼90 %) during the last 60 years is observed over this urban area compared to a broader region in its surroundings. In addition, periodic impacts of large-scale phenomena like ENSO (El Niño–Southern Oscillation) or SSN (sunspot number) become weaker when the study location is downscaled towards an urbanized region. Finally, when long-term projections of DDF are drawn using the high urbanization scenario of RCP 8.5, a huge rise in dry days is seen during mid-July to mid-September (reaching up to 50 dry days by the year 2100 over Lucknow), which will be a crucial concern for policymakers in future.
- Article
(3649 KB) - Full-text XML
-
Supplement
(2193 KB) - BibTeX
- EndNote


Drought is a natural and recurrent phenomenon which occurs in all forms of climate. Although similar to aridity in many ways, droughts are mainly temporary in nature and thus they should not be confused with water scarcity due to excess of water demand over available supply. On the other hand, these weather extremes are more reasonably linked with the distribution and frequency of rainfall over any region. Although there are no generally accepted definitions for drought, the American Meteorological Society has categorized it into four types: meteorological or climatological, agricultural, hydrological, and socioeconomic (Heim, 2002). A prolonged drought lasts several months or even years, while the absence or reduction of precipitation creates meteorological droughts. On the other hand, short-term (few weeks) dryness in the surface layer could result in an agricultural drought (Heim, 2002). However, when prolonged meteorological droughts reduce the ground water level severely then hydrological droughts occur. Finally, all of the first three droughts with a deficit in water availability are named as socioeconomic drought. Among these four, the agricultural drought might be a serious issue when farming or crop producing in humid or subhumid zones are concerned. The situation has, however, become more serious in the present due to rapid population growth across all continents, thereby also producing an increase in their global demand (Sivakumar, 2011).
India is a country where agriculture and its allied activities act as major sources of livelihood and hence it is expected to be deeply affected by drought occurrences, especially if they occur in the mid-monsoon period (as it experiences ∼80 % of the annual rainfall due to the southwest monsoon). Generally drought events originate from a deficiency in precipitation and water shortage over a particular region and time. As rainfall observation data are available from the past 2 centuries, mostly all of the calculations of drought indices include this variable either singly or in combination with other meteorological parameters (WMO, 1975). Some early drought indices were simply represented by the drought duration or intensity upon satisfying the drought defining criteria, e.g., Munger (1916) defined the drought index as the length of period without 24 h precipitation with a minimum of 1.27 mm. Marcovitch (1930) used temperature data along with the precipitation, while Benton (1942) used the length of drought in days, where the count was terminated upon occurrence of 2.54 mm of rainfall over a span of 48 h. Likewise, many other drought indices can be found in the literature where precipitation has been used as a primary factor (Palmer, 1965; Lloyd-Hughes and Saunders, 2002). Recently, the multiscaler drought index named the Standardized Precipitation Index (McKee et al., 1993) is widely used by several researchers in analyzing the drought characteristics. However, no single index has the ability to precisely represent the drought duration and intensity and its possible impacts (Wilhite and Glantz, 1985). Again, apart from the rainfall, there are also some other parameters that affect the drought severity, e.g., potential evapotranspiration (PET) and soil water holding capacity (Dai et al., 2004). The Palmer Drought Severity Index (Palmer, 1965) is an effective parameter which uses all these three parameters; however, it has some limitations when applying over climatic zones like India (Kumar et al., 2013). In addition, gathering all these parameters in gridded form and then quantifying the drought index is very difficult over the Indian region. On the other hand, the Standardized Precipitation Evapotranspiration Index (SPEI) uses only precipitation and temperature, and is considered to be better for analyzing drought occurrence (Begueria et al., 2010).
India happens to be one of the most vulnerable drought-prone countries, as severe droughts occur at least once in a 3-year time span since the past few decades. In addition, there are numerous instances of severe drought conditions during monsoon as reported in the recent past (Pai et al., 2011). Consequently, several studies have been carried out in recent years in order to understand the drought occurrences during the Indian summer monsoon period (Gore and Sinha Ray, 2002). Bhalme and Mooley (1980) defined the Drought Area Index for drought intensity assessment using monthly rainfall distribution. Raman and Rao (1981) suggested a possible relation between summer droughts and prolonged brake phase of the southwest monsoon over the Indian subcontinent. Parthasarathy et al. (1987) identified the extreme drought years by analyzing the decade-long anomalies in the Indian summer monsoon rainfall. Tyalagadi et al. (2015) analyzed more than 100 years of rainfall and identified 21 drought years, half of which were associated with El Niño. Gadgil et al. (2003) explained the excess rainfall or drought in terms of the Equatorial Indian Ocean Oscillation (EQUINOO) during 1972–2002, especially during monsoon season. Francis and Gadgil (2010) also suggested the role of the El Niño Southern Oscillation (ENSO) and EQUINOO behind the 48 % deficit of June rainfall over India. Apart from these oscillations, like ENSO or IOD (Indian Ocean Dipole), there are also lots of other parameters which may have prominent influences on drought occurrence: Himalayan ice cover, Eurasian snow cover, the passage of intraseasonal waves, effects of accumulated pollution etc., e.g., Krishnamurti et al. (2010) reported the intrusion of desert air mass to be responsible for the drought occurrences over the central Indian region.
In general, most of the previous studies on monsoon droughts are discussed on the basis of rainfall accumulation, and there are very few which quantify its relation with the direct or indirect radiative effects of aerosols (Twomey, 1977) while considering both rainfall and PET. Absorbing aerosols such as black carbon (BC) or dust have the capability of atmospheric heating by absorbing solar radiation, while nonabsorbing aerosols (e.g., sulfates) scatter the solar radiation and have less of an effect over the same time span (Lau and Kim, 2006). Additionally, they have the capability of modulating the cloud characteristics by altering cloud radiative properties (Wencai et al., 2015). Previous studies have shown the presence of the aerosols (mainly dust and BC) and their ability to impact rainfall (depending upon their sizes) during Indian summer monsoon as described by the elevated heat pump hypothesis (Solmon et al., 2015). During late premonsoon or early monsoon season, the aerosol loading over India is nearly 3 times higher than the average due to the dust abundance, which is partly dependent upon the winds, precipitation and surface temperature (Dey, 2004). However, the opposite can also be true (e.g., Moorthy et al., 2007). Very recently some new attempts were undertaken to study the long- and short-term implications of both natural and anthropogenic components in producing several atmospheric processes in the boundary layer which produce a hindrance to convective rainfall, especially over urbanized coastal locations, which may also lead to subsequent drought occurrences (Chakraborty et al., 2017; Talukdar et al., 2017). Keeping all these assertions in mind, an effort is made to establish a possible relationship between aerosol loading and summer monsoon rainfall, and consequently over drought occurrences during this period in the past few decades.
A detailed investigation is presented on the evolution of the dry phase leading to drought conditions during mid-monsoon over three Indian regions based on the balance between precipitation and PET during the monsoon season. A new parameter called dry day frequency is used to understand the trends of drought potential over the mentioned Indian regions. This is followed by a three-pronged investigation to identify the most dominant factor behind these trends after which future projections of DDF is observed and explained for these locations during the mid-monsoon period.
Most of the research attempts in the recent past have employed the SPEI as an indicator of drought occurrence over the Indian region (Beguería et al., 2010). SPEI, which is precipitation minus PET, mainly represents the climatic monthly water budget. Interestingly, this parameter is found to be the most reliable identifier of drought occurrences as it can be expressed in terms of standardized Gaussian variance with 0 mean and 1 standard deviation. Another advantage of using SPEI over any other multiscalar drought indicators (e.g., SPI) is that it not only includes the effect of the evaporative demand in its calculation but also can be calculated for different timescales (Beguería et al., 2010), unlike the Palmer Drought Severity Index (PDSI) which relies on a water balance of a particular system. In this study the SPEI is calculated using monthly precipitation and PET from the CRU TS3 dataset (http://catalogue.ceda.ac.uk/uuid/c9dd2107e0b7e8c7b6aca7c34980f679, last access: 15 September 2018), where the PET is calculated considering the monthly mean temperature and the geographical location of the concerned region as per the method suggested by Thornthwaite (1948). Hence, it provides long-term information about the drought conditions over any location with a high spatial resolution of 0.5∘ × 0.5∘ on a monthly basis. However, the available precipitation (P) data are provided in the form of monthly accumulated value, whereas the PET represents the monthly mean. Therefore, the difference (D) or SPEI is calculated for each month as follows:
It may be noted that for this analysis the value of D is normalized with respect to the climatic mean and 1σ standard deviation to obtain comparable values for all regions of the country. These normalized values of D are hereafter referred to as DI. This study considered the length of the dry phase as an indicator of drought occurrence and severity, which is calculated from 0.25∘ × 0.25∘ daily gridded rainfall datasets as in the National Data Centre, India Meteorological Department (IMD) (Guhathakurta and Rajeevan, 2008), during the period of 1901–2015. Owing to its better temporal and spatial resolutions, the IMD rainfall dataset has been used in several research attempts in the past for analyzing the morphology of drought occurrences over India (e.g., Gore and Sinha Ray, 2002). In previous literature, there have been various mentions of identifying certain days as dry, based on some predefined daily rainfall accumulation thresholds. Singh and Ranade (2010) has mentioned that days having rainfall less than 5 mm d−1 can be considered dry. But this criterion is only valid for ecological droughts and hence it will not be a suitable threshold for many Indian regions experiencing very low rainfall. Recently, another classification scheme has also been attempted by Sushama et al. (2014) where rainfall accumulation lower than 1 or 3 mm d−1 is considered a dry day. To further check which threshold provides best results, the correlation coefficients of DI versus DDF are plotted in Table S2 in the Supplement. The correlation coefficients follow some spatial diversity but interestingly they do not exhibit much change with respect to the rainfall threshold. Hence, to understand its implication, the number of days having rainfall accumulation above 1 and 3 mm (during JJAS) is expressed in the form of a ratio in Fig. S1. The ratio indicates that for all the months and regions days having rainfall accumulation above 1 mm d−1 are more in number compared to the days having rainfall accumulation above 3 mm d−1. This makes it reasonable to set 1 mm d−1 as the threshold rainfall accumulation for DDF consideration as it will filter out only the intensely dry conditions which will make the drought identification more reliable. Hence, in this study 1 mm d−1 is used as the dry day identification threshold. Further, the DI values obtained are normalized with respect to mean and standard deviation for simplicity. Datasets of number of dry days and drought index are passed into three dependence tests: first using three equally sized grouped box whisker distributions and second by principle component analysis of variances of two main contributors. The third approach involves multilinear regression in order to see the contribution of various components on dry or wet condition,
Datasets of sunspot numbers are considered here as a reliable representative of solar activity, which in turn may modulate the earth's hydrological balance. There have been several scientific mentions in the past underlying the effect of solar intensity on tropical rain and monsoon strengths both over India and abroad (Agnihotri et al., 2002). Monthly averaged sunspot numbers are obtained from the Solar Influences Data analysis Center (SIDC) in the Royal Observatory of Belgium from the year 1749 till present (Cliver et al., 2013). This study also considered the ENSO index, obtained from the Oceanic Niño Index (ONI), which is calculated using a 3-month running mean of Extended Reconstructed Sea Surface Temperature, Version 5 (ERSST.v5). Sea surface temperature (SST) anomalies in Niño 3.4 region (5∘ N–5∘ S, 120∘–170∘ W) with a 30-year base period (Huang et al., 2017). Conditions resulting in values beyond the threshold of ±0.5 ∘C are considered to be either an El Niño or La Niña. These datasets are obtained from 1950 to present. The present study also uses 0.5∘ × 0.625∘ gridded datasets of aerosol optical thickness (AOT) at 550 nm, black carbon (BC), dust (PM2.5 only), organic carbon (OC), sea salt and sulfate obtained from MERRA-2 (Modern-Era Retrospective analysis for Research and Applications version 2) provided by NASA. MERRA-2 provides a global reanalysis product since 1980 to present (https://gmao.gsfc.nasa.gov/reanalysis/MERRA-2/, last access: 25 June 2019). The reliability of the aerosol products from MERRA-2 have already been authenticated in studies like Buchard et al. (2017). According to previous reports by Randles et al. (2017), the standard deviation between AOD values and their corresponding observation counterparts are found to be as low as 0.001 for BC AOT and up to 0.013 for total AOT. In recent years, these datasets have also been utilized for similar climatic investigations over the Indian region (Pandey et al., 2017). Moreover, in this study an additional validation of the aerosol components from MERRA-2 have been made against in situ datasets from Aethalometer measurements over Kolkata. However, to preserve the parity with monthly averaged black carbon extinction as in MERRA-2, the observation datasets are also monthly averaged for a net period of 36 months during 2013, 2015 and 2017. Consequently, a well matching pattern is observed between the two sources as shown in Fig. S2. To double check, the datasets of BC AOT and concentrations are both normalized and then their probability distributions are plotted. The distributions fitted with Gaussian curves show almost similar behavior in both the cases, which shows the suitability of these datasets in subsequent sections. However, it may be noted here that the purpose of this validation is solely to authenticate the feasibility of the data and not to give any idea about the absolute accuracies from MERRA-2.
In addition to all general data quality issues, there is another potential issue regarding the discrepancy in data quality before and after the year 1999. To solve this issue, AOT datasets were taken in two clusters before and after 1999 and a detailed statistical analysis on the data revealed widespread overlapping which supports the continuity in data quality standards of aerosols for this analysis. Further details are provided in the Supplement Text 1 and Table S3.
In addition, the ERA-Interim reanalysis low-cloud-cover data are utilized (http://www.ecmwf.int/, last access: 10 August 2019) at 0.75∘ × 0.75∘ default resolution (Berisford et al., 2011) during 1980–2015. The idea behind using this dataset was to identify the association between increased cloudiness and reduced rain accumulation during the mid-monsoon months. The same dataset was also utilized to obtain monthly averaged values of several local and mesoscale parameters related to precipitation such as moisture content (SHUM) and geopotential (Z) at 850 hPa, instability indices such as vertical total index (VT) and near-surface temperature (T2m).
This study uses gridded population density (as a proxy of urbanization), obtained from the Gridded Population of the World (GPWv4) and provided by the CIESIN-SEDAC database from Columbia University for the years 2000, 2005, 2010 and 2015. This dataset is constructed by extrapolating the population data from national or subnational administrative units all around the world. The resolution of the product is 30 arcsec, or approximately 1 km at the Equator; further details about the data can be obtained from the following link: https://sedac.ciesin.columbia.edu/data/set/gpw-v4-population-density-rev11 (last access: 8 October 2018).
3.1 Identification of potentially drought-prone regions over India
Considerable conditions for drought occurrences are identified on the basis of the balance between monthly PET and rainfall accumulation during June–September as depicted in Fig. 1. It is seen that due to arid climates, northwestern India experiences higher values of PET, particularly up to July, which may happen due to late arrival of monsoons at that location, and hence this region may be considered for the analysis. On the other hand, the southeastern peninsula of India experiences higher PET values, hence it has been considered for further analysis. However, the rest of the country experiences much lower values of PET. In contrast, precipitation values are consistently lower both in northwestern India as well as the southeastern peninsula, so both these regions may face more probability to experience negative DI, hence are selected for analysis. Another highlight from the figure is that, the mid-section of the Indo-Gangetic Plain (IGP) depicts a sharp gradient of precipitation. This diversity becomes more prominent during the months of July–August as during this period, the entire IGP experiences very heavy rain accumulation (> 300 mm on average) but the mid-IGP experiences much lower rainfall ∼200 mm. Consequently, this mid-IGP region is also selected for analysis. Accordingly, the grid points with 0.5∘ resolution in these three regions are identified and accumulated to form three main study regions which are numbered 1, 2 and 3 corresponding to IGP, southeastern peninsula and northwest India, respectively as shown in Fig. S3.
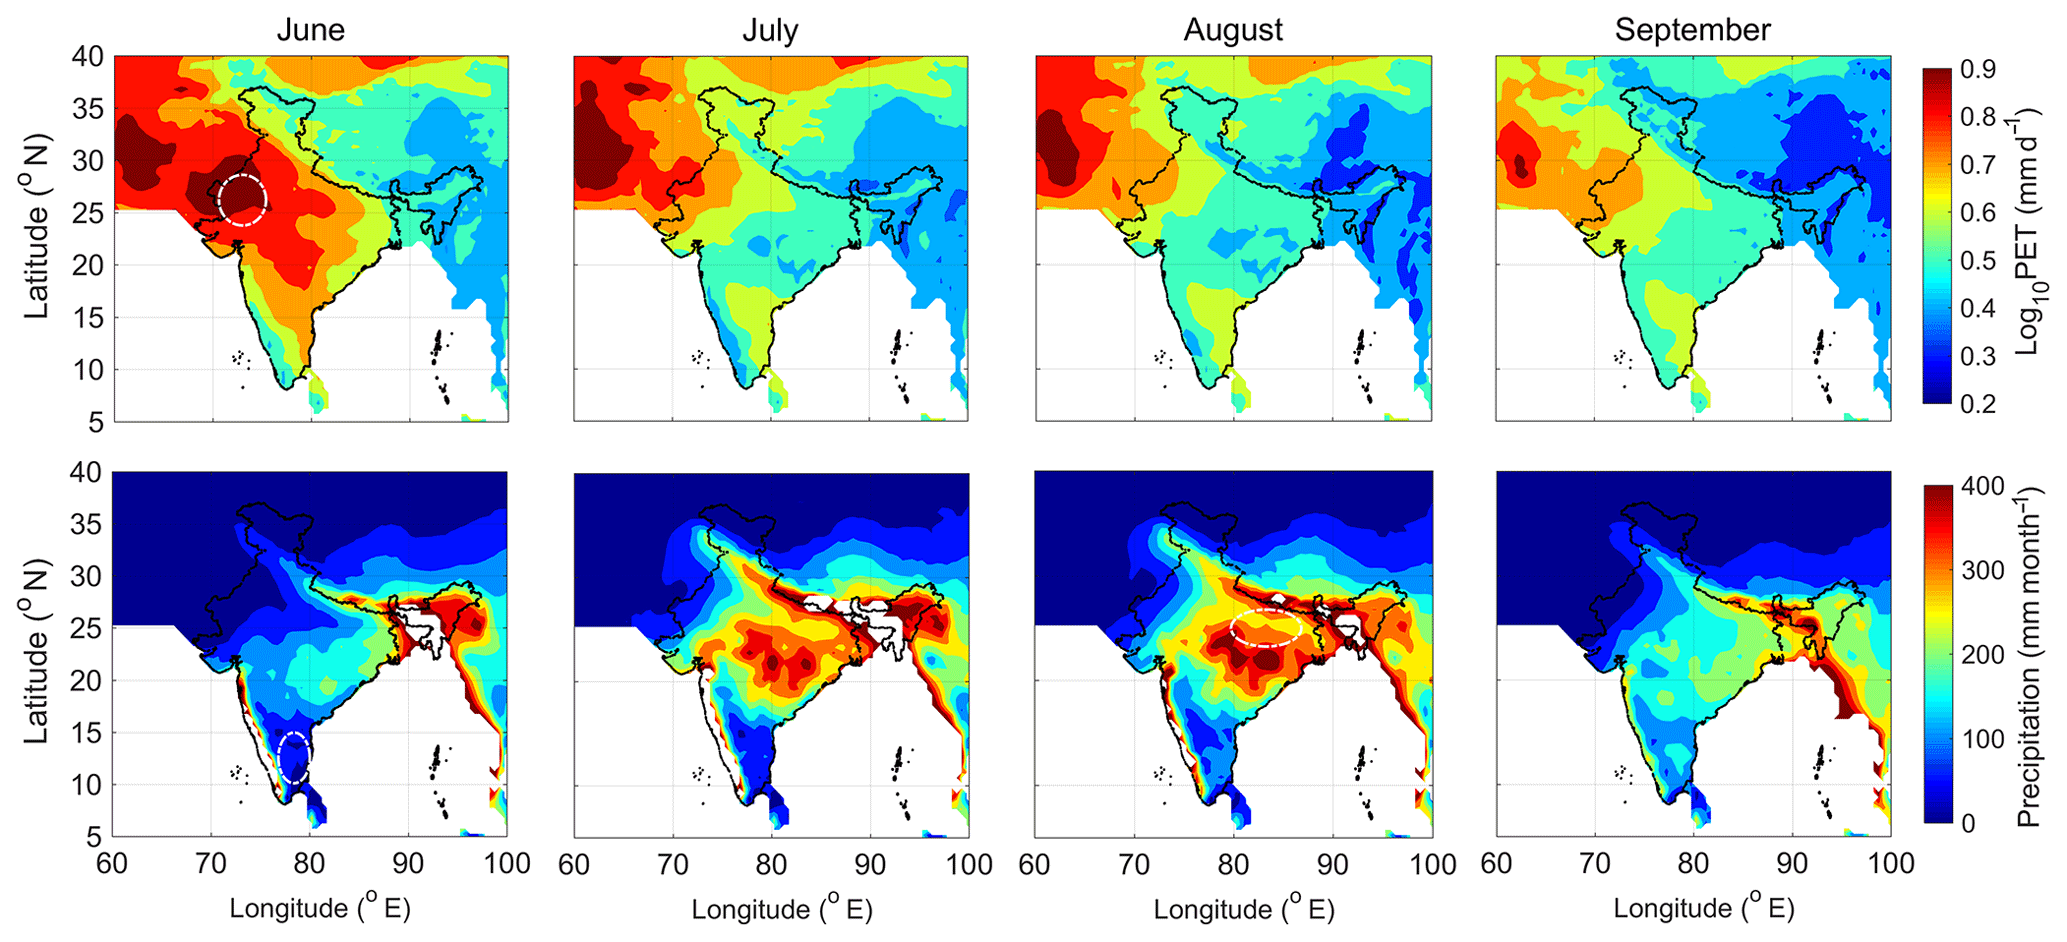
Figure 1Monthly averaged maps of potential evapotranspiration rate and precipitation during June–September.
3.2 Importance of dry day frequency (DDF) in analyzing the drought conditions
After the identification of the drought-prone regions, the main objective is to determine a suitable parameter which best represents the probability of droughts and which also can be related to other natural and anthropogenic factors in all regions. Hence an assumption is made that if the temporal distribution of rainfall is considered constant each month, then a drought is only possible when both PET is high and precipitation is low. Now low precipitation and high PET mainly arise from multiple dry day occurrences in a month leading to droughts. For simplicity, during each of the four months in the three seasons, the difference between precipitation and PET is calculated over 115 years and the obtained data are normalized with respect to mean and 1σ SD. The DDF time series is calculated from daily precipitation values as already described previously after which the absolute magnitudes of correlation coefficients between drought index DI and this dry day frequency are calculated and shown in Fig. 2a. The correlation analysis is done for two overlapping periods of 115 and 60 years: 1901–2015 and 1956–2015. The reason for this two-part analysis is that during the second part more technological advancement may lead to more reliable daily rainfall data; this is because during recent years the advent of more accurate rain gauges has led to more reliability in measuring the daily accumulation that is < 1 mm and thus more reliable dry day frequencies are calculated. Another reason is that the second part witnessed more station and satellite data sources, so the possibility of a relationship is expected to be stronger in the last 60 years. However, to provide better evidence of the above-stated hypothesis, Fig. S4 shows scatter plots of DI and dry day frequencies for all regions and months.
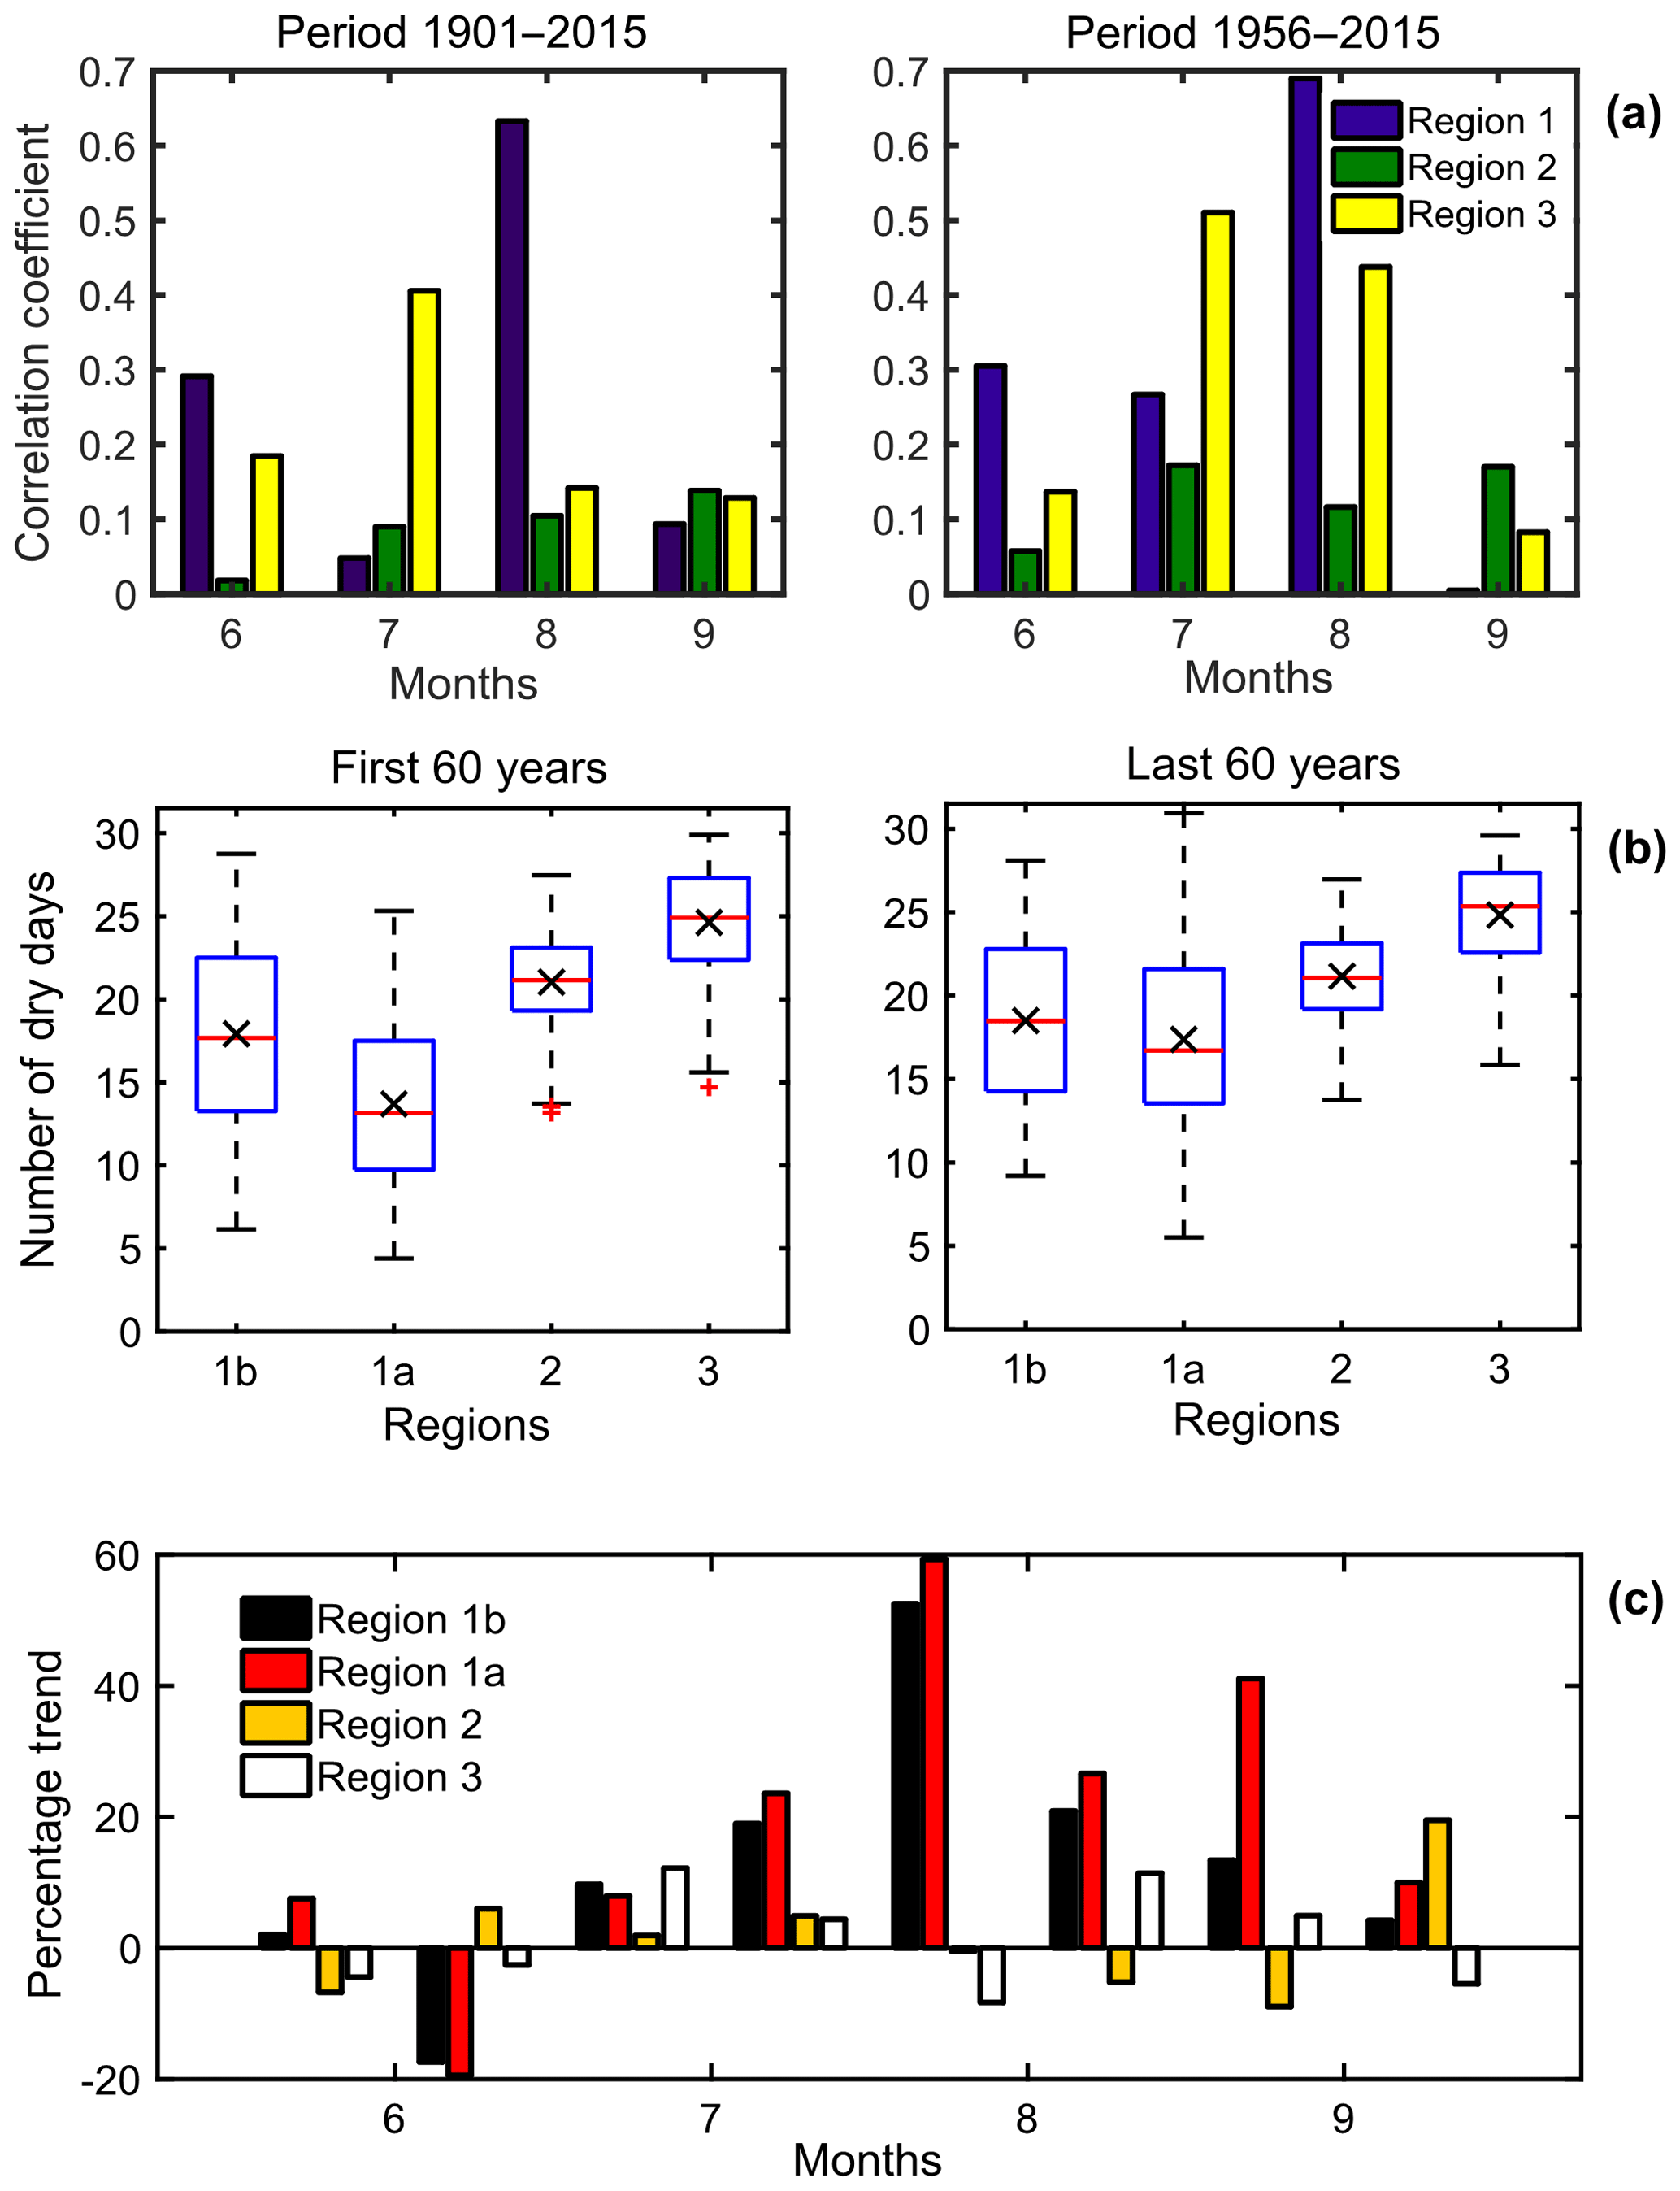
Figure 2(a) Correlation coefficients between DI and DDF values for all monsoon months for two different climatic periods, 1901–2015 and 1956–2015; (b) monthly mean values of DDF for regions 1a, 1b, 2 and 3 during 1901–1960 and 1956–2015; (c) the 15 d trends of DDF trends during 1956–2015.
The correlation analysis depicts a set of reasonable correlation coefficients in both regions 1 and 3 over 115 years. Better correlation values are observed typically over July in region 3 and August in region 1, while it is lower in all other cases. It may be noted that regions situated in the western and northwestern parts of the country experience delayed monsoon (supported from many independent sources) which have led to high correlation values during June and July over region 3. However, region 1 especially shows a good correlation in August, a mid-monsoon month, which needs more attention in the following sections. Here, it may be noted from Fig. S4 that the agreement between DDF and DI is not strong in most of the cases other than three to four instances only. The reason is that the DI is dependent on the monthly accumulated difference between precipitations and PET, while DDF depends upon the erratic distribution of daily rainfall accumulation, hence the temporal scales of these two parameters are different from each other. The second reason is the presence of an independent factor called PET which depends upon various components (location, season, vegetation and soil type, temperature, moisture content, wind speed, surface pressure, and net radiation flux) but not on precipitation. Hence this explains the disagreement between these two parameters on a climatic scale.
Considering the last 60 years, correlation coefficients are improved in all regions and months as expected. Region 3 shows high correlations in July followed by August, while region 1 depicts comparatively much higher values during July and August. Thus the consideration of delayed monsoon onset may bring out more dry days in regions 1 and 3. But on the other hand, region 1 shows a high association between DI and dry days in August which demands investigations. Region 2 is mainly influenced by precipitation occurring during the late monsoon months, i.e., September, and not by the mature monsoon stage which is evident from the higher correlation values at that time. Hence this region may not fit with the scope of the present study. Additionally, higher correlation values are obtained during the 60 years span compared to the 115-year scale, hence DDF trends will be studied over the last 60 years span in the following sections.
3.3 Determining the time spans for the analysis of DDF trend
3.3.1 The importance of partitioning region 1 for further analysis
It can be seen from the preceding sections that the correlation between DI and dry days for region 1 is noticeable, but it is not highly prominent due to the presence of many outliers in the scatter plots (Fig. S4). This is because region 1 encompasses a total spatial coverage of 5∘ × 8∘ which has a lot of topographical and climatic diversities between them. A better example of this has already been depicted from the precipitation diversity in Fig. 1, where the precipitation gradient was found to change abruptly even within region 1. So these spatial diversities can interrupt the association between droughts and dry days. Hence to have a more realistic investigation, the region is now partitioned horizontally along 81.25∘ E, which lies in the middle of IGP. This gives rise to two different regions in the east and west of region 1 which will hereafter be referred to as regions 1a and 1b, respectively. The total distribution of data of DDF for 1a, 1b, 2 and 3 are again investigated for two overlapping periods 1901–1960 and 1956–2015 for parity in Fig. 2b. Regions 2 and 3 show almost no change in the distribution before or after 1955, hence it is not given importance. Region 1b shows a slight increase in mean and median but with no prominent change in the distribution, while the same thing is very prominent over region 1a. In this case, since the last 60 years the mean and median values changed by more than 4 d, which is a very alarming fact. Most importantly, the upper quartiles and whisker have ascended to a maximum value of 30 d, which indicates severe drought occurrences. Thus it can be inferred that region 1a emerges as a prominent drought-prone region showing an abrupt rise in DDF especially over the month of August and hence it will be investigated in detail in the following sections.
3.3.2 Analyzing the climatic trends of DDF using a 15 d window
It has already been discussed that the drought intensity has significant correlation with DDF on a monthly basis. However, it is also necessary to investigate whether the intramonthly distribution of rainfall may also have its own impact in modulating the dry day frequencies especially during the mid-monsoon months which experience maximum precipitation variability. Hence, the monsoon months (JJAS) are now divided into eight equal slots of 15 d each and the 60-year time series for all these regions are obtained. The robust-fit trend analysis at 95 % confidence level is done to find the mean yearly trends, which is multiplied by 60 years and then normalized with respect to mean to generate a percentage-wise change in DDF.
The percentage changes are shown in Fig. 2c, which depicts an overall increase in DDF for all regions with a few exceptions. Region 2 shows very weak trends (< 5 %) all throughout monsoon; however, by the end of September, a reasonable trend of ∼20 % is seen which may link to dry phase developments in the later months. However, this period falls at the declining phase of monsoon, which is beyond the main scope of this study, hence it is neglected.
Region 3 shows minimal but alternating dry day frequency trends (< ±5 %) throughout the monsoon season except for a weak increase (∼10 %) over July, and hence this time frame is selected for further investigation.
On the other hand, region 1 shows very strong increasing trends in dry day frequencies with a similar pattern over 1a and 1b. Both these subregions experience relative wetting in late June, followed by a prolonged dry phase up to September. But the main difference between the two subregions is that the trends are consistently high all throughout region 1a with as much as 60 % and 20 % increases over August which also continues onto September; in region 1b, the trend values are comparatively lower (40 % and 5 %) during August. Thus, it can be inferred that although a clear increase in DDF is obtained all throughout region 1 during July–September, the trends are relatively stronger in region 1a, especially during August, hence it is given primary importance in this study.
3.4 Investigating the probable influence of natural and anthropogenic components on DDF for region 1a
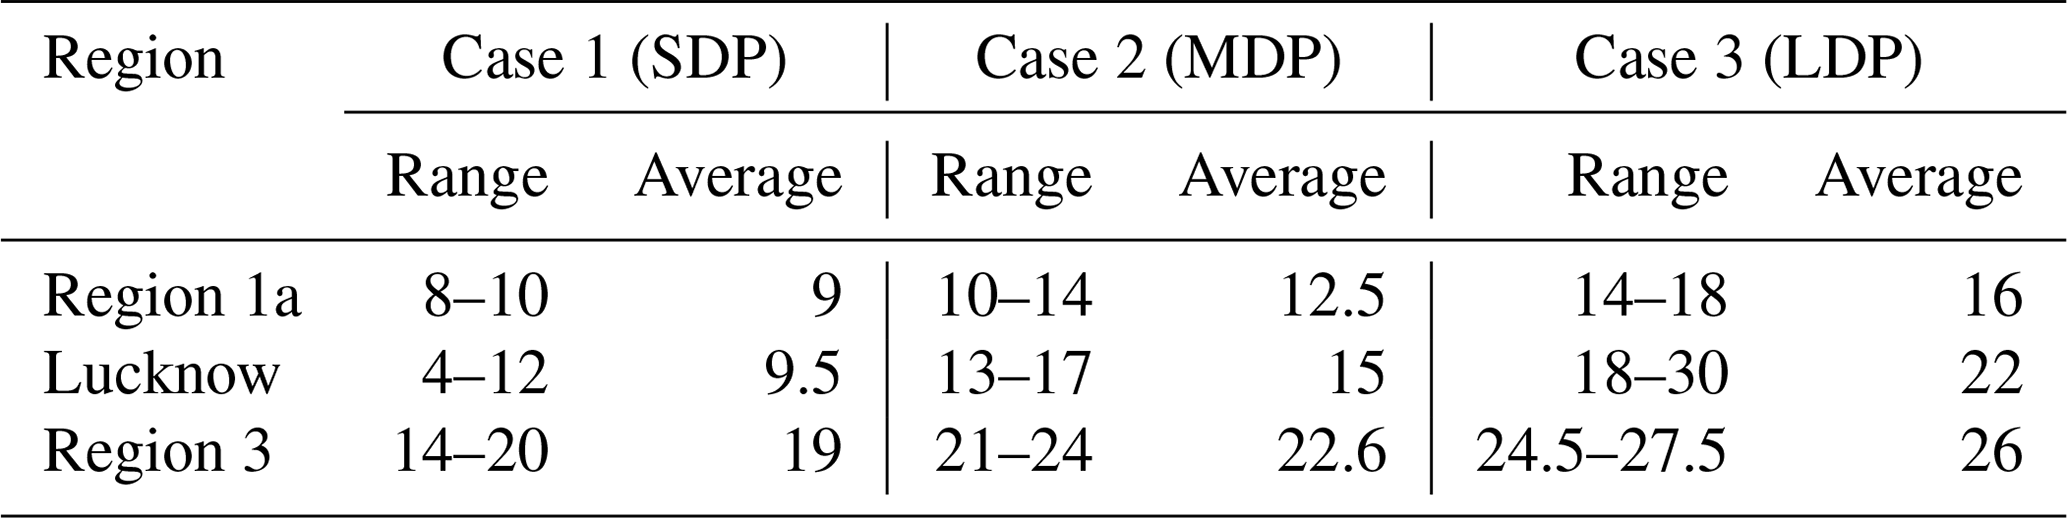
In light of the previous sections, the probable influences behind the increasing trends in dry day occurrences are investigated over region 1. A number of natural or anthropogenic factors may be responsible for this phenomenon. While natural factors mainly include the effect of solar activity, ENSO oscillations or moisture tendencies, the anthropogenic constituents mainly include aerosols which again encompass a lot of organic and inorganic pollutants. To quantify the effect of aerosols, the aerosol extinction coefficient values can be utilized from either satellite observations (Multi-angle Imaging SpectroRadiometer, MISR) or from dedicated model simulations (MERRA-2). Since observational datasets from MISR satellites are very sparse during monsoon season and also the total measurement period is only 16 years, the MERRA-2 datasets are used for further analysis. Keeping the availability of AOD datasets in mind, further analysis has to be concentrated on the 36-year time span between 1980 and 2015. Owing to the prominence of DDF trends during the month of August, further studies are concentrated on this period only. As already mentioned, natural factors like solar activity and ENSO oscillations (hereafter referred to as SSN and ENSO) may have some impact on precipitation variability, which is also supported from previous attempts, and hence they are considered. Additionally, moisture content also directly controls precipitation and so their monthly means at 850 hPa (corresponding to maximum moisture content during monsoon) are also utilized from the MERRA-2 reanalysis database. Some additional factors such as surface meteorological conditions, circulation pattern and atmospheric thermodynamics also play significant roles in controlling the occurrence of isolated but intense convective precipitations, which also indirectly affect the dry day frequency count. Hence parameters such as 2 m surface temperature, 850 hPa geopotential and vertical totals index (difference between 850 and 500 hPa temperature) are also considered in this analysis. To understand the dependence of these factors on DDF, the monthly DDF values during August, 1980–2015, are arranged in descending order and then the sorted dataset is divided into three equal groups as short dry phase (SDP), corresponding to normal conditions (8–10 d with average of 9); medium dry phase (MDP), signifying near drought (10–14 d, with average of 12.5 d); and long drought period (LDP), which represents full drought conditions (14–18 d, average ∼16), as depicted in Table 1, and they are also hereafter mentioned as SDP, MDP and LDP, respectively. For all these three groups, the distribution of total aerosol extinction (AOT), SSN, ENSO index, T2m, VT along with Z and SHUM at 850 hPa are shown in the form of box plots in Fig. 3. It is seen that as DDF increases, the distribution of total aerosols increases, as evident from the rise in median and upper whisker values. The variation in SSN is almost random in all cases, and hence neglected. Additionally, ENSO intensity changes fairly with droughts. The upper whiskers and median rises slightly, but its effect is doused due to a dominant overlapping between the groups which fails to indicate a clear relationship. Specific humidity shows a minor decrease in all groups, though the median and quartiles do not show any prominent change (from 15 to 13 g kg−1). On the other hand, Z does not show much prominent variability with respect to DDF. T2m and VT being surface parameters did show a change of 0.5 K owing to more dry days, but this change was not strong enough to be considered amid prominent overlapping between the clusters. Hence the importance of the factors other that AOT cannot be ascertained.
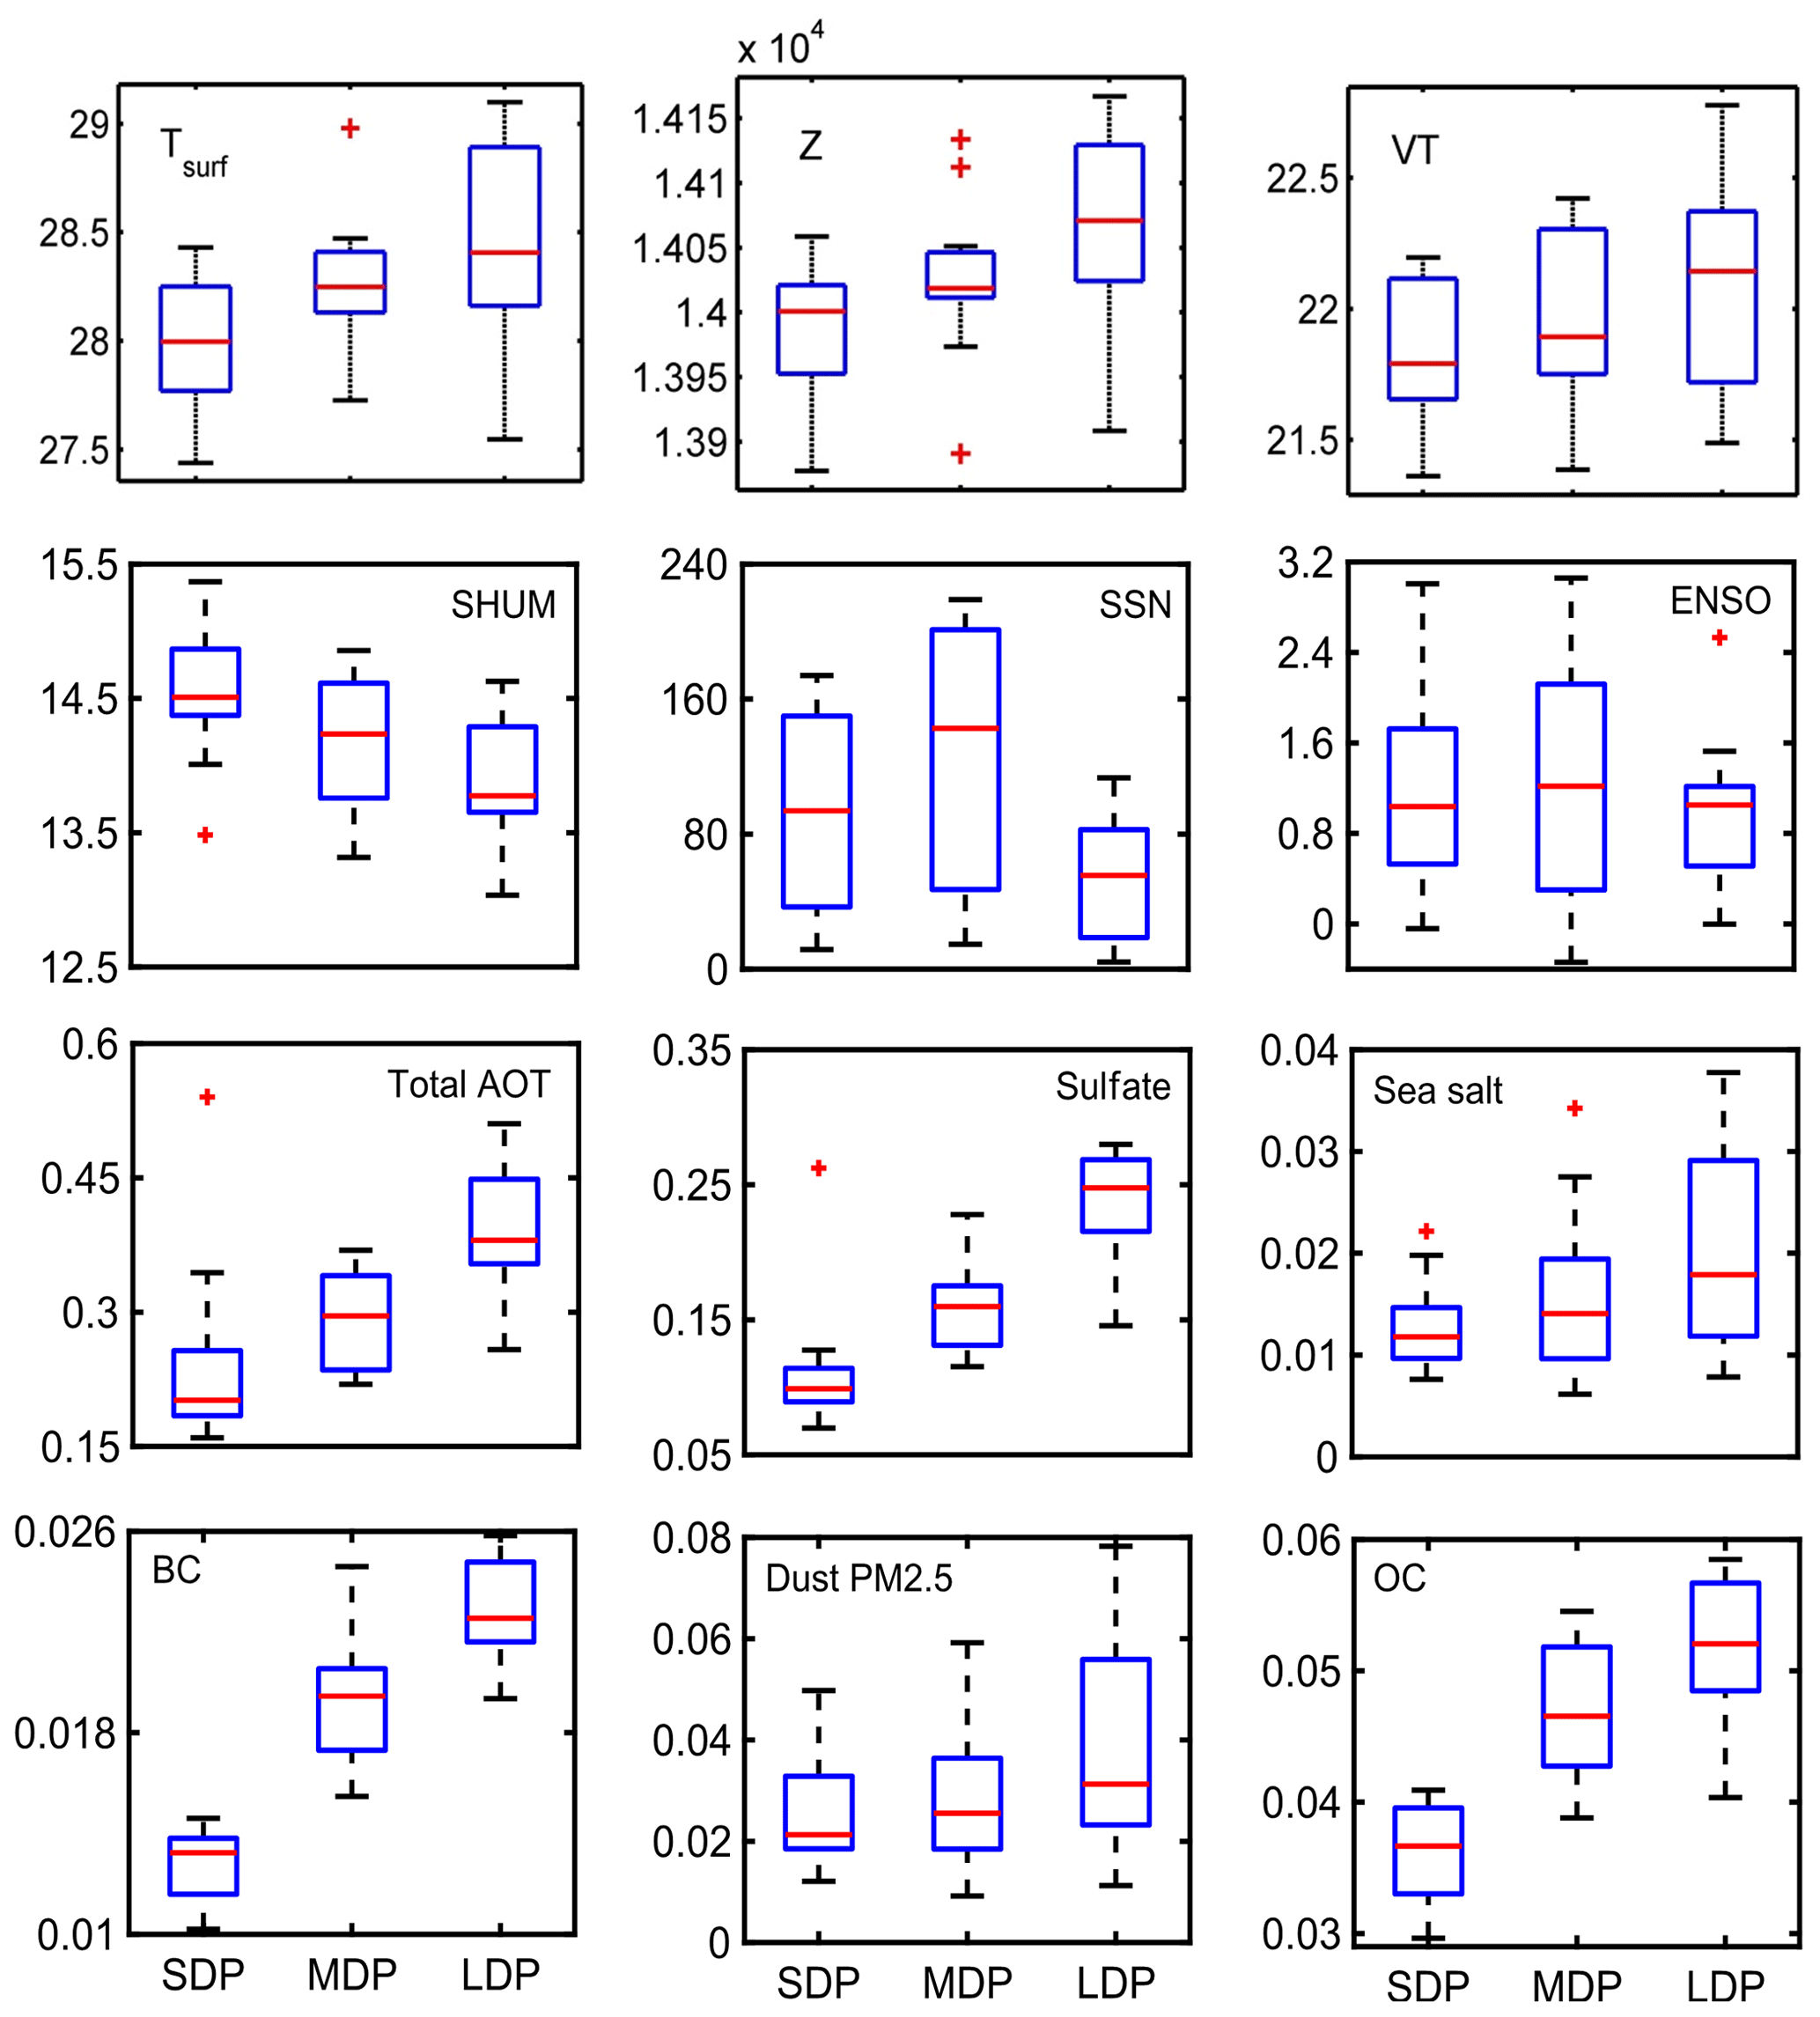
Figure 3Frequency distribution analysis results of various controlling factors behind DDF evolution for various types of dry phase lengths over region 1a, namely surface temperature, geopotential, VT, humidity, SSN, ENSO, total aerosols, sulfates, sea salt, BC, dust PM2.5 and OC.
Table 1Classification of dry phase conditions according to its length for region 1a, Lucknow and region3.
As the dry phase length distribution fails to identify the dominant factor behind the rise of dry days in region 1a, hence all these four factors are passed through principal component analysis (PCA) test and the results are shown in Fig. S5a. The analysis produced a set of three orthogonal components out of which pc1 and pc2 account for 38 % and 19 %, respectively, of variances so we can neglect the contribution of the third component. Next, the corresponding variance scores of these components are plotted in Fig. S5, which shows that most of the parameters have very little variance according to both pc1 and pc2 axes, except aerosols, thereby indicating its increasing dominance over dry day evolution which can be validated using multilinear regression (MLR) analysis.
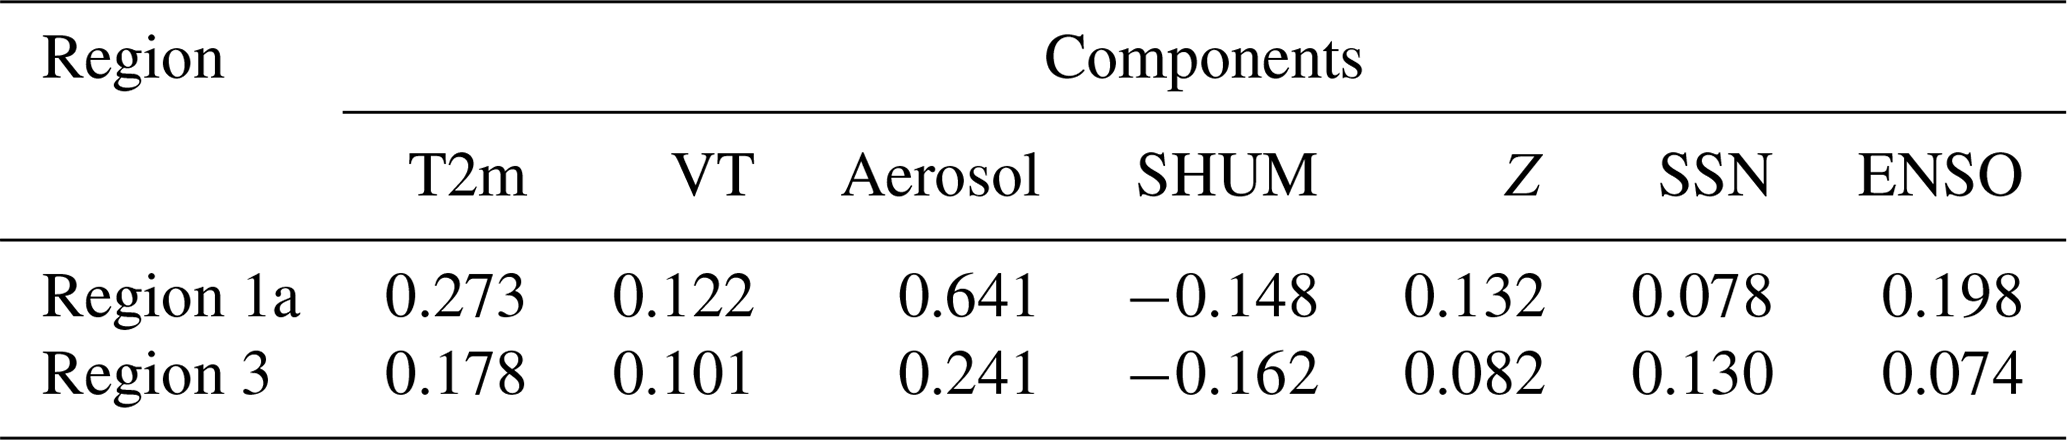
Further, multilinear regression analysis is done to see the independent contribution of these four parameters to DDF. All datasets are normalized so as to get uniform variability to enable easy identification of the dominating factors. The MLR concludes that the coefficients for T2m, VT, aerosol, SHUM, Z, SSN and ENSO are 0.273, 0.122, 0.641, −0.148, 0.132, 0.078 and 0.198, respectively, as shown in Table 2. SSN, Z and VT do not show any effect, and hence are finally rejected. ENSO and specific humidity have significant contributions but in the opposite manner and also their distribution analysis showed significant overlapping; hence they should not be considered in order to remove ambiguity. Finally aerosols and surface temperature have much higher values than the rest; however, out of the two, AOT still dominates with a coefficient of 0.641, which is much higher than the others as also observed in the PCA test and distribution analysis. Hence one has to consider aerosols as a more dominating factor compared to other natural components in modulating dry day occurrences.
Table 2MLR coefficients for all general factors affecting DDF for region 1a, Lucknow and region 3.
In view of the dominance of total aerosol AOT over DDF, the analysis is concentrated on the datasets of various aerosol components over region 1a. Total columnar extinction values of five aerosol components, namely black carbon (BC), dust PM2.5, organic carbon (OC), sea salt and sulfates, are obtained from MERRA-2. BC and OC mostly come from anthropogenic sources and significantly contribute to warming up the atmosphere. It has been reported in earlier studies that the presence of BC aerosol in cloud may have a “burn off” effect on the cloud due to heating (Ackerman et al., 2000). On the other hand, aerosols like PM2.5, which may have both natural and anthropogenic sources, can also influence the cloud lifetime by increasing cloud droplet number (Sato et al., 2018). Thus, the cloud cover is modulated and precipitation process is affected. The change in concentration of these parameters during the last 36 years over region 1a is discussed in the next section.
It was discussed in the previous sections that aerosols have a dominating influence over dry day occurrences; however, it is yet to be specified which types of aerosols (natural or anthropogenic, organic or inorganic) are becoming major influencing factors for this phenomenon over region 1a. Hence, time series datasets of these five components are again taken for 36 years and are grouped with respect to the corresponding dry day ranges as already explained in the previous section. After that, the corresponding distributions are plotted in box plots in Fig. 3. The distribution analysis depicts that the sea salts show some overlapping which reduces the impact on DDF. Sulfates have quite high values all throughout but their distribution exhibits a prominent overlapping so they cannot be used here. Dust AOT values are low but its median shows a weak contribution towards drying, but the overlapping in the distribution makes the association very weak. Compared to others, BC and OC have shown a better association with DDF along with reasonably increasing tendencies in medians and quartiles. But this phenomenon also hints towards a dominant component of pollution coming from certain highly urbanized sectors of region 1a such as Lucknow, Allahabad (25.43∘ N, 81.84∘ E) and Varanasi (25.31∘ N, 82.97∘ E). Again out of these two, BC has relatively better variation as it has the least overlapping nature, so it may be considered the most dominant factor. To have better evidence, the PCA and regression analyses are attempted.
In the previous sections, when the magnitudes of BC and sulfate AOTs are compared then a question may arise as to how such small changes in BC have a dominant influence on DDF while sulfates have relatively no effect on it. Hence to have a double check on this fact, a statistical analysis is again performed on the AOT datasets, the details of which can be found in the Supplement Text 2 and Table S4. The analysis revealed that sulfate AOTs experience tremendous overlapping between the clusters which is about 2–3 times the actual increase in its cluster mean; however, the cluster mean increase in the case of BC is 1.5 times its SD, thereby explaining its net effectiveness in controlling the DDF.
The PCA results depicted in Fig. S5b show the contribution of pc1 alone is 60 % followed by pc2 of 25 % to be more prominent, hence there may not be a need to study pc3 here. From the scores, it is found that sulfate and dust behave similarly in their variances with high pc1 and low pc2 values, but OC and BC have both high pc1 and pc2 components so they may be found responsible for the variability in dry day changes. However, sea salt also may have some influence but it is not clearly understood from the figure.
Table 3MLR coefficients for aerosol components affecting DDF for region 1a, Lucknow and region 3.

To clarify any remaining misconceptions, the MLR coefficients are computed which gives the values as 0.542, 0.129, 0.263, 0.326 and 0.124 for BC, dust, OC, sea salt and sulfates, respectively (shown in Table 3). It is expected that the dust and sulfate have very low contributions so should be neglected. BC, OC and sea salt have higher values, of which OC and sea salt have comparable magnitudes, but sea salt has much low AOT values with a lower pc1 variance score and also reasonable distribution overlapping, so the effect of OC may be considered better. BC has a very high MLR coefficient with high pc1 score and also a clear variability in distributions. Hence, it may be concluded that owing to urbanization, the effect of BC followed by OC has a strong association with drought intensity and dry day occurrence.
3.5 Investigating the probable influence of natural and anthropogenic components on DDF over Lucknow
From the previous section, it has surfaced that anthropogenic emission (of BC and OC) as a result of urbanization may have a significant association with the increase in DDF during August. To be definite about this, a reinvestigation has been done over Lucknow (26.8∘ N, 80.9∘ E), which is the state capital of the state Uttar Pradesh, and is a more urbanized point location belonging to region 1a. However, the relationship between DDF with SSN, ENSO and SHUM is not shown as Lucknow already falls in region 1a, whose synoptic effect would not change within the region. Here, the effect of individual aerosol components is also depicted in the distribution analysis as shown in Fig. 4. In the case of Lucknow, the variability in dry day values is much stronger as shown by SDP (4–12 dry days of average 9.5) MDP (13–17 d with average 15) and LDP (18–30 d with average at 22 d) mentioned in Table 1. The distribution analysis for total aerosol AOT shows much larger values over Lucknow with a fairly prominent variability in the median and quartile values which may have influenced the entire distribution towards more dry conditions. Coming to sea salts and sulfates, they have much lower values than in region 1a due to its significant distance from the seas. Sulfates show no meaningful variation, and hence they are rejected straightaway; sea salt values are low but the variation in median and upper whisker shows a prominent increase which may be important. However, the lower quartile is very small and overlapping in all three cases which serve as a setback to its variability. However, dust does not show such variations due to a considerable overlapping in it. On the other hand, BC and OC do not have much overlapping and they also have a clear increase in medians and both quartiles, thus supporting more sensitivity of this region towards dry days.
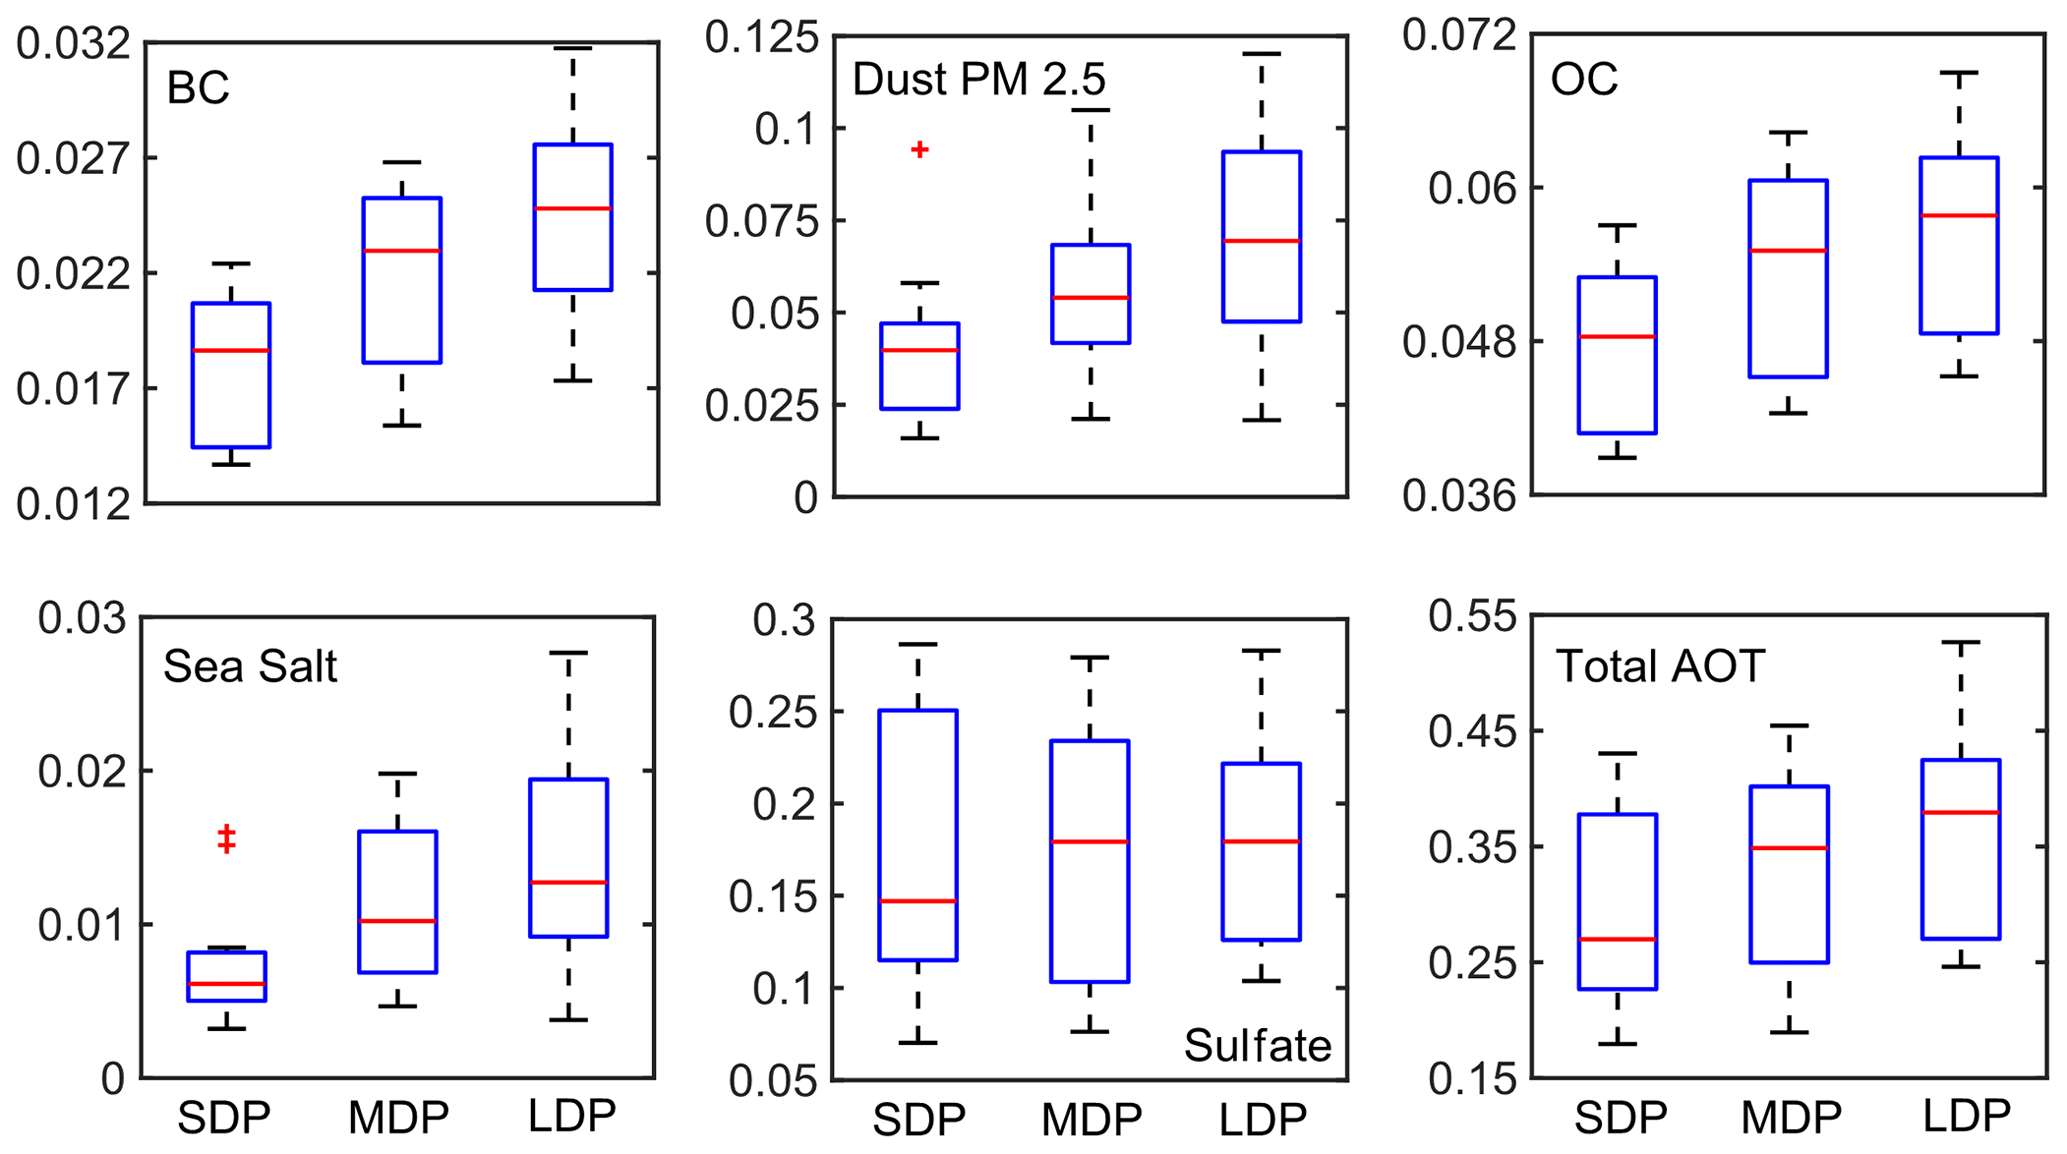
Figure 4Frequency distribution analysis results of various controlling factors behind DDF evolution for various types of dry phase lengths over Lucknow corresponding to five aerosol components such as BC, dust PM2.5, OC, sea salt and sulfates.
Figure S6 shows the distribution analysis of these components with PCA tests. The analysis reveals the presence of three strong principal components where pc1 is 60 % and pc2 is 30 %; hence pc3 is not considered further. When the variance scores for these parameters are plotted, then all factors show almost similar values of pc1 score, so pc2 becomes important. While judging the pc2 scores, we see that BC followed by OC have the best variability in this set, hence they may be considered for the dry day variation. To confirm this, multilinear regression is done on the components and the results yield values of 0.864, 0.218, 0.556, 0.0106 and 0.155 for BC, dust, OC, sea salt and sulfate (Table 3). According to previous results, the contribution of BC and OC is much higher than the others, with BC showing a higher correlation in all cases compared to OC, hence the dependence of dry days is found to be primarily associated with urbanization, more evidence of which will be produced in later sections. Dust follows this parameter but its dependence is comparatively much smaller than both BC and OC, which further supports these findings.
In the previous subsection, the effect of aerosols with BC in particular is found to be strongly associated with low rainfall occurrence. However, the effect of all meteorological parameters was not isolated in the previous analysis. Also a time series analysis showing the impact of present AOD on impending rainfall accumulation was not demonstrated earlier. Hence an attempt has been made over Lucknow as it is an urbanized location in region 1a. To isolate the effect of various meteorological parameters such as temperature, pressure, winds, moisture content and rainfall accumulation, these datasets have been collected and then plotted in Fig. S7 for 16–30 July of 1980–2015. The long-term mean and 2σ standard deviations are also shown to exclude years having abnormal weather conditions. The screening process revealed that three years (1980, 1987 and 2002) have exhibited meteorological variations beyond the general range, hence they are removed.
It is further required to see the effect of low rainfall periods and AOD on impending DDF for the next few days during these years. Hence a set of years having comparatively lower rainfall accumulation during 16–31 July were identified. A total of 16 years was recorded which had rainfall values between the 50th and 25th percentile of the population. It may be noted that certain years experienced rainfall below the 1st quartile and hence they were neglected to preserve the data uniformity. The average AOD values were accumulated for those years and interestingly two well separated clusters having a set of nonadjacent 8 years in each were observed: one with AOD below 0.3 and the other above 0.4. To study the effect of these two AOD clusters on rainfall, their corresponding DDF values are observed for the next 15 d (1–15 August). This time shift was employed in order to investigate the net effect of changing AOD on impending rainfall distributions. It was observed that DDF values are distinctly higher for high AOD compared to the lower AOD case. This supports the hypothesis that higher AOD necessarily leads to more DDF in the next few days.
In the previous section it was clarified that there is potential growth of aerosols in a particular region which takes part in certain complex atmospheric processes which sequentially leads to dry phase developments. However, this study also needs to be done for a larger region to test whether the same hypothesis is also valid over a widespread area. Hence, this test has now been done over region 1 and region 1a. In this case all similar steps are followed but now the AOD–DDF cluster relationship is shown side by side for regions 1, 1a and Lucknow together to understand whether localized urbanization inputs do really have any influence over DDF growth. The cluster analysis results from Fig. 5 shows almost similar clustering in DDF with respect to aerosols but the effect of AOD is seen to become more diffused as one shifts from a small urban region such as Lucknow (having more localized anthropogenic dominance) to region 1 (having lower urbanization density) and this is also well reflected from slightly higher DDF values over Lucknow.

Figure 5Sequential association between AOD cluster (16–30 July) and DDF (1–15 August) for regions 1, 1a and Lucknow.
3.6 Comparative analysis on the DDF trend of the last 60 years and cloud properties among regions 1, 1a and Lucknow
The preceding sections have given an idea of how urbanization is influencing the evolution of dry day occurrences. To understand quantitatively its climatic impact, the averaged DDF of the last 60 years are plotted for regions 1, 1a and Lucknow in order to examine the change in DDF patterns as one downscales from a broad synoptic scale (IGP) to a small localized urban location. Figure 6 reveals that region 1 has a weak but discernible increase from 9 to 13 d in last 60 years. When robust-fit analysis was performed, it was inferred that the net change in dry day frequencies over region 1 is ∼35 % with respect to the 60-year average. However, the existence of some periodicities in the data was observed while no evident extremes were observed in the time frame. The value of the slope is found to be lower (0.074), which leads to a poor r of 0.384. For region 1a, the total variability is from 5 to 18 d, so the slope is expected to improve a bit (with a robust-fit net trend of ∼44 % with respect to the average) while the periodicity seems to be apparently disturbed due to the presence of more data extremes. Finally, in the case of Lucknow, a huge change is observed from 9 to 17 d, which indicates a complete shift in rain climatology with trend values as high as 61 % with respect to the 60-year average during August when normally the maximum rainfall occurs over India. A huge number of outliers and extremes are seen, some of which are close to 30 d (indicating no rain over August at all). The periodicity also seems to be disturbed due to outliers resulting in a very sharp slope of 0.139 per year. Thus, the severity in drought climatology is well explained with respect to urbanization as already hypothesized earlier. But it may be noted that the increasing trends and correlations are mainly caused by more occurrence of high dry days in the present rather than a gradual rise in the mean values; additionally, there are also some periodicities in the signal which results in the correlation being less than 0.5.

Figure 6Statistical comparison of the climatology of all parameters during August for region 1, region 1a, Lucknow during various time spans (a) dry day frequency values between 1956–2015 and (b) Low cloud cover during 1980–2015.
It was reported earlier that an increase in anthropogenic aerosols may lead to more cloud condensation nuclei, thus causing a reduction in cloud particle radius which may result in a low occurrence of rain in spite of the increase in cloud cover. From the previous section it is clear that dry day frequency exhibits a definite increase in magnitude over region 1a and Lucknow. Since anthropogenic components have shown the highest possible dominance on dry day occurrences, an attempt is made to identify how cloud parameters like cloud cover have changed with time over regions 1, 1a and Lucknow having different urbanization growth and so on the anthropogenic components. In this study, the main emphasis is given to low cloud cover only since aerosols have a tendency to be limited to the lower atmosphere, especially in the monsoon season. Region 1, which is covering a broad area, does not show a prominent change in DDF and it is also observed that the change in cloud cover over region 1 (∼2 %) is very feeble. Interestingly, as the region of concern is downscaled to region 1a, followed by a further downscaling, the urbanization impact becomes prominent and that is also reflected in the observed low-cloud-cover value. A significant increase in cloud lifetime is observed which has resulted in this growth of the low-level clouds. The situation, however, becomes more prominently worse in the case of Lucknow, where the cloud cover increased consistently (∼18 %), reflecting the dominant yet localized impact of urbanization. As a consequence, the dry day frequency ascends at a rapid rate over Lucknow in spite of increasing cloud cover, which definitely needs to be studied in more detail in future approaches. To further support these results, a detailed analysis depicting the impact of urbanization on aerosol components (hence DDF) is shown in later sections.
The long-term trends of dry day occurrences have exhibited a prominent growth in dry days but the effect of these trends were found to be subdued to some extent by several periodicities over the last 60 years in both region 1 and 1a. To understand their role on a quantitative scale, periodicity analysis is done on the last 60 years using autocorrelation functions and the results are depicted in Fig. S8. The autocorrelation function (ACF) values show highest value of 1 for a time lag 0, hence it is removed. Also, there is no use in understanding periodicities greater than half of the period, hence the maximum period is fixed to 30 years. The 1σ bars are provided to understand which periodicity may be significant enough to impact the long-term trends. The figure shows that the ACFs are reducing with time for all regions just as expected. However, only two peaks are found considerable in the plot: the first one refers to the 4-year ENSO periodicity, which is expected to be stronger over larger spatial scales. On the other hand, the second peak corresponds to the year-to-year varying localized urbanization component (observed as a peak in 1-year duration). As a result, it is expected that the effect of this 1-year peak is found to be much lower than the ENSO peak in region 1, while it reverses for region 1a due to a more localized urbanization impact. Again, because of the same reason, the year-to-year variability (shown by periodicity 1) should also be far more dominant over Lucknow than in region 1 or 1a. As expected, the figure reveals that the effect of urbanization clearly overshadows the ENSO periodicity over Lucknow (due to more intense urbanization). The contributions of both 1- and 4-year periodicities are seen to be almost comparable in region 1a. But in region 1 the effect of ENSO periodicities is stronger than the 1-year peak. This clearly infers about the effect of urbanization, which suppresses the effect of ENSO periodicity and thereby results in the drastic increase in DDF over Lucknow.
3.7 Probable influence of natural and anthropogenic components on DDF for region 3
In most of the preceding sections, the variability in DDF has been studied over region 1 falling in the IGP. However, the northwestern part of the country also comes under a high drought severity zone as already discussed, hence this region is studied in detail. Figure 2 shows that the DDF trend is comparatively higher during the month of July, hence DDF during that month will be considered hereafter for further analysis over region 3. It may be noted that the change is not so much prominent here as in region 1 (with a cumulative average of ∼8 % rise) and also the yearly fluctuations are too large which has subdued the trends resulting in a feeble rise of 2 d in the last 60 years (23–25 d) over this region shown in Fig. 7. To start with the distribution analysis, three classes are made as SDP (14–20 dry days average 19) MDP (21–24 dry days average 22.6) and LDP (24.5–27.5 d with average 26 d) as depicted in Table 1. It may be noted that the values themselves have high magnitudes for all classes and the variability is also quite low (19–26 d) here compared to 9–22 in Lucknow; the observed variation also should not be prominent which is also evident from Fig. 7. Further, as this region generally experiences an arid climate, specific humidity can be an important factor here. Accordingly, a decreasing trend is seen as supported by the median and lower bounds. But there is more overlapping among the classes and the total variance of humidity at 850 hPa is only between 12–10, which may not be strong enough to modulate drought intensities all by itself. SSN shows no definite variation hence not considered further. Surface temperature and 850 hPa geopotential height seem to be unaffected by the DDF clusters, hence they are not found to be suitable for further consideration. VT shows a good growth but at the cost of widespread overlapping, hence it can be cross-examined in other analysis tests. Aerosols and ENSO seem to have a weak increasing trend in their medians, which again is diffused by more overlapping in these distributions. This weaker variability is in good agreement with the feeble trend in dry days, but simultaneously makes it difficult to determine the potential driving factor behind the increasing DDF in region 3.
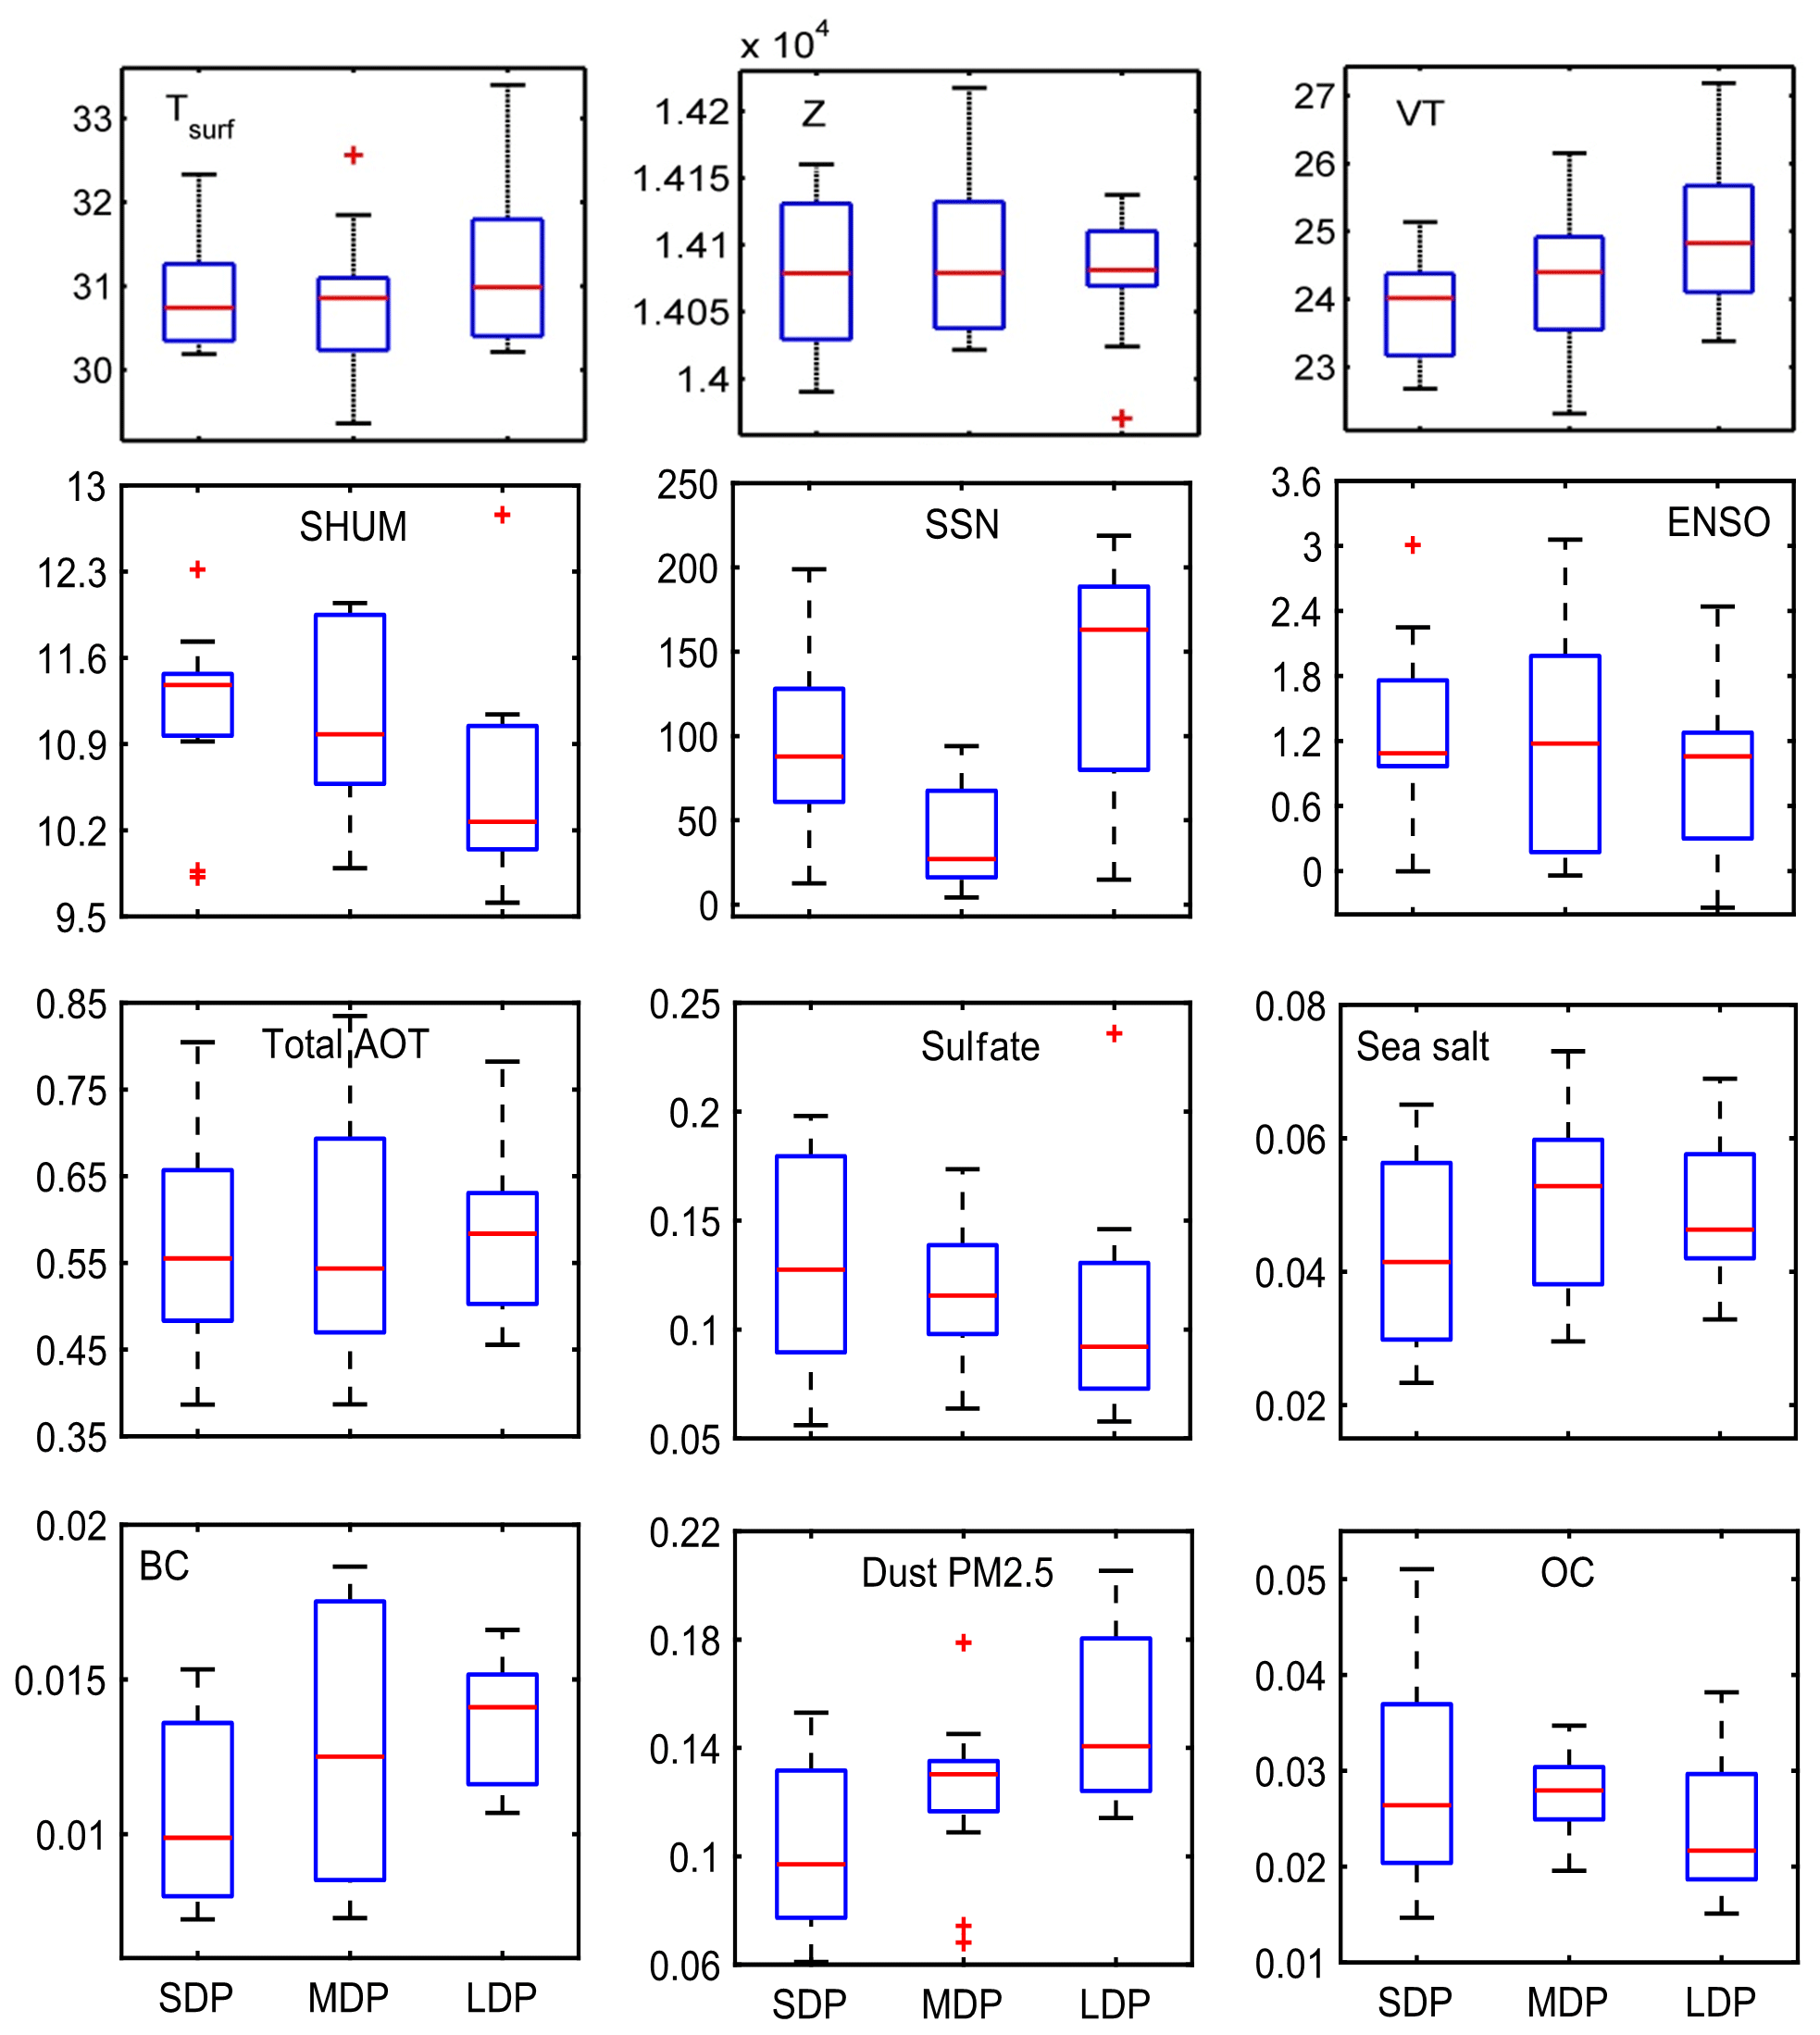
Figure 7Frequency distribution analysis results of various controlling factors behind DDF evolution for various types of dry phase lengths over region 3, namely surface temperature, geopotential, VT, humidity, SSN, ENSO, total aerosols, sulfates, sea salt, BC, dust PM2.5 and OC.
A better insight into the interdependence of all these components is investigated by the PCA test in Fig. S9a. The analysis reveals six PCA components out of which two principle components (PCs) are considered to explain the complete range of variances in dry days. The scores signify no definite pattern with the total aerosol AOT assuming high pc1 and low pc2, followed by surface temperature and ENSO having high contributions in only one of the two PCs. SHUM falls in a completely different quadrant while the other parameters also show an equally poor variance relationship and hence are neglected. Since aerosols have a higher pc1 component which is comparatively stronger than other PCs, it may be a deciding factor. To clarify this, MLR coefficients are calculated which are around 0.178, 0.101, 0.241, −0.162, 0.082, 0.130 and 0.074 for T2m, VT, Aerosol, SHUM, Z, SSN and ENSO, respectively (also shown in Table 2). It is clear from the MLR outputs that specific humidity has a strong negative influence on dry days so it will have a good effect on drought occurrences. But apart from this, surface temperature and aerosols have MLR coefficients and hence can be considered as important factors influencing DDF. Out of the two, aerosols are finally selected based on their dominant performances in all three tests. But as the MLR coefficient of aerosol is not very high, a detailed analysis on all its components needs to be done in later sections.
In view of the previous subsection, analysis is concentrated on the aerosols components over region 3. The distribution analysis of aerosol components is shown in Fig. 7, which depicts that, as usual, sea salt aerosols and sulfates have no role in modulating the DDF. It may be noted that here the magnitudes of sea salts and sulfates are higher than in region 1 or 1a, possibly due to its transport from the nearby seas which has not been washed away by rain in its path owing to the arid climate. However, they experience a very prominent overlapping between the components, which reduces the overall trend. The variation in OC is not clear and hence is removed. BC as usual has a deterministic variance with some overlapping, but still the whiskers and median values indicate its impact on dry days. Another important aspect here is that the range of values for these parameters is much lower here due to lower urbanization which still affects the DDF. But the contribution of dust aerosols emerges as the dominant component here as it not only shows higher values compared to all other regions but it also signifies a clear trend in the medians and distribution values. Thus it can be inferred that both dust and BC may contribute to this phenomenon.
To investigate which parameter has more dominance in dry day formation, PCA analysis is done on the individual components and the results are depicted in Fig. S9b. Here four principle component analyses (PCAs) are obtained, but the first two PCAs contribute 80 % of variability so the 2-D variance is seen. Also, the contribution of pc1 is comparable to pc2 so here both will be important. While analyzing the scores, it is observed that only dust and BC have both high pc1 and pc2, while most of the others have lower pc2 scores so they can be neglected. Further investigation is done on MLR analysis towards the trend contribution, which also gives similar outputs as 0.464, 0.431, 0.120, 0.182 and 0.033 for BC, dust, OC, sea salt and sulfate, respectively (Table 3). Again here both BC and dust emerge as potentially significant for the region 3 to be considered in association with the weak rise in dry days. Both of these components may have local sources but owing to their location there are possibilities of having an added amount of dust aerosol being transported from adjoining deserts, from dust storms, or from fumigation of dust from the ground during intense dryness, which are not found prominent over region 1a (where BC and OC were high due to high urbanization). Further, for more meticulous observation, cloud cover values have also been checked (Fig. 8) which show that the cloud cover has remained almost unchanged over the years unlike region 1a and Lucknow. This is again in good agreement with a less prominent increase in anthropogenic emissions or in short less of an increase in urbanization over region 3 compared to region 1a or Lucknow. This is further discussed in the following sections but a few things are important to mention here: the trend of dry days in region 3, though it is weaker compared to region 1a, may have a serious impact in the future as the region already experiences a high number of dry days itself, so a slight increasing trend is also alarming. Thus the effect of urbanization will still be an important parameter contributing towards the increase in BC and (some of) dust aerosol growth, and thereby leading to stronger trends in DDF over this region.
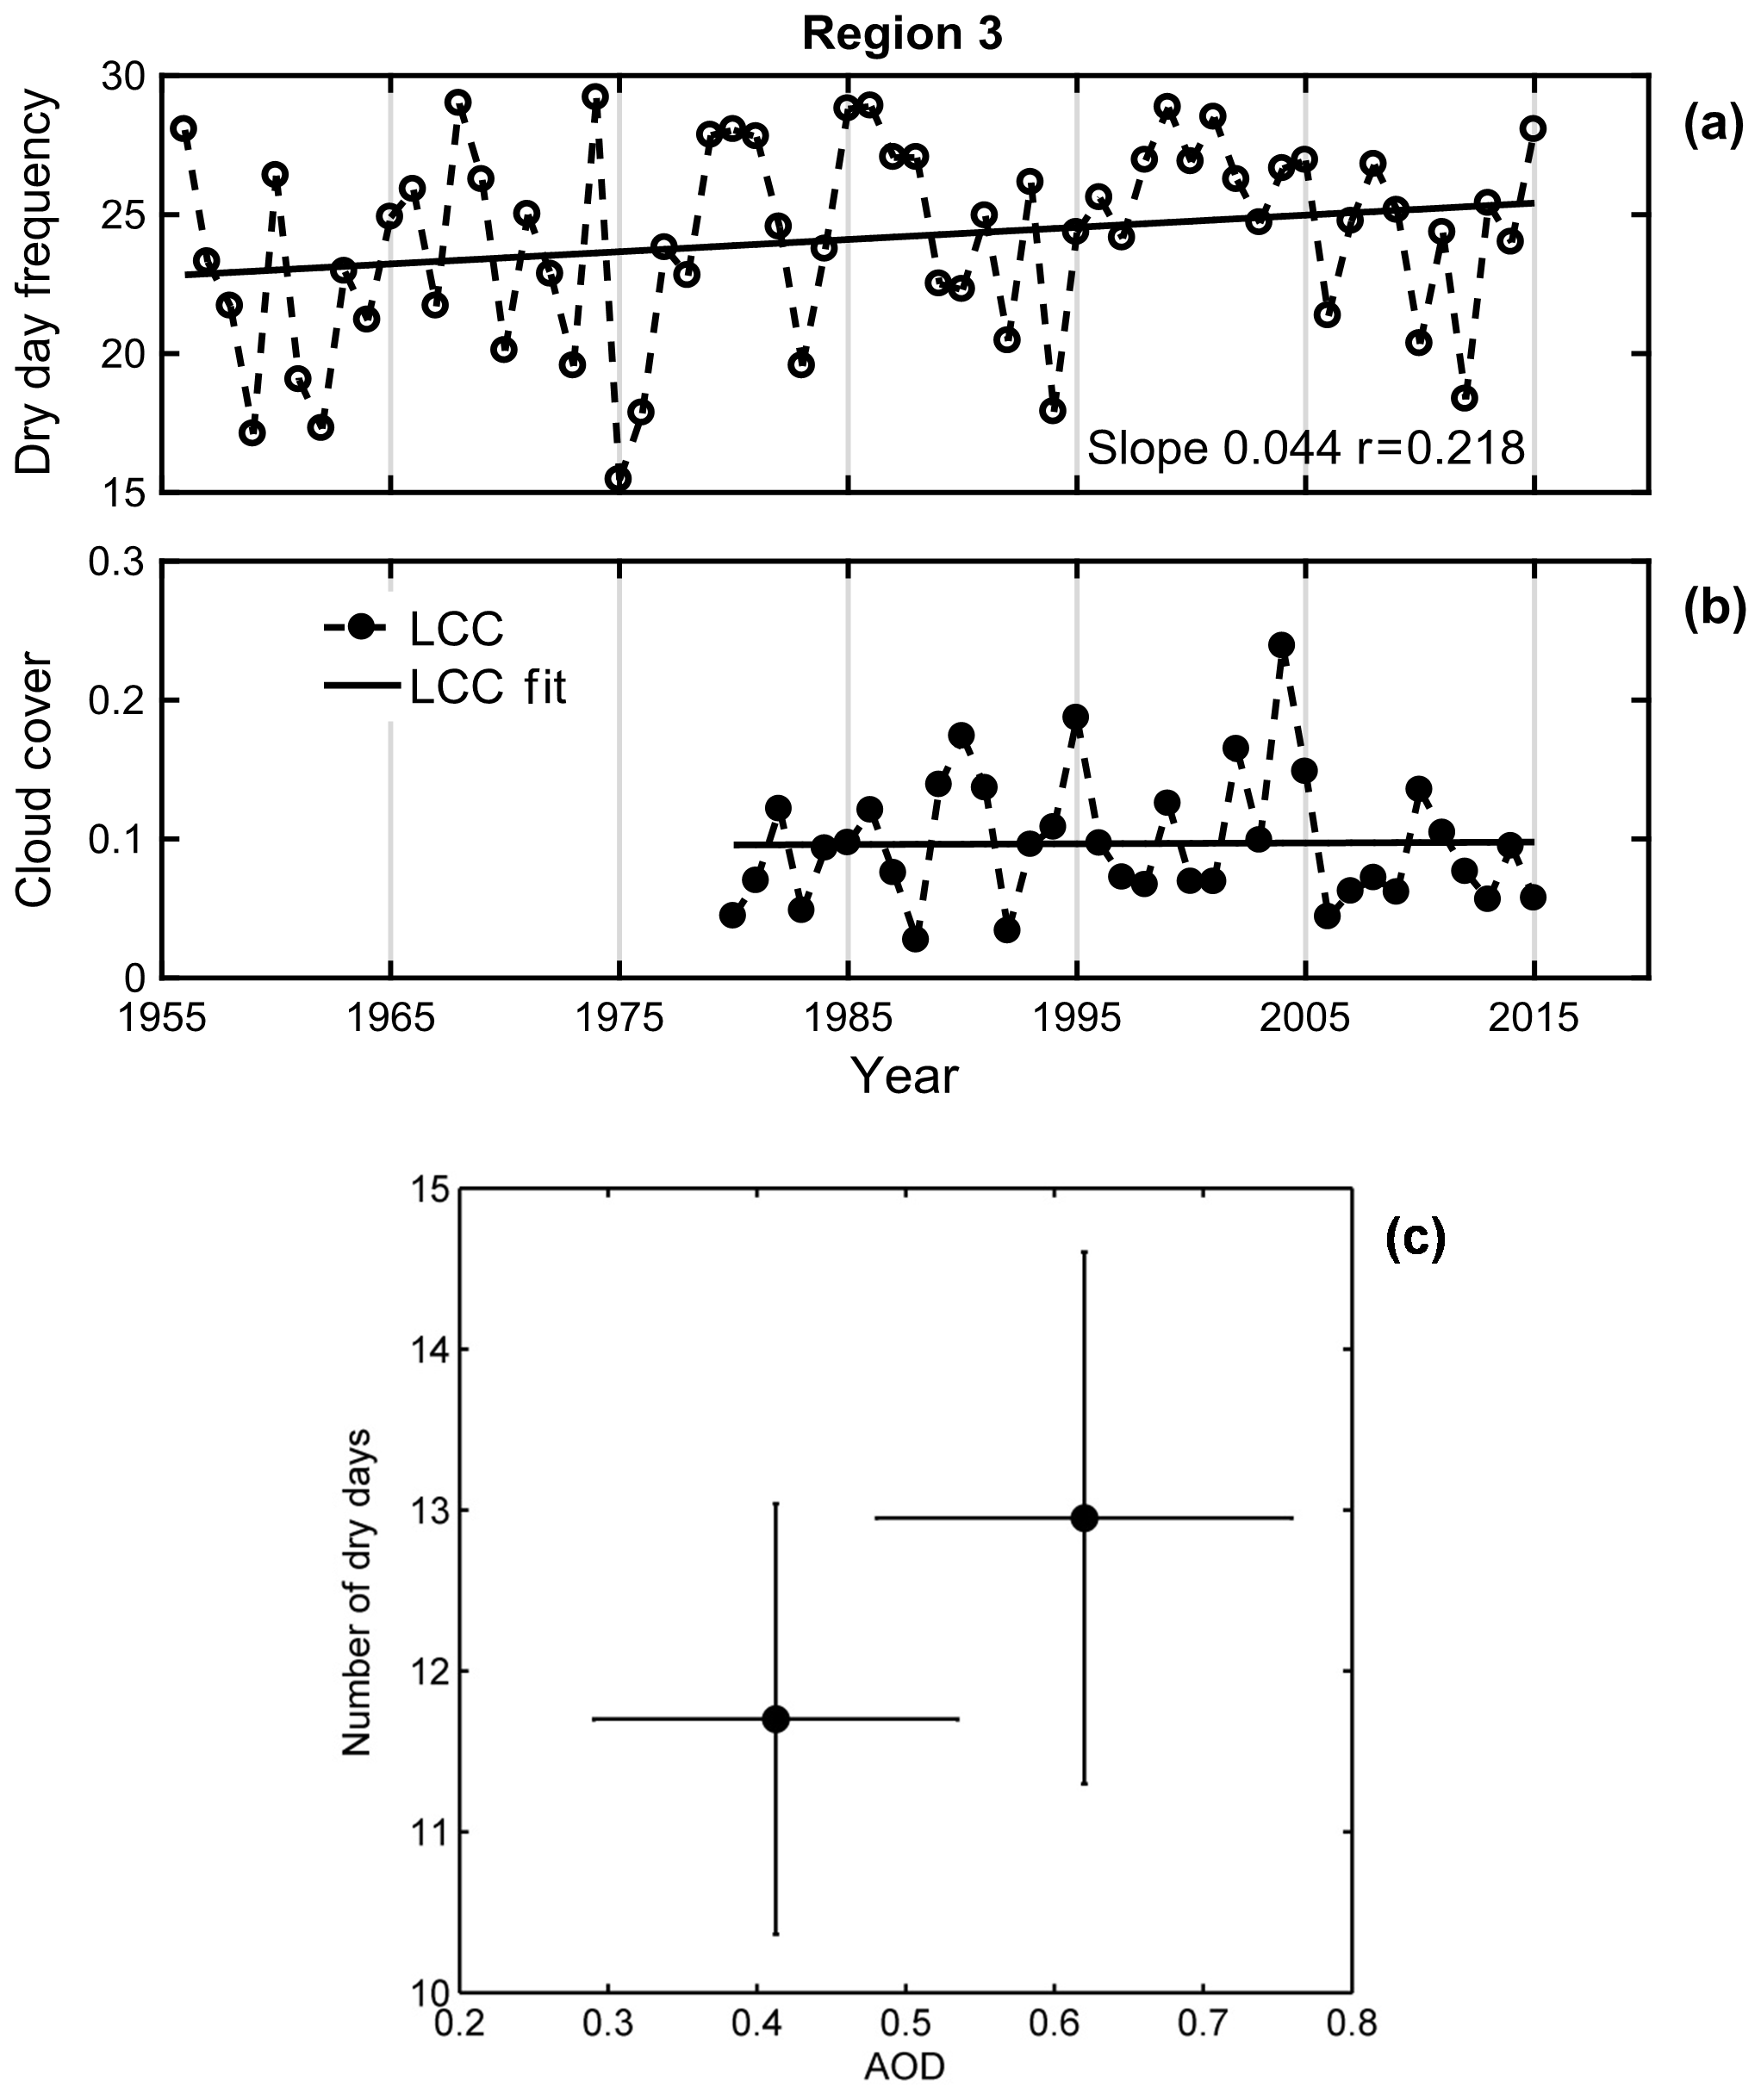
Figure 8Statistical comparison of the climatology of all parameters during July for region 3 during various time spans. (a) Dry day frequency values between 1956 and 2015 and (b) low cloud cover during 1980–2015. (c) Sequential association between aerosol growth (16–30 June) and DDF (1–15 July).
After the unclear dominance of dust followed by anthropogenic components was explained in the previous sections, now it is again necessary to check whether the aerosol growth in region 3 has really any sequential effect on the impending DDF growth, hence the same study is also repeated over region 3. The results from this analysis, shown in Fig. 8, indicate that the DDF values are much higher over this region due to the prevalence of a normal arid climate and not primarily due to aerosols, which is also understood from the widespread overlapping between the two clusters. Hence the definite relationship between aerosol growth and DDF cannot be firmly established and it may need more detailed analysis in future.
3.8 Impact of urbanization on DDF trends
From the previous section, a strong association has been observed between dry day frequency and anthropogenic emissions such as BC and OC, which in turn is closely related to the urbanization growth. On the other hand, high population density is also generally associated with the growth of urbanization and hence it may be taken as a suitable proxy for the latter in this study. The population density values were taken from the gridded 1∘ population densities during 2000–2015 (from SEDAC website) while the BC AOT extinction datasets are utilized from MERRA-2. The BC AOT values were averaged for the month of August over a moving window of 5 years for regions 1, 1a, Lucknow and region 3 to be synchronous with the population density measurements and their variations are shown in Fig. 8. The figure suggests that both population and BC AOT show a similar increasing trend and this supports the utility of using the population data for further analysis.
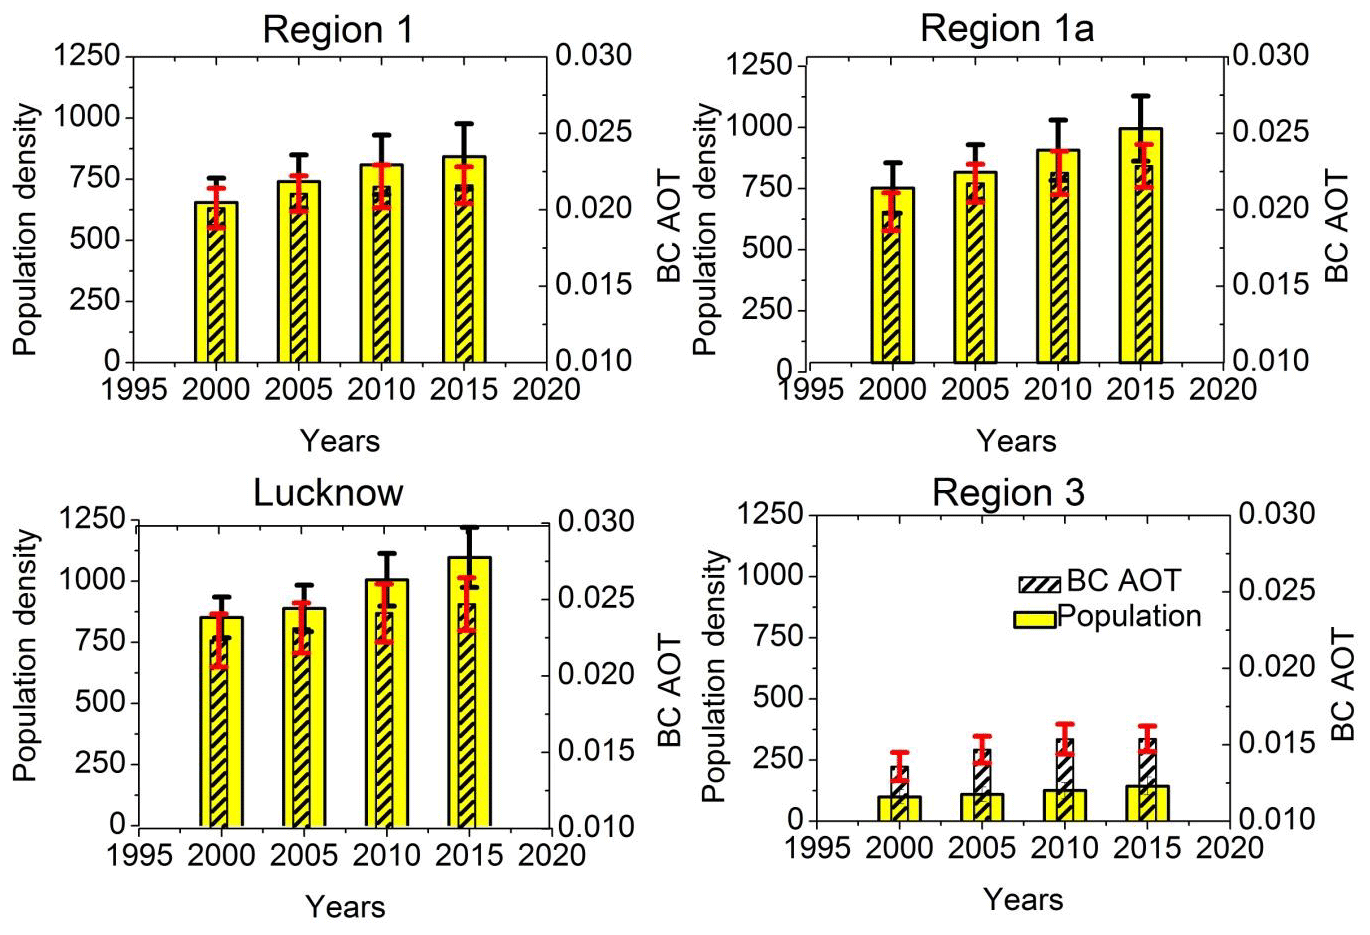
Figure 9Region-wise population densities and BC AOT values (during August) for regions 1, 1a, Lucknow and region 3 during (2000–2015); vertical bars represent the corresponding 1σ standard deviations values.
The primary distribution of population for the year 2000 is shown in Fig. S10, which depicts more values for region 1a compared to region 1b, and Lucknow is still found as a patch of very high population even during 2000. On the other hand, region 3 had much lower populations at the same time. Next, the long-term variation in population density is again observed over regions 1, 1a and Lucknow from Fig. 9. It may be noted from the figure that all throughout region 1 population density rises from 650 to 800 persons per square kilometer, which is quite a high value. Region 1a shows even higher values than region 1 with a steep rise from 760 to 1000 persons per square kilometer. Thus it follows that region 1a has consistently higher population average and trends leading to higher OC and BC. However, the situation worsens in Lucknow where population density changes drastically from 850 to 1100 persons per square kilometer with most of the change happening in the last 10 years, hence this phenomenon strongly supports the amplified DDF trend over Lucknow compared to 1a. But region 3 shows very little variations in last few years (100 to 140), which may have led to the comparatively lower BC and OC emissions. However, it may also be noted that the relative change over region 3 is higher (40 %) compared to Lucknow (30 %). Hence in future, if urbanization and population persist to grow at the same rate over region 3, then BC, OC and dust will also expectedly grow to alarming limits which can cause a drastic change in DDF over northwestern Indian regions.
3.9 Future trends of DDF over region 1 and 3 using the RCP 8.5 scenario
The next concern of this study is to investigate the projected change of dry phase lengths over the foreseeable future. Many attempts in recent years have employed CMIP5 general circulation model (GCM) simulations to provide future projections for any urbanization scenario. In accordance with the present study, RCP 8.5 projections of rainfall (and DDF) corresponding to maximum urbanization levels have been considered over the mentioned regions. It may be noted that in the last 60 years itself, DDF values have reached ∼30 d in August, hence it is useful to study DDF in a 2-month span of mid-July to mid-September (having a reasonable increasing trend in dry days). Future projections of DDF over this time span are obtained from 1950 to 2100. But the reliability and accuracy of these datasets first need to be validated from in situ measurements. Hence, historical daily precipitation datasets of “r1i1p1” realization from 11 well-known GCM simulations are taken during 1955–2005 for all grid points in regions 1 and 3 after which the DDF is calculated and recorded. Finally the averaged DDFs from each model were compared with the IMD data and the correlation coefficient with the normalized standard deviation values in Table S5 indicate that three models, namely CAN ESM2, CNRM CM5 and NorESM 1M, show better agreement, hence they can be utilized to generate future projections for regions 1 and 3 up to the year 2100. For simplicity, the yearly means of DDF historical data from the models are also shown in Fig. S11, which again are found to follow the expected trends of DDF in all three regions.
The total variation in dry days are investigated over regions 1 and 3 including both historical and CMIP5 RCP 8.5 projections data to get a 150-year trend of dry day frequencies in Fig. 10a. The DDF for all 29 grid points in region 1 and 20 grid points over region 3 are averaged yearly and then depicted in Figs. 5 and 7. The multimodel mean data show that even when averaged spatially, dry days show a clear increase from ∼8 d in 1950 to ∼40 d near 2100. Thus, region 1 will experience a rise in DDF from 10 % to 70 % during the mid-monsoon phase, which is highly alarming and is attributed to the rapid pace of urbanization over those regions in the future. Again, this trend looks less discretely increasing compared to the historical trends over Lucknow. Again, in certain cases the projected DDF is expected to increase up to ∼50 d (80 %) during the 2100 monsoon, which should lead to severe drought conditions. The trends look comparatively weaker in the first 50 years (8–12), then it gets stronger (12–24) and finally shoots up to very high values (24–42 d) after 2050, which is primarily caused by a high urbanization rate over this region in the future. However, when the same analysis was done for region 3, DDF was found to increase steadily from 20 to 40 d over 150 years. The trends of DDF are clearly much weaker in region 3 compared to region 1, while the standard error bars are also low here. Both of these factors can be attributed to the fact that region 3 has much lower urbanization components than region 1. It may be noted that if region 3 continues to face urbanization at the present rate, then in future it will experience a higher number of dry days. Additionally, it has been observed that the trends have increased almost steadily in region 3 with no abrupt change in DDF in the last 50 years like region 1. This is attributed to the low urbanization levels in region 3 at present.
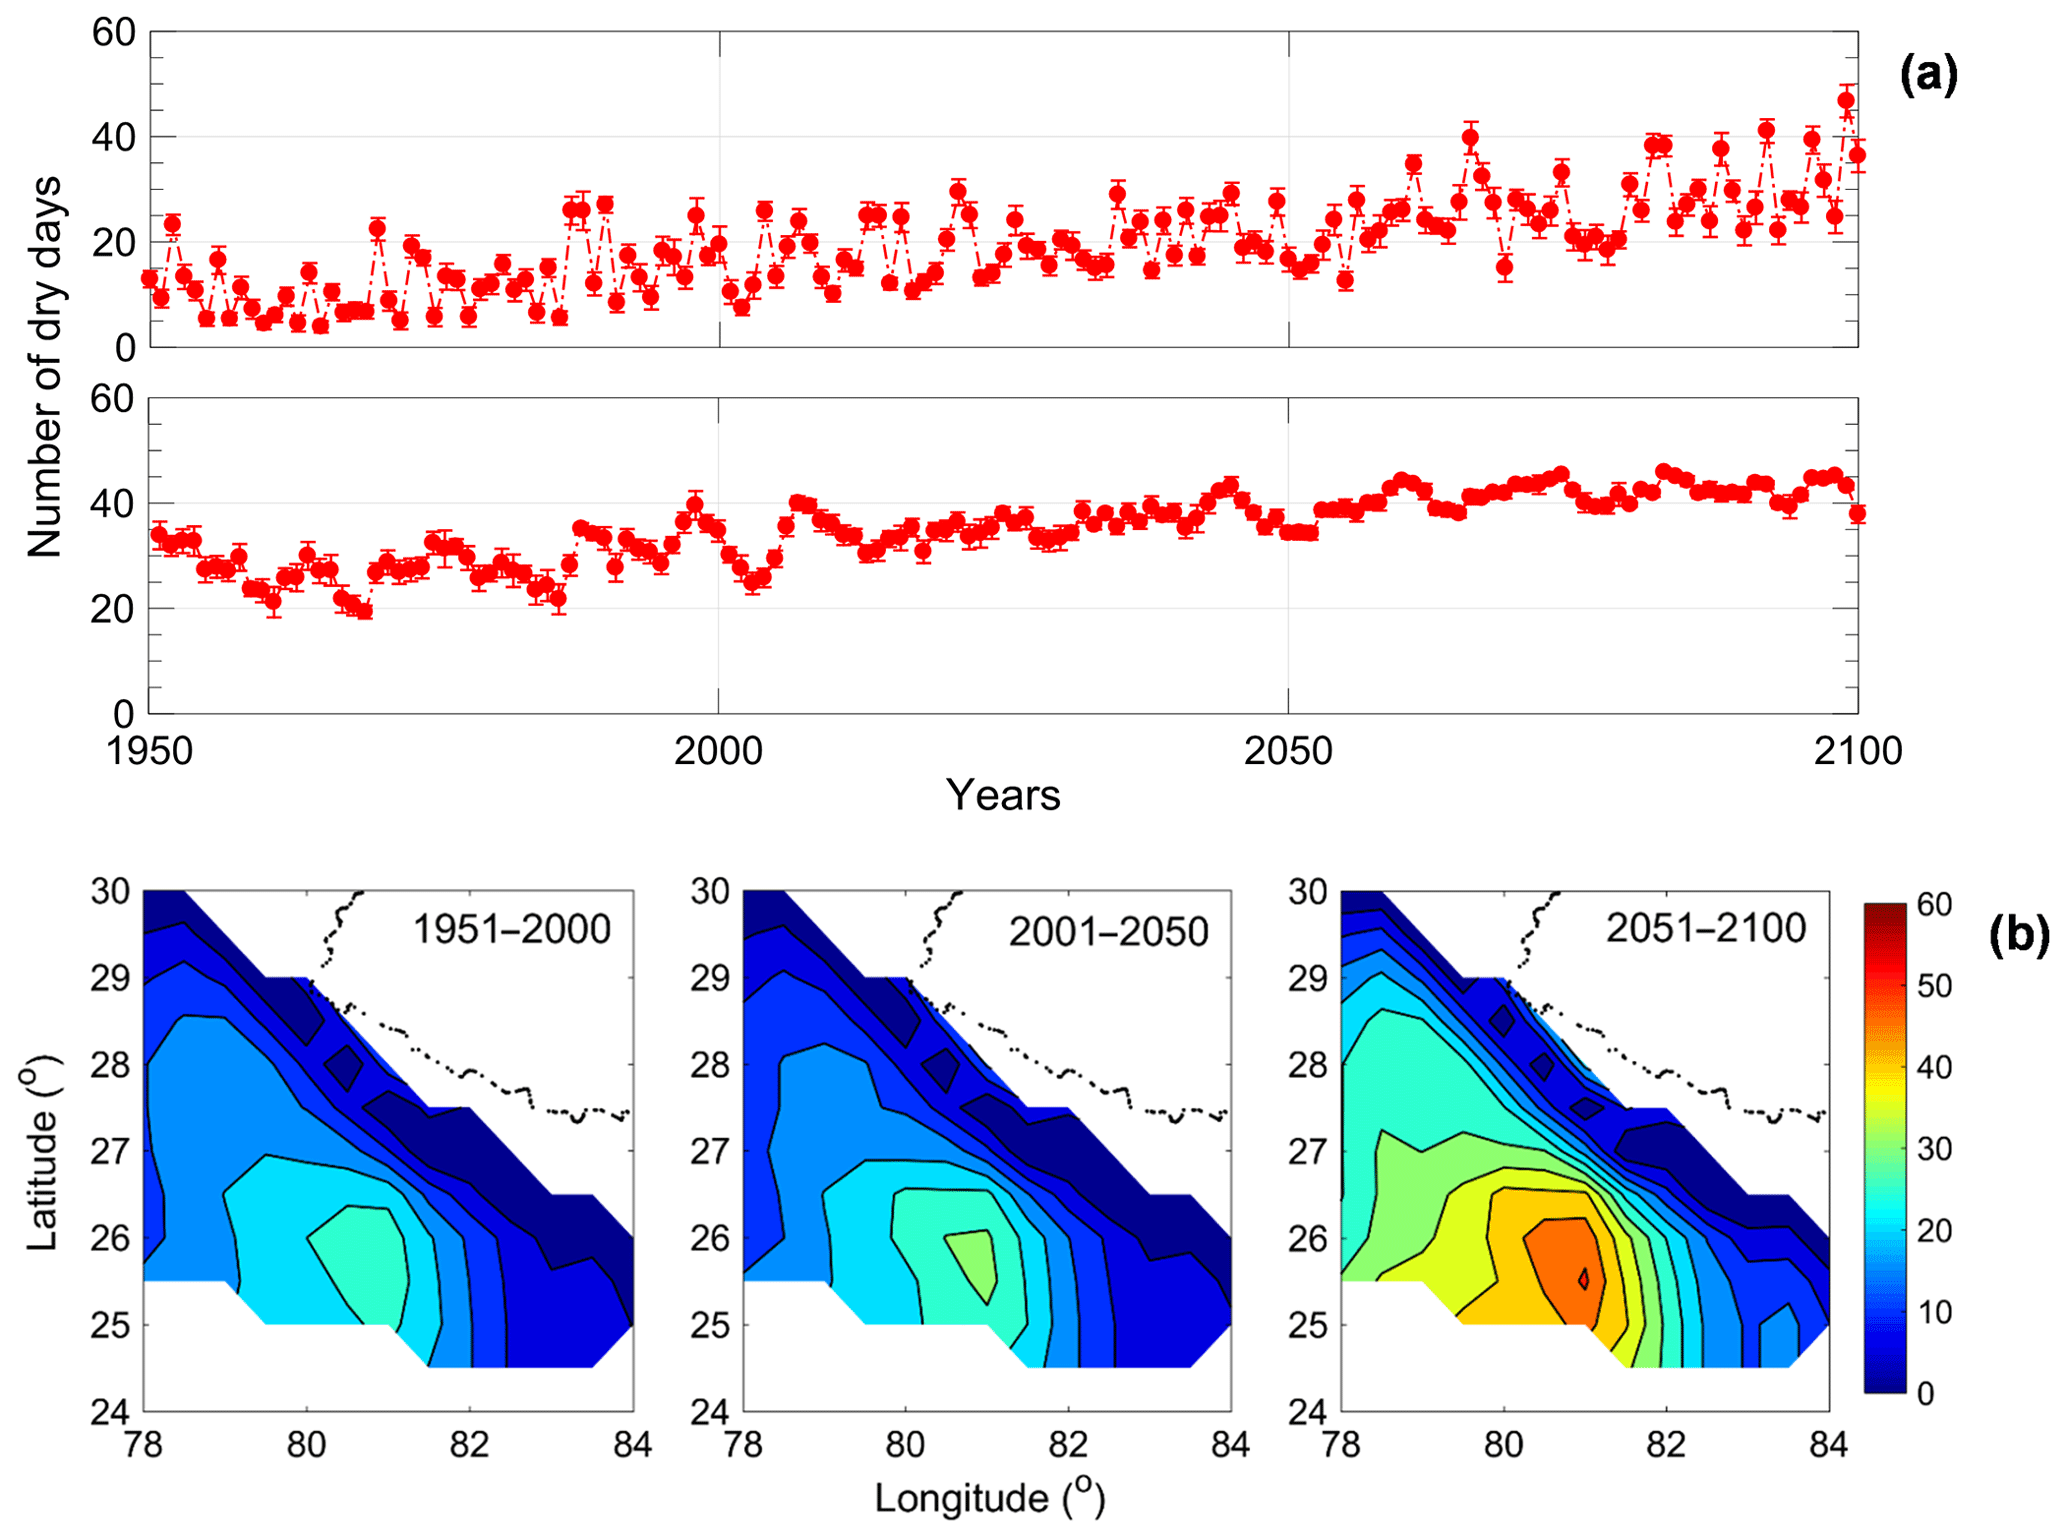
Figure 10(a) Climatic variations in dry day frequency over regions 1 and 3 containing both historical data (up to 2005) and RCP 8.5 projections (2006–2100) of multimodel mean from three selected GCMs (b) Projected lat–long maps of DDF for all three 50-year periods from 1951 to 2100.
Hence region 1 creates a more alarming situation with dry days increasing by around 5 times compared to the other regions. To further investigate this abrupt change spatially, the model averaged data of DDF for the 50-year span are shown for region 1 in Fig. 10b. As expected, the figure shows a high value around Lucknow for the 50-year periods but its effect diffuses as one goes towards the outskirts of Lucknow facing lesser urbanization. Places adjoining Lucknow show a very drastic change only after 2010. Thus, most of the places adjoining Lucknow show a very high number of dry days (> 45 d) near the end of this century, which will grossly affect the monsoonal rainfall leading to severe droughts and so it needs to be addressed by policymakers.
It is an essential aspect to study the probability of drought occurrences over India during monsoon as agricultural and economical issues are directly related to it. In the present study, a detailed analysis on the occurrence of dry days during monsoon over the Indian region is presented. In this study, three potentially drought-prone regions in India based on the dearth of precipitation and abundance of PET is considered. Region 1 mostly belongs to the State of Uttar Pradesh (UP), region 2 covers major parts of the states of Andhra Pradesh and Tamil Nadu and a small portion of Karnataka, and region 3 encompass the arid part of Rajasthan. Detailed investigations revealed that over the eastern part of region 1, which is referred to as region 1a, urbanization plays a significant role in increasing DDF. Prevailing impact of anthropogenic emission like BC or OC aerosols becomes more prominent as the study goes in depth with a downscaling approach from a broad region 1 to a specific urbanized location like Lucknow, which is one of the urbanized sectors of IGP. The increase in cloud cover and nonoccurrence of rain events indicate rain suppression phenomena over region 1, which is yet to be investigated in detail. This also indicates the scope of the study over several other point locations having drought occurrence record but could not be included in the present study. Finally, the long-term projections of DDF are drawn over regions 1a and 3 using the intense urbanization scenario of RCP 8.5 and an average of 70 % rise in dry days are seen, which may be a very crucial concern by the year 2100 and hence it needs to be considered by policymakers in future aspects. However, this study is mainly done from modeled components of aerosols, so a far more accurate analysis can later be done over the IGP subject to more availability of aerosol in situ data in the other major urban locations over India. The main findings of the study are shown in a schematic presentation in Fig. S12 and are highlighted as follows:
-
The DDF (based on the frequency of days having local precipitation accumulation less than 1 mm) has a significant level of correlation with the universally accepted monthly SPEI drought index (DI) especially in the last 60 years. Further, the correlation levels between DI and DDF are more prominent during August in region 1a and during July in region 3.
-
The trends of DDF (within a 15 d window) are more prominent during August for region 1a. However, region 3 shows a descent trend during July, while region 2 shows the same during late September (corresponding to the monsoon retreating phase), hence it has been neglected as it may not completely reflect a monsoonal drought.
-
Results from region 1a indicate prevailing contribution of aerosols compared to ENSO, humidity, surface meteorology, circulation instability or SSN. Our study shows that BC and OC aerosols over urbanized region are more active at increasing the DDF, which is also supported from distribution, PCA and MLR analyses.
-
The trend analysis on DDF reveals that the increasing trends become stronger as the spatial coverage is downscaled from region1 to 1a and followed by a local urbanized location of Lucknow. About 50 % increase in DDF is found in Lucknow compared to 17 % all through region 1. Further, a periodicity of 4 and 8 years is found to be stronger in region 1, which is overpowered by the randomly varying urbanization component over Lucknow.
-
The sequential association analysis between aerosols and DDF reveals that aerosol growth in the period of 16–30 July over region 1 has a direct impact on DDF developments during the next 15 d time span. However, the relationship is slightly more definite for localized urbanized areas like Lucknow, having a more anthropogenic aerosol dominance.
-
Population density maps have been taken as a proxy of the urbanization component owing to its significant agreement with anthropogenic carbonaceous emissions (BC). A higher population density is observed over Lucknow (average of 850 persons per square kilometer and trends of ∼35 %) compared to the rest of region 1 and 1a. Further, the population density values are very low in region 3 (100 persons per square kilometer), which is in good agreement with the lower impact of urbanization on DDF over this region.
-
In-depth investigation revealed that the increase in urbanization components like BC or OC exhibits a significant association with increased cloud lifetime (∼18 % rise in low cloud cover) over Lucknow, which results in a stronger gradient of dry day occurrences (from 9 d in 1956 to ∼17 d at present).
-
Though in region 3 aridity plays a major role to experience a high number of dry days (∼23), still dust aerosols show an increasing trend and hence it probably influences a further increase in DDF (an increase from 23 d in 1956 to 25 d at present), which is alarming for region 3.
-
The climatic projections of dry day frequency from CMIP5 simulations of three GCM models (CNRM CM5, CAN ESM and NorESM 1M) show a sharp increase in dry days during 15 July to 15 September with DDF reaching up to 50 dry days over region 1 and 45 dry days over region 3 by 2100.
Daily rainfall data used in the present study were obtained from the National Climate Centre, India Meteorological Department (http://www.imdpune.gov.in/ndc, last access: 16 August 2019). Aerosol components were utilized from the Modern-Era Retrospective analysis for Research and Applications version 2 provided by NASA (https://gmao.gsfc.nasa.gov/reanalysis/MERRA-2/, last access: 25 June 2019), while other related meteorological datasets have been taken from the ERA-Interim reanalysis (http://www.ecmwf.int/, last access: 10 August 2019).
The supplement related to this article is available online at: https://doi.org/10.5194/acp-19-12325-2019-supplement.
RC performed the main analysis in the study. BKG, ST, MVR and AM provided the initial concept, main guidance, needed data and also contributed to the analysis, discussion and editing.
The authors declare that they have no conflict of interest.
This article is part of the special issue “Interactions between aerosols and the South West Asian monsoon”. It is not associated with a conference.
One of the authors (Rohit Chakraborty) thanks the Science and Engineering Research Board, Department of Science and Technology, for providing fellowship under a National Post Doctoral Fellowship scheme (grant no. PDF/2016/001939). He also acknowledges the National Atmospheric Research Laboratory for providing necessary support and data for this work. The authors also thank Soumyajyoti Jana from Calcutta University for his suggestions.
This paper was edited by B. V. Krishna Murthy and reviewed by three anonymous referees.
Ackerman, A. S., Toon, O. B., Taylor, J. P., Johnson, D. W., Hobbs, P. V., and Ferek, R. J.: Effects of aerosols on cloud albedo: Evaluation of Twomey's parameterization of cloud susceptibility using measurements of ship tracks, J. Atmos. Sci., 57, 2684–2695, 2000.
Agnihotri, R., Dutta, K., Bhushan, R., and Somayajulu, B. L. K.: Evidence for solar forcing on the Indian monsoon during the last millennium, Earth Planet. Sc. Lett., 198, 521–527, 2002.
Alaka, T., Gaddam, G. and others: Monsoonal Droughts In India–A Recent Assessment, Pap. Glob. Chang. IGBP, 2015.
Beguería, S., Vicente-Serrano, S. M., and Angulo-Martínez, M.: A multiscalar global drought dataset: the SPEIbase: a new gridded product for the analysis of drought variability and impacts, B. Am. Meteorol. Soc., 91, 1351–1356, 2010.
Benton, G. S.: Drought in the United States analyzed by means of the theory of probability, United States Department of Agriculture, 1942.
Berrisford, P., Kållberg, P., Kobayashi, S., Dee, D., Uppala, S., Simmons, A. J., Poli, P., and Sato, H.: Atmospheric conservation properties in ERA‐Interim, Q. J. Roy. Meteorol. Soc., 137, 1381–1399, 2011.
Bhalme, H. N. and Mooley, D. A.: Large-scale droughts/floods and monsoon circulation, Mon. Weather Rev., 108, 1197–1211, 1980.
Buchard, V., Randles, C. A., Da Silva, A. M., Darmenov, A., Colarco, P. R., Govindaraju, R., Ferrare, R., Hair, J., Beyersdorf, A. J., Ziemba, L. D., and Yu, H.: The MERRA-2 aerosol reanalysis, 1980 onward, Part II: Evaluation and case studies, J. Climate, 30, 6851–6872, https://doi.org/10.1175/JCLI-D-16-0613.1, 2017.
Chakraborty, R., Talukdar, S., Saha, U., Jana, S., and Maitra, A.: Anomalies in relative humidity profile in boundary layer during convective rain, Atmos. Res., 191, 74–83, 2017.
Cliver, E. W., Clette, F., and Svalgaard, L.: Recalibrating the sunspot number (SSN): the SSN workshops, Cent. Eur. Astrophys. Bull., 37, 401–416, 2013.
Dai, A., Trenberth, K. E., and Qian, T.: A global dataset of Palmer Drought Severity Index for 1870–2002: Relationship with soil moisture and effects of surface warming, J. Hydrometeorol., 5, 1117–1130, 2004.
Dey, S., Tripathi, S. N., Singh, R. P., and Holben, B. N.: Influence of dust storms on the aerosol optical properties over the Indo-Gangetic basin, J. Geophys. Res.-Atmos., 109, D20211, https://doi.org/10.1029/2004JD004924, 2004.
For International Earth Science Information Network (CIESIN): Columbia University, C., Gridded Population of the World, Version 4 (GPWv4): Population Density, NASA Socioeconomic Data and Applications Center (SEDAC), 2016.
Francis, P. A. and Gadgil, S.: Towards understanding the unusual Indian monsoon in 2009, J. Earth Syst. Sci., 119, 397–415, 2010.
Gadgil, S., Vinayachandran, P. N., and Francis, P. A.: Droughts of the Indian summer monsoon: Role of clouds over the Indian Ocean, Curr. Sci., 85, 1713–1719, 2003.
Gore, P. G. and Sinha Ray, K. C.: Variability in drought incidence over districts of Maharashtra, Mausam, 53, 533–538, 2002.
Guhathakurta, P. and Rajeevan, M.: Trends in the rainfall pattern over India, Int. J. Climatol., 28, 1453–1469, 2008.
Heim Jr, R. R.: A review of twentieth-century drought indices used in the United States, B. Am. Meteorol. Soc., 83, 1149–1165, 2002.
Huang, B., Thorne, P. W., Banzon, V. F., Boyer, T., Chepurin, G., Lawrimore, J. H., Menne, M. J., Smith, T. M., Vose, R. S., and Zhang, H.-M.: Extended reconstructed sea surface temperature, version 5 (ERSSTv5): upgrades, validations, and intercomparisons, J. Climate., 30, 8179–8205, 2017.
Krishnamurti, T. N., Thomas, A., Simon, A., and Kumar, V.: Desert air incursions, an overlooked aspect, for the dry spells of the Indian summer monsoon, J. Atmos. Sci., 67, 3423–3441, 2010.
Kumar, K. N., Rajeevan, M., Pai, D. S., Srivastava, A. K., and Preethi, B.: On the observed variability of monsoon droughts over India, Weather Clim. Extrem., 1, 42–50, 2013.
Lau, K.-M. and Kim, K.-M.: Observational relationships between aerosol and Asian monsoon rainfall, and circulation, Geophys. Res. Lett., 33, 1–5, https://doi.org/10.1029/2006GL027546, 2006.
Lloyd-Hughes, B. and Saunders, M. A.: A drought climatology for Europe, Int. J. Climatol., 22, 1571–1592, 2002.
Marcovitch, S.: The measure of droughtiness, Mon. Weather Rev., 58, 113, https://doi.org/10.1175/1520-0493(1930)58<113:TMOD>2.0.CO;2, 1930.
McKee, T. B., Doesken, N. J., and Kleist, J.: The relationship of drought frequency and duration to time scales, in: Proceedings of the 8th Conference on Applied Climatology, 17, 179–183, 1993.
Moorthy, K. K., Babu, S. S., Satheesh, S. K., Srinivasan, J., and Dutt, C. B. S.: Dust absorption over the “Great Indian Desert” inferred using ground-based and satellite remote sensing, J. Geophys. Res.-Atmos., 112, D09206, https://doi.org/10.1029/2006JD007690, 2007.
Munger, T. T.: Graphic method of representing and comparing drought intensities, Mon. Weather Rev., 44, 642–643, 1916.
Pai, D. S., Sridhar, L., Guhathakurta, P., and Hatwar, H. R.: District-wide drought climatology of the southwest monsoon season over India based on standardized precipitation index (SPI), Nat. Hazards, 59, 1797–1813, 2011.
Palmer, W. C.: Meteorological drought. Research Paper No. 45. Washington, DC: US Department of Commerce, Weather Bur., 59, 1965.
Pandey, S. K., Vinoj, V., Landu, K., and Suresh Babu, S.: Declining pre-monsoon dust loading over South Asia: Signature of a changing regional climate, Sci. Rep., 7, 16062, https://doi.org/10.1038/s41598-017-16338-w, 2017.
Parthasarathy, B., Sontakke, N. A., Monot, A. A., and Kothawale, D. R.: Droughts/floods in the summer monsoon season over different meteorological subdivisions of India for the period 1871–1984, J. Climatol., 7, 57–70, 1987.
Raman, C. R. V and Rao, Y. P.: Blocking highs over Asia and monsoon droughts over India, Nature, 289, 271–273, 1981.
Randles, C. A., da Silva, A.M., Buchard, V., Colarco, P. R., Darmenov, A., Govindaraju, R., Smirnov, A., Holben, B., Ferrare, R., Hair, J., Shinozuka, Y., and Flynn, C. J.: The MERRA-2 Aerosol Reanalysis, 1980 Onward, Part I: System Description and Data Assimilation Evaluation, J. Climate, 30, 6823–6850, 2017.
Sato, Y., Goto, D., Michibata, T., Suzuki, K., Takemura, T., Tomita, H., and Nakajima, T.: Aerosol effects on cloud water amounts were successfully simulated by a global cloud-system resolving model, Nat. Commun., 9, 985, https://doi.org/Please provide date and location of meeting, if possible, 2018.
Singh, N. and Ranade, A.: The wet and dry spells across India during 1951–2007, J. Hydrometeorol., 11, 26–45, 2010.
Sivakumar, M., Stone, R., Sentelhas, P. C., Svoboda, M., Omondi, P., Sarkar, J., and Wardlow, B.: Agricultural drought indices: summary and recommendations, in: Agricultural drought indices Proceedings of an expert meeting, 2–4, 2011.
Solmon, F., Nair, V. S., and Mallet, M.: Increasing Arabian dust activity and the Indian summer monsoon, Atmos. Chem. Phys., 15, 8051–8064, https://doi.org/10.5194/acp-15-8051-2015, 2015.
Sushama, L., Said, S. B., Khaliq, M. N., Kumar, D. N., and Laprise, R.: Dry spell characteristics over India based on IMD and APHRODITE datasets, Clim. Dynam., 43, 3419–3437, 2014.
Talukdar, S., Jana, S., and Maitra, A.: Dominance of pollutant aerosols over an urban region and its impact on boundary layer temperature profile, J. Geophys. Res.-Atmos., 122, 1001–1014, 2017.
Thornthwaite, C. W.: An approach toward a rational classification of climate, Geogr. Rev., 38, 55–94, 1948.
Twomey, S.: The influence of pollution on the shortwave albedo of clouds, J. Atmos. Sci., 34, 1149–1152, 1977.
Tyalagadi, M. S., Gadgil, A., and Krishnakumar, G.: Monsoonal droughts in India – a recent assessment, De Gruyter Open, 22, 19–35, 2015.
Wencai, W., Sheng, L., Jin, H., and Han, Y.: Dust aerosol effects on cirrus and altocumulus clouds in Northwest China, J. Meteorol. Res., 29, 793–805, 2015.
Wilhite, D. A. and Glantz, M. H.: Understanding: the drought phenomenon: the role of definitions, Water Int., 10, 111–120, 1985.
World Meteorological Organisation: Drought and Agriculture, Technical Note No. 138, WMO No. 392, Geneva, Switzerland, 1975.