the Creative Commons Attribution 4.0 License.
the Creative Commons Attribution 4.0 License.
Significant reduction of PM2.5 in eastern China due to regional-scale emission control: evidence from SORPES in 2011–2018
Xin Huang
Xuguang Chi
Zheng Xu
Longfei Zheng
Zhengning Xu
Yuning Xie
Ximeng Qi
Yicheng Shen
Jiaping Wang
Lei Wang
Jianning Sun
Xiu-Qun Yang
Wei Qin
Xiangzhi Zhang
Wei Cheng
Weijing Liu
Liangbao Pan
Congbin Fu
Haze pollution caused by PM2.5 is the largest air quality concern in China in recent years. Long-term measurements of PM2.5 and the precursors and chemical speciation are crucially important for evaluating the efficiency of emission control, understanding formation and transport of PM2.5 associated with the change of meteorology, and accessing the impact of human activities on regional climate change. Here we reported long-term continuous measurements of PM2.5, chemical components, and their precursors at a regional background station, the Station for Observing Regional Processes of the Earth System (SORPES), in Nanjing, eastern China, since 2011. We found that PM2.5 at the station has experienced a substantial decrease (−9.1 % yr−1), accompanied by even a very significant reduction of SO2 (−16.7 % yr−1), since the national “Ten Measures of Air” took action in 2013. Control of open biomass burning and fossil-fuel combustion are the two dominant factors that influence the PM2.5 reduction in early summer and winter, respectively. In the cold season (November–January), the nitrate fraction was significantly increased, especially when air masses were transported from the north. More NH3 available from a substantial reduction of SO2 and increased oxidization capacity are the main factors for the enhanced nitrate formation. The changes of year-to-year meteorology have contributed to 24 % of the PM2.5 decrease since 2013. This study highlights several important implications on air pollution control policy in China.
- Article
(13193 KB) - Full-text XML
-
Supplement
(229 KB) - BibTeX
- EndNote
Fine particulate matter, with an aerodynamic diameter smaller than 2.5 µm (PM2.5), which impacts human health and visibility negatively (Cao et al., 2012; Zhang et al., 2017; Malm et al., 2004), has been considered to be one of the main air pollutants in China (He et al., 2001; Yao et al., 2002; Sun et al., 2006; Pathak et al., 2009; Zhang et al., 2015; Wang et al., 2017). To tackle this great challenge, China has been implementing the “Action Plan for Air Pollution Prevention and Control” (i.e., the so-called national “Ten Measures of air”) in several developed critical regions since 2013 (Sheehan et al., 2014; Wang et al., 2017; Liu et al., 2018, 2019; Zheng et al., 2018). Measurement data, mainly from the ambient air quality monitoring network, showed some evidence of improved haze pollution in many cities in recent years (Wang et al., 2017; Lang et al., 2017; Zhang et al., 2019). However, to give a robust and quantitative assessment of the change due to specific emission reduction, high-quality long-term continuous measurements of PM2.5 and its chemical composition and precursors together with comprehensive data analysis and model simulations are needed because PM2.5 has complex chemical compositions, sources and formation mechanisms (Pathak et al., 2009; G. Wang et al., 2016; Cheng et al., 2016; Wen et al., 2018), and a strong dependence on year-to-year meteorology (Zheng et al., 2015; Zhang et al., 2016, 2019).
The Yangtze River Delta (YRD) is one of the developed and highly populated regions in China (Ding et al., 2013a; H. L. Wang et al., 2016). Under unfavorable meteorological conditions, PM2.5 in this region could reach very high concentrations in winter and early summer, contributed mainly by fossil-fuel combustion and agricultural straw burning, respectively (Ding et al., 2013a, b; Cheng et al., 2014; Huang et al., 2016; Ding et al., 2016a; H. L. Wang et al., 2016; J. Wang et al., 2018). Some recent studies reported the change of PM2.5 and its chemical components in some YRD cities in a short period, e.g., 2–3 years (H. L. Wang et al., 2016; Wang et al., 2017; Sun et al., 2018); however, so far there has been a lack of long-term observational study with comprehensive measurements that cover the entire national “Ten Measures” period, i.e., 2013–2017, in this region.
In this study, we report the long-term continuous ground-based measurements of PM2.5 and its chemical compositions as well as main precursors at the Station for Observing Regional Processes of the Earth System (SORPES) in Nanjing, in the western YRD, for the period 2011–2018. Based on Lagrangian dispersion modeling and comprehensive analysis with other supporting data, we investigate the impacts of emissions from fossil-fuel combustion and open biomass burning (BB) and of year-to-year meteorology on the trend of primary and secondary PM2.5 in this region.
2.1 Brief introduction to SORPES and instrumentations
SORPES (32∘07′14′′ N, 118∘57′10′′ E; 62 m a.s.l.) is a cross-disciplinary research and experiment platform that was established in 2011 to understand the impact of human activities in the rapidly urbanized and industrialized eastern China region (Ding et al., 2013a, 2016b). Because of the unique geographical location, i.e., downwind of the North China Plain (NCP) and the YRD city cluster but upwind of downtown Nanjing (with a distance of about 20 km), this site can be considered to be a regional background station for air quality studies in eastern China (Ding et al., 2016b). Regional anthropogenic plumes from the NCP to YRD city clusters and the early summer open BB smoke in eastern China (Fig. 1) can influence this site under complex multi-scale transport associated with the Asian monsoon (Ding et al., 2013a, 2016b).
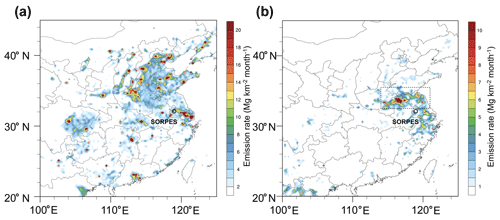
Figure 1Spatial distributions of (a) anthropogenic emission of primary PM2.5 in 2010 (data from the MIX inventory available in MEIC database of Tsinghua University) and (b) averaged carbon emission from open biomass burning in May–June during 2012–2017 (data from GFEDv4 available at https://daac.ornl.gov/cgi-bin/dsviewer.pl?ds_id=1293).
Continuous measurement of PM2.5 mass concentration and its precursors, e.g., sulfur dioxide (SO2), nitrogen oxides (NOx; nitric oxide (NO) + nitrogen dioxide (NO2)), etc., started in August 2011. More species, such as PM2.5 chemical compositions, including black carbon (BC) and water-soluble ions (e.g., sulfate (), nitrate (), ammonium (), potassium (K+), calcium (Ca2+), etc.), have been measured since 2013 (Xie et al., 2015; Sun et al., 2018; J. Wang et al., 2018; Shen et al., 2018). Details of the data used in this study, including instrumentation, the measurement period, and data coverage, are given in Table S1 in the Supplement. Briefly, instruments and analyzers for chemical compositions measurement are housed in a two-floor building on the top of a small hill at about 42 m a.g.l. PM2.5 mass concentration is measured by the online analyzer based on the light scattering and beta-ray absorption method (Thermo Fisher Scientific, Model 5030 SHARP, USA). The water-soluble inorganic ions, including , , , K+, etc., are detected by the Monitor for AeRosols and GAses in Ambient air (MARGA; Metrohm, Switzerland; Xie et al., 2015; Sun et al., 2018). BC was measured using a seven-wavelength aethalometer (AE-31, Magee Scientific), and the data at a wavelength of 880 nm were used in this study (Shen et al., 2018; Virkkula et al., 2015). SO2 and NOx are measured by the online analyzers with a time resolution of 1–5 min (Thermo Fisher Scientific, 43i and 42i). All the instruments are routinely calibrated for different durations. During the continuous measurement period, most of the instruments have data coverage of over 80 % (Table S1).
2.2 Lagrangian dispersion modeling and other data sources
In order to help quantitatively understand the influence of the year-to-year change in meteorology on air pollutant transport and dispersion, we conducted backward Lagrangian particle dispersion modeling (LPDM) using the HYbrid Single-Particle Lagrangian Integrated Trajectory (HYSPLIT) model (Stein et al., 2015). We used the model to calculate single-particle backward trajectories and to conduct cluster analysis. We also estimated the hourly PM2.5 concentration based on the particle dispersion simulations following a method developed by Ding et al. (2013a, c). Briefly, for each hour during the study period, the model was run backwardly for 2 d and 7 d, with 3000 particles being released every hour at the altitude of 100 m over SORPES. The model calculated the position of particles by mean wind and a turbulence transport component, and the spatiotemporal distribution of these particles was further used to calculate the potential source contribution by using the footprint “retroplume”, i.e., the residence time at the altitude of 100 m a.g.l. and an emission inventory (Ding et al., 2013a, c). Global Data Assimilation System (GDAS) data were used to drive the model, and the MIX emission inventory database for the year 2010 (Fig. 1a; M. Li et al., 2017) was used for a quantitative estimation of PM2.5 concentration.
Besides the observations at SORPES and data used in the LPDM simulations, various data are used to support the data analysis and discussions. To identify the impact of agricultural straw burning, we used the BB emission inventory from the Global Fire Emissions Database, Version 4.1 (with small fires; GFED4s; Giglio et al., 2013), and the MODIS (Moderate Resolution Imaging Spectroradiometer) Thermal Anomalies/Fire Daily L3 Global product (MOD/MYD14A1; Boschetti et al., 2009). The ERA5 reanalysis data (https://cds.climate.copernicus.eu/cdsapp#!/home, last access: 1 February 2019) from the European Centre for Medium-Range Weather Forecasts (ECMWF) and the Tropical Rainfall Measuring Mission (TRMM) satellite-observed precipitation (Huffman et al., 2007) are also used to investigate the year-to-year difference of meteorology that may influence the PM2.5 concentration.
Based on continuous measurement at SORPES, Fig. 2 shows the trends of PM2.5 mass concentration and key precursors (SO2 and NOx (NO+NO2)) since 2011 and the main PM2.5 chemical components (BC, , , and ) since 2013. Considering the difference in the observation duration and the specific emission control in eastern China associated with the national “Ten Measures of Air” since 2013 (Sheehan et al., 2014; Wang et al., 2017; Liu et al., 2018), we conducted linear regression for the two periods: August 2011–July 2018 and August 2013–July 2018. It can be found that PM2.5 concentration and the mixing ratio of two precursors have shown an overall decreasing trend during the past 7 years (−6.4, 1, −4.6, and −11.1 % yr−1 for PM2.5, SO2, NO2, and NO, respectively) but more remarkable decreasing trends (−9.1, −16.7, −5.2, and −14.1 % yr−1 for PM2.5, SO2, NO2, and NO, respectively) since 2013. For SO2, the 5-year reduction almost reached 70 %–80 % and showed a significantly higher reduction rate in comparison with NOx. It demonstrates that the YRD region, as one of the main industry bases with a huge consumption of coal, achieved a very big success of air pollution prevention from desulfurization in power plants and factories and from the replacement of coal with natural gases and electricity in recent years. In fact, a nationwide significant reduction of SO2 in the past few years has been also reported by ground and satellite measurements and emission estimations (C. Li et al., 2017; Liu et al., 2018; Zheng et al., 2018).
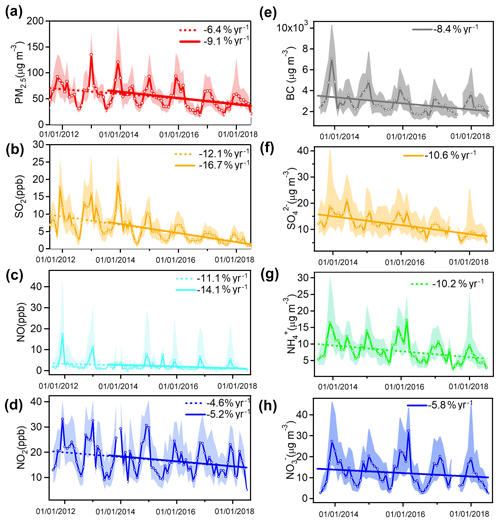
Figure 2Monthly statistics and trends for (a) PM2.5, (b) SO2, (c) NO, (d) NO2, (e) BC, (f) , (g) , and (h) observed at SORPES. Note: for BC, , , and , only data during August 2013–July 2018 are shown here. The solid lines marked with open circles represent the monthly medium value, and shaded areas mark the data from 25th to 75th percentiles. Dashed and solid lines show the linear regression fitting for data during 2011–2018 and 2013–2018, respectively.
Figure 2d shows that NO2, another precursor of nitrate, has shown a decreasing trend (−5.2 % yr−1) since 2013, which is much smaller than that of SO2. Accordingly, the two secondary inorganic water-soluble ions, and , showed different trends, with the former showing a more significant reduction (−10.6 % yr−1 vs. −5.8 % yr−1). BC, an important particle mainly from primary emission of incomplete combustion but with a significant impact on climate and aerosol–boundary-layer feedback (Bond et al., 2013; Ding et al., 2016a; Z. Wang et al., 2018; Huang et al., 2018), showed a decreasing trend (about −8.4 % yr−1) between the trends of sulfate and nitrate. Although BC is a short-lived climate forcer contributing to global warming (Bond et al., 2013; IPCC, 2013; Ding et al., 2016a), so far there has been no specific reduction-policy focus on it. Here the results show that the efforts in reducing PM2.5 also caused BC reduction, which co-benefited the mitigation of global warming (Bond et al., 2013; IPCC, 2013).
In eastern China, agricultural straw burning is particularly strong in early summer, i.e., from the middle of May to the middle of June, after the harvest of wheat (Ding et al., 2013a, b; Cheng, 2013; Huang et al., 2016; Chen et al., 2017). Intensive emission from these activities could cause a second maximum of PM2.5 in early summer (Ding et al., 2013a) and also severe haze events with high concentrations of PM2.5 and other pollutants. For example, SORPES recorded an hourly concentration of PM2.5 of over 400 µg m−3 on 10 June 2012 (Ding et al., 2013a; Xie et al., 2015; Nie et al., 2015). To examine the change before and after the “Ten Measures” took action, Fig. 3a presents the seasonal variation in PM2.5 mass concentration averaged for the periods of 2011–2014 and 2015–2018. It clearly shows that the secondary maximum of PM2.5 mass concentration in early summer was missing in recent years, instead of having a relatively flat change (Fig. 3a).
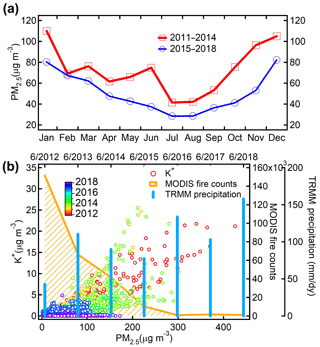
Figure 3(a) Seasonal variation in PM2.5 mass concentration measured at SORPES during 2011–2014 and 2015–2018. (b) Scatter plots of K+ as a function of PM2.5 concentration measured at SORPES and the sum of MODIS fire counts and of TRMM precipitation in the BB domain (square in Fig. 1b) during 15 May–20 June, 2012–2018.
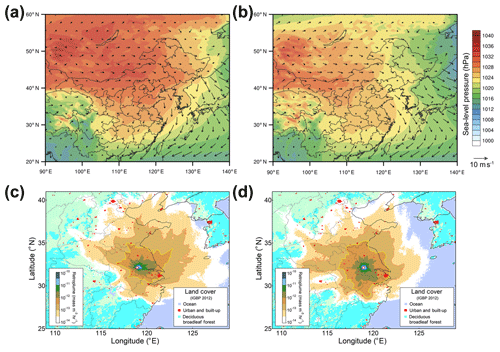
Since the “Ten Measures” took action in 2013, the Chinese government has conducted very strict emission control of agricultural straw burning by using a real-time satellite as a tool to monitor these activities (Chen et al., 2017; Wang et al., 2017). The MODIS satellite fire count data have demonstrated the significant reduction in BB activities in this region since 2013 (Fig. 3b). To further investigate the potential impacts of other factors, i.e., the change of air pollutant transport associated with circulation patterns, we conducted LPDM simulations for the BB seasons (15 May–20 June) during the two 3-year periods. Figure 4 shows that the averaged transport pathways of air masses did not change much for the two periods, but the MODIS satellite fire counts showed a distinct difference in both total amount and spatial distribution. This BB-emitted smoke could be transported to SORPES in 2 d when the north wind prevailed.
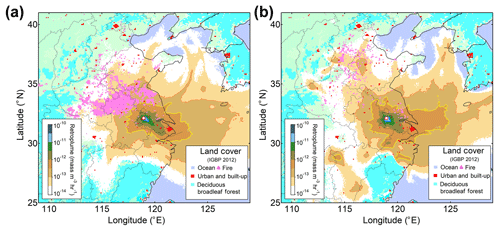
Figure 4Averaged retroplume from 2 d backward Lagrangian dispersion modeling and MODIS fire counts for the period of 15 May–20 June during (a) 2012–2014 and (b) 2016–2018.
Figure 3b also shows the averaged TRMM precipitation in the same area as the fire count data (i.e., dashed square in Fig. 1b) during 15 May–20 June in 2011–2018. It is indicative of a certain reverse correlation of precipitation with the total amount fire counts. However, the relationship between precipitation and BB is complicated. On one hand, the harvest season is generally before the meiyu season in this region (Kitoh and Takao, 2006). Farmers usually choose continuous sunny days to harvest and to dry the wheat, while the straw also burns easily in dry conditions (Feng et al., 2019). On the other hand, precipitation can influence the wet deposition of smoke (Uematsu et al., 2010). Meanwhile, BB smoke has been demonstrated to modify rainfall. For example, Ding et al. (2013b) and Huang et al. (2016) reported a case of suppressed rainfall and a changed rainfall pattern by BB smoke in this region based on the SORPES observations and numerical modeling. Although more quantitative studies are still needed, here the year-to-year variation in precipitation should not be the dominant factor influencing the substantial decreasing the PM2.5, especially for the period between 2013 and 2018, when the precipitation did not show a significant trend.
To confirm the impact of BB on the PM2.5 reduction, we further investigate the measured BB tracer, fine particulate K+, as previous studies (Ding et al., 2013b; Xie et al., 2015; Nie et al., 2015; Zhou et al., 2017) suggested that it is a good tracer for agricultural straw burning in this region. The scatter plot of K+ as a function of PM2.5 mass concentration, color-coded with time and given in Fig. 3b, clearly shows a dramatic decrease in the proportion at SORPES, especially after 2015. Using the concentration of K+ as a threshold, we identified BB (K+ higher than the 75 % percentile) and non_BB cases (K+ lower than 25 % percentile) and showed the scatter plots of sulfate and nitrate as a function of PM2.5 in Fig. 5. It confirms that very efficient control of open BB emission is the dominant factor that influenced the early summer PM2.5 reduction in this region.
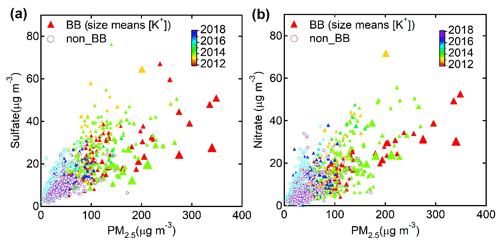
Figure 5Scatter plots of (a) sulfate and (b) nitrate as a function of PM2.5 for biomass burning (with K+ higher than 75 % percentile) and non-biomass burning (with K+ lower than 25 % percentile) cases for the period of 15 May–20 June during 2012–2018.
Besides the early summer, months in the cold season, e.g., November, December, and January (NDJ), experienced strong PM2.5 reduction in the past few years (Fig. 3a). In order to further explore the inter-relationship among precursors and secondary and primary particles, we show the scatter plots of different species color-coded with time in Fig. 6. For the SO2–NOx plot, it changed from a bifurcation pattern in the earlier years to the latest linear one, which is monotonous (Fig. 6a). The bifurcated pattern of SO2 versus NOx indicates the impact of emissions from elevated coal-burning point sources (with high SO2∕NOx ratio) and scattered vehicle sources (Wang et al., 2002). The pattern change in recent years further confirms that the reduction of SO2 was mainly due to efficient control and coal replacement with natural gas or electricity from large elevated coal-burning sources, such as power plants (Wang et al., 2002; Liu et al., 2018).
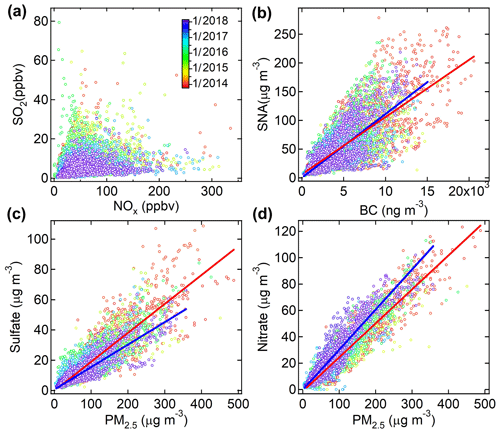
Figure 6Scatter plots of (a) SO2 versus NOx, (b) SNA (i.e., the sum of sulfate, nitrate, and ammonium) versus BC, (c) versus PM2.5, and (d) versus PM2.5 in November, December, and January during 2013–2018.
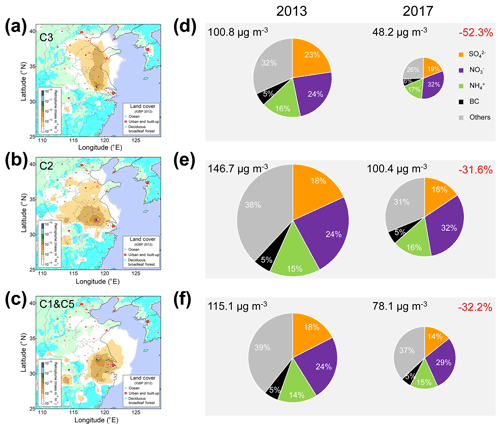
Figure 7Averaged retroplume for air masses from (a) NCP (C3 in Fig. S1), (b) central–eastern China plain (C2 in Fig. S1), and (c) YRD (C1 and C5 in Fig. S1), and (d–f) a comparison of pie charts of SNA and BC in PM2.5 for the three types of air masses in NDJ of 2013 (November and December 2013 and January 2014) and 2017 (November and December 2017 and January 2018), corresponding to the three transport pathways of different air masses given in (a–c). Note: averaged PM2.5 concentrations for the corresponding air masses and periods are shown in the top left of each pie chart and also indicated by the size of the pie charts. The reduction rates between the two periods are shown in red in the top right of right panel (in percentage).
For the scatter plot of SNA (the sum of sulfate, nitrate, and ammonium) versus BC (Fig. 6b), a less-changed SNA/BC slope from 2014 to 2018 somehow suggests the co-benefited reduction of short-lived climate forcers from the mitigation of haze pollution in China. Since SNA is mainly secondary products due to oxidation of SO2 and NOx and neutralization of NH3 (Pinder et al., 2007) and BC is a tracer of primary pollutants from combustion sources (Bond et al., 2013), the similar slope here also indicates that the overall proportion of secondary particles in PM2.5 was less changed. However, the sulfate ∕ PM2.5 ratio was significantly reduced from 2014 to 2018 (Fig. 6c), linked to the remarkable reduction of its precursor SO2, as shown in Fig. 2b. However, for nitrate, an overall increased nitrate ∕ PM2.5 ratio could be clearly seen in recent years, especially for 2018, despite of a moderate decreasing of NO2 (Fig. 2d). It is well-known that PM2.5 has a nonlinear response to the reduction of sulfate because decreases in sulfate may increase aerosols when more nitric acid may enter the aerosol phase (West et al., 1999; Pinder et al., 2007; Liu et al., 2019). Here the regional-scale sulfate reduction should have increased the availability of NH3 for the formation of nitrate (Pathak et al., 2009; Huang et al., 2012; Wang et al., 2011; Liu et al., 2018, 2019). In addition, the increased atmospheric oxidization capacity will also enhance the formation of nitrate (Wen et al., 2018; Liu et al., 2019).
To further investigate the change in SNA and BC associated with air masses from main source regions in eastern China, we carried out back-trajectory cluster analysis for the months of NDJ during 2013–2018 (Fig. S1). In Fig. 7, we show the pie charts of SNA and BC in PM2.5 at SORPES between 2013 and 2017, i.e., the beginning and end of the first 5-year “Ten Measures”, for air masses that originated from the NCP (Fig. 7a, d), the central–eastern China plain (Fig. 7b and e), and the YRD (Fig. 7c and f). The results show a significantly higher reduction (−52.3 %) in the air masses from the NCP than the other two areas (∼ 32 %), indicating more strict and efficient control in northern China (Liu et al., 2019; Li et al., 2019). For the fraction of chemical composition, sulfate shows a significant decrease in the NCP (from 23 % to 19 %) and YRD (from 18 % to 14 %), but nitrate shows a significant increase (from 24 % to 29 % for YRD air masses and from 24 % to 32 % for air masses from the two regions in the north), while ammonium shows a 1 % increase in all three regions. These results confirmed the increased availability of NH3 for the formation of SNA (Pathak et al., 2009; Liu et al., 2018, 2019; Li et al., 2019) and suggest a stricter NH3 emission reduction as a potentially efficient means for further PM2.5 mitigation in eastern China.
Meteorological conditions, especially transport and dispersion, could significantly influence PM2.5 concentration (Ding et al., 2013a, b; Zhang et al., 2016). From the air quality management perspectives, it is very important to quantify the influence of emission reduction and year-to-year change in meteorology based on the observed trend of air pollutants. Because NDJ is the 3-month period with the highest PM2.5 concentration at SORPES (Fig. 3a), the trend during these months should also dominate the overall trend in the annual average. In addition, the total precipitation during this period was relatively low (upper panel of Fig. 8), indicating the limited influence of wet deposition. Considering the limitation of LPDM in characterizing wet deposition and also secondary PM formation, we only chose NDJ to conduct the LPDM simulations based on the fixed MIX emission inventory for 2010 (M. Li et al., 2017) to quantify the impacts from emission reduction and from the change in meteorology. To better characterize the influence of year-to-year differences in meteorology alone based on LPDM, we scaled the simulation results to make the modeled median values equal to observation for the first year, i.e., November 2011–January 2012. This procedure removes other systematic differences between the LPDM simulation and the observation, e.g., uncertainty of the emission inventory, parameterization of the boundary layer, etc., in the model. In fact, for the results with all years scaled using this method, the LPDM simulations could reproduce the day-to-day variation in PM2.5 well (Fig. S2). The good agreement implies that the primary and secondary PM2.5 had a consistent change with day-to-day weather, which controls the transport and dispersion of pollutants.
Figure 8 shows the trends of observed PM2.5 concentration at SORPES and the scaled LPDM simulation results to the first-year observation (i.e., 2011–2012) in NDJ from 2012 to 2018. The observations in the 3 months show a consistent trend, with the annual average given in Fig. 1a. From the LPDM simulation results based on the fixed emission inventory, we can find that the meteorology-influenced PM2.5 had strong year-to-year variation, with a minimum medium value of 84.8 µg m−3 in 2011–2012 to 108.4 µg m−3 in 2013–2014, i.e., with a year-to-year difference of up to 28 %. The differences in the 2 years were mainly due to different transport and dispersion patterns related to different large-scale circulations (Fig. 9). In NDJ of 2013–2014, eastern China was dominated by a stagnant high isolated from the continental high, causing more subregional influence of air masses in eastern China (Fig. 9d) than NDJ of 2011–2012. For the LPDM simulations with fixed emission inventory, an increasing trend (about 1.1 % yr−1) existed for the entire 7 years, but a moderate decreasing trend (−2.6 % yr−1) existed in the last 5 years (Fig. 8). Here the distinctly different trends for the 5-year and 7-year periods indicate that the interannual variation could substantially influence the understanding of the trend in air quality for a period of less than 1 decade. For the period since 2013, i.e., when the “Ten Measures” took action, the observed decrease in PM2.5 (−10.9 % yr−1) are mainly induced by emission reduction (76 %) and the year-to-year change in meteorology contributed to the remaining 24 %, i.e., about a quarter of the overall decrease. Here our estimation is consistent with that by Zhang et al. (2019), in which meteorology was estimated to contribute 20 %–30 % of the deceased trend in the YRD region during the period 2013–2017.
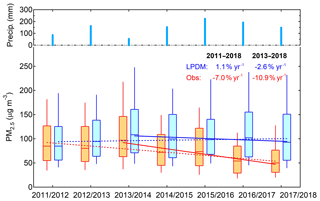
Figure 8Statistics of PM2.5 concentrations from the SORPES observation and the scaled LPDM simulations to the first-year observation (lower panel) and a sum of 3-month TRMM precipitation averaged in a grid (31–33∘ N, 118–120∘ E) around SORPES (upper panel) for November–December–January during 2011–2018.
In this study, we make a comprehensive analysis based on long-term continuous high-quality measurements of PM2.5, relevant chemical compositions, and precursors at a regional background station, SORPES, in Nanjing, eastern China, since 2011. By utilizing Lagrangian dispersion modeling and various data, we quantified the impact of changes in different emission sources and in year-to-year meteorology on the observed trends, especially after the implementation of “Action Plan for Air Pollution Prevention and Control” (i.e., the national “Ten Measures of Air”) in 2013. The main conclusions are given below:
-
We found a substantial reduction of PM2.5 together with a stronger reduction of SO2 at SORPES during 2011–2018 and much faster decreasing trends (−9.1 % yr−1 in PM2.5 and −16.7 % yr−1 in SO2) associated with a concurrent reduction in sulfate (−10.6 % yr−1), nitrate (−5.8 % yr−1), and BC (−8.4 % yr−1) during 2013–2018, i.e., after the “Ten Measures” were implemented.
-
The early summer agricultural straw burning has been found to have significantly reduced since 2013 in eastern China. It significantly reduced PM2.5 concentration at SORPES during May–June, resulting in a change in the seasonal pattern of PM2.5. In the cold season (November–January), the fraction of nitrate in PM2.5 was significantly increased, especially when air masses came from the north. Besides an increased oxidization capacity, more NH3 being available for nitrate formation under the condition of reduced sulfate associated with a substantial reduction of SO2 is the main reason causing the enhanced nitrate formation. A stricter NH3 emission reduction is suggested for further PM2.5 mitigation in eastern China.
-
The year-to-year difference in meteorological conditions could cause a strong change in wintertime PM2.5 concentrations by mainly influencing the transport and dispersion of air pollutants. The change in meteorology contributed to 24 % of the observed decrease in PM2.5 at the SORPES station in November–January during 2013–2018, with the remaining 76 % caused mainly by emission reduction.
This study demonstrates the unique role of long-term high-quality continuous measurement at a regional background station in understanding the impact of emission sources, chemical mechanisms, and meteorology processes on the change of atmospheric components. Based on comprehensive and in-depth analysis of the data, the long-term measurements can provide a quantitative understanding about the large-scale air quality measures and can also raise some insights on policy-making for future air pollution prevention and control.
The ERA-5 global reanalysis data are available at https://cds.climate.copernicus.eu/cdsapp\#!/home (Copernicus Climate Change Service, 2019). MIX emission data are available at http://www.meicmodel.org/dataset-mix.html (last access: 15 March 2019). Biomass burning emission data are available at https://www.geo.vu.nl/~gwerf/GFED/GFED4/ (van der Werf et al., 2017). MODIS satellite fire count data are available at https://e4ftl01.cr.usgs.gov/MOTA/ (NASA, 2019), and the TRMM precipitation data are available at https://disc.gsfc.nasa.gov/datasets/TRMM_3B42_Daily_7/summary?keywords=TRMM (last access: 15 March 2019). The SORPES data in this paper will be publicly available when the paper is published.
The supplement related to this article is available online at: https://doi.org/10.5194/acp-19-11791-2019-supplement.
AD designed this study, carried out the data analysis, and wrote the paper, with contributions from all co-authors. XH participated the data analysis and modeling and plotted some figures. WN, XC, ZX, LZ, ZNX, YX, XQ, YS, PS, JW, LW, WQ, and XZ conducted the measurements at SORPES.
The authors declare that they have no conflict of interest.
We thank colleagues and students in the School of Atmospheric Sciences at Nanjing University and Markku Kulmala's group at the University of Helsinki for their contributions to the development of SORPES and the maintenance of the measurements.
This research has been supported by the Ministry of Science and Technology, China (grant nos. 2016YFC0200500, 2018YFC0213800, and 2016YFC0202000), and the National Natural Science Foundation of China (grant nos. 41725020 and 41621005).
This paper was edited by Qiang Zhang and reviewed by three anonymous referees.
Bond, T. C., Doherty, S. J., Fahey, D. W., Forster, P. M., Berntsen, T., DeAngelo, B. J., Flanner, M. G., Ghan, S., Kärcher, B., Koch, D., Kinne, S., Kondo, Y., Quinn, P. K., Sarofim, M. C., Schultz, M. G., Schulz, M., Venkataraman, C., Zhang, H., Zhang, S., Bellouin, N., Guttikunda, S. K., Hopke, P. K., Jacobson, M. Z., Kaiser, J. W., Klimont, Z., Lohmann, U., Schwarz, J. P., Shindell, D., Storelvmo, T., Warren, S. G., and Zender, C. S.: Bounding the role of black carbon in the climate system: A scientific assessment, J. Geophys. Res., 118, 5380–5552, 2013.
Boschetti, L., Roy, D., and Hoffmann A.: MODIS Collection 5 Burned Area Product-MCD45, User's Guide, Version 2, 2009.
Cao, J., Xu, H., Xu, Q., Chen, B., and Kan H.: Fine particulate matter constituents and cardiopulmonary mortality in a heavily polluted Chinese City, Environ. Health. Perspect., 120, 373–378, 2012.
Chen, J., Li, C., Ristovski, Z., Milic, A., Gu, Y., Islam, M. S., Wang, S., Hao, J., Zhang, H., He, C., Guo, H., Fu, H., Miljevic, B., Morawska, L., Thai, P., Lam, Y. F., Pereira, G., Ding, A., Huang, X., and Dumka, U. C.: A review of biomass burning: Emissions and impacts on air quality, health and climate in China, Sci. Total Envion., 579, 1000–1034, 2017.
Cheng, Y. F., Zheng, G., Wei, C., Mu, Q., Zheng, B., Wang, Z., Gao, M., Zhang, Q., He, K., Carmichael, G., Pöschl, U., and Su, H.: Reactive nitrogen chemistry in aerosol water as a source of sulfate during haze events in China, Sci. Adv., 2, e1601530, https://doi.org/10.1126/sciadv.1601530, 2016.
Cheng, Z., Wang, S., Fu, X., Watson, J. G., Jiang, J., Fu, Q., Chen, C., Xu, B., Yu, J., Chow, J. C., and Hao, J.: Impact of biomass burning on haze pollution in the Yangtze River delta, China: a case study in summer 2011, Atmos. Chem. Phys., 14, 4573–4585, https://doi.org/10.5194/acp-14-4573-2014, 2014.
Copernicus Climate Change Service (C3S): Climate Data Store (CDS), available at: https://cds.climate.copernicus.eu/cdsapp#!/home, last access: 1 February 2019.
Ding, A. J., Fu, C. B., Yang, X. Q., Sun, J. N., Zheng, L. F., Xie, Y. N., Herrmann, E., Nie, W., Petäjä, T., Kerminen, V.-M., and Kulmala, M.: Ozone and fine particle in the western Yangtze River Delta: an overview of 1 yr data at the SORPES station, Atmos. Chem. Phys., 13, 5813–5830, https://doi.org/10.5194/acp-13-5813-2013, 2013a.
Ding, A. J., Fu, C. B., Yang, X. Q., Sun, J. N., Petäjä, T., Kerminen, V.-M., Wang, T., Xie, Y., Herrmann, E., Zheng, L. F., Nie, W., Liu, Q., Wei, X. L., and Kulmala, M.: Intense atmospheric pollution modifies weather: a case of mixed biomass burning with fossil fuel combustion pollution in eastern China, Atmos. Chem. Phys., 13, 10545–10554, https://doi.org/10.5194/acp-13-10545-2013, 2013b.
Ding, A. J., Wang, T., and Fu, C.: Transport characteristics and origins of carbon monoxide and ozone in Hong Kong, South China, J. Geophys. Res., 118, 9475–9488, https://doi.org/10.1002/jgrd.50714, 2013c.
Ding, A. J., Huang, X., Nie, W., Sun, J., Kerminen, V.-M., Petäjä, T., Su, H., Cheng, Y., Wang, M., Chi, X., Wang, J., Virkkula, A., Guo, W. Yuan, J., Wang, S., Zhang, R., Wu, Y., Song, Y., Zhu, T., Zilitinkevich, S., Kulmala, M., and Fu, C.: Enhanced haze pollution by black carbon in megacities in China, Geophys. Res. Lett., 43, 2873–2879, 2016a.
Ding, A. J., Nie, W., Huang, X., Chi, X., Sun, J., Kerminen, V.-M., Xu, Z., Guo, W., Petäjä, T., Yang, X., Kulmala, M., and Fu, C.: Long-term observation of air pollution-weather/climate interactions at the SORPES station: a review and outlook, Front. Environ. Sci. Eng., 10, 15, https://doi.org/10.1007/s11783-016-0877-3, 2016b.
Feng, X., Fu, T.-M., Cao, H., Tian, H., Fan, Q., and Chen, X.: Neural network predictions of pollution emissions from open burning of crop residues: application to air quality forecasts in Southern China, Atmos. Environ., 204, 22–31, https://doi.org/10.1016/j.atmosenv.2019.02.002, 2019.
Giglio, L., Randerson, J. T., and van der Werf, G. R.: Analysis of daily, monthly, and annual burned area using the fourth-generation global fire emissions database (GFED4), J. Geophys. Res. 118, 317–328, 2013.
He, K., Yang, F., Ma, Y., Zhang, Q., Yao, X., Chan, C.K., Cadle, S., Chan, T., and Mulawa, P.: The characteristics of PM2.5 in Beijing, China, Atmos. Environ., 35, 4959–4970, 2001.
Huang, X., Song, Y., Li, M., Li, J., Huo, Q., Cai, X., Zhu, T., Hu, M., and Zhang, H.: A high-resolution ammonia emission inventory in China, Global Biogeochem. Cy., 26, GB1030, https://doi.org/10.1029/2011GB004161, 2012.
Huang, X., Ding, A., Liu, L., Liu, Q., Ding, K., Niu, X., Nie, W., Xu, Z., Chi, X., Wang, M., Sun, J., Guo, W., and Fu, C.: Effects of aerosol–radiation interaction on precipitation during biomass-burning season in East China, Atmos. Chem. Phys., 16, 10063–10082, https://doi.org/10.5194/acp-16-10063-2016, 2016.
Huang, X., Wang, Z. L., and Ding, A. J.: Impact of Aerosol-PBL Interaction on Haze Pollution: Multiyear Observational Evidences in North China, Geophys. Res. Lett., 45, 8596–8603, 2018.
Huffman, G. J., Bolvin, D. T., Nelkin, E. J., and Wolff, D. B.: The TRMM multiscatellite precipitation analysis (TMPA): Quasi-global, multiyear, combined-sensor precipitation estimates at fine scales, J. Hydrometeorol., 8, 38–55, 2007.
IPCC Climate Change: The Physical Science Basis. Cambridge, U.K., Cambridge Univ. Press, 2013.
Kitoh, A. and Uchiyama, T.: Changes in onset and withdraw of the East Asian summer rainy season by multi-model global warming experiment, J. Meteoro. Soc. Japan, 84, 247–258, 2006.
Lang, J., Zhang, Y., Zhou, Y., Cheng, S., Chen, D., Guo, X., Chen, S., Li, X., Xing, X., and Wang, H.: Trends of PM2.5 and chemical composition in Beijing, 2000–2015, Aerosol Air Qual. Res., 17, 412–425, 2017.
Li, C., McLinden, C., Fioletov, V., Krotkov, N., Carn, S., Joiner, J., Streets, D., He, H., Ren, X., Li, Z., and Dickerson, R. R.: India is overtaking China as the World's largest emitter of anthropogenic sulfur dioxide, Sci. Rep., 7, 14304, https://doi.org/10.1038/s41598-017-14639-8, 2017.
Li, H., Cheng, J., Zhang, Q., Zheng, B., Zhang, Y., Zheng, G., and He, K.: Rapid transition in winter aerosol composition in Beijing from 2014 to 2017: response to clean air actions, Atmos. Chem. Phys., 19, 11485–11499, https://doi.org/10.5194/acp-19-11485-2019, 2019.
Li, M., Zhang, Q., Kurokawa, J.-I., Woo, J.-H., He, K., Lu, Z., Ohara, T., Song, Y., Streets, D. G., Carmichael, G. R., Cheng, Y., Hong, C., Huo, H., Jiang, X., Kang, S., Liu, F., Su, H., and Zheng, B.: MIX: a mosaic Asian anthropogenic emission inventory under the international collaboration framework of the MICS-Asia and HTAP, Atmos. Chem. Phys., 17, 935–963, https://doi.org/10.5194/acp-17-935-2017, 2017.
Liu, M., Huang, X., Song, Y., Xu, T., Wang, S., Wu, Z., Hu, M., Zhang, L., Zhang, Q., Pan, Y., Liu, X., and Zhu, T.: Rapid SO2 emission reductions significantly increase tropospheric ammonia concentrations over the North China Plain, Atmos. Chem. Phys., 18, 17933–17943, https://doi.org/10.5194/acp-18-17933-2018, 2018.
Liu, M., Huang, X., Song, Y., Tang, J., Cao, J., Zhang, X., Zhang, Q., Wang, S., Xu, T., Kang, L., Cai, X., Zhang, H., Yang, F., Wang, H., Yu, J., Lau, A., He, L., Huang, X., Duan, L., Ding, A., Xue, L., Gao, J., Liu, B., and Zhu, T.: Ammonia emission control in China would mitigate haze pollution and nitrogen deposition, but worsen acid rain, P. Natl. Acad. Sci. USA, 116, 7760–7765, https://doi.org/10.1073/pnas.1814880116, 2019.
Malm, W. C., Schichtel, B. A., Pitchford, M. L., Ashbaugh, L. L., and Eldred, R. A.: Spatial and monthly trends in speciated fine particle concentration in the United states, J. Geophys. Res., 109, D03306, https://doi.org/10.1029/2003JD003739, 2004.
NASA: Land Processes Distributed Active Archive Center (LP DAAC) Distribution Server, MODIS satellite fire count data, available at: https://e4ftl01.cr.usgs.gov/MOTA/, last access: 1 April 2019.
Nie, W., Ding, A. J., Xie, Y. N., Xu, Z., Mao, H., Kerminen, V.-M., Zheng, L. F., Qi, X. M., Huang, X., Yang, X.-Q., Sun, J. N., Herrmann, E., Petäjä, T., Kulmala, M., and Fu, C. B.: Influence of biomass burning plumes on HONO chemistry in eastern China, Atmos. Chem. Phys., 15, 1147–1159, https://doi.org/10.5194/acp-15-1147-2015, 2015.
Pathak, R. K., Wu, W. S., and Wang, T.: Summertime PM2.5 ionic species in four major cities of China: nitrate formation in an ammonia-deficient atmosphere, Atmos. Chem. Phys., 9, 1711–1722, https://doi.org/10.5194/acp-9-1711-2009, 2009.
Pinder, R. W., Adams, P. J., and Pandis, S. N.: Ammonia emission controls as a cost-effective strategy for reducing atmospheric particulate matter in the eastern United States, Environ. Sci. Technol, 41, 380–386, 2007.
Sheehan, P., Cheng, E. J., English, A., and Sun, F. H.: China's response to the air pollution shock, Nat. Clim. Change, 4, 306–309, 2014.
Shen, Y., Virkkula, A., Ding, A., Wang, J., Chi, X., Nie, W., Qi, X., Huang, X., Liu, Q., Zheng, L., Xu, Z., Petäjä, T., Aalto, P. P., Fu, C., and Kulmala, M.: Aerosol optical properties at SORPES in Nanjing, east China, Atmos. Chem. Phys., 18, 5265–5292, https://doi.org/10.5194/acp-18-5265-2018, 2018.
Stein, A. F., Draxler, R. R., Rolph, G. D., Stunder, B. J. B., Cohen, M. D., and Ngan, F.: NOAA's HYSPLIT atmospheric transport and dispersion modeling system, B. Am. Meteoro. Soc., 96, 2059–2077, 2015.
Sun, P., Nie, W., Chi, X., Xie, Y., Huang, X., Xu, Z., Qi, X., Xu, Z., Wang, L., Wang, T., Zhang, Q., and Ding, A.: Two years of online measurement of fine particulate nitrate in the western Yangtze River Delta: influences of thermodynamics and N2O5 hydrolysis, Atmos. Chem. Phys., 18, 17177–17190, https://doi.org/10.5194/acp-18-17177-2018, 2018.
Sun, Y., Zhuang, G., Tang, A., Wang, Y., and An, Z.: Chemical characteristics of PM2.5 and PM10 in haze-fog episode in Beijing, Environ. Sci. Technol., 40, 3148–3155, 2006.
Uematsu, M., Hattori, H., Nakamura, T., Narita, Y., Jung, J., Matsumoto, K., Nakaguchi, Y., and Kumar, M. D.: Atmospheric transport and deposition of anthropogenic substances from the Asia to the East China Sea, Marine Chem., 120, 108–115, 2010.
Virkkula, A., Chi, X., Ding, A., Shen, Y., Nie, W., Qi, X., Zheng, L., Huang, X., Xie, Y., Wang, J., Petäjä, T., and Kulmala, M.: On the interpretation of the loading correction of the aethalometer, Atmos. Meas. Tech., 8, 4415–4427, https://doi.org/10.5194/amt-8-4415-2015, 2015.
van der Werf, G. R., Randerson, J. T., Giglio, L., van Leeuwen, T. T., Chen, Y., Rogers, B. M., Mu, M., van Marle, M. J. E., Morton, D. C., Collatz, G. J., Yokelson, R. J., and Kasibhatla, P. S.: Global fire emissions estimates during 1997–2016, Earth Syst. Sci. Data, 9, 697–720, https://doi.org/10.5194/essd-9-697-2017, 2017 (data available at: https://www.geo.vu.nl/~gwerf/GFED/GFED4/, last access: 1 February 2019).
Wang, G., Zhang, R., Gomez, M. E., Yang, L., Zamora, M. L., Hu, M., Lin, Y., Peng, J., Guo, S., Meng, J., Li, J., Cheng, C. Hu., T., Ren, Y., Wang, Y., Gao, J., Cao, J., An, Z., Zhou, W., Li, G., Wang, J., Tian, P., Marrero-Ortiz, W., Secrest, J., Du, Z., Zheng, J., Shang, D., Zeng, L., Shao, M., Wang, W., Huang, Y., Wang, Y., Zhu, Y., Li, Y., Hu, J., Pan, B., Cai, L., Cheng, Y., Ji, Y., Zhang, F., Rosenfeld, D., Liss, P. S., Duce, R. A., Kolb, C. E., and Molina, M. J.: Persistent sulfate formation from London Fog to Chinese haze, P. Natl. Acad. Sci. USA, 113, 13630–13635, 2016.
Wang, H. L., Qiao, L. P., Lou, S. R., Zhou, M., Ding, A. J., Huang, H. Y., Chen, J. M., Wang, Q., Tao, S. K., Chen, C. H., Li, L., and Huang, C.: Chemical composition of PM2.5 and meteorological impact among three years in urban Shanghai, China, J. Clean. Prod., 112, 1302–1311, 2016.
Wang, J. D., Zhao, B., Wang, S., Yang, F., Xing, J., Morawska, L., Ding, A., Kulmala, M., Kerminen, V.-M., Kujansuu, J., Wang, Z., Ding, D., Zhang, X., Wang, H., Tian, M., Petäjä, T., Jiang, J., and Hao, J.: Particulate matter pollution over China and the effects of control policies, Sci. Total Environ., 584, 426–447, 2017.
Wang, J., Nie, W., Cheng, Y., Shen, Y., Chi, X., Wang, J., Huang, X., Xie, Y., Sun, P., Xu, Z., Qi, X., Su, H., and Ding, A.: Light absorption of brown carbon in eastern China based on 3-year multi-wavelength aerosol optical property observations and an improved absorption Ångström exponent segregation method, Atmos. Chem. Phys., 18, 9061–9074, https://doi.org/10.5194/acp-18-9061-2018, 2018.
Wang, S., Xing, J., Jang, C., Zhu, Y., Fu, J. S., and Hao, J.: Impact assessment of ammonia emissions on inorganic aerosols in East China using response surface modeling technique, Environ. Sci. Tech., 45, 9293–9300, 2011.
Wang, T., Cheung, T. F., Li, Y. S., Yu, X. M., and Blake, D. R.: Emission characteristics of CO, NOx, SO2 and indications of biomass burning observed at a rural site in eastern China, J. Geophys. Res., 107, 4157, https://doi.org/10.1029/2001JD000724, 2002.
Wang, Z., Huang, X., and Ding, A.: Dome effect of black carbon and its key influencing factors: a one-dimensional modelling study, Atmos. Chem. Phys., 18, 2821–2834, https://doi.org/10.5194/acp-18-2821-2018, 2018.
Wen, L., Xue, L., Wang, X., Xu, C., Chen, T., Yang, L., Wang, T., Zhang, Q., and Wang, W.: Summertime fine particulate nitrate pollution in the North China Plain: increasing trends, formation mechanisms and implications for control policy, Atmos. Chem. Phys., 18, 11261–11275, https://doi.org/10.5194/acp-18-11261-2018, 2018.
West, J. J., Ansari, A. S., and Pandis, S. N.: Marginal PM2.5: Nonlinear Aerosol mass response to sulfate reductions in the eastern United States, J. Air. Weste. Manage. Assoc., 49, 1415–1424, 1999.
Xie, Y., Ding, A., Nie, W., Mao, H., Qi, X., Huang, X., Xu, Z. Kerminen, V.-M., Petäjä, T., Chi, X., Virkkula, A., Boy, M., Xue, L., Guo, J., Sun, J., Yang, X., Kulmala, M., and Fu, C.: Enhanced sulfate formation by nitrogen dioxide: Implications from in situ observations at the SORPES station, J. Geophys. Res., 120, 12679–12694, 2015.
Yao, X., Chan, C. K., Fang, M., Cadle, S., Chan, T. Mulawa, P., He, K., and Ye, B.: The water-soluble ionic composition of PM2.5 in Shanghai and Beijing, China, Atmos. Environ., 36, 4223–4234, 2002.
Zhang, Q., Jiang, X., Tong, D., Davis, S. J., Zhao, H., Geng, G., Feng, T., Zheng, B., Lu, Z., Streets, D. G., Ni, R., Brauer, M., van Donkelaar, A., Martin, R. V., Huo, H., Liu, Z., Pan, D., Kan, H., Yan, Y., Lin, J., He, K., and Guan, D.: Transboundary health impacts of transported global air pollution and international trade, Nature, 543, 705–709, 2017.
Zhang, R. Y., Wang, G., Guo, S., Zamora, J., Ying, Q., Lin, Y., Wang, W., Hu, M., and Wang, Y.: Formation of Urban Fine Particulate Matter, Chem. Rev., 115, 3803–3855, 2015.
Zhang, X. Y., Xu, X., Ding, Y., Liu, Y., Zhang, H., Wang, Y., and Zhong, J.: The impact of meteorological changes from 2013 to 2017 on PM2.5 mass reduction in key regions in China, Sci. China – Earth Sci., 62, 1–18, https://doi.org/10.1007/s11430-019-9343-3, 2019.
Zhang, Y., Ding, A., Mao, H., Nie, W., Zhou, D., Liu, L., Huang, X., and Fu, C.: Impact of synoptic weather patterns and inter-decadal climate variability on air quality in the North China Plain during 1980–2013, Atmos. Environ., 124, 119–128, 2016.
Zheng, B., Tong, D., Li, M., Liu, F., Hong, C., Geng, G., Li, H., Li, X., Peng, L., Qi, J., Yan, L., Zhang, Y., Zhao, H., Zheng, Y., He, K., and Zhang, Q.: Trends in China's anthropogenic emissions since 2010 as the consequence of clean air actions, Atmos. Chem. Phys., 18, 14095–14111, https://doi.org/10.5194/acp-18-14095-2018, 2018.
Zheng, G. J., Duan, F. K., Su, H., Ma, Y. L., Cheng, Y., Zheng, B., Zhang, Q., Huang, T., Kimoto, T., Chang, D., Pöschl, U., Cheng, Y. F., and He, K. B.: Exploring the severe winter haze in Beijing: the impact of synoptic weather, regional transport and heterogeneous reactions, Atmos. Chem. Phys., 15, 2969–2983, https://doi.org/10.5194/acp-15-2969-2015, 2015.
Zhou, Y., Xing, X., Lang, J., Chen, D., Cheng, S., Wei, L., Wei, X., and Liu, C.: A comprehensive biomass burning emission inventory with high spatial and temporal resolution in China, Atmos. Chem. Phys., 17, 2839–2864, https://doi.org/10.5194/acp-17-2839-2017, 2017.


