the Creative Commons Attribution 4.0 License.
the Creative Commons Attribution 4.0 License.
 | 13 Sep 2019
Satellite inference of water vapour and above-cloud aerosol combined effect on radiative budget and cloud-top processes in the southeastern Atlantic Ocean
Lucia T. Deaconu
Nicolas Ferlay
Fabien Waquet
Fanny Peers
François Thieuleux
Philippe Goloub
Aerosols have a direct effect on the Earth's radiative budget and can also affect cloud development and lifetime, and the aerosols above clouds (AAC) are particularly associated with high uncertainties in global climate models. Therefore, it is a prerequisite to improve the description and understanding of these situations. During the austral winter, large loadings of biomass burning aerosols originating from fires in the southern African subcontinent are lifted and transported westwards, across the southeastern Atlantic Ocean. The negligible wet scavenging of these absorbing aerosols leads to a near-persistent smoke layer above one of the largest stratocumulus cloud decks on the planet. Therefore, the southeastern Atlantic region is a very important area for studying the impact of above-cloud absorbing aerosols, their radiative forcing and their possible effects on clouds.
In this study we aim to analyse and quantify the effect of smoke loadings on cloud properties using a synergy of different remote sensing techniques from A-Train retrievals (methods based on the passive instruments POLDER and MODIS and the operational method of the spaceborne lidar CALIOP), collocated with ERA-Interim re-analysis meteorological profiles. To analyse the possible mechanisms of AAC effects on cloud properties, we developed a high and low aerosol loading approach, which consists in evaluating the change in radiative quantities (i.e. cloud-top cooling, heating rate vertical profiles) and cloud properties with the smoke loading. During this analysis, we account for the variation in the meteorological conditions over our sample area by selecting the months associated with one meteorological regime (June–August).
The results show that the region we focus on is primarily under the energetic influence of absorbing aerosols, leading to a significant positive shortwave direct effect at the top of the atmosphere. For larger loads of AACs, clouds are optically thicker, with an increase in liquid water path of 20 g m−2 and lower cloud-top altitudes by 100 m. These results do not contradict the semi-direct effect of above-cloud aerosols, explored in previous studies. Furthermore, we observe a strong covariance between the aerosol and the water vapour loadings, which has to be accounted for. A detailed analysis of the heating rate profiles shows that within the smoke layer, the absorbing aerosols are 90 % responsible for warming the ambient air by approximately 5.7 K d−1. The accompanying water vapour, however, has a longwave effect at distance on the cloud top, reducing its cooling by approximately 4.7 K d−1 (equivalent to 7 %). We infer that this decreased cloud-top cooling in particular, in addition with the higher humidity above the clouds, might modify the cloud-top entrainment rate and its effect, leading to thicker clouds. Therefore, smoke (the combination of aerosol and water vapour) events would have the potential to modify and probably reinforce the underlaying cloud cover.
- Article
(5470 KB) - Full-text XML
- BibTeX
- EndNote


The South Atlantic Ocean (SAO) is covered almost permanently by the largest stratocumulus cloud deck on the planet. These clouds play a very important role in the climate system, as they cool the tropics by reflecting sun radiation back into space (Bretherton et al., 2004; Wood, 2012). Between June and October, biomass burning aerosols originating from fires in the southern African subcontinent are lifted and transported long distances westwards, mostly above the low-level clouds (Ichoku et al., 2003; Waquet et al., 2009). The southern African subcontinent is the main annual contributor of biomass burning aerosols, as most of this region is covered by savannah. Due to agricultural practices, the savannah vegetation is burned and a large amount of aerosol is injected into the atmosphere (Labonne et al., 2007). The negligible wet scavenging of the aerosols transported above the clouds leads to a near-persistent smoke layer above the stratocumulus deck, which can be suspended in the atmosphere for several days. These dark-coloured aerosols are efficient in absorbing shortwave radiation, which can warm the lower troposphere and can modify the radiative budget, with a large-scale effect on climate that is not yet well understood. For instance, at the top of the atmosphere, the sign and amplitude of the direct radiative effect (DRE) depend on the aerosol properties and on the reflective properties of the underlying surface. The aerosol DRE can be positive or negative, depending on the cloud albedo, the aerosol type and its level of absorption (Lenoble et al., 1982; Keil and Haywood, 2003; Peers et al., 2015). The aerosol effects are, in fact, even more complex and may stabilize, promote or suppress the cloud formation, as a function of the position of the absorbing aerosol layer with respect to the cloud layer and the contact with the cloud droplets. In the case of absorbing aerosols above stratocumulus clouds, the warming of the layers located above the clouds would tend to stabilize the boundary layer. This stabilization would induce a lower entrainment rate and a moister boundary layer. The resulting effects would be an increase in the liquid water content and preservation of cloud cover (Brioude et al., 2009; Johnson et al., 2004). Conversely, if the aerosols are within the cloud, the warming of the atmospheric layer due to aerosol absorption tends to reduce the relative humidity and the liquid water content, decreasing the stratocumulus cloud cover (Hill et al., 2008). Additionally, an increase in the number of aerosols serving as cloud condensation nuclei (CCN) could lead to a larger number of smaller cloud droplets that bring about more reflective clouds, inducing a cooling of the Earth–atmosphere system (Twomey, 2007). The reduction of cloud droplet size may potentially have other impacts on precipitation and cloud properties.
All this considered, the southeastern Atlantic region is well suited to investigate the interactions of aerosols above clouds (AAC) with radiation and clouds. Currently the complexity of these interactions in the southeastern Atlantic and their influence on local and global climate are, however, not well captured by models. This is mainly due to limitations in accurately representing the aerosol and cloud spatial and vertical distributions, the aerosol absorption capacity, and the cloud properties, such as cloud optical thickness, liquid water path and effective radius. In situ measurements can be used to improve our understanding of the aerosol direct radiative forcing and cloud adjustments to the presence of aerosols. Recent airborne campaigns aim to answer several scientific questions related to the smoke-and-cloud regime over the Atlantic region using multiple aircraft and surface-based instrumentation located at different measurement sites, over the period 2016 to 2018 (Zuidema et al., 2016). The three campaigns (ORACLES, CLARIFY and AEROCLO-sA) offer the opportunity for international scientists to collaboratively verify and validate different satellite measurements and constrain the climate models.
Table 1Satellites and models and their associated parameters used in this study.
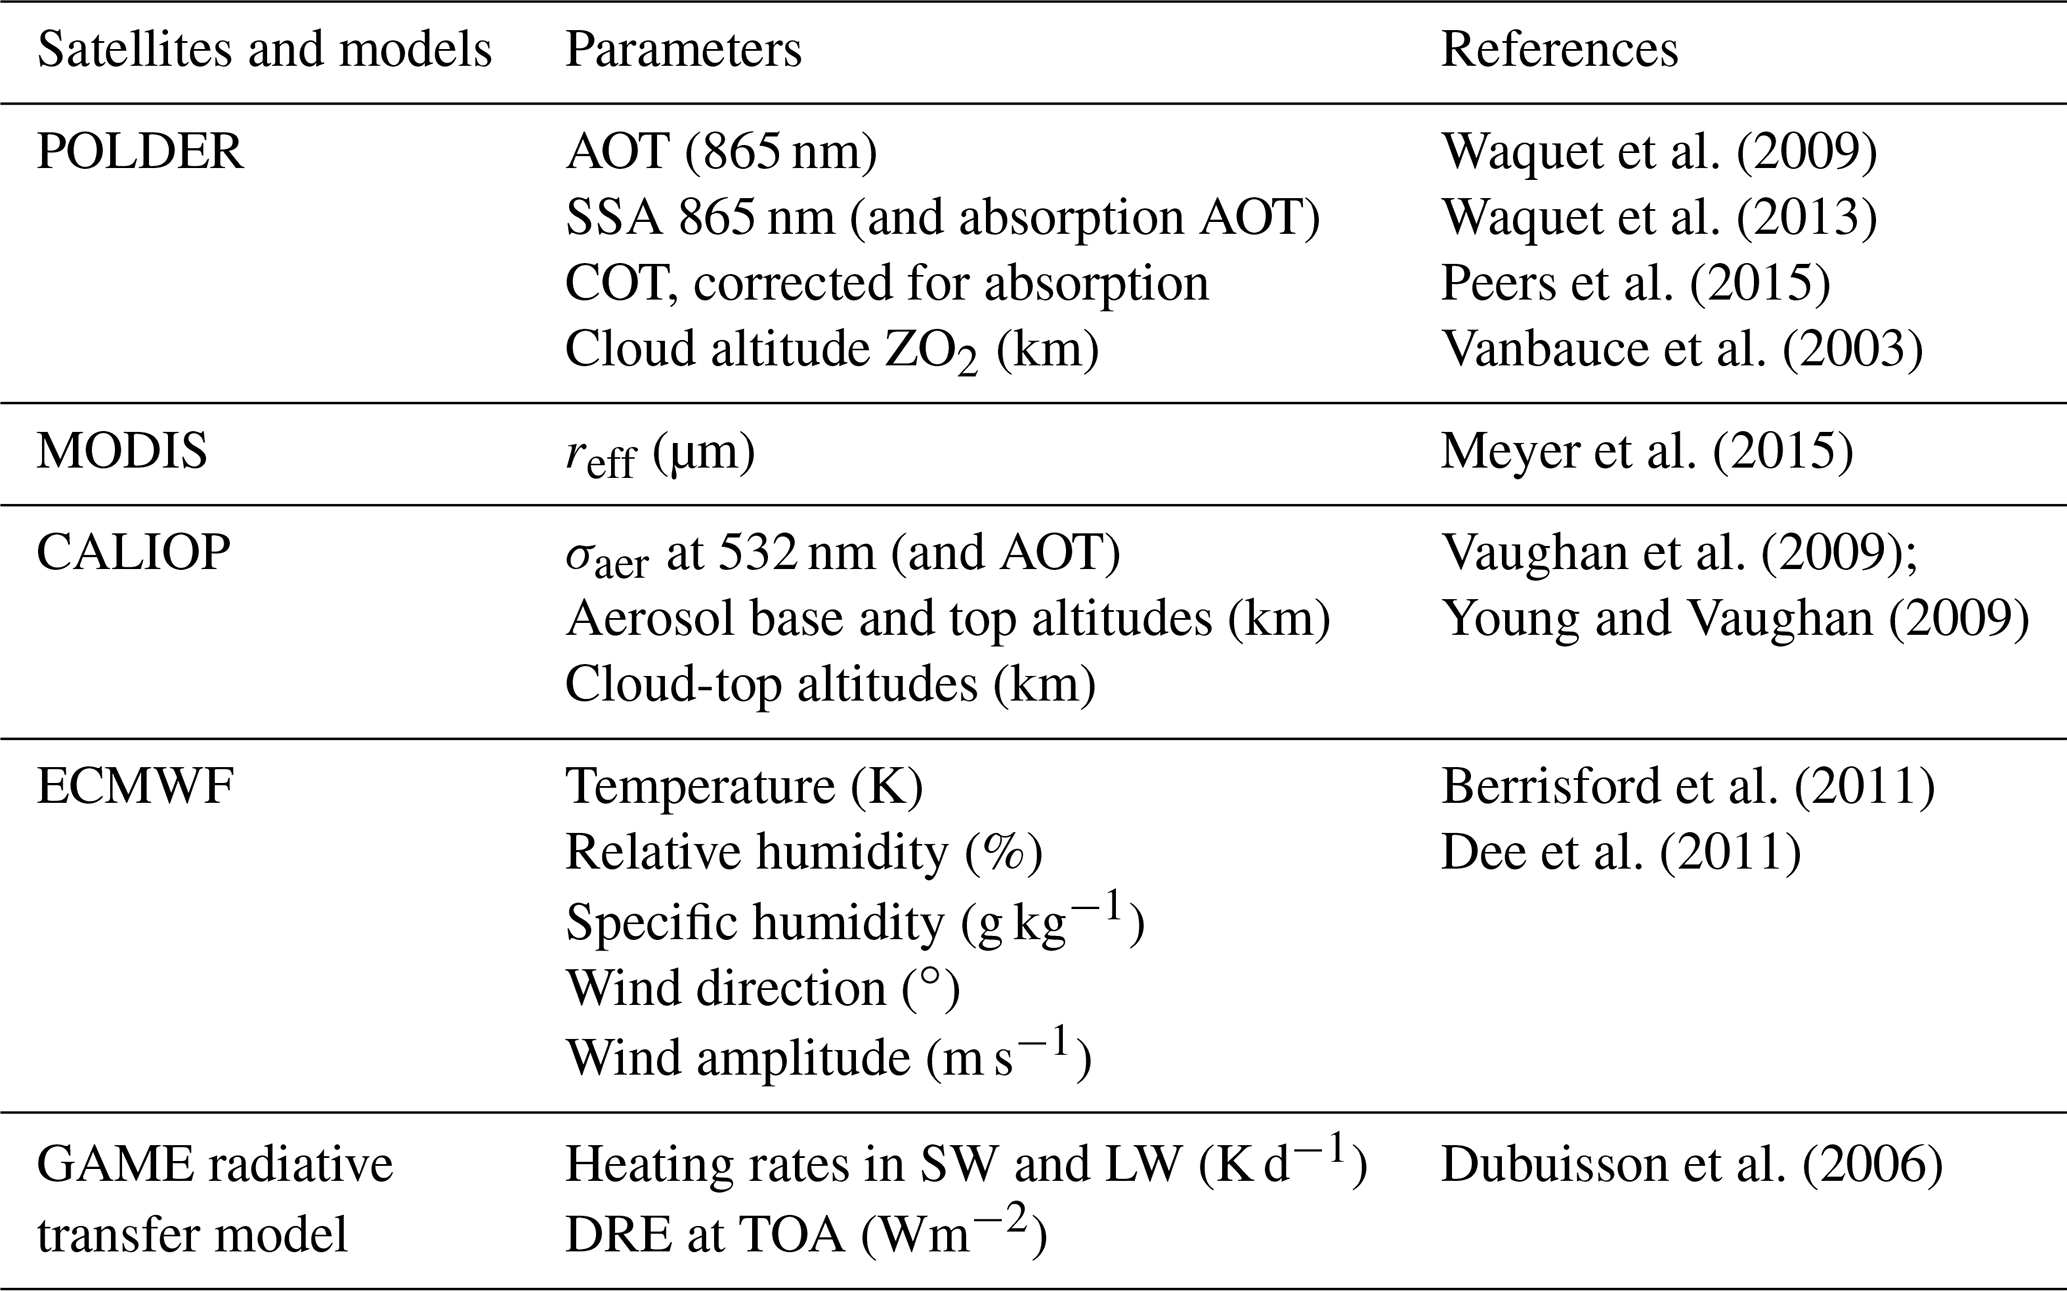
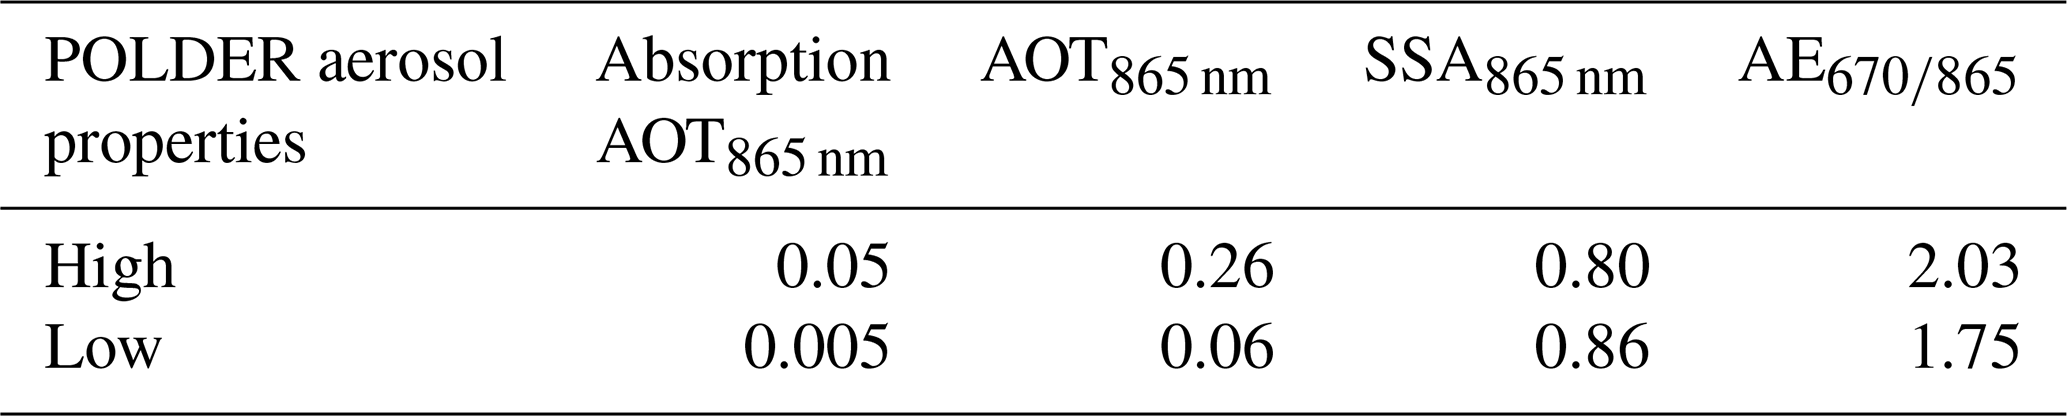
Table 2Mean values of aerosol properties over the specific area from June to August 2008, in the case of high values of absorption AOT (> 0.04) and in the case of low values of absorption AOT (< 0.01), respectively.
Although in situ measurements are more detailed and provide a better characterization of aerosols and their effects, these local measurements are not sufficient for regional or global climate studies. Space-borne observations allow the retrieval of aerosol and cloud properties over large spatial–temporal scales, facilitating the study of their effects on climate and reducing the related uncertainties. The A-Train satellite constellation includes different passive and active sensors that provide near-simultaneous measurements of aerosol and cloud properties, allowing the combination and comparison of various methods and also the possibility to perform instrumental synergies. The study of the above-cloud aerosol properties and radiative impacts as well as their potential interactions with the underlying clouds using satellite observations is a relatively recent topic in the field of remote sensing. Until now, different methods and instruments were used for the retrieval of the above-cloud aerosol properties. Lidar instruments that provide the vertical profile of the atmosphere are valuable tools for the study of above-cloud aerosol scenes. The lidar CALIOP (Cloud-Aerosol Lidar with Orthogonal Polarization), installed on the CALIPSO (Cloud-Aerosol Lidar and Infrared Pathfinder Satellite Observation) satellite, uses backscatter measurements to determine the vertical structure of the atmosphere and the properties of the aerosol and cloud layer (Vaughan et al., 2009; Winker et al., 2009; Young and Vaughan, 2009). The operational method developed for CALIOP allows the retrieval of the aerosol properties (i.e. mainly the aerosol optical thickness, AOT) for scenes with aerosols above clouds. However, the method relies on assumptions on the extinction-to-backscatter ratio of aerosols, and alternative CALIOP-based research methods have also been introduced to retrieve the above-cloud AOT (ACAOT). The depolarization ratio method (first introduced by Hu et al., 2007, and further implemented by Deaconu et al., 2017; Kacenelenbogen et al., 2019; Liu et al., 2015) and the colour ratio method (Chand et al., 2008) use fewer assumptions for the retrieval of AAC properties. These techniques are based on light transmission methods and treat the liquid water clouds situated underneath the aerosol layer as a target. Passive sensors have also been used to obtain information on aerosols above clouds. The multidirectional polarization measurements have shown sensitivity to scenes with aerosols above clouds (Waquet et al., 2009; Hasekamp, 2010; Knobelspiesse et al., 2011), as they strongly modify the polarized light reflected back to space by the cloud layer. Waquet et al. (2013) have developed an operational method for retrieving the properties of AACs that relies on the polarized radiances measured by the POLDER (Polarization and Directionality of Earth Reflectances) instrument, on board the PARASOL (Polarization and Anisotropy of Reflectances for Atmospheric Science coupled with Observations from a Lidar) satellite. The method is able to retrieve the AOT at 865 nm and the Ångström exponent, which is a parameter indicative of the particle size. Furthermore, Peers et al. (2015) have developed a complementary method that uses additional total multidirectional radiances measured by POLDER to retrieve the aerosol single-scattering albedo (SSA) and the cloud optical thickness (COT). Passive sensor techniques that solely use total radiance measurements have also been used to obtain information on aerosols above clouds. Torres et al. (2012) have developed an algorithm to retrieve the ACAOT and the underlying COT, using radiance measurements performed in the ultraviolet (UV) range by the with Ozone Monitoring Instrument (OMI). Similar methods that can retrieve the above-cloud AOT and, simultaneously, the cloud properties have also been developed for the Moderate Resolution Imaging Spectroradiometer (MODIS) instrument (Jethva et al., 2013; Meyer et al., 2015a). For more methods, please refer to Tables 1 and 2 of Kacenelenbogen et al. (2019), which report earlier studies that observed AAC using passive and active satellite sensors.
Previous studies that aimed to analyse the impact of absorbing aerosols on the cloud properties and radiative forcing were based on the exploitation of several A-Train satellite observations and modelling. Costantino and Bréon (2013) used MODIS to retrieve aerosol and cloud properties, collocated with CALIOP estimates of aerosol and cloud altitudes. Their objective was to use the simultaneous satellite-retrieved aerosol and cloud properties to contribute to the knowledge of aerosol effect on low-level stratocumulus cloud microphysics (cloud droplet effective radius, reff), optical properties (COT) and liquid water path (LWP). Their results showed that the aerosol effects on the cloud microphysics are strong when the layers are in contact: effective radius can decrease from 15–16 down to 10–11 µm for an aerosol index that varies from 0.02 to 0.5, suggesting a potential indirect effect of aerosols. Wilcox (2010) also used the aerosol and cloud altitudes retrieved with CALIOP in combination with OMI aerosol index in order to analyse the link between the absorbing aerosols located above clouds and the marine stratocumulus cloud properties. His results showed that the presence of absorbing aerosol layers led to a heating (by nearly 1 K at 700 hPa) in the lower troposphere that stabilizes the atmosphere. This warming coincides with LWP values greater by more than 20 g m−2 and cloud-top altitude lower by 200 m in cases when high loadings of smoke are transported above the cloud. Sakaeda et al. (2011) obtained similar results using the Community Atmospheric Model 3.0 (CAM) constrained by satellite observations.
As mentioned above, the effect of aerosols on the cloud cover can be complex and indirect and can result from the modification of the atmospheric thermodynamics by the aerosol loading, e.g. a modification of atmospheric stability. But to go further, a difficulty and challenge in the analysis of aerosol effects on clouds comes from the fact that cloud properties are also, and often primarily, sensitive to meteorological conditions and corresponding atmospheric thermodynamics and dynamics. Studies dedicated to aerosol effects should thus aim to disentangle, if possible, aerosol effects on cloud properties from effects of meteorological conditions only (Brenguier and Wood, 2009; Stevens and Brenguier, 2009). A level of complexity comes from the fact that covariances exist between meteorological parameters and aerosol concentration and properties. Climatology of biomass burning events may coincide with changes in meteorological regimes. For example, Adebiyi et al. (2015) showed a shift southward in circulation patterns and thermodynamics between July–August and September–October, as the southern African anticyclone strengthens. Also, while the aforementioned studies depict dry smoke plumes, biomass burning aerosol events can be accompanied by varying water vapour production. Several studies (Clements et al., 2006; Parmar et al., 2008; Potter, 2005) suggest that depending on the moisture content of fresh biomass, the natural or anthropogenic biomass fires are releasing water vapour in the atmosphere (in addition to organic and black carbon, CO2 and CO; Levine, 1990), which can influence the atmospheric dynamics, and thus moisture transport. Without measurements of water vapour release from biomass burning in field conditions, however, it is difficult to constrain the effect on water vapour transport. It might be important to account for the effect of this accompanying moisture and to identify the different air circulation patterns that will lead the biomass burning transportation off the coast of southern Africa. This was performed by Adebiyi et al. (2015), who incorporated radiosonde measurements from St. Helena Island of temperature and specific humidity, MODIS AOT550 nm, CALIOP aerosol altitude data and reanalysis data (ERA-Interim) to provide a unique dataset of thermodynamic profiles linked to clear and polluted conditions. They also investigated the radiative effect of moisture and absorbing aerosol in different cloudy conditions at St. Helena. They show that the specific humidity (qv) is higher within the aerosol plumes (around 700 hPa). This was previously observed during the UK-SAFARI 2000 campaign (Haywood et al., 2003) with qv values larger than 2 to 4 g kg−1 within the aerosol layer, while outside the smoke plume the qv values are less than 1 g kg−1. The moisture may have a role in the aerosol ageing (Dubovik et al., 2002; Haywood et al., 2003; Kar et al., 2018) and a radiative significance in both shortwave and longwave spectra. Radiative transfer calculations show that mid-tropospheric moisture generates a net diurnal cooling of approximately 0.45 K d−1, decreasing the impact of the shortwave heating caused by the biomass burning aerosols that reaches 1.5 K d−1. As in Wilcox (2010), this study shows a decrease in the cloud-top altitude of about 112 m near St. Helena under polluted conditions.
Starting from all these studies, we have developed our own strategy in order to better understand the effect of aerosols and meteorological parameters on clouds. Our strategy exploits several satellite measurements and meteorological reanalysis data as constraints of a radiative transfer model. We focus on situations with large amounts of absorbing aerosols above the clouds and compare them with cases characterized by low values of absorbing AOT. Also, in order to minimize the meteorological impact, we analysed only a limited time period over a smaller area off the coast of Angola. Smoke layer elevated above the clouds can induce a semi-direct effect through an energetic forcing due to both the effects of biomass burning aerosol and water vapour. The semi-direct effect is defined as a change in the vertical profiles of temperature in the atmosphere due to the presence of absorbing aerosol layers located above clouds. This modification may affect the process of evaporation and cloud formation. We therefore developed a method to calculate the profiles of heating rates in the visible and thermal infrared by combining POLDER and CALIOP data as well as meteorological data. In Sect. 2, we present the different parameters used to estimate the AAC, cloud properties and the meteorological variables and some elements of climatology available for the southeastern Atlantic Ocean. We also describe the CALIOP–POLDER synergy and the radiative transfer calculations. Section 3 describes a “low and high approach”, which consists in distinguishing between two different aerosol-loading situations and analysing the difference in the statistic of cloud properties and meteorological parameters. We present this strategy in terms of selected area, time period and covariance between aerosol load and meteorological data. Section 4 shows the changes in cloud properties with respect to the aerosol loadings, the overall radiative effect of the smoke layer for the selected region and an attempt to separate the radiative effects of the biomass burning aerosols from those of the water vapour. Section 5 provides the conclusions and perspectives.
2.1 Description of the dataset
In this study, we use version 4.00 of the official output product PARASOL_PM02-L2 for AAC scenes (available at the ICARE website, http://www.icare.univ-lille1.fr/parasol/products/, last access: 13 December 2017) to retrieve the properties of aerosols above clouds. The parameters used in our study are the aerosol optical thickness, the aerosol single-scattering albedo and the aerosol-corrected cloud optical thickness. All these parameters are retrieved at a resolution of 6×6 km2 and available at 490 and 865 nm. We also use the Ångström exponent, which is primarily indicative of the particle size (i.e. with the AOT retrieved at 865 and 670 nm). The aerosol model prescribed by the POLDER satellite algorithm (i.e. particle size and absorption) is also used to extrapolate these optical properties over a large spectral range. The uncertainties associated with these variables are thoroughly described in Peers et al. (2015) and Waquet et al. (2013). The lidar CALIOP is primarily used to determine the aerosol layer vertical extent. We used level 2 version 3.01 of the inversion products, officially named CAL_LID_ L2_ 05kmALay, for the aerosol base and top altitudes, CAL_LID_L2_05kmCLay for the cloud-top altitude and CAL_LID_L2_ 05km_APro for the vertical profile of aerosol extinction at 532 nm (data can be found at http://www.icare.univ-lille1.fr/calipso/ products/, last access: 7 January 2018) (Vaughan et al., 2009; Young and Vaughan, 2009). Other cloud parameters considered are the cloud droplet effective radius, reff inferred by MODIS, the liquid water path (LWP), the cloud altitude (ZO2) and the aerosol-corrected cloud optical thickness (COT) retrieved with POLDER. ZO2 is calculated using the POLDER oxygen pressure method (POxygen), which is determined from differential absorption between two spectral bands centred on the oxygen A-band (763 and 765 nm) (Buriez et al., 1997; Vanbauce et al., 2003). In our study, the ZO2 product is used as a proxy for the cloud-top altitude estimate outside the CALIOP track. The liquid water path is computed with the homogeneous assumption, using POLDER COT and the MODIS reff:
where ρw is the water density. The MODIS reff bias for biomass burning aerosols above clouds (Meyer et al., 2015b) is expected to be of about 2 % on average and then should have a small effect on the LWP computation.
In order to estimate the main thermodynamic quantities of the atmosphere, we use the ERA-Interim product provided by the European Centre for Medium-Range Weather Forecasts (ECMWF) model (Berrisford et al., 2011). This reanalysis meteorological database delivers various parameters, including profiles of temperature (K), specific humidity (g kg−1), pressure (hPa), wind speed (m s−1), wind direction (∘) and ozone (atm-cm). The assimilating model is configured for 60 vertical levels, from the surface up to 0.1 hPa. The horizontal resolution of the products is 0.5∘ and the reanalysis data are provided every 6 h (Dee et al., 2011). In our study, these data were spatially and temporally collocated with the POLDER and CALIOP observations. All these parameters are summarized in Table 1.
2.2 Radiative transfer calculation and synergy CALIOP–POLDER
To compute fluxes and heating rates at different levels in the atmosphere, in the visible and also in the thermal infrared ranges, we use the Global Atmospheric ModEl (GAME), which is a fast and high-spectral-resolution radiative transfer code that allows the calculations of radiances (and fluxes) in horizontal and plan-parallel atmospheric layers (Dubuisson et al., 2006). The model accounts for the Rayleigh scattering effects and for the scattering and absorbing properties of clouds and aerosols that have to be computed over the different spectral intervals: 208 spectral intervals for the shortwave spectrum (from 220 nm to 4 µm) and 115 spectral intervals for the longwave spectrum (from 4 to 50 µm). This method allows the discretization of the radiation field in a finite number of propagation directions and allows us to efficiently compute the multiple scattering processes occurring in the atmosphere whatever the value of the optical thickness.
The GAME model requires information on the vertical distribution of aerosol and clouds, their optical and microphysical properties, and the vertical structure of the atmosphere. Inputs to GAME are the collocated POLDER, CALIOP and ERA-Interim re-analysis data for the temperature and humidity profiles, which are crucial for the radiative computation in the longwave spectrum.
In GAME the computation is made for plane-parallel layers of the atmosphere, each layer characterized by particular values of aerosol (or cloud) and meteorological parameters. We have divided the lower troposphere into 100 m thick layers from the surface up to 8 km. Above this altitude (up to 100 km) the layers are more roughly distributed, as the upper atmosphere is not under the influence of biomass burning aerosols and not in our field of interest. For each 100 m aerosol layer we provided the CALIOP extinction coefficient (σe, km−1 sr−1).

Figure 1Biomass burning study case: (a) CALIOP initial extinction coefficient (m−1) at 532 nm (σe,532 nm), (b) scaled CALIOP σe,532 nm as a function of latitude; (c) example of CALIOP extinction coefficient profile at 532 nm (blue) and the result of scaling (red) with the POLDER AOT extrapolated at 532 nm.
However, the standard CALIOP product can underestimate the geometrical thickness of the aerosol layer when the optical thickness is large enough, due to the attenuation of the backscattered signal (Jethva et al., 2014). It can also underestimate the AOT when aerosols are below a certain detection threshold (Kacenelenbogen et al., 2014; Watson-Parris et al., 2018). The CALIOP miscalculation of the aerosol bottom altitude would implicitly underestimate the aerosol extinction profile (i.e. the AOT), and hence the aerosol radiative forcing. A recent study that uses independent lidar backscattering measurements at 1064 nm of the Cloud-Aerosol Transport System (CATS) (Yorks et al., 2014) shows that the CALIOP algorithm probably overestimates the base of the aerosol layer by 500 m (Rajapakshe et al., 2017). Indeed, aerosol–cloud interaction is possible, but from our data, most of the retrievals show detached situations. Deaconu et al. (2017) showed that the CALIOP operational algorithm underestimates the AOT above clouds with a factor of 2 to 4 depending on the aerosol type, when compared to other methods dedicated for above-cloud aerosol retrievals – the POLDER polarization method (Waquet et al., 2009) and the CALIOP depolarization ratio method (DRM) (Deaconu et al., 2017; Hu et al., 2007). By analysing the consistency between the above-cloud aerosol retrievals from the POLDER method and CALIOP DRM, they also found good agreement for AOT retrievals when the microphysics of the aerosols are well defined (such as biomass burning aerosols) and when the aerosol layer is detached from the cloud. These results give confidence in our ability to measure the properties of AAC over the South Atlantic region using the POLDER method. Therefore, in our study we will use the POLDER AOT865 nm retrieved under the CALIOP track to scale the CALIOP σe profile used in GAME (Fig. 1). As the POLDER AOT is retrieved at 865 nm and the CALIOP σe is used at 532 nm, the σe scaling first requires an extrapolation of POLDER AOT at 532 nm. Afterwards, we infer the resulting CALIOP σe,scaled at 550 nm, which is the native wavelength used for AOT in the radiative transfer model. As mentioned before, the base of the aerosol layer is biased high, which means that the calculation of the heating rates is confined within a slightly thinner geometrical aerosol layer (by 500 m). This, however, does not alter the results and conclusions of our study.
We compute the instantaneous heating rate (HR) profiles (K d−1) in the shortwave and in the longwave domains (HRSW and HRLW). The first is due to the shortwave absorption of aerosols and water vapour. The second is the result of infrared absorption and emission processes and depends mainly on the profile of atmospheric component, cloud and water vapour, with their temperatures. In the longwave spectrum we considered a negligible effect of aerosols. The sum between HRSW and HRLW gives the total heating rate, referred to as HRtotal in the following.
2.3 Elements of climatology in the southeastern Atlantic Ocean
2.3.1 Meteorological patterns
The pattern of the atmospheric circulation plays a determinant role in the transport of aerosols emitted from the African continent. Meteorology and circulation patterns can also impact the stratocumulus clouds by changing the thermodynamic environment, regardless of the presence (or absence) of aerosols above clouds. Therefore, it is necessary to separate (or constrain) the effects of meteorology on clouds from the variations caused by AAC in order to study the aerosol effects on clouds in the SAO. In this area, the main atmospheric circulation is dominated by easterly winds throughout the air column and south-easterlies close to the surface, as shown in the study of Adebiyi et al. (2015) Figs. 8 to 10. From July to October the Southern Hemisphere is influenced by the Atlantic anticyclone between 600 and 800 hPa and the trade winds at the surface (with winds stronger than 5 m s−1). The September–October period presents differences compared to the July–August period, as different circulation patterns cause a maximum coverage of the stratocumulus clouds, and more importantly, a maximum in the continental aerosol loading transported westwards over the Atlantic basin, around 10∘ S. This region is also characterized by two different humidity and temperature regimes: larger values are found north of 20∘ S compared to the southern region. Adebiyi et al. (2015) also described a general increase in the mid-tropospheric moisture at 600 hPa during September–October, suggesting an association between the aerosol loading and moisture.
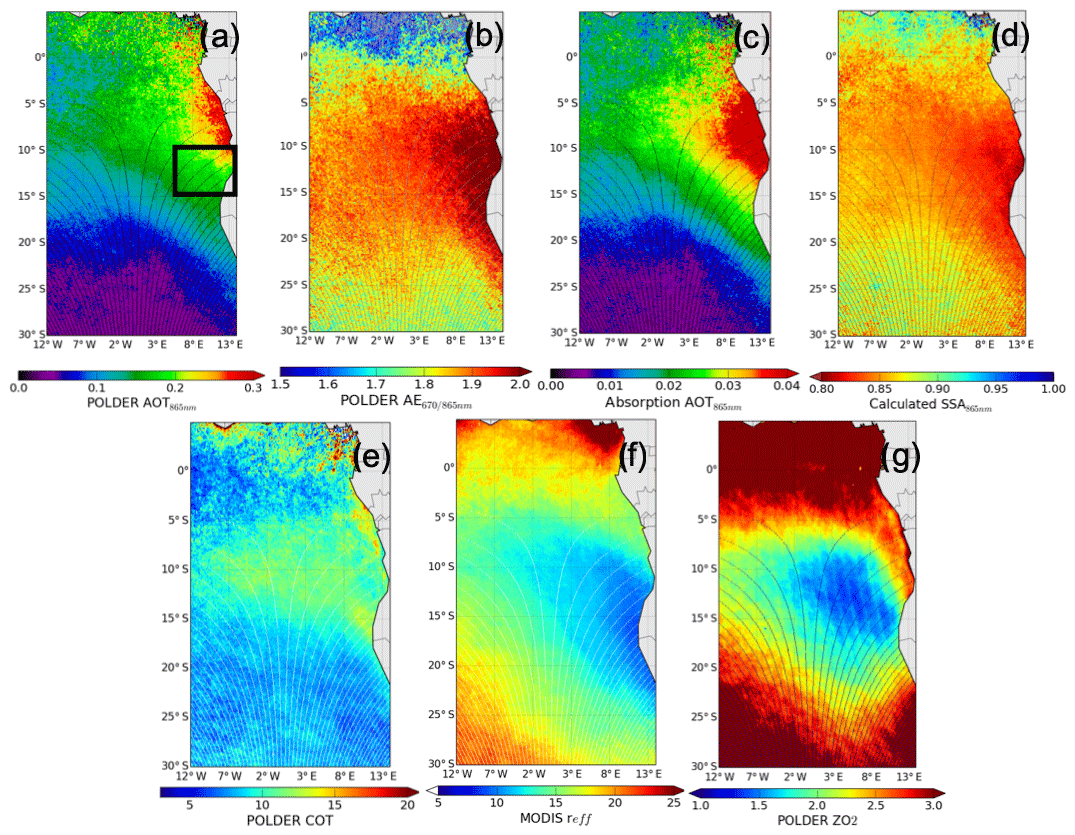
Figure 2Mean values of above-cloud aerosol and cloud properties above the South Atlantic Ocean, for a period of 6 months (May to October) from 2006 to 2009: (a) POLDER AOT865 nm. The black box represents the sample area close to Angola's coast described in Sect. 3.2; (b) POLDER AE670∕865 nm; (c) POLDER absorption AOT865 nm; (d) POLDER SSA865 nm; (e) POLDER COT (corrected for above-cloud absorbing aerosols); (f) MODIS effective radius, reff (µm); (g) POLDER cloud altitude (ZO2) derived from oxygen pressure (km).
2.3.2 Aerosol and cloud properties
The maps shown in Fig. 2 present the average values of different POLDER and MODIS aerosol and cloud retrievals at a horizontal resolution of 6×6 km2, acquired from May to October 2006 to 2009 over an area that extends from 30∘ S to 5∘ N and from 12∘ W to 14∘ E in the SAO.
Large aerosol loadings are found close to the coast, where the average above-cloud AOT exceeds 0.3 at 865 nm. Towards the west, the ACAOT decreases to an average of 0.2 at 865 nm due to transportation and deposition of aerosols (Fig. 2a). As expected, the mean values of the Ångström exponent (AE670∕865) along the shoreline are larger than 2.0, characteristic of very fine particles of smoke (Dubovik et al., 2002), while westwards the mean AE670∕865 values slightly decrease to around 1.85 (Fig. 2b). This suggests an increase in the particle size, as the plume is transported towards the open sea. The decrease in the mean AE values with longitude can suggest the evolution of the aerosol properties, such as growth of the smoke aerosols associated with ageing (Kar et al., 2018; Müller et al., 2007; Waquet et al., 2013; Reid et al., 1998). Also, between 0 and 5∘ N, the values of the AE670∕865 decrease to 0.4 (not shown on the colour scale), which correspond to values prescribed for the dust model in the POLDER algorithm, indicating that dust particles could be preferentially transported above clouds over this area.
Information related to the absorption property of the aerosols is given by the single-scattering albedo and/or by the absorption AOT865 nm, which is the product of the extinction (total) AOT by (1 – SSA). For this region we observe high values of absorption AOT865 nm, which exceed 0.04 close to the coast (Fig. 2c) and decrease progressively westwards. These estimates are consistent with the values retrieved for the SSA865 nm of 0.80 at seashore that increase to 0.87 around 12∘ W (Fig. 2d). The observations are in agreement with the typical values provided by AERONET (Dubovik et al., 2002; Sayer et al., 2014) and the field campaigns Southern African Regional Science Initiative (SAFARI-2000; Leahy et al., 2007; Swap et al., 2002), ObseRvations of Aerosols above CLouds and their intEractionS (ORACLES-2016; Pistone et al., 2019) and Dust and Biomass Experiment (DABEX; Johnson et al., 2008) for the biomass burning aerosols. North of the latitude of 5∘ S, the SAO region is under the influence of dust particles and the retrieved SSA865 nm is up to 0.97, which is expected for mineral dust particles that do not absorb much light in the near-infrared range (Dubovik et al., 2002).
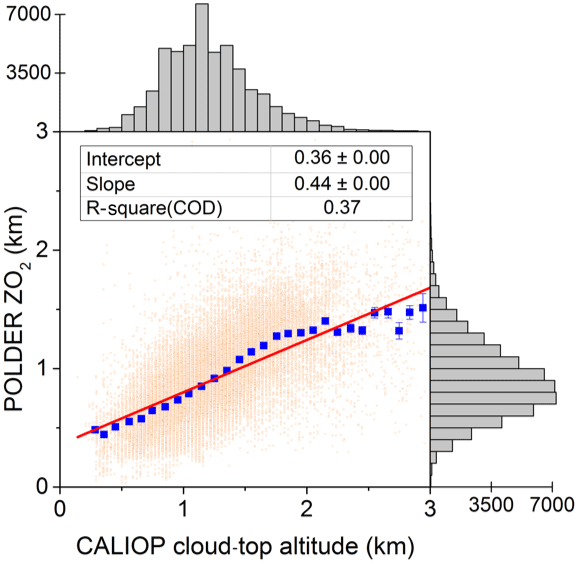
Figure 3POLDER cloud altitude (ZO2) compared to CALIOP cloud-top altitude, over a period of 6 months (May to October) from 2006 to 2010 along the CALIOP track. Lateral histograms show the data distribution.
Low-level stratocumulus clouds typically cover the South Atlantic Ocean. Generally, these clouds are characterized by rather small droplets (reff of approximately 10 µm) and by optical thickness values of around 10–15 (Szczodrak et al., 2001). In the presence of above-cloud biomass burning aerosols, MODIS-retrieved COT can be underestimated by more than 20 %, especially over bright clouds with large COT (Haywood et al., 2004; Peers et al., 2015). Figure 2e presents the mean POLDER COT that was corrected for the aerosol-induced bias due to aerosol above–cloud absorption (Peers et al., 2015). The MODIS cloud droplet effective radius (reff) (Fig. 2f) is increasing from the coast towards the open sea, from 10 to 15 µm. In Fig. 2g we observe a minimum cloud altitude of 1.2 km central to the stratocumulus deck, which increases radially as the stratocumulus transition into cumulus clouds or when the frequency of other types of clouds increases (Warren et al., 1988). Figure 3 compares the POLDER ZO2 product with the CALIOP cloud-top altitude (CTA). In the case of geometrically thick clouds, the oxygen pressure method mainly indicates the cloud middle pressure (Ferlay et al., 2010) instead of cloud-top pressure. This explains the difference that we observed between POLDER ZO2 and CALIOP (CTA) over a period of 6 months (May to October) from 2006 to 2010 along the CALIOP track: the two altitude measurements are well correlated but ZO2 is lower than CTA. From the side histograms, we notice that the majority of CTA values are centred around 1.25 km, while ZO2 values are centred around 0.9 km. The difference between the products increases systematically when CTA exceeds 1.5 km. In this region an underestimation of around 300 m by the POLDER product is more likely.
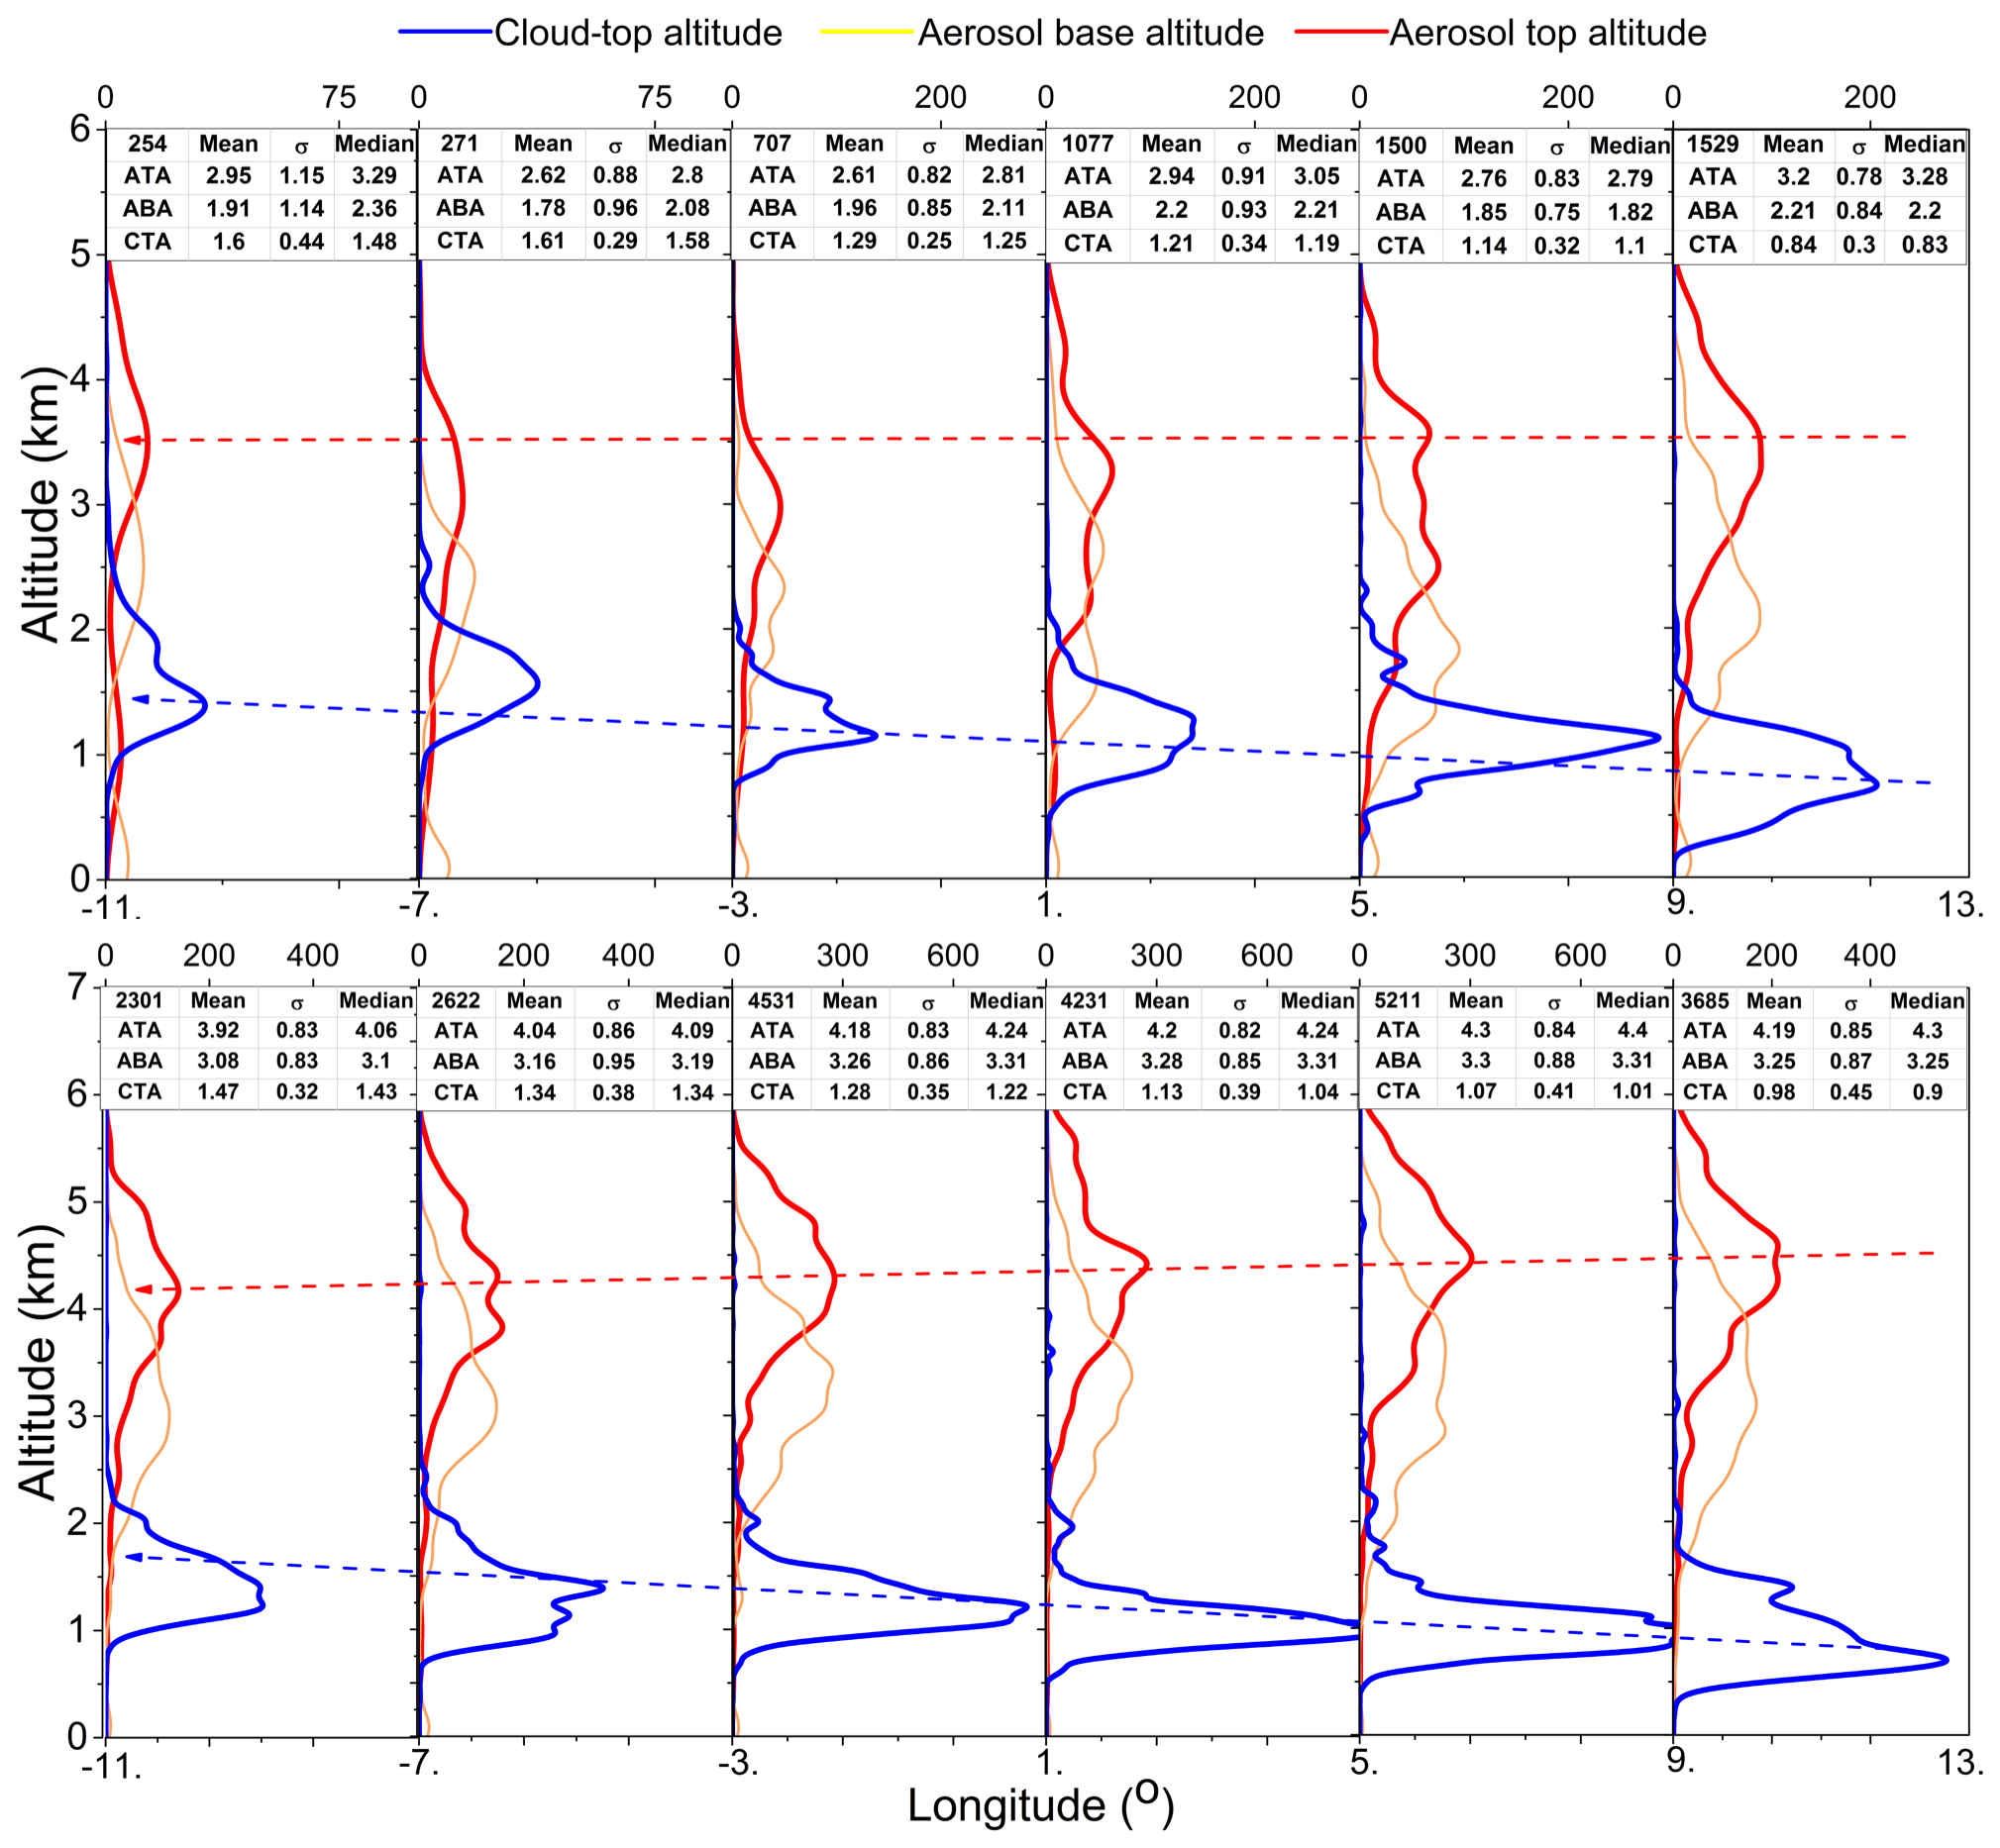
Figure 4First and second rows of the panel present the histograms of the cloud-top altitude (CTA), the aerosol top altitude (ATA) and the aerosol base altitude (ABA) retrieved using CALIOP, as a function of longitude for two time periods: first row (May to July) and second row (August to October) from 2006 to 2010. The mean, median and standard deviation over 4∘ of longitude as well as the number of measurements are shown in the associated tables. The selected area extends from 30∘ S to 5∘ N and 12∘ W to 14∘ E over the South Atlantic Ocean (SAO).
Figure 4 shows the variation with longitude of cloud and aerosol altitudes retrieved with CALIOP over the South Atlantic for a period of 6 months (May to October) from 2006 to 2010. We reported the mean values of cloud-top altitude, aerosol top altitude (ATA) and aerosol base altitude (ABA) for longitude bins of 4∘. The data are shown for May–July in the first row and for August–October in the second row. The mean, standard deviation and median, as well as the number of measurements for each 4∘ bin are provided in the associated tables. For both time periods, we notice the cloud-top altitude increasing from 1 to 1.5 km towards the west. This suggests that the clouds develop and become more convective further away from the coast. The average aerosol top altitude is higher during the second interval (August–October), and we observe a higher number of AAC situations. This is likely due to the fact that the biomass burning events that reach higher altitudes are most frequent during the late austral winter. We also observe a double layer aerosol profile in the first period, mainly west of 1∘ E (upper left profiles): one mode around 3.0 km and another around 1 km, which are likely to correspond to sea salt aerosols located in the boundary marine layer. In the first period the aerosol base and top altitudes do not show strong variability across the longitude, while in the second period the average aerosol altitude decreases from east to west. This suggests that contact situations between the cloud and the aerosol layers are less frequent close to the coast and increase as the aerosols are transported westwards.
3.1 Strategy of analysis
One objective of the current study is to analyse the changes in cloud properties with aerosol loading and absorption, as previously observed (e.g. Wilcox, 2010) and if these differences can be understood and attributed to the overlying aerosols or to the meteorological variability. We also consider the potential effect of the water vapour and its variability. Another objective is to evaluate the radiative forcing of smoke events, which could help in understanding the impact of atmospheric processes that lead to differences in cloud properties. We propose a low and high approach, which consist in distinguishing between two different smoke loading situations and analysing the difference in the statistic of cloud properties and meteorological parameters, for a selected temporal and spatial domain. In the following, for the high cases the above-cloud absorption AOT865 nm is larger than 0.04, while the low cases are characterized by absorption AOT865 nm lower than 0.01. In this section, we first justify the choice of the sample area and time period selected for this study. We then analyse the covariance relationship between the aerosol load and the water vapour content and explore the meteorological patterns for the selected area in function of the high and low scenarios. Analysis of the differences in cloud properties will follow in Sect. 4.
3.2 Selection of a sample area and time period
We selected a region close to Angola's coast that expands from 15 to 10∘ S and 6 to 14∘ E (Fig. 2a – black box), which is close to the main stratocumulus region identified by Klein and Hartmann (1993). The spatial size of the domain is limited in order to control the natural variability of cloud properties and meteorology. Also, the domain is close to the coast so that aerosol loading is high (Fig. 2) and aerosols are mainly detached from low-level clouds (Figs. 4 and 5). This is important in order to minimize the microphysical interactions between aerosols and cloud droplets (i.e. indirect effect) and the probability of aerosols within the clouds, which could affect the retrieval of aerosol properties with the POLDER polarization method (Deaconu et al., 2017).
The variability of meteorological parameters in this sample area is emphasized in Fig. 6, which presents ERA-Interim monthly mean meteorological parameters from June to October 2008. We can observe that the temperature profile does not change much throughout this period, while the relative humidity (RH) and the specific humidity (qv) change from month to month. In June and July, moisture levels are comparable, with values of qv lower than 2.5 g kg−1 at 700 hPa, in contrast with August and September where qv reaches 5 g kg−1 at 700 hPa. In October, RH shows a strong peak between 700 and 500 hPa, and qv is also larger compared to previous months. The average monthly horizontal winds show a significant difference between the months of SO compared to JJA. The winds are much stronger in SO and much more westwards above 800 hPa. The wind speed also increases above 800 hPa during these months. Winds in August differ from the winds in June–July, but not significantly below 800 hPa.

Figure 5Mean cloud-top altitude, aerosol base altitude and aerosol top altitude retrieved with CALIOP operational product, as a function of longitude, between 6 and 13∘ E for June–August 2008. Vertical bars represent the standard deviation.
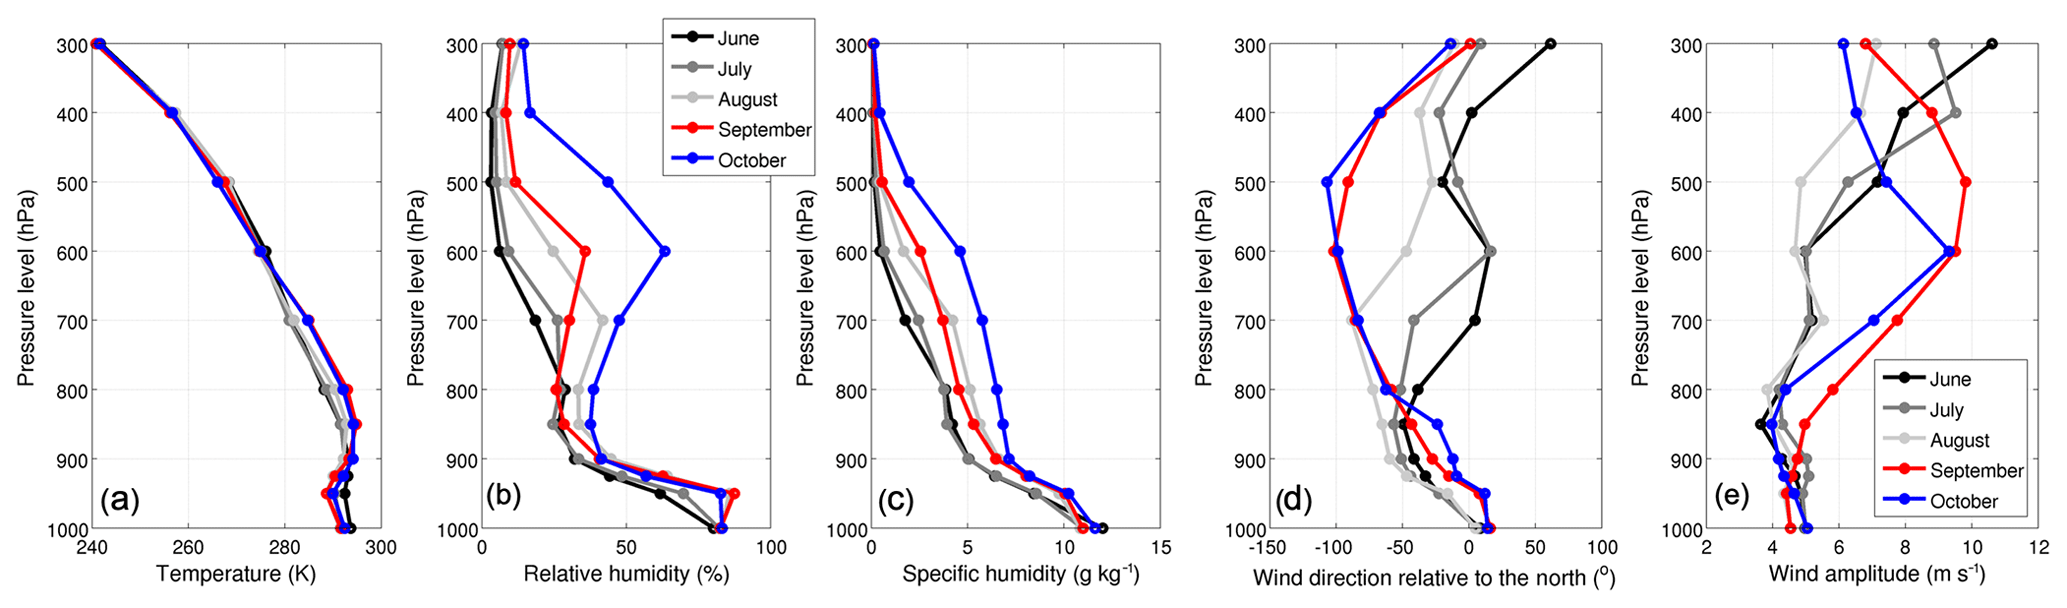
Figure 6Monthly mean meteorological parameters computed with ERA-Interim models at 12 h UTC, from June to October 2008, over the sample area: (a) temperature (K); (b) relative humidity (%); (c) specific humidity (g kg−1); (d) wind direction relative to the north (∘); (e) wind amplitude (m s−1).
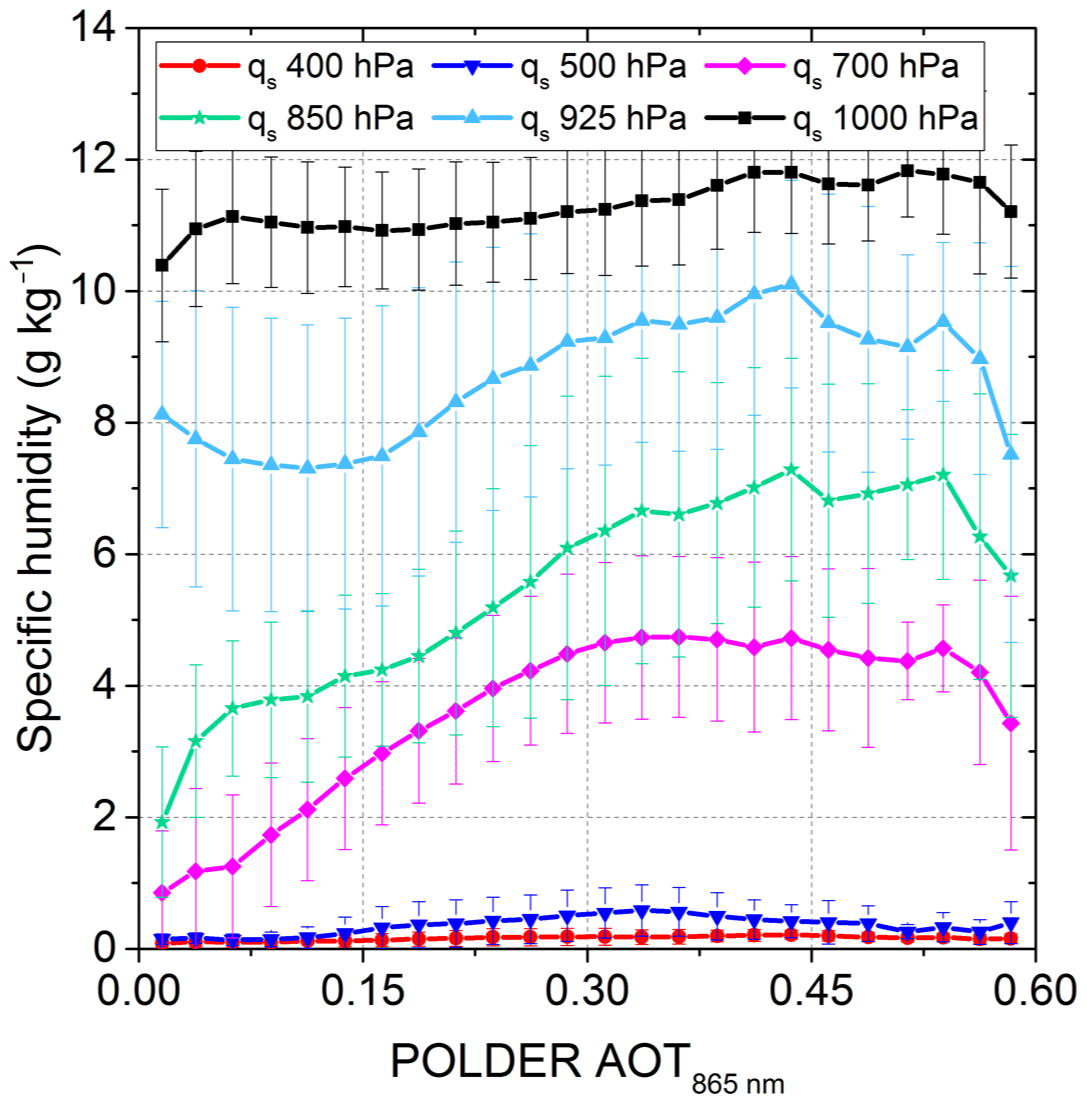
Figure 7Mean specific humidity as a function of POLDER AOT865 nm retrieved at different pressure levels, within the selected region over June–August 2008. The vertical bars represent the standard deviation for the specific humidity.
Knowing these temporal variations in mean meteorological parameters, we chose to analyse the aerosol and cloud parameters and their correlation over the months of June to August (JJA) 2008. Doing so, we mostly select one meteorological regime characterized by few differences at the cloud altitudes in terms of wind, temperature, and humidity and a moderate water vapour content at the aerosol layer.
3.3 Covariance between humidity and aerosol loading
We analysed the mean values of the specific humidity from June to August 2008 over the sampling area, at different pressure levels, as a function of the aerosol loading. Figure 7 shows the ERA-Interim qv values at six pressure levels as a function of the POLDER AOT at 865 nm. At the surface and at 950 hPa, the average qv is almost constant, varying slightly with the AOT from 10 to 12 g kg−1 and from 7.5 and 10 g kg−1, respectively. Higher in altitude, at 500 and 400 hPa the mean values of qv are very small, regardless of the aerosol loading. On the other hand, at the smoke plume level (i.e. between 850 and 700 hPa) we notice a strong increase in the qv with the AOT, from 2 to 7 g kg−1 and from 1 to 5 g kg−1, respectively. So, there is a covariance between humidity and aerosol loading at aerosol's altitudes, which confirm previous findings from Adebiyi et al. (2015).
An interpretation of the humidity reinforcement with larger biomass burning AOT could originate from combustion processes. Depending on the fire intensity and the meteorological conditions, smoke parcels can be saturated with water vapour and the latent heat resulting from the condensation of the water vapour can enhance the vertical development of convection due to additional buoyancy. It is possible that smoke and water vapour released during biomass combustion are both advected at higher altitudes, which contributes to the humidity in the aerosol plumes. Through laboratory measurements and experimental studies scientists have attempted to confirm that water vapour from wildland or grass fires can significantly modify the dynamic of the lower troposphere. Some of their results suggested that the fuel moisture could make a significant contribution to the humidity within the aerosol plumes resulting from biomass combustion (Clements et al., 2006; Hudspith et al., 2017; Parmar et al., 2008).
3.4 Meteorological patterns for high and low situations
We investigate the mean temperature, specific humidity, relative humidity and atmospheric subsidence provided by ERA-Interim, over JJA 2008, for smoke situations with high and low absorption and loading. Because of the covariance between aerosol and water vapour, in our study smoke loading means aerosol and water vapour loading.
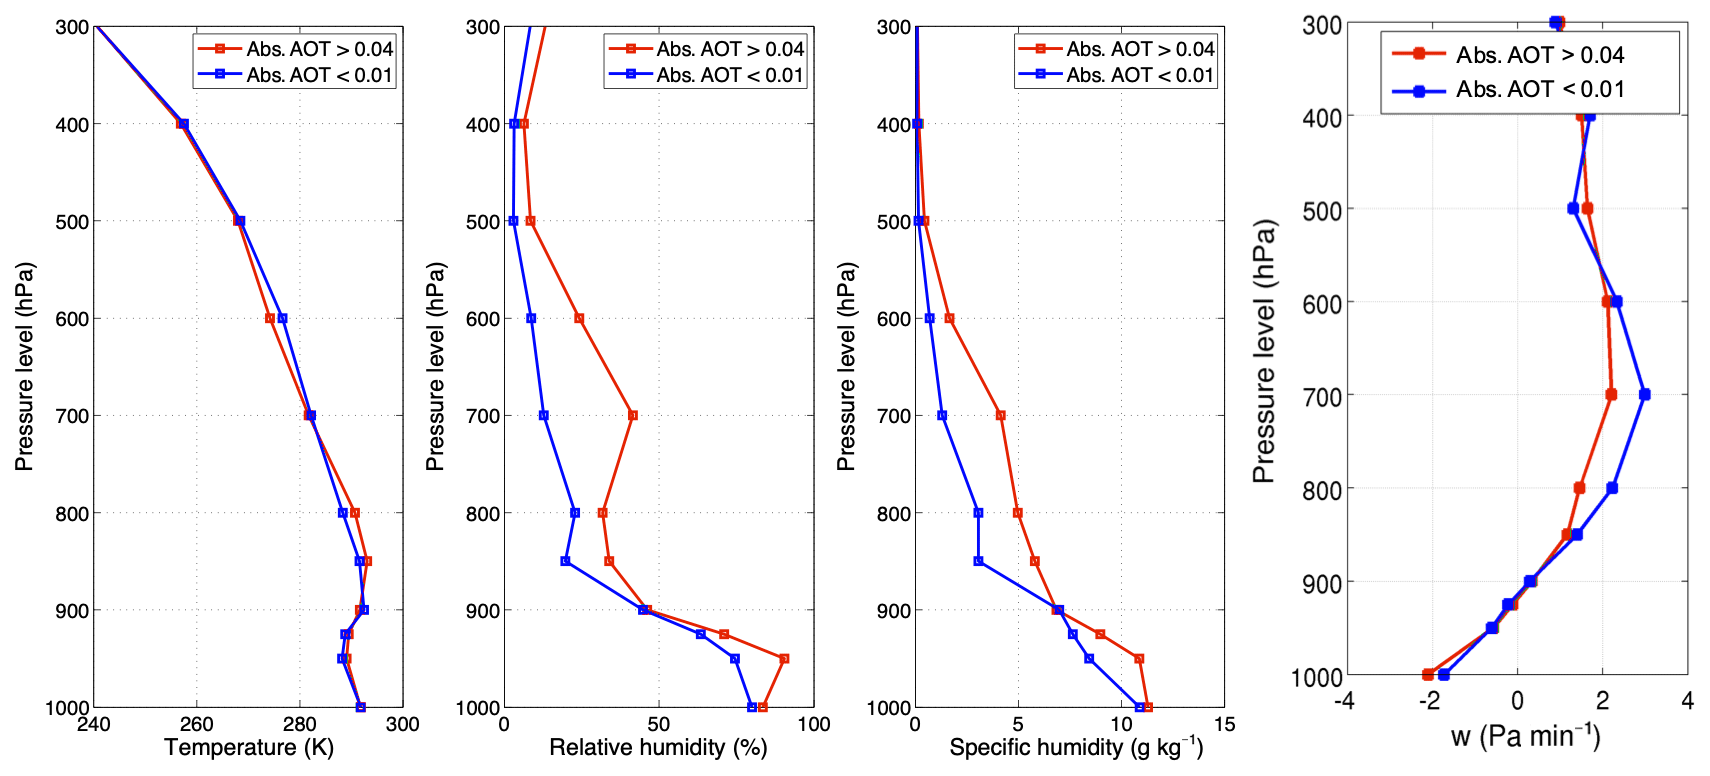
Figure 8Mean values of (a) temperature profile and (b) relative humidity profile, (c) specific humidity profile and (d) atmospheric subsidence at noon, w (downwelling wind, Pa min−1), within the sample region, from June to August 2008 selected for two situations: POLDER absorption AOT865 nm smaller than 0.01 (red lines, mainly June–July 2008) and POLDER absorption AOT865 nm larger than 0.04 (blue lines, mainly August 2008).
Figure 8a shows that the temperature profile is almost identical between high and low cases throughout the atmospheric column. In both cases, we notice a temperature inversion, called subsidence inversion, that occurs as result of adiabatic compression when high-pressure systems sink the upper air layers. A moderate to strong temperature inversion almost always caps stratocumulus clouds located under a high-pressure centre (such as the South Atlantic anticyclone). When smoke layers heated by the solar radiation cover low-level stratocumulus clouds, the temperature inversion is strengthened (Kaufman et al., 2005). In our case, we can observe a small increase by 1 K at 850 hPa for high smoke loadings.
The average humidity profiles (Figs. 8b and 7c) show some significant differences between the two cases. For the high cases the average relative humidity (RH) is almost saturated at the cloud level and presents a strong peak at 700 hPa (RH ≈40 %). The RH difference between high and low situations reaches a maximum between 800 and 600 hPa, where the smoke layer resides. Also, the specific humidity is higher (up to 2.5 g kg−1) everywhere throughout the air column for the smoke cases and we notice an increase in qv by 300 % at 700 hPa compared with only 35.7 % at 925 hPa (pressure level mostly associated with the cloud level). Conversely, subsidence is stronger by about 1 Pa min−1 at 700 hPa when low loadings of aerosols are present above the clouds (mainly during June–July). It confirms the description of Adebiyi et al. (2015) (see Fig. 15) that the large-scale subsidence decreases when aerosol loadings are higher, which would tend to push the cloud to rise in altitude.
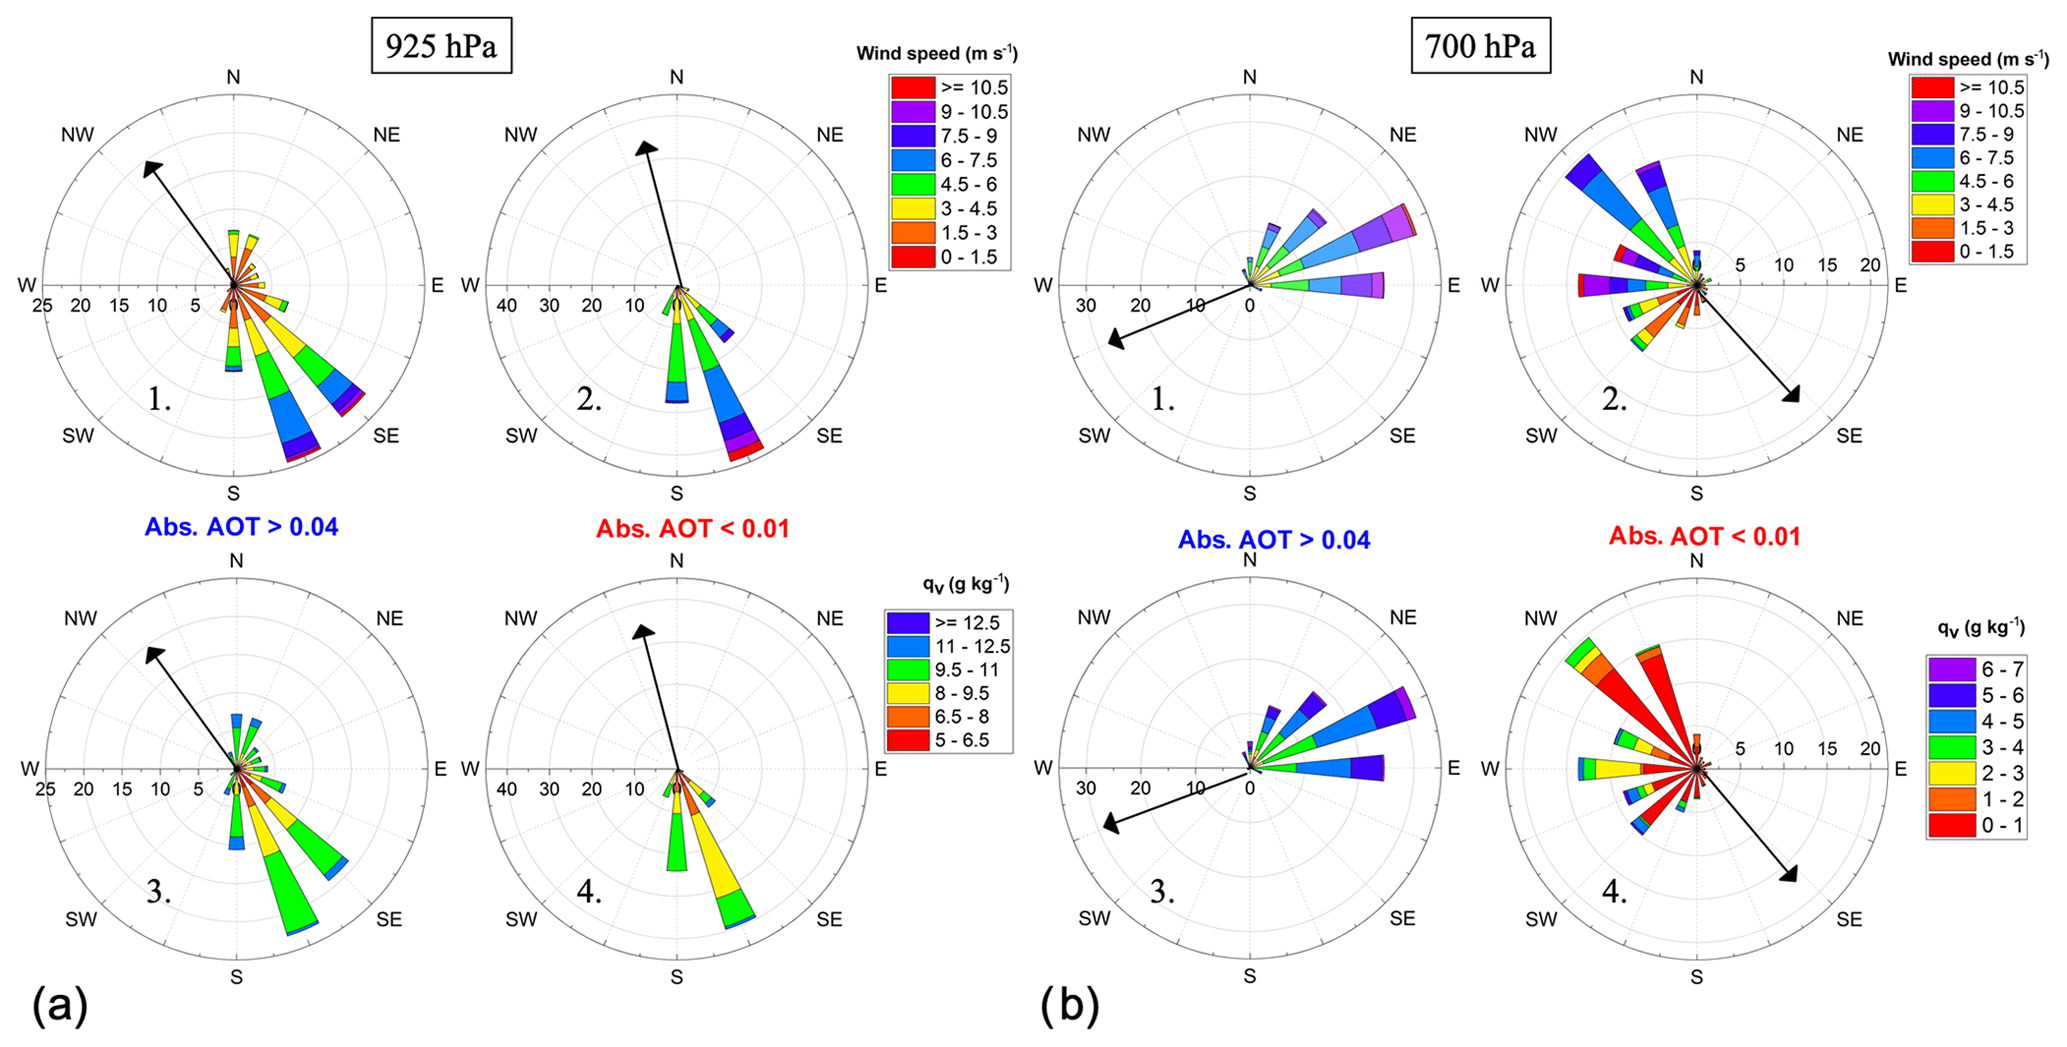
Figure 9Wind speed rose (1–2) and specific humidity rose (3–4) at 925 hPa (a) and 700 hPa (b) for situations with absorption AOT larger than 0.04 (1–3) and with absorption AOT smaller than 0.01 (2–4). The radius shows the frequency of wind direction. The arrow represents the main wind direction.
The meteorological database allows us to compute wind speed roses and specific humidity roses, representative for high- and low-aerosol situations. This will give information on the circulation of air masses (e.g. wind direction) that cause the humidity and the aerosols close to the coast. Figure 9 presents the frequency distribution of these parameters over the sample area in the JJA 2008 period, for two pressure levels: 925 hPa – mainly corresponding to the cloud-top altitude (Fig. 9a) – and 700 hPa – where aerosols are found (Fig. 9b). At 925 hPa we notice that both situations are characterized by south-easterly winds, with wind speeds of 6 to 9 ms−1 for more than 50 % of the cases and with specific humidity that is usually larger than 9 g kg−1. Figure 9b shows that the meteorological parameters at 700 hPa are, however, very different for the two conditions. It is obvious that the air masses carrying high loads of smoke are predominantly coming from the land (direction E–NE), while the air circulation responsible for low absorption AOT is originating from the open ocean (main direction W–NW). Even if it was expected, it can be considered an interesting result because it shows the consistency between the POLDER AOT retrievals and the ERA-Interim meteorological parameters. The wind speed is generally 1–2 m s−1 higher in the case of larger-absorption AOT and the qv is 4 to 6 times larger for these cases.
To conclude, few meteorological differences are found between the high and low situations at lower altitudes and where the clouds reside: similar temperature inversion, similar wind direction and specific humidity. However, humidity close to the surface is higher for the high cases. At 700 hPa the wind direction and moisture are very different for the two situations: easterlies are associated with larger AOTs and larger humidity values, while the wind coming from the open ocean is characterized by low values of AOT and humidity. We consider these differences when we analyse the change in cloud properties between the low- and high-smoke-loading situations.
4.1 Difference in cloud properties
We follow our strategy and analyse here the variation in cloud parameters for different scenarios of smoke (aerosol and water vapour) loadings, between June and August 2008. The variations in cloud parameters are analysed as a function of longitude and as a function of meteorological parameters. By choosing a particular time period and a spatial domain, we showed in the previous section that we reduced the meteorological variability and thus its potential effect on cloud properties.
Figure 10 presents different cloud properties as a function of longitude for the two AOT conditions. We observe a westwards evolution of some parameters with longitude, regardless of the high or low situations. For example, POLDER COT, MODIS reff and LWP show an increase westward (panels a, b and d) that might result from changes in cloud optical and microphysical properties, driven by changes in sea surface temperature (SST) and meteorological conditions away from the coast (also consistent with the fact that the wind direction is mostly westwards).

Figure 10Mean values of POLDER COT (a), MODIS reff, (b) POLDER ZO2 (c) and liquid water path (LWP) (d) as a function of longitude. Mean values of LWP as a function of meteorological parameters: surface wind speed (e) and sea surface temperature (SST) (f) are also presented. The data are separated into situations with POLDER absorption AOT865 nm smaller than 0.01 (red lines) and with POLDER absorption AOT865 nm larger than 0.04 (blue lines).
Most of the parameters display a difference between the low and high situations, as there is a visible gap between the values corresponding to the two situations, independently of longitude. MODIS reff increases from E to W from 6.5 to 11 µm when the aerosol loading is low. One can also observe a weaker increase when the aerosol loading is high, from 8 to 10 µm (Fig. 10b). This difference may suggest that the cloud microphysics are different for the situations with and without aerosols. Due to the bias in the CALIOP retrievals of aerosol base altitude, we cannot exclude the possibility of aerosol–cloud contact cases that could lead to a reduction of reff for the polluted cases. We also notice thicker clouds when the absorption AOT is larger than 0.04, as POLDER COT corrected from absorption increases by approximately 3 units along the longitude (Fig. 10a). As a result, the inferred LWP is systematically larger by approximately 20 g m−2 (Fig. 10d), from E to W over the interest area. This increase is significant here, as it represents between 33 % and 66 % larger LWP: +20 g m−2 is 66 % more LWP in the E and 33 % in the W. When analysing the LWP as a function of the SST and the surface wind speed (Fig. 10e and f), we notice that the difference between the low and high situations is almost independent of longitude. As in Fig. 10d, the results show a difference in the liquid water path for the two scenarios regardless of the meteorological conditions, with LWP being systematically larger for the high cases. LWP increases with surface wind speed away from the coast (Fig. 10e) but behaving very differently as a function of SST (Fig. 10f). For the low case, LWP clearly decreases with SST, while a tendency is much less clear in the high case.
Another cloud parameter we analysed is the POLDER cloud altitude, ZO2 (Fig. 10c). In the case of low absorption/burden ZO2 slightly increases with longitude, while in the high cases we observe slightly lower cloud altitudes that remain under 1 km. It is unlikely that the lower cloud altitudes are the result of stronger atmospheric subsidence. As Fig. 8d shows, the subsidence is lower (with 1 Pa min−1) for polluted situations while cloud altitudes are also lower. The small altitude difference might be the result of enhanced convection away from the coast in the low situation. The effect of an upper level of aerosol on the estimate of cloud altitude derived from oxygen pressure is questionable.
The analysis of the cloud parameter variation over the zone shows a common feature of their variations – a westward increase in cloud parameters. Significant differences between the low- and high-aerosol situations, with a larger LWP for the high case, remain for different meteorological conditions (wind, SST). These results do not contradict a “cloud thickening” effect described by Wilcox (2010), who obtained from microwave measurements an increased LWP by 20 g m−2 and an around 200 m decrease in the cloud-top altitude retrieved with CALIOP.
The last parameter that we analysed is the variation in the specific humidity at 925 hPa as a function of longitude over the zone, corresponding to the results presented in Sect. 3.3 and 3.4 (Fig. 11a). Not surprisingly after the previous results, the humidity is higher when large loads of absorbing aerosols are present above clouds. It is also rather constant on average along the longitude with values between 8.5 and 10 g kg−1. Its variation is very different in the low case, with a westward increase from 5.5 to 9 g kg−1. This difference is not directly understandable as the wind direction and amplitude are not very different between the two cases (see Fig. 9a).
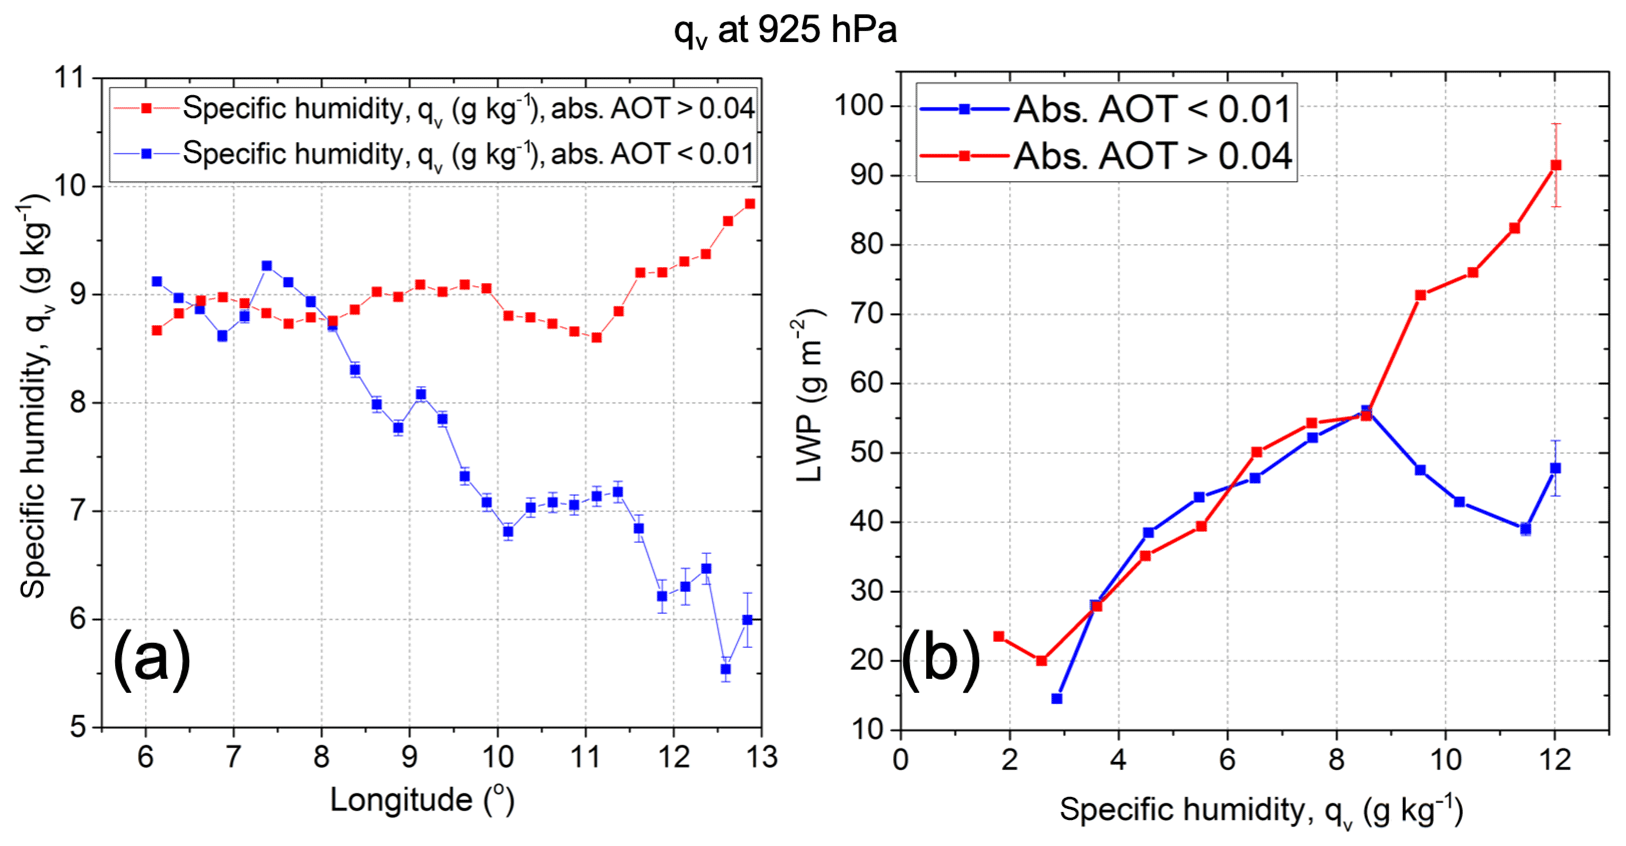
Figure 11Mean values of specific humidity at 925 hPa as a function of longitude (a) and LWP versus ERA-Interim specific humidity at 925 hPa (b). The data are separated into situations with POLDER absorption AOT865 nm smaller than 0.01 (red lines) and with POLDER absorption AOT865 nm larger than 0.04 (blue lines).
Furthermore, we studied the covariance between the specific humidity and the LWP because of very obvious physical links. Figure 11b shows the relationship between LWP computed for the high and low situations as a function of the specific humidity at 925 hPa. We notice that in both cases, the average LWP increases linearly with qv up to 55 g m−2 at 9 g kg−1, where a shift occurs. In the low case a decrease in LWP with larger humidity is observed, while in the high case the LWP increase is not perturbed. It is one additional argument that shows the difference between the two smoke loading situations. One interpretation is that processes leading to some negative feedback could be significantly perturbed by the presence of the smoke layers overlying the stratocumulus cloud layer. In Sect. 4.4 we will analyse this figure in more depth, with a discussion about the actual location of this pressure level compared with the cloud-top altitude. We make the link with the study of the smoke radiative forcing and the potential forcing of cloud-top processes and feedbacks. In addition, we have also considered a second hypothesis related to the loss of precipitable water that could explain this behaviour.
4.2 Overall radiative impact of the smoke layers
Our hypothesis is that a smoke layer elevated above the clouds can induce a semi-direct effect through a change in the radiative budget above the cloud and/or at cloud top. More precisely, the presence of a layer-containing aerosol within a moisture profile will modify the radiative heating rates in the atmospheric column, as a consequence of radiative processes that are absorption, scattering and emission of radiation. This is also the case when high-level clouds overly stratocumulus clouds (Christensen et al., 2013). If the heating rates vary at the cloud level, they will directly impact cloud processes and development. Stratocumulus clouds are characterized by a strong cloud-top cooling, which is the result of a radiative and evaporative cooling. Both act as drivers to create cloud-top turbulence, mixing in the cloud layer and small-scale dry air entrainment (Zuidema et al., 2009). Modification of radiative heating rates at the cloud top and its surroundings would eventually modify cloud-top processes, the thermodynamic state of entrained air and its impact on clouds (Bretherton et al., 2004).
Figure 12 presents our results of the smoke layer's overall radiative effect estimated over the sample area close to Angola's coast and for the entire period of June to August 2008. The simulations were performed for individual CALIOP tracks, thus considering the variability of aerosol and cloud properties as well as their different altitudes.
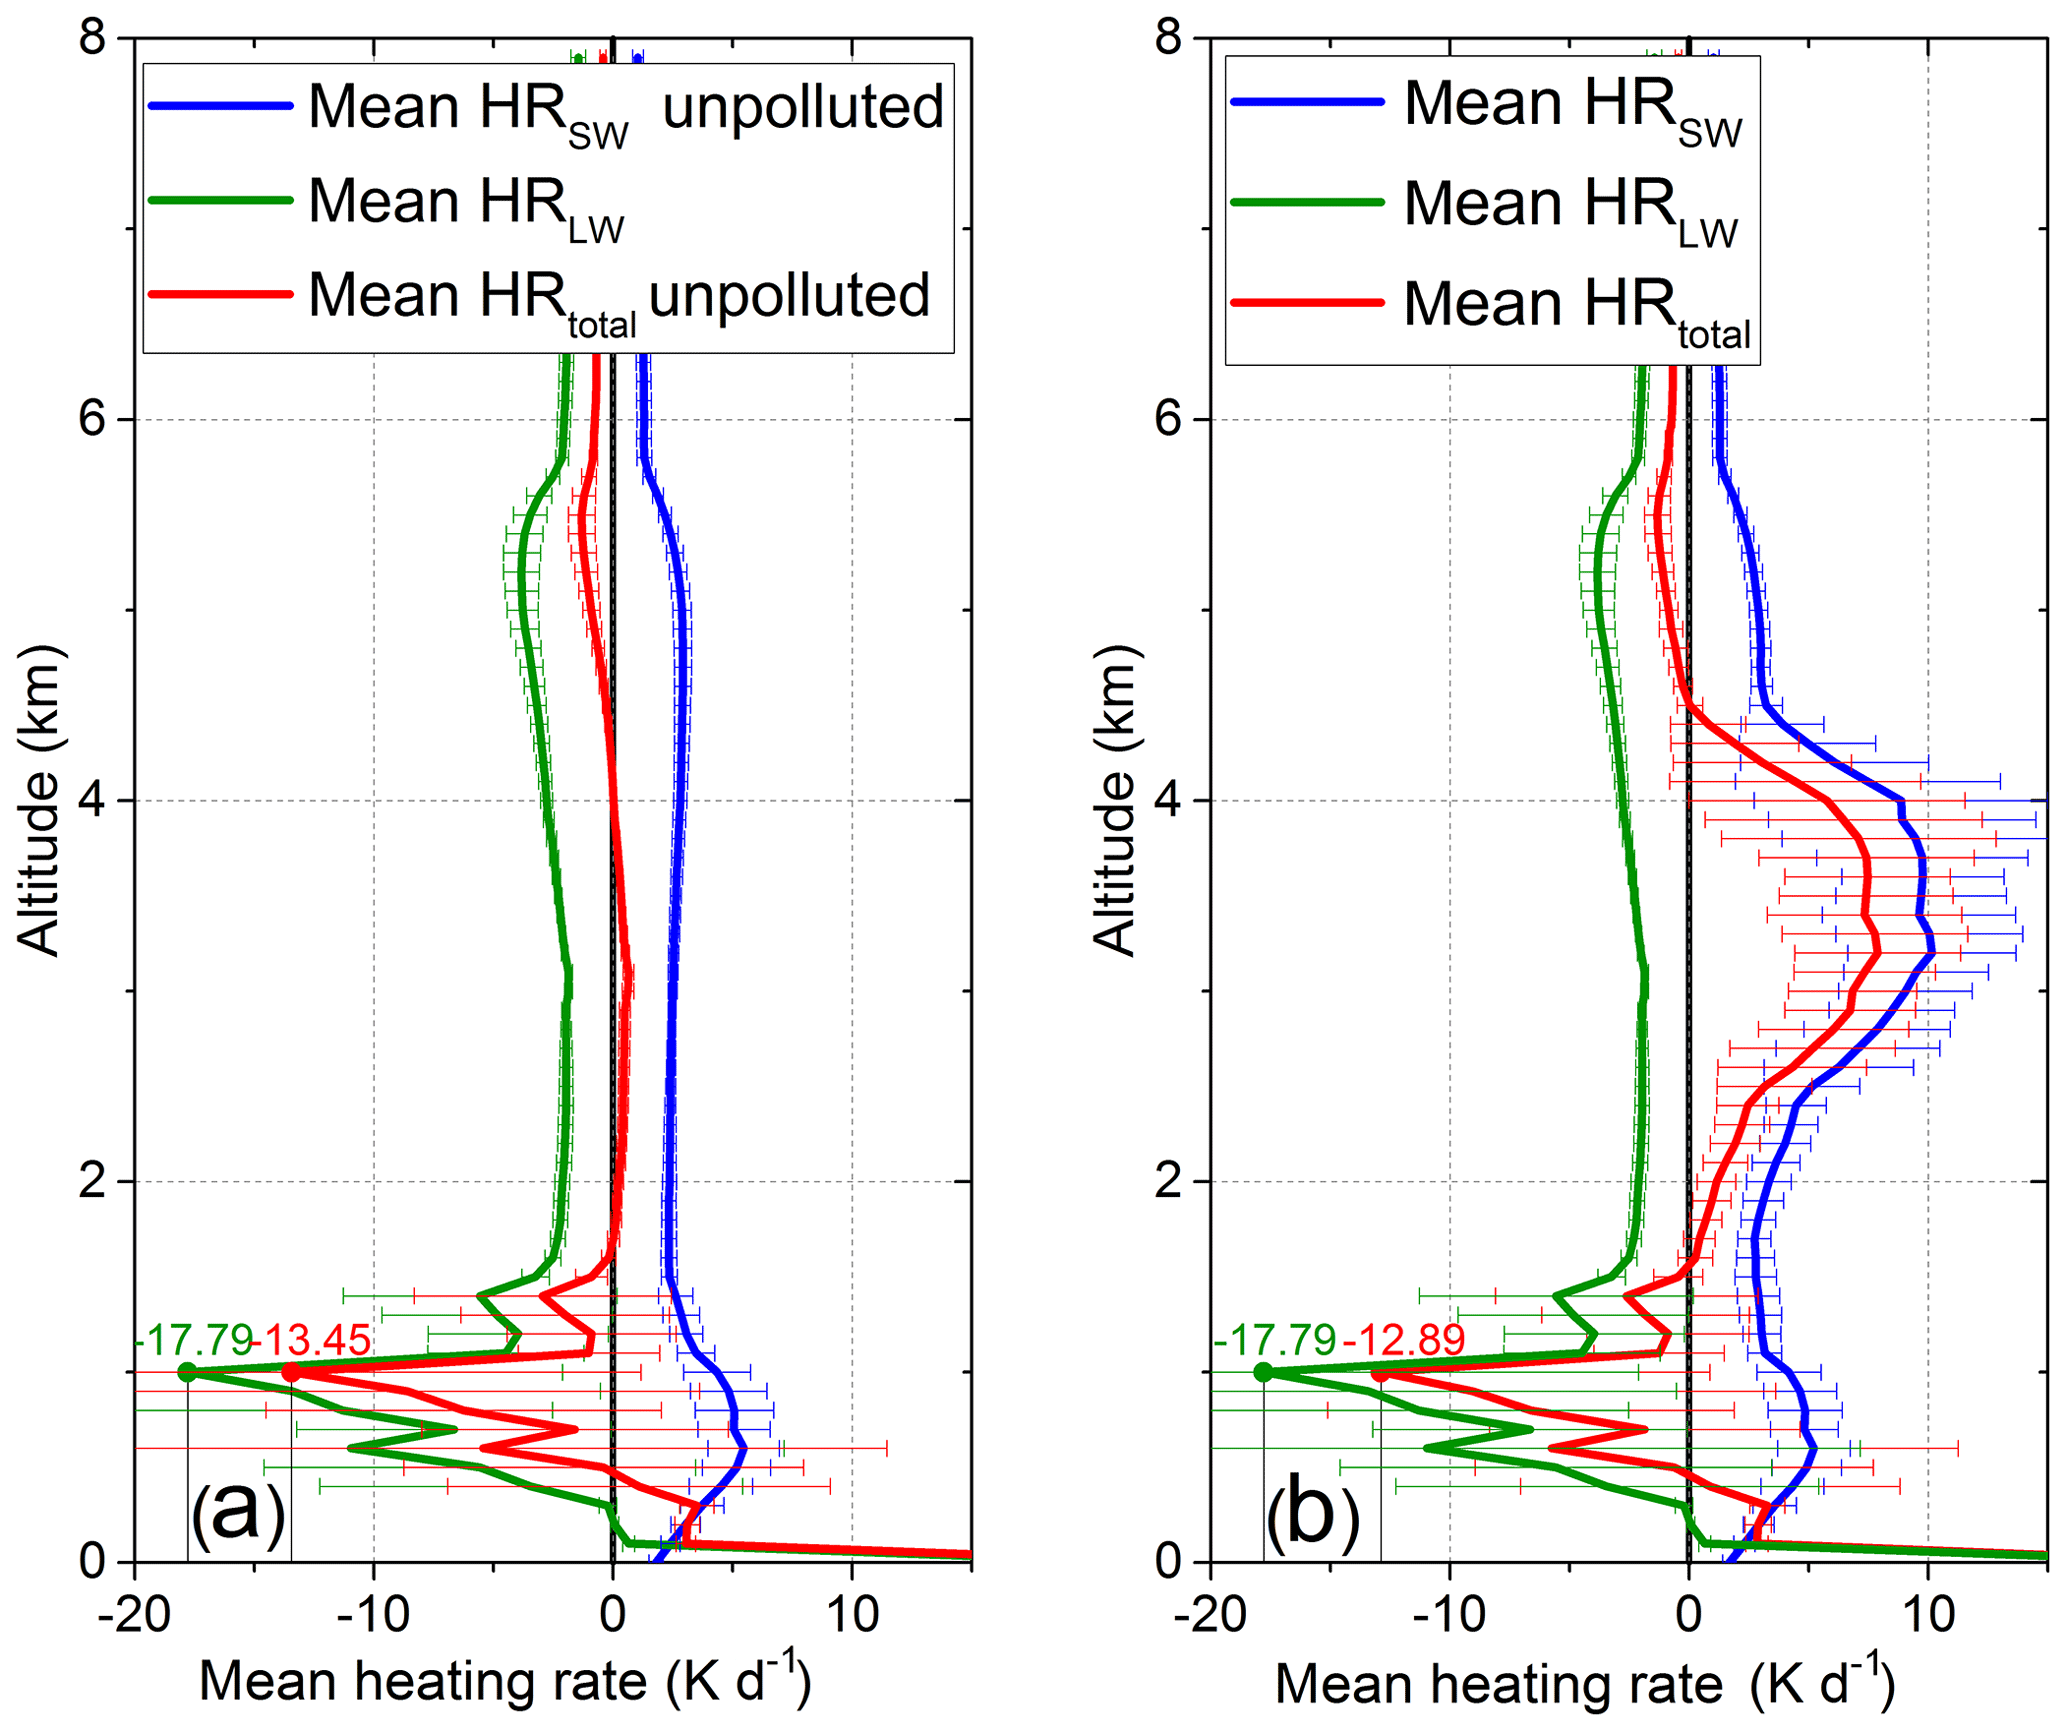
Figure 12Average heating rate for “unpolluted” cases (a) and polluted situations (b), over the sample area, from June to August 2008: shortwave HR (blue line), longwave HR (green line) and total HR (red line). The horizontal bars represent the standard deviation.
The shortwave radiative transfer results under the CALIOP track show that over the sample area, the instantaneous shortwave direct radiative effect (DRE) at the top of the atmosphere (TOA) has values between 50 and 120 Wm−2, with an average of 66.7±23.2 Wm−2. The maximum value corresponds to the largest POLDER AOT865 nm and COT (not presented here). These positive values of DRE show that the aerosols reduce the local albedo by absorbing solar radiation, generating a radiative warming of the atmospheric column.
In Fig. 12 the mean profile of the shortwave, longwave and total heating rates (K d−1), for clean situations (in which we consider only the water vapour profiles, panel a) and for smoke events (panel b) are shown. This gives a better appreciation of the average aerosol and water vapour contributions to the radiative budget in the area. We computed the heating rate initially for individual profiles, and then we averaged over the entire region. This explains the different peaks between 0.5 and 1.5 km, as the cloud-top altitude varies for each profile.
We observe that most of the warming in the atmosphere occurs where the smoke resides (between 2.5 and 4.5 km). The HRSW maximum value is 9 K d−1, of which the water vapour contributes with 3 K d−1 (seen in panel a). The heating observed above 4.5 km is due to the shortwave radiation absorbed by the water vapour; at the cloud level the warming comes from solar absorption by water vapour and cloud droplets. There is a longwave cooling at the cloud level, with mean HRLW of approximately −18 K d−1 and in the upper atmosphere a mean cooling up to −5 K d−1. In the case of polluted situations, the budget of the heating rates at the aerosol level shows that the aerosols warm the layer with an average HRtotal of 6 K d−1, while water vapour has an overall effect close to null over the cloud layer, with a compensation between its induced solar heating and infrared cooling. At the cloud level the mean HRtotal has negative values: in the unpolluted cases the HRtotal at cloud top reaches −12.9 K d−1, while in the presence of above-cloud aerosols the value decreases to −13.5 K d−1. This difference represents the average effect of above-cloud aerosols on the cloud-top heating rate, as they absorb part of the shortwave radiation. At surface the longwave absorption leads to a strong warming, with values larger than 20 K d−1, due to the absorption of the ocean's longwave contribution by the cloud and water vapour.
Overall, we observe that the sample area is globally under the energetic influence of absorbing aerosols, leading to warming at the altitudes where aerosols reside. They also create a global positive shortwave direct effect at the top of the atmosphere. Finally, we observe that over the sample area there is a radiative cooling at the cloud-top layers, slightly different between the unpolluted case and the case with aerosols.
However, in order to understand the aerosol and water vapour effects we have to account for the covariance between humidity and aerosol instead of only simulating cases with and without aerosols in the atmospheric column.
4.3 Distinction between water vapour and aerosol effects
The radiative study over the sampled area has already given us information on the average aerosol and water vapour contribution to the heating rates, mainly at the aerosol level. In this section, we analyse two different simulations for average high and low loadings of aerosol and water vapour. We define a cloud type characterized by reff of 10 µm and COT of 10, in order to consider the same contribution of the cloud droplets' multiple scattering and heating rates in both situations. The objective is to investigate how different aerosol loadings and meteorological parameters could influence the heating rates and to separate their different contributions and effects in the end.
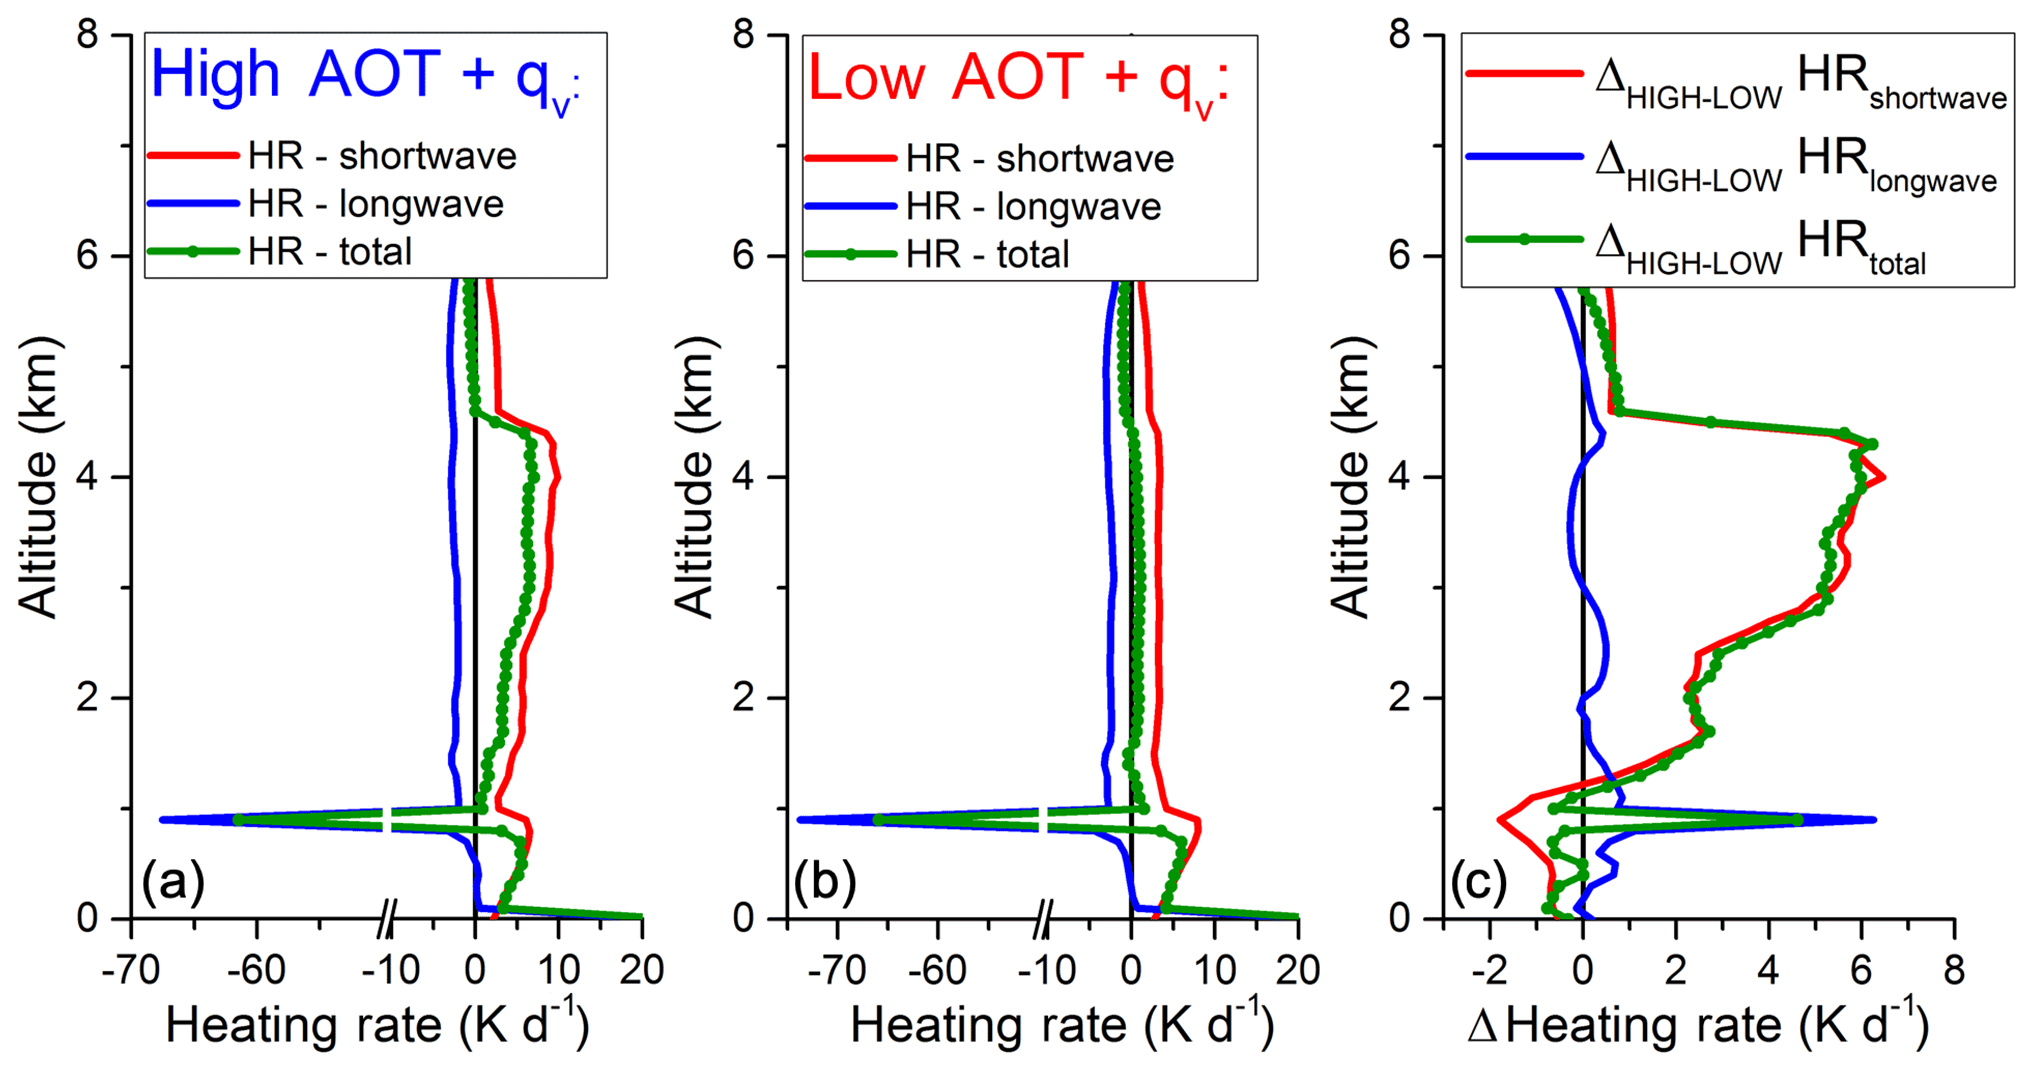
Figure 13Calculated heating rate profiles (K d−1) in shortwave (red line), longwave (blue line) and total budget (green dot line) at 12 h, for (a) average high cases (AOT865 nm=0.26 and water vapour typical for high situations), (b) average low cases (AOT865 nm=0.06 and water vapour typical for low situations) and (c) the difference between the high- and low-heating-rate profiles.
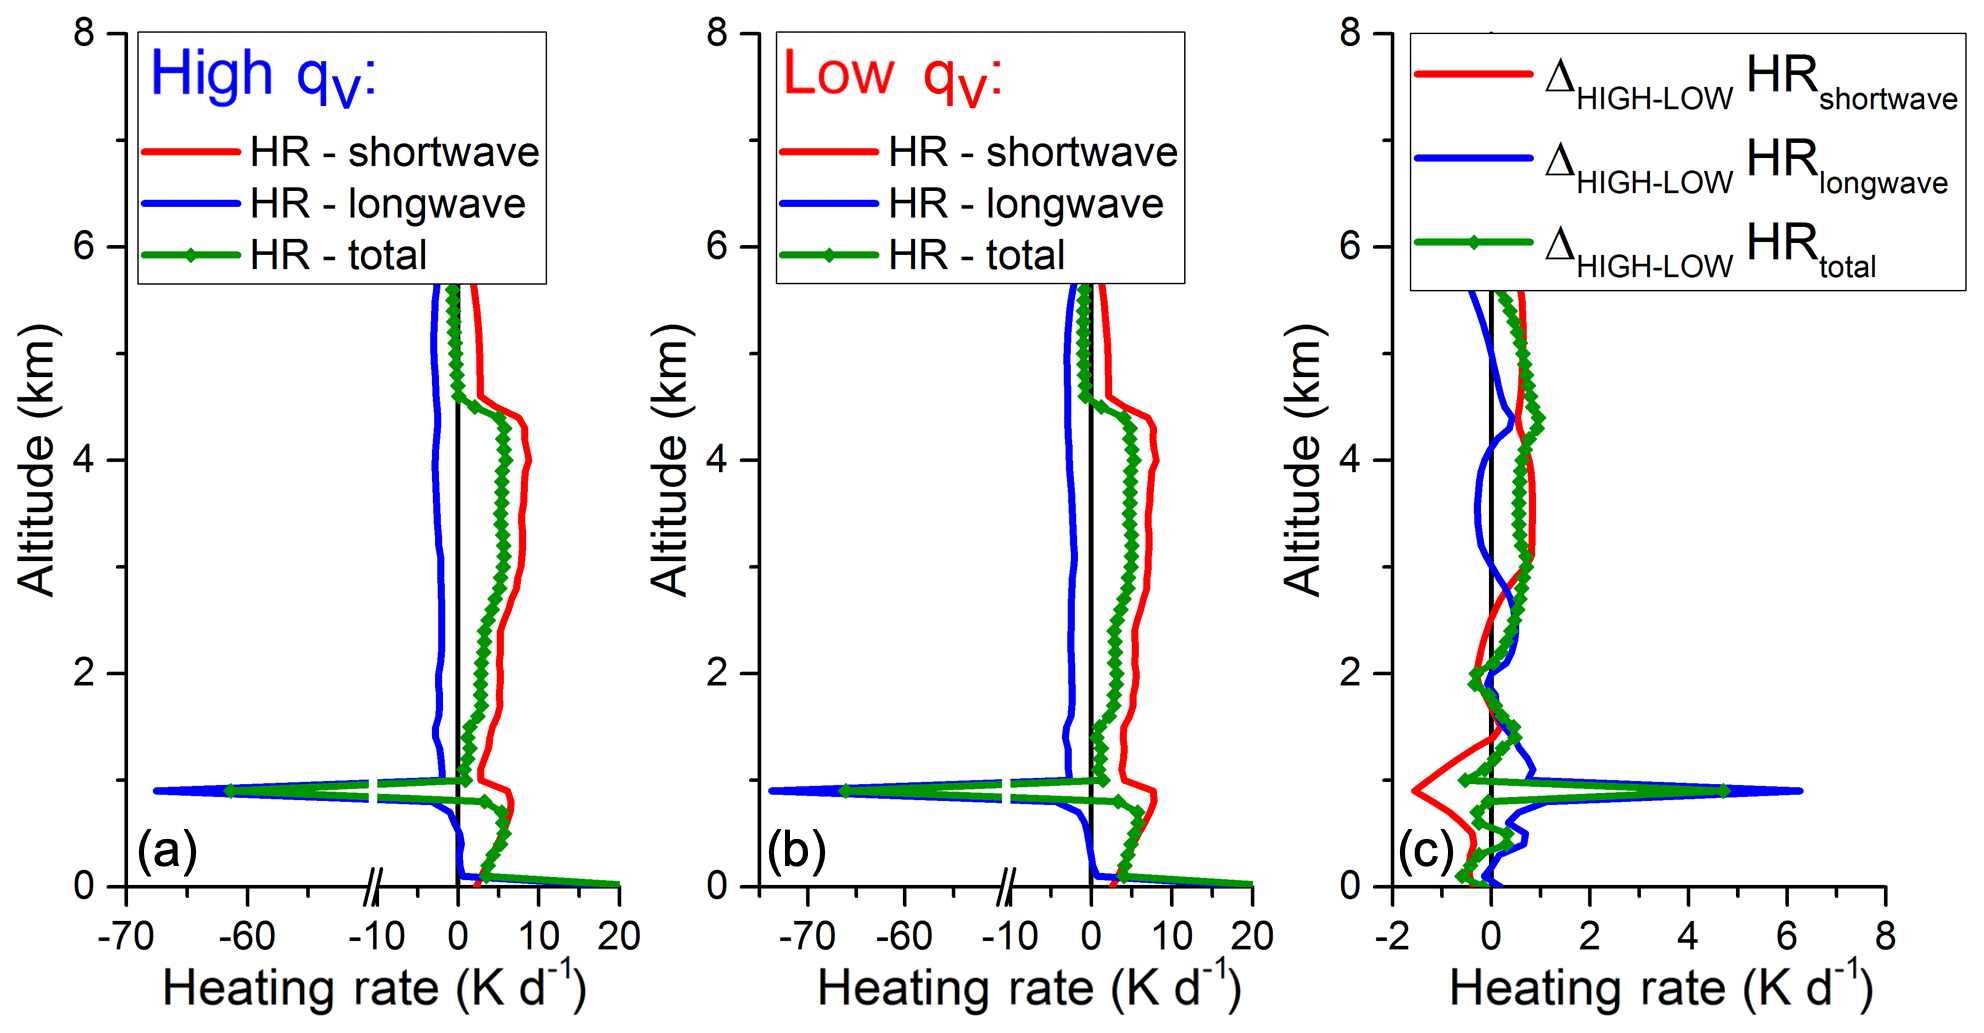
Figure 14Calculated heating rates profiles (K d−1) in shortwave (red line), longwave (blue line) and total budget (green dot line) at 12 h, for an average AOT865 nm over the region of 0.21 and (a) water vapour typical of the high situation and (b) water vapour typical of the low situations. The last panel (c) presents the difference between the high- and low-heating-rate profiles.
Figure 13 presents the first simulation, for which we calculated the heating rates in shortwave and longwave spectrums and their total by considering the average aerosol properties in the case of high and low situations (see Table 2) and the associated water vapour profiles (see Fig. 8c). Figure 13a shows the heating rate profiles for polluted situations – large AOT and water vapour content, Fig. 13b presents the heating rate of the less polluted situations – low AOT and water vapour, and Fig. 13c presents the difference between the resulting heating rates of the high and low cases. We observe a strong cooling at the cloud-top level (at 1 km), with values that reach −70 K d−1 (Fig. 13a and b) and a warming at the smoke level (between 2 and 4.5 km), more visible for the polluted case. The net heating rate profile (panel c) shows a maximum warming of about 6 K d−1 and a warming at the cloud top with 5 K d−1 between the high and low scenarios. These effects can be attributed to the presence of a smoke layer above the cloud, as the cumulative effect of aerosols and water vapour at the smoke level and at the cloud top.
Table 3Shortwave and longwave heating rate (K d−1) values for large and low AOT and specific humidity (qv) values (first simulation) and for a constant AOT and high and low values of the specific humidity profile (second simulation), obtained at the cloud-top level and at 4 km at noon.
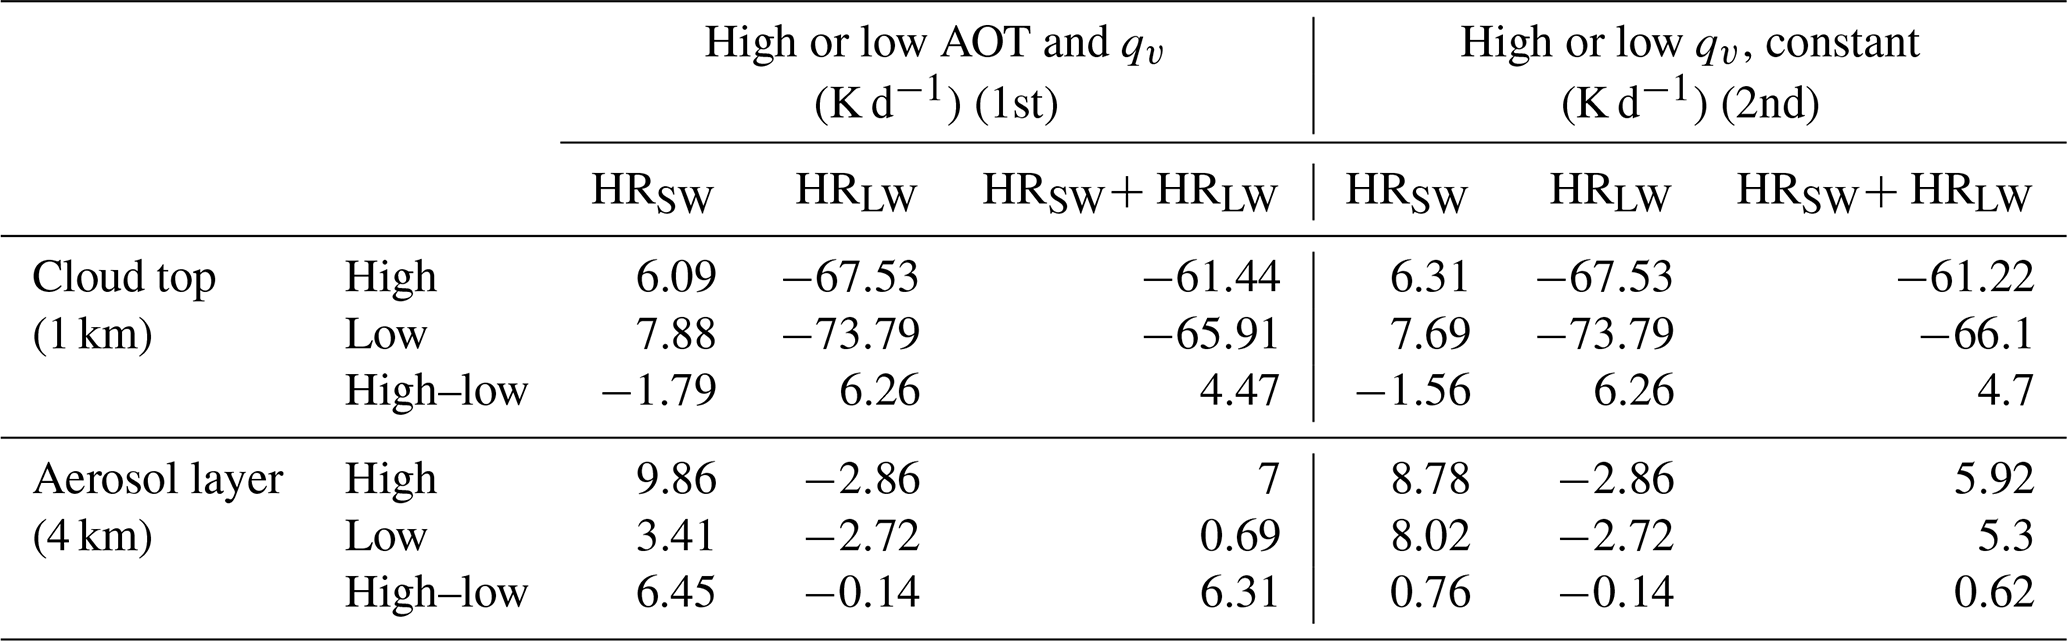
In order to separate the water vapour from the aerosol contributions, we performed a second simulation for which the above-cloud AOT is the same (0.21 at 865 nm), but with distinct typical water vapour profiles for high and low cases. Therefore, the aerosol radiative contribution is equal for the two cases, and the subtraction of the heating rates obtained for the two profiles will provide the water-vapour-only radiative contribution in the column. Results are shown in Fig. 14. In the shortwave, the difference of HR computation shows that the increase in water vapour has a warming effect in the aerosol layer of only 0.8 K d−1 and a cooling effect in the cloud layer due to a shadowing effect. At the cloud top the water vapour is the main agent to drive the net warming of about 5 K d−1, which is equivalent to 7 % loss in cloud-top cooling. The synthesis between the shortwave heating rates computed in the first simulation (water vapour and aerosol contribution) and those computed in the second scenario (water vapour only after the subtraction) provides the distinct contributions of moisture and aerosols in the heating rate difference between polluted and less polluted situations (see Tables 3 and 4).
4.4 Discussion
The results of the radiative transfer simulations provide an estimate of the distinct contributions of water vapour and aerosols to the smoke radiative forcing. Above-cloud aerosols accompanied by water vapour impact not only the layers where they reside by heating or cooling their environment, but also have a distant effect on the underlying cloud systems. Results show that overlaying aerosols drive the (instantaneous) warming within the smoke layer (typically +6 K d−1 at the A-Train passage time), while the water vapour could be responsible for a significant reduction (7 % loss) of the radiative cooling at the cloud-top level.
Table 4Subtraction of aerosol (A) and water vapour (WV) contributions in shortwave (SW) and longwave (LW) ranges between the first and second simulations.

As said above in Sect. 4.2, the cloud-top radiative cooling is the main driver of cloud-top turbulence and air entrainment. Modification of radiative heating rates at the cloud top and its surroundings could eventually modify atmospheric processes (layer stability, cloud-top turbulence) and the evolution of clouds. One can wonder if the smoke radiative forcing could impact the cloud-related processes and cloud evolution in a way that could lead to the observed cloud thickening between low- and high-smoke-loading situations. The observed thickening could be associated with the difference in the statistical relationship between LWP and qv at 925 hPa. High values of LWP (up to 80–90 g m−2) are observed in the high case, while in the low case LWP is below 50–60 g m−2. In the low case, the inversion of LWP with increasing specific humidity could suggest the existence of a negative feedback that limits the average LWP values. We hypothesize that some cloud-related processes are different in the low and high cases, as a consequence of changes in the cloud-top cooling with the presence of overlaying smoke.
One should be careful in the analysis of Fig. 11b as there is an uncertainty in the actual location of the 925 hPa level compared to the top of the stratocumulus layer. From the analysis of the average model-derived humidity profile over the zone, values of specific humidity between 8 and 12 g kg−1 would indicate the presence of increased humidity within the cloud layers. Values for humidity layers just above the cloud top would be approximately 6 g kg−1 at 900 hPa. The data in Fig. 11b are hypothesized to be for a specific humidity profile within the cloud. However, even if it were to lie above the cloud, we would still expect that the increased humidity would lead to an increase in the amount of condensable water within the cloud layer, although it would be caused by the entrainment process instead.
The underlying mechanism responsible for the LWP-qv inversion above 55 g m−2 remains unknown. One explanation could be that this relationship seems to illustrate a strong cloud–radiation–turbulent–entrainment feedback (Zhu et al., 2005) that would exist for stratocumulus clouds. Wood (2012) describes this negative feedback as the following: a thickening cloud drives stronger entrainment (of warm, dry air), which results in cloud thinning. A thickening cloud is more efficiently cooled at its cloud top, and as a response, mixing and turbulence increase. The increase in dry air entrainment could lead to a thinning cloud (Wood, 2012). For the high cases, the cloud-top radiative cooling is reduced mainly by the radiative effects of water vapour, and the temperature inversion above the cloud is reinforced by the SW absorption of aerosols. Thus, a combined effect of increased atmospheric stability and of cloud-top cooling reduction would eventually lead to a decrease in entrainment rate and its moderating effect on clouds, further amplified by the fact that the entrained air would be moister. This would explain a cancellation or reduction of the cloud thinning effect, illustrated in Fig. 11b.
A second hypothesis for the negative slope of LWP larger then 55 g m−2 for large humidity values is the loss of condensed water due to precipitation. Figure 10b shows a weaker increase in reff when the aerosol loading is high. Due to the CALIOP high bias on aerosol base altitude, we do not exclude the possibility of some aerosol–cloud contact cases that could lead to a Twomey effect, and hence lower reff values. For the low cases, we notice a strong reff increase followed by a flattening at around 11 µm, between 5 and 9∘ E. Studies (e.g. Freud and Rosenfeld, 2012) show that a precipitable droplet size is around (or over) 12 µm. The average does not reach this value, but there are definitely large droplets in the low case that could lead to precipitation. Sufficient humidity is present in both cases, but precipitable droplets only seem to exist in the clean case, which could correspond to the decrease in LWP due to precipitation.
This study indicates the importance of separating the aerosol and water vapour contributions when studying cloud adjustments to above-cloud aerosols.
In our study, we focused on the impact of absorbing aerosol layers overlying a lower cloud layer, their associated radiative forcing and their potential effects on the underlying clouds. The main objective was to disentangle the effect of aerosols on clouds from the meteorological effect, and to calculate their radiative impact. The region of interest was the South Atlantic Ocean due to the large loads of African biomass burning absorbing aerosols that are frequently transported over the main South Atlantic stratocumulus deck.
We realized a synergy between CALIOP and POLDER measurements of aerosols above clouds, to which we added meteorological parameters provided by the ERA-Interim reanalysis. We analysed the properties of aerosols and clouds for the period May–October 2006 to 2009, in particular the information about the vertical distance between the two layers: along the longitude, the clouds develop vertically as they are transported further westwards; the aerosols are mainly detached from the cloud close to the coast and afterwards they lose altitude, which is explained by the wet and dry deposition processes and the atmospheric circulation over the south of Africa and southeastern Atlantic Ocean. The evolution of aerosol properties travelling westward (increase in size, decrease in absorption and Ångström exponent) suggests an ageing of aerosols.
For a more detailed analysis we selected a small area close to the coast of Angola that is near the main stratocumulus deck identified in the region and where large loads of aerosols are transported at higher altitudes, mainly detached from the clouds below. The study was limited to 3 months (June to August 2008) in order to constrain the meteorological variability that can affect the clouds and the overlaid aerosols, but also to maintain a sufficiently large dataset for a better statistical analysis.
A first interesting result of our approach is that we are able, using a CALIOP–POLDER–ERA-Interim synergy and a radiative transfer model, to provide estimates of the aerosol radiative effects and the vertical heating rate profiles when aerosol layers are above low-level clouds (below 1.5 km), in both the shortwave and longwave domains. Over the area, we estimated that smoke layers located above clouds significantly perturb TOA net flux and the solar illumination of clouds at the time of the overpass of POLDER (13:30 UTC). The study revealed positive average values of the DRE at TOA, between 50 and 120 Wm−2, with an average of 66.7 Wm−2 and a standard deviation of 23.2 Wm−2, which signifies a reduced scene's albedo and a warming of the atmospheric column strongly correlated to the aerosol loading. The shortwave heating rate shows a warming of 9 K d−1 at the aerosol layer, of which 3 K d−1 is due to the water vapour shortwave absorption. However, the total effect of water vapour is almost null, as the shortwave heating is compensated for by its longwave radiative cooling. Another estimate is the heating rate at the cloud-top layers. We observed a net cloud-top radiative cooling dominated by infrared transfer, around −60 K d−1 for each pixel under the CALIOP track, and a mean of −13 K d−1 over the area, as clouds are diversely vertically located. Removing aerosols from the calculation shows a slight increased cooling. In the total balance between shortwave and longwave heating rates, we notice a small effect of the presence of aerosols above clouds (of 0.56 K d−1), which is explained by the shadowing effect of aerosols, which attenuate the solar radiation to reach the cloud top.
For this area and for this time period, we observed a strong covariance between the increase in the specific humidity and the increase in AOT, especially at 850 and 700 hPa (Fig. 7). One explanation could come from the release of water vapour together with aerosols from the African sources (Parmar et al., 2008). Another explanation, not explored here, could come from the rapid adjustments of water vapour to the presence of aerosols (Smith et al., 2018).
This covariance motivated us to analyse the relationship between cloud and meteorological parameters for two distinct regimes: highly absorbing aerosols and aerosol layers with low absorption. This distinction confirmed two different humidity profiles characteristic of high and low situations. At 700 hPa, the difference clearly originates from two distinct air masses: the high loads of aerosols come from the land (direction east–west), with high amounts of water vapour, while the low cases originate from the open ocean, with lower moisture quantities. The analysis of meteorological conditions at 925 hPa shows some differences, but mainly common features of wind directions, temperature inversion and humidity. The larger difference was observed above the cloud layers, at 700 hPa, where the aerosol layer resides.
Our results confirm previous satellite observations and studies that showed that clouds contain more water and are at slightly lower altitudes when large loads of absorbing aerosols are located above them. Indeed, we observed a significant increase in LWP between low and high cases, whatever the meteorological conditions (Figs. 10 and 11). These results are valid for June–August since we have selected one meteorological regime with a similar number of high and low situations. We do not ignore the possibility that different results may be found in another period (such as September–October), characterized by different meteorological conditions and aerosol emissions.
The cause and effect of the cloud “thickening” is a challenge to untangle. Stabilization of above-cloud layers that experience a warming – which should lead to temperature inversion reinforcement, decrease in air entrainment and humidity preservation – has been suggested in previous studies. Our results of layer warming due to aerosol SW absorption are not contradictory, but aerosol layers seem quite distant from the cloud top here to confidently confirm this explanation. For the two smoke scenarios, two distinct relationships have been obtained between the specific humidity at 925 hPa and the LWP: below 55 g m−2 the LWP increases systematically for both cases, followed by a negative slope for the low cases and a continuous increase for the high cases. This suggests that the negative feedback evoked by Wood (2012) (a cloud thinning that follows a stronger entrainment, consequence of a cloud thickening) is attenuated, if not cancelled, in the high case. A possible explanation is a reduction of cloud-top entrainment and its consequence due to two factors: a decrease in cloud-top turbulence due to a decrease in cloud-top cooling and the fact that air entrained is more humid in the high case. Another hypothesis is the sink of LWP in the low cases due to loss of condensable water via precipitation.
We evaluated the difference in cloud-top cooling between the low and high scenarios by performing two radiative transfer simulations with two typical covariant loadings of aerosol and humidity. The results of the radiative transfer simulations show that, while an increase in aerosols is 90 % responsible for increasing the heating of the layer where they reside, the increase in the water vapour amount is responsible for a decrease in cloud-top cooling of +4.7 K d−1 (7 %), while a slight increase in the aerosol's shadowing leads to a cooling of −0.23 K d−1. Thus, the presence of smoke layers in the scene significantly impacts its radiative budget and modifies the heating rates, with an increase in heating in the aerosol layers, and a decrease in the cooling at the cloud top, which may significantly impact the cloud-top dynamics. Accounting for the covariance between aerosol loading and water vapour seems important for understanding the observed cloud thickening (these are identified mechanisms for AAC semi-direct effects on clouds).
As perspectives, we propose validating our computed heating rates by comparing them with the AEROCLO-sA, CLARIFY and ORACLES airborne data. During these field campaigns, various lidar and polarimeters were deployed and could be used to estimate in synergy the heating rate profiles. An exercise of validation would consist in validating the heating rates with the concomitant flux measurements performed at different levels through the smoke layers. Furthermore, we plan to combine our database with a climate or regional model to check the consistency of our data. The model can be constrained using observations (aerosol and cloud parameters, water vapour content, meteorological profiles), and can provide simulations made with and without aerosols and to help disentangle the effects of meteorology versus the aerosol effects. Such new strategies combining models and active and passive remote sensing data with meteorological data and airborne sounding will help to better understand the impacts of aerosols on the clouds and climate at regional and global scales. Using our large database, we can further calculate the heating rates of aerosols above clouds for a larger region to better study the transport effect, or even at a global scale.
All data are available at the ICARE website online archive: http://www.icare.univ-lille1.fr/archive (ICARE, 2013). We used the PM-L2.v3.01 POLDER aerosol above-cloud products (http://www.icare.univ-lille1.fr/parasol/products/, Riedi and Waquet, 2015) that provide data at 6 km by 6 km, and the 05kmAPro.v3.02 and 05kmCPro.v3.02 CALIOP products (http://www.icare.univ-lille1.fr/calipso/products/, last access: 12 September 2012) available at ICARE by request. The reanalysis data are distributed by the ECMWF Meteorological Archival and Retrieval System (MARS).
LD, NF and FW conceived the study. FW and PG acquisitioned the funding. LD generated the database and analysed the data with the help of NF, FW and FP. NF analysed the meteorological data and helped interpret the changes in cloud properties. FW modified the GAME models in VIS and IRT for the purpose of this study and defined the “high and low” strategy for investigating the aerosol effects on clouds. FT provided IT support. LD wrote the paper with reviews from all authors.
The authors declare that they have no conflict of interest.
This article is part of the special issue “New observations and related modelling studies of the aerosol–cloud–climate system in the Southeast Atlantic and southern Africa regions (ACP–AMT inter-journal SI)”. It is not associated with a conference.
Lucia Deaconu's grant was provided by the CaPPA project (Chemical and Physical Properties of the Atmosphere), which is funded by the French National Research Agency (ANR) through the PIA (Programme d'Investissement d'Avenir) under contract ANR-11-LABX-0005-01 and by the Regional Council Hauts-de-France and the European Funds for Regional Economic Development (FEDER). The authors would like to acknowledge Philippe Dubuisson, for his insights into the GAME model, Fanny Minvielle for helping to provide ECMWF data and the ICARE Data Service Centre for providing the satellite retrievals.
We acknowledge the CaPPA project that funded this research work. The CaPPA project (Chemical and Physical Properties of the Atmosphere) is funded by the French National Research Agency (ANR) through the PIA (Programme d'Investissement d'Avenir) under contract ANR-11-LABX-0005-01 and by the Regional Council Hauts-de-France and the European Funds for Regional Economic Development (FEDER).
This paper was edited by Paquita Zuidema and reviewed by Meloe Kacenelenbogen and two anonymous referees.
Adebiyi, A. A., Zuidema, P., and Abel, S. J.: The convolution of dynamics and moisture with the presence of shortwave absorbing aerosols over the southeast Atlantic, J. Climate, 28, 1997–2024, https://doi.org/10.1175/JCLI-D-14-00352.1, 2015.
Berrisford, P., Dee, D. P., Poli, P., Brugge, R., Fielding, K., Fuentes, M., K\r allberg, P. W., Kobayashi, S., Uppala, S., and Simmons, A.: The ERA-Interim archive Version 2.0, ERA Rep. Ser., 1, 23, 2011.
Brenguier, J.-L. and Wood, R.: Observational Strategies from the Micro- to Mesoscale, in Clouds in the Perturbed Climate System, 487–510, The MIT Press, 2009.
Bretherton, C. S., Uttal, T., Fairall, C. W., Yuter, S. E., Weller, R. A., Baumgardner, D., Comstock, K., Wood, R., and Raga, G. B.: The EPIC 2001 stratocumulus study, B. Am. Meteorol. Soc., 85, 967–977, https://doi.org/10.1175/BAMS-85-7-967, 2004.
Brioude, J., Cooper, O. R., Feingold, G., Trainer, M., Freitas, S. R., Kowal, D., Ayers, J. K., Prins, E., Minnis, P., McKeen, S. A., Frost, G. J., and Hsie, E.-Y.: Effect of biomass burning on marine stratocumulus clouds off the California coast, Atmos. Chem. Phys., 9, 8841–8856, https://doi.org/10.5194/acp-9-8841-2009, 2009.
Buriez, J. C., Vanbauce, C., Parol, F., Goloub, P., Herman, M., Bonnel, B., Fouquart, Y., Couvert, P., and Seze, G.: Cloud detection and derivation of cloud properties from POLDER, Int. J. Remote Sens., 18, 2785–2813, https://doi.org/10.1080/014311697217332, 1997.
Chand, D., Anderson, T. L., Wood, R., Charlson, R. J., Hu, Y., Liu, Z., and Vaughan, M.: Quantifying above-cloud aerosol using spaceborne lidar for improved understanding of cloudy-sky direct climate forcing, J. Geophys. Res., 113, D13206, https://doi.org/10.1029/2007JD009433, 2008.
Christensen, M. W., Carrió, G. G., Stephens, G. L., and Cotton, W. R.: Radiative Impacts of Free-Tropospheric Clouds on the Properties of Marine Stratocumulus, J. Atmos. Sci., 70, 3102–3118, https://doi.org/10.1175/JAS-D-12-0287.1, 2013.
Clements, C. B., Potter, B. E., and Zhong, S.: In situ measurements of water vapor, heat, and CO2 fluxes within a prescribed grass fire, Int. J. Wildl. Fire, 15, 299–306, https://doi.org/10.1071/WF05101, 2006.
Costantino, L. and Bréon, F.-M.: Aerosol indirect effect on warm clouds over South-East Atlantic, from co-located MODIS and CALIPSO observations, Atmos. Chem. Phys., 13, 69–88, https://doi.org/10.5194/acp-13-69-2013, 2013.
Deaconu, L. T., Waquet, F., Josset, D., Ferlay, N., Peers, F., Thieuleux, F., Ducos, F., Pascal, N., Tanré, D., Pelon, J., and Goloub, P.: Consistency of aerosols above clouds characterization from A-Train active and passive measurements, Atmos. Meas. Tech., 10, 3499–3523, https://doi.org/10.5194/amt-10-3499-2017, 2017.
Dee, D. P., Uppala, S. M., Simmons, A. J., Berrisford, P., Poli, P., Kobayashi, S., Andrae, U., Balmaseda, M. A., Balsamo, G., Bauer, P., Bechtold, P., Beljaars, A. C. M., van de Berg, L., Bidlot, J., Bormann, N., Delsol, C., Dragani, R., Fuentes, M., Geer, A. J., Haimberger, L., Healy, S. B., Hersbach, H., Hólm, E. V., Isaksen, L., Kållberg, P., Köhler, M., Matricardi, M., Mcnally, A. P., Monge-Sanz, B. M., Morcrette, J. J., Park, B. K., Peubey, C., de Rosnay, P., Tavolato, C., Thépaut, J. N., and Vitart, F.: The ERA-Interim reanalysis: Configuration and performance of the data assimilation system, Q. J. Roy. Meteor. Soc., 137, 553–597, https://doi.org/10.1002/qj.828, 2011.
Dubovik, O., Holben, B., Eck, T. F., Smirnov, A., Kaufman, Y. J., King, M. D., Tanré, D., and Slutsker, I.: Variability of Absorption and Optical Properties of Key Aerosol Types Observed in Worldwide Locations, J. Atmos. Sci., 59, 590–608, https://doi.org/10.1175/1520-0469(2002)059<0590:VOAAOP>2.0.CO;2, 2002.
Dubuisson, P., Roger, J. C., Mallet, M., and Dubovik, O.: A code to compute the direct solar radiative forcing: Application to anthropogenic aerosols during the Escompte experiment, in IRS 2004: Current Problems in Atmospheric Radiation, edited by: Fischer, H. and Sohn, B.-J., 127–130, Hampton, Va., 2006.
Ferlay, N., Thieuleux, F., Cornet, C., Davis, A. B., Dubuisson, P., Ducos, F., Parol, F., Riédi, J., and Vanbauce, C.: Toward new inferences about cloud structures from multidirectional measurements in the oxygen a band: Middle-of-cloud pressure and cloud geometrical thickness from POLDER-3/PARASOL, J. Appl. Meteorol. Clim., 49, 2492–2507, https://doi.org/10.1175/2010JAMC2550.1, 2010.
Freud, E. and Rosenfeld, D.: Linear relation between convective cloud drop number concentration and depth for rain initiation, J. Geophys. Res.-Atmos., 117, D02207, https://doi.org/10.1029/2011JD016457, 2012.
Hasekamp, O. P.: Capability of multi-viewing-angle photo-polarimetric measurements for the simultaneous retrieval of aerosol and cloud properties, Atmos. Meas. Tech., 3, 839–851, https://doi.org/10.5194/amt-3-839-2010, 2010.
Haywood, J. M., Osborne, S. R., Francis, P. N., Keil, A., Formenti, P., Andreae, M. O., and Kaye, P. H.: The mean physical and optical properties of regional haze dominated by biomass burning aerosol measured from the C-130 aircraft during SAFARI 2000, J. Geophys. Res.-Atmos., 108, 8473, https://doi.org/10.1029/2002JD002226, 2003.
Haywood, J. M., Osborne, S. R., and Abel, S. J.: The effect of overlying absorbing aerosol layers on remote sensing retrievals of cloud effective radius and cloud optical depth, Q. J. Roy. Meteor. Soc., 130, 779–800, https://doi.org/10.1256/qj.03.100, 2004.
Hill, A. A., Dobbie, S., and Yin, Y.: The impact of aerosols on non-precipitating marine stratocumulus. I: Model description and prediction of the indirect effect, Q. J. Roy. Meteor. Soc., 134, 1143–1154, https://doi.org/10.1002/qj.278, 2008.
Hu, Y., Vaughan, M., Liu, Z., Powell, K., and Rodier, S.: Retrieving Optical Depths and Lidar Ratios for Transparent Layers Above Opaque Water Clouds From CALIPSO Lidar Measurements, IEEE Geosci. Remote S., 4, 523–526, https://doi.org/10.1109/LGRS.2007.901085, 2007.
Hudspith, V. A., Belcher, C. M., Barnes, J., Dash, C. B., Kelly, R., and Hu, F. S.: Charcoal reflectance suggests heating duration and fuel moisture affected burn severity in four Alaskan tundra wildfires, Int. J. Wildl. Fire, 26, 306–316, https://doi.org/10.1071/WF16177, 2017.
ICARE: 05kmAPro.v3.02 and 05kmCPro.v3.02 CALIOP products, available at: http://www.icare.univ-lille1.fr/archive (last access: 7 January 2018), 2013.
Ichoku, C., Remer, L. A., Kaufman, Y. J., Levy, R., Chu, D. A., Tanré, D., and Holben, B. N.: MODIS observation of aerosols and estimation of aerosol radiative forcing over southern Africa during SAFARI 2000, J. Geophys. Res.-Atmos., 108, 8499, https://doi.org/10.1029/2002JD002366, 2003.
Jethva, H., Torres, O., Remer, L. A., and Bhartia, P. K.: A color ratio method for simultaneous retrieval of aerosol and cloud optical thickness of above-cloud absorbing aerosols from passive sensors: Application to MODIS measurements, IEEE Geosci. Remote S., 51, 3862–3870, https://doi.org/10.1109/TGRS.2012.2230008, 2013.
Jethva, H., Torres, O., Waquet, F., Chand, D., and Hu, Y.: How do A-train sensors intercompare in the retrieval of above-cloud aerosol optical depth? A case study-based assessment, Geophys. Res. Lett., 41, 186–192, https://doi.org/10.1002/2013GL058405, 2014.
Johnson, B. T., Shine, K. P., and Forster, P. M.: The semi-direct aerosol effect: Impact of absorbing aerosols on marine stratocumulus, Q. J. Roy. Meteor. Soc., 130, 1407–1422, https://doi.org/10.1256/qj.03.61, 2004.
Johnson, B. T., Osborne, S. R., Haywood, J. M., and Harrison, M. A. J.: Aircraft measurements of biomass burning aerosol over West Africa during DABEX, J. Geophys. Res.-Atmos., 113, D00C06, https://doi.org/10.1029/2007JD009451, 2008.
Kacenelenbogen, M., Redemann, J., Vaughan, M. A., Omar, A. H., Russell, P. B., Burton, S., Rogers, R. R., Ferrare, R. A., and Hostetler, C. A.: An evaluation of CALIOP/CALIPSO's aerosol-above-cloud detection and retrieval capability over North America, J. Geophys. Res.-Atmos., 119, 230–244, https://doi.org/10.1002/2013JD020178, 2014.
Kacenelenbogen, M. S., Vaughan, M. A., Redemann, J., Young, S. A., Liu, Z., Hu, Y., Omar, A. H., LeBlanc, S., Shinozuka, Y., Livingston, J., Zhang, Q., and Powell, K. A.: Estimations of global shortwave direct aerosol radiative effects above opaque water clouds using a combination of A-Train satellite sensors, Atmos. Chem. Phys., 19, 4933–4962, https://doi.org/10.5194/acp-19-4933-2019, 2019.
Kar, J., Vaughan, M., Tackett, J., Liu, Z., Omar, A., Rodier, S., Trepte, C., and Lucker, P.: Swelling of transported smoke from savanna fires over the Southeast Atlantic Ocean, Remote Sens. Environ., 211, 105–111, https://doi.org/10.1016/j.rse.2018.03.043, 2018.
Kaufman, Y. J., Koren, I., Remer, L. A., Rosenfeld, D., and Rudich, Y.: The effect of smoke, dust, and pollution aerosol on shallow cloud development over the Atlantic Ocean, P. Natl. Acad. Sci. USA, 102, 11207–11212, https://doi.org/10.1073/pnas.0505191102, 2005.
Keil, A. and Haywood, J. M.: Solar radiative forcing by biomass burning aerosol particles during SAFARI 2000: A case study based on measured aerosol and cloud properties, J. Geophys. Res.-Atmos., 108, 8467, https://doi.org/10.1029/2002JD002315, 2003.
Klein, S. A. and Hartmann, D. L.: The seasonal cycle of low stratiform clouds, J. Climate, 6, 1587–1606, https://doi.org/10.1175/1520-0442(1993)006<1587:TSCOLS>2.0.CO;2, 1993.
Knobelspiesse, K., Cairns, B., Ottaviani, M., Ferrare, R., Hair, J., Hostetler, C., Obland, M., Rogers, R., Redemann, J., Shinozuka, Y., Clarke, A., Freitag, S., Howell, S., Kapustin, V., and McNaughton, C.: Combined retrievals of boreal forest fire aerosol properties with a polarimeter and lidar, Atmos. Chem. Phys., 11, 7045–7067, https://doi.org/10.5194/acp-11-7045-2011, 2011.
Labonne, M., Bréon, F. M., and Chevallier, F.: Injection height of biomass burning aerosols as seen from a spaceborne lidar, Geophys. Res. Lett., 34, L11806, https://doi.org/10.1029/2007GL029311, 2007.
Leahy, L. V., Anderson, T. L., Eck, T. F., and Bergtrom, R. W.: A synthesis of single scattering albedo of biomass burning aerosol over southern Africa during SAFARI 2000, Geophys. Res. Lett., 34, L12814, https://doi.org/10.1029/2007GL029697, 2007.
Lenoble, J., Tanre, D., Deschamps, P. Y., and Herman, M.: A Simple Method to Compute the Change in Earth-Atmosphere Radiative Balance Due to a Stratospheric Aerosol Layer, J. Atmos. Sci., 39, 2565–2576, https://doi.org/10.1175/1520-0469(1982)039<2565:ASMTCT>2.0.CO;2, 1982.
Levine, J. S.: Global biomass burning: Atmospheric, climatic and biospheric implications, EOS T. Am. Geophys. Un., 71, 1075–1077, https://doi.org/10.1029/90EO00289, 1990.
Liu, Z., Winker, D., Omar, A., Vaughan, M., Kar, J., Trepte, C., Hu, Y., and Schuster, G.: Evaluation of CALIOP 532 nm aerosol optical depth over opaque water clouds, Atmos. Chem. Phys., 15, 1265–1288, https://doi.org/10.5194/acp-15-1265-2015, 2015.
Meyer, K., Platnick, S., and Zhang, Z.: Simultaneously inferring above-cloud absorbing aerosol optical thickness and underlying liquid phase cloud optical and microphysical properties using MODIS, J. Geophys. Res.-Atmos., 120, 5524–5547, https://doi.org/10.1002/2015JD023128, 2015.
Müller, D., Ansmann, A., Mattis, I., Tesche, M., Wandinger, U., Althausen, D., and Pisani, G.: Aerosol-type-dependent lidar ratios observed with Raman lidar, J. Geophys. Res.-Atmos., 112, D16202, https://doi.org/10.1029/2006JD008292, 2007.
Parmar, R. S., Welling, M., Andreae, M. O., and Helas, G.: Water vapor release from biomass combustion, Atmos. Chem. Phys., 8, 6147–6153, https://doi.org/10.5194/acp-8-6147-2008, 2008.
Peers, F., Waquet, F., Cornet, C., Dubuisson, P., Ducos, F., Goloub, P., Szczap, F., Tanré, D., and Thieuleux, F.: Absorption of aerosols above clouds from POLDER/PARASOL measurements and estimation of their direct radiative effect, Atmos. Chem. Phys., 15, 4179–4196, https://doi.org/10.5194/acp-15-4179-2015, 2015.
Pistone, K., Redemann, J., Doherty, S., Zuidema, P., Burton, S., Cairns, B., Cochrane, S., Ferrare, R., Flynn, C., Freitag, S., Howell, S. G., Kacenelenbogen, M., LeBlanc, S., Liu, X., Schmidt, K. S., Sedlacek III, A. J., Segal-Rozenhaimer, M., Shinozuka, Y., Stamnes, S., van Diedenhoven, B., Van Harten, G., and Xu, F.: Intercomparison of biomass burning aerosol optical properties from in situ and remote-sensing instruments in ORACLES-2016, Atmos. Chem. Phys., 19, 9181–9208, https://doi.org/10.5194/acp-19-9181-2019, 2019.
Potter, B. E.: The role of released moisture in the atmospheric dynamics associated with wildland fires, Int. J. Wildl. Fire, 14, 77–84, https://doi.org/10.1071/WF04045, 2005.
Rajapakshe, C., Zhang, Z., Yorks, J. E., Yu, H., Tan, Q., Meyer, K., Platnick, S., and Winker, D. M.: Seasonally Transported Aerosol Layers over Southeast Atlantic are Closer to Underlying Clouds than Previously Reported, Geophys. Res. Lett., 44, 5818–5825, https://doi.org/10.1002/2017GL073559, 2017.
Reid, J. S., Hobbs, P. V., Ferek, R. J., Blake, D. R., Martins, J. V., Dunlap, M. R., and Liousse, C.: Physical, chemical, and optical properties of regional hazes dominated by smoke in Brazil, J. Geophys. Res.-Atmos., 103, 32059–32080, https://doi.org/10.1029/98JD00458, 1998.
Riedi, J. and Waquet, F.: The POLDER/PARASOL Products, http://www.icare.univ-lille1.fr/parasol/products/ (last access: 11 September 2019), 2015.
Sakaeda, N., Wood, R., and Rasch, P. J.: Direct and semidirect aerosol effects of southern African biomass burning aerosol, J. Geophys. Res.-Atmos., 116, D12205, https://doi.org/10.1029/2010JD015540, 2011.
Sayer, A. M., Hsu, N. C., Eck, T. F., Smirnov, A., and Holben, B. N.: AERONET-based models of smoke-dominated aerosol near source regions and transported over oceans, and implications for satellite retrievals of aerosol optical depth, Atmos. Chem. Phys., 14, 11493–11523, https://doi.org/10.5194/acp-14-11493-2014, 2014.
Smith, C. J., Kramer, R. J., Myhre, G., Forster, P. M., Soden, B. J., Andrews, T., Boucher, O., Faluvegi, G., Fläschner, D., Hodnebrog, Ø., Kasoar, M., Kharin, V., Kirkevåg, A., Lamarque, J.-F., Mülmenstädt, J., Olivié, D., Richardson, T., Samset, B. H., Shindell, D., Stier, P., Takemura, T., Voulgarakis, A., and Watson-Parris, D.: Understanding Rapid Adjustments to Diverse Forcing Agents, Geophys. Res. Lett., 45, 12023–12031, https://doi.org/10.1029/2018GL079826, 2018.
Stevens, B. and Brenguier, J.: Cloud controlling factors: Low clouds, in: Clouds in the perturbed climate, edited by: Heintzenberg, J. and Charlson, R., Cambridge, Mass, MIT Press, 173–196, 2009.
Swap, R. J., Annegarn, H. J., Suttles, J. T., Haywood, J., Helmlinger, M. C., Hely, C., Hobbs, P. V., Holben, B. N., Ji, J., King, M. D., Landmann, T., Maenhaut, W., Otter, L., Pak, B., Piketh, S. J., Platnick, S., Privette, J., Roy, D., Thompson, A. M., Ward, D., and Yokelson, R.: The Southern African Regional Science Initiative (SAFARI 2000): Overview of the dry season field campaign, in: South African Journal of Science, vol. 98, 125–130, National Research Foundation, available at: https://pennstate.pure.elsevier.com/en/publications/the-southern-african-regional-science-initiative-safari-2000-over (last access: 21 February 2019), 2002.
Szczodrak, M., Austin, P. H., and Krummel, P. B.: Variability of Optical Depth and Effective Radius in Marine Stratocumulus Clouds, J. Atmos. Sci., 58, 2912–2926, https://doi.org/10.1175/1520-0469(2001)058<2912:VOODAE>2.0.CO;2, 2001.
Torres, O., Jethva, H., and Bhartia, P. K.: Retrieval of Aerosol Optical Depth above Clouds from OMI Observations: Sensitivity Analysis and Case Studies, J. Atmos. Sci., 69, 1037–1053, https://doi.org/10.1175/JAS-D-11-0130.1, 2012.
Twomey, S.: Pollution and the Planetary Albedo, Atmos. Environ., 41, 120–125, https://doi.org/10.1016/j.atmosenv.2007.10.062, 2007.
Vanbauce, C., Cadet, B., and Marchand, R. T.: Comparison of POLDER apparent and corrected oxygen pressure to ARM/MMCR cloud boundary pressures, Geophys. Res. Lett., 30, 1212, https://doi.org/10.1029/2002GL016449, 2003.
Vaughan, M. A., Powell, K. A., Winker, D. M., Hostetler, C. A., Kuehn, R. E., Hunt, W. H., Getzewich, B. J., Young, S. A., Liu, Z., and McGill, M. J.: Fully Automated Detection of Cloud and Aerosol Layers in the CALIPSO Lidar Measurements, J. Atmos. Ocean. Tech., 26, 2034–2050, https://doi.org/10.1175/2009JTECHA1228.1, 2009.
Warren, S. G., Hahn, C. J., London, J., Chervin, R. M., and Jenne, R. L.: Colorado Univ., Boulder, CO, Colorado Univ., Boulder, CO, and National Center for Atmospheric Research, Boulder, CO, Global distribution of total cloud cover and cloud type amounts over the ocean, United States: N. p., https://doi.org/10.2172/5415329, 1988.
Waquet, F., Riedi, J., Labonnote, L. C., Goloub, P., Cairns, B., Deuzé, J.-L., and Tanré, D.: Aerosol Remote Sensing over Clouds Using A-Train Observations, J. Atmos. Sci., 66, 2468–2480, https://doi.org/10.1175/2009JAS3026.1, 2009.
Waquet, F., Cornet, C., Deuzé, J.-L., Dubovik, O., Ducos, F., Goloub, P., Herman, M., Lapyonok, T., Labonnote, L. C., Riedi, J., Tanré, D., Thieuleux, F., and Vanbauce, C.: Retrieval of aerosol microphysical and optical properties above liquid clouds from POLDER/PARASOL polarization measurements, Atmos. Meas. Tech., 6, 991–1016, https://doi.org/10.5194/amt-6-991-2013, 2013.
Watson-Parris, D., Schutgens, N., Winker, D., Burton, S. P., Ferrare, R. A., and Stier, P.: On the Limits of CALIOP for Constraining Modeled Free Tropospheric Aerosol, Geophys. Res. Lett., 45, 9260–9266, https://doi.org/10.1029/2018GL078195, 2018.
Wilcox, E. M.: Stratocumulus cloud thickening beneath layers of absorbing smoke aerosol, Atmos. Chem. Phys., 10, 11769–11777, https://doi.org/10.5194/acp-10-11769-2010, 2010.
Winker, D. M., Vaughan, M. A., Omar, A., Hu, Y., Powell, K. A., Liu, Z., Hunt, W. H., and Young, S. A.: Overview of the CALIPSO Mission and CALIOP Data Processing Algorithms, J. Atmos. Ocean. Tech., 26, 2310–2323, https://doi.org/10.1175/2009JTECHA1281.1, 2009.
Wood, R.: Stratocumulus Clouds, Mon. Weather Rev., 140, 2373–2423, https://doi.org/10.1175/MWR-D-11-00121.1, 2012.
Yorks, J. E., McGill, M. J., Scott, V. S., Wake, S. W., Kupchock, A., Hlavka, D. L., Hart, W. D., and Selmer, P. A.: The airborne Cloud-Aerosol transport system: Overview and description of the instrument and retrieval algorithms, J. Atmos. Ocean. Tech., 31, 2482–2497, https://doi.org/10.1175/JTECH-D-14-00044.1, 2014.
Young, S. A. and Vaughan, M. A.: The Retrieval of Profiles of Particulate Extinction from Cloud-Aerosol Lidar Infrared Pathfinder Satellite Observations (CALIPSO) Data: Algorithm Description, J. Atmos. Ocean. Tech., 26, 1105–1119, https://doi.org/10.1175/2008JTECHA1221.1, 2009.
Zhu, P., Bretherton, C. S., Köhler, M., Cheng, A., Chlond, A., Geng, Q., Austin, P., Golaz, J., Lenderink, G., Lock, A., and Stevens, B.: Intercomparison and Interpretation of Single-Column Model Simulations of a Nocturnal Stratocumulus-Topped Marine Boundary Layer, Mon. Weather Rev., 133, 2741–2758, https://doi.org/10.1175/MWR2997.1, 2005.
Zuidema, P., Painemal, D., De Szoeke, S., and Fairall, C.: Stratocumulus cloud-top height estimates and their climatic implications, J. Climate, 22, 4652–4666, https://doi.org/10.1175/2009JCLI2708.1, 2009.
Zuidema, P., Redemann, J., Haywood, J., Wood, R., Piketh, S., Hipondoka, M., Formenti, P., Zuidema, P., Redemann, J., Haywood, J., Wood, R., Piketh, S., Hipondoka, M., and Formenti, P.: Smoke and Clouds above the Southeast Atlantic: Upcoming Field Campaigns Probe Absorbing Aerosol's Impact on Climate, B. Am. Meteorol. Soc., 97, 1131–1135, https://doi.org/10.1175/BAMS-D-15-00082.1, 2016.