the Creative Commons Attribution 4.0 License.
the Creative Commons Attribution 4.0 License.
 | 04 Sep 2019
Chemical and optical properties of carbonaceous aerosols in Nanjing, eastern China: regionally transported biomass burning contribution
Xiaoyan Liu
Yan-Lin Zhang
Yiran Peng
Lulu Xu
Chunmao Zhu
Fang Cao
Xiaoyao Zhai
M. Mozammel Haque
Chi Yang
Yunhua Chang
Tong Huang
Zufei Xu
Mengying Bao
Wenqi Zhang
Meiyi Fan
Xuhui Lee
Biomass burning can significantly impact the chemical and optical properties of carbonaceous aerosols. Here, the biomass burning impacts were studied during wintertime in a megacity of Nanjing, eastern China. The high abundance of biomass burning tracers such as levoglucosan (lev), mannosan (man), galactosan (gal) and non-sea-salt potassium (nss-K+) was found during the studied period with the concentration ranges of 22.4–1476 ng m−3, 2.1–56.2 ng m−3, 1.4–32.2 ng m−3 and 0.2–3.8 µg m−3, respectively. The significant contribution of biomass burning to water-soluble organic carbon (WSOC; 22.3±9.9 %) and organic carbon (OC; 20.9±9.3 %) was observed in this study. Backward air mass origin analysis, potential emission sensitivity of elemental carbon (EC) and MODIS fire spot information indicated that the elevations of the carbonaceous aerosols were due to the transported biomass-burning aerosols from southeastern China. The characteristic mass ratio maps of lev∕man and lev∕nss-K+ suggested that the biomass fuels were mainly crop residuals. Furthermore, the strong correlation (p < 0.01) between biomass burning tracers (such as lev) and light absorption coefficient (babs) for water-soluble brown carbon (BrC) revealed that biomass burning emissions played a significant role in the light-absorption properties of carbonaceous aerosols. The solar energy absorption due to water-soluble brown carbon and EC was estimated by a calculation based on measured light-absorbing parameters and a simulation based on a radiative transfer model (RRTMG_SW). The solar energy absorption of water-soluble BrC in short wavelengths (300–400 nm) was 0.8±0.4 (0.2–2.3) W m−2 (figures in parentheses represent the variation range of each parameter) from the calculation and 1.2±0.5 (0.3–1.9) W m−2 from the RRTMG_SW model. The absorption capacity of water-soluble BrC accounted for about 20 %–30 % of the total absorption of EC aerosols. The solar energy absorption of water-soluble BrC due to biomass burning was estimated as 0.2±0.1 (0.0–0.9) W m−2, considering the biomass burning contribution to carbonaceous aerosols. Potential source contribution function model simulations showed that the solar energy absorption induced by water-soluble BrC and EC aerosols was mostly due to the regionally transported carbonaceous aerosols from source regions such as southeastern China. Our results illustrate the importance of the absorbing water-soluble brown carbon aerosols in trapping additional solar energy in the low-level atmosphere, heating the surface and inhibiting the energy from escaping the atmosphere.
Please read the corrigendum first before continuing.
-
Notice on corrigendum
The requested paper has a corresponding corrigendum published. Please read the corrigendum first before downloading the article.
-
Article
(8404 KB)
-
The requested paper has a corresponding corrigendum published. Please read the corrigendum first before downloading the article.
- Article
(8404 KB) - Full-text XML
- Corrigendum
- BibTeX
- EndNote


Biomass burning has been of great concern in recent years due to its severe impact on air quality and climate (Zhang et al., 2015; Gilman et al., 2015; J. Chen et al., 2017). Water-soluble organic carbon (WSOC) from biomass burning emission has a pronounced influence on the increase in aerosol cloud condensation nuclei (CCN) activity, which can lead to a cooling impact (Gao et al., 2003; Rogers et al., 1991; Novakov and Corrigan, 1996). Meanwhile, a portion of organic carbon (OC) could have a cooling effect on the land surface by scattering sunlight (Zhang et al., 2017; Myhre et al., 2013). A portion of OC is involved in the aging process of elemental carbon (EC) or black carbon (BC) as coating materials for the BC core, enhancing BC radiative absorption (Peng et al., 2016; Y. Wang et al., 2018). A fraction of OC can also directly absorb solar energy, functioning similarly to BC, which is referred to as brown carbon (BrC) (Laskin et al., 2015). But BrC is different from BC due to its strong light absorption from visible (VIS) to ultraviolet (UV) wavelengths, thus having a stronger wavelength dependence than BC (Andreae and Gelencsér, 2006). Radiative forcing of BC is estimated to be 0.2–1.2 W m−2 (Moffet and Prather, 2009), while radiative forcing of BrC contribution is suggested to be up to 0.25 W m−2 and contribute up to 19 % of the total atmospheric absorption computed by model simulations (Feng et al., 2013). As a part of WSOC, water-soluble BrC is rich in the biomass burning smoke (Washenfelder et al., 2015). Taken together, biomass burning can affect climate and aerosol chemical compositions in an extremely complex way. All effects mentioned above are both regional and global owing to the aerosol long-range transport. Numerical studies have shown that emissions from biomass burning can be transported to remote sites, even across the oceans (Aouizerats et al., 2015; Zhu et al., 2016; Ancellet et al., 2016). Aouizerats et al. (2015) modeled a large fire-induced haze episode in 2006 stemming mostly from Indonesia using the Weather Research and Forecasting model coupled with chemistry and found a notable impact of long-range transported aerosols from Indonesia on ambient air quality and climate in Singapore. Ancellet et al. (2016) made the assessment of aerosol transport from North America to Europe using forward simulations of the FLEXPART Lagrangian particle dispersion model.
Due to the significant role of carbonaceous aerosols in biomass burning plumes, it is important to quantify the contribution from biomass burning to carbonaceous species such as OC, EC, WSOC and BrC. In the observation-based studies, the characteristic ratio and positive matrix factorization are frequently used to calculate biomass burning contribution. OC and EC proportions released by biomass burning were shown to be 45±12 % and 12±7.3 %, respectively, in the harvest season in Daejeon, Korea (Jung et al., 2014). These numbers are comparable with the results for the harvest seasons in the Yangtze River Delta region, China, where biomass burning contributed 51 % and 16 % to OC and EC concentrations, respectively (D. Chen et al., 2017). The share of OC in PM2.5 produced by biomass burning in Beijing ranged from 18 % to 70 % in different seasons and areas (Duan et al., 2004; T. Zhang et al., 2008; Cheng et al., 2013). In addition, a large quantity of BrC with light-absorbing properties was detected in biomass burning emissions in southern Asia and the United States, and in some controlled wood pyrolysis experiments (Bosch et al., 2014; Chen and Bond, 2010; Hecobian et al., 2010; Kirchstetter et al., 2004). It was reported that 23±7 % and 16±7 % of WSOC originated from biomass burning in Beijing, in winter and summer, respectively (Yan et al., 2015). Meanwhile, the contributions of biomass burning to WSOC in the PM10 in Mexico ranged from 7 % to 57 % (Tzompa-Sosa et al., 2016). These studies have demonstrated important contributions of biomass burning to carbonaceous aerosols. Levoglucosan (lev) is recommended to be a biomass burning tracer because it is uniquely derived from cellulose pyrolysis (Simoneit et al., 1999, 2004; Simoneit, 2002). Levoglucosan has been initially quantified by gas chromatography–mass spectrometry (GC-MS) with a relatively complex operation procedure and at a high cost (Fraser and Lakshmanan, 2000; Graham et al., 2003; Oros and Simoneit, 2001). With the improvement of technology, a new detection method, named high-performance anion-exchange chromatography coupled to pulsed amperometric detection (HPAEC-PAD), has emerged (Engling et al., 2006). The HPAEC-PAD approach is as reliable as traditional methods (such as GC), but with a higher efficiency, an easier operation and a lower cost. The new method can simultaneously quantify other carbohydrates in ambient samples, including mannosan (man) and galactosan (gal), which are also anhydrosugars and used as tracers of biomass burning like levoglucosan (Engling et al., 2006; Jung et al., 2018; Tsai et al., 2015). Additionally, non-sea-salt potassium (nss-K+) is also a tracer of biomass burning, calculated by the formula nss- Na+, to exclude K+ originating from seawater (Lai et al., 2007; Cao et al., 2016). Nowadays, the above four tracers are applied to both qualitatively and quantitatively investigate the biomass burning impact. Furthermore, their characteristic ratios help researchers to better recognize the biomass fuel types (Puxbaum et al., 2007; Mochida et al., 2010; Wang et al., 2011; Cheng et al., 2013, 2014; Zhang et al., 2012)
Biomass burning aerosol has significant impacts on regional and global radiative forcing (Ramanathan and Carmichael, 2008). There is no doubt that elemental carbon increases the solar absorption of ambient aerosols most effectively (Ramanathan and Carmichael, 2008; Myhre and Samset, 2015; K. Li et al., 2016). Lack et al. (2012) found that the absorptivity of BC and primary organic matter mixtures has 70 % enhancement in biomass burning periods compared to normal days in Boulder, Colorado. Meanwhile, the role of BrC in the radiation balance of the climate system has attracted increasing interest. Shamjad et al. (2015) mentioned that the atmospheric radiative forcing of total aerosol increases by 56 %, and the forcing of BrC aerosol increases by 38 % in the biomass burning season comparing to other seasons in Kanpur, India. Light absorption characteristics of WSOC aerosols are key factors in the climate forcing calculation. Light-absorbing parameters, including the absorption coefficient, mass absorption efficiency and absorption Ångström exponent, have been involved to describe the light absorption characteristics of BrC (Alexander et al., 2008; Yang et al., 2009; Chakrabarty et al., 2016; Choudhary et al., 2017; Srinivas et al., 2016). Hoffer et al. (2006) found that the contribution of humic-like substances to total aerosol absorption was as high as 50 % at the wavelength of 300 nm in the Amazon basin. Hecobian et al. (2010) measured the optical properties of WSOC in Atlanta, US, and their results showed that the absorption coefficient around 365 nm had a strong correlation with WSOC from biomass burning or from urban emissions. Du et al. (2014b) calculated mass absorbance efficiency for WSOC from a biomass burning factor derived from a positive matrix factorization receptor model. It showed that the biomass burning source contributed 58 % of total light absorption at 365 nm and WSOC associated with sulfate and oxalate contributed 21 %. Using a simplistic absorption-based model, Kirillova et al. (2014b) estimated the relative absorptive forcing of WSOC compared to EC in the winter season at New Delhi, India. Their results indicated that the contribution of WSOC to total absorption was between 3 % and 11 %. C. Li et al. (2016) applied a similar method in the Tibetan Plateau and found that the radiative forcing caused by WSOC was 6.03±3.62 % and 11.41±7.08 % of that caused by EC at two stations there, respectively. The aforementioned method provides a rough estimation of the absorption of solar energy by WSOC and EC, by using the measured sample concentrations of WSOC and EC and the optical properties of WSOC. Many assumptions were applied in that method, and thus uncertainties in the estimated forcing could be substantial. Additionally, Jung et al. (2015) evaluated the instantaneous forcing of WSOC. They calculated the aerosol optical properties and applied a simplified expression to account for the radiative transfer process. Their results showed that the radiative forcing of WSOC aerosol (assumed core-shell mixing with inorganic components) ranged from −0.07 to −0.49 W m−2 at the top of the atmosphere (TOA). In a recent study, Panicker et al. (2017) applied an aerosol optical model embedded in a radiative transfer model to investigate the radiative forcing for OC and EC under two urban environments in northern India. The model can produce quite realistic results as long as the default database and user-specified inputs represent the real atmospheric conditions in the model. In this study, we estimate the radiative forcing of WSOC and EC with a radiative transfer model.
Physical and optical properties of carbonaceous aerosols alter with the transport process and modify their radiative forcing accordingly. For example, pollutants from biomass burning in northern Asia and North America can be transported to the Arctic with the poleward jet at midlatitudes and have non-negligible effects on Arctic climate (Shindell and Faluvegi, 2009). During the transport process, BC and BrC are prone to being internally mixed with other gas and particle pollutants from biomass burning, resulting in multiplication of the absorptivity due to the lensing effect (Bond and Bergstrom, 2006). Using a novel chamber method, Peng et al. (2016) found two stages in the aging of BC: initial transformation with little absorption variation and subsequent growth with a profound absorption enhancement. It was also revealed that BC in areas with a more polluted urban background had a more remarkable impact on the pollution development and the radiative forcing enhancement (Peng et al., 2016). Model simulations calibrated by chamber measurements showed significant differences in BC burden and radiative forcing from the simulations without considering BC aging. In addition, BC coating materials from aging processes were found to be responsible for a net increase in BC radiative forcing (Y. Wang et al., 2018). Quantification of BrC property change with the transport of biomass burning aerosols and estimation of its contribution to the regional radiative forcing are both essential for better understanding the climate effects of BrC. So far only a few studies have focused on the light-absorbing properties of BrC from biomass burning in China (Cheng et al., 2011; Du et al., 2014b; Yan et al., 2015). It was shown that over short wavelengths (300–400 nm), light absorption by WSOC, which is often used as the surrogate for water-soluble BrC, was ∼40 % and ∼25 % of that by EC in winter and summer, respectively (Yan et al., 2015). However, the BrC light absorption quantification due to biomass burning has not been identified.
China, the top crop-producing country in the world, has a history of burning crop residuals (Zhang et al., 2016), making China a hotspot of biomass burning research. As soon as it became evident that biomass burning emission is detrimental to the environment and human health, China's government introduced policies to prohibit straw burning. These policies are now implemented strictly, so that open biomass burning has been quite rare in recent years, especially in eastern China. Under this background, this study is mainly aimed at a wintertime pollution event in eastern China and intended to determine the origin of biomass burning aerosols and figure out the impacts of regionally transported biomass burning on chemical and optical properties of carbonaceous aerosols. To achieve these goals, 3 h PM2.5 samples have been collected and analyzed to determine the aerosol chemical compositions and light-absorbing properties. The solar energy absorption of carbonaceous aerosols was estimated by the calculation based on measured light-absorbing parameters and the simulation based on a radiative transfer model (RRTMG_SW).
2.1 Site description and sample collection
The observation site NUPT (32.09∘ N, 118.78∘ E) was located in the campus of Nanjing University of Posts and Telecommunications. It is in an urban area of eastern China, one of the China's economic centers and also one of the world's most advanced manufacturing bases. This site represents a severely anthropogenically influenced environment, with a complex pollution pattern contributed by vehicles, industries, biomass burning and atmospheric transport.
The sampling campaign was conducted from 14 to 30 January 2015. PM2.5 samples were collected at a flow rate of 1.05 m3 min−1 with a nominal sampling time of 3 h for each sample. Blank filters were kept in the sampler for 1 min, without air flow, at both the beginning and the end of this campaign. All filters used for sample collection were quartz fiber filters, which had been prebaked at 450 ∘C for 6 h to eliminate organic material.
2.2 Sample analysis for carbonaceous components
OC and EC were detected using a Desert Research Institute (DRI) Model 2001 Thermal Optical Carbon Analyzer (Atmoslytic Inc., Calabasas, USA). A portion of sampled filter (0.53 cm2) was analyzed following the IMPROVE thermal optical reflectance (TOR) protocol (Bao et al., 2017). For the determination of WSOC, a portion of each filter with a size of 4.02 cm2 was removed from the parent filter and extracted with 10 mL ultrapure water in a sonication bath for 30 min. The water extracts were filtered through syringe filters (0.22 µm, ANPEL, Shanghai, China) for WSOC concentration analysis by a TOC analyzer (TOC-L, Shimadzu, Kyoto, Japan) following the WSTC-WSIC protocol. All the calculations related to the carbonaceous components were blank corrected and the system error between DRI and TOC-L analyzers was corrected by testing a sucrose solution of a specific concentration.
2.3 Extraction and analysis of ion and carbohydrates
A portion of each sample filter (5.07 cm2) was cut off and extracted with 10 mL ultrapure water (> 18.2Ω) via ultrasonic agitation (30 min). The extract solution was filtered to remove insoluble materials and then used for ion analysis by ion chromatography on a ThermoFisher Scientific ICS-5000+ system (US) equipped with a gradient pump, a conductivity detector/chromatography compartment and an automated sampler. The separation of cations was carried out on an IonPac CS12A analytical column and an IonPac CG12A guard column with aqueous methanesulfonic acid (MSA, 30 mM L−1) eluent at a flow rate of 1 mL min−1. While anions were separated on an IonPac AS11-HC analytical column and an IonPac AG11-HC guard column using sodium hydroxide (NaOH) gradient elution at a flow rate of 1.5 mL min−1: 0–3 min, 0.5 mM L−1; 3–5 min, 0.5–5 mM L−1; 5–15 min, 5–30 mM L−1; 15–20 min, 0.5 mM L−1.
The extraction procedure for carbohydrate analysis was basically same as that for ions, except that the water volume was changed from 10 to 2 mL. The equipment of the ion chromatography system used was largely the same, except that a conductivity detector was replaced by an electrochemical detector. The carbohydrates were separated by a CarboPac MA1 column and a matched guard column using NaOH gradient elution at a flow rate of 0.4 mL min−1. To determine levoglucosan and galactosan the elution was run at a time gradient: −15–34 min, 300 mM L−1; 34–45 min, 300–480 mM L−1; 45–60 min, 480 mM L−1. For mannosan, the elution was run at another time gradient: −15–5 min, 50 mM L−1; 5–25 min, 250 mM L−1; 25–35 min, 250–350 mM L−1; 35–40 min, 350–650 mM L−1; 40–70 min, 650 mM L−1. The volume of the sample loop was 200 µL. All ions and carbonaceous components amount calculations were corrected by the mean value of two field blanks.
2.4 Extraction and analysis of WSOC light-absorbing property
A fraction of sampled filter (5.02 cm2) was cut and extracted with 2 mL ultrapure water. The filter extract was tested for light absorption by an ultraviolet-visible absorption spectrophotometer (UV-2600, Shimadzu, Kyoto, Japan) with a scanning wavelength range of 200–800 nm. The absorption coefficient (babs, M m−1 or 10−6 m−1) at 365 nm was calculated by Eq. (1):
where A365 and A700 refer to absorbance (or light attenuation) at 365 and 700 nm, respectively, measured by the spectrometer; Vwater (mL) corresponds to the volume of the aqueous extract (water); the factor is set to 103, which is estimated from the absorption signal for the full filter; Vaero (m3) refers to the volume of air filtered; and L (mm) is the path length of the cell (10 mm). The choice of 365 nm as the reference wavelength to represent light absorption of WSOC is made according to the strong light-absorbing capacity and also is meant to avoid light-absorbing disturbance by other substances in the extract. Absorbance at 700 nm represents the baseline drift in the analysis (Bosch et al., 2014; Cheng et al., 2011; Hecobian et al., 2010). Mass absorption efficiency (MAE, m2 g−1) of BrC in WSOC was derived from Eq. (2):
where WSOC refers to the concentration of WSOC (µg m−3). Absorption Ångström exponents (AAE) were computed by Eq. (3):
where K is a constant, AAE describes the wavelength-dependent absorption enhancement of BrC, associated with its origin, size and composition (Bikkina, 2014); and λ is wavelength in the range of 310–460 nm. AAE for WSOC was fitted within the range of 310–460 nm in which coefficients of determination (R2) for all samples are above 0.90. The solar energy absorbance of WSOC and EC at the ground level was estimated using Eqs. (4) and (5):
where I(λ) is the clear-sky Air Mass 1 Global Horizontal (AM1GH) solar radiance spectrum at the surface; hABL refers to the vertical height of the boundary layer (set to 1000 m); MAEEC is set as 7.5±1.2 m2 g−1, which is the MAE of EC at 550 nm; and EC (µg m−3) is the EC concentration in each sample. The fraction EWSOC∕EEC is the ratio of EWSOC and EEC, comparing the light-absorbing capacity of BrC in WSOC and EC. Here EWSOC, EEC and EWSOC∕EEC were computed in a wavelength range of 300–400 nm (Bosch et al., 2014; Kirillova et al., 2014b; Bond and Bergstrom, 2006; Yan et al., 2015).
2.5 Radiative forcing estimation with model
We also estimated the radiative forcing of WSOC and EC with a stand-alone radiative transfer model RRTMG_SW (Global climate model version of Short Wave Rapid Radiative Transfer Model) (Iacono Michael et al., 2000). The correlated-k approach was applied in RRTMG_SW to calculate radiative fluxes and heating rates in 14 contiguous bands in the shortwave (820–500 00 cm−1). The stand-alone RRTMG_SW can be driven by a given atmospheric profile. In this study, we prescribed the midlatitude winter atmospheric profile, which is default in the RRTMG package (Iacono Michael et al., 2008; Mlawer and Clough, 1998). We chose the average solar zenith angle of 60∘ in the midlatitude regions (Li, 2017) and ran RRTMG_SW for clear-sky conditions without the impact of cloud.
Aerosol radiative (absorptive) properties for WSOC and EC are parameterized in terms of their mass concentrations in RRTMG_SW. The optics per unit mass (mass absorption efficiency, MAE*; single scattering albedo, SSA*; and asymmetry factor, g*) of EC was provided from the Optical Properties of Aerosols and Clouds (OPAC) dataset (Hess et al., 1998). For WSOC, we calculated the optics using the Mie model (Bohren and Huffman, 1998; Pruppacher and Klett, 1997) with the input optics and prescribed size parameters. Refractive index (RI) was set to be 1.55–0.112i (Kirchstetter et al., 2004; Shamjad et al., 2016). The density of WSOC is 1.569 g cm−3 (Feng et al., 2013). The dry-mode radius and standard deviation of the WSOC particle size distribution were assumed to be 0.0212 µm and 2.24, respectively (Hess et al., 1998). Because WSOC is hydrophilic, we also calculated the wet particle radius and wet RIs according to Pruppacher and Klett (1997). The optics of WSOC obtained from the Mie model were provided to RRTMG_SW for radiative calculations.
2.6 Footprint analysis, PSCF models and fire hotspots
The FLEXPART Lagrangian particle dispersion model was used to estimate the footprint of the site (Stohl et al., 1998, 2005; Grythe et al., 2017). FLEXPART version 10.1 was run in the backward model in which the potential emission sensitivity (PES) of the receptor point is provided (Seibert and Frank, 2004). The operational reanalyzed data from the European Centre for Medium-Range Weather Forecasts (ECMWF) at a spatial resolution of with 61 vertical levels were used as meteorology. The simulation considered BC (corresponding to EC in this study) as the tracer species, and dry deposition and wet scavenging were accounted for. The output was set as the retention time(s) of particles in each grid during the simulation period. The HYSPLIT 4.8 model from NOAA was used to compute 48 h backward trajectories of air masses reaching Nanjing sites at a planetary boundary layer (PBL) height of 500 m. MODIS fire hotspot data were applied to evaluate open biomass burning intensity during the study period. The Potential Source Contribution Function (PSCF) model was usually applied to localize the potential sources of pollutants. The details about the setup of the model can be seen in the research of Bao et al. (2017). Here we introduce the light absorbance of WSOC into the model. The higher the PSCF value, the higher the possibility that the areas make potential contributions to the light absorbance of WSOC in the aerosols at the receptor site.
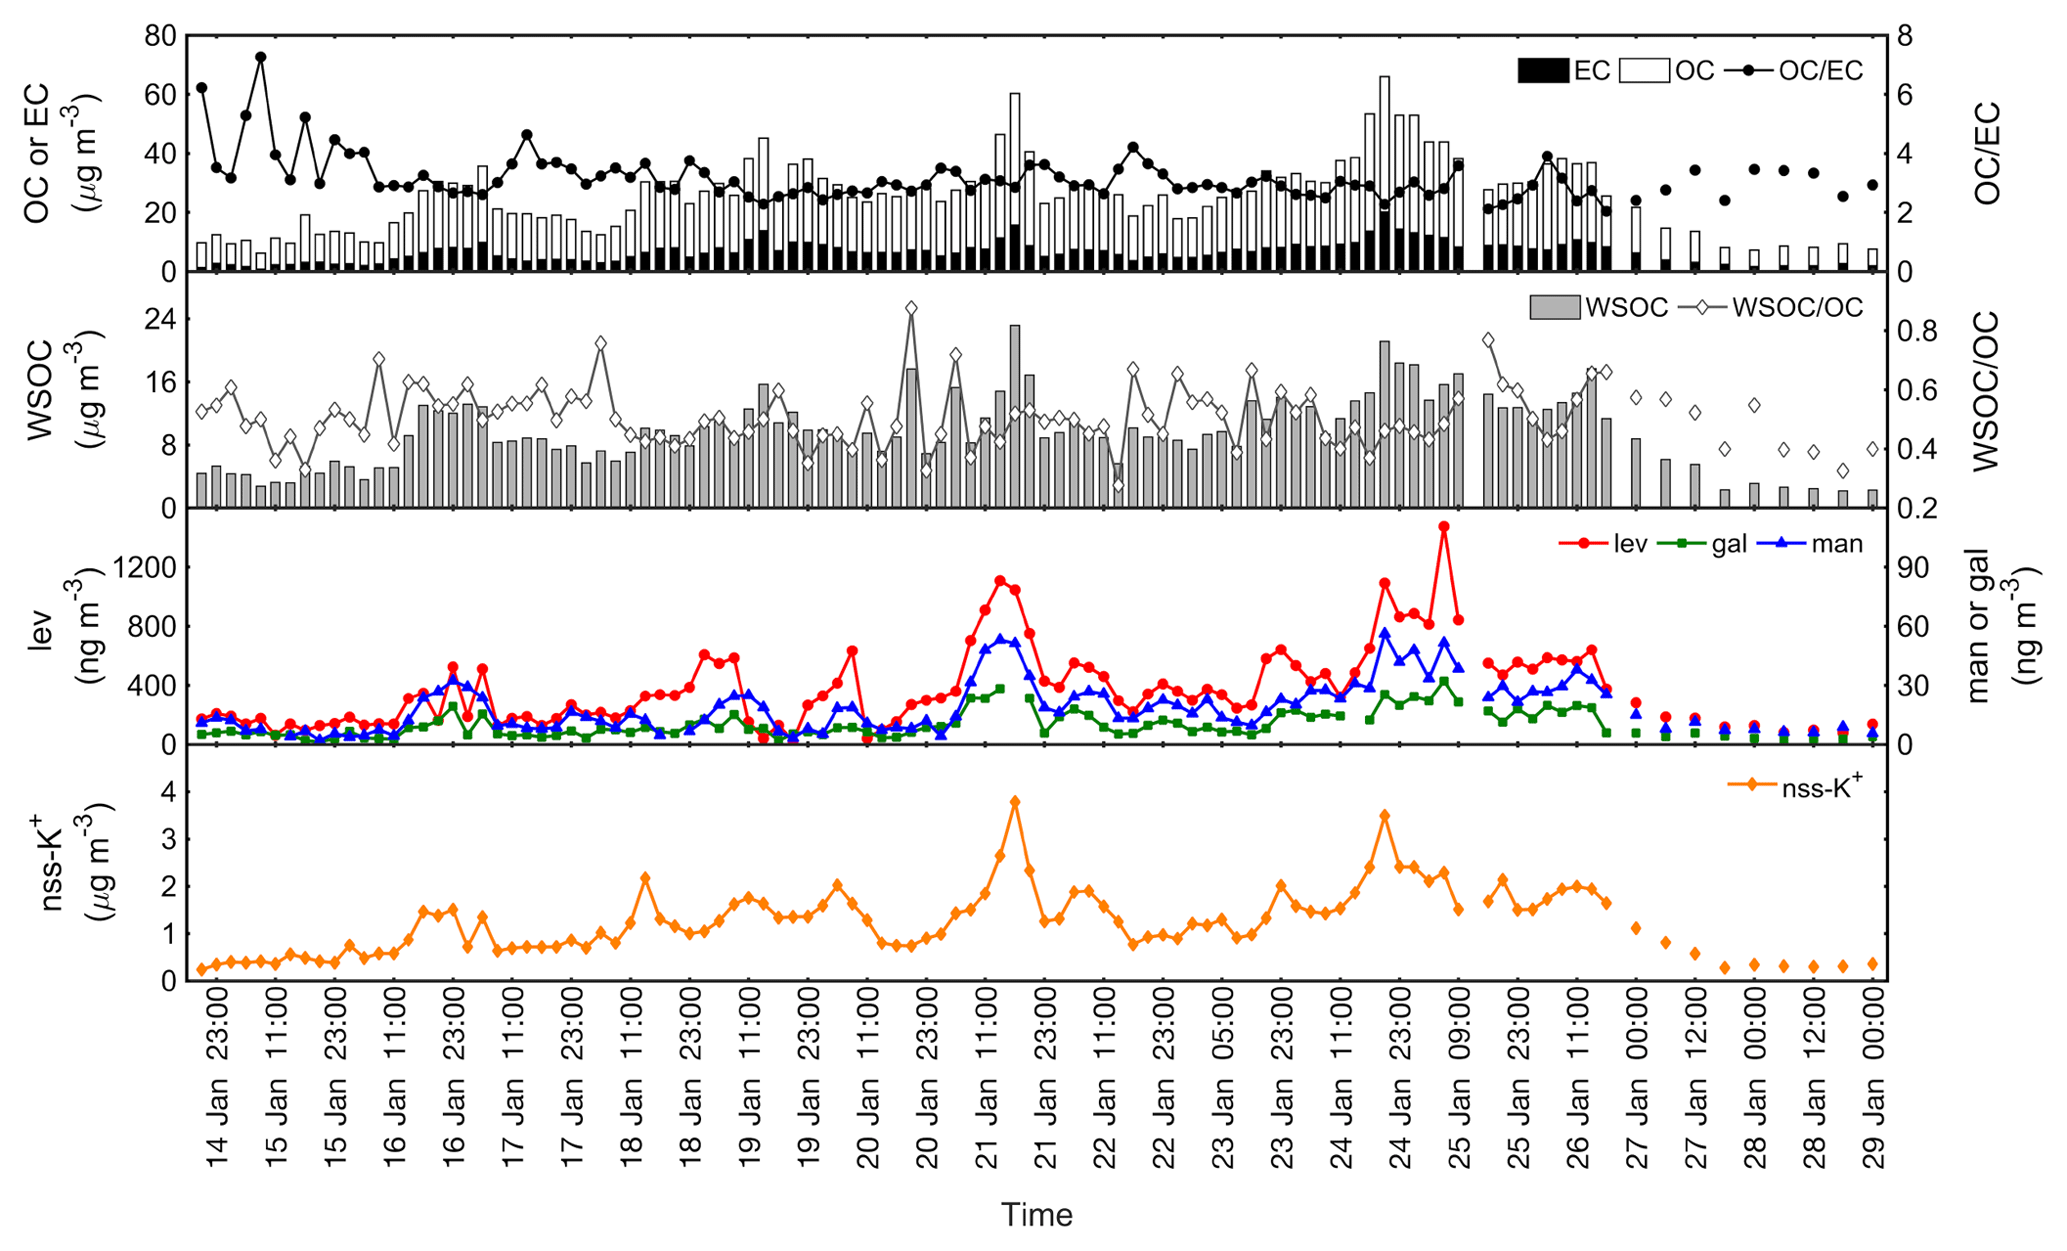
Figure 1Time series of OC, EC, WSOC, levoglucosan (lev), mannosan (man), galactosan (gal) and non-sea-salt potassium (nss-K+) concentrations as well as OC∕EC and WSOC∕OC ratios for PM2.5 samples. The horizontal ordinate indicates the ending time for each sample.
3.1 Carbonaceous components
The temporal variations of OC∕EC ratios and OC and EC concentrations in PM2.5 during the studied episode are plotted in Fig. 1. The average concentrations of OC and EC were 19.1±8.6 and 6.6±3.5 µg m−3, respectively (Table 1). Our results are comparable to the seasonal mean levels of OC and EC in PM2.5 in the winter of 2015 in a nearby site in Nanjing, which were 22.5±9.6 and 8.2±3.1 µg m−3, respectively (Li et al., 2015). OC shows a robust relationship with EC (R2=0.90, p < 0.01), which underlines the significant contribution of fuel burning to OC, since EC is only released by inefficient combustion (Liu et al., 2014a). In this study, EC peaked at 17:00 LT on 21 January and 20:00 LT on 24 January, implying intensive fuel burning at those times. OC ranged from 5.5 to 45.8 µg m−3 and EC ranged from 0.8 to 20.1 µg m−3. The relative standard deviation was used to represent the variation of OC (44 %) and EC (53 %), suggesting that EC had a larger uncertainty than OC. It indicates that EC came from a variety of combustion sources which were dynamic and unstable. The variation of OC and EC over time led to the significant changes in PM2.5 levels.
Table 1Concentration and mass ratio of atmospheric gaseous components and particulate species (PM2.5), biomass burning contribution to carbonaceous aerosol, light-absorption parameters of water-soluble BrC, and solar energy absorption of carbonaceous aerosols.
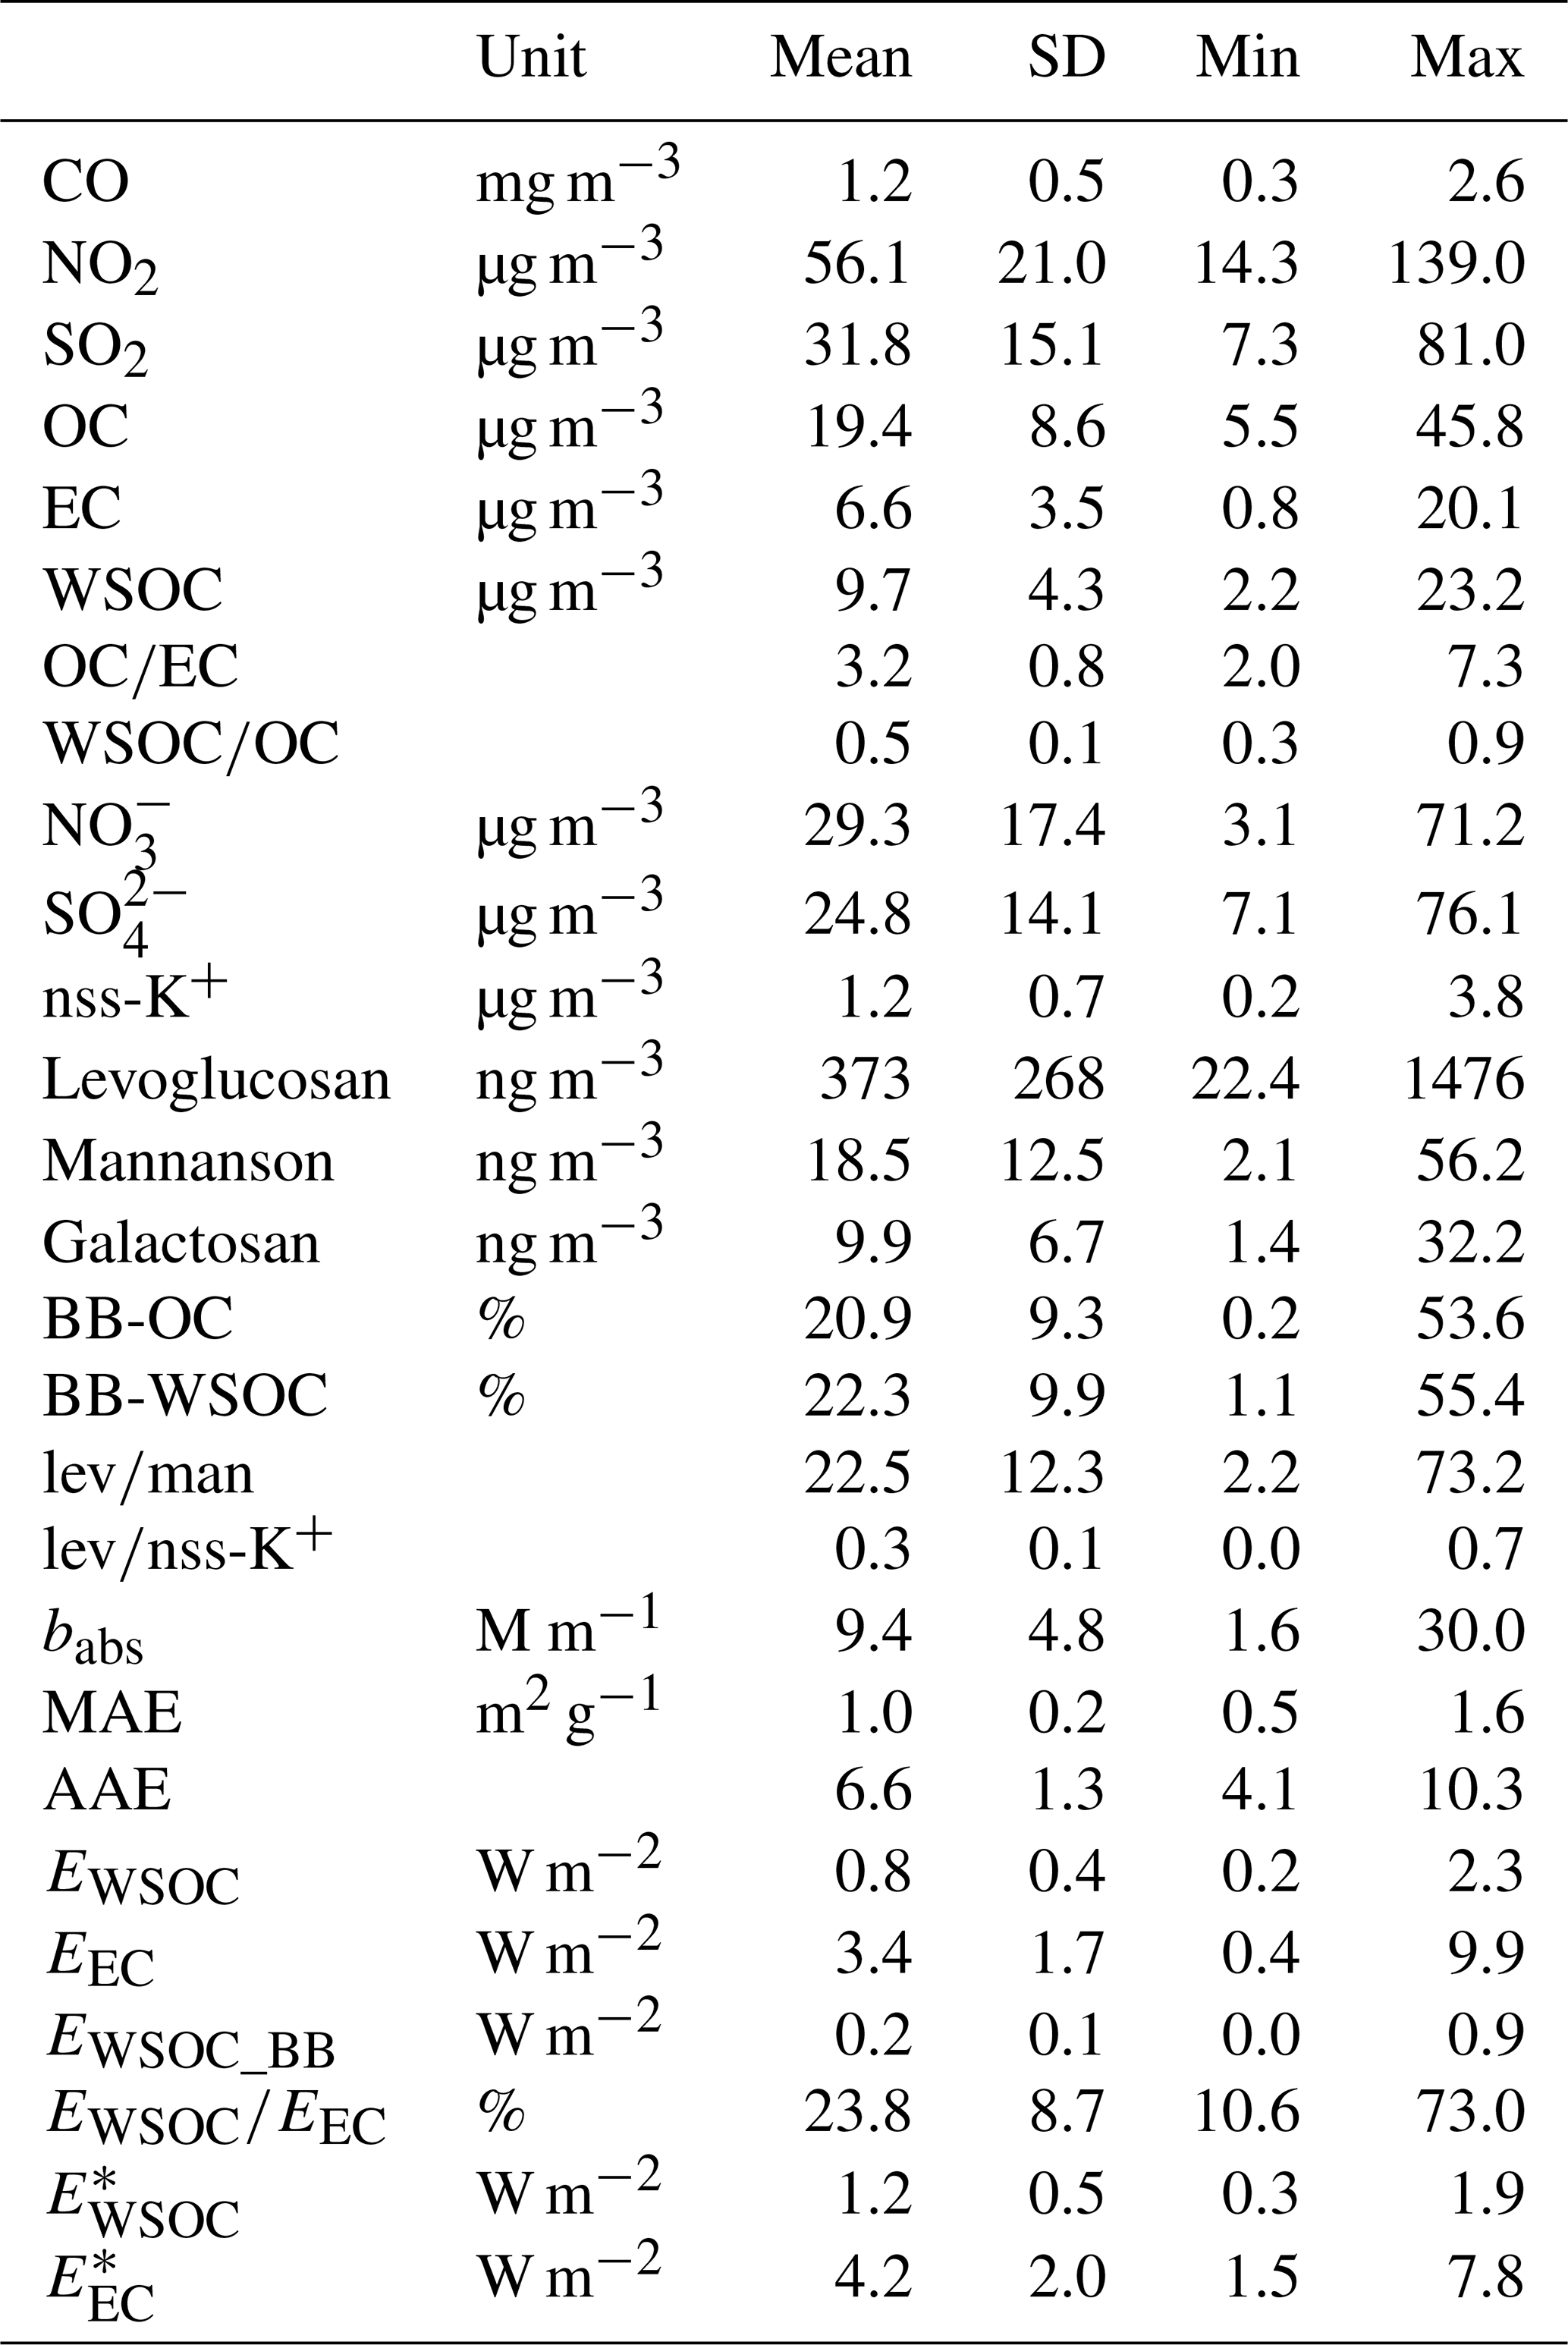
* Refers to values derived from the RRTMG_SW model simulation.
The OC∕EC ratios varied from 2.0 to 7.3, with a mean value of 3.2±0.8. The OC∕EC ratio is usually used as the indicator of secondary organic carbon (Hou et al., 2011; Zeng and Wang, 2011). According to the temporal variation of the OC∕EC ratio in Fig. 1, the impact of secondary organic carbon varied in different stages of the pollution episode. The OC∕EC ratio variation range was 2.0–7.3 when the atmosphere was cleaner. Generally, an OC∕EC ratio above two means a significant contribution of secondary organic aerosol (SOA) (Haque et al., 2019; Kunwar and Kawamura, 2014). As the pollution got more severe over time, it shrank to 2.0–4.0 after 16 January, indicating that the secondary sources had a relatively stable but still considerable impact on PM2.5 at the polluted stage. According to the previous studies, secondary organic aerosol usually played an important role in the wintertime air pollution (Huang et al., 2014; Sun et al., 2013).
Temporal variations of WSOC concentration and WSOC∕OC ratio are illustrated in Fig. 1. The average concentration of WSOC in the event was 9.7±4.3 µg m−3 and WSOC varied from 2.2 to 23.2 µg m−3. WSOC was at a higher level in this pollution episode than in the episodes reported by Du et al. (2014a). It was reported that WSOC was abundant in biomass burning emissions in previous studies (Jaffrezo et al., 2005; Park and Cho, 2011). In addition, a strong correlation was also found between OC and WSOC (R2 > 0.70, p < 0.01), and the WSOC∕OC mass ratio was averaged to 0.5±0.1, a value consistent with that of another study (Bikkina, 2014). If a major portion of OC was derived from combustion, WSOC could be very likely released from fuel burning. Moreover, WSOC is an important form of BrC, which is able to absorb light radiation. It seems that biomass burning can emit BrC, increasing the light-absorbing capacity of aerosols.
3.2 Chemical species related to fossil fuel combustion
To explore the combustion sources, the roles of traffic and industrial emissions, which are main fossil fuel combustion sources in the urban area (Cao et al., 2005), were first investigated. Nitrogen dioxide (NO2) is the main chemical component in motor vehicle exhaust (Kendrick et al., 2015), and sulfur dioxide (SO2) is usually treated as the tracer for coal combustion widely existing in industrial activities (Akimoto and Narita, 1994). Therefore, the sum of NO2 and SO2 concentrations can represent the contribution of fossil fuel combustion to the atmospheric pollutants. As shown in Fig. 2, carbon monoxide (CO) and the sum of NO2 and SO2 concentrations have a positive correlation, but with a low correlation coefficient (R2=0.40, p < 0.01). The same pattern is also shown between EC and sum of nitrate (NO) and sulfate () in PM2.5 (R2=0.46, p < 0.01). These patterns suggest that fossil fuel was not the only main type of fuel and that biomass fuel might have been burned during the episode.
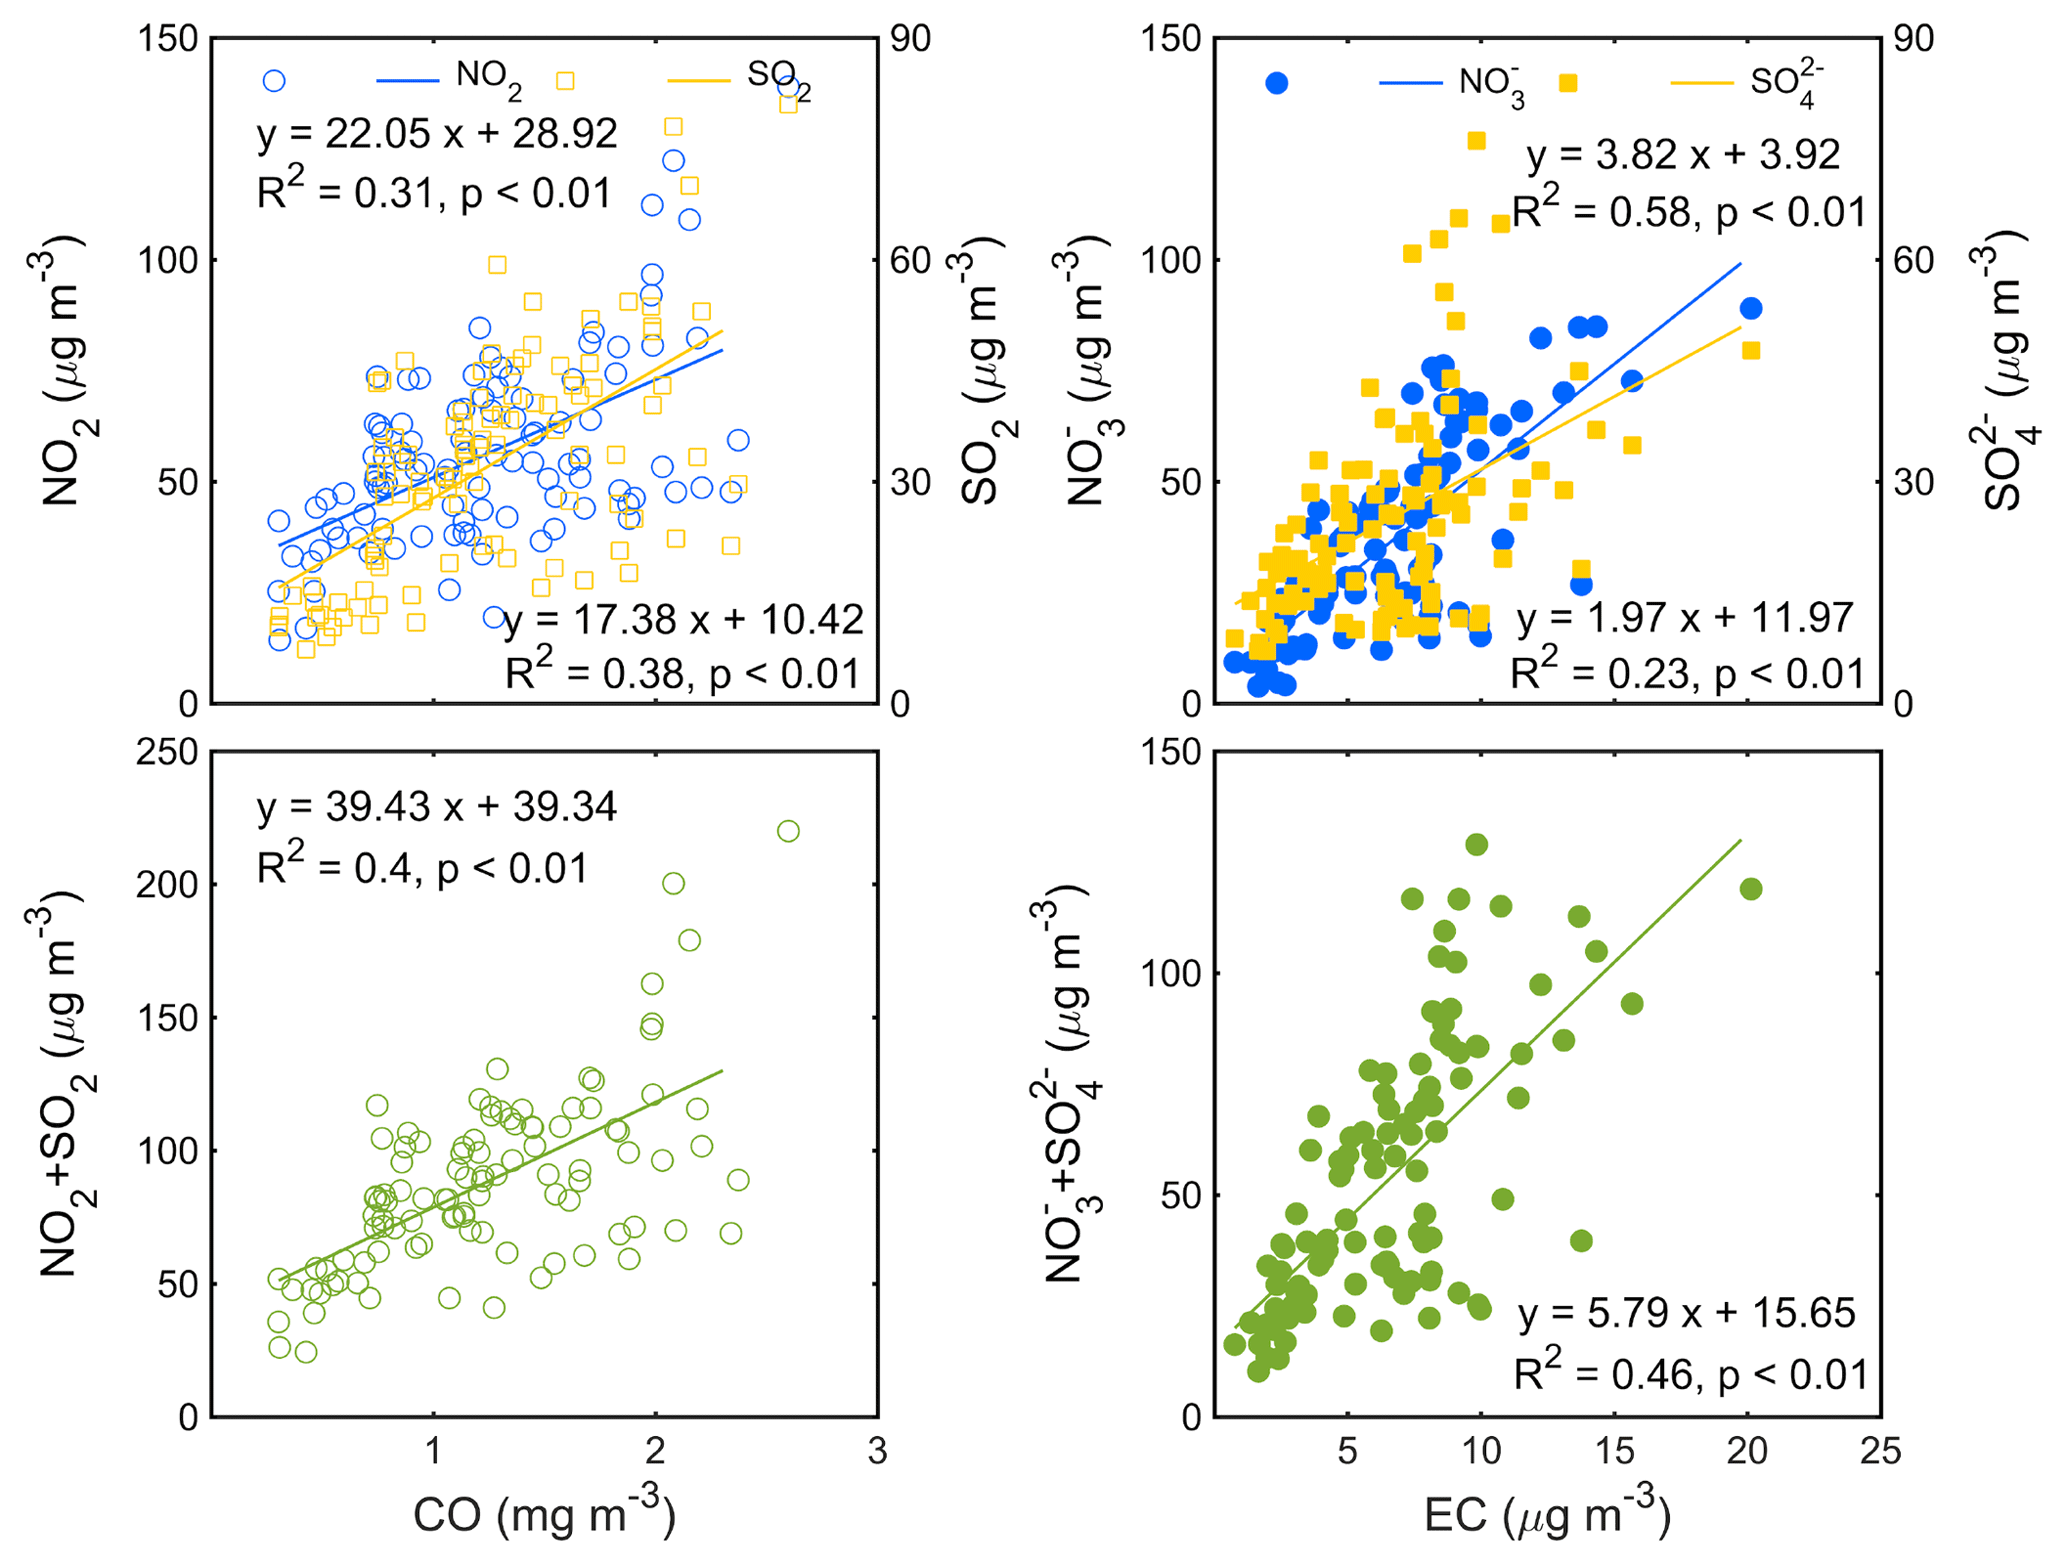
Figure 2Correlations of carbon monoxide (CO) with nitrogen dioxide (NO2), sulfur dioxide (SO2) and the sum of nitrogen dioxide and sulfate dioxide (NO2+SO2) in ambient air, and correlations of EC with nitrate (), sulfate () and the sum of nitrate and sulfate () in PM2.5 from 14 to 29 January 2015 in Nanjing.
3.3 Biomass burning tracers
Tracers of biomass burning have been introduced to describe the role of biomass burning in this event. As shown in Fig. 3, all tracers strongly correlate with each other (R2 > 0.60, p < 0.01). But there is a more significant correlation between anhydrosugars (R2 > 0.75, p < 0.01) than that between nss-K+ and anhydrosugars (, p < 0.01). Because of the non-unique origin of potassium, nss-K+ seems a weak tracer of biomass burning, in agreement with other published results. K+ has additional significant sources other than biomass burning, such as seawater, soil resuspension and fertilizers (Urban et al., 2012). Furthermore, K+ is abundant in firework aerosols according to several recent studies (Cheng et al., 2013; Drewnick et al., 2006). Among all three types of anhydrosugars, levoglucosan was treated as the main tracer in this study because of its larger quantity in PM2.5 than the other two.
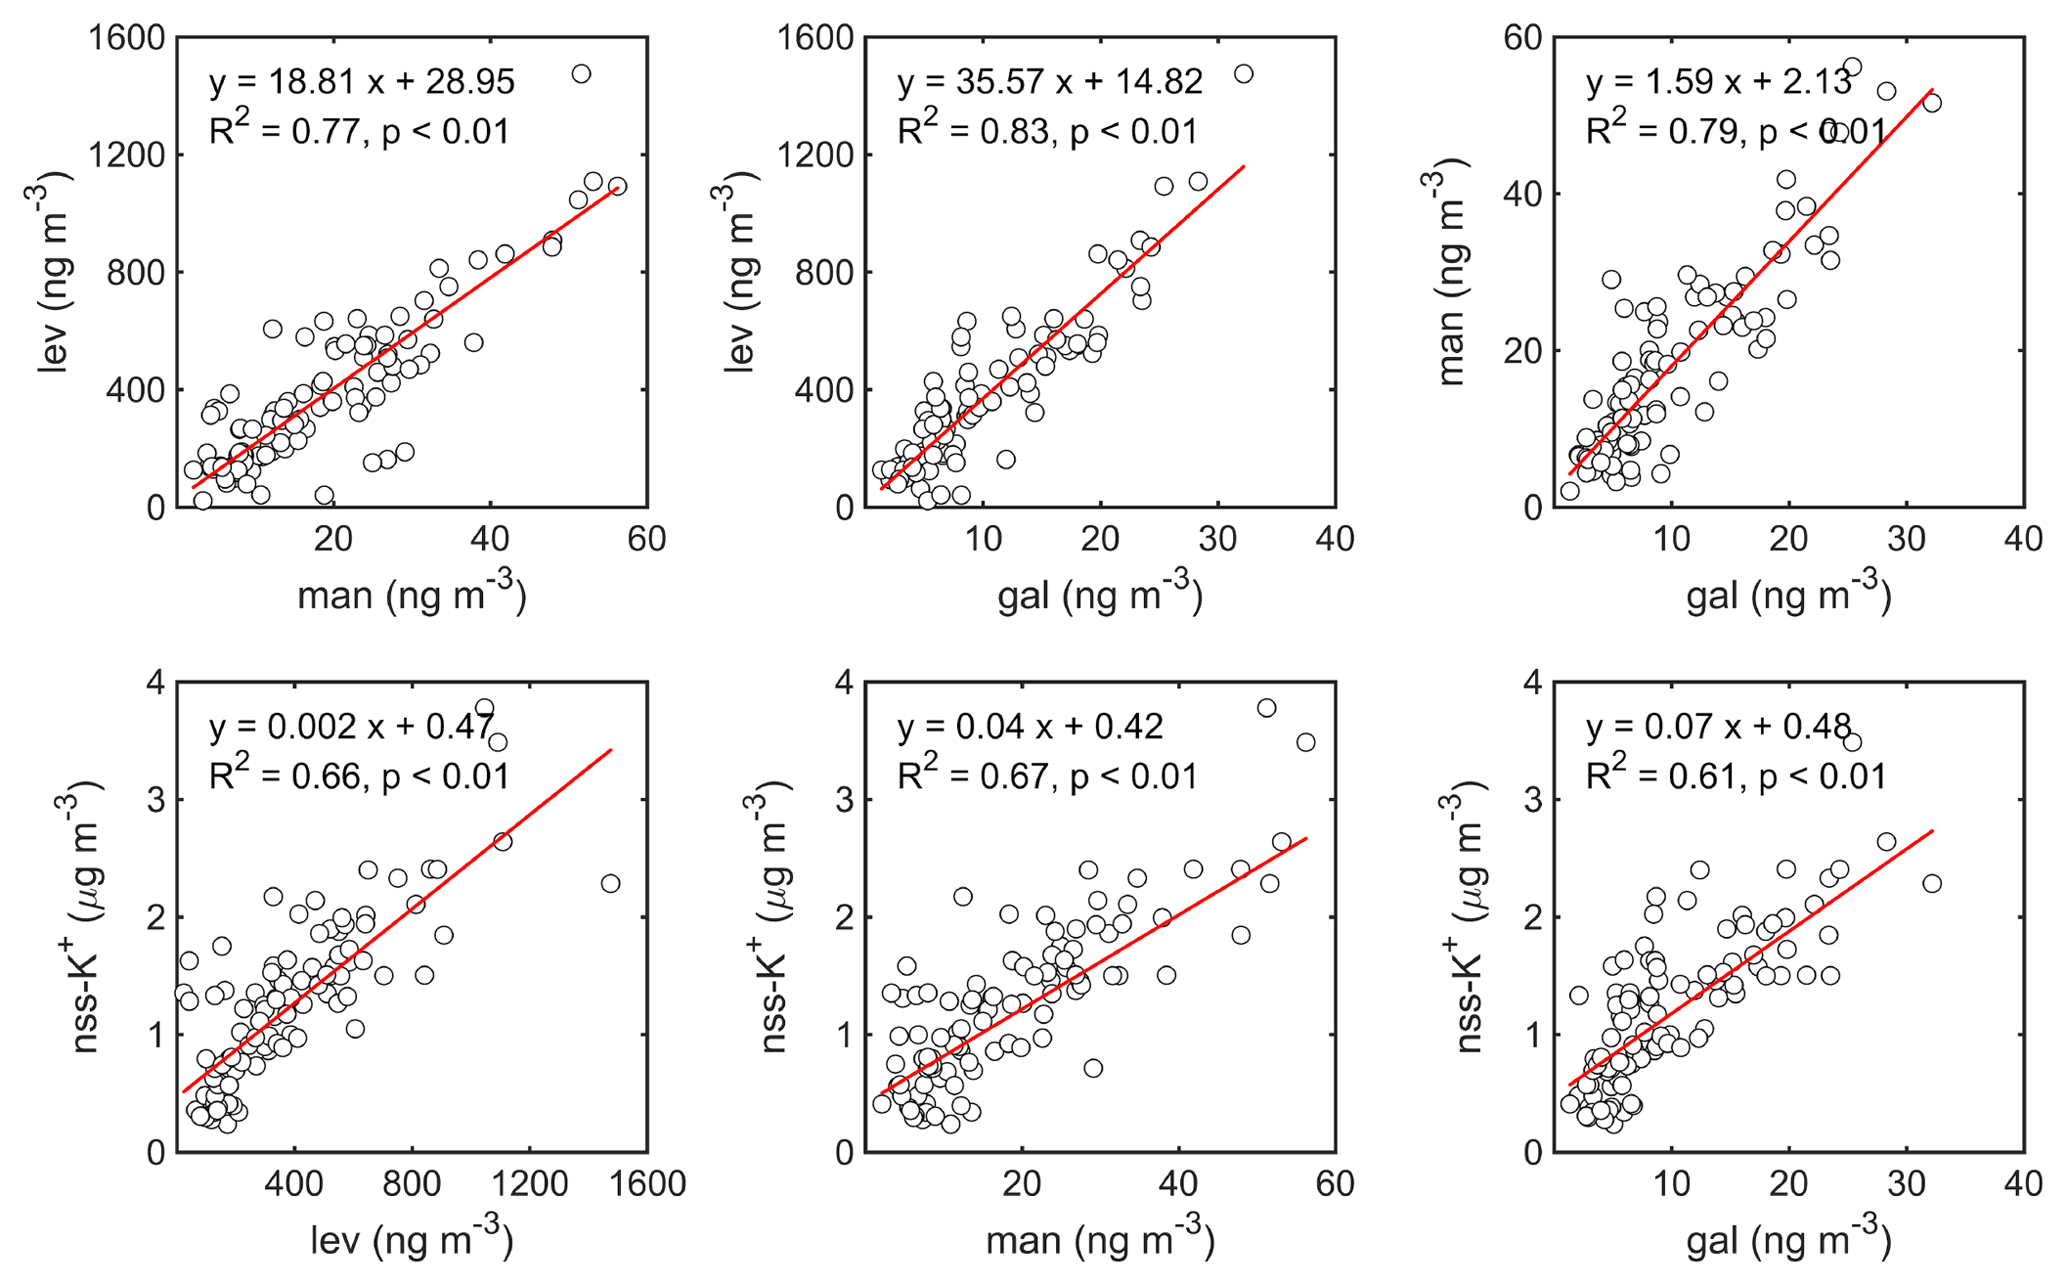
Figure 3Correlations between four tracers of biomass burning including levoglucosan (lev), mannosan (man), galactosan (gal) and non-sea-salt potassium (nss-K+) in PM2.5 from 14 to 29 January 2015 in Nanjing.
Time series plots of nss-K+, levoglucosan, mannosan and galactosan in PM2.5 are shown in Fig. 1. In this study, nss-K+ varied from 0.2 to 3.8 µg m−3, with a mean level of 1.2±0.7 µg m−3. A consistent trend between nss-K+ and EC can be seen in Fig. 1, especially with both peaks of EC and nss-K+ during 14:00–17:00 LT on 21 January (15.7 and 3.8 µg m−3) and during 17:00–20:00 LT on 24 January (20.1 and 3.5 µg m−3), suggesting that the intensities of total fuel combustion and biomass fuel combustion changed synchronously.
The average concentration of levoglucosan in PM2.5 was 373±268 ng m−3 in this study, which was significantly higher than those observed at the coastal sites in Europe (Puxbaum et al., 2007; von Schneidemesser et al., 2009), the forest sites in the eastern China (W. Wang et al., 2008) and some rural sites in Canada and Hong Kong (Leithead et al., 2006; Sang et al., 2011). But for the rural sites of Australia, levoglucosan was found to be much more enriched than in this study (Reisen et al., 2011). For the urban areas, levoglucosan levels in this study were higher than the level in Shanghai, Hong Kong, Singapore and the southeastern US (X. Li et al., 2016; Sang et al., 2011; Yang et al., 2013; X. Zhang et al., 2010) but was lower than those measured in Grenoble, France, and also Beijing during winter and a biomass burning episode in summer (Cheng et al., 2013; Favez et al., 2010) (Table 2).
Table 2Comparison of levoglucosan concentration level in PM2.5 during this study with those reported in the literature.
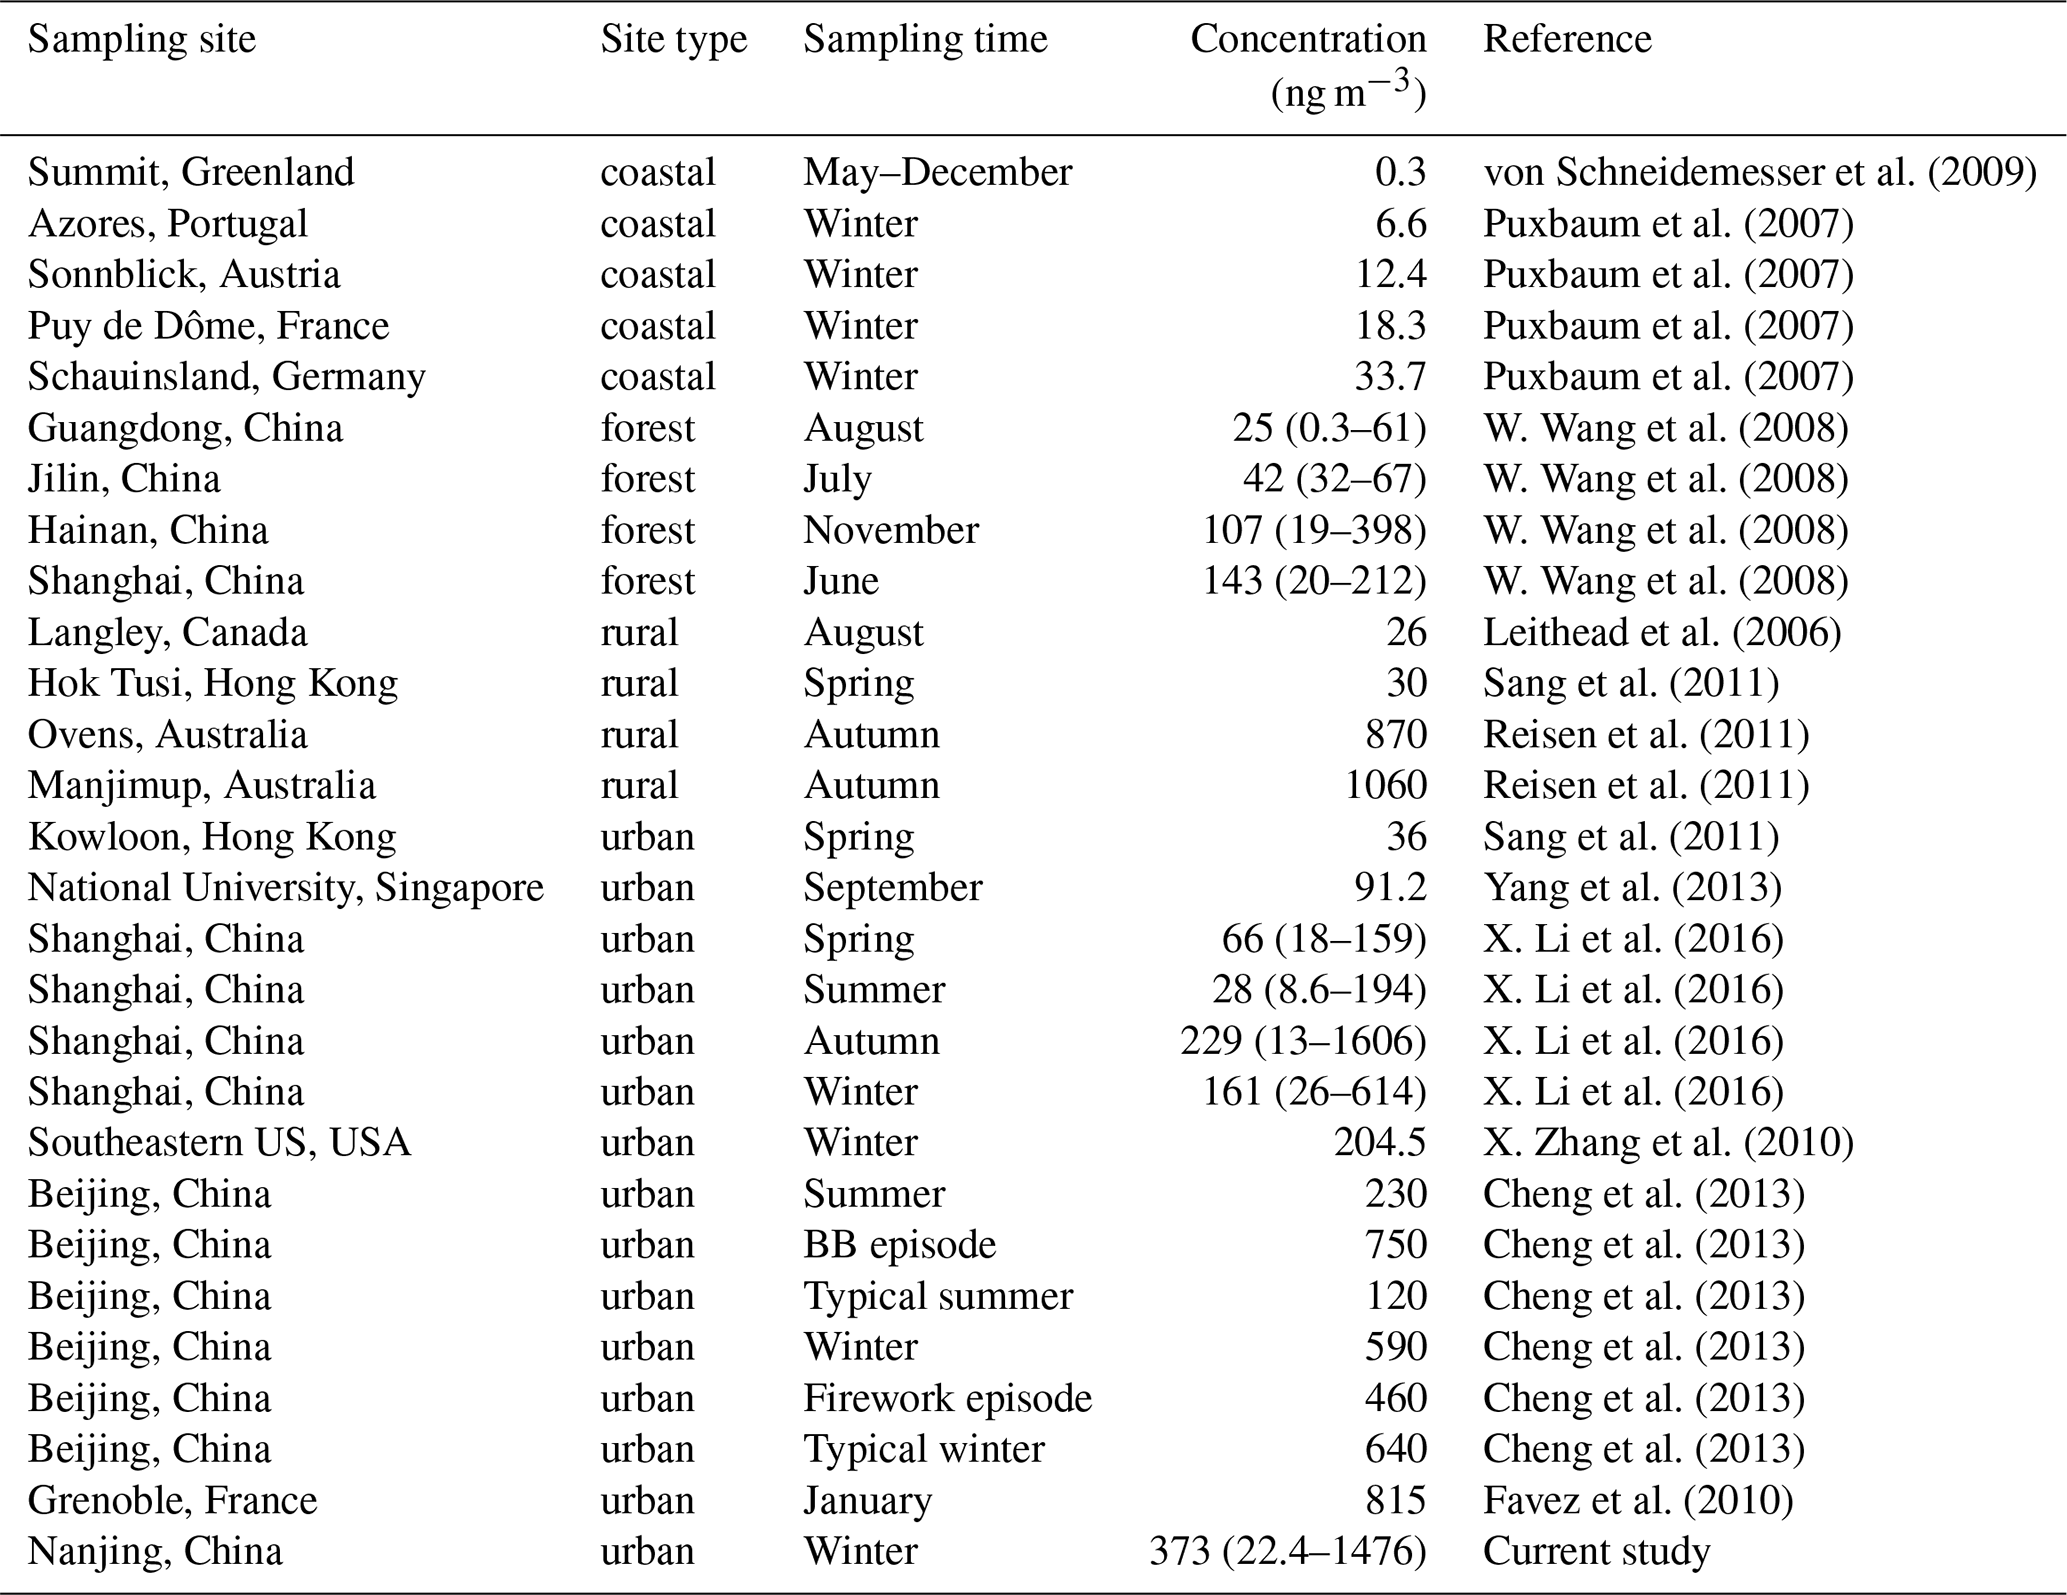
The concentration range of levoglucosan in PM2.5 of our study was 22.4–1476 ng m−3. The maximum value approximately approached that observed in Shanghai in the autumn when biomass burning prevailed (1606 ng m−3, Table 2). The highest level of levoglucosan appeared during 05:00–08:00 LT on 25 January, implying that the strongest biomass fuel combustion occurred in this period. Remarkably, levoglucosan concentration presented a valley during 11:00–14:00 LT on 19 January, when EC presented a peak. It can be explained that the intense combustion at that time was not dominated by biomass burning. The discrepancy of the time distribution between nss-K+ and levoglucosan were again attributed to the diversity of origins of potassium.
The concentrations of mannosan and galactosan in PM2.5 were averaged to 18.5±12.5 and 9.9±6.7 ng m−3, with ranges of 2.1–56.2 and 1.4–32.2 ng m−3, respectively. The trend of mannosan, galactosan and levoglucosan were closely matched, as illustrated in Fig. 1. They reached their highest and second highest levels together, which highlighted the fact that biomass burning heavily impacted the compositions of aerosols in these two periods.
3.4 Biomass burning contribution to carbonaceous components
Figure 4 shows the correlations between carbonaceous components (OC, EC or WSOC) and biomass burning tracers (levoglucosan, mannosan, galactosan or nss-K+). All biomass burning tracers are associated with EC (0.40 < R2 < 0.80, p < 0.01), which demonstrates the conjecture that biomass burning was one of the main types of combustion. Moreover, biomass burning tracers exhibit strong correlations with OC and WSOC (0.40 < R2 < 0.80, p < 0.01), indicating that biomass burning might have contributed to organic carbon including WSOC. For each tracer, the higher coefficient of determination (R2) for OC than EC illustrates that the biomass burning impacts on OC were more significant than those on EC. Notably, the slopes and the intercepts of the trend line for WSOC are both about half of those for OC, in accordance with results shown in Sect. 3.1 that WSOC accounted for around 50 % of OC. As a consequence, biomass burning made a stable contribution to WSOC and the contribution was even larger than that to EC in this episode.

Figure 4Correlations of OC, EC and WSOC vs. levoglucosan (lev), mannosan (man), galactosan (gal) and non-sea-salt potassium (nss-K+) in PM2.5 from 14 to 29 January 2015 in Nanjing.
The contribution of biomass burning to OC in PM2.5 (BB-OC) was calculated using Eq. (6):
(Z. Zhang et al., 2010; Puxbaum et al., 2007; Zdráhal et al., 2002; Sang et al., 2011). In biomass burning source emission tests for three major types of cereal straw (corn, wheat and rice) in China, 0.082 was reported as the lev∕OC ratio for PM2.5 (Zhang et al., 2007). This value can be used in combination with the lev∕OC ratios of our PM2.5 samples to roughly estimate the contribution of biomass burning smoke to the ambient OC. The reason why we used the ratio lev∕OC associated with cereal straw burning will be explained in Sect. 3.5. As shown in Table 1, BB-OC ranged from 0.2 % to 53.6 % in this event, with an average of 20.9±9.3 %. Our calculated biomass burning contribution has a greater span than that of the Beijing rural area (18 %–38 %), which was computed with the same lev∕OC ratio (T. Zhang et al., 2008; Y. Zhang et al., 2008), even though January was not in a common biomass burning prevailing season of Nanjing.
The contribution from biomass burning to the WSOC in PM2.5 (BB-WSOC) trend in Fig. 5 makes the above analysis more convincing due to the consistency of the contributions computed by two different methods. BB-WSOC was estimated with Eq. (7):
which used a lev∕WSOC ratio of 0.17 µg µgC−1 from the test burns of rice straw and wheat straw (Yan et al., 2015). BB-WSOC ranged from 1.1 % to 55.4 %, with an average of 22.3±9.9 %. It was at an equivalent level with that investigated in Beijing wintertime, where BB-WSOC was averaged at 23±7 % (Yan et al., 2015) and had a pretty large span. BB-WSOC exhibits a similar trend with BB-OC (Fig. 5). The robust relationship between BB-OC and BB-WSOC (R2=0.81, p < 0.01) with a regression slope close to 1 (0.96) confirms the reliability of our biomass burning contribution quantification. However, the biomass burning contribution here could be related to both local emissions and long-range transport due to the atmospheric motion and the subsequent mixing of aerosols. The origins of biomass burning will be discussed in the following section.

Figure 5Time series of biomass burning contribution to OC (BB-OC) and WSOC(BB-WSOC) and the correlation between them.
3.5 Origin of biomass burning
3.5.1 Major fuel types of biomass burning
The biomass burning characteristics, expressed in the parameter space of lev∕man and lev∕nss-K+ in Fig. 6, are used to differentiate the burning substrates. The ratio space for needle, duff, hardwood, softwood and crop residuals was introduced from the work of Cheng et al. (2013), which overcomes the limitation of using only one characteristic ratio (either lev∕nss-K+ or lev∕man) to distinguish the types of biomass being burned and hence increases the reliability of determination. In previous studies, emissions from the crop residuals burning were characterized by a lower lev∕nss-K+ ratio (mostly less than 1) and a higher lev∕man ratio which was reported to be ∼20 in general and could be as high as 41 (Sheesley et al., 2003; Sullivan et al., 2008; Engling et al., 2009; Oanh et al., 2011).

Figure 6Representative ranges of lev∕nss-K+ and lev∕man ratios for different types of biomass fuel introduced by Cheng et al. (2013). Results from the ambient samples collected in this study are also shown for comparison.
In the present study, the mean lev∕man ratio was 22.5±12.3 and the mean lev∕nss-K+ was 0.3±0.1. According to Fig. 6, ∼94 % of the ambient samples (96 out of 102) in this study are traced to crop residuals and grass region, demonstrating that crop residuals were the main biomass type burned in the investigated episode, since the contribution of grass was negligible compared to the total biomass consumed in China (Streets et al., 2003). Our result is similar to that reported for the typical biomass burning events in summer in Beijing (Cheng et al., 2013).
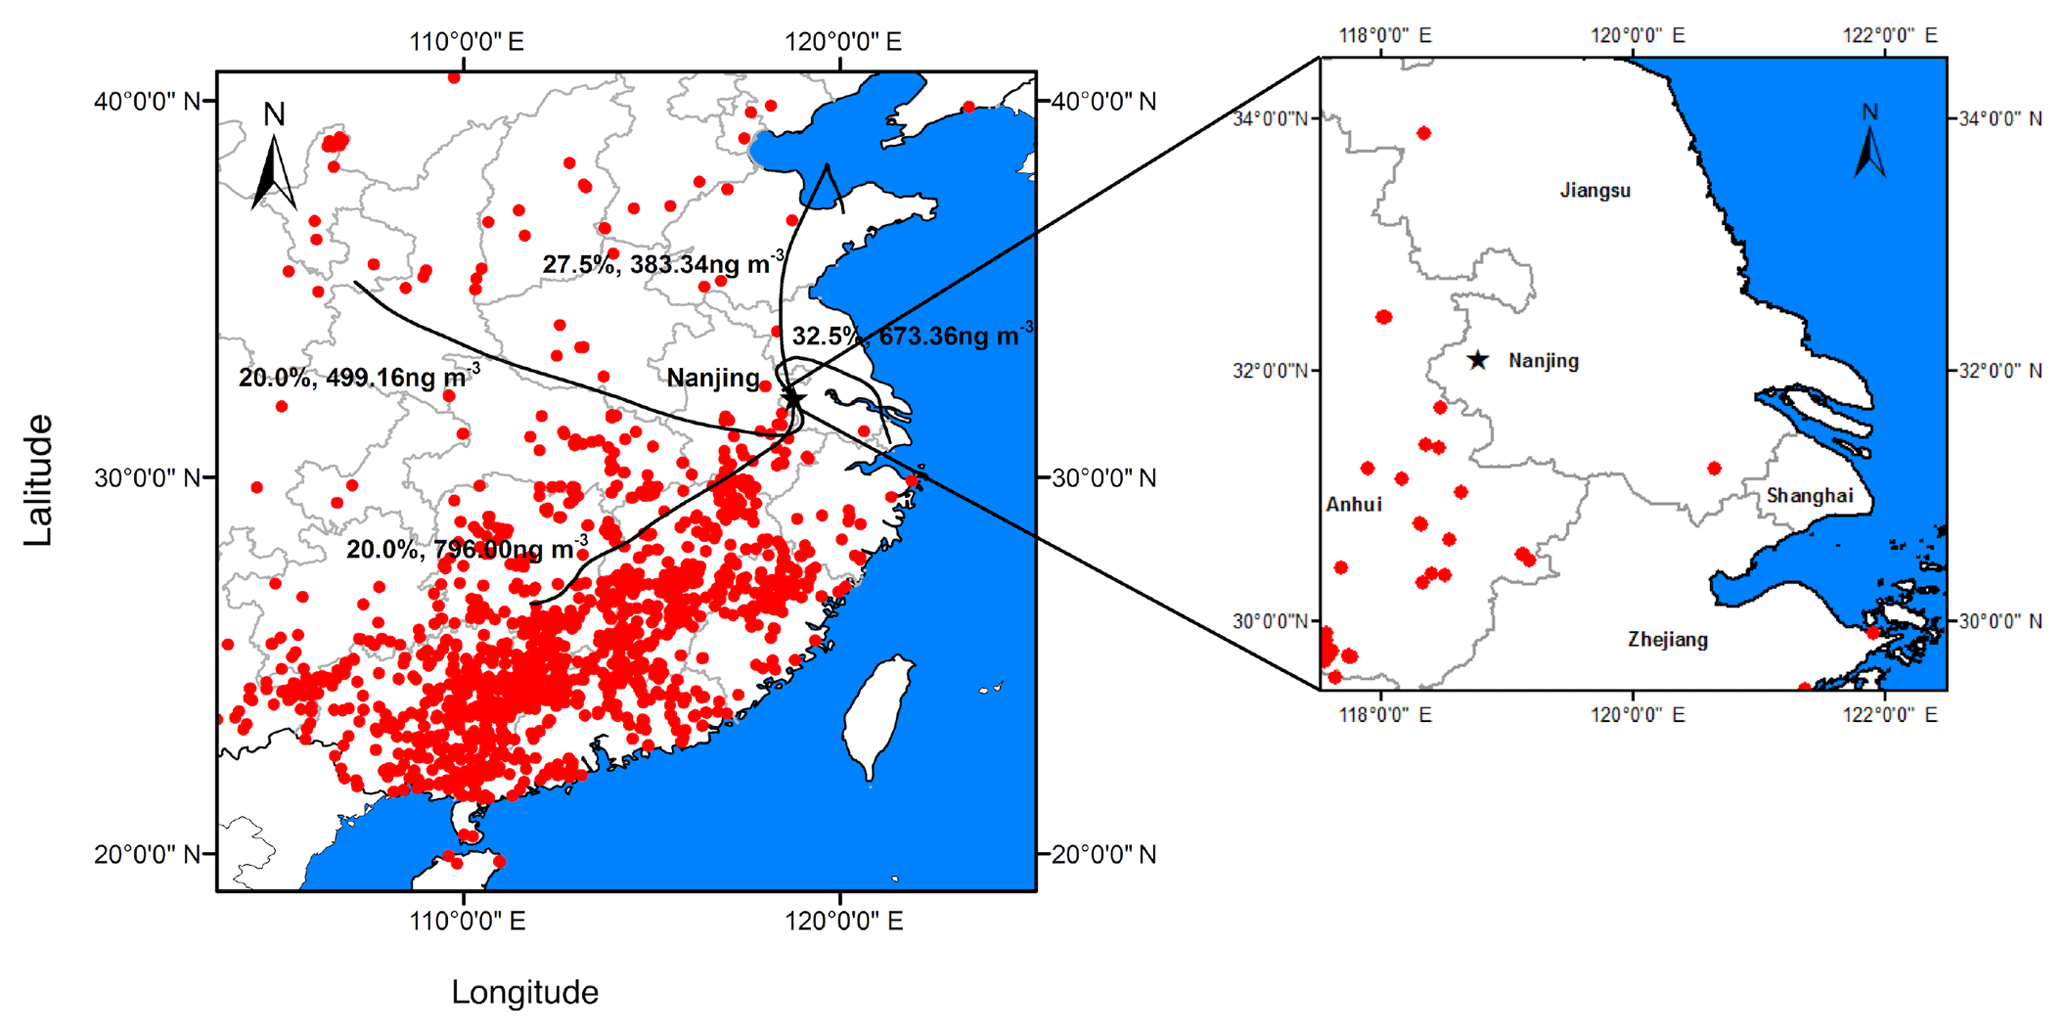
Figure 7Air mass backward trajectory from 21 to 25 January, along with the MODIS fire spot map. Percentage refers to the air mass contribution to Nanjing and values with a unit of nanograms per cubic meter (ng m−3) refers to the mean concentration of levoglucosan for every trajectory in that cluster.
3.5.2 Long-range transport
In order to examine the influence of long-range transport on local atmospheric compositions, 48 h backward trajectories of air masses reaching the Nanjing sites at a height of 500 m were computed via the HYSPLIT model covering all the sampling days. Figure 7 displays the MODIS fire spot distribution during 21 to 25 January, when open burning was strong in China. No fire signals were found in the local region of Nanjing, suggesting the dominant influence from long-range transport. Some fire spots appeared in northern China, but densely distributed spots were in southeastern China. All 48 h backward air mass trajectories were classified into four clusters, and mean levoglucosan concentrations of all trajectories for each cluster are described in Fig. 7, in order to compare the relative levels of biomass burning emissions transported by the four clusters. The cluster originating from southeastern China had the highest mean levoglucosan concentration (796 ng m−3) among the four clusters, although it transported the least air mass to Nanjing (20 %). Moreover, when the maximum levoglucosan was observed between 05:00 and 08:00 LT on 25 January, the FLEXPART potential emission sensitivity in Fig. 8 indicates that a notable fraction of air masses was coming from a region in the south and southeast of Nanjing. It is evident that air masses caught the pollutants emitted from biomass burning on 21–24 January, as was illustrated by the hotspots. Therefore, the biomass burning emissions from southeastern China profoundly impacted the aerosols in Nanjing during the episode.
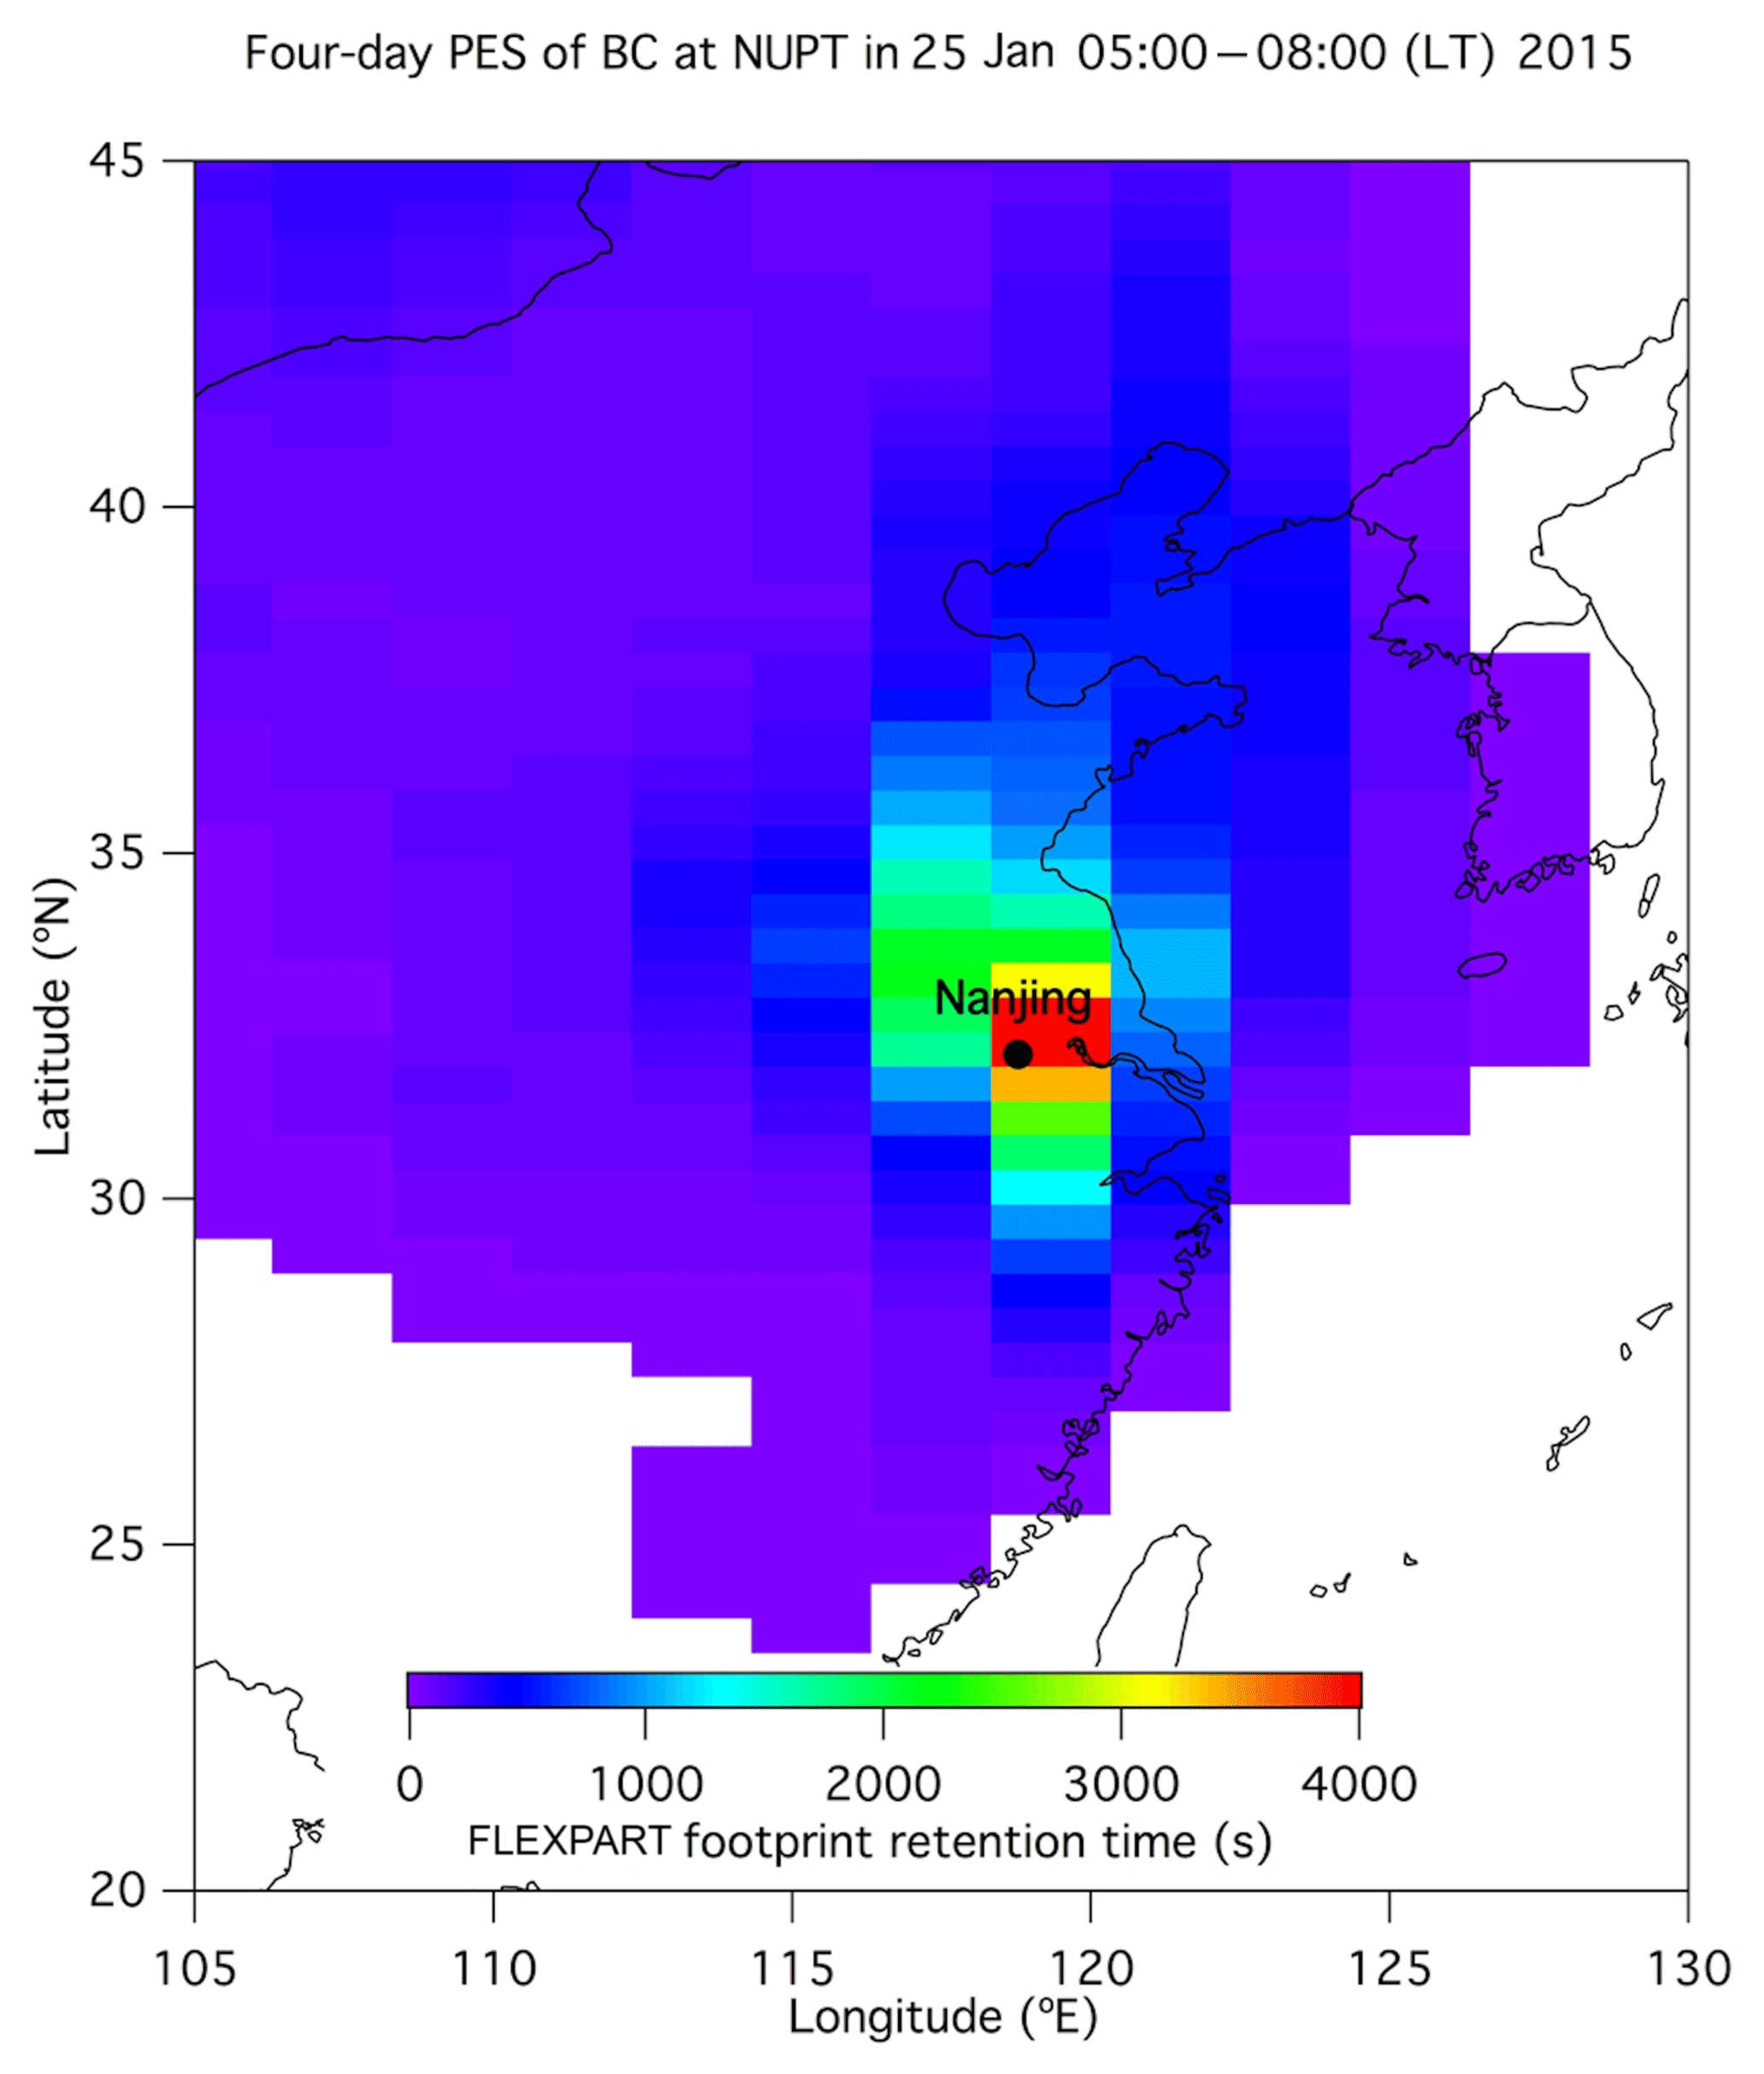
Figure 8The four-day footprint of NUPT (32.09∘ N, 118.78∘ E, black point), the observation site, starting from 05:00–08:00 LT on 25 January 2015 when the maximum levoglucosan was observed. The footprint was illustrated as FLEXPART potential emission sensitivity, shown as the retention time in each grid at 0–500 m contributing to the observed elemental carbon.
In addition, there was a notable cluster originating from the coastal site of eastern China and mainly passing through Shanghai and Jiangsu, where no fire signals were found. But this cluster had a relatively high mean levoglucosan concentration (673 ng m−3). According to the research by Zhou et al. (2017) on the biomass burning emission inventory, domestic straw burning was responsible for ∼42 % of total biomass burning in China in 2012, and ∼1.5 Gg and ∼80 Gg PM2.5 came from domestic burning in Shanghai and Jiangsu, respectively. It illustrated the significant impact of indoor biomass burning which was invisible in MODIS fire spot map because satellites can only detect open biomass burning. Therefore, the levoglucosan enrichment of the cluster from coastal area might be due to domestic biomass burning. The air mass frequency of this cluster was 32.5 %, the largest one among that for all clusters, which means domestic biomass burning in the eastern China much influenced aerosols in Nanjing. Domestic biomass burning should be taken as an important factor to study aerosols of eastern China in further studies, even though open biomass burning from long-range transport played a significant role in this study.
3.6 Light-absorbing property
The light absorption coefficient of WSOC at 365 nm is used to represent water-soluble BrC, which is organic carbon with a capacity of absorbing radiation (Yan et al., 2015; Hecobian et al., 2010; J. Wang et al., 2018). The mean babs value was 9.4±4.8 M m−1, higher than the summertime value but lower than the wintertime value in Beijing and Guangzhou (Yan et al., 2015; Qin et al., 2018). Meanwhile, it had a large span from 1.6 to 30.0 M m−1, partially attributed to its dependence on biomass burning intensity. As shown in Fig. 9, babs is significantly correlated with biomass burning tracers (R2 > 0.50, p < 0.01), indicating that a considerable quantity of BrC was associated with biomass burning emissions in this episode. According to the analysis in Sect. 3.4, the robust correlations between WSOC and biomass burning tracers (levoglucosan, mannosan, galactosan or nss-K+) imply that biomass burning had contributed to WSOC. With respect to this point, the correlation between babs and WSOC (R2=0.76, P < 0.01) and that between babs and WSOC from biomass burning, calculated with WSOC multiplied by the BB-WSOC fraction (R2=0.55, P < 0.01), are presented in Fig. 10. Both correlations are significantly positive at the 1 % possibility level. But babs has a relatively higher R2 with WSOC than WSOC from BB, indicating that other sources also contributed to water-soluble BrC in the episode. Other researchers pointed out that secondary photochemical reactions in the atmosphere can produce water-soluble BrC as well (Sareen et al., 2013; Liu et al., 2016).
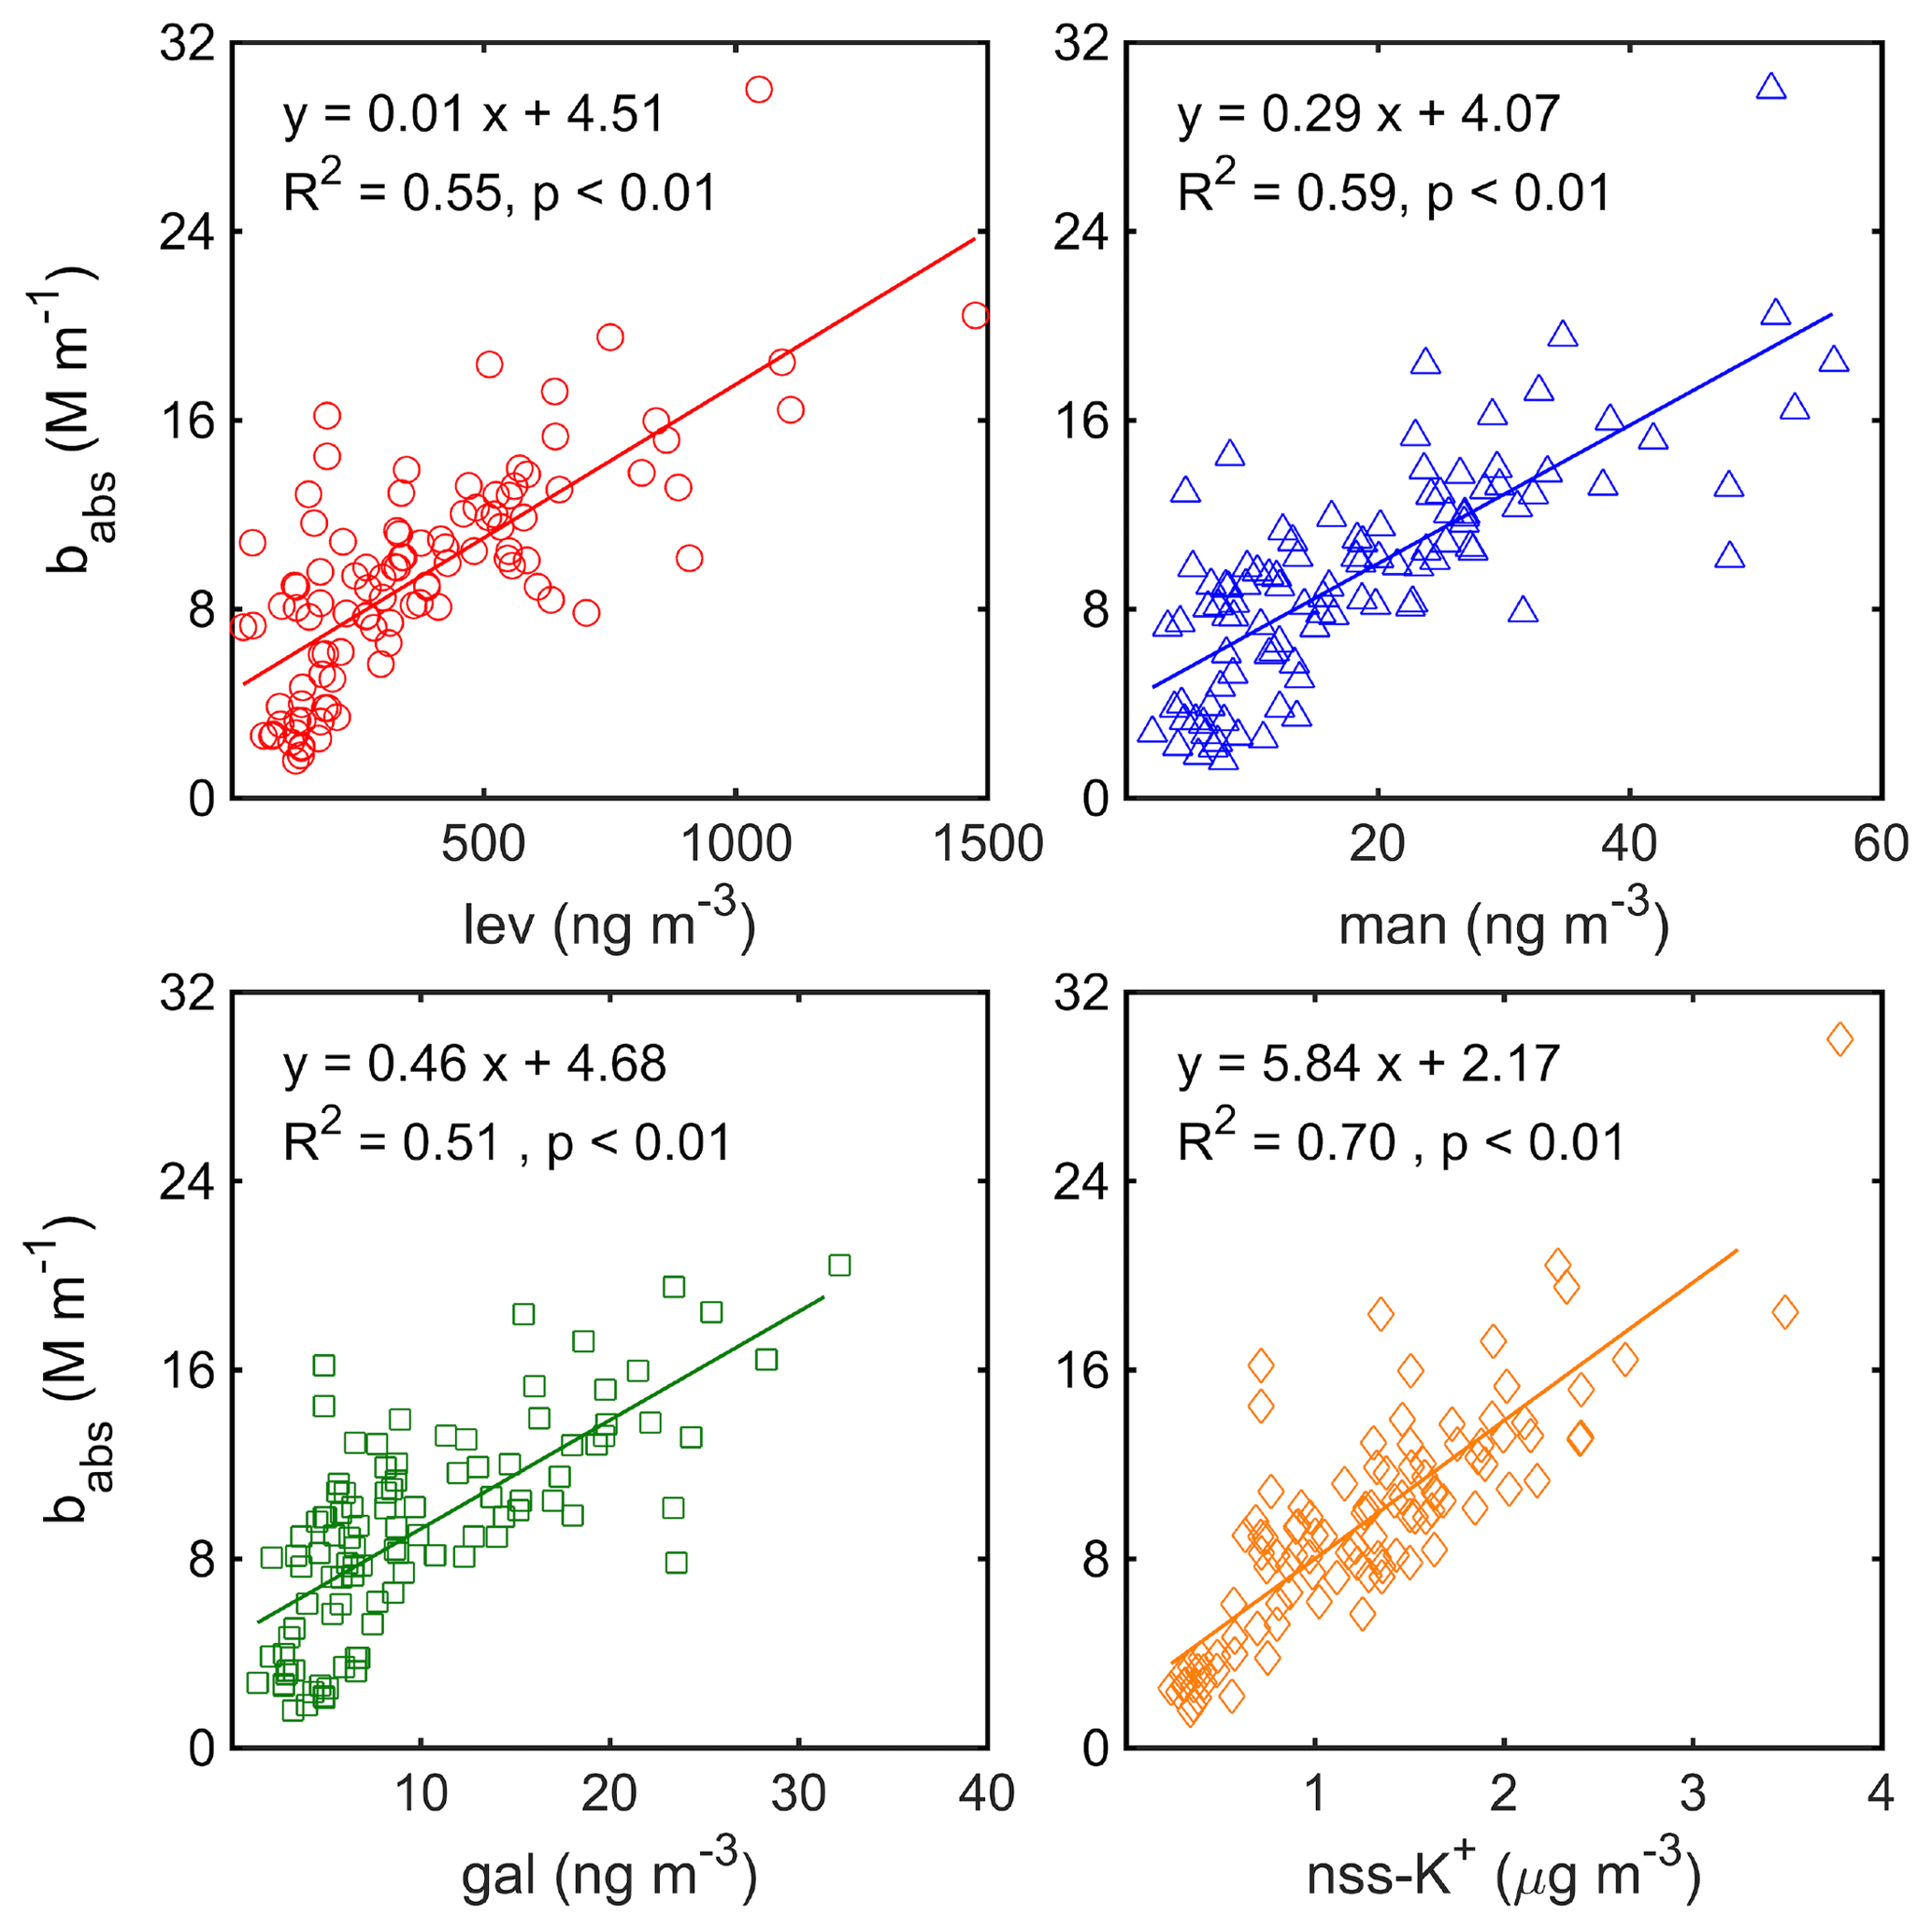
Figure 9Correlations of water-soluble BrC carbon absorption coefficient (babs) vs. levoglucosan (lev), mannosan (man), galactosan (gal) and non-sea-salt potassium (nss-K+) in PM2.5 from 14 to 29 January 2015 in Nanjing.
It is evident that the absorption coefficient of WSOC shows a relationship with wavelength, which can be described by the absorption Ångström exponent. AAE is also used to distinguish the BrC emission types due to its dependence on particle size and composition. Generally, the Ångström exponent for compounds from biomass burning and biofuel emissions is larger than 6 (Hoffer et al., 2006; Chen and Bond, 2010; Hecobian et al., 2010; Bikkina, 2014). The AAE mean in this study was 6.6±1.3, ranging from 4.1 to 10.3, and more than 68 % of samples (71 out of 104) had an AAE above 6 (Fig. 13). Our result is consistent with those for the Indo-Gangetic Plain, where biomass burning emission has been proven to be the predominant aerosol source (Bikkina, 2014). If light absorption is dominated by elemental carbon, AAE is reported to be ∼1 (Bond, 2001; Kirchstetter et al., 2004). For fresh and aged SOA it should be ∼7 and ∼4.7, respectively (Bones et al., 2010).
Mass absorption efficiency characterizes the efficiency of light absorption by WSOC. As shown in Fig. 11, the MAE mean in this study was 1.0±0.2 m2 g−1, with a range of 0.5–1.6, higher than that of some US cities. Beijing (summer) and the Indo-Gangetic Plain were effected by biomass burning, but to a lesser extent than some Indian areas and Beijing, China, during wintertime. The MAE was lower than 1.79 m2 g−1 in Beijing during winter. As shown in Fig. 11, MAE has poor correlation with AAE (Yan et al., 2015; Kirillova et al., 2014b; Kim et al., 2016; Du et al., 2014b; Hecobian et al., 2010; Yan et al., 2017; Cheng et al., 2011, 2016; Zhang et al., 2013; Bikkina, 2014; Srinivas et al., 2016).
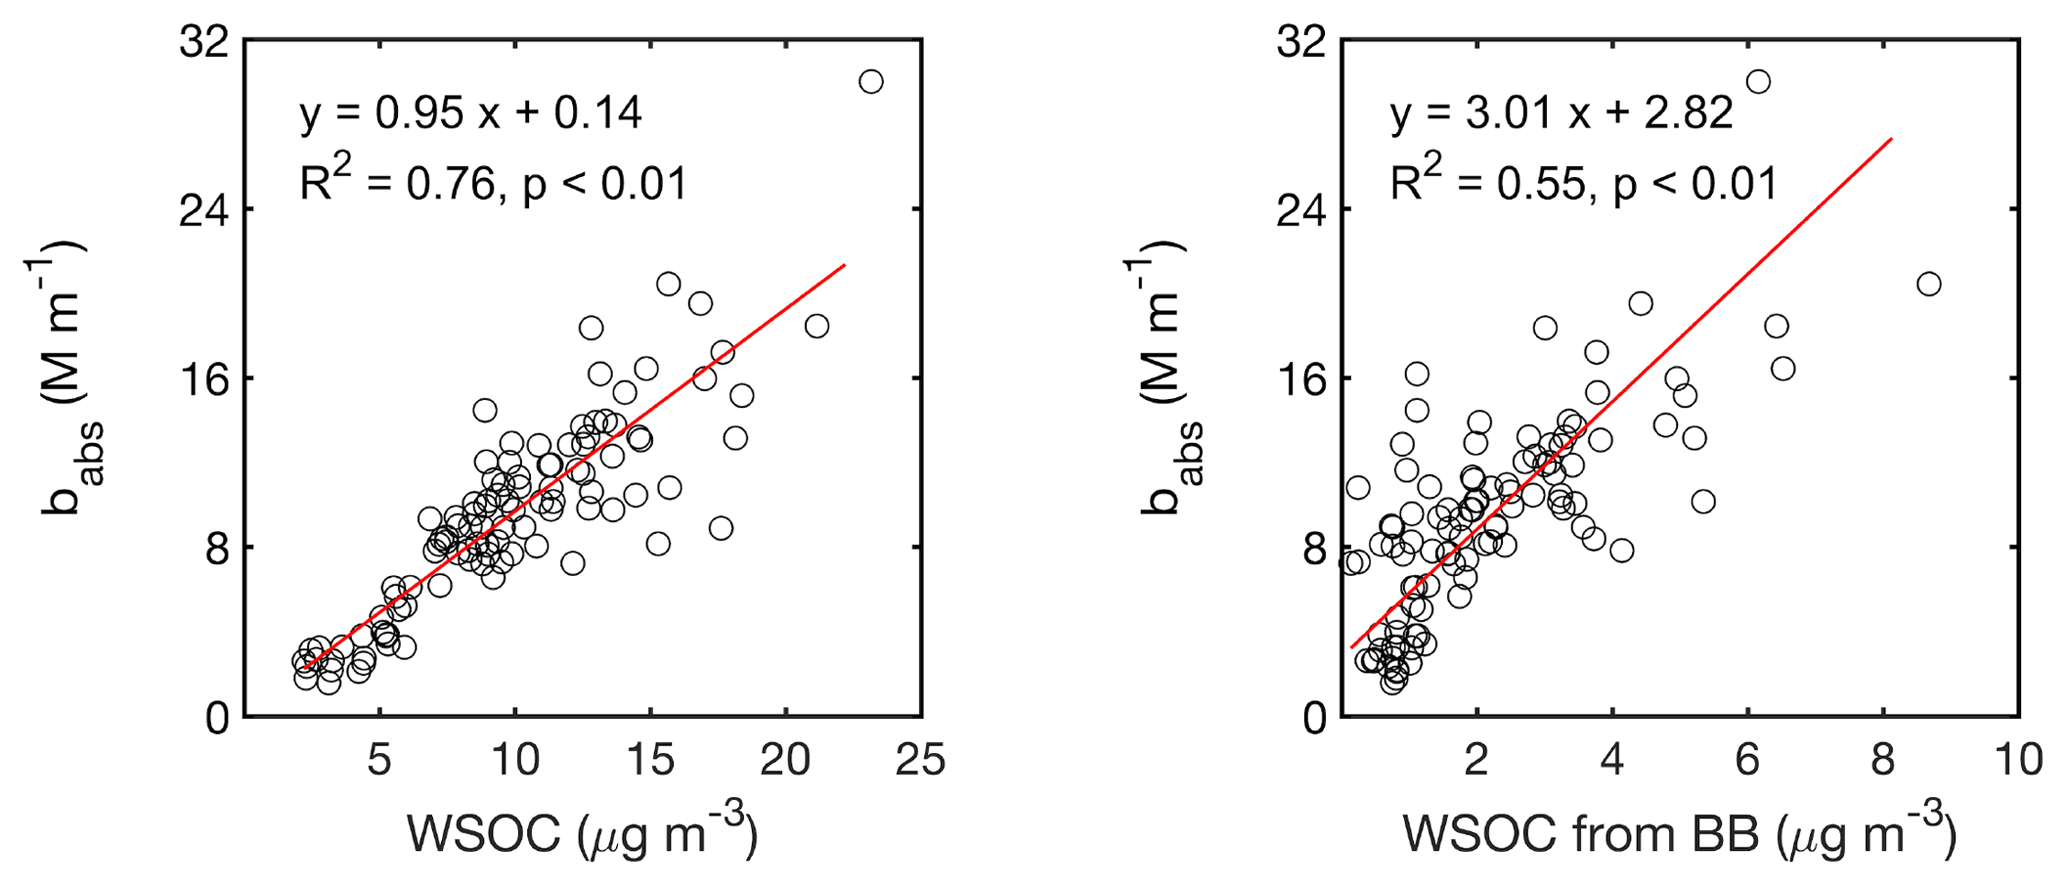
Figure 10Correlations of water-soluble BrC absorption coefficient (babs) and WSOC or WSOC from biomass burning (WSOC from BB) in PM2.5 from 14 to 29 January 2015 in Nanjing. WSOC from BB is calculated with WSOC multiplied by BB-WSOC.

Figure 11Comparison of mean mass absorbance efficiency (MAE) and absorption Ångström exponent (AAE) of WSOC in PM2.5 in this study with those reported in the literature.
As shown in Fig. 13, the solar energy absorption of WSOC (EWSOC) in short wavelengths (300–400 nm) had a mean value of 0.8±0.4 W m−2, ranging from 0.2 to 2.3 W m−2. The counterpart contributed by biomass burning (EWSOC_BB), derived from multiplying EWSOC by BB-WSOC, had a mean value of 0.2±0.1 W m−2, ranging from 0.0 to 0.9 W m−2. Solar energy absorption of EC (EEC) in the wavelength range of 300–400 nm had a mean value of 3.4±1.7 W m−2, ranging from 0.4 to 9.9 W m−2. The WSOC to EC absorption percentage (EWSOC∕EEC) was 23.8±8.7 % and could be up to 73.0 % at the short wavelengths (300–400 nm), which is much higher than that for Beijing winter (42 %) (Yan et al., 2015). The map in Fig. 12 specifies the level of PSCF values related to the carbonaceous compounds (levoglucosan, WSOC and EC) and their radiative absorption properties (babs, EWSOC, EEC, EWSOC∕EEC) in terms of a color bar. The areas with high PSCF values were interpreted as the potential areas loading the carbonaceous compounds or better light absorption. As shown in Fig. 12, the water-soluble carbonaceous aerosols transported to Nanjing over a long distance had a stronger light absorption capacity, compared to those aerosols from local emissions. It is evident that WSOC would enhance its light absorption capacity after aging along the long-range air mass transport, and the enhancement is much more than that for EC (Kirillova et al., 2014a). It means that the carbonaceous emissions over long-range transport can affect the local atmospheric solar radiation balance more. In addition, the levoglucosan has a similar PSCF distribution with WSOC and EC, illustrating that long-range-transported biomass burning emissions profoundly impacted the carbonaceous aerosols in Nanjing during this episode. The similar PSCF distributions between WSOC and babs or EWSOC can be explained by the fact that light absorption of WSOC is usually related to WSOC levels. The similarity of PSCF distributions between EC and EEC can be explained in the same way. However, the PSCF distribution of EWSOC∕EEC is different from EEC or EWSOC in Fig. 12, indicating that southeastern China is potentially the area loading the aerosols with a higher light-absorbing contribution by WSOC. It is consistent with the fire spot distribution in Fig. 7, which implies that the long-range transported biomass burning emission significantly impacted the solar energy absorption of carbonaceous aerosols in Nanjing during this episode.
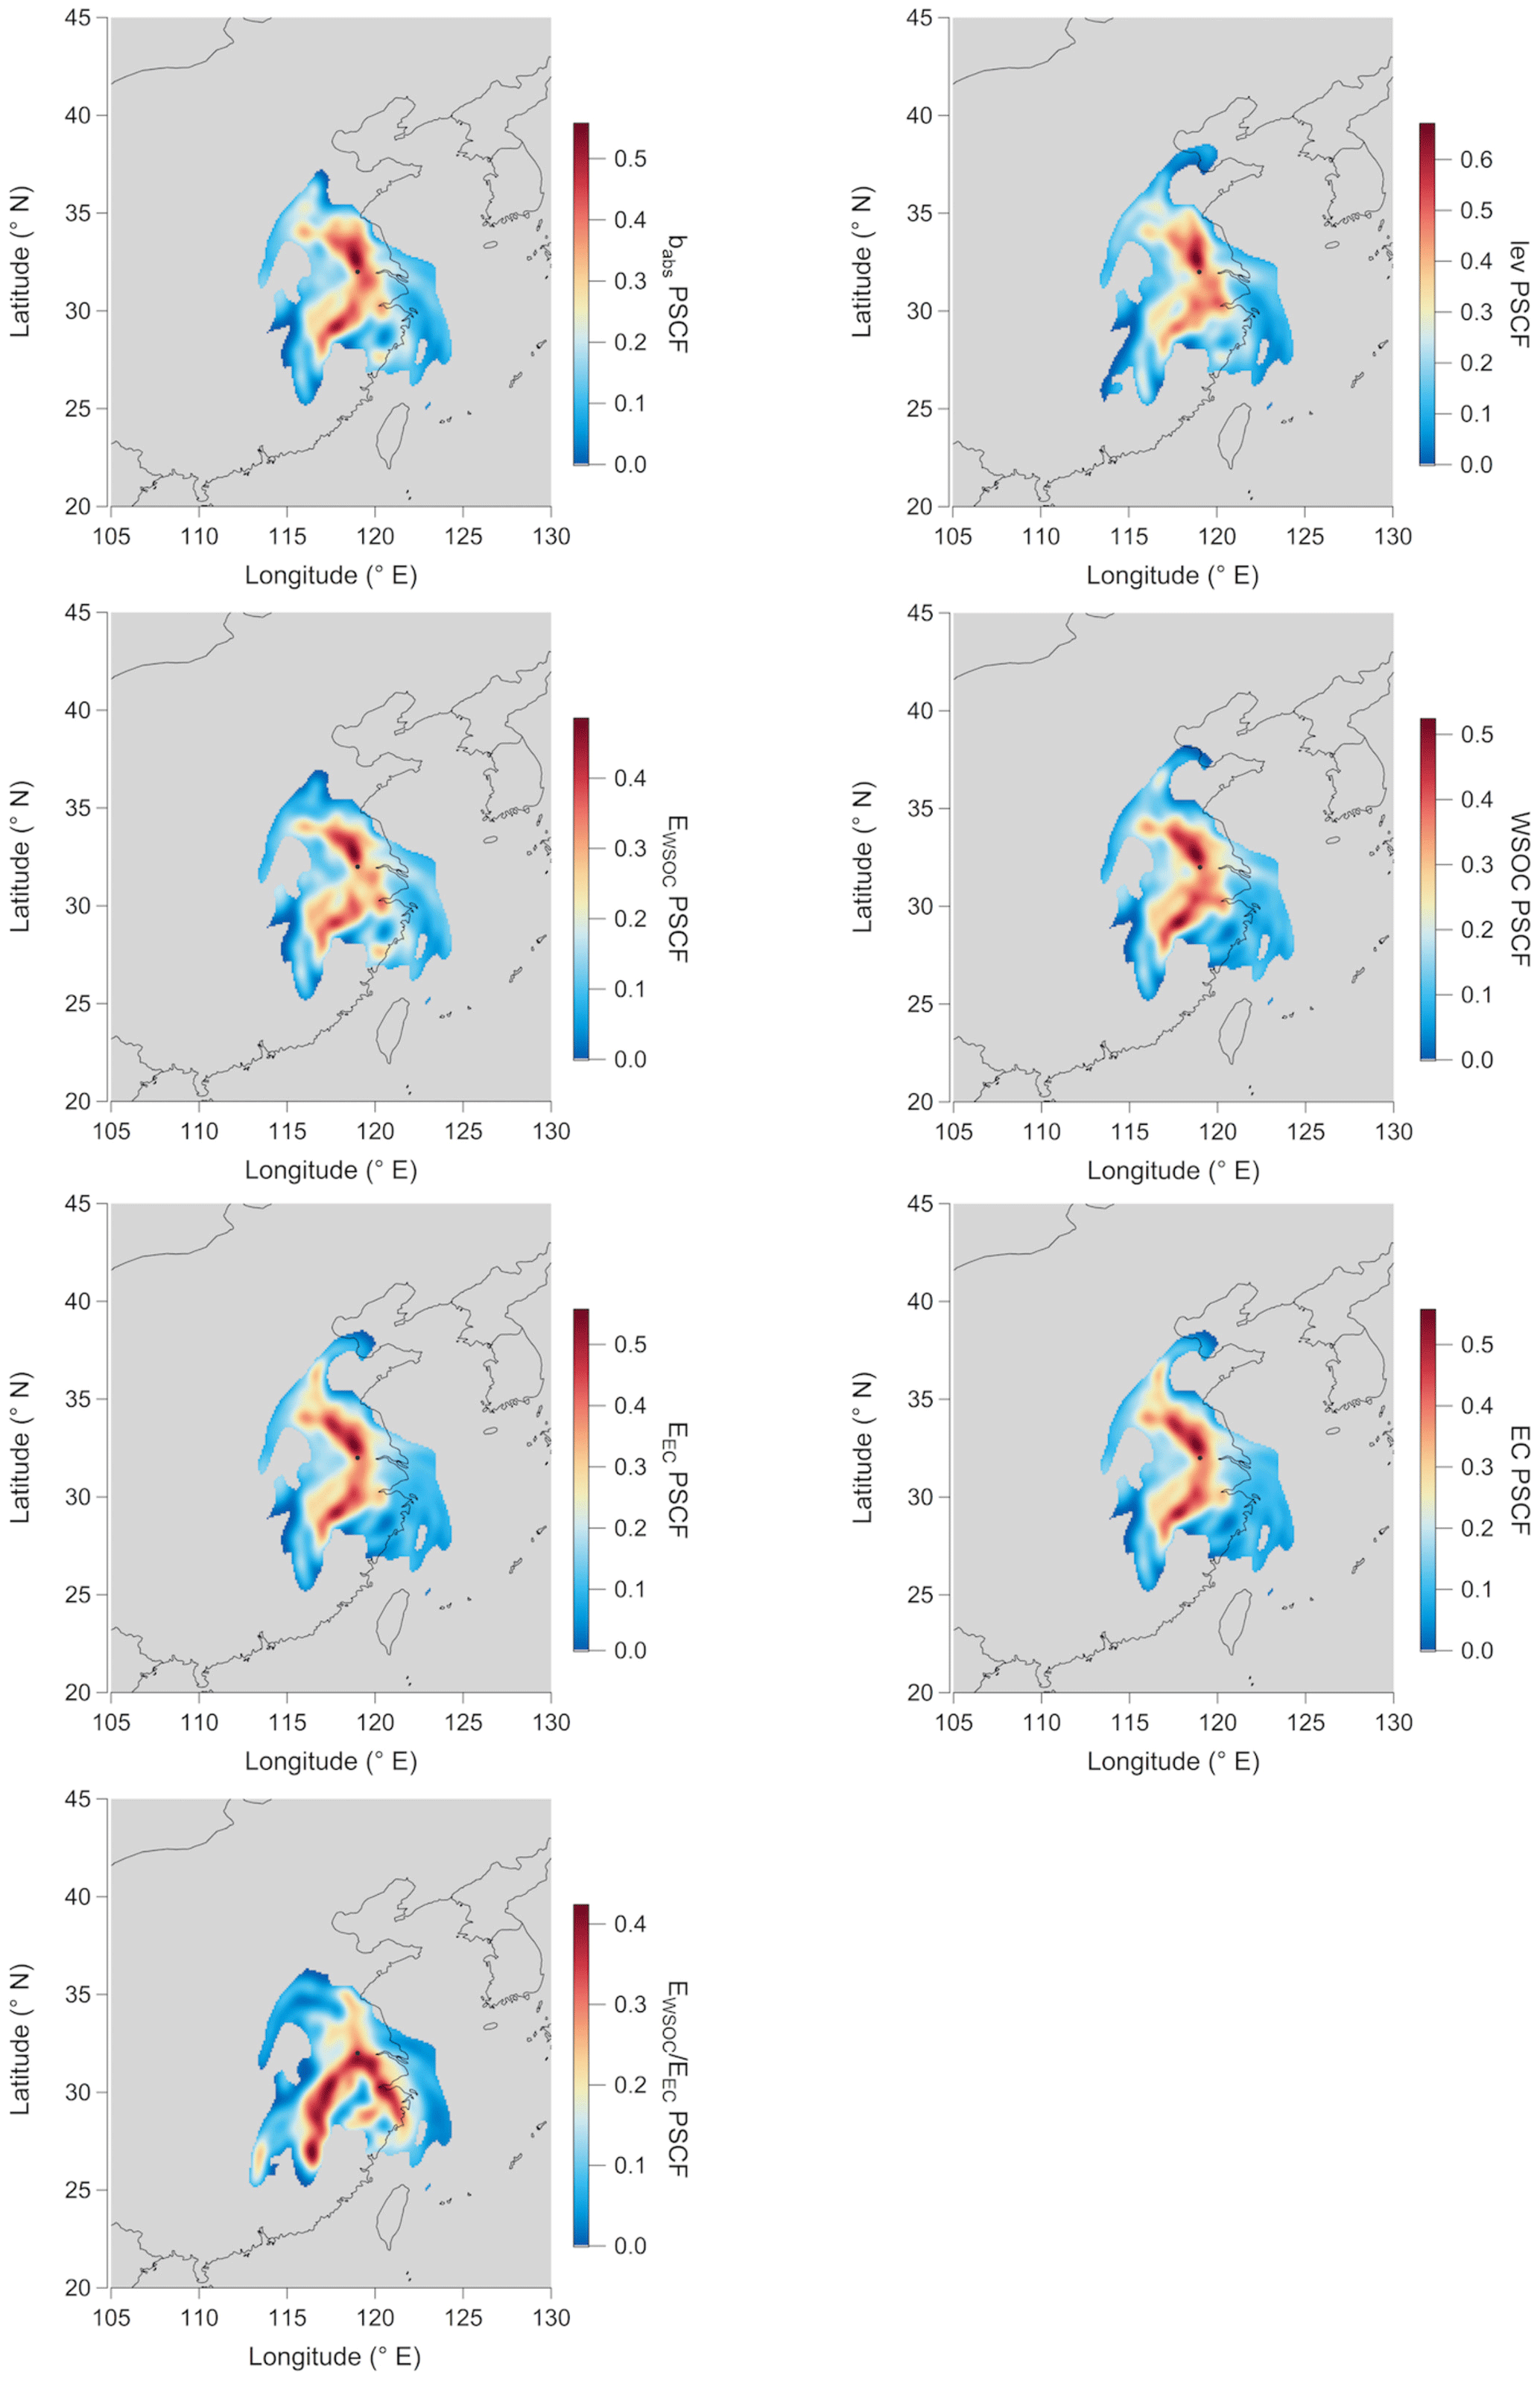
Figure 12The PSCF map for levoglucosan (lev), water-soluble BrC absorption coefficient (babs), WSOC, EC, light absorption of WSOC (EWSOC) and EC (EEC) and the WSOC to EC light-absorption ratio (EWSOC ∕ EEC) for PM2.5 from 14 to 29 January 2015 in Nanjing (black point).
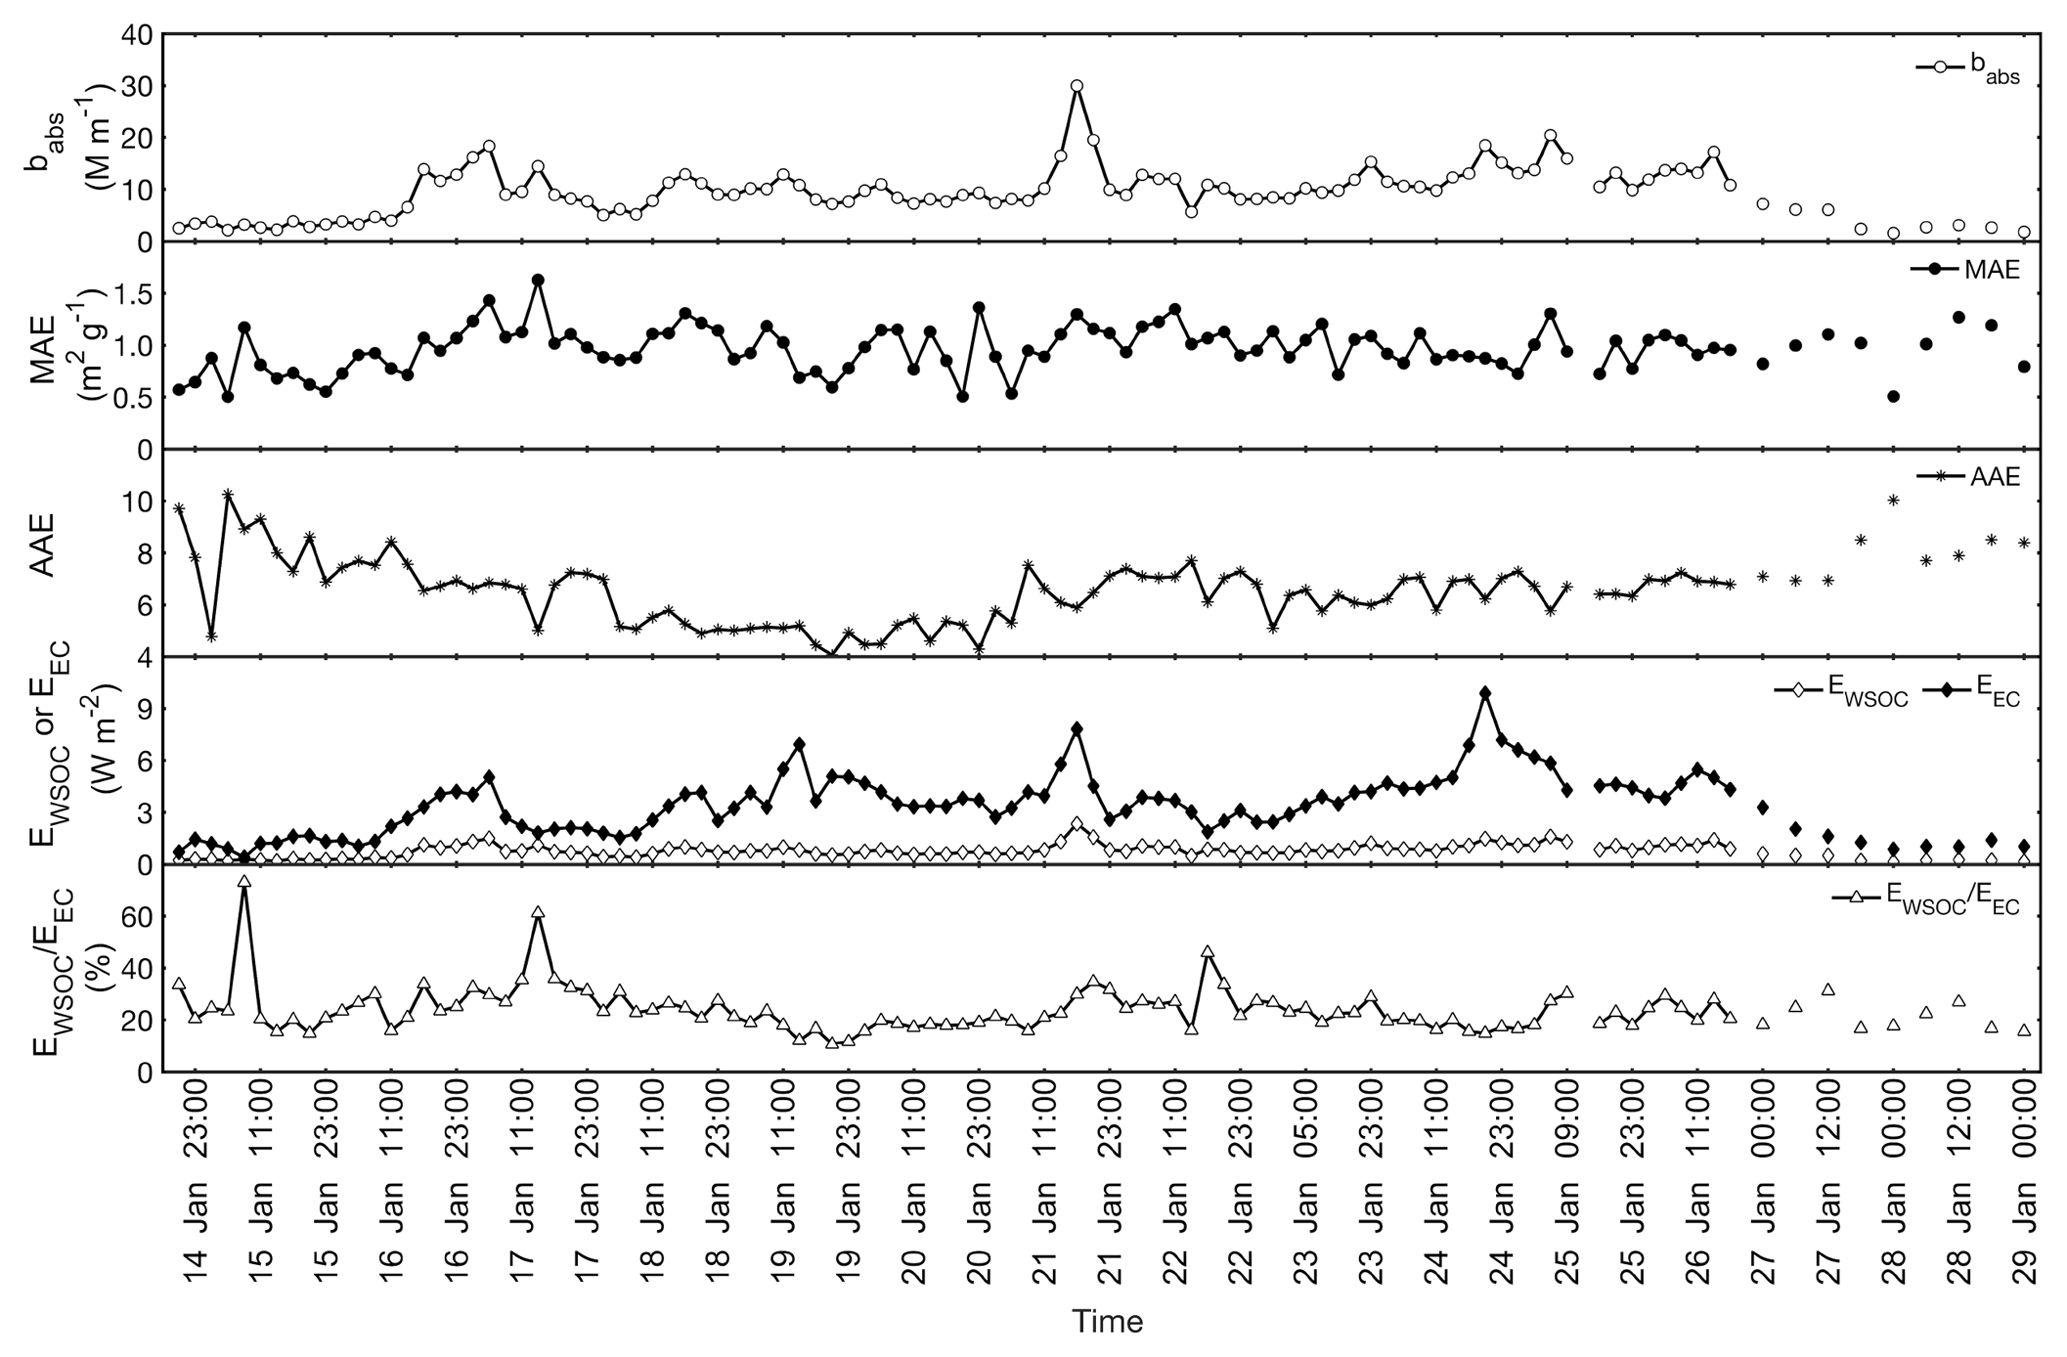
Figure 13Time series of water-soluble BrC absorption coefficient (babs), mass absorbance efficiency (MAE), absorption Ångström exponent (AAE), light absorption of WSOC (EWSOC) and EC (EEC) and the WSOC to EC light-absorption ratio (EWSOC ∕ EEC) for PM2.5 from 14 to 29 January 2015 in Nanjing.
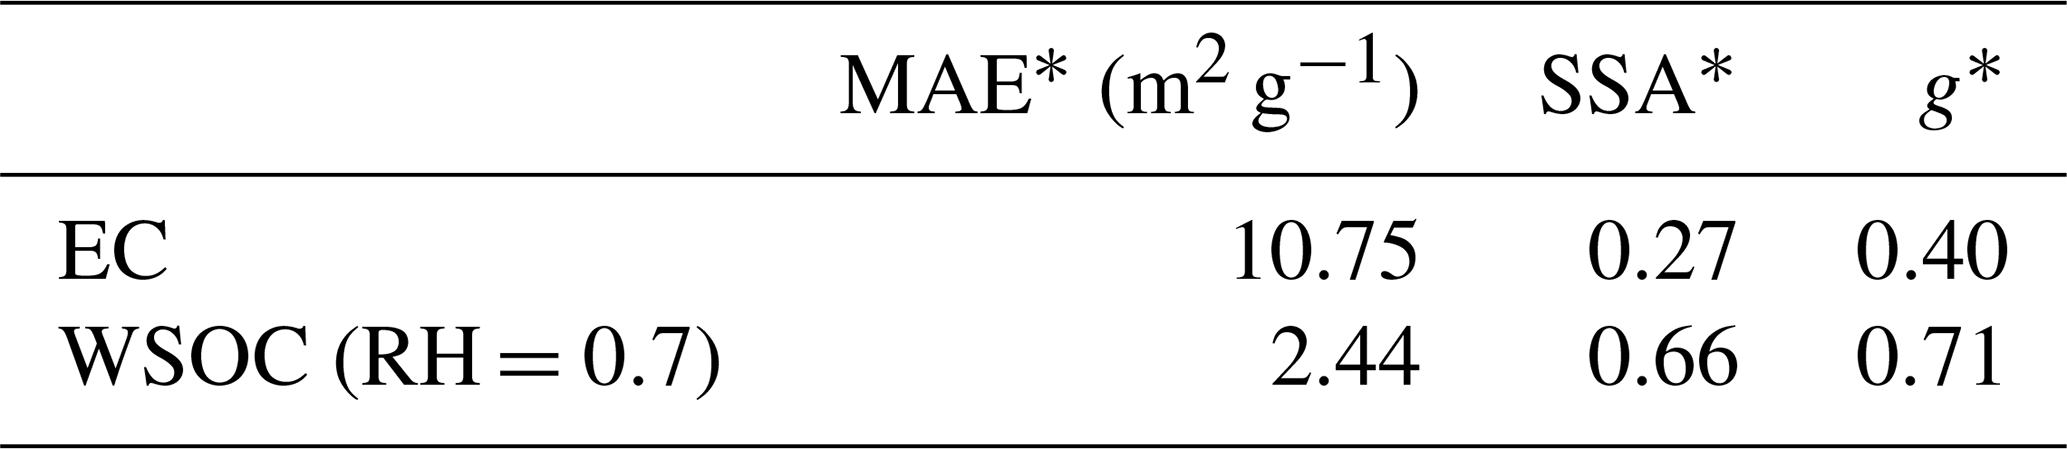
In Table 3, we show the optical properties (MAE*, SSA* and g*) for EC and WSOC (at RH =0.7) in the band 26 (22 650–29 000 cm−1, 345–442 nm) as provided in the RRTMG_SW model. Based on the surface mass concentration of EC and WSOC measured in this study, RRTMG_SW simulated the respective absorptive properties in the first layer of the model (the lowest layer above the ground), which accounts for the aerosol absorption in the radiative transfer calculation. To obtain the absorptive radiative forcing (ARF) of EC or WSOC, RRTMG_SW was run twice by including and excluding EC or WSOC in the model. The differences in the radiative flux between the two runs indicate the absorptive radiative effect of EC or WSOC in the atmosphere.
Table 3Optics for EC and WSOC (RH =0.7) in the shortwave band 26 (22 650–29 000 cm−1, 345–442 nm) provided in RRTMG_SW.
In the wavelength range of 345–442 nm, the change in the net flux at the surface caused by absorption of EC and WSOC was and W m−2, respectively. The ARF at the top of the atmosphere (TOA) was 0.8±0.4 W m−2 for EC and W m−2 for WSOC. Therefore, the ARF in the atmosphere caused by absorption of EC () and WSOC () was 4.2±2.0 and 1.2±0.5 W m−2, respectively, which are slightly higher than the previously estimated EEC and EWSOC, indicating that the absorbing aerosols maintain a part of the solar energy in the atmosphere. Our estimates from the model indicate that the absorption ability of WSOC was equivalent to about 30 % of EC absorption in this study, which is comparable to the ratio from previous studies. For example, Lin et al. (2014) simulated the global OC radiative forcing and indicated that the absorption due to OC (both primary and secondary OC) aerosols is about 27 %–70 % of the EC warming effect in the global atmosphere. Liu et al. (2014b, 2015) investigated the absorption of OC aerosols at different altitudes over the North American continent and found that OC absorption at TOA is around 20 % of EC direct effect in the background troposphere. Our study provides additional evidence and stresses the necessity to account for the absorption capacity of WSOC in model simulations of the global energy budget.
In this study, biomass burning tracers (including levoglucosan, mannosan, galactosan and nss-K+) were used to quantify biomass burning contributions to the carbonaceous components of PM2.5 in Nanjing during a wintertime pollution event. The origin of biomass burning and biomass fuel types were also investigated. Furthermore, solar energy absorption due to biomass-burning BrC was quantified.
The levoglucosan concentration in PM2.5 in this study was up to 1476 ng m−3, which is significantly higher in comparison with those found in other studies. Biomass burning contribution to OC and WSOC was, on average, 20.9±9.3 % and 22.3±9.9 %, respectively, and was as high as 53.6 % to OC and 55.4 % to WSOC, reflecting the large contribution of biomass burning to carbonaceous aerosols in urban atmospheres during winter. Both of the facts indicate the significant impact of biomass burning in this atmospheric pollution episode, although no local open biomass burning was found during the study period. The combination of long-range transport analysis, fire spot information and the potential emission sensitivity of BC suggests that the burning of crop residuals in southeastern China was responsible for the significant biomass burning contribution to the ambient aerosols.
The mass absorption efficiency of water-soluble BrC at the 365 nm wavelength was averaged to 1.0±0.2 m2 g−1, with a range from 0.5 to 1.6 m2 g−1. Based on the measured light-absorbing properties, solar energy absorption of WSOC and EC in short wavelengths (300–400 nm) was calculated to be 0.8±0.4 and 3.4±1.7 W m−2, respectively, which were slightly lower than 1.2±0.5 W m−2 for WSOC and 4.2±2.0 W m−2 for EC, the results simulated by a radiative transfer model (RRTMG_SW). The maximum solar energy absorption of WSOC due to biomass burning was 0.9 W m−2. It provides the evidence that carbonaceous components released by biomass burning transported over long distances absorbed solar energy, especially in the UV band, influencing the radiation balance of the atmosphere. The PSCF analysis of the carbonaceous compound concentration and light absorption of carbonaceous aerosols shows that the regionally transported biomass burning emissions profoundly impacted the chemical and optical properties of carbonaceous aerosols in Nanjing during this episode.
Data are available from the corresponding author on request (dryanlinzhang@outlook.com, zhangyanlin@nuist.edu.cn).
YZ designed the study. XL and YZ conceived the study. XL, XZ, TH, ZX, MB, WZ, MF carried out the experiments and collected data. XL wrote the paper with YZ, YP, LX and CZ. FC, MH, CY, YC and XuL have contributed to the data interpretation and review of the paper.
The authors declare that they have no conflict of interest.
This article is part of the special issue “Regional transport and transformation of air pollution in eastern China”. It is not associated with a conference.
This research has been supported by the National Key R&D Program of China (grant no. 2017YFC0210101), the Natural Scientific Foundation of China (grant nos. 91644103, 41977305 and 41761144056), and the Provincial Natural Science Foundation of Jiangsu (grant no. BK20180040). This study has been supported by the funding of Jiangsu Innovation & Entrepreneurship Team. The authors would also like to thank the China Scholarship Council for the support to Xiaoyan Liu.
This paper was edited by Yuan Wang and reviewed by three anonymous referees.
Akimoto, H. and Narita, H.: Distribution of SO2, NOx and CO2 emissions from fuel combustion and industrial activities in Asia with resolution, Atmos. Environ., 28, 213–225, https://doi.org/10.1016/1352-2310(94)90096-5, 1994.
Alexander, D. T. L., Crozier, P. A., and Anderson, J. R.: Brown Carbon Spheres in East Asian Outflow and Their Optical Properties, Science, 321, 833–836, https://doi.org/10.1126/science.1155296, 2008.
Ancellet, G., Pelon, J., Totems, J., Chazette, P., Bazureau, A., Sicard, M., Di Iorio, T., Dulac, F., and Mallet, M.: Long-range transport and mixing of aerosol sources during the 2013 North American biomass burning episode: analysis of multiple lidar observations in the western Mediterranean basin, Atmos. Chem. Phys., 16, 4725–4742, https://doi.org/10.5194/acp-16-4725-2016, 2016.
Andreae, M. O. and Gelencsér, A.: Black carbon or brown carbon? The nature of light-absorbing carbonaceous aerosols, Atmos. Chem. Phys., 6, 3131–3148, https://doi.org/10.5194/acp-6-3131-2006, 2006.
Aouizerats, B., van der Werf, G. R., Balasubramanian, R., and Betha, R.: Importance of transboundary transport of biomass burning emissions to regional air quality in Southeast Asia during a high fire event, Atmos. Chem. Phys., 15, 363–373, https://doi.org/10.5194/acp-15-363-2015, 2015.
Bao, M., Cao, F., Chang, Y., Zhang, Y.-L., Gao, Y., Liu, X., Zhang, Y., Zhang, W., Tang, T., Xu, Z., Liu, S., Lee, X., Li, J., and Zhang, G.: Characteristics and origins of air pollutants and carbonaceous aerosols during wintertime haze episodes at a rural site in the Yangtze River Delta, China, Atmos. Pollut. Res., 8, 900–911, https://doi.org/10.1016/j.apr.2017.03.001, 2017.
Bikkina, S.: Brown carbon in atmospheric outflow from the Indo-Gangetic Plain: Mass absorption efficiency and temporal variability, Atmos. Environ., 89, 835–843, https://doi.org/10.1016/j.atmosenv.2014.03.030, 2014.
Bohren, C. F. and Huffman, D. R.: Absorption and scattering of light by small particles, Wiley-Inter-science Publication, 181–185, 1998.
Bond, T. C.: Spectral dependence of visible light absorption by carbonaceous particles emitted from coal combustion, Geophys. Res. Lett., 28, 4075–4078, https://doi.org/10.1029/2001GL013652, 2001.
Bond, T. C. and Bergstrom, R. W.: Light Absorption by Carbonaceous Particles: An Investigative Review, Aerosol Sci. Tech., 40, 27–67, https://doi.org/10.1080/02786820500421521, 2006.
Bones, D. L., Henricksen, D. K., Mang, S. A., Gonsior, M., Bateman, A. P., Nguyen, T. B., Cooper, W. J., and Nizkorodov, S. A.: Appearance of strong absorbers and fluorophores in limonene-O3 secondary organic aerosol due to -mediated chemical aging over long time scales, J. Geophys. Res.-Atmos., 115, D05203, https://doi.org/10.1029/2009JD012864, 2010.
Bosch, C., Andersson, A., Kirillova, E. N., Budhavant, K., Tiwari, S., Praveen, P. S., Russell, L. M., Beres, N. D., Ramanathan, V., and Gustafsson, Ö.: Source-diagnostic dual-isotope composition and optical properties of water-soluble organic carbon and elemental carbon in the South Asian outflow intercepted over the Indian Ocean, J. Geophys. Res.-Atmos., 119, 11743–711759, https://doi.org/10.1002/2014JD022127, 2014.
Cao, F., Zhang, S.-C., Kawamura, K., and Zhang, Y.-L.: Inorganic markers, carbonaceous components and stable carbon isotope from biomass burning aerosols in Northeast China, Sci. Total Environ., 572, 1244–1251, https://doi.org/10.1016/j.scitotenv.2015.09.099, 2016.
Cao, J. J., Wu, F., Chow, J. C., Lee, S. C., Li, Y., Chen, S. W., An, Z. S., Fung, K. K., Watson, J. G., Zhu, C. S., and Liu, S. X.: Characterization and source apportionment of atmospheric organic and elemental carbon during fall and winter of 2003 in Xi'an, China, Atmos. Chem. Phys., 5, 3127–3137, https://doi.org/10.5194/acp-5-3127-2005, 2005.
Chakrabarty, R. K., Gyawali, M., Yatavelli, R. L. N., Pandey, A., Watts, A. C., Knue, J., Chen, L.-W. A., Pattison, R. R., Tsibart, A., Samburova, V., and Moosmüller, H.: Brown carbon aerosols from burning of boreal peatlands: microphysical properties, emission factors, and implications for direct radiative forcing, Atmos. Chem. Phys., 16, 3033–3040, https://doi.org/10.5194/acp-16-3033-2016, 2016.
Chen, D., Cui, H., Zhao, Y., Yin, L., Lu, Y., and Wang, Q.: A two-year study of carbonaceous aerosols in ambient PM2.5 at a regional background site for western Yangtze River Delta, China, Atmos. Res., 183, 351–361, https://doi.org/10.1016/j.atmosres.2016.09.004, 2017.
Chen, J., Li, C., Ristovski, Z., Milic, A., Gu, Y., Islam, M. S., Wang, S., Hao, J., Zhang, H., He, C., Guo, H., Fu, H., Miljevic, B., Morawska, L., Thai, P., Lam, Y. F., Pereira, G., Ding, A., Huang, X., and Dumka, U. C.: A review of biomass burning: Emissions and impacts on air quality, health and climate in China, Sci. Total Environ., 579, 1000–1034, https://doi.org/10.1016/j.scitotenv.2016.11.025, 2017.
Chen, Y. and Bond, T. C.: Light absorption by organic carbon from wood combustion, Atmos. Chem. Phys., 10, 1773–1787, https://doi.org/10.5194/acp-10-1773-2010, 2010.
Cheng, Y., He, K.-B., Zheng, M., Duan, F.-K., Du, Z.-Y., Ma, Y.-L., Tan, J.-H., Yang, F.-M., Liu, J.-M., Zhang, X.-L., Weber, R. J., Bergin, M. H., and Russell, A. G.: Mass absorption efficiency of elemental carbon and water-soluble organic carbon in Beijing, China, Atmos. Chem. Phys., 11, 11497–11510, https://doi.org/10.5194/acp-11-11497-2011, 2011.
Cheng, Y., Engling, G., He, K.-B., Duan, F.-K., Ma, Y.-L., Du, Z.-Y., Liu, J.-M., Zheng, M., and Weber, R. J.: Biomass burning contribution to Beijing aerosol, Atmos. Chem. Phys., 13, 7765–7781, https://doi.org/10.5194/acp-13-7765-2013, 2013.
Cheng, Y., He, K.-b., Du, Z.-y., Engling, G., Liu, J.-m., Ma, Y.-l., Zheng, M., and Weber, R. J.: The characteristics of brown carbon aerosol during winter in Beijing, Atmos. Environ., 127, 355–364, https://doi.org/10.1016/j.atmosenv.2015.12.035, 2016.
Cheng, Z., Wang, S., Fu, X., Watson, J. G., Jiang, J., Fu, Q., Chen, C., Xu, B., Yu, J., Chow, J. C., and Hao, J.: Impact of biomass burning on haze pollution in the Yangtze River delta, China: a case study in summer 2011, Atmos. Chem. Phys., 14, 4573–4585, https://doi.org/10.5194/acp-14-4573-2014, 2014.
Choudhary, V., Rajput, P., Singh, D. K., Singh, A. K., and Gupta, T.: Light absorption characteristics of brown carbon during foggy and non-foggy episodes over the Indo-Gangetic Plain, Atmos. Pollut. Res., 9, 494–501, https://doi.org/10.1016/j.apr.2017.11.012, 2017.
Drewnick, F., Hings, S. S., Curtius, J., Eerdekens, G., and Williams, J.: Measurement of fine particulate and gas-phase species during the New Year's fireworks 2005 in Mainz, Germany, Atmos. Environ., 40, 4316–4327, https://doi.org/10.1016/j.atmosenv.2006.03.040, 2006.
Du, Z., He, K., Cheng, Y., Duan, F., Ma, Y., Liu, J., Zhang, X., Zheng, M., and Weber, R.: A yearlong study of water-soluble organic carbon in Beijing I: Sources and its primary vs. secondary nature, Atmos. Environ., 92, 514–521, https://doi.org/10.1016/j.atmosenv.2014.04.060, 2014a.
Du, Z., He, K., Cheng, Y., Duan, F., Ma, Y., Liu, J., Zhang, X., Zheng, M., and Weber, R.: A yearlong study of water-soluble organic carbon in Beijing II: Light absorption properties, Atmos. Environ., 89, 235–241, https://doi.org/10.1016/j.atmosenv.2014.02.022, 2014b.
Duan, F., Liu, X., Yu, T., and Cachier, H.: Identification and estimate of biomass burning contribution to the urban aerosol organic carbon concentrations in Beijing, Atmos. Environ., 38, 1275–1282, https://doi.org/10.1016/j.atmosenv.2003.11.037, 2004.
Engling, G., Carrico, C. M., Kreidenweis, S. M., Collett, J. L., Day, D. E., Malm, W. C., Lincoln, E., Min Hao, W., Iinuma, Y., and Herrmann, H.: Determination of levoglucosan in biomass combustion aerosol by high-performance anion-exchange chromatography with pulsed amperometric detection, Atmos. Environ., 40, 299–311, https://doi.org/10.1016/j.atmosenv.2005.12.069, 2006.
Engling, G., Lee, J. J., Tsai, Y.-W., Lung, S.-C. C., Chou, C. C. K., and Chan, C.-Y.: Size-Resolved Anhydrosugar Composition in Smoke Aerosol from Controlled Field Burning of Rice Straw, Aerosol Sci. Tech., 43, 662–672, https://doi.org/10.1080/02786820902825113, 2009.
Favez, O., El Haddad, I., Piot, C., Boréave, A., Abidi, E., Marchand, N., Jaffrezo, J.-L., Besombes, J.-L., Personnaz, M.-B., Sciare, J., Wortham, H., George, C., and D'Anna, B.: Inter-comparison of source apportionment models for the estimation of wood burning aerosols during wintertime in an Alpine city (Grenoble, France), Atmos. Chem. Phys., 10, 5295–5314, https://doi.org/10.5194/acp-10-5295-2010, 2010.
Feng, Y., Ramanathan, V., and Kotamarthi, V. R.: Brown carbon: a significant atmospheric absorber of solar radiation?, Atmos. Chem. Phys., 13, 8607–8621, https://doi.org/10.5194/acp-13-8607-2013, 2013.
Fraser, M. P. and Lakshmanan, K.: Using Levoglucosan as a Molecular Marker for the Long-Range Transport of Biomass Combustion Aerosols, Environ. Sci. Technol., 34, 4560–4564, https://doi.org/10.1021/es991229l, 2000.
Gao, S., Hegg, D. A., Hobbs, P. V., Kirchstetter, T. W., Magi, B. I., and Sadilek, M.: Water-soluble organic components in aerosols associated with savanna fires in southern Africa: Identification, evolution, and distribution, J. Geophys. Res.-Atmos., 108, 8491, https://doi.org/10.1029/2002JD002324, 2003.
Gilman, J. B., Lerner, B. M., Kuster, W. C., Goldan, P. D., Warneke, C., Veres, P. R., Roberts, J. M., de Gouw, J. A., Burling, I. R., and Yokelson, R. J.: Biomass burning emissions and potential air quality impacts of volatile organic compounds and other trace gases from fuels common in the US, Atmos. Chem. Phys., 15, 13915–13938, https://doi.org/10.5194/acp-15-13915-2015, 2015.
Graham, B., Guyon, P., Taylor, P. E., Artaxo, P., Maenhaut, W., Glovsky, M. M., Flagan, R. C., and Andreae, M. O.: Organic compounds present in the natural Amazonian aerosol: Characterization by gas chromatography-mass spectrometry, J. Geophys. Res.-Atmos., 108, 4766, https://doi.org/10.1029/2003jd003990, 2003.
Grythe, H., Kristiansen, N. I., Groot Zwaaftink, C. D., Eckhardt, S., Ström, J., Tunved, P., Krejci, R., and Stohl, A.: A new aerosol wet removal scheme for the Lagrangian particle model FLEXPART v10, Geosci. Model Dev., 10, 1447–1466, https://doi.org/10.5194/gmd-10-1447-2017, 2017.
Haque, Md. M., Kawamura, K., Deshmukh, D. K., Fang, C., Song, W., Mengying, B., and Zhang, Y.-L.: Characterization of organic aerosols from a Chinese megacity during winter: predominance of fossil fuel combustion, Atmos. Chem. Phys., 19, 5147–5164, https://doi.org/10.5194/acp-19-5147-2019, 2019.
Hecobian, A., Zhang, X., Zheng, M., Frank, N., Edgerton, E. S., and Weber, R. J.: Water-Soluble Organic Aerosol material and the light-absorption characteristics of aqueous extracts measured over the Southeastern United States, Atmos. Chem. Phys., 10, 5965–5977, https://doi.org/10.5194/acp-10-5965-2010, 2010.
Hess, M., Koepke, P., and Schult, I.: Optical Properties of Aerosols and Clouds: The Software Package OPAC, B. Am. Meteorol. Soc., 79, 831–844, https://doi.org/10.1175/1520-0477(1998)079<0831:OPOAAC>2.0.CO;2, 1998.
Hoffer, A., Gelencsér, A., Guyon, P., Kiss, G., Schmid, O., Frank, G. P., Artaxo, P., and Andreae, M. O.: Optical properties of humic-like substances (HULIS) in biomass-burning aerosols, Atmos. Chem. Phys., 6, 3563–3570, https://doi.org/10.5194/acp-6-3563-2006, 2006.
Hou, B., Zhuang, G., Zhang, R., Liu, T., Guo, Z., and Chen, Y.: The implication of carbonaceous aerosol to the formation of haze: Revealed from the characteristics and sources of OC/EC over a mega-city in China, J. Hazard. Mater., 190, 529–536, https://doi.org/10.1016/j.jhazmat.2011.03.072, 2011.
Huang, R.-J., Zhang, Y., Bozzetti, C., Ho, K.-F., Cao, J.-J., Han, Y., Daellenbach, K. R., Slowik, J. G., Platt, S. M., Canonaco, F., Zotter, P., Wolf, R., Pieber, S. M., Bruns, E. A., Crippa, M., Ciarelli, G., Piazzalunga, A., Schwikowski, M., Abbaszade, G., Schnelle-Kreis, J., Zimmermann, R., An, Z., Szidat, S., Baltensperger, U., Haddad, I. E., and Prévôt, A. S. H.: High secondary aerosol contribution to particulate pollution during haze events in China, Nature, 514, 218–222, https://doi.org/10.1038/nature13774, 2014.
Iacono Michael, J., Mlawer Eli, J., Clough Shepard, A., and Morcrette, J. J.: Impact of an improved longwave radiation model, RRTM, on the energy budget and thermodynamic properties of the NCAR community climate model, CCM3, J. Geophys. Res.-Atmos., 105, 14873–14890, https://doi.org/10.1029/2000JD900091, 2000.
Iacono Michael, J., Delamere Jennifer, S., Mlawer Eli, J., Shephard Mark, W., Clough Shepard, A., and Collins William, D.: Radiative forcing by long-lived greenhouse gases: Calculations with the AER radiative transfer models, J. Geophys. Res.-Atmos., 113, D13103, https://doi.org/10.1029/2008JD009944, 2008.
Jaffrezo, J.-L., Aymoz, G., Delaval, C., and Cozic, J.: Seasonal variations of the water soluble organic carbon mass fraction of aerosol in two valleys of the French Alps, Atmos. Chem. Phys., 5, 2809–2821, https://doi.org/10.5194/acp-5-2809-2005, 2005.
Jung, C. H., Lee, J. Y., and Kim, Y. P.: Estimation of aerosol optical properties considering hygroscopicity and light absorption, Atmos. Environ., 105, 191–201, https://doi.org/10.1016/j.atmosenv.2015.01.058, 2015.
Jung, J., Lee, S., Kim, H., Kim, D., Lee, H., and Oh, S.: Quantitative determination of the biomass-burning contribution to atmospheric carbonaceous aerosols in Daejeon, Korea, during the rice-harvest period, Atmos. Environ., 89, 642–650, https://doi.org/10.1016/j.atmosenv.2014.03.010, 2014.
Jung, J., Lee, D., Jeong, H., Lee, S., and Oh, S.: Chemical characterization of the long-range transport of firework/firecracker emissions over the Korean Peninsula: A novel indicator of Asian continental outflows, Atmos. Environ., 178, 223–230, https://doi.org/10.1016/j.atmosenv.2018.02.013, 2018.
Kendrick, C. M., Koonce, P., and George, L. A.: Diurnal and seasonal variations of NO, NO2 and PM2.5 mass as a function of traffic volumes alongside an urban arterial, Atmos. Environ., 122, 133–141, https://doi.org/10.1016/j.atmosenv.2015.09.019, 2015.
Kim, H., Kim, J. Y., Jin, H. C., Lee, J. Y., and Lee, S. P.: Seasonal variations in the light-absorbing properties of water-soluble and insoluble organic aerosols in Seoul, Korea, Atmos. Environ., 129, 234–242, https://doi.org/10.1016/j.atmosenv.2016.01.042, 2016.
Kirchstetter, T. W., Novakov, T., and Hobbs, P. V.: Evidence that the spectral dependence of light absorption by aerosols is affected by organic carbon, J. Geophys. Res.-Atmos., 109, D21208, https://doi.org/10.1029/2004jd004999, 2004.
Kirillova, E. N., Andersson, A., Han, J., Lee, M., and Gustafsson, Ö.: Sources and light absorption of water-soluble organic carbon aerosols in the outflow from northern China, Atmos. Chem. Phys., 14, 1413–1422, https://doi.org/10.5194/acp-14-1413-2014, 2014a.
Kirillova, E. N., Andersson, A., Tiwari, S., Srivastava, A. K., Bisht, D. S., and Gustafsson, Ö.: Water-soluble organic carbon aerosols during a full New Delhi winter: Isotope-based source apportionment and optical properties, J. Geophys. Res.-Atmos., 119, 3476–3485, https://doi.org/10.1002/2013JD020041, 2014b.
Kunwar, B. and Kawamura, K.: One-year observations of carbonaceous and nitrogenous components and major ions in the aerosols from subtropical Okinawa Island, an outflow region of Asian dusts, Atmos. Chem. Phys., 14, 1819–1836, https://doi.org/10.5194/acp-14-1819-2014, 2014.
Lack, D. A., Langridge, J. M., Bahreini, R., Cappa, C. D., Middlebrook, A. M., and Schwarz, J. P.: Brown carbon and internal mixing in biomass burning particles, P. Natl. Acad. Sci. USA, 109, 14802, https://doi.org/10.1073/pnas.1206575109, 2012.
Lai, S.-c., Zou, S.-c., Cao, J.-j., Lee, S.-c., and Ho, K.-f.: Characterizing ionic species in PM2.5 and PM10 in four Pearl River Delta cities, South China, J. Environ. Sci., 19, 939–947, https://doi.org/10.1016/S1001-0742(07)60155-7, 2007.
Laskin, A., Laskin, J., and Nizkorodov, S. A.: Chemistry of Atmospheric Brown Carbon, Chem. Rev., 115, 4335–4382, https://doi.org/10.1021/cr5006167, 2015.
Leithead, A., Li, S. M., Hoff, R., Yu, C., and Brook, J.: Levoglucosan and dehydroabietic acid: Evidence of biomass burning impact on aerosols in the Lower Fraser Valley, Atmos. Environ., 40, 2721–2734, 2006.
Li, B., Zhang, J., Zhao, Y., Yuan, S., Zhao, Q., Shen, G., and Wu, H.: Seasonal variation of urban carbonaceous aerosols in a typical city Nanjing in Yangtze River Delta, China, Atmos. Environ., 106, 223–231, https://doi.org/10.1016/j.atmosenv.2015.01.064, 2015.
Li, C., Yan, F., Kang, S., Chen, P., Hu, Z., Gao, S., Qu, B., and Sillanpää, M.: Light absorption characteristics of carbonaceous aerosols in two remote stations of the southern fringe of the Tibetan Plateau, China, Atmos. Environ., 143, 79–85, https://doi.org/10.1016/j.atmosenv.2016.08.042, 2016.
Li, J.: Comments on “On the Choice of Average Solar Zenith Angle”, J. Atmos. Sci., 74, 1669–1676, https://doi.org/10.1175/JAS-D-16-0185.1, 2017.
Li, K., Liao, H., Mao, Y., and Ridley, D. A.: Source sector and region contributions to concentration and direct radiative forcing of black carbon in China, Atmos. Environ., 124, 351–366, https://doi.org/10.1016/j.atmosenv.2015.06.014, 2016.
Li, X., Chen, M., Le, H. P., Wang, F., Guo, Z., Iinuma, Y., Chen, J., and Herrmann, H.: Atmospheric outflow of PM2.5 saccharides from megacity Shanghai to East China Sea: Impact of biological and biomass burning sources, Atmos. Environ., 143, 1–14, https://doi.org/10.1016/j.atmosenv.2016.08.039, 2016.
Lin, G., Penner, J. E., Flanner, M. G., Sillman, S., Xu, L., and Zhou, C.: Radiative forcing of organic aerosol in the atmosphere and on snow: Effects of SOA and brown carbon, J. Geophys. Res.-Atmos., 119, 7453–7476, https://doi.org/10.1002/2013JD021186, 2014.
Liu, J., Li, J., Zhang, Y., Liu, D., Ding, P., Shen, C., Shen, K., He, Q., Ding, X., Wang, X., Chen, D., Szidat, S., and Zhang, G.: Source Apportionment Using Radiocarbon and Organic Tracers for PM2.5 Carbonaceous Aerosols in Guangzhou, South China: Contrasting Local- and Regional-Scale Haze Events, Environ. Sci. Technol., 48, 12002–12011, https://doi.org/10.1021/es503102w, 2014a.
Liu, J., Scheuer, E., Dibb, J., Ziemba, L. D., Thornhill, K. L., Anderson, B. E., Wisthaler, A., Mikoviny, T., Devi, J. J., Bergin, M., and Weber, R. J.: Brown carbon in the continental troposphere, Geophys. Res. Lett., 41, 2191–2195, https://doi.org/10.1002/2013GL058976, 2014b.
Liu, J., Scheuer, E., Dibb, J., Diskin, G. S., Ziemba, L. D., Thornhill, K. L., Anderson, B. E., Wisthaler, A., Mikoviny, T., Devi, J. J., Bergin, M., Perring, A. E., Markovic, M. Z., Schwarz, J. P., Campuzano-Jost, P., Day, D. A., Jimenez, J. L., and Weber, R. J.: Brown carbon aerosol in the North American continental troposphere: sources, abundance, and radiative forcing, Atmos. Chem. Phys., 15, 7841–7858, https://doi.org/10.5194/acp-15-7841-2015, 2015.
Liu, J., Lin, P., Laskin, A., Laskin, J., Kathmann, S. M., Wise, M., Caylor, R., Imholt, F., Selimovic, V., and Shilling, J. E.: Optical properties and aging of light-absorbing secondary organic aerosol, Atmos. Chem. Phys., 16, 12815–12827, https://doi.org/10.5194/acp-16-12815-2016, 2016.
Mlawer, E. J. and Clough, S. A.: Shortwave and longwave enhancements in the rapid radiative transfer model, Seventh Atmospheric Radiation Measurement (ARM) Science Team Meeting, U.S. Department of Energy, 499–504, 1998.
Mochida, M., Kawamura, K., Fu, P., and Takemura, T.: Seasonal variation of levoglucosan in aerosols over the western North Pacific and its assessment as a biomass-burning tracer, Atmos. Environ., 44, 3511–3518, https://doi.org/10.1016/j.atmosenv.2010.06.017, 2010.
Moffet, R. C. and Prather, K. A.: In-situ measurements of the mixing state and optical properties of soot with implications for radiative forcing estimates, P. Natl. Acad. Sci. USA, 106, 11872–11877, https://doi.org/10.1073/pnas.0900040106, 2009.
Myhre, G., Shindell, D., Bréon, F.-M., Collins, W., Fuglestvedt, J., Huang, J., Koch, D., Lamarque, J.-F., Lee, D., Mendoza, B., Nakajima, T., Robock, A., Stephens, G., Takemura, T., and Zhang, H.: Anthropogenic and natural radiative forcing, Cambridge, UK, 659–740, 2013.
Myhre, G. and Samset, B. H.: Standard climate models radiation codes underestimate black carbon radiative forcing, Atmos. Chem. Phys., 15, 2883–2888, https://doi.org/10.5194/acp-15-2883-2015, 2015.
Novakov, T. and Corrigan, C. E.: Cloud condensation nucleus activity of the organic component of biomass smoke particles, Geophys. Res. Lett., 23, 2141–2144, https://doi.org/10.1029/96GL01971, 1996.
Oanh, N. T. K., Bich, T. L., Tipayarom, D., Manadhar, B. R., Prapat, P., Simpson, C. D., and Liu, L. J. S.: Characterization of particulate matter emission from open burning of rice straw, Atmos. Environ., 45, 493–502, https://doi.org/10.1016/j.atmosenv.2010.09.023, 2011.
Oros, D. R. and Simoneit, B. R. T.: Identification and emission factors of molecular tracers in organic aerosols from biomass burning Part 1. Temperate climate conifers, Appl. Geochem., 16, 1513–1544, https://doi.org/10.1016/S0883-2927(01)00021-X, 2001.
Panicker, A., Aditi, R., Beig, G., Ali, K., and Solmon, F.: Radiative Forcing of Carbonaceous Aerosols over Two Urban Environments in Northern India, Aerosol Air Qual. Res., 18, 884–894, https://doi.org/10.4209/aaqr.2017.01.0056, 2017.
Park, S. S. and Cho, S. Y.: Tracking sources and behaviors of water-soluble organic carbon in fine particulate matter measured at an urban site in Korea, Atmos. Environ., 45, 60–72, https://doi.org/10.1016/j.atmosenv.2010.09.045, 2011.
Peng, J., Hu, M., Guo, S., Du, Z., Zheng, J., Shang, D., Levy Zamora, M., Zeng, L., Shao, M., Wu, Y.-S., Zheng, J., Wang, Y., Glen, C. R., Collins, D. R., Molina, M. J., and Zhang, R.: Markedly enhanced absorption and direct radiative forcing of black carbon under polluted urban environments, P. Natl. Acad. Sci. USA, 113, 4266, https://doi.org/10.1073/pnas.1602310113, 2016.
Pruppacher, H. R. and Klett, J. D.: Microphysics of Clouds and Precipitation, Second Revised and Enlarged Edition with an Introduction to Cloud Chemistry and Cloud Electricity ed., Kluwer Academic Publishers, Dordrecht, 1997.
Puxbaum, H., Caseiro, A., Sánchez-Ochoa, A., Kasper-Giebl, A., Claeys, M., Gelencsér, A., Legrand, M., Preunkert, S., and Pio, C.: Levoglucosan levels at background sites in Europe for assessing the impact of biomass combustion on the European aerosol background, J. Geophys. Res.-Atmos., 112, D23S05, https://doi.org/10.1029/2006JD008114, 2007.
Qin, Y. M., Tan, H. B., Li, Y. J., Li, Z. J., Schurman, M. I., Liu, L., Wu, C., and Chan, C. K.: Chemical characteristics of brown carbon in atmospheric particles at a suburban site near Guangzhou, China, Atmos. Chem. Phys., 18, 16409–16418, https://doi.org/10.5194/acp-18-16409-2018, 2018.
Ramanathan, V. and Carmichael, G.: Global and regional climate changes due to black carbon, Nat. Geosci., 1, 221–227, https://doi.org/10.1038/ngeo156, 2008.
Reisen, F., Meyer, C. P., McCaw, L., Powell, J. C., Tolhurst, K., Keywood, M. D., and Gras, J. L.: Impact of smoke from biomass burning on air quality in rural communities in southern Australia, Atmos. Environ., 45, 3944–3953, https://doi.org/10.1016/j.atmosenv.2011.04.060, 2011.
Rogers, C. F., Hudson, J. G., Zielinska, B., Tanner, R. L., Hallett, J., and Watson, J. G.: Cloud condensation nuclei from biomass burnin, Massachusetts Inst of Tech Press, United States, 1991.
Sang, X. F., Chan, C. Y., Engling, G., Chan, L. Y., Wang, X. M., Zhang, Y. N., Si, S., Zhang, Z. S., Zhang, T., and Ming, H.: Levoglucosan enhancement in ambient aerosol during springtime transport events of biomass burning smoke to Southeast China, Tellus B, 63, 129–139, 2011.
Sareen, N., Moussa, S. G., and McNeill, V. F.: Photochemical Aging of Light-Absorbing Secondary Organic Aerosol Material, J. Phys. Chem. A, 117, 2987–2996, https://doi.org/10.1021/jp309413j, 2013.
Seibert, P. and Frank, A.: Source-receptor matrix calculation with a Lagrangian particle dispersion model in backward mode, Atmos. Chem. Phys., 4, 51–63, https://doi.org/10.5194/acp-4-51-2004, 2004.
Shamjad, P. M., Tripathi, S. N., Pathak, R., Hallquist, M., Arola, A., and Bergin, M. H.: Contribution of Brown Carbon to Direct Radiative Forcing over the Indo-Gangetic Plain, Environ. Sci. Technol., 49, 10474–10481, https://doi.org/10.1021/acs.est.5b03368, 2015.
Shamjad, P. M., Tripathi, S. N., Thamban, N. M., and Vreeland, H.: Refractive Index and Absorption Attribution of Highly Absorbing Brown Carbon Aerosols from an Urban Indian City-Kanpur, Sci. Rep.-UK, 6, 37735, https://doi.org/10.1038/srep37735, 2016.
Sheesley, R. J., Schauer, J. J., Chowdhury, Z., Cass, G. R., and Simoneit, B. R. T.: Characterization of organic aerosols emitted from the combustion of biomass indigenous to South Asia, J. Geophys. Res.-Atmos., 108, 4285, https://doi.org/10.1029/2002jd002981, 2003.
Shindell, D. and Faluvegi, G.: Climate response to regional radiative forcing during the twentieth century, Nat. Geosci., 2, 294–300, https://doi.org/10.1038/ngeo473, 2009.
Simoneit, B. R. T.: Biomass burning – a review of organic tracers for smoke from incomplete combustion, Appl. Geochem., 17, 129–162, https://doi.org/10.1016/S0883-2927(01)00061-0, 2002.
Simoneit, B. R. T., Schauer, J. J., Nolte, C. G., Oros, D. R., Elias, V. O., Fraser, M. P., Rogge, W. F., and Cass, G. R.: Levoglucosan, a tracer for cellulose in biomass burning and atmospheric particles, Atmos. Environ., 33, 173-182, https://doi.org/10.1016/S1352-2310(98)00145-9, 1999.
Simoneit, B. R. T., Elias, V. O., Kobayashi, M., Kawamura, K., Rushdi, A. I., Medeiros, P. M., Rogge, W. F., and Didyk, B. M.: SugarsDominant Water-Soluble Organic Compounds in Soils and Characterization as Tracers in Atmospheric Particulate Matter, Environ. Sci. Technol., 38, 5939–5949, https://doi.org/10.1021/es0403099, 2004.
Srinivas, B., Rastogi, N., Sarin, M. M., Singh, A., and Singh, D.: Mass absorption efficiency of light absorbing organic aerosols from source region of paddy-residue burning emissions in the Indo-Gangetic Plain, Atmos. Environ., 125, 360–370, https://doi.org/10.1016/j.atmosenv.2015.07.017, 2016.
Stohl, A., Hittenberger, M., and Wotawa, G.: Validation of the lagrangian particle dispersion model FLEXPART against large-scale tracer experiment data, Atmos. Environ., 32, 4245–4264, https://doi.org/10.1016/S1352-2310(98)00184-8, 1998.
Stohl, A., Forster, C., Frank, A., Seibert, P., and Wotawa, G.: Technical note: The Lagrangian particle dispersion model FLEXPART version 6.2, Atmos. Chem. Phys., 5, 2461–2474, https://doi.org/10.5194/acp-5-2461-2005, 2005.
Streets, D. G., Bond, T. C., Carmichael, G. R., Fernandes, S. D., Fu, Q., He, D., Klimont, Z., Nelson, S. M., Tsai, N. Y., Wang, M. Q., Woo, J. H., and Yarber, K. F.: An inventory of gaseous and primary aerosol emissions in Asia in the year 2000, J. Geophys. Res.-Atmos., 108, GTE 30-31–GTE 30-23, 2003.
Sullivan, A. P., Holden, A. S., Patterson, L. A., McMeeking, G. R., Kreidenweis, S. M., Malm, W. C., Hao, W. M., Wold, C. E., and Collett, J. L.: A method for smoke marker measurements and its potential application for determining the contribution of biomass burning from wildfires and prescribed fires to ambient PM2.5 organic carbon, J. Geophys. Res., 113, D22302, https://doi.org/10.1029/2008jd010216, 2008.
Sun, Y. L., Wang, Z. F., Fu, P. Q., Yang, T., Jiang, Q., Dong, H. B., Li, J., and Jia, J. J.: Aerosol composition, sources and processes during wintertime in Beijing, China, Atmos. Chem. Phys., 13, 4577–4592, https://doi.org/10.5194/acp-13-4577-2013, 2013.
Tsai, Y. I., Sopajaree, K., Kuo, S.-C., and Yu, S.-P.: Potential PM2.5 impacts of festival-related burning and other inputs on air quality in an urban area of southern Taiwan, Sci. Total Environ., 527–528, 65–79, https://doi.org/10.1016/j.scitotenv.2015.04.021, 2015.
Tzompa-Sosa, Z. A., Sullivan, A. P., Retama, A., and Kreidenweis, S. M.: Contribution of Biomass Burning to Carbonaceous Aerosols in Mexico City during May 2013, Aerosol Air Qual. Res., 16, 114–124, https://doi.org/10.4209/aaqr.2015.01.0030, 2016.
Urban, R. C., Lima-Souza, M., Caetano-Silva, L., Queiroz, M. E. C., Nogueira, R. F. P., Allen, A. G., Cardoso, A. A., Held, G., and Campos, M. L. A. M.: Use of levoglucosan, potassium, and water-soluble organic carbon to characterize the origins of biomass-burning aerosols, Atmos. Environ., 61, 562–569, https://doi.org/10.1016/j.atmosenv.2012.07.082, 2012.
von Schneidemesser, E., Schauer, J. J., Hagler, G. S. W., and Bergin, M. H.: Concentrations and sources of carbonaceous aerosol in the atmosphere of Summit, Greenland, Atmos. Environ., 43, 4155–4162, https://doi.org/10.1016/j.atmosenv.2009.05.043, 2009.
Wang, G., Chen, C., Li, J., Zhou, B., Xie, M., Hu, S., Kawamura, K., and Chen, Y.: Molecular composition and size distribution of sugars, sugar-alcohols and carboxylic acids in airborne particles during a severe urban haze event caused by wheat straw burning, Atmos. Environ., 45, 2473–2479, https://doi.org/10.1016/j.atmosenv.2011.02.045, 2011.
Wang, J., Nie, W., Cheng, Y., Shen, Y., Chi, X., Wang, J., Huang, X., Xie, Y., Sun, P., Xu, Z., Qi, X., Su, H., and Ding, A.: Light absorption of brown carbon in eastern China based on 3-year multi-wavelength aerosol optical property observations and an improved absorption Ångström exponent segregation method, Atmos. Chem. Phys., 18, 9061–9074, https://doi.org/10.5194/acp-18-9061-2018, 2018.
Wang, W., Wu, M. H., Li, L., Zhang, T., Liu, X. D., Feng, J. L., Li, H. J., Wang, Y. J., Sheng, G. Y., Claeys, M., and Fu, J. M.: Polar organic tracers in PM2.5 aerosols from forests in eastern China, Atmos. Chem. Phys., 8, 7507–7518, https://doi.org/10.5194/acp-8-7507-2008, 2008.
Wang, Y., Ma, P.-L., Peng, J., Zhang, R., Jiang, J. H., Easter, R. C., and Yung, Y. L.: Constraining Aging Processes of Black Carbon in the Community Atmosphere Model Using Environmental Chamber Measurements, J. Adv. Model. Earth Sy., 10, 2514–2526, https://doi.org/10.1029/2018MS001387, 2018.
Washenfelder, R. A., Attwood, A. R., Brock, C. A., Guo, H., Xu, L., Weber, R. J., Ng, N. L., Allen, H. M., Ayres, B. R., Baumann, K., Cohen, R. C., Draper, D. C., Duffey, K. C., Edgerton, E., Fry, J. L., Hu, W. W., Jimenez, J. L., Palm, B. B., Romer, P., Stone, E. A., Wooldridge, P. J., and Brown, S. S.: Biomass burning dominates brown carbon absorption in the rural southeastern United States, Geophys. Res. Lett., 42, 653–664, https://doi.org/10.1002/2014GL062444, 2015.
Yan, C., Zheng, M., Sullivan, A. P., Bosch, C., Desyaterik, Y., Andersson, A., Li, X., Guo, X., Zhou, T., Gustafsson, Ö., and Collett, J. L.: Chemical characteristics and light-absorbing property of water-soluble organic carbon in Beijing: Biomass burning contributions, Atmos. Environ., 121, 4–12, https://doi.org/10.1016/j.atmosenv.2015.05.005, 2015.
Yan, C., Zheng, M., Bosch, C., Andersson, A., Desyaterik, Y., Sullivan, A. P., Collett, J. L., Zhao, B., Wang, S., He, K., and Gustafsson, Ö.: Important fossil source contribution to brown carbon in Beijing during winter, Sci. Rep.-UK, 7, 43182, https://doi.org/10.1038/srep43182, 2017.
Yang, L., Nguyen, D. M., Jia, S., Reid, Jeffrey, S., Yu, and Liya, E.: Impacts of biomass burning smoke on the distributions and concentrations of C2–C5 dicarboxylic acids and dicarboxylates in a tropical urban environment, Atmos. Environ., 78, 211–218, 2013.
Yang, M., Howell, S. G., Zhuang, J., and Huebert, B. J.: Attribution of aerosol light absorption to black carbon, brown carbon, and dust in China – interpretations of atmospheric measurements during EAST-AIRE, Atmos. Chem. Phys., 9, 2035–2050, https://doi.org/10.5194/acp-9-2035-2009, 2009.
Zdráhal, Z., Oliveira, J., Vermeylen, R., Claeys, M., and Maenhaut, W.: Improved Method for Quantifying Levoglucosan and Related Monosaccharide Anhydrides in Atmospheric Aerosols and Application to Samples from Urban and Tropical Locations, Environ. Sci. Technol., 36, 747–753, https://doi.org/10.1021/es015619v, 2002.
Zeng, T. and Wang, Y.: Nationwide summer peaks of OC/EC ratios in the contiguous United States, Atmos. Environ., 45, 578–586, https://doi.org/10.1016/j.atmosenv.2010.10.038, 2011.
Zhang, L., Liu, Y., and Hao, L.: Contributions of open crop straw burning emissions to PM2.5concentrations in China, Environ. Res. Lett., 11, 014014, https://doi.org/10.1088/1748-9326/11/1/014014, 2016.
Zhang, T., Claeys, M., Cachier, H., Dong, S., Wang, W., Maenhaut, W., and Liu, X.: Identification and estimation of the biomass burning contribution to Beijing aerosol using levoglucosan as a molecular marker, Atmos. Environ., 42, 7013–7021, https://doi.org/10.1016/j.atmosenv.2008.04.050, 2008.
Zhang, T., Wooster, M. J., Green, D. C., and Main, B.: New field-based agricultural biomass burning trace gas, PM2.5, and black carbon emission ratios and factors measured in situ at crop residue fires in Eastern China, Atmos. Environ., 121, 22–34, https://doi.org/10.1016/j.atmosenv.2015.05.010, 2015.
Zhang, X., Hecobian, A., Zheng, M., Frank, N. H., and Weber, R. J.: Biomass burning impact on PM2.5 over the southeastern US during 2007: integrating chemically speciated FRM filter measurements, MODIS fire counts and PMF analysis, Atmos. Chem. Phys., 10, 6839–6853, https://doi.org/10.5194/acp-10-6839-2010, 2010.
Zhang, X., Lin, Y.-H., Surratt, J. D., and Weber, R. J.: Sources, Composition and Absorption Ångström Exponent of Light-absorbing Organic Components in Aerosol Extracts from the Los Angeles Basin, Environ. Sci. Technol., 47, 3685–3693, https://doi.org/10.1021/es305047b, 2013.
Zhang, Y., Schauer, J. J., Zhang, Y., Zeng, L., Wei, Y., Liu, Y., and Shao, M.: Characteristics of Particulate Carbon Emissions from Real-World Chinese Coal Combustion, Environ. Sci. Technol., 42, 5068–5073, https://doi.org/10.1021/es7022576, 2008.
Zhang, Y., Forrister, H., Liu, J., Dibb, J., Anderson, B., Schwarz, J. P., Perring, A. E., Jimenez, J. L., Campuzano-Jost, P., Wang, Y., Nenes, A., and Weber, R. J.: Top-of-atmosphere radiative forcing affected by brown carbon in the upper troposphere, Nat. Geosci., 10, 486–489, https://doi.org/10.1038/ngeo2960, 2017.
Zhang, Y.-N., Zhang, Z.-S., Chan, C.-Y., Engling, G., Sang, X.-F., Shi, S., and Wang, X.-M.: Levoglucosan and carbonaceous species in the background aerosol of coastal southeast China: case study on transport of biomass burning smoke from the Philippines, Environ. Sci. Pollut. R., 19, 244–255, https://doi.org/10.1007/s11356-011-0548-7, 2012.
Zhang, Y.-x., Shao, M., Zhang, Y.-h., Zeng, L.-m., He, L.-y., Zhu, B., Wei, Y.-j., and Zhu, X.-l.: Source profiles of particulate organic matters emitted from cereal straw burnings, J. Environ. Sci., 19, 167–175, https://doi.org/10.1016/S1001-0742(07)60027-8, 2007.
Zhang, Z., Engling, G., Lin, C.-Y., Chou, C. C. K., Lung, S.-C. C., Chang, S.-Y., Fan, S., Chan, C.-Y., and Zhang, Y.-H.: Chemical speciation, transport and contribution of biomass burning smoke to ambient aerosol in Guangzhou, a mega city of China, Atmos. Environ., 44, 3187–3195, https://doi.org/10.1016/j.atmosenv.2010.05.024, 2010.
Zhou, Y., Xing, X., Lang, J., Chen, D., Cheng, S., Wei, L., Wei, X., and Liu, C.: A comprehensive biomass burning emission inventory with high spatial and temporal resolution in China, Atmos. Chem. Phys., 17, 2839–2864, https://doi.org/10.5194/acp-17-2839-2017, 2017.
Zhu, J., Xia, X., Che, H., Wang, J., Zhang, J., and Duan, Y.: Study of aerosol optical properties at Kunming in southwest China and long-range transport of biomass burning aerosols from North Burma, Atmos. Res., 169, 237–247, https://doi.org/10.1016/j.atmosres.2015.10.012, 2016.
The requested paper has a corresponding corrigendum published. Please read the corrigendum first before downloading the article.
- Article
(8404 KB) - Full-text XML