the Creative Commons Attribution 4.0 License.
the Creative Commons Attribution 4.0 License.
 | 29 Aug 2019
Fine particulate matter (PM2.5) trends in China, 2013–2018: separating contributions from anthropogenic emissions and meteorology
Daniel J. Jacob
Xuan Wang
Lu Shen
Yuzhong Zhang
Tianliang Zhao
Hong Liao
Fine particulate matter (PM2.5) is a severe air pollution problem in China. Observations of PM2.5 have been available since 2013 from a large network operated by the China National Environmental Monitoring Center (CNEMC). The data show a general 30 %–50 % decrease in annual mean PM2.5 across China over the 2013–2018 period, averaging at −5.2 µg m−3 a−1. Trends in the five megacity cluster regions targeted by the government for air quality control are µg m−3 a−1 (±95 % confidence interval) for Beijing–Tianjin–Hebei, µg m−3 a−1 for the Yangtze River Delta, µg m−3 a−1 for the Pearl River Delta, µg m−3 a−1 for the Sichuan Basin, and µg m−3 a−1 for the Fenwei Plain (Xi'an). Concurrent 2013–2018 observations of sulfur dioxide (SO2) and carbon monoxide (CO) show that the declines in PM2.5 are qualitatively consistent with drastic controls of emissions from coal combustion. However, there is also a large meteorologically driven interannual variability in PM2.5 that complicates trend attribution. We used a stepwise multiple linear regression (MLR) model to quantify this meteorological contribution to the PM2.5 trends across China. The MLR model correlates the 10 d PM2.5 anomalies to wind speed, precipitation, relative humidity, temperature, and 850 hPa meridional wind velocity (V850). The meteorology-corrected PM2.5 trends after removal of the MLR meteorological contribution can be viewed as being driven by trends in anthropogenic emissions. The mean PM2.5 decrease across China is −4.6 µg m−3 a−1 in the meteorology-corrected data, 12 % weaker than in the original data, meaning that 12 % of the PM2.5 decrease in the original data is attributable to meteorology. The trends in the meteorology-corrected data for the five megacity clusters are µg m−3 a−1 for Beijing–Tianjin–Hebei (14 % weaker than in the original data), µg m−3 a−1 for the Yangtze River Delta (3 % stronger), µg m−3 a−1 for the Pearl River Delta (19 % weaker), µg m−3 a−1 for the Sichuan Basin (27 % weaker), and µg m−3 a−1 for the Fenwei Plain (Xi'an; 23 % weaker); 2015–2017 observations of flattening PM2.5 in the Pearl River Delta and increases in the Fenwei Plain can be attributed to meteorology rather than to relaxation of emission controls.
- Article
(1805 KB) - Full-text XML
-
Supplement
(707 KB) - BibTeX
- EndNote


PM2.5 (particulate matter with aerodynamic diameter less than 2.5 µm) is a severe air pollution problem in China, responsible for 1.1 million excess deaths in 2015 (Cohen et al., 2017). The Chinese government introduced, in 2013, the “Action Plan on the Prevention and Control of Air Pollution” (Chinese State Council, 2013a), called Clean Air Action for short, to aggressively control anthropogenic emissions. Starting that year, PM2.5 data from a nationwide monitoring network of about 1000 sites became available from the China National Environmental Monitoring Center (CNEMC) of the Ministry of Ecology and Environment of China (MEEC). These data show 30 %–40 % decreases in PM2.5 across eastern China over the 2013–2017 period (Chinese State Council, 2018a; Zhang et al., 2019). However, interpretation of these trends in terms of emission controls may be biased by interannual variability and trends in meteorology (Zhang et al., 2014; Wang et al., 2014; Zhu et al., 2012; Jia et al., 2015; Li et al., 2018; Yang et al., 2018, 2016; Liang et al., 2016; Cheng et al., 2019; Chen et al., 2019; Silver et al., 2018). Here we use a stepwise multilinear regression (MLR) model to separate the effects of meteorological variability and emission controls on the 2013–2018 trends in PM2.5 across China.
Meteorology drives large day-to-day, seasonal, and interannual variations in PM2.5 in China by affecting transport, scavenging, emissions, and chemical production (Wang et al., 2014; Leung et al., 2018; Tai et al., 2012; Zou et al., 2017). The relationships between PM2.5 and meteorological variables are complex and differ by region and time of year (Shen et al., 2017). For example, wintertime PM2.5 pollution events in central and eastern China are associated with low wind speed and high relative humidity (RH; Wang et al., 2014; Zhang et al., 2014; Shen et al., 2018; Pendergrass et al., 2019; Moch et al., 2018; Song et al., 2019). On the other hand, high wind speeds in northern China in spring and summer promote dust emission (Lyu et al., 2017; Wang et al., 2004). Precipitation scavenging is a major factor driving PM2.5 variability in southern and coastal China (Chen et al., 2018; Leung et al., 2018).
Anthropogenic emissions of PM2.5 and its precursors, including sulfur dioxide (SO2), nitrogen oxides (NOx), ammonia (NH3), and nonmethane volatile organic compounds (NMVOCs), have undergone large changes in China over the past decades. Rapid growth in emissions from 1980 to 2006 led to a general increase in PM2.5 over China, as demonstrated by visibility data (Che et al., 2007; Han et al., 2016; Wang and Chen, 2016; Fu et al., 2014; Zhang et al., 2012) and, since 1999, by satellite aerosol optical depth (AOD) data (Ma et al., 2016; Lin et al., 2018; Zhao et al., 2017). SO2 emissions peaked in 2006–2007, NOx emissions peaked in 2011, and NH3 emissions peaked around 1996, as estimated from emission inventories (Zhao et al., 2017; Wang et al., 2017; Xia et al., 2016; F. Liu et al., 2016; Lu et al., 2010; Xu et al., 2016; Kang et al., 2016) and observed from satellites (Xia et al., 2016; F. Liu et al., 2016; de Foy et al., 2016; van der A et al., 2017). SO2 and NOx emissions have declined since their peaks, whereas emissions of NH3 have remained relatively stable since its peak (Zhao et al., 2017). The onset of emission controls led to slight decreases in PM2.5 over the 2006–2012 period, as indicated by satellite AOD data (Ma et al., 2016, 2019; Lin et al., 2018; Zhao et al., 2017) and surface observations (Tao et al., 2017; Wang et al., 2017). The Clean Air Action greatly increased the scope of emission controls. The Multi-resolution Emission Inventory for China (MEIC; http://www.meicmodel.org, last access: 20 March 2019) estimates nationwide emission decreases over the 2013–2017 period of 59 % for SO2, 33 % for primary PM2.5, 21 % for NOx, and 3 % for NH3, with NMVOCs increasing by 2 % (Zheng et al., 2018). Continued reductions in emissions are required and implemented in 2018 (Chinese State Council, 2018b). Our goal in this work is to quantify the response of PM2.5 to these rapid emission changes by resolving the effect of meteorological variability, thus allowing improved assessment of the success of the Clean Air Action.
2.1 Observations
We use 2013–2018 hourly data for surface air PM2.5 together with SO2, nitrogen dioxide (NO2), and CO concentrations from the CNEMC network (http://106.37.208.233:20035/, last access: 18 March 2019). The network started in January 2013, with 496 sites in 74 major cities across the country (Chinese State Council, 2013b), growing to ∼1500 sites in 454 cities by 2018. PM2.5 mass concentrations are measured using the micro-oscillating balance method and/or the β-absorption method (MEE, 2012; Zhang and Cao, 2015). SO2, NO2, and CO concentrations are measured at the same sites as PM2.5. NO2 concentrations are measured by the molybdenum converter method known to have positive interferences from NO2 oxidation products (Dunlea et al., 2007). SO2 and CO are respectively measured using ultraviolet fluorescence and infrared absorption (MEE, 2012; Zhang and Cao, 2015). We applied quality control to the hourly CNEMC data following Barrero et al. (2015) to exclude severe outliers (Lu et al., 2018). There are also occasional consecutive repeats of data that may be caused by faulty instruments or reporting (Rohde and Muller, 2015; Silver et al., 2018). Here we removed values from the hourly time series when there are >24 consecutive repeats. These in whole removed 7.4 %, 7.0 %, 6.4 %, and 6.7 % of the PM2.5, SO2, NO2, and CO data respectively.
We correlated these air quality observations with meteorological observations from 839 stations distributed across China (Fig. S1 in the Supplement). The meteorological observations are compiled in the Surface Daily Climate Dataset (V3.0) released by the China National Meteorological Information Center (CNMIC; http://data.cma.cn/, last access: 16 March 2019). These include data for wind speed (WDS), precipitation (PRECIP), relative humidity (RH), and temperature (TEM). We also used the 850 hPa meridional wind velocity (V850) from the MERRA-2 reanalysis produced at 0.5∘ × 0.625∘ horizontal resolution by the NASA Global Modeling and Assimilation Office (https://gmao.gsfc.nasa.gov/reanalysis/MERRA-2, last access: 20 March 2019). We choose these meteorological variables for their strong correlations with PM2.5 identified in previous studies (Wang et al., 2014; Cai et al., 2017; Shen et al., 2017; Leung et al., 2018; Song et al., 2019; Zou et al., 2017). V850 in particular is a strong predictor of PM2.5 wintertime pollution events in the North China Plain because northerly winds (negative V850) ventilate the region with clean dry air (Cai et al., 2017; Pendergrass et al., 2019).
All data in this work are averaged over 10 d (10 d time resolution). Trend analyses use only those sites with at least 70 % data coverage for each of the 6 years from 2013 to 2018. We did sensitivity tests with data coverage thresholds changing from 70 % to 90 % and obtained similar pollutant trends. To make the most use of available data, 70 % is chosen. For the MLR model, we further average all data on a 2∘ × 2.5∘ grid to increase statistical robustness, following Tai et al. (2012) and Shen et al. (2017).
The 2013 Clean Air Action (Chinese State Council, 2013a) identified three megacity clusters as target regions for reducing air pollution: Beijing–Tianjin–Hebei (BTH; 35–41∘ N, 113.75–118.75∘ E), the Yangtze River Delta (YRD; 29–33∘ N, 118.75–123∘ E), and the Pearl River Delta (PRD; 21–25∘ N, 111.25–116.25∘ E). The more recent plan released in July 2018 (Chinese State Council, 2018b) removed PRD from the list of target regions and added the Fenwei Plain (FWP; 33–35∘ N, 106.25–111.25∘ E; 35–37∘ N, 108.75–113.75∘ E). Previous studies (Zhang et al., 2012) also identified the Sichuan Basin (SCB; 27–33∘ N, 103.75–108.75∘ E) as one of the major haze regions in China. We present analyses for these five target regions by averaging the data from all sites with more than 70 % data coverage for each of the 6 years from 2013 to 2018. The only continuous record for 2013–2018 in the FWP region is for Xi'an (13 sites). Additional FWP sites outside Xi'an started operating in early 2015 and are consistent with the Xi'an data, as will be shown below.
2.2 Multiple linear regression model
We construct a stepwise multiple linear regression (MLR) model to quantify the effect of meteorology on PM2.5 variability. The model fits the deseasonalized and detrended 10 d PM2.5 mean time series on the 2∘ × 2.5∘ grid to the five deseasonalized and detrended 10 d mean meteorological variables (WDS, PRECIP, RH, TEM, and V850). The deseasonalized and detrended time series are obtained by removing the 50 d moving averages from the 10 d mean time series (Tai et al., 2010). This focuses on synoptic scales of variability and avoids aliasing from common seasonal variations and long-term trends between variables (Shen et al., 2017).
Separate fits of PM2.5 to the meteorological variables are done for each 2∘× 2.5∘ grid square and season (DJF, MAM, JJA, and SON). The fit has the form
where Yd,i(t) is the deseasonalized and detrended PM2.5 time series for grid square and season i, and is the corresponding time series for the deseasonalized and detrended meteorological variable kϵ[1,5]. We fit the regression coefficients βi,k and the intercept bi. The regression is done stepwise, adding and deleting terms based on their independent statistical significance to obtain the best model fit (Draper and Smith, 1998). The fits and the selected meteorological variables differ by location and season, but with regional consistency (Table S1 in the Supplement). For meteorological variables not in the final MLR model, the regression coefficients βi,k in Eq. (1) are zero.
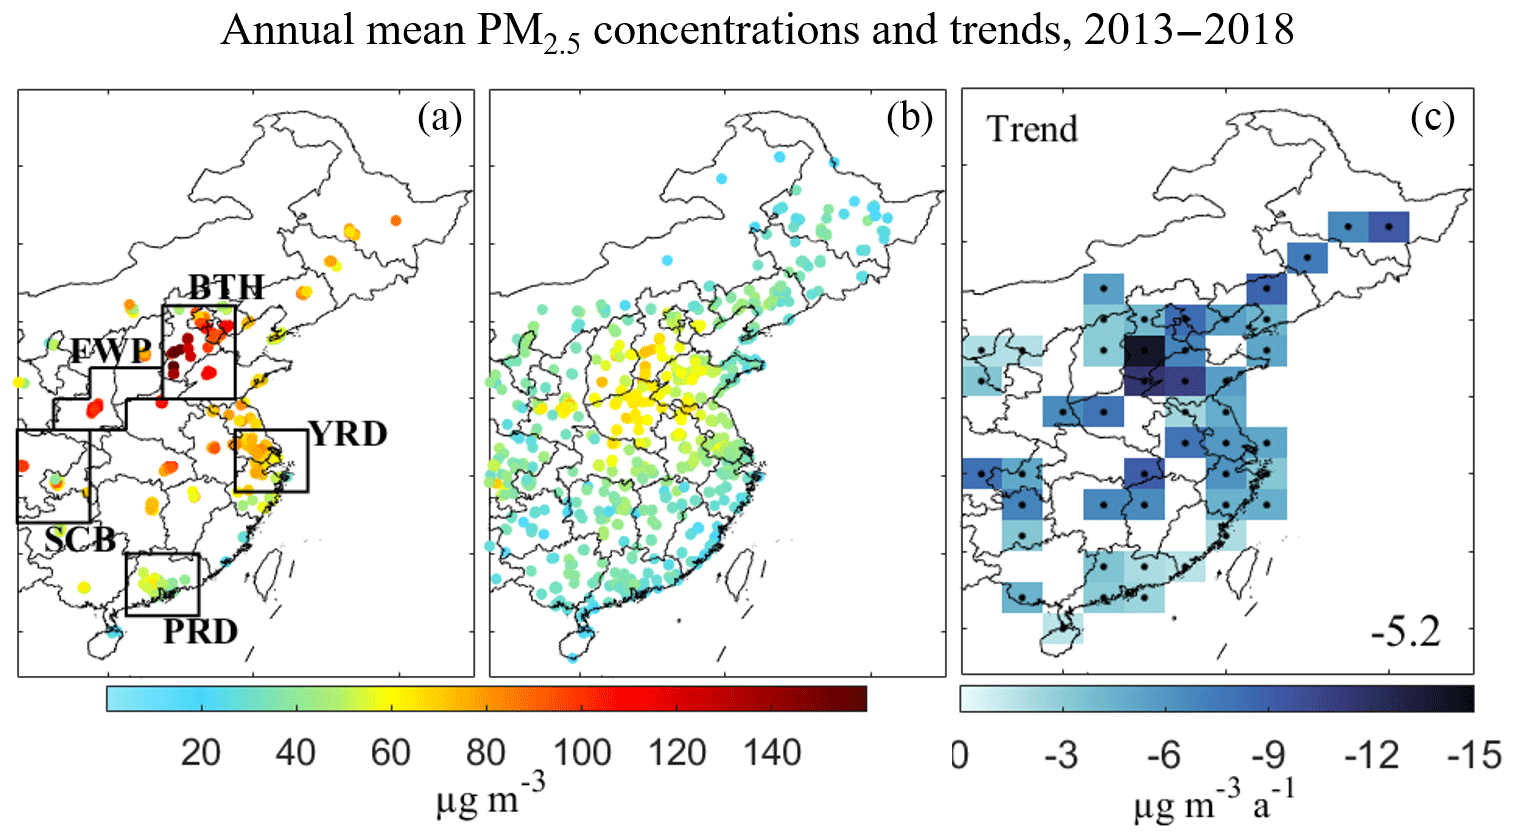
Figure 1Annual mean PM2.5 concentrations in China from the CNEMC network. Panels (a) and (b) show values for 2013 and 2018 for sites with more than 70 % data coverage for the corresponding year. Panel (c) shows the ordinary linear regression trends on a 2∘ × 2.5∘ grid for sites with more than 70 % data coverage for each of the 6 years from 2013 to 2018. The trends are based on the time series of 10 d mean anomalies, as described in the text. Polygons in (a) define the four target regions of the Clean Air Action (Beijing–Tianjin–Hebei – BTH: 35–41∘ N, 113.75–118.75∘ E; Yangtze River Delta – YRD: 29–33∘ N, 118.75–123∘ E; Pearl River Delta – PRD: 21–25∘ N, 111.25–116.25∘ E; and Fenwei Plain – FWP: 33–35∘ N, 106.25–111.25∘ E, and 35–37∘ N, 108.75–113.75∘ E), to which we add Sichuan Basin (SCB; 27–33∘ N, 103.75–108.75∘ E). Number inset in panel (c) is the trend in mean PM2.5 over the study region (21–41∘ N, 103.75–123∘ E). Dots in panel (c) indicate grid squares with significant trends (p<0.05).
2.3 Application to 2013–2018 PM2.5 trends
We use the MLR model to remove the effect of meteorological variability from the 2013–2018 PM2.5 trends, including not only the 10 d synoptic-scale variability but also any interannual variability and 6-year trends. This makes the standard assumption that the same factors that drive synoptic-scale variability also drive interannual variability (Jacob and Winner, 2009; Tai et al., 2012). We thus apply Eq. (1) to the meteorological anomalies , obtained by removing the 6-year means of the 50 d moving averages from the 10 d mean time series. The anomalies calculated in this manner are deseasonalized but not detrended. This yields the meteorology-driven PM2.5 anomalies Ym,i:
Consider now the PM2.5 anomaly Ya,i for grid square and season i obtained by deseasonalizing but not detrending the PM2.5 data (by removing the 6-year means of the 50 d moving averages) in the same way as for the meteorological variables. The residual anomaly Yr,i, after removing meteorological influence from the MLR model, is given by
The residual is the component of the anomaly that cannot be explained by the MLR meteorological model, and we will refer to it as the meteorology-corrected data. It includes noise due to limitations of the MLR model and other factors but also a long-term trend over the 6-year period that we can attribute to changes in anthropogenic emissions. The same approach was recently applied by Li et al. (2019) to separate anthropogenic and meteorological drivers of ozone trends in China.
3.1 PM2.5 trends in China, 2013–2018
Figure 1 shows annual mean observed PM2.5 concentrations from the CNEMC over China for 2013 and 2018 and the linear regression trends on the 2∘ × 2.5∘ grid based on the PM2.5 anomalies Ya,i(t), including effects of both changing emissions and meteorology. In 2013, PM2.5 across most of China was well above the Chinese national air quality standard (annual mean of 35 µg m−3). BTH and FWP (Xi'an) had the highest PM2.5 among the five target regions, with annual average concentrations of 108±34 µg m−3 (standard deviation describes variability in the annual average across sites in the region) and 108±11 µg m−3 respectively, followed by SCB (71±17 µg m−3), YRD (67±12 µg m−3), and PRD (47±7 µg m−3). PM2.5 decreased dramatically from 2013 to 2018, by 34 %–49 % for the five target regions. Mean 2018 concentrations were 55±13 µg m−3 in BTH, 62±4 µg m−3 in FWP (Xi'an), 40±6 µg m−3 in SCB, 40±7 µg m−3 in YRD, and 31±5 µg m−3 in PRD.
Figure 2 shows the 2013–2018 relative trends of annual mean PM2.5 for the five target regions along with the corresponding trends of SO2, NO2, and CO concentrations measured at the same sites. Also shown in the bottom panels are the MEIC trends in emissions of primary PM2.5, SO2, NOx, NH3, and CO for 2013–2017. The PM2.5 observations show steady decreases for BTH, YRD, and SCB. PRD flattens out in 2015–2017 before decreasing again in 2018. FWP (Xi'an) decreases sharply by 47 % from 2013 to 2015 but rebounds in 2015–2017 before decreasing again in 2018. Trends at other FWP sites that became operational in early 2015 are similar to Xi'an. We argue in Sect. 3.3 that the 2015–2017 flattening at PRD and the anomalous 2013–2015 sharp decrease and 2015–2017 rebound at FWP are driven by meteorology.

Figure 2Relative trends of 2013–2018 observed concentrations and 2013–2017 MEIC emission estimates for the five target regions of Fig. 1. The observed PM2.5 trends are shown as thick lines. Values are annual means referenced to 2013. The observed concentrations are averaged over all sites in each region with at least 70 % data coverage for each year. The number of sites for each region is indicated. Fenwei Plain trends are for Xi'an, as other sites did not start operating until early 2015. Post-2015 relative PM2.5 trends at these other sites are shown as the dashed line.
We see from Fig. 2 that only SO2 has a decrease steeper than PM2.5, indicating that SO2 emission controls have been a major driver of the PM2.5 trend (Lang et al., 2017; Shao et al., 2018). The overall SO2 decrease for the five regions is 57 %–76 % from 2013 to 2018. The SO2 decrease is quantitatively consistent with the decrease in SO2 emissions estimated by MEIC (Zheng et al., 2018). This drastic cut of China SO2 emissions is due to installation of scrubbers at coal-fired power plants (Siwen et al., 2015; Karplus et al., 2018; Silver et al., 2018), elimination of small coal boilers, improvement of coal quality (Zheng et al., 2018), and switch from residential coal to cleaner fuels (Zhao et al., 2018). We also see a significant decrease in CO of 18 %–43 % for the five regions from 2013 to 2018, again consistent with the MEIC and suggesting a reduction in organic PM2.5 emissions. Primary PM2.5 emissions in the MEIC decreased at a rate comparable to or steeper than CO. Trends in China PM2.5, SO2, and NO2 presented here are consistent with previous studies (Silver et al., 2018; Ma et al., 2019) that cover a shorter time period than 2013–2018.
Figure 3 shows the time series of monthly mean PM2.5 for the five target regions, illustrating the seasonal and interannual variability. All regions show winter maxima that can be mostly attributed to meteorology, including shallower mixing depth, lower precipitation, and increased stagnation in winter (Wang et al., 2018). Residential heating emissions in winter also contribute to the seasonality in China, north of about 33∘ N (covering BTH and FWP in this study; J. Liu et al., 2016; Xiao et al., 2015). There is a large interannual variability, particularly in winter, that must be largely driven by meteorology. Studies for BTH have shown that high PM2.5 in winter months is associated with weak southerly winds, low mixing depths, and high relative humidity (Zhang et al., 2014; Chang et al., 2016; Li et al., 2018; Shao et al., 2018). The relatively clean 2017–2018 winter was due in part to a higher frequency of northerly flow and associated ventilation (CMA, 2018; Yi et al., 2019). In addition, particularly aggressive actions by the government to restrict coal use that winter may have played a role in reducing PM2.5 levels (Zhang et al., 2019).
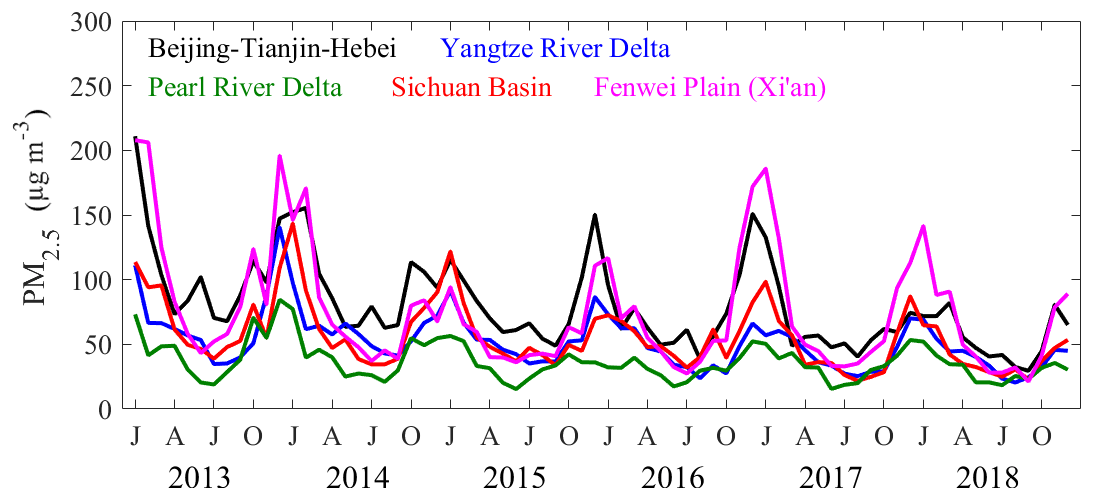
Figure 3Time series in 2013–2018 of monthly mean PM2.5 concentrations over the five target regions. Values are averages from all sites in the region with over 70 % data coverage for each of the 6 years.
3.2 Meteorological influence on PM2.5
Figure 4 shows the correlations of 10 d PM2.5 concentrations with the individual meteorological variables used in the MLR model. Correlation coefficients r as low as 0.3 are statistically significant, more so when consistent across a region. Wind speed is negatively correlated with PM2.5, as would be expected from ventilation, except in areas of the north where wind promotes dust formation (Lyu et al., 2017; Wang et al., 2004). Precipitation is also generally negatively correlated with PM2.5, as one would expect from scavenging (Chen et al., 2018). The positive correlation between precipitation and PM2.5 over northern China in spring is likely a result of high RH associated with precipitation in adjacent days.

Figure 4Correlation coefficients (r) of PM2.5 concentration with the individual meteorological variables used in the MLR model: surface wind speed (m s−1), precipitation (mm d−1), relative humidity (RH; %), surface air temperature (∘C), and 850 hPa meridional wind velocity (m s−1) for different seasons in China. The correlations are based on 10 d average observations on a 2∘ × 2.5∘ grid. Dots indicate statistically significant correlations (p<0.05).
Correlation between RH and PM2.5 is positive over northern China, especially in winter, and negative over southern China, especially in summer. The positive correlation between PM2.5 and RH over northern China in winter has been reported by previous studies and attributed in part to the role of aqueous-phase aerosol chemistry in driving secondary PM2.5 formation (Zheng et al., 2015; He et al., 2018; Song et al., 2019; Pendergrass et al., 2019; Tie et al., 2017). The negative correlation of PM2.5 with RH over southern China likely reflects the association of high RH with precipitation and onshore wind, which facilitate PM2.5 wet removal and ventilation (Zhu et al., 2012; Leung et al., 2018).
Temperature has a positive correlation with PM2.5 year-round over most of China (Wang et al., 2014; Leung et al., 2018), even though there is no strong direct dependence of PM2.5 on temperature (Jacob and Winner, 2009). The correlation likely reflects the covariation of temperature with other meteorological variables, including wind speed, precipitation, and RH (Tai et al., 2012; Zhu et al., 2012). A possible explanation for the negative correlation with temperature in summer over the North China Plain could be the volatilization of ammonium nitrate at high temperatures (Kleeman, 2008). V850 shows strong positive correlations with winter PM2.5 over most of China, and strong negative correlations with summer PM2.5 over southern China, especially for the Pearl River Delta.
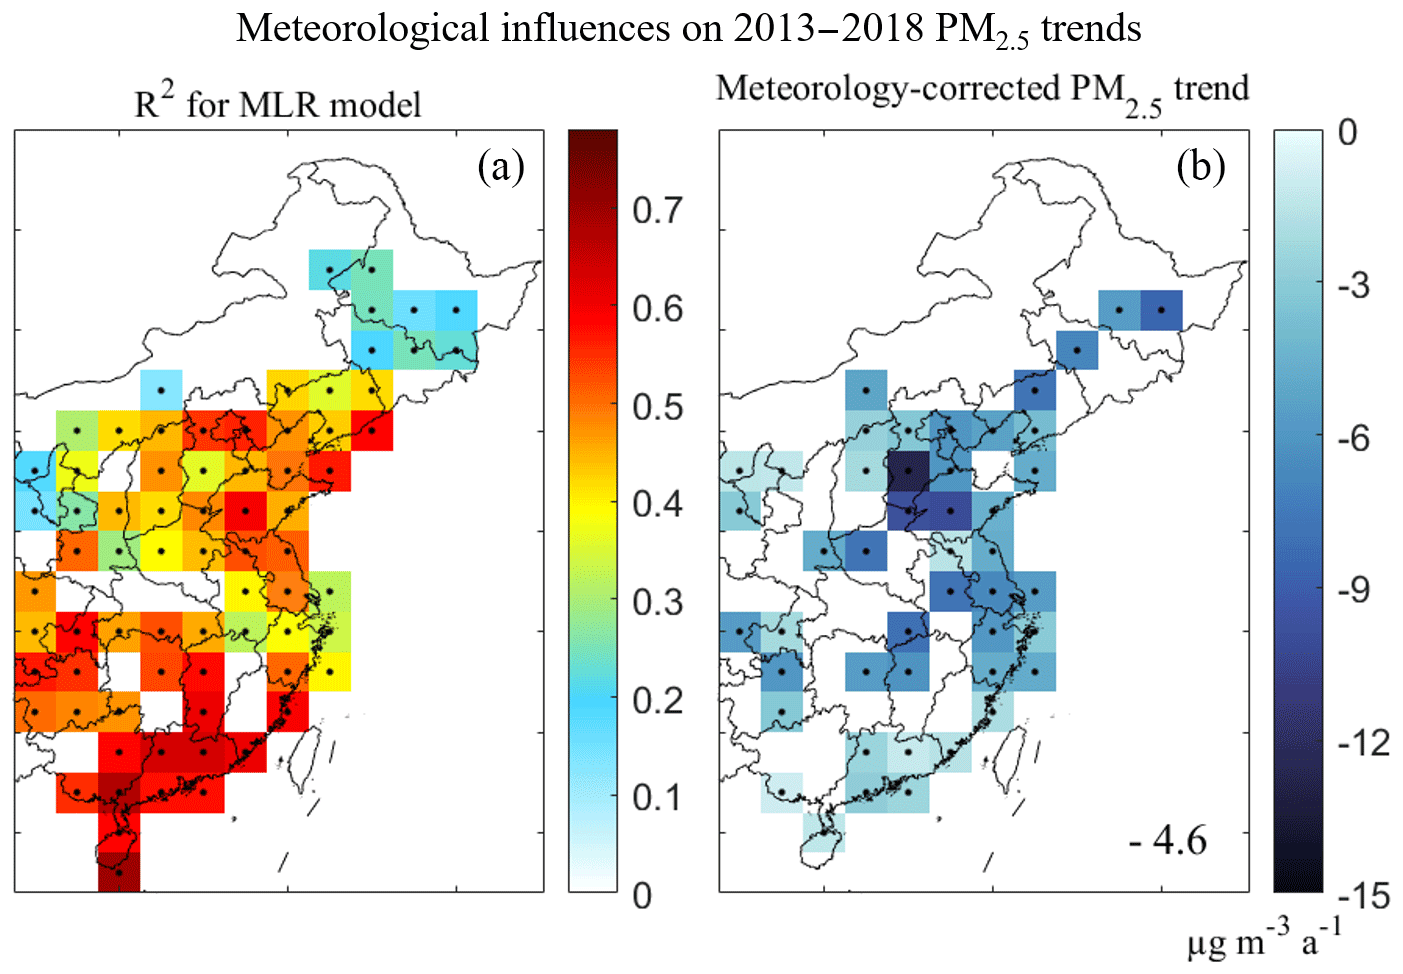
Figure 5Resolving meteorological influences on PM2.5 2013–2018 trends in China. Panel (a) shows the fraction of detrended and deseasonalized variance in 10 d PM2.5 means explained by the stepwise multilinear regression (MLR) meteorological model. Panel (b) shows the meteorology-corrected trends to be compared to the trends in the original data shown in Fig. 1. Number inset in (b) is the trend in mean PM2.5 over the study region (same definition as in Fig. 1). Dots indicate significant correlations (p<0.05) in (a) and significant trends (p<0.05) in (b).
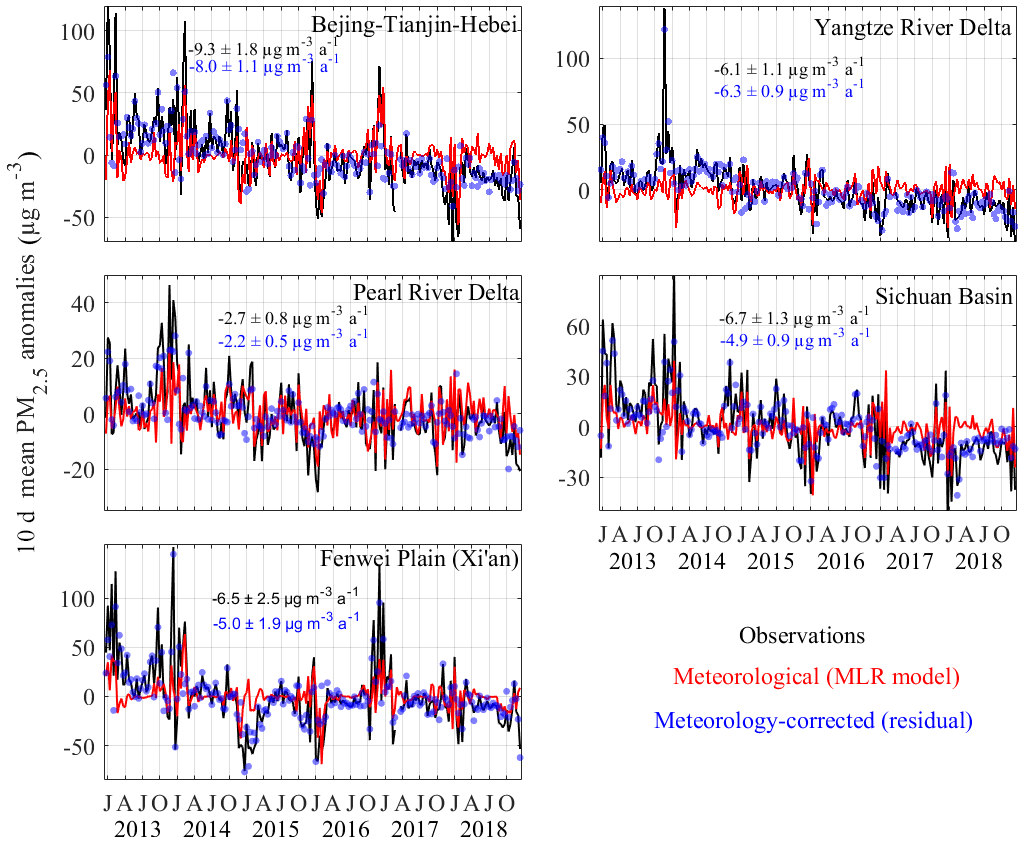
Figure 6Time series of 2013–2018 PM2.5 10 d mean anomalies for the five target regions of Fig. 1. The anomalies are relative to the 2013–2018 means. The data are averaged over all measurement sites in each region with at least 70 % of data coverage for each year (same as for Fig. 2). The meteorological contribution to the anomalies as determined from the MLR model is shown in red. The long-term trend in the meteorology-corrected residual in blue (Eq. 3) is interpreted as being driven by changes in anthropogenic emissions. Values inset in each panel are the ordinary linear regression trends, with 95 % confidence intervals obtained by the bootstrap method.
Figure 5a describes the ability of the MLR model to account for PM2.5 variability in relation to wind speed, precipitation, RH, temperature, and V850 as potential predictor variables. Results are presented as the coefficients of determination R2 (fraction of variance explained) between observed and model PM2.5 in the detrended deseasonalized time series. The R2 values have been adjusted to account for different numbers of significant explanatory terms (predictor variables). R2 values for the five target regions are 0.59 (BTH), 0.46 (YRD), 0.65 (PRD), 0.65 (SCD), and 0.41 (FWP). Figure 5b shows the meteorology-corrected PM2.5 trends after removal of meteorological variability predicted by the MLR model, i.e., the trends in the residuals Yr,i(t) in Eq. (3). The meteorology-corrected decreasing trend averaged across China is −4.6 µg m−3 a−1, 12 % weaker than in the original data, meaning that 12 % of the PM2.5 decrease in the original data is attributable to meteorology. We elaborate on this below for the five target regions.
3.3 Meteorology-corrected PM2.5 trends for the five target regions
Figure 6 shows the 10 d mean PM2.5 anomalies in the deseasonalized (but not detrended) data for the five target regions (Ya(t) in Sect. 2.3). Also shown is the meteorological component Ym(t) derived from the MLR meteorological model and the residual Yr(t) (meteorology-corrected; Eq. 3) whose long-term trend can be interpreted as being due to changes in anthropogenic emissions. The PM2.5 anomalies show large features on 10 d basis that can be mostly captured by the MLR model. The residual meteorology-corrected time series is much smoother, as depicted by the narrower 95 % confidence intervals in the anthropogenic residual trends than in the original observed trends. The meteorology-corrected trends differ by 3 % (YRD) to 27 % (SCB) from the observed trends. The YRD trend reflects a significant contribution from the December 2013 outlier, which reflects unfavorable meteorological conditions (Fig. S2) that are not adequately captured by the MLR model. If we exclude this outlier month from the time series, the observed YRD trend becomes µg m−3 a−1 and the meteorology-corrected trend becomes µg m−3 a−1.
Most remarkably, it appears that the 2015–2017 flattening in the PRD and 2015–2017 increase in the FWP (see Fig. 2) can be mostly attributed to meteorological variability as resolved by the MLR model rather than to emissions. The trend in the residual is more consistent with a steady 2013–2018 anthropogenic decrease in both regions. The MLR model shows that meteorology accelerated the PM2.5 decline in PRD and FWP from 2013 to 2015 and contributed partly to the 2015–2017 PM2.5 rebound over FWP. In particular, the high PM2.5 anomalies in PRD in 2013 and early 2014 are driven by anomalously low V850, and the low PM2.5 in winter 2015–2016 is associated with anomalously high southerly flow and precipitation (Fig. S4). The low PM2.5 in FWP in the winter 2014–2015 is associated with anomalously high wind speed, low RH, and low temperature, while the high anomalies in the winter 2016–2017 are associated with anomalously low wind speed, high RH, and high temperature (Fig. S5).
Observations of fine particulate matter (PM2.5) pollution in China from the extensive CNEMC network established in 2013 show large 2013–2018 decreases driven by emission controls with complicating influences from meteorology. Here we used a stepwise multiple linear regression (MLR) meteorological model to investigate and separate contributions from anthropogenic emissions and meteorology to these 6-year trends.
The CNEMC observations show 34 %–49 % decreases in PM2.5 in the five megacity clusters targeted by the Chinese government's Clean Air Action to reduce anthropogenic emissions. Concurrent observations of SO2, CO, and NO2 are qualitatively consistent with these PM2.5 decreases being driven by drastic cuts in emissions from coal combustion. At the same time, there is large interannual variability driven by meteorology particularly in winter when PM2.5 is highest.
We used the stepwise MLR meteorological model to relate PM2.5 anomalies across China to wind speed, precipitation, relative humidity (RH), temperature, and meridional velocity at 850 hPa (V850) as potential predictors. The model accounts for ∼50 % of the variance in the deseasonalized detrended PM2.5 data, including 41 %–65 % for the five megacity clusters. Application to the PM2.5 time series shows that meteorological variability contributed significantly to the 6-year trends across China and in the megacity clusters. Removing meteorological variability as given by the MLR model also reduces the uncertainty in the trend that can be attributed to emission controls. We refer to the data series after removal of meteorological variability as the meteorology-corrected data. Thus the 2013–2018 PM2.5 decrease for Beijing–Tianjin–Hebei is µg m−3 a−1 in the original data and is 14 % weaker in the meteorology-corrected data ( µg m−3 a−1). For the Sichuan Basin where the meteorological correction is particularly large, the PM2.5 decrease is µg m−3 a−1 in the original data and is reduced by 27 % to µg m−3 a−1 in the meteorology-corrected data. The average 2013–2018 PM2.5 decrease over our study domain is −5.2 µg m−3 a−1 in the original data (Fig. 1c) and is reduced by 12 % to −4.6 µg m−3 a−1 in the meteorology-corrected data (Fig. 5b).
Observations for the 2015–2017 period indicate a flattening of the PM2.5 trend in the Pearl River Delta and an increase in the Fenwei Plain. We find from the MLR model that these 3-year trends can be explained by meteorological variability (including particularly steep 2013–2015 decreases) rather than by relaxation of emission controls.
All of the measurements and reanalysis data are openly available for download from the websites given in the main text. The anthropogenic emission inventory is available from http://www.meicmodel.org (last access: 20 January 2019), and for more information, please contact Qiang Zhang (qiangzhang@tsinghua.edu.cn).
The supplement related to this article is available online at: https://doi.org/10.5194/acp-19-11031-2019-supplement.
SZ, DJJ, and HL designed the study. SXZ developed the model, performed the simulations and analyses. XW, LS, KL, YZ, and TZ helped with scientific interpretation and discussion. KG helped with pollutants data processing. SZ and DJJ wrote the paper, and all authors provided input on the paper for revision before submission.
The authors declare that they have no conflict of interest.
This work is a contribution from the Harvard-NUIST Joint Laboratory for Air Quality and Climate (JLAQC). We thank the MEIC (Multi-resolution Emission Inventory for China) team at Tsinghua University for providing the MEIC. We acknowledge Loretta J. Mickley (Harvard University) and Jonathan Moch (Harvard University) for helpful discussions.
This research has been supported by the Harvard-NUIST Joint Laboratory for Air Quality and Climate (JLAQC), the National Natural Science Foundation of China (grant nos. 41830965 and 91744209), and the National Key R&D Program Pilot Projects (grant no. 2016YFC0203304). Shixian Zhai acknowledges support from the China Scholarship Council (201708320314). Hong Liao is supported by the National Natural Science Foundation of China (91744311).
This paper was edited by Toshihiko Takemura and reviewed by Hyung-Min Lee and one anonymous referee.
Barrero, M. A., Orza, J. A. G., Cabello, M., and Canton, L.: Categorisation of air quality monitoring stations by evaluation of PM10 variability, Sci. Total Environ., 524–525, 225–236, https://doi.org/10.1016/j.scitotenv.2015.03.138, 2015.
Cai, W., Li, K., Liao, H., Wang, H., and Wu, L.: Weather conditions conducive to Beijing severe haze more frequent under climate change, Nat. Clim. Change, 7, 257–263, 2017.
Chang, L., Xu, J., Tie, X., and Wu, J.: Impact of the 2015 El Nino event on winter air quality in China, Sci. Rep.-UK, 6, 34275, https://doi.org/10.1038/srep34275, 2016.
Che, H., Zhang, X., Li, Y., Zhou, Z., and Qu, J. J.: Horizontal visibility trends in China 1981–2005, Geophys. Res. Lett., 34, L24706, https://doi.org/10.1029/2007GL031450, 2007.
Chen, Z., Xie, X., Cai, J., Chen, D., Gao, B., He, B., Cheng, N., and Xu, B.: Understanding meteorological influences on PM2.5 concentrations across China: a temporal and spatial perspective, Atmos. Chem. Phys., 18, 5343–5358, https://doi.org/10.5194/acp-18-5343-2018, 2018.
Chen, Z., Chen, D., Kwan, M., Chen, B., Cheng, N., Gao, B., Zhuang, Y., Li, R., and Xu, B.: The control of anthropogenic emissions contributed to 80 % of the decrease in PM2.5 concentrations in Beijing from 2013 to 2017, Atmos. Chem. Phys. Discuss., https://doi.org/10.5194/acp-2018-1112, in review, 2019.
Cheng, J., Su, J., Cui, T., Li, X., Dong, X., Sun, F., Yang, Y., Tong, D., Zheng, Y., Li, Y., Li, J., Zhang, Q., and He, K.: Dominant role of emission reduction in PM2.5 air quality improvement in Beijing during 2013–2017: a model-based decomposition analysis, Atmos. Chem. Phys., 19, 6125–6146, https://doi.org/10.5194/acp-19-6125-2019, 2019.
Chinese State Council: Action Plan on Air Pollution Prevention and Control, available at: http://www.gov.cn/zwgk/2013-09/12/content_2486773.htm (last access: 26 December 2018), 2013a (in Chinese).
Chinese State Council: Release of PM2.5 monitoring information in China, available at: http://www.gov.cn/jrzg/2013-01/01/content_2303447.htm (last access: 26 December 2018), 2013b (in Chinese).
Chinese State Council: Full realization of the “Action Plan on Prevention and Control of Air Pollution”, available at: http://www.gov.cn/xinwen/2018-02/01/content_5262720.htm (last access: 26 December 2018), 2018a (in Chinese).
Chinese State Council: Three-year Action Plan on Defending the Blue Sky, available at: http://www.gov.cn/zhengce/content/2018-07/03/content_5303158.htm (last access: 26 December 2018), 2018b (in Chinese).
CMA (China Meteorological Administration): China's atmospheric environment continues to improve, according to the 2017 meteorological bulletin on atmospheric environment, available at: http://www.cma.gov.cn/2011xwzx/2011xqxxw/2011xqxyw/201802/t20180212_462395.html (last access: 25 August 2019), 2018.
Cohen, A. J., Brauer, M., Burnett, R., Anderson, H. R., Frostad, J., Estep, K., Balakrishnan, K., Brunekreef, B., Dandona, L., and Dandona, R.: Estimates and 25-year trends of the global burden of disease attributable to ambient air pollution: an analysis of data from the Global Burden of Diseases Study 2015, Lancet, 389, 1907–1918, 2017.
de Foy, B., Lu, Z., and Streets, D. G.: Satellite NO2 retrievals suggest China has exceeded its NOx reduction goals from the twelfth Five-Year Plan, Sci. Rep.-UK, 6, 35912, https://doi.org/10.1038/srep35912, 2016.
Draper, N. R. and Smith, H.: Applied Regression Analysis, Hoboken, NJ, Wiley-Interscience, 307–312, 1998.
Dunlea, E. J., Herndon, S. C., Nelson, D. D., Volkamer, R. M., San Martini, F., Sheehy, P. M., Zahniser, M. S., Shorter, J. H., Wormhoudt, J. C., Lamb, B. K., Allwine, E. J., Gaffney, J. S., Marley, N. A., Grutter, M., Marquez, C., Blanco, S., Cardenas, B., Retama, A., Ramos Villegas, C. R., Kolb, C. E., Molina, L. T., and Molina, M. J.: Evaluation of nitrogen dioxide chemiluminescence monitors in a polluted urban environment, Atmos. Chem. Phys., 7, 2691–2704, https://doi.org/10.5194/acp-7-2691-2007, 2007.
Fu, G. Q., Xu, W. Y., Yang, R. F., Li, J. B., and Zhao, C. S.: The distribution and trends of fog and haze in the North China Plain over the past 30 years, Atmos. Chem. Phys., 14, 11949–11958, https://doi.org/10.5194/acp-14-11949-2014, 2014.
Han, L., Zhou, W., and Li, W.: Fine particulate (PM2.5) dynamics during rapid urbanization in Beijing, 1973–2013, Sci. Rep.-UK, 6, 23604, https://doi.org/10.1038/srep23604, 2016.
He, P., Alexander, B., Geng, L., Chi, X., Fan, S., Zhan, H., Kang, H., Zheng, G., Cheng, Y., Su, H., Liu, C., and Xie, Z.: Isotopic constraints on heterogeneous sulfate production in Beijing haze, Atmos. Chem. Phys., 18, 5515–5528, https://doi.org/10.5194/acp-18-5515-2018, 2018.
Jacob, D. J. and Winner, D. A.: Effect of climate change on air quality, Atmos. Environ., 43, 51–63, https://doi.org/10.1016/j.atmosenv.2008.09.051, 2009.
Jia, B., Wang, Y., Yao, Y., and Xie, Y.: A new indicator on the impact of large-scale circulation on wintertime particulate matter pollution over China, Atmos. Chem. Phys., 15, 11919–11929, https://doi.org/10.5194/acp-15-11919-2015, 2015.
Kang, Y., Liu, M., Song, Y., Huang, X., Yao, H., Cai, X., Zhang, H., Kang, L., Liu, X., Yan, X., He, H., Zhang, Q., Shao, M., and Zhu, T.: High-resolution ammonia emissions inventories in China from 1980 to 2012, Atmos. Chem. Phys., 16, 2043–2058, https://doi.org/10.5194/acp-16-2043-2016, 2016.
Karplus, V. J., Zhang, S., and Almond, D.: Quantifying coal power plant responses to tighter SO2 emissions standards in China, P. Natl. Acad. Sci. USA, 115, 7004–7009, https://doi.org/10.1073/pnas.180060, 2018.
Kleeman, M. J.: A preliminary assessment of the sensitivity of air quality in California to global change, Climatic Change, 87, 273–292, 2008.
Lang, J., Zhang, Y., Zhou, Y., Cheng, S., Chen, D., Guo, X., Chen, S., Li, X., Xing, X., and Wang, H.: Trends of PM2.5 and chemical composition in Beijing, 2000–2015, Aerosol Air Qual. Res., 17, 412–425, 2017.
Leung, D. M., Tai, A. P. K., Mickley, L. J., Moch, J. M., van Donkelaar, A., Shen, L., and Martin, R. V.: Synoptic meteorological modes of variability for fine particulate matter (PM2.5) air quality in major metropolitan regions of China, Atmos. Chem. Phys., 18, 6733–6748, https://doi.org/10.5194/acp-18-6733-2018, 2018.
Li, K., Liao, H., Cai, W., and Yang, Y.: Attribution of Anthropogenic Influence on Atmospheric Patterns Conducive to Recent Most Severe Haze Over Eastern China, Geophys. Res. Lett., 45, 2072–2081, https://doi.org/10.1002/2017GL076570, 2018.
Li, K., Jacob, D. J., Liao, H., Shen, L., Zhang, Q., and Bates, K. H.: Anthropogenic drivers of 2013–2017 trends in summer surface ozone in China, P. Natl. Acad. Sci. USA, 116, 422–427, 2019.
Liang, X., Li, S., Zhang, S., Huang, H., and Chen, S. X.: PM2.5 data reliability, consistency, and air quality assessment in five Chinese cities, J. Geophys. Res.-Atmos., 121, 10220–10236, https://doi.org/10.1002/2016JD024877, 2016.
Lin, C. Q., Liu, G., Lau, A. K. H., Li, Y., Li, C. C., Fung, J. C. H., and Lao, X. Q.: High-resolution satellite remote sensing of provincial PM2.5 trends in China from 2001 to 2015, Atmos. Environ., 180, 110–116, https://doi.org/10.1016/j.atmosenv.2018.02.045, 2018.
Liu, F., Zhang, Q., Zheng, B., Tong, D., Yan, L., Zheng, Y., and He, K.: Recent reduction in NOx emissions over China: synthesis of satellite observations and emission inventories, Environ. Res. Lett., 11, 114002, https://doi.org/10.1088/1748-9326/11/11/114002, 2016.
Liu, J., Mauzerall, D. L., Chen, Q., Zhang, Q., Song, Y., Peng, W., Klimont, Z., Qiu, X., Zhang, S., Hu, M., Lin, W., Smith, K. R., and Zhu, T.: Air pollutant emissions from Chinese households: A major and underappreciated ambient pollution source, P. Natl. Acad. Sci. USA, 113, 7756, https://doi.org/10.1073/pnas.1604537113, 2016.
Lu, X., Hong, J., Zhang, L., Cooper, O. R., Schultz, M. G., Xu, X., Wang, T., Gao, M., Zhao, Y., and Zhang, Y.: Severe Surface Ozone Pollution in China: A Global Perspective, Environ. Sci. Tech. Let., 5, 487–494, https://doi.org/10.1021/acs.estlett.8b00366, 2018.
Lu, Z., Streets, D. G., Zhang, Q., Wang, S., Carmichael, G. R., Cheng, Y. F., Wei, C., Chin, M., Diehl, T., and Tan, Q.: Sulfur dioxide emissions in China and sulfur trends in East Asia since 2000, Atmos. Chem. Phys., 10, 6311–6331, https://doi.org/10.5194/acp-10-6311-2010, 2010.
Lyu, Y., Qu, Z., Liu, L., Guo, L., Yang, Y., Hu, X., Xiong, Y., Zhang, G., Zhao, M., Liang, B., Dai, J., Zuo, X., Jia, Q., Zheng, H., Han, X., Zhao, S., and Liu, Q.: Characterization of dustfall in rural and urban sites during three dust storms in northern China, 2010, Aeolian Res., 28, 29–37, https://doi.org/10.1016/j.aeolia.2017.06.004, 2017.
Ma, Z., Hu, X., Sayer, A. M., Levy, R., Zhang, Q., Xue, Y., Tong, S., Bi, J., Huang, L., and Liu, Y.: Satellite-Based Spatiotemporal Trends in PM2.5 Concentrations: China, 2004–2013, Environ. Health Persp., 124, 184–192, https://doi.org/10.1289/ehp.1409481, 2016.
Ma, Z., Liu, R., Liu, Y., and Bi, J.: Effects of air pollution control policies on PM2.5 pollution improvement in China from 2005 to 2017: a satellite-based perspective, Atmos. Chem. Phys., 19, 6861–6877, https://doi.org/10.5194/acp-19-6861-2019, 2019.
MEE (Ministry of Ecology and Environment of the People's Republic of China, the former Ministry of Environmental Protection): Ambient air quality standards, GB 3095-2012, 2012.
Moch, J. M., Dovrou, E., Mickley, L. J., Keutsch, F. N., Cheng, Y., Jacob, D. J., Jiang, J., Li, M., Munger, J. W., and Qiao, X.: Contribution of hydroxymethane sulfonate to ambient particulate matter: A potential explanation for high particulate sulfur during severe winter haze in Beijing, Geophys. Res. Lett., 45, 11969–11979, https://doi.org/10.1029/2018GL079309, 2018.
Pendergrass, D. C., Shen, L., Jacob, D. J., and Mickley, L. J.: Predicting the impact of climate change on severe wintertime particulate pollution events in Beijing using extreme value theory, Geophys. Res. Lett., 46, 1824–1830, https://doi.org/10.1029/2018GL080102, 2019.
Rohde, R. A. and Muller, R. A.: Air pollution in China: mapping of concentrations and sources, PloS one, 10, e0135749, https://doi.org/10.1371/journal.pone.0135749, 2015.
Shao, P., Tian, H., Sun, Y., Liu, H., Wu, B., Liu, S., Liu, X., Wu, Y., Liang, W., Wang, Y., Gao, J., Xue, Y., Bai, X., Liu, W., Lin, S., and Hu, G.: Characterizing remarkable changes of severe haze events and chemical compositions in multi-size airborne particles (PM1, PM2.5 and PM10) from January 2013 to 2016–2017 winter in Beijing, China, Atmos. Environ., 189, 133–144, https://doi.org/10.1016/j.atmosenv.2018.06.038, 2018.
Shen, L., Mickley, L. J., and Murray, L. T.: Influence of 2000–2050 climate change on particulate matter in the United States: results from a new statistical model, Atmos. Chem. Phys., 17, 4355–4367, https://doi.org/10.5194/acp-17-4355-2017, 2017.
Shen, L., Jacob, D. J., Mickley, L. J., Wang, Y., and Zhang, Q.: Insignificant effect of climate change on winter haze pollution in Beijing, Atmos. Chem. Phys., 18, 17489–17496, https://doi.org/10.5194/acp-18-17489-2018, 2018.
Silver, B., Reddington, C. L., Arnold, S. R., and Spracklen, D. V.: Substantial changes in air pollution across China during 2015–2017, Environ. Res. Lett., 13, 114012, https://doi.org/10.1088/1748-9326/aae718, 2018.
Siwen, W., Qiang, Z., Randall, V. M., Sajeev, P., Fei, L., Meng, L., Xujia, J., and Kebin, H.: Satellite measurements oversee China's sulfur dioxide emission reductions from coal-fired power plants, Environ. Res. Lett., 10, 114015, https://doi.org/10.1088/1748-9326/10/11/114015, 2015.
Song, S., Gao, M., Xu, W., Sun, Y., Worsnop, D. R., Jayne, J. T., Zhang, Y., Zhu, L., Li, M., Zhou, Z., Cheng, C., Lv, Y., Wang, Y., Peng, W., Xu, X., Lin, N., Wang, Y., Wang, S., Munger, J. W., Jacob, D. J., and McElroy, M. B.: Possible heterogeneous chemistry of hydroxymethanesulfonate (HMS) in northern China winter haze, Atmos. Chem. Phys., 19, 1357–1371, https://doi.org/10.5194/acp-19-1357-2019, 2019.
Tai, A. P. K., Mickley, L. J., and Jacob, D. J.: Correlations between fine particulate matter (PM2.5) and meteorological variables in the United States: Implications for the sensitivity of PM2.5 to climate change, Atmos. Environ., 44, 3976–3984, https://doi.org/10.1016/j.atmosenv.2010.06.060, 2010.
Tai, A. P. K., Mickley, L. J., Jacob, D. J., Leibensperger, E. M., Zhang, L., Fisher, J. A., and Pye, H. O. T.: Meteorological modes of variability for fine particulate matter (PM2.5) air quality in the United States: implications for PM2.5 sensitivity to climate change, Atmos. Chem. Phys., 12, 3131–3145, https://doi.org/10.5194/acp-12-3131-2012, 2012.
Tao, J., Zhang, L., Cao, J., and Zhang, R.: A review of current knowledge concerning PM2.5 chemical composition, aerosol optical properties and their relationships across China, Atmos. Chem. Phys., 17, 9485–9518, https://doi.org/10.5194/acp-17-9485-2017, 2017.
Tie, X., Huang, R.-J., Cao, J., Zhang, Q., Cheng, Y., Su, H., Chang, D., Poschl, U., Hoffmann, T., Dusek, U., Li, G., Worsnop, D. R., and O'Dowd, C. D.: Severe Pollution in China Amplified by Atmospheric Moisture, Sci. Rep.-UK, 7, 15760, https://doi.org/10.1038/s41598-017-15909-1, 2017.
van der A, R. J., Mijling, B., Ding, J., Koukouli, M. E., Liu, F., Li, Q., Mao, H., and Theys, N.: Cleaning up the air: effectiveness of air quality policy for SO2 and NOx emissions in China, Atmos. Chem. Phys., 17, 1775–1789, https://doi.org/10.5194/acp-17-1775-2017, 2017.
Wang, H.-J. and Chen, H.-P.: Understanding the recent trend of haze pollution in eastern China: roles of climate change, Atmos. Chem. Phys., 16, 4205–4211, https://doi.org/10.5194/acp-16-4205-2016, 2016.
Wang, J., Zhao, B., Wang, S., Yang, F., Xing, J., Morawska, L., Ding, A., Kulmala, M., Kerminen, V.-M., Kujansuu, J., Wang, Z., Ding, D., Zhang, X., Wang, H., Tian, M., Petaja, T., Jiang, J., and Hao, J.: Particulate matter pollution over China and the effects of control policies, Sci. Total Environ., 584–585, 426–447, https://doi.org/10.1016/j.scitotenv.2017.01.027, 2017.
Wang, X., Dong, Z., Zhang, J., and Liu, L.: Modern dust storms in China: an overview, J. Arid Environ., 58, 559–574, 2004.
Wang, X., Dickinson, R. E., Su, L., Zhou, C., and Wang, K.: PM2.5 pollution in China and how it has been exacerbated by terrain and meteorological conditions, B. Am. Meteorol. Soc., 99, 105–119, 2018.
Wang, Y., Yao, L., Wang, L., Liu, Z., Ji, D., Tang, G., Zhang, J., Sun, Y., Hu, B., and Xin, J.: Mechanism for the formation of the January 2013 heavy haze pollution episode over central and eastern China, Science China Earth Sciences, 57, 14–25, 2014.
Xia, Y., Zhao, Y., and Nielsen, C. P.: Benefits of China's efforts in gaseous pollutant control indicated by the bottom-up emissions and satellite observations 2000–2014, Atmos. Environ., 136, 43–53, 2016.
Xiao, Q., Ma, Z., Li, S., and Liu, Y.: The impact of winter heating on air pollution in China, PloS one, 10, e0117311, https://doi.org/10.1371/journal.pone.0117311, 2015.
Xu, P., Liao, Y. J., Lin, Y. H., Zhao, C. X., Yan, C. H., Cao, M. N., Wang, G. S., and Luan, S. J.: High-resolution inventory of ammonia emissions from agricultural fertilizer in China from 1978 to 2008, Atmos. Chem. Phys., 16, 1207–1218, https://doi.org/10.5194/acp-16-1207-2016, 2016.
Yang, Y., Liao, H., and Lou, S.: Increase in winter haze over eastern China in recent decades: Roles of variations in meteorological parameters and anthropogenic emissions, J. Geophys. Res.-Atmos., 121, 13050–13065, https://doi.org/10.1002/2016JD025136, 2016.
Yang, Y., Wang, H., Smith, S. J., Zhang, R., Lou, S., Qian, Y., Ma, P.-L., and Rasch, P. J.: Recent intensification of winter haze in China linked to foreign emissions and meteorology, Sci. Rep.-UK, 8, 2107, https://doi.org/10.1038/s41598-018-20437-7, 2018.
Yi, K., Liu, J., Wang, X., Ma, J., Hu, J., Wan, Y., Xu, J., Yang, H., Liu, H., Xiang, S., and Tao, S.: A combined Arctic-tropical climate pattern controlling the inter-annual climate variability of wintertime PM2.5 over the North China Plain, Environ. Pollut., 245, 607–615, https://doi.org/10.1016/j.envpol.2018.10.136, 2019.
Zhang, R., Li, Q., and Zhang, R.: Meteorological conditions for the persistent severe fog and haze event over eastern China in January 2013, Science China Earth Sciences, 57, 26–35, https://doi.org/10.1007/s11430-013-4774-3, 2014.
Zhang, X. Y., Wang, Y. Q., Niu, T., Zhang, X. C., Gong, S. L., Zhang, Y. M., and Sun, J. Y.: Atmospheric aerosol compositions in China: spatial/temporal variability, chemical signature, regional haze distribution and comparisons with global aerosols, Atmos. Chem. Phys., 12, 779–799, https://doi.org/10.5194/acp-12-779-2012, 2012.
Zhang, X. Y., Xu, X. D., Ding, Y. H., Liu, Y. J., Zhang, H. D., Wang, Y. Q., Zhong, J. T.: The impact of meteorological changes from 2013 to 2017 on PM2.5 mass reduction in key regions in China, Science China Earth Sciences, 49, https://doi.org/10.1360/N072018-00303, 2019 (in Chinese).
Zhang, Y.-L. and Cao, F.: Fine particulate matter (PM2.5) in China at a city level, Sci. Rep.-UK, 5, 14884, https://doi.org/10.1038/srep14884, 2015.
Zhao, B., Jonathan, H. J., Yu, G., David, D., John, W., Kuo-Nan, L., Hui, S., Jia, X., Michael, G., and Lei, H.: Decadal-scale trends in regional aerosol particle properties and their linkage to emission changes, Environ. Res. Lett., 12, 054021, https://doi.org/10.1088/1748-9326/aa6cb2, 2017.
Zhao, B., Zheng, H., Wang, S., Smith, K. R., Lu, X., Aunan, K., Gu, Y., Wang, Y., Ding, D., and Xing, J.: Change in household fuels dominates the decrease in PM2.5 exposure and premature mortality in China in 2005–2015, P. Natl. Acad. Sci. USA, 115, 12401–12406, 2018.
Zheng, B., Zhang, Q., Zhang, Y., He, K. B., Wang, K., Zheng, G. J., Duan, F. K., Ma, Y. L., and Kimoto, T.: Heterogeneous chemistry: a mechanism missing in current models to explain secondary inorganic aerosol formation during the January 2013 haze episode in North China, Atmos. Chem. Phys., 15, 2031–2049, https://doi.org/10.5194/acp-15-2031-2015, 2015.
Zheng, B., Tong, D., Li, M., Liu, F., Hong, C., Geng, G., Li, H., Li, X., Peng, L., Qi, J., Yan, L., Zhang, Y., Zhao, H., Zheng, Y., He, K., and Zhang, Q.: Trends in China's anthropogenic emissions since 2010 as the consequence of clean air actions, Atmos. Chem. Phys., 18, 14095–14111, https://doi.org/10.5194/acp-18-14095-2018, 2018.
Zhu, J., Liao, H., and Li, J.: Increases in aerosol concentrations over eastern China due to the decadal-scale weakening of the East Asian summer monsoon, Geophys. Res. Lett., 39, L09809, https://doi.org/10.1029/2012GL051428, 2012.
Zou, Y., Wang, Y., Zhang, Y., and Koo, J.-H.: Arctic sea ice, Eurasia snow, and extreme winter haze in China, Sci. Adv., 3, e1602751, https://doi.org/10.1126/sciadv.1602751, 2017.