the Creative Commons Attribution 4.0 License.
the Creative Commons Attribution 4.0 License.
 | 29 Aug 2019
Arabitol, mannitol, and glucose as tracers of primary biogenic organic aerosol: the influence of environmental factors on ambient air concentrations and spatial distribution over France
Abdoulaye Samaké
Jean-Luc Jaffrezo
Olivier Favez
Samuël Weber
Véronique Jacob
Trishalee Canete
Alexandre Albinet
Aurélie Charron
Véronique Riffault
Esperanza Perdrix
Antoine Waked
Benjamin Golly
Dalia Salameh
Florie Chevrier
Diogo Miguel Oliveira
Jean-Luc Besombes
Jean M. F. Martins
Nicolas Bonnaire
Sébastien Conil
Géraldine Guillaud
Boualem Mesbah
Benoit Rocq
Pierre-Yves Robic
Agnès Hulin
Sébastien Le Meur
Maxence Descheemaecker
Eve Chretien
Nicolas Marchand
Gaëlle Uzu
The primary sugar compounds (SCs, defined as glucose, arabitol, and mannitol) are widely recognized as suitable molecular markers to characterize and apportion primary biogenic organic aerosol emission sources. This work improves our understanding of the spatial behavior and distribution of these chemical species and evidences their major effective environmental drivers. We conducted a large study focusing on the daily (24 h) PM10 SC concentrations for 16 increasing space scale sites (local to nationwide), over at least 1 complete year. These sites are distributed in several French geographic areas of different environmental conditions. Our analyses, mainly based on the examination of the short-term evolutions of SC concentrations, clearly show distance-dependent correlations. SC concentration evolutions are highly synchronous at an urban city scale and remain well correlated throughout the same geographic regions, even if the sites are situated in different cities. However, sampling sites located in two distinct geographic areas are poorly correlated. Such a pattern indicates that the processes responsible for the evolution of the atmospheric SC concentrations present a spatial homogeneity over typical areas of at least tens of kilometers. Local phenomena, such as the resuspension of topsoil and associated microbiota, do no account for the major emissions processes of SC in urban areas not directly influenced by agricultural activities. The concentrations of SC and cellulose display remarkably synchronous temporal evolution cycles at an urban site in Grenoble, indicating a common source ascribed to vegetation. Additionally, higher concentrations of SC at another site located in a crop field region occur during each harvest periods, indicating resuspension processes of plant materials (crop detritus, leaf debris) and associated microbiota for agricultural and nearby urbanized areas. Finally, ambient air temperature, relative humidity, and vegetation density constitute the main effective drivers of SC atmospheric concentrations.
- Article
(6008 KB) - Full-text XML
-
Supplement
(1212 KB) - BibTeX
- EndNote


Primary biogenic organic aerosols (PBOAs), which notably comprise bacterial and fungal cells or spores, viruses, or microbial fragments such as endotoxins and mycotoxins as well as pollens and plant debris, are ubiquitous particles released from the biosphere to the atmosphere (Amato et al., 2017; Fang et al., 2018; Martin et al., 2010; Perrino and Marcovecchio, 2016; Wéry et al., 2017). PBOA can contribute significantly to the total coarse aerosol mass (Amato et al., 2017; Bozzetti et al., 2016; Coz et al., 2010; Fröhlich-Nowoisky et al., 2016; Jaenicke, 2005; Manninen et al., 2014; Morris et al., 2011; Samaké et al., 2019; Vlachou et al., 2018; Yue et al., 2017). Besides their expected negative human health effects (Fröhlich-Nowoisky et al., 2009, 2016; Humbal et al., 2018; Lecours et al., 2017; Zamfir et al., 2019), they substantially influence the carbon and water cycles at the global scale, notably acting as cloud and ice nuclei (Ariya et al., 2009; Elbert et al., 2007; Fröhlich-Nowoisky et al., 2016; Hill et al., 2017; Humbal et al., 2018; Morris et al., 2014; Rajput et al., 2018). While recent studies have revealed highly relevant information on the abundance and size partitioning of PBOA (Fröhlich-Nowoisky et al., 2017; Huffman and Santarpia, 2017), their emission sources and contribution to total airborne particles are still poorly documented, partly due to the analytical limitations to distinguish PBOA from other types of carbonaceous particulate matter (Bozzetti et al., 2016; China et al., 2018; Di Filippo et al., 2013; Perrino and Marcovecchio, 2016; Yan et al., 2019). Notably, the global emissions of fungal spores emitted into the atmosphere are still poorly constrained and range from 8 to 186 Tg yr−1 (Després et al., 2012; Elbert et al., 2007; Jacobson and Streets, 2009; Sesartic and Dallafior, 2011; Tanarhte et al., 2019).
Recently, source-specific tracer methodologies have been introduced to estimate their contribution to aerosol loadings (Di Filippo et al., 2013; Gosselin et al., 2016; Li et al., 2018; Medeiros et al., 2006b; Verma et al., 2018; Wang et al., 2018). Indeed, atmospheric organic aerosols (OAs) contain specific chemical species that can be used as reliable biomarkers in tracing the sources and abundance of PBOA (Bauer et al., 2008; Gosselin et al., 2016; Holden et al., 2011; Jia et al., 2010; Li et al., 2018; Medeiros et al., 2006b; Wang et al., 2018). For instance, among sugar alcohols, arabitol and mannitol (two common storage soluble carbohydrates in fungi) have been recognized as tracers for airborne fungi, and their concentrations are widely used to estimate PBOA contributions to OA mass (Amato et al., 2017; Bauer et al., 2008; Buiarelli et al., 2013; Golly et al., 2018; Medeiros et al., 2006b; Samaké et al., 2019; Srivastava et al., 2018; Verma et al., 2018; Weber et al., 2018, 2019). Similarly, glucose has also been used as a tracer for plant materials (such as pollen, leaves, and their fragments) or soil emissions within various studies around the world (Chen et al., 2013; Medeiros et al., 2006b; Pietrogrande et al., 2014; Rathnayake et al., 2017; Rogge et al., 2007; Wan et al., 2019; Xiao et al., 2018; Zhu et al., 2015).
In this context, atmospheric concentrations of specific sugar alcohols and/or primary monosaccharides (including glucose) have been previously quantified at sites in several continental, agricultural, coastal, or polar regions (Barbaro et al., 2015; Chen et al., 2013; Glasius et al., 2018; Li et al., 2018; Pietrogrande et al., 2014; Verma et al., 2018; Wan et al., 2019; Yan et al., 2019; Yttri et al., 2007). However, large datasets investigating their (multi)annual cycles and seasonal and simultaneous short-term variations at multiple spatial-scale resolutions (i.e., from local to continental) are still lacking (Liang et al., 2013; Nirmalkar et al., 2018; Pietrogrande et al., 2014; Yan et al., 2019). Such records are essential to better understand the spatial behavior of primary sugar compound (SC) concentrations (i.e., glucose, arabitol, and mannitol) and PBOA emission processes and to isolate their potential key drivers (e.g., vegetation type and density, topography, weather conditions), which are still unclear (Bozzetti et al., 2016). This information would be essential for further implementation into chemical transport models (Heald and Spracklen, 2009; Myriokefalitakis et al., 2017; Tanarhte et al., 2019).
It is commonly acknowledged that SCs (particularly arabitol and mannitol) originate from primary biogenically derived sources such as bacterial, fungal spores, and plant materials (Di Filippo et al., 2013; Golly et al., 2018; Gosselin et al., 2016; Holden et al., 2011; Kang et al., 2018; Medeiros et al., 2006b; Wan et al., 2019; Yan et al., 2019; Yttri et al., 2007; Zhu et al., 2018a). Some studies have characterized the composition of SC in topsoil samples (for fractions larger than PM10) from both natural (i.e., uncultivated) and agricultural regions (Medeiros et al., 2006a; Rogge et al., 2007; Simoneit et al., 2004; Wan and Yu, 2007). The authors suggested that the particulate arabitol, mannitol, and glucose are introduced into the atmosphere mainly through resuspended soils or dust particles and associated biota derived from natural soil erosion, unpaved road dust or agricultural practices. Conversely, Jia and Fraser (2011) reported higher concentrations of SC relative to PBOA in size-segregated aerosol samples collected at a suburban site (Higley, USA) compared to the local size-fractionated soils (equivalent to atmospheric PM2.5 and PM10). This suggested that direct emissions from biota (microbiota, vascular plant materials) could also be a significant atmospheric input process for SC at this suburban site.
A large database on SC concentrations was obtained over France in the last decade. It already allowed the investigation of the size distribution and seasonal variabilities of SC concentrations in aerosols at 28 French sites, notably showing that SCs are ubiquitous primary aerosols, accounting for a significant proportion of PM10 organic matter (OM) mass (Samaké et al., 2019). Results confirmed that their ambient concentrations display a well-marked seasonality, with maximum concentrations from late spring to early autumn, followed by an abrupt decrease in late autumns and a minimum concentration during wintertime in France. This study also showed that the mean PBOA chemical profile is largely dominated by organic compounds, with only a minor contribution of dust particle fraction. The latter result indicated that ambient polyols could most likely be associated with direct biological particle emissions (active spore discharge, microbiota released from phylloplane or phyllosphere, etc.) rather than with the microorganism-containing soil resuspension. These observations call for more investigations of the predominant SC (and PBOA) emission sources.
Cellulose, a linear polymer composed of D-glucopyranose units linked by β-1,4 bonds, is the most frequent polysaccharide occurring in terrestrial environments (Ramoni and Seiboth, 2016). Plant materials contain cellulose, which has been reported as a suitable proxy to evaluate the vegetative debris contribution to OM mass (Bozzetti et al., 2016; Daellenbach et al., 2017; Glasius et al., 2018; Hiranuma et al., 2019; Puxbaum and Tenze-Kunit, 2003; Sánchez-Ochoa et al., 2007; Yttri et al., 2011b). The ambient PM10 cellulose has been shown to be abundant in the European semirural or background environments (accounting for 2 % to 10 % of OM mass) (Glasius et al., 2018; Sánchez-Ochoa et al., 2007) and Nordic rural environments in Norway (contributing to 12 % to 18 % of total carbon mass) (Yttri et al., 2011b). Thus, simultaneous concentration measurements of cellulose and SC can provide essential information into their emission source dynamics.
As the continuation of our previous work (Samaké et al., 2019), the present paper aims to delineate the processes that drive the atmospheric concentrations of SC and then PBOA. This is achieved through (i) the analysis of simultaneous annual short-term time series of particulate SC concentrations over pairs of sites across multiple space ranges, including local, regional, and nationwide sites, and (ii) the investigation of links between concentrations and series key parameters such as meteorological and phenological ones. Simultaneous annual short-term concentration measurements of SC and cellulose were performed to better understand their sources correlations.
2.1 Sampling sites
Daily PM10 concentrations reported in the present work were obtained from different research and monitoring programs conducted over the last 6 years in France. Within the framework of the present study, we carefully selected sites sharing at least 1 complete year of concurrent monitoring with another one, to be representative of the annual variation cycles. The final dataset includes data from 16 sites, which are distributed in different regions of France (Fig. 1) and cover several main types of environmental conditions in terms of site topography, local vegetation, and climate. The characteristics and data available at each sampling site are listed in Table S1 of the Supplement, together with the information on the annual average concentrations of aerosol chemical composition (Table S2). Detailed information on the sampling conditions can be found in Samaké et al. (2019), such as the campaign periods, number of collected PM samples, sampling flow rates, sample storage and handling, etc. Note that, the previous database (Samaké et al., 2019) has been updated here with arabitol and mannitol in PM10 collected at the suburban site of Nogent-sur-Oise for a series covering the years 2013 to 2017.
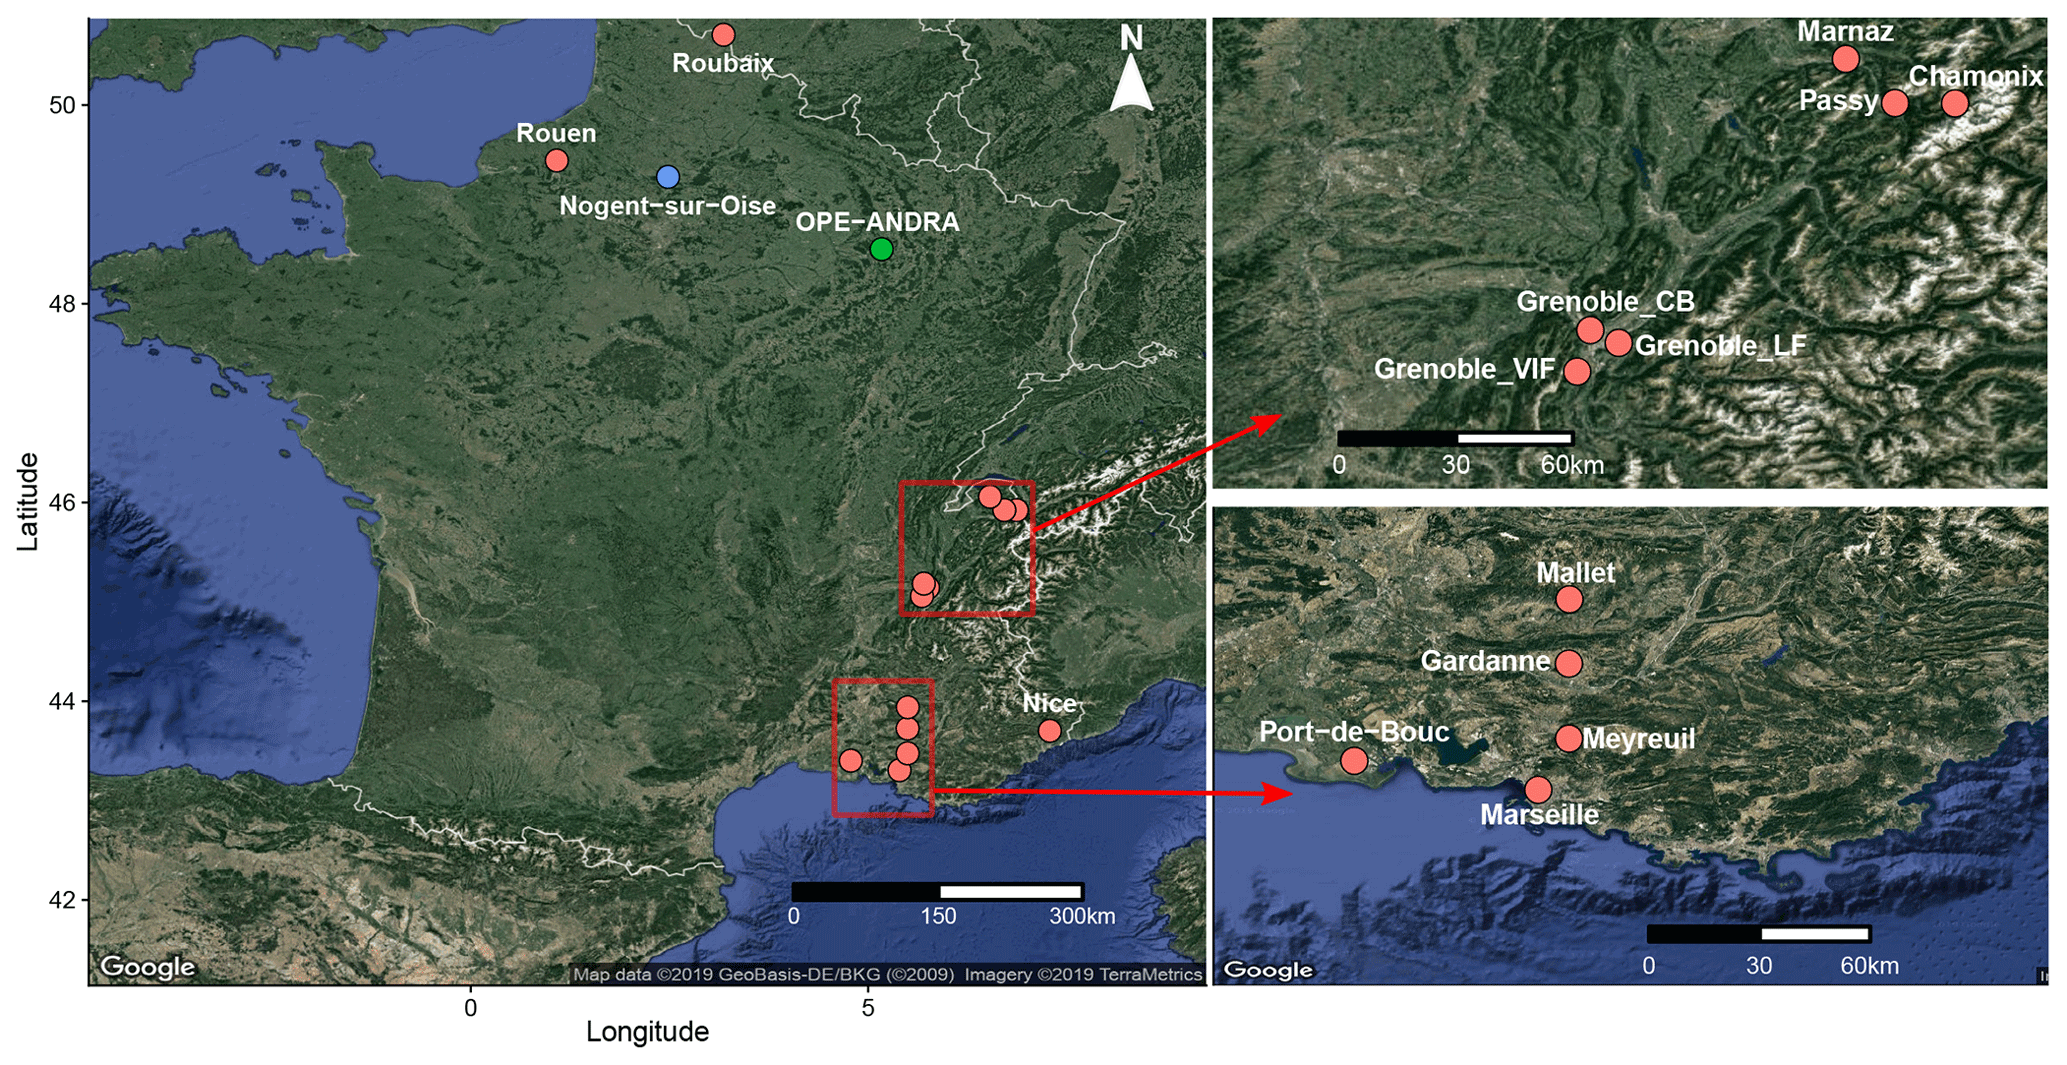
Figure 1Geographical location of the selected sampling sites. The red and blue dots indicate urban and suburban sites, respectively, while the green one corresponds to a rural site, surrounded by field crop areas.
2.2 Chemical analyses
Daily (24 h) PM10 samples were collected onto prebaked quartz fiber filters (Tissuquartz PALL QAT-UP 2500 150 mm diameter) every third or sixth day but not concurrently at all sites. They were then analyzed for various chemical species using subsampled fractions of the collection filters and a large array of analytical methods. Details of all the chemical analysis procedures are reported elsewhere (Golly et al., 2018; Samaké et al., 2019; Waked et al., 2014; Weber et al., 2018). Briefly, primary sugar compounds were extracted from filter aliquots (punches typically about 10 cm2) into ultrapure water. The extracts are then filtered using a 0.22 µm Acrodisc filter. Depending on the site, analyses were conducted either by the IGE (Institut des Géosciences de l'Environnement) or by the LSCE (Laboratoire des Sciences du Climat et de l'Environnement) (Samaké et al., 2019). At the IGE, extraction was performed during 20 min in a vortex shaker, and analyses were achieved using high-performance liquid chromatography with pulsed amperometric detection (HPLC-PAD). A first set of equipment was used until March 2016, consisting of a Dionex DX500 equipped with a three-column Metrosep (Carb 1-Guard + A Supp 15–150 + Carb 1–150); the analytical program was isocratic with 70 mM sodium hydroxide (NaOH) as an eluent for 11 min, followed by a gradient cleaning step with a 120 mM NaOH as an eluent for 9 min. This procedure allows the analysis of arabitol, mannitol, and glucose (Waked et al., 2014). A second set of equipment was used after March 2016, with a Thermo-Fisher ICS 5000+ HPLC equipped with a 4 mm diameter Metrosep Carb 2×150 mm column and a 50 mm pre-column. The analytical run was isocratic with 15 % of an eluent of sodium hydroxide (200 mM) and sodium acetate (4 mM) and 85 % water, at 1 mL min−1. At the LSCE, extraction was performed for 45 min by sonication and analyses were achieved using an ion chromatography instrument (IC, DX600, Dionex) with pulsed amperometric detection (ICS3000, Thermo-Fisher). In addition, a CarboPAC MA1 column was used (4×250 mm, Dionex) along with an isocratic analytical run with 480 mM sodium hydroxide eluent. This analytical technique allows us to quantify arabitol, mannitol, and glucose (Srivastava et al., 2018). Examples of standard solution and sample raw HPLC-PAD chromatograms are presented in Fig. S1.
For cellulose quantification, we used an optimized protocol based on that described by Kunit and Puxbaum (1996) and Puxbaum and Tenze-Kunit (2003), in which the cellulose contained in the lignocellulosic material is enzymatically hydrolyzed into glucose units before analysis. Since the alkaline peroxide pretreatment step used to remove lignin in the original protocol results in a loss of sample material, it has been avoided in this study. Therefore, only the “free cellulose” is reported in our samples. Note that Sánchez-Ochoa et al. (2007) consider that this free cellulose could represent only about 70 % of the total cellulose in air samples and that the total cellulose could represent only about 50 % of the “plant debris” content of atmospheric PM. Very few other results are available on this topic (Bozzetti et al., 2016; Glasius et al., 2018; Vlachou et al., 2018; Yttri et al., 2011b). The protocol has been improved to increase sensitivity and accuracy by reducing the contribution of glucose in the blanks and by using an HPLC-PAD as the analytical method for the determination of glucose concentrations. Trichoderma reesei cellulase (> 700 U g−1, Sigma Aldrich) and Aspergillus niger glucosidase (> 750 U g−1, Sigma Aldrich) were used as saccharification enzymes. The protocol is detailed in Sect. S2 in the Supplement.
Field blank filters (about 10 % of samples) were handled as real samples for quality assurance. The present data have been corrected from field blanks. The reproducibility of the analysis of primary sugar compounds (polyols, glucose) and cellulose, estimated from the analysis of sample extracts from 10 punches of the same filters, were in the range of 10 %–15 %. The quantification limits of primary sugar compounds and cellulose ranged from 0.63 to 0.89 ng m−3. About 2800 samples are considered in this work for the polyols and glucose series, while 290 samples (from the sites of Grenoble_LF and OPE-ANDRA) are considered for the cellulose series. Hereafter, the term “polyols” is used to refer uniquely to the sum of arabitol and mannitol concentrations.
2.3 Meteorological data and leaf area index (LAI) measurements
Ambient weather data were not available at all monitoring sites (see Table S1). In this study, data including daily relative humidity (%), nighttime temperature (∘C), average and maximum temperatures (∘C), wind speed (m s−1), solar radiation (W m−2), and rainfall level (mm) for the sites of Marnaz and OPE-ANDRA (Fig. 1), representing different climatic regions and environmental conditions, were obtained from the French meteorological data sharing service system (Météo-France) and ANDRA (French national radioprotective agency, in charge of the OPE-ANDRA site).
The LAI, which is defined as the projected area of leaves over a unit of land, is an important measure of the local vegetation density variation (Heald and Spracklen, 2009; Yan et al., 2016a, b). For this study, we used the MODIS Collection 6 LAI product because it is considered to have the highest quality among all the MODIS LAI products (Yan et al., 2016a, b). The MCD15A3H product uses both Terra and Aqua reflectance observations as inputs to estimate daily LAI at 500 m spatial resolution, and a 4 d composite is calculated to reduce the noise from abiotic factors. Using a 2×2 km grid box around the monitoring site, the local vegetation density variation was retrieved from LP DAAC (https://lpdaac.usgs.gov/, last access: 15 March 2019) for the sites of Marnaz, OPE-ANDRA, and Grenoble_LF.
2.4 Data analyses
All the statistical analyses were carried out using the open-source R software (R studio interface, version 3.4.1). Several statistical analyses were performed on the concentrations to identify the spatial patterns of emission sources and the potential parameters of influence as explained below.
The normalized cross-correlation (NCC) test was chosen to examine the potential similarities among the monitoring sites for particulate SC concentrations, in terms of short-term temporal trends (e.g., synchronized periods of increase or decrease, simultaneous fluctuations during specific episodes). The main advantage of NCC over the traditional correlation tests is that it is less sensitive to linear changes in the amplitudes of the two time series compared. Therefore, to reduce the possibility of spurious “anti-correlation” due to highly variable concentration ranges, data were amplitude-normalized prior to correlation analysis. A thorough discussion of the normalized cross-correlation method can be found elsewhere (Bardal and Sætran, 2016; Dai and Zhou, 2017; Eisner et al., 2009; Kaso, 2018; Lainer et al., 2016; Le Pichon et al., 2019). To achieve pair-wise correlation analysis between the sampling sites collected during the same periods, the original raw daily measurements were processed as follows: starting on identical days for each pairs of sites, the arrangement of the original daily data into consecutive 3 d intervals (or 6 d intervals in the case of OPE-ANDRA) and the calculation of the average concentration values for the middle day were performed. The resultant data were used for correlation analysis between site pairs (Table S3).
Multiple linear regression (MLR) was used to assess the strength of the relationships between atmospheric concentrations of particulate SC and local environmental factors including the daily mean relative humidity, nighttime temperature, average and maximum temperature, wind speed, solar radiation, rain levels, and LAI. Because the LAI is a 4 d composite, daily values of the other variables were rescaled to consecutive 4 d averaged values. The linear regression (linear model or lm) package in R was employed for multiple regression analyses. The concentration data were log-transformed to obtain regression residual distributions as close as possible to the normal Gaussian one (Fig. S2). Stepwise forward selection was used to select the predictors that explain well the temporal variation in SC concentrations at the site of Marnaz.
It should be noted that due to the limited availability of external parameters, the environmental factors driving SC atmospheric levels have been extensively investigated for only two monitoring sites with contrasted characteristics: the urban background site of Marnaz located in an Alpine valley, and the rural OPE-ANDRA site surrounded by field crop areas spreading over several tens of kilometers.

Figure 2Concentrations (in ng m−3) of (a, c, e) ambient particulate polyols (defined as the sum of arabitol and mannitol) and (b, d, f) glucose over different monitoring sites in France. Since PM10 were collected every 3 d at Nogent-sur-Oise and 6 d at OPE-ANDRA, the original datasets are averaged over consecutive 6 d intervals (g).
3.1 Example of spatial coherence of the concentrations at different scales
Our previous work (Samaké et al., 2019) showed that particulate polyols and glucose are ubiquitous primary compounds with nonrandom spatial and seasonal variation patterns over France. Here, an inter-site comparison of their short-term concentration evolutions has been carried out at different space scales (from local to national) for the pairs that can be investigated in our database. Figure 2 presents some of these comparisons for three spatial scales (15, 120, and 205 km).
The daily average concentrations of polyols (defined as the sum of arabitol and mannitol) and glucose display highly synchronous evolutional trends (i.e., homogeneity in the concentrations, the timing of concentration peaks, simultaneity of the daily specific episodes of increase or decrease in concentrations) over three neighboring monitoring sites located 15 km apart in the Grenoble area (Fig. 2a and b). Interestingly, remarkable synchronous patterns both for the short term (near-daily) and longer term (seasonal) still occur for sites located 120 km apart, as exemplified for two sites in Alpine environments (Grenoble and Marnaz) (Fig. 2c and d). However, as shown in Fig. 2e and f, the evolutions of concentrations become quite dissimilar and asynchronous in terms of seasonal and daily fluctuations for more distant sites (Grenoble and Nice, 205 km apart) that are located in different climatic regions (Alpine for Grenoble, Mediterranean for Nice). This contrasts with results from the rural background site of OPE-ANDRA and the suburban site of Nogent-sur-Oise, both located in a large field crop region of extensive agriculture and about 230 km apart from each other (Fig. 2g). Indeed, they present very similar variations in daily concentrations for multiyear series, despite their distance apart, with concentration peaks generally more pronounced at the rural site of OPE-ANDRA.
The following sections are dedicated to the investigation of the processes that can lead to these similarities and differences according to these spatial scales.
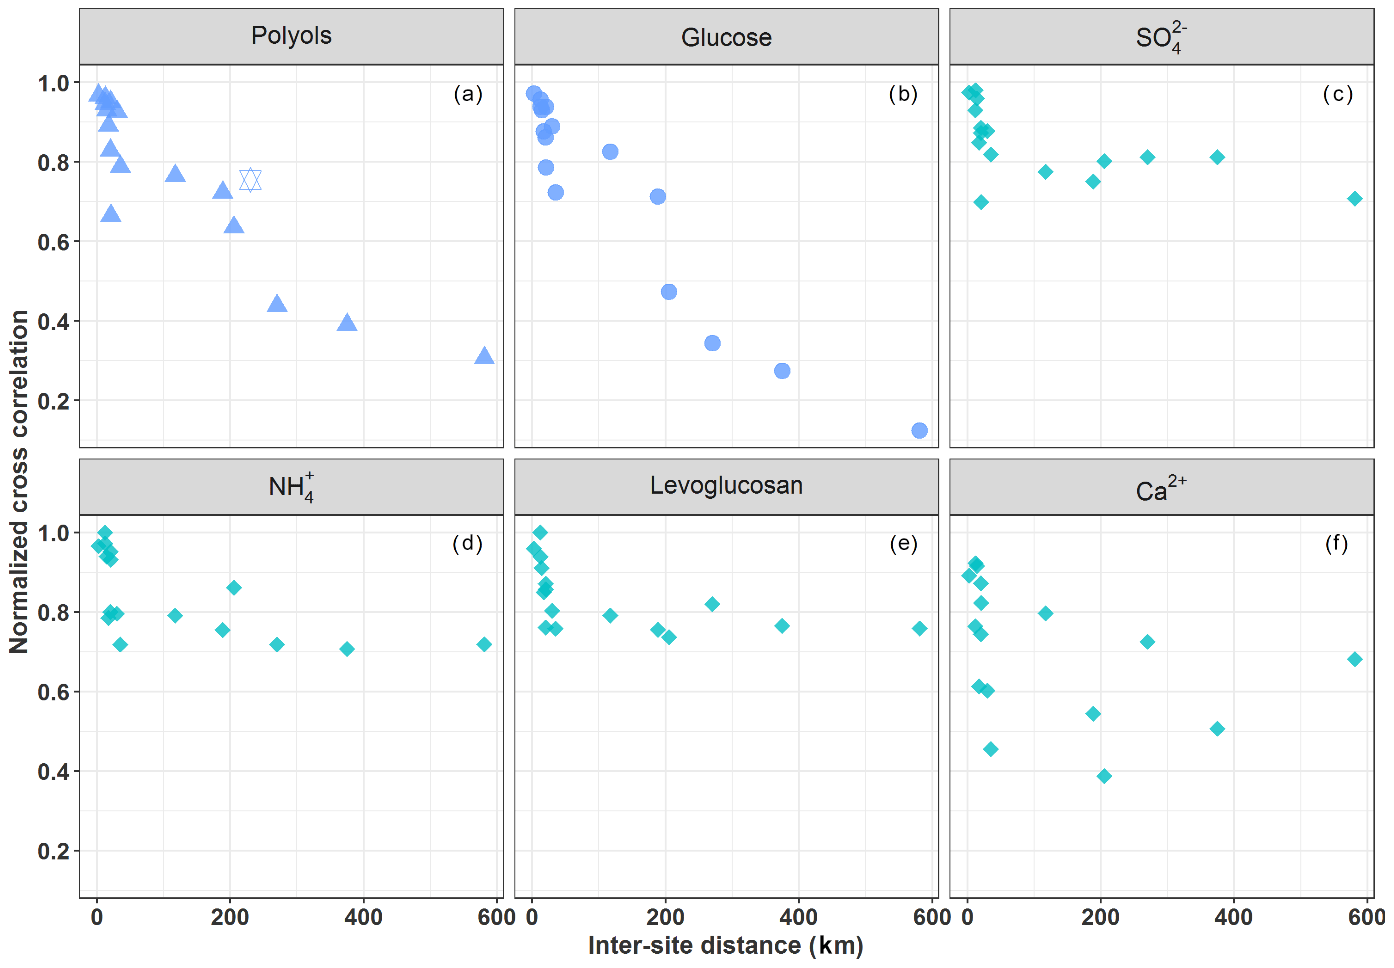
Figure 3Normalized cross-correlation values for the daily evolution of particulate polyols (a), glucose (b), sulfate (c), ammonium (d), levoglucosan (e), and calcium (f) concentrations over pairs of sites located at multiple increasing space scales across France. The hexagram corresponds to the correlation between the sites of OPE-ANDRA and Nogent-sur-Oise, both sites being surrounded by crop field areas.
3.2 Inter-site correlations and spatial-scale variability
Figure 3a and b provide an overview of the cross-correlation coefficients for the daily evolution of concentrations (for polyols and glucose (SC)) between pairs of sites located at multiple increasing space scales across France (Table S3). Time series of concentrations for both SCs show a clear distance-dependent correlation. The strength of the correlations is highly significant for distances up to 150–190 km (R>0.72, p<0.01) and gradually decreases with increasing inter-site distances. One exception is the pair OPE-ANDRA and Nogent-sur-Oise (high correlation for a distance above 230 km), both sites being located in highly impacted agricultural areas. This overall pattern suggests that the processes responsible for the atmospheric concentrations of SC present a spatial homogeneity over typical areas of at least several tens of kilometers.
Unlike SC, ambient air concentrations of sulfate (Fig. 3c) and ammonium (Fig. 3d), associated with long-range aerosol transport (Abdalmogith and Harrison, 2005; Amato et al., 2016; Coulibaly et al., 2015; Pindado and Perez, 2011; Waked et al., 2014), and levoglucosan (Fig. 3e), associated with biomass burning (Weber et al., 2019; Xiao et al., 2018), display stronger positive correlations (R> 0.72–0.98, p<0.01) at all pairs of sites considered in the present work. The concentrations of levoglucosan and those of SC clearly display very different annual atmospheric evolution cycles: i.e., higher concentrations of levoglucosan in France are observed in the coldest season (winter) due to the increased biomass burning, while those of SC are observed in warm seasons and coinciding with negligible ambient concentrations of levoglucosan (Fig. S3). Moreover, ambient concentrations of calcium (Fig. 3f), associated with local fugitive dust sources or/and long-range aerosol transport (Ram et al., 2010; Wan et al., 2019) display random correlation patterns. These results are in agreement with Zhu et al. (2018b), who also reported nonsignificant correlations between SC and sulfate in PM2.5 aerosols measured at Shanghai, China. The distinct spatial behaviors between sulfate (or Ca2+) and SC in the present work further suggest a dominant regional influence for atmospheric SC, as opposed to processes associated with either local sources for calcium or long-range transport for sulfate.
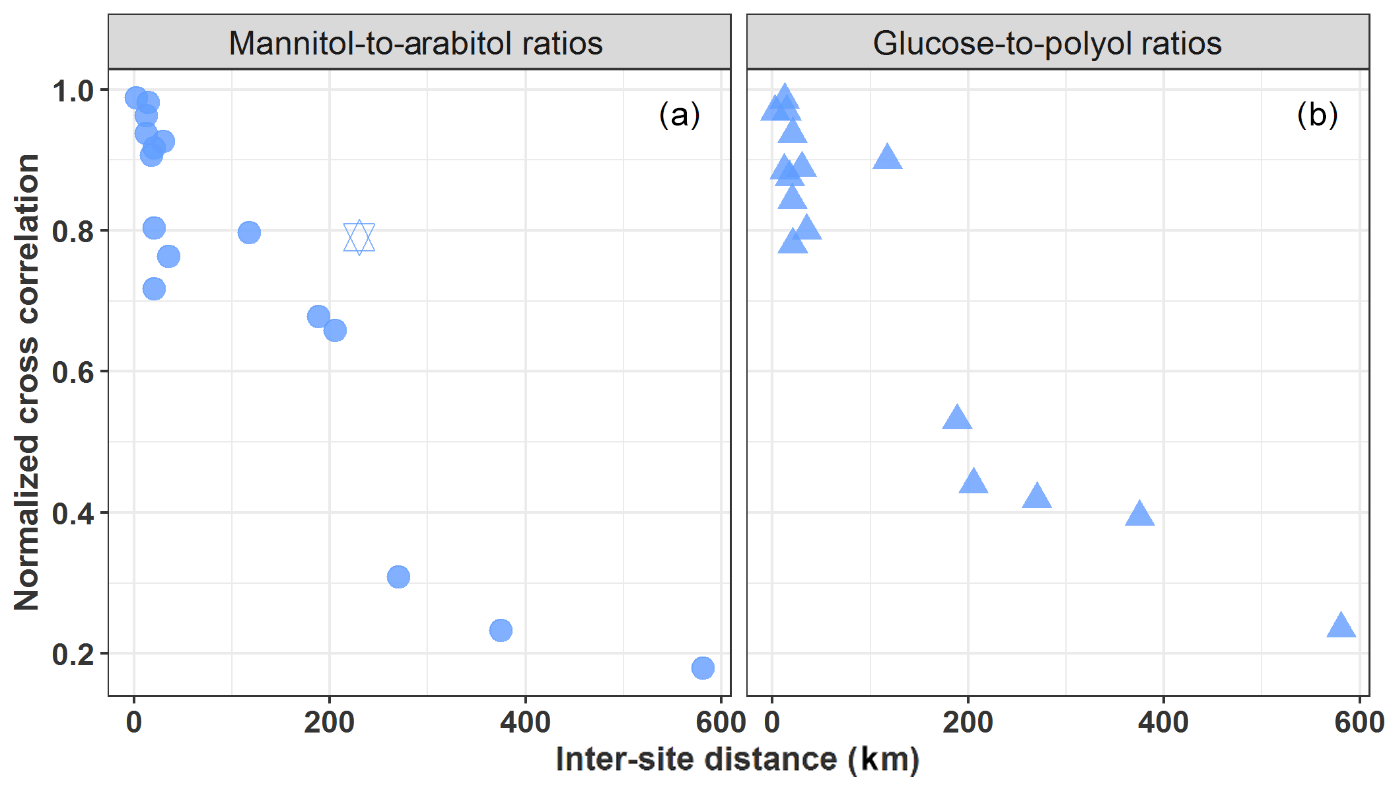
Figure 4Normalized cross-correlation values for daily evolution of particulate mannitol-to-arabitol (a) and glucose-to-polyols (b) ratios over pairs of sites located at multiple increasing space scales across France. The hexagram corresponds to the correlation between the sites of OPE-ANDRA and Nogent-sur-Oise, both sites being surrounded by crop field areas.
Mannitol and arabitol are well-known materials of fungal spores, serving as osmoregulatory solutes (Medeiros et al., 2006b; Simoneit et al., 2004; Verma et al., 2018; Xiao et al., 2018; Zhang et al., 2015). Based on parallel measurements of spore counts and PM10 polyol concentrations at three sites within the area of Vienna (Austria), Bauer et al. (2008) found an average arabitol and mannitol content per fungal spores of, respectively, 1.2 pg per spore (range 0.8–1.8 pg per spore) and 1.7 pg per spore (range 1.2–2.4 pg per spore). Mannitol and arabitol have also often been identified in the green algae and lower plants (Buiarelli et al., 2013; Di Filippo et al., 2013; Gosselin et al., 2016; Vélëz et al., 2007; Xu et al., 2018; Zhang et al., 2010). Gosselin et al. (2016) observed a relatively low (R2=0.31) to high (R2=0.84) coefficient of determination between mannitol and arabitol for total suspended particles (TSPs) collected at a pine-forested area during dry and rainy periods, respectively. High correlation in rainy periods possibly suggested that both chemical species in the TSP fraction in this pine-forested area could have been derived mainly from the same sources, i.e., actively wet-discharged ascospores and basidiospores, while the relatively poor correlation in dry periods could likely have been due to more complex sources (dry discharged spores, plants, algae, etc.). Being important chemical species for the metabolism of the microorganisms (Shcherbakova, 2007), it may well be that the concentration ratio of mannitol to arabitol could deliver some information on the spatial or temporal evolution of their emission processes (Gosselin et al., 2016). The annual average mannitol-to-arabitol ratio at all sites is about 1.15±0.59, with ratios for the warm period (June–September) being 1 to 2 times higher than those in the cold period (December–May) (Table S1). These ratios are within the range of those previously reported for PM10 aerosols collected at various urban and rural background sites in Europe (Bauer et al., 2008; Yttri et al., 2011b). Similarly, Burshtein et al. (2011) also reported comparable ratios for PM10 aerosols collected during autumn and winter from a Mediterranean region in Israel.
Similarly, the annual average glucose-to-polyols ratio at all sites is about 0.79±0.77. No literature data are currently available for comparison. Further work is needed to relate these variations with microorganism communities and plant growing stages.
However, as evidenced in Fig. 4, both mannitol-to-arabitol and glucose-to-polyols ratios show a clear distance-dependent correlation, with higher correlations (R=0.64 to 0.98, p<0.01) observed for pairs of sites within 150–190 km distance. This spatial consistency highlights once again that the dominant emission processes should be effective regionally, rather than being specific local input processes, and that atmospheric dynamics of the concentration levels (i.e., driven by the interplay of emission and removal processes) are determined by quite similar environmental factors (e.g., meteorological conditions, vegetation, land use) at such a regional scale. This implies that local events and phenomena, such as the mechanical resuspension of topsoil and associated biota (like bacteria, fungi, plant materials), might not be their major atmospheric input processes, particularly in urban background areas typically characterized by less bare soil and with a variable nature of the unpaved topsoil at the regional scale (Karimi et al., 2018). Furthermore, Karimi et al. (2018) also recently reported heterogeneous topsoil microbial structure within patches of 43 to 260 km across different regions of France. It follows that the hypotheses of emissions related to the mechanical resuspension of topsoil particles and associated biota or microbiota emitted actively from surface soil into the air generally assumed in most pioneering reports (Medeiros et al., 2006b; Rogge et al., 2007; Simoneit et al., 2004; Wan and Yu, 2007) are most probably not valid.
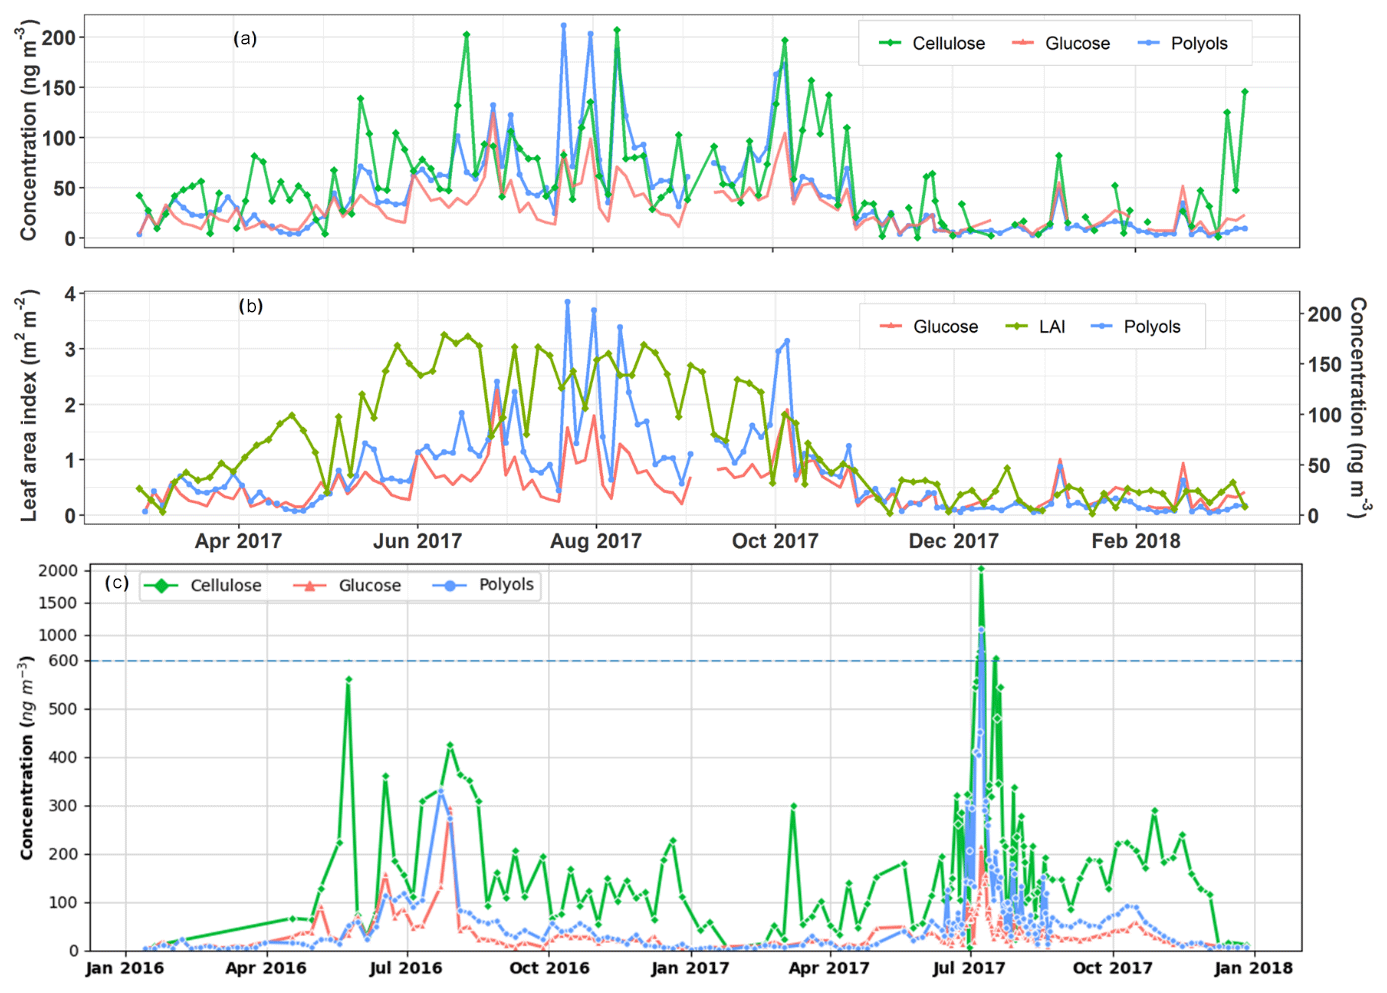
Figure 5Temporal covariation cycles of the daily particulate polyol and glucose concentrations along with vegetation indicators at the urban background site of Grenoble (a, b) and the rural agricultural background site of OPE-ANDRA (c). Note that PM10 aerosols are intensively collected at OPE-ANDRA every day (24 h) from 12 June to 22 August 2017 and that the concentration scale changes above 600 ng m−3 in (c) due to an extreme concentration peak in July 2017. The horizontal dashed line denotes this change in y axis scale.
Alternatively, the vegetation leaves have also been suggested as sources of atmospheric SCs (Bozzetti et al., 2016; Golly et al., 2018; Jia et al., 2010; Myriokefalitakis et al., 2017; Pashynska et al., 2002; Sullivan et al., 2011; Verma et al., 2018; Wan et al., 2019). In fact, vascular plant leaf surfaces is an important habitat for endophytic and epiphytic microbial communities (Kembel and Mueller, 2014; Lindow and Brandl, 2003; Lymperopoulou et al., 2016; Mhuireach et al., 2016; Whipps et al., 2008). Our results are more in agreement with a dominant atmosphere entrance process closely linked to vegetation, which is more homogeneous than topsoil at the climatic regional scale. Consistent with this, Sullivan et al. (2011) also observed evident distinct regional patterns for daily PM2.5 polyol and glucose concentrations at 10 urban and rural sites located in the upper Midwest (USA). The authors attributed such a spatial pattern to the differences in vegetation types and microbial diversity over distinct geographical regions. Accordingly, the vegetation structure and composition have previously been shown to play essential roles on airborne microbial variabilities in nearby areas (Bowers et al., 2011; Laforest-Lapointe et al., 2017; Lymperopoulou et al., 2016; Mhuireach et al., 2016).
3.3 Influence of the vegetation on polyol and glucose concentrations
The relationships between SC PM10 concentrations and vegetation (plant materials) can be examined at the site of Grenoble Les Frênes (Grenoble_LF) by comparing the annual evolutions of SC and the free atmospheric cellulose concentrations, together with LAI ones.
The daily ambient concentration levels of SC and cellulose range, respectively, from 5.0 to 301.9 ng m−3 (with an average of 41.2±39.9 ng m−3) and 0.7 to 207.2 ng m−3 (with an average of 52.9±44.2 ng m−3), which corresponds to, respectively, to 0.1 % to 6.6 % and 0.01 % to 5.3 % of total OM mass in PM10. These values are comparable to those previously reported for various sites in Europe (Daellenbach et al., 2017; Sánchez-Ochoa et al., 2007; Vlachou et al., 2018; Yttri et al., 2011b). Thus, a major part of PBOA could possibly be ascribed to cellulose and SC-derived sources.
As evidenced in Fig. 5a, ambient free cellulose concentrations vary seasonally, with maximum seasonal average values observed in summer (81.4±47.6 ng m−3) and autumn (64.2±49.2 ng m−3), followed by spring (52.6±37.8 ng m−3) and lower levels in winter (23.0±19.9 ng m−3). This is the same global pattern for polyols, which are also more abundant in summer (82.4±47.4 ng m−3) and autumn (48.7±41.6 ng m−3), followed by spring (24.9±16.3 ng m−3) and winter (10.2±9.6 ng m−3) in the Grenoble area. On a daily scale, the episodic increases or decreases in polyols in PM10 are very often well synchronized with that in cellulose (Fig. 5a). Moreover, the maximum atmospheric concentrations of polyols also mainly occur when the vegetation density (LAI) is at its highest in late summer (Fig. 5b). Similar global behaviors are also observed for atmospheric particulate glucose and LAI (Fig. 5a and b). To further assess the relationships between SC PM10 concentrations and vegetation in a rural area, a 2-year measurement of cellulose concentrations at the highly impacted agricultural rural site of OPE-ANDRA has been conducted. The average concentration of cellulose at OPE-ANDRA (197.9±217.8 ng m−3) is 3.5 times higher than that measured in the urban area of Grenoble. In terms of temporal dynamics, the evolution cycles (i.e., peaks and decreases) of both polyols and glucose are also very often well synchronized with that of cellulose at OPE-ANDRA (Fig. 5c).
Altogether, these findings highlight that SC in PM10 and cellulose in both urban background and rural agricultural areas most probably share a common source related to the vegetation. This is additional evidence in support of the hypothesis suggested in previous studies (Bozzetti et al., 2016; Burshtein et al., 2011; Daellenbach et al., 2017; Pashynska et al., 2002; Verma et al., 2018; Vlachou et al., 2018; Wan and Yu, 2007; Yttri et al., 2007). It is also in line with studies indicating that the PBOA source profile identified using offline aerosol mass spectrometry (offline-AMS) correlates very well with coarse cellulose concentrations (Bozzetti et al., 2016; Vlachou et al., 2018). A noticeable contribution of cellulose to PBOA mass (26 %) at the rural background site of Payerne (Switzerland), during summer 2012 and winter 2013, was reported by Bozzetti et al. (2016).
As also evidenced in Fig. 5, the cellulose concentration peaks are not systematically correlated to those of polyols. The development stage of the plants (developing or mature leaves, flowering plants) in addition to the metabolic activities of endophytic and epiphytic biota (growth, sporulation), all closely related to meteorological conditions (Bodenhausen et al., 2014; Bringel and Couée, 2015; Lindow and Brandl, 2003; Pirttilä and Frank, 2011; Reddy et al., 2017), could explain such observations. The influence of local meteorological conditions for an urban Alpine valley site is discussed in Sect. 3.4. Consistent with our observations, previous studies conducted at various urban background sites in Europe have suggested that particulate polyols are associated to mature plant leaves and microorganisms (bacterial and fungal spores), while glucose, which is a monomer of cellulose, would most likely be linked to the developing leaves (Bozzetti et al., 2016; Burshtein et al., 2011; Pashynska et al., 2002; Yttri et al., 2007; Zhu et al., 2015).
3.4 Influence of meteorological parameters on ambient concentrations of polyols and glucose
We used here a multiple linear regression analysis (MLR) approach to gain further insight into the environmental factors influencing the annual and short time variation cycles of atmospheric SC concentrations. This tentative MLR analysis is focused on the urban background site of Marnaz only since meteorological and other data are readily available for this site and are not influenced too much by some large city effects. Several variables were tested, which are already mentioned in the literature as drivers of SC concentrations. It includes the ambient relative humidity, rainfall level, wind speed, solar radiation, nighttime temperature, average (or maximum) temperature, and LAI. Nighttime temperature was selected since the time series in Marnaz and Grenoble indicate that the major drop in concentrations in late fall (Fig. 2c) is related to the first night of the season with nighttime temperature below 5 ∘C. The use of the night temperature is also consistent with the bimodal distribution of polyols during nighttime and daytime found in previous studies (Claeys et al., 2004; Graham et al., 2003; Yan et al., 2019; Yttri et al., 2011a).
Table 1Multiple linear regression for ambient polyol and glucose concentrations and their effective environmental factors at the Marnaz site. Contributions of predictor are normalized to sum 1. The “Relaimpo package under R” was used to compute bootstrap confidence intervals for the importance of effective predictors (n=1000) (Grömping, 2006).
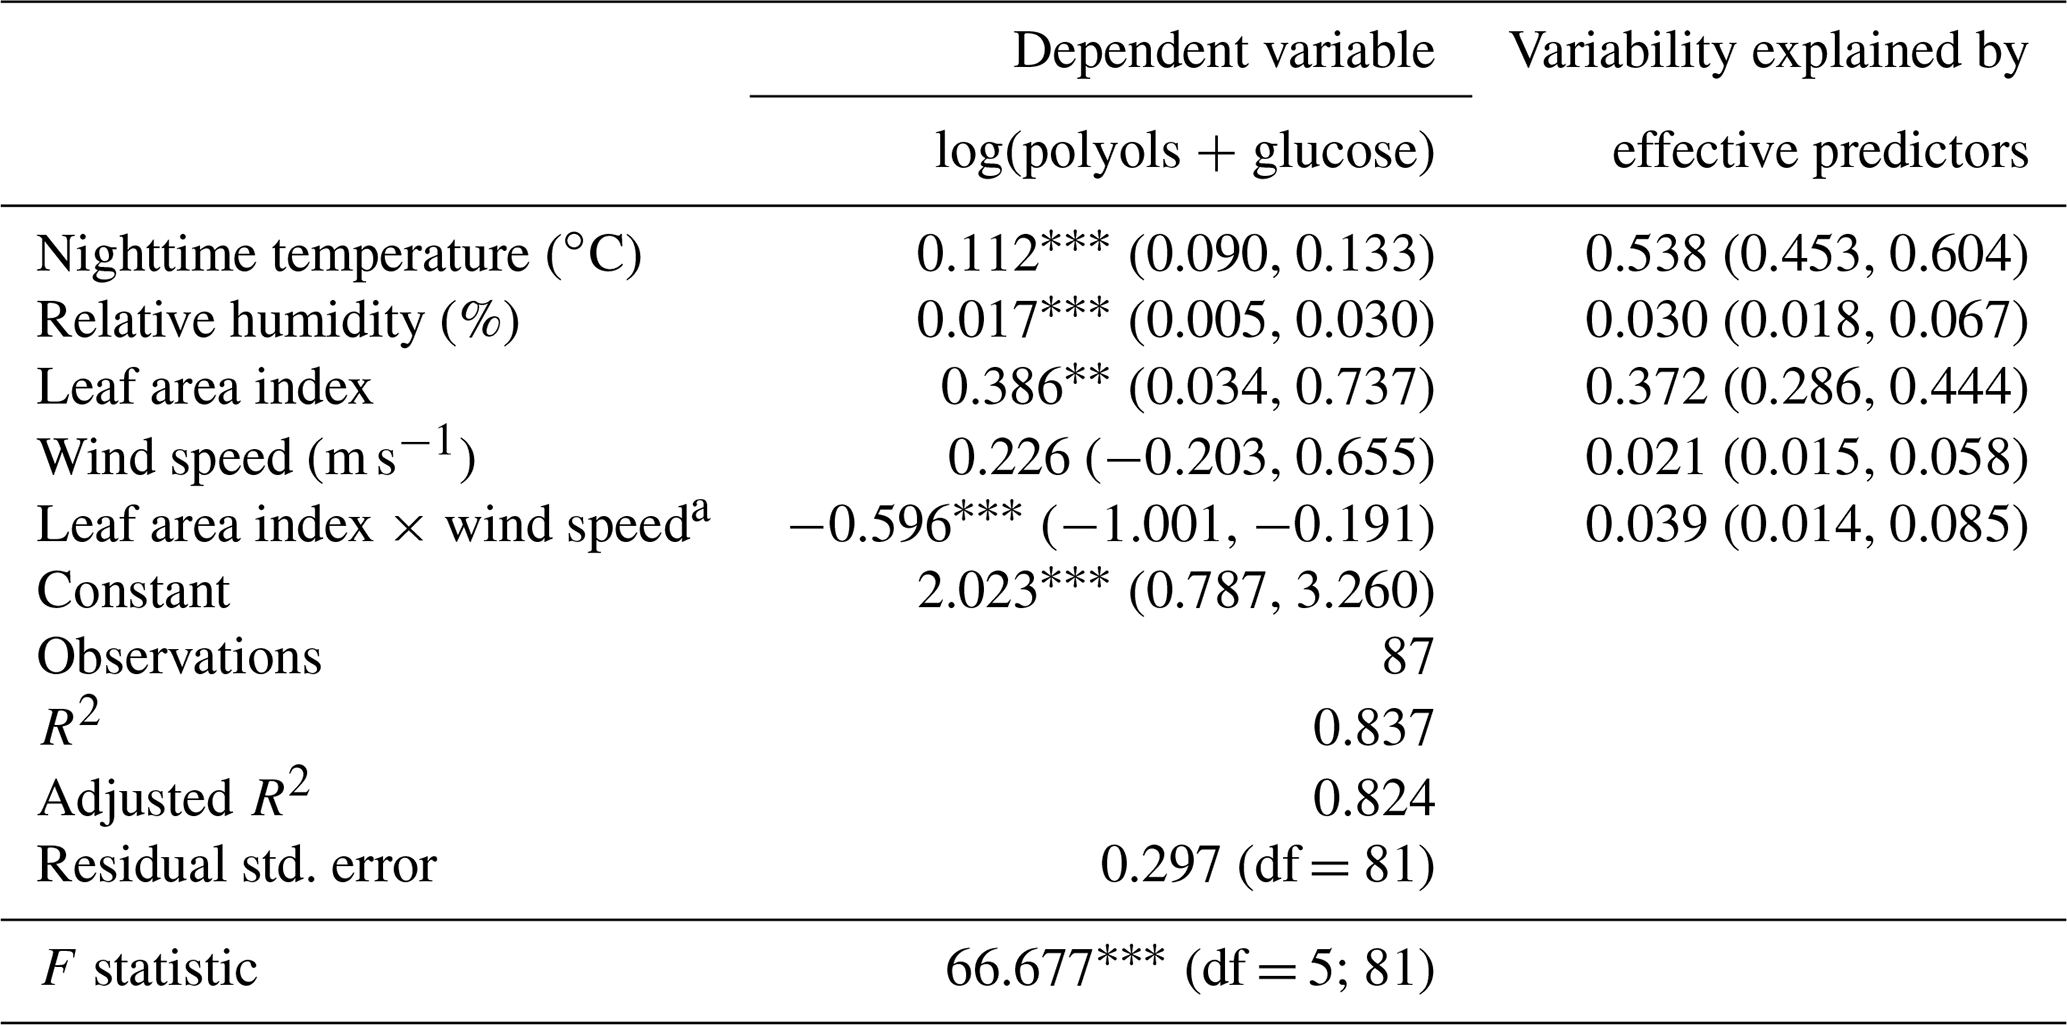
Note: ; ; a interaction between predictors.
Overall, the environmental factors including the mean nighttime temperature, relative humidity, wind speed, and the leaf area index explain up to 82 % (adjusted R2=0.82; see Table 1) of the annual temporal variation cycles of SC concentrations. The mean nighttime temperature and LAI contribute, respectively, 54 % and 37 % of the observed annual variabilities of SC concentrations. The atmospheric humidity is also a driver for these chemical species (3 % of the explained variation). These results are consistent with previous studies showing that concentrations of mannitol (in both PM10 and PM2.5 size fractions) linearly correlate best with the LAI, atmospheric water vapor, and temperature (Heald and Spracklen, 2009; Hummel et al., 2015; Myriokefalitakis et al., 2017). All of these drivers have been previously shown to induce the initial release and influence the long-term airborne microbial (i.e., bacteria, fungi) concentrations (China et al., 2016; Elbert et al., 2007; Grinn-Gofroń et al., 2019; Jones and Harrison, 2004; Rathnayake et al., 2017; Zhang et al., 2015).
Besides, the wind speed (range of 0.2 to 5.6 m s−1) seems an additional effective driver affecting the contribution of the local vegetation to SC concentrations in the atmosphere. Although enough air movement is required to passively release microorganisms along with plant debris into the atmosphere, strong air motions induce higher dispersion. These observations are in good agreement with those previously reported (Jones and Harrison, 2004; Liang et al., 2013; Zhang et al., 2010, 2015; Zhu et al., 2018b). For instance Liang et al. (2013) have found a negative correlation between wind speed and polyol concentrations, and the highest atmospheric fungal spores concentrations were observed for a wind speed range of 0.6 to 1.0 m s−1.
One of the limitations of this study is that 4 d averaged observations do not allow us to evaluate the driver contributions that might explain some short-term events for which the influence of meteorological parameters such as rainfall or solar radiation could also be significant (Grinn-Gofroń et al., 2019; Heald and Spracklen, 2009; Jones and Harrison, 2004). However, such simple parameterizations could be a first step in considering SC concentrations in chemical-transport models (CTMs), and further work is required in this direction in order to generate a robust parameterization of the emissions.
3.5 Specific case of a highly impacted agricultural area
This section focuses on evidencing the environmental drivers of PM10 SC concentrations specific to agricultural areas. To achieve this objective, the site of OPE-ANDRA was selected because it is extensively impacted by agricultural activities, without being too prone to influences by other sources. OPE-ANDRA is a specific rural background observatory located about 230 km east of Paris at an altitude of 392 m. It is characterized by a low population density (< 22 inhabitants km−2 within an area of 900 km2), with no surrounding major transport road or industrial activities. The air monitoring site itself lies in a “reference sector” of 240 km2, in the middle of a field crop area (tens of kilometers in all directions). The daily agricultural practices within this reference sector are recorded and made available by ANDRA. The parcels within the agricultural area are submitted to a 3-year crop-rotation system. The major crops are wheat, barley, rape, pea, and sunflower. Additionally, OPE-ANDRA is also characterized by a homogeneous type of soil, with a predominance of superficial clay limestone.
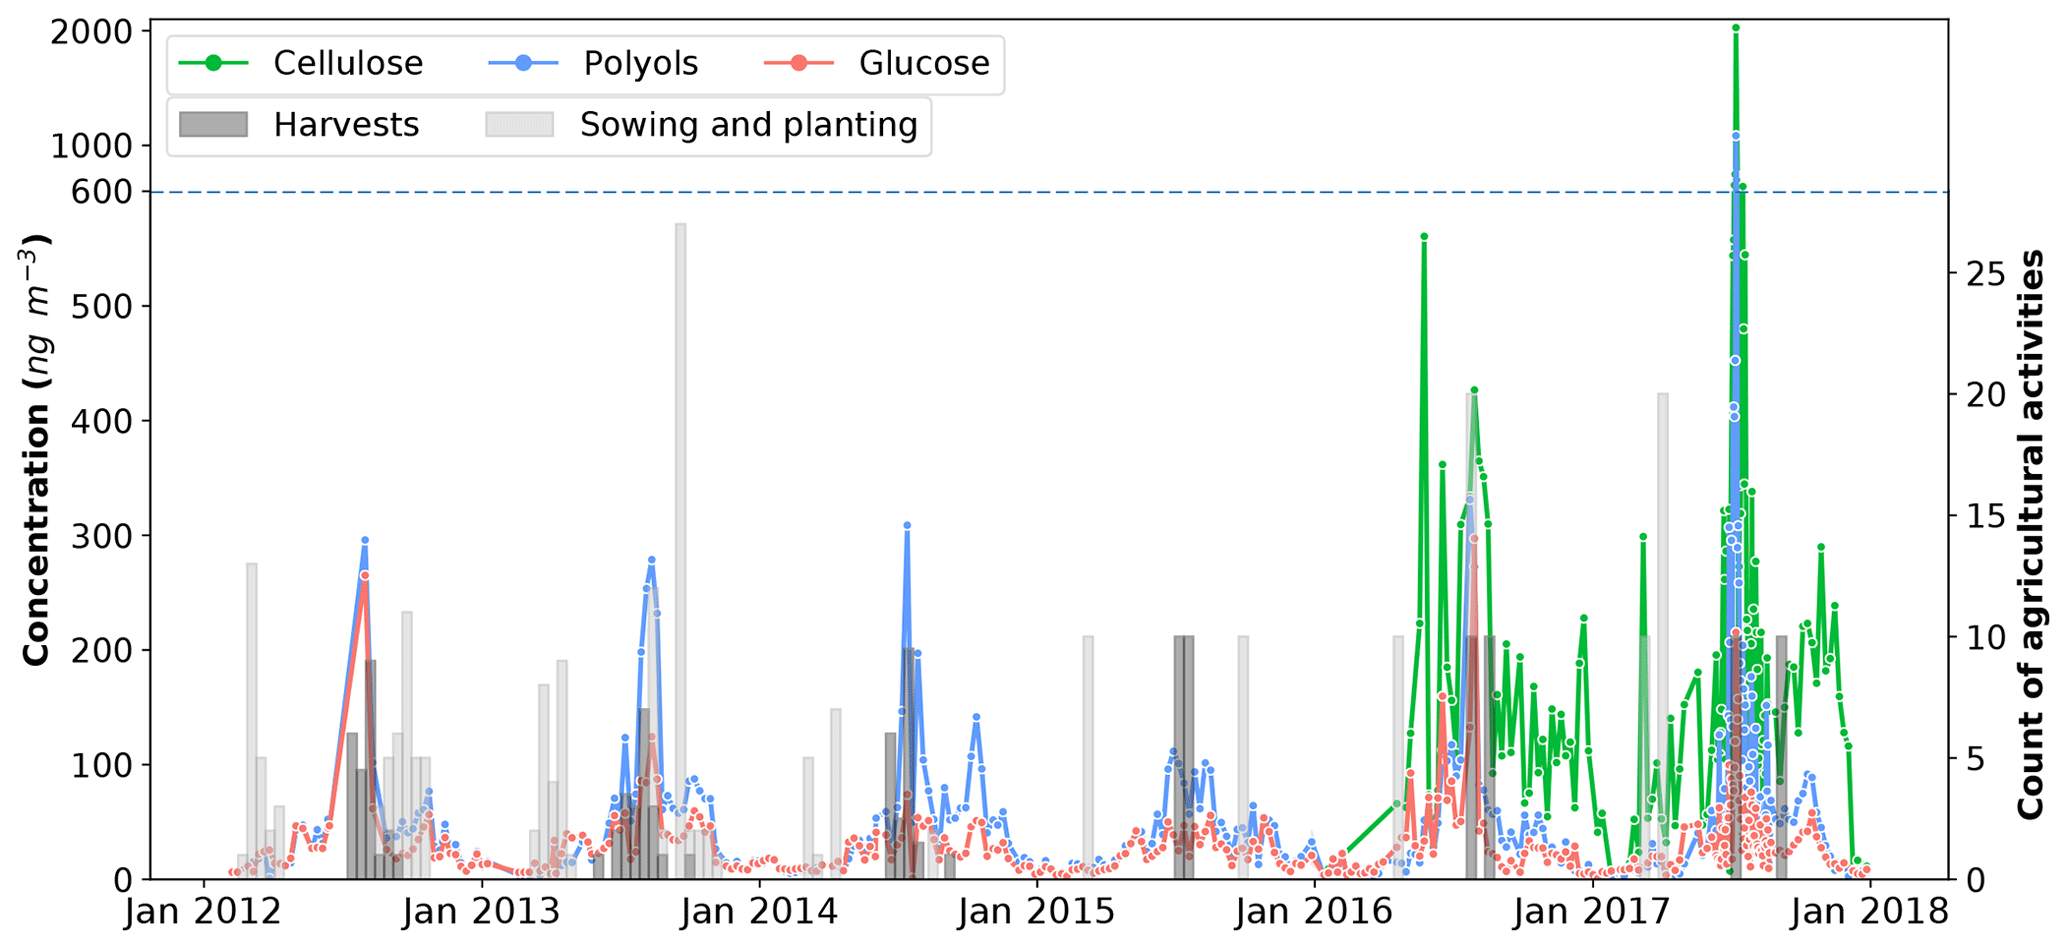
Figure 6Daily evolution cycles of polyol and glucose concentrations in aerosols collected from the OPE-ANDRA monitoring site, from 2012 to 2018. Cellulose concentrations were measured from January 2016 to January 2018. Colored bars correspond to the sum of the various agricultural practices performed (data for 69 parcels are averaged over 12 d for better clarity). Records of agricultural activities after October 2014 were available for only two parcels within the immediate vicinity of the PM10 sampler. Records are multiplied by 10 for this period.
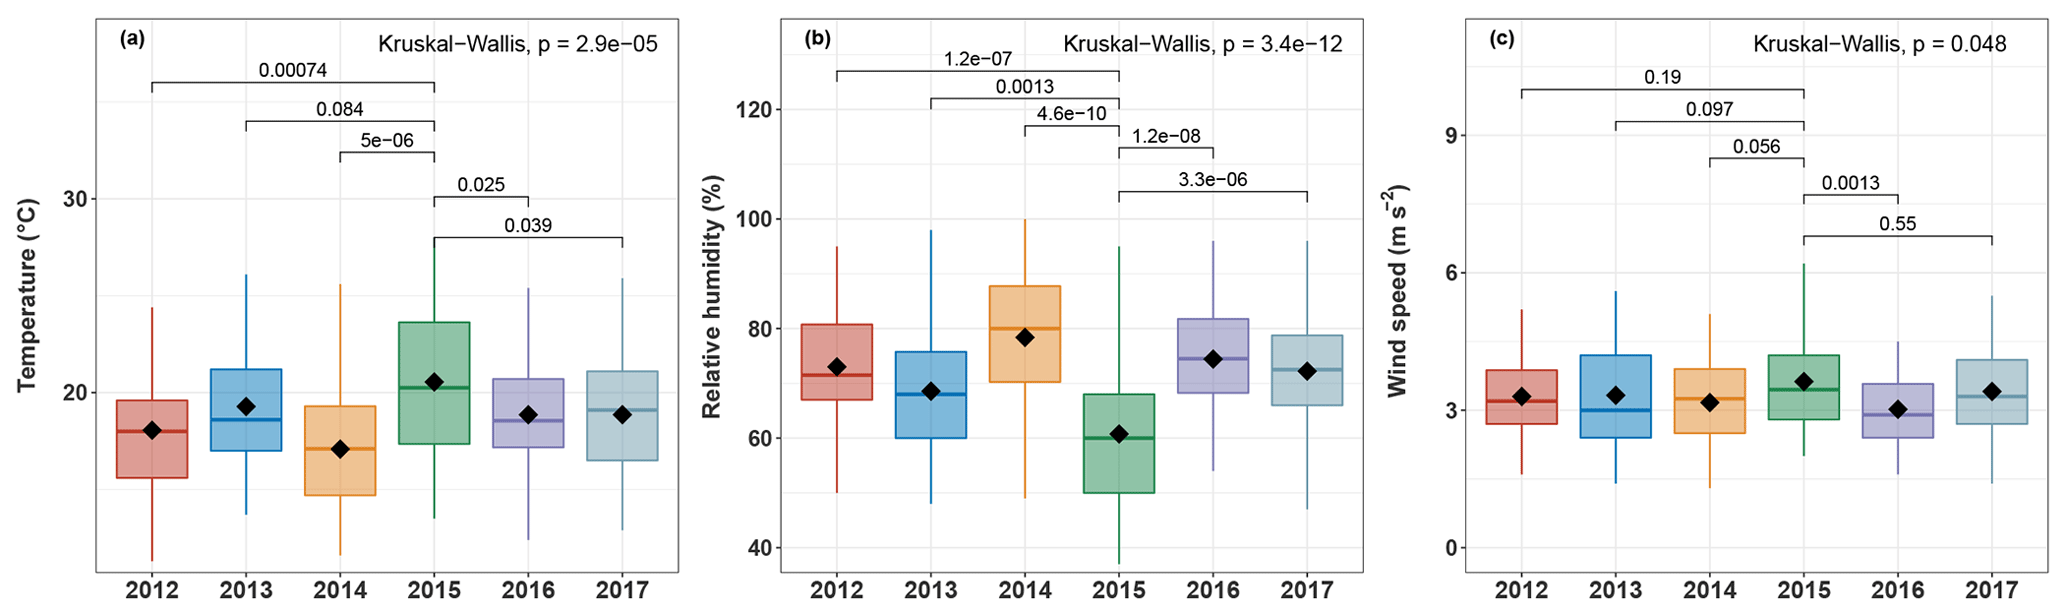
Figure 7Boxplots of (a) maximum ambient temperature, (b) relative humidity, and (c) wind speed at OPE-ANDRA from 2012 to 2017. Analyses are performed for warmer periods (June–November). Only statistically different meteorological factors are presented. The black marker inside each boxplot indicates the average value, while the top, middle, and bottom of the box represent the 75th, median, and 25th percentiles, respectively. The whiskers at the top and bottom of the box extend from the 95th to the 5th percentiles. Statistical differences between average values were assessed with the Kruskall–Wallis method (p<0.05).
Figure 6 shows the daily evolution of polyol concentrations in the PM10 fraction at OPE-ANDRA from 2012 to 2018, together with the agricultural activities recorded daily and averaged over 12 d.
Although the concentrations of polyols fluctuate from one year to another, they display clear annual variation cycles, with higher values in the warm periods (June–November) and lower concentration values in the cold periods (October–May). Interestingly, the annual concentrations of polyols in 2015 (4.2–111.7 ng m−3; annual average: 37.0±29.1 ng m−3) are significantly lower than those observed for the other years (0.6–1084.6 ng m−3; annual average: 62.9±96.8 ng m−3). Similar inter-annual evolution trends, but with variable intensities, are also observed for glucose concentrations (Fig. 6). The year 2015 was found to be particularly hot and dry at OPE-ANDRA (Fig. 7), whereas the locally averaged wind conditions are quite stable over the years within the period of study, suggesting that the wind conditions are not the main driver of the observed inter-annual variability. These results highlight that ambient air temperature and humidity are key meteorological drivers of the annual variation cycles of polyol and glucose concentrations. Hot and dry ambient air conditions may decrease the metabolic activity of the microorganisms (e.g., microbial growth and sporulation) (Fang et al., 2018; Liang et al., 2013; Meisner et al., 2018).
Finally, maximum ambient concentration levels for both SC and cellulose are observed in excellent temporal agreement with the harvest periods (late summer) at the OPE-ANDRA site (Fig. 6). Harvesting activities have been previously reported as the major sources for particulate polyols and glucose to the atmosphere in agricultural and nearby urbanized areas (Golly et al., 2018; Rogge et al., 2007; Simoneit et al., 2004). Hence, the resuspension of plant materials (crop detritus, leaves debris) and associated microbiota (e.g., bacteria, fungi) originating from cultivated lands is the most likely major input process of PM10 polyols and glucose at field crop sites.
The short-term temporal (daily) and spatial (local to nationwide) evolutions of particulate polyol (defined here as the sum of arabitol and mannitol) and glucose concentrations are rarely discussed in the current literature. The present work aimed at investigating the spatial behavior of these chemicals and evidencing their major effective environmental drivers. The major results mainly showed the following.
The short-term evolution of ambient polyol and glucose concentrations is highly synchronous across an urban city scale and remains very well correlated throughout the same geographic areas of France, even if the monitoring sites are situated in different cities about 150–190 km apart. However, sampling sites located in two distinct geographic areas are poorly correlated. This indicates that emission sources of these chemicals are uniformly distributed, and their accumulation and removal processes are driven by quite similar environmental parameters at the regional scale. Therefore, local phenomena, such as the atmospheric resuspension of topsoil particles and associated microbiota and microbial direct emissions (e.g., sporulation), cannot be the main emission processes of particulate polyols and glucose in urban areas not directly influenced by agricultural activities.
The atmospheric concentrations of polyols (or glucose) and cellulose display remarkably synchronous temporal evolution cycles at the background urban site of Grenoble, indicating a common source related to plant debris.
Higher ambient concentrations of polyols and glucose at the rural site of OPE-ANDRA occur during each harvest period, pointing out resuspension processes of plant materials (crop detritus, leaves debris) and associated microbiota for agricultural and nearby urbanized areas. This is associated with higher PM10 cellulose concentration levels, as high as 0.4 to 2.0 µg m−3 on a daily basis (accounting up to 7.5 % to 32.4 % of the OM mass).
Multiple linear regression analysis of the yearly series from the site of Marnaz gave insightful information on which parameter controls the ambient concentrations of polyols and glucose. Ambient air nighttime temperature, relative humidity, and vegetation density are the most important drivers, whilst wind speed conditions tend to affect the contribution of local vegetation.
Altogether, these results improve our understanding of the spatial behavior tracers of PM10 PBOA emission sources in France and in general, which is imperative for further implementation of this important mass fraction of OM into chemical transport models. Further investigations of the airborne microbial fingerprint (bacteria and fungi) are ongoing, which may deepen our understanding of the PBOA source profile.
All relevant data for this paper are archived at the IGE (Institut des Géosciences de l'Environnement), and are available upon request from the corresponding author (Jean-Luc Jaffrezo).
The supplement related to this article is available online at: https://doi.org/10.5194/acp-19-11013-2019-supplement.
JLJ was the (co-)supervisor for the PhDs for AS, FC, and SW and for the post-docs of DS, BG, and AW. He directed all the personnel who performed the analysis at IGE. He is the coordinator for the CNRS LEFE-EC2CO CAREMBIOS program that is funding the work of AS. GU and JMFM were the co-supervisor for the PhDs of AS and SW. EP, OF, and VR supervised the PhD of DMO, who investigated the sites in northern France. OF, JLJ, JLB, AA, and NM were the coordinators or partners of the different initial programs for the collection and chemical analysis of the samples. VJ developed the analytical techniques for polyol and cellulose measurements. TC performed the cellulose measurements. Sample analyses at LSCE were performed by NB. AC gave advice on the statistical aspects of the data processing. AS and JLJ processed the data and wrote up the paper. SW participated in the visualization of the results. SC supervises the OPE station and collected the agricultural activities records. All authors from AASQA (author affiliation nos. 9 to 16) are representatives of each network that conducted the sample collection and the general supervision of the sampling sites. All authors reviewed and commented on the paper.
The authors declare that they have no conflict of interest.
We would like to express special acknowledgement of Pierre Taberlet (LECA, Grenoble, France) for fruitful discussions about the importance of endophytic and epiphytic biota for aerobiology. The PhDs of Abdoulaye Samaké and Samuël Weber are funded by the Government of Mali and ENS Paris, respectively. We gratefully acknowledge the LEFE-CHAT and EC2CO programs of the CNRS for financial support of the CAREMBIOS multidisciplinary project and the LEFE-CHAT program for the MECEA project for the development of the atmospheric cellulose measurements. Samples were collected and analyzed within the framework of many different programs funded by ADEME, Primequal, the French Ministry of Environment, the CARA program led by the French Reference Laboratory for Air Quality Monitoring (LCSQA), ANDRA, and actions funded by many AASQAs and IMT Lille Douai (especially Labex CaPPA ANR-11-LABX-0005-01 and CPER CLIMIBIO projects). Analytical aspects were supported at IGE by the Air-O-Sol platform within Labex OSUG@2020 (ANR10 LABX56). We acknowledge the work of many engineers in the lab at IGE for the analyses (Aude Wack, Céline Charlet, Fany Donaz, Fany Masson, Sylvie Ngo, Vincent Lucaire, Claire Vérin, and Anthony Vella). Finally, the authors would like to kindly thank the dedicated efforts of many other people at the sampling sites and in the laboratories for collecting and analyzing the samples.
This research has been supported by the Centre National de la Recherche Scientifique (LEFE-CHAT and EC2CO programs: CAREMBIOS multidisciplinary project).
This paper was edited by Alex Huffman and reviewed by three anonymous referees.
Abdalmogith, S. S. and Harrison, R. M.: The use of trajectory cluster analysis to examine the long-range transport of secondary inorganic aerosol in the UK, Atmos. Environ., 39, 6686–6695, https://doi.org/10.1016/j.atmosenv.2005.07.059, 2005.
Amato, F., Alastuey, A., Karanasiou, A., Lucarelli, F., Nava, S., Calzolai, G., Severi, M., Becagli, S., Gianelle, V. L., Colombi, C., Alves, C., Custódio, D., Nunes, T., Cerqueira, M., Pio, C., Eleftheriadis, K., Diapouli, E., Reche, C., Minguillón, M. C., Manousakas, M.-I., Maggos, T., Vratolis, S., Harrison, R. M., and Querol, X.: AIRUSE-LIFE+: a harmonized PM speciation and source apportionment in five southern European cities, Atmos. Chem. Phys., 16, 3289–3309, https://doi.org/10.5194/acp-16-3289-2016, 2016.
Amato, P., Brisebois, E., Draghi, M., Duchaine, C., Fröhlich-Nowoisky, J., Huffman, J. A., Mainelis, G., Robine, E., and Thibaudon, M.: Main biological aerosols, specificities, abundance, and diversity, in Microbiology of Aerosols, John Wiley & Sons, Ltd., 1–21, https://doi.org/10.1002/9781119132318, 2017.
Ariya, P. A., Sun, J., Eltouny, N. A., Hudson, E. D., Hayes, C. T., and Kos, G.: Physical and chemical characterization of bioaerosols – implications for nucleation processes, Int. Rev. Phys. Chem., 28, 1–32, https://doi.org/10.1080/01442350802597438, 2009.
Barbaro, E., Kirchgeorg, T., Zangrando, R., Vecchiato, M., Piazza, R., Barbante, C., and Gambaro, A.: Sugars in Antarctic aerosol, Atmos. Environ., 118, 135–144, https://doi.org/10.1016/j.atmosenv.2015.07.047, 2015.
Bardal, L. M. and Sætran, L. R.: Spatial correlation of atmospheric wind at scales relevant for large scale wind turbines, J. Phys. Conf. Ser., 753, 032033, https://doi.org/10.1088/1742-6596/753/3/032033, 2016.
Bauer, H., Claeys, M., Vermeylen, R., Schueller, E., Weinke, G., Berger, A., and Puxbaum, H.: Arabitol and mannitol as tracers for the quantification of airborne fungal spores, Atmos. Environ., 42, 588–593, https://doi.org/10.1016/j.atmosenv.2007.10.013, 2008.
Bodenhausen, N., Bortfeld-Miller, M., Ackermann, M., and Vorholt, J. A.: A synthetic community approach reveals plant genotypes affecting the phyllosphere microbiota, PLoS Genet., 10, e1004283, https://doi.org/10.1371/journal.pgen.1004283, 2014.
Bowers, R. M., Sullivan, A. P., Costello, E. K., Collett, J. L., Knight, R., and Fiereri, N.: Sources of bacteria in outdoor air across cities in the midwestern United States., Appl. Environ. Microbiol., 77, 6350–6356, https://doi.org/10.1128/AEM.05498-11, 2011.
Bozzetti, C., Daellenbach, K. R., Hueglin, C., Fermo, P., Sciare, J., Kasper-Giebl, A., Mazar, Y., Abbaszade, G., El Kazzi, M., Gonzalez, R., Shuster-Meiseles, T., Flasch, M., Wolf, R., Křepelová, A., Canonaco, F., Schnelle-Kreis, J., Slowik, J. G., Zimmermann, R., Rudich, Y., Baltensperger, U., El Haddad, I., and Prévôt, A. S. H.: Size-resolved identification, characterization, and quantification of primary biological organic aerosol at a European rural site, Environ. Sci. Technol., 50, 3425–3434, https://doi.org/10.1021/acs.est.5b05960, 2016.
Bringel, F. and Couée, I.: Pivotal roles of phyllosphere microorganisms at the interface between plant functioning and atmospheric trace gas dynamics, Front. Microbiol., 6, 486, https://doi.org/10.3389/fmicb.2015.00486, 2015.
Buiarelli, F., Canepari, S., Di Filippo, P., Perrino, C., Pomata, D., Riccardi, C., and Speziale, R.: Extraction and analysis of fungal spore biomarkers in atmospheric bioaerosol by HPLC–MS–MS and GC–MS, Talanta, 105, 142–151, https://doi.org/10.1016/j.talanta.2012.11.006, 2013.
Burshtein, N., Lang-Yona, N., and Rudich, Y.: Ergosterol, arabitol and mannitol as tracers for biogenic aerosols in the eastern Mediterranean, Atmos. Chem. Phys., 11, 829–839, https://doi.org/10.5194/acp-11-829-2011, 2011.
Chen, J., Kawamura, K., Liu, C.-Q., and Fu, P.: Long-term observations of saccharides in remote marine aerosols from the western North Pacific: A comparison between 1990–1993 and 2006–2009 periods, Atmos. Environ., 67, 448–458, https://doi.org/10.1016/j.atmosenv.2012.11.014, 2013.
China, S., Wang, B., Weis, J., Rizzo, L., Brito, J., Cirino, G. G., Kovarik, L., Artaxo, P., Gilles, M. K., and Laskin, A.: Rupturing of biological spores as a source of secondary particles in Amazonia, Environ. Sci. Technol., 50, 12179–12186, 2016.
China, S., Burrows, S. M., Wang, B., Harder, T. H., Weis, J., Tanarhte, M., Rizzo, L. V., Brito, J., Cirino, G. G., Ma, P.-L., Cliff, J., Artaxo, P., Gilles, M. K., and Laskin, A.: Fungal spores as a source of sodium salt particles in the Amazon basin, Nat. Commun., 9, 4793, https://doi.org/10.1038/s41467-018-07066-4, 2018.
Claeys, M., Graham, B., Vas, G., Wang, W., Vermeylen, R., Pashynska, V., Cafmeyer, J., Guyon, P., Andreae, M. O., Artaxo, P., and Maenhaut, W.: Formation of secondary organic aerosols through photooxidation of isoprene, Science, 303, 1173, https://doi.org/10.1126/science.1092805, 2004.
Coulibaly, S., Minami, H., Abe, M., Hasei, T., Sera, N., Yamamoto, S., Funasaka, K., Asakawa, D., Watanabe, M., Honda, N., Wakabayashi, K., and Watanabe, T.: Seasonal fluctuations in air pollution in Dazaifu, Japan, and effect of long-range transport from mainland east Asia, Biol. Pharm. Bull., 38, 1395–1403, https://doi.org/10.1248/bpb.b15-00443, 2015.
Coz, E., Artíñano, B., Clark, L. M., Hernandez, M., Robinson, A. L., Casuccio, G. S., Lersch, T. L., and Pandis, S. N.: Characterization of fine primary biogenic organic aerosol in an urban area in the northeastern United States, Atmos. Environ., 44, 3952–3962, 2010.
Daellenbach, K. R., Stefenelli, G., Bozzetti, C., Vlachou, A., Fermo, P., Gonzalez, R., Piazzalunga, A., Colombi, C., Canonaco, F., Hueglin, C., Kasper-Giebl, A., Jaffrezo, J.-L., Bianchi, F., Slowik, J. G., Baltensperger, U., El-Haddad, I., and Prévôt, A. S. H.: Long-term chemical analysis and organic aerosol source apportionment at nine sites in central Europe: source identification and uncertainty assessment, Atmos. Chem. Phys., 17, 13265–13282, https://doi.org/10.5194/acp-17-13265-2017, 2017.
Dai, Y.-H. and Zhou, W.-X.: Temporal and spatial correlation patterns of air pollutants in Chinese cities, PLoS ONE, 12, e0182724, https://doi.org/10.1371/journal.pone.0182724, 2017.
Després, V. R., Alex Huffman, J., Burrows, S. M., Hoose, C., Safatov, A. S., Buryak, G., Fröhlich-Nowoisky, J., Elbert, W., Andreae, M. O., Pöschl, U., and Jaenicke, R.: Primary biological aerosol particles in the atmosphere: a review, Tellus B, 64, 15598, https://doi.org/10.3402/tellusb.v64i0.15598, 2012.
Di Filippo, P., Pomata, D., Riccardi, C., Buiarelli, F., and Perrino, C.: Fungal contribution to size-segregated aerosol measured through biomarkers, Atmos. Environ., 64, 132–140, 2013.
Eisner, A. D., Richmond-Bryant, J., Hahn, I., Drake-Richman, Z. E., Brixey, L. A., Wiener, R. W., and Ellenson, W. D.: Analysis of indoor air pollution trends and characterization of infiltration delay time using a cross-correlation method, J. Environ. Monit., 11, 2201, https://doi.org/10.1039/b907144j, 2009.
Elbert, W., Taylor, P. E., Andreae, M. O., and Pöschl, U.: Contribution of fungi to primary biogenic aerosols in the atmosphere: wet and dry discharged spores, carbohydrates, and inorganic ions, Atmos. Chem. Phys., 7, 4569–4588, https://doi.org/10.5194/acp-7-4569-2007, 2007.
Fang, Z., Guo, W., Zhang, J., and Lou, X.: Influence of heat Events on the composition of airborne bacterial communities in urban ecosystems, Int. J. Environ. Res. Public. Health, 15, 2295, https://doi.org/10.3390/ijerph15102295, 2018.
Fröhlich-Nowoisky, J., Pickersgill, D. A., Després, V. R., and Pöschl, U.: High diversity of fungi in air particulate matter, P. Natl. Acad. Sci. USA, 106(31), 12814–12819, https://doi.org/10.1073/pnas.0811003106, 2009.
Fröhlich-Nowoisky, J., Kampf, C. J., Weber, B., Huffman, J. A., Pöhlker, C., Andreae, M. O., Lang-Yona, N., Burrows, S. M., Gunthe, S. S., Elbert, W., Su, H., Hoor, P., Thines, E., Hoffmann, T., Després, V. R., and Pöschl, U.: Bioaerosols in the earth system: climate, health, and ecosystem interactions, Atmos. Res., 182, 346–376, https://doi.org/10.1016/j.atmosres.2016.07.018, 2016.
Fröhlich-Nowoisky, J., Amato, P., Renard, P., Brisebois, E., and Duchaine, C.: Quantification and characterization of bioaerosols (offline techniques), in: Microbiology of Aerosols, John Wiley & Sons, Ltd., 49–82, https://doi.org/10.1002/9781119132318, 2017.
Glasius, M., Hansen, A. M. K., Claeys, M., Henzing, J. S., Jedynska, A. D., Kasper-Giebl, A., Kistler, M., Kristensen, K., Martinsson, J., Maenhaut, W., Nøjgaard, J. K., Spindler, G., Stenström, K. E., Swietlicki, E., Szidat, S., Simpson, D., and Yttri, K. E.: Composition and sources of carbonaceous aerosols in northern Europe during winter, Atmos. Environ., 173, 127–141, https://doi.org/10.1016/j.atmosenv.2017.11.005, 2018.
Golly, B., Waked, A., Weber, S., Samaké, A., Jacob, V., Conil, S., Rangognio, J., Chrétien, E., Vagnot, M.-P., Robic, P.-Y., Besombes, J.-L., and Jaffrezo, J.-L.: Organic markers and OC source apportionment for seasonal variations of PM2.5 at 5 rural sites in France, Atmos. Environ., 198, 142–157, https://doi.org/10.1016/j.atmosenv.2018.10.027, 2018.
Gosselin, M. I., Rathnayake, C. M., Crawford, I., Pöhlker, C., Fröhlich-Nowoisky, J., Schmer, B., Després, V. R., Engling, G., Gallagher, M., Stone, E., Pöschl, U., and Huffman, J. A.: Fluorescent bioaerosol particle, molecular tracer, and fungal spore concentrations during dry and rainy periods in a semi-arid forest, Atmos. Chem. Phys., 16, 15165–15184, https://doi.org/10.5194/acp-16-15165-2016, 2016.
Graham, B., Guyon, P., Taylor, P. E., Artaxo, P., Maenhaut, W., Glovsky, M. M., Flagan, R. C., and Andreae, M. O.: Organic compounds present in the natural Amazonian aerosol: Characterization by gas chromatography-mass spectrometry: organic compounds in Amazonian aerosols., J. Geophys. Res.-Atmos., 108, 4766, https://doi.org/10.1029/2003JD003990, 2003.
Grinn-Gofroń, A., Nowosad, J., Bosiacka, B., Camacho, I., Pashley, C., Belmonte, J., De Linares, C., Ianovici, N., Manzano, J. M. M., Sadyś, M., Skjøth, C., Rodinkova, V., Tormo-Molina, R., Vokou, D., Fernández-Rodríguez, S., and Damialis, A.: Airborne alternaria and Cladosporium fungal spores in Europe: forecasting possibilities and relationships with meteorological parameters, Sci. Total Environ., 653, 938–946, https://doi.org/10.1016/j.scitotenv.2018.10.419, 2019.
Grömping, U.: Relative importance for linear regression in R: the package relaimpo, J. Stat. Softw., 17, 1–27, https://doi.org/10.18637/jss.v017.i01, 2006.
Heald, C. L. and Spracklen, D. V.: Atmospheric budget of primary biological aerosol particles from fungal spores, Geophys. Res. Lett., 36, L09806, https://doi.org/10.1029/2009GL037493, 2009.
Hill, T. C. J., DeMott, P. J., Conen, F., and Möhler, O.: Impacts of bioaerosols on atmospheric ice nucleation processes, in Microbiology of Aerosols, John Wiley & Sons, Ltd., 195–219, https://doi.org/10.1002/9781119132318, 2017.
Hiranuma, N., Adachi, K., Bell, D. M., Belosi, F., Beydoun, H., Bhaduri, B., Bingemer, H., Budke, C., Clemen, H.-C., Conen, F., Cory, K. M., Curtius, J., DeMott, P. J., Eppers, O., Grawe, S., Hartmann, S., Hoffmann, N., Höhler, K., Jantsch, E., Kiselev, A., Koop, T., Kulkarni, G., Mayer, A., Murakami, M., Murray, B. J., Nicosia, A., Petters, M. D., Piazza, M., Polen, M., Reicher, N., Rudich, Y., Saito, A., Santachiara, G., Schiebel, T., Schill, G. P., Schneider, J., Segev, L., Stopelli, E., Sullivan, R. C., Suski, K., Szakáll, M., Tajiri, T., Taylor, H., Tobo, Y., Ullrich, R., Weber, D., Wex, H., Whale, T. F., Whiteside, C. L., Yamashita, K., Zelenyuk, A., and Möhler, O.: A comprehensive characterization of ice nucleation by three different types of cellulose particles immersed in water, Atmos. Chem. Phys., 19, 4823–4849, https://doi.org/10.5194/acp-19-4823-2019, 2019.
Holden, A. S., Sullivan, A. P., Munchak, L. A., Kreidenweis, S. M., Schichtel, B. A., Malm, W. C., and Collett, J. L.: Determining contributions of biomass burning and other sources to fine particle contemporary carbon in the western United States, Atmos. Environ., 45, 1986–1993, https://doi.org/10.1016/j.atmosenv.2011.01.021, 2011.
Huffman, J. A. and Santarpia, J.: Online Techniques for quantification and characterization of biological aerosols, in Microbiology of Aerosols, John Wiley & Sons, Ltd., 83–114, https://doi.org/10.1002/9781119132318, 2017.
Humbal, C., Gautam, S., and Trivedi, U.: A review on recent progress in observations, and health effects of bioaerosols, Environ. Int., 118, 189–193, https://doi.org/10.1016/j.envint.2018.05.053, 2018.
Hummel, M., Hoose, C., Gallagher, M., Healy, D. A., Huffman, J. A., O'Connor, D., Pöschl, U., Pöhlker, C., Robinson, N. H., Schnaiter, M., Sodeau, J. R., Stengel, M., Toprak, E., and Vogel, H.: Regional-scale simulations of fungal spore aerosols using an emission parameterization adapted to local measurements of fluorescent biological aerosol particles, Atmos. Chem. Phys., 15, 6127–6146, https://doi.org/10.5194/acp-15-6127-2015, 2015.
Jacobson, M. Z. and Streets, D. G.: Influence of future anthropogenic emissions on climate, natural emissions, and air quality, J. Geophys. Res., 114, D08118, https://doi.org/10.1029/2008JD011476, 2009.
Jaenicke, R.: Abundance of cellular material and proteins in the atmosphere, Science, 308, 73–73, https://doi.org/10.1126/science.1106335, 2005.
Jia, Y., Bhat, S., and Fraser, M. P.: Characterization of saccharides and other organic compounds in fine particles and the use of saccharides to track primary biologically derived carbon sources, Atmos. Environ., 44, 724–732, https://doi.org/10.1021/es103104e, 2010.
Jia, Y., Bhat, S., and Fraser, M. P.: Characterization of saccharides and other organic compounds in fine particles and the use of saccharides to track primary biologically derived carbon sources, Atmos. Environ., 44, 724–732, https://doi.org/10.1021/es103104e, 2011.
Jones, A. M. and Harrison, R. M.: The effects of meteorological factors on atmospheric bioaerosol concentrations – a review, Sci. Total Environ., 326, 151–180, https://doi.org/10.1016/j.scitotenv.2003.11.021, 2004.
Kang, M., Ren, L., Ren, H., Zhao, Y., Kawamura, K., Zhang, H., Wei, L., Sun, Y., Wang, Z., and Fu, P.: Primary biogenic and anthropogenic sources of organic aerosols in Beijing, China: Insights from saccharides and n-alkanes, Environ. Pollut., 243, 1579–1587, https://doi.org/10.1016/j.envpol.2018.09.118, 2018.
Karimi, B., Terrat, S., Dequiedt, S., Saby, N. P. A., Horrigue, W., Lelièvre, M., Nowak, V., Jolivet, C., Arrouays, D., Wincker, P., Cruaud, C., Bispo, A., Maron, P.-A., Bouré, N. C. P., and Ranjard, L.: Biogeography of soil bacteria and archaea across France, Sci. Adv., 4, eaat1808, https://doi.org/10.1126/sciadv.aat1808, 2018.
Kaso, A.: Computation of the normalized cross-correlation by fast Fourier transform, PLOS ONE, 13, e0203434, https://doi.org/10.1371/journal.pone.0203434, 2018.
Kembel, S. W. and Mueller, R. C.: Plant traits and taxonomy drive host associations in tropical phyllosphere fungal communities, Botany, 92, 303–311, https://doi.org/10.1139/cjb-2013-0194, 2014.
Kunit, M. and Puxbaum, H.: Enzymatic determination of the cellulose content of atmospheric aerosols, Atmos. Environ., 30, 1233–1236, https://doi.org/10.1016/1352-2310(95)00429-7, 1996.
Laforest-Lapointe, I., Messier, C., and Kembel, S. W.: Tree leaf bacterial community structure and diversity differ along a gradient of urban intensity, mSystems, 2, e00087-17, https://doi.org/10.1128/mSystems.00087-17, 2017.
Lainer, M., Hocke, K., and Kämpfer, N.: Variability of mesospheric water vapor above Bern in relation to the 27-day solar rotation cycle, J. Atmos. Sol.-Terr. Phys., 143–144, 71–87, https://doi.org/10.1016/j.jastp.2016.03.008, 2016.
Le Pichon, A., Blanc, E., and Hauchecorne, A.: Infrasound monitoring for atmospheric studies, 2nd edn., Springer International Publishing, Switzerland, https://doi.org/10.1007/978-3-319-75140-5,2019.
Lecours, P. B., Duchaine, C., Thibaudon, M., and Marsolais, D.: Health impacts of bioaerosol exposure, in Microbiology of Aerosols, John Wiley & Sons, Ltd., 249–268, https://doi.org/10.1002/9781119132318, 2017.
Li, L., Ren, L., Ren, H., Yue, S., Xie, Q., Zhao, W., Kang, M., Li, J., Wang, Z., Sun, Y., and Fu, P.: Molecular characterization and seasonal variation in primary and secondary organic aerosols in Beijing, China, J. Geophys. Res.-Atmos., 123, 12394–12412, https://doi.org/10.1029/2018JD028527, 2018.
Liang, L., Engling, G., He, K., Du, Z., Cheng, Y., and Duan, F.: Evaluation of fungal spore characteristics in Beijing, China, based on molecular tracer measurements, Environ. Res. Lett., 8, 014005, https://doi.org/10.1088/1748-9326/8/1/014005, 2013.
Lindow, S. E. and Brandl, M. T.: Microbiology of the Phyllosphere, Appl. Environ. Microbiol., 69, 1875–1883, https://doi.org/10.1128/AEM.69.4.1875-1883.2003, 2003.
Lymperopoulou, D. S., Adams, R. I., and Lindow, S. E.: Contribution of vegetation to the microbial composition of nearby outdoor air, Appl. Environ. Microbiol., 82, 3822–3833, https://doi.org/10.1128/AEM.00610-16, 2016.
Manninen, H. E., Bäck, J., Sihto-Nissilä, S.-L., Huffman, J. A., Pessi, A.-M., Hiltunen, V., Aalto, P. P., Hidalgo Fernández, P. J., Hari, P., Saarto, A., Kulmala, M., and Petäjä, T.: Patterns in airborne pollen and other primary biological aerosol particles (PBAP), and their contribution to aerosol mass and number in a boreal forest, Boreal Environ. Res., 383–405, 2014.
Martin, S. T., Andreae, M. O., Artaxo, P., Baumgardner, D., Chen, Q., Goldstein, A. H., Guenther, A., Heald, C. L., Mayol-Bracero, O. L., McMurry, P. H., Pauliquevis, T., Pöschl, U., Prather, K. A., Roberts, G. C., Saleska, S. R., Silva Dias, M. A., Spracklen, D. V., Swietlicki, E., and Trebs, I.: Sources and properties of Amazonian aerosol particles, Rev. Geophys., 48, RG2002, https://doi.org/10.1029/2008RG000280, 2010.
Medeiros, P. M., Fernandes, M. F., Dick, R. P., and Simoneit, B. R. T.: Seasonal variations in sugar contents and microbial community in a ryegrass soil, Chemosphere, 65, 832–839, https://doi.org/10.1016/j.chemosphere.2006.03.025, 2006a.
Medeiros, P. M., Conte, M. H., Weber, J. C., and Simoneit, B. R. T.: Sugars as source indicators of biogenic organic carbon in aerosols collected above the Howland Experimental Forest, Maine, Atmos. Environ., 40, 1694–1705, 2006b.
Meisner, A., Jacquiod, S., Snoek, B. L., ten Hooven, F. C., and van der Putten, W. H.: Drought legacy effects on the composition of soil fungal and prokaryote communities, Front. Microbiol., 9, 294, https://doi.org/10.3389/fmicb.2018.00294, 2018.
Mhuireach, G., Johnson, B. R., Altrichter, A. E., Ladau, J., Meadow, J. F., Pollard, K. S., and Green, J. L.: Urban greenness influences airborne bacterial community composition, Sci. Total Environ., 571, 680–687, https://doi.org/10.1016/j.scitotenv.2016.07.037, 2016.
Morris, C. E., Sands, D. C., Bardin, M., Jaenicke, R., Vogel, B., Leyronas, C., Ariya, P. A., and Psenner, R.: Microbiology and atmospheric processes: research challenges concerning the impact of airborne micro-organisms on the atmosphere and climate, Biogeosciences, 8, 17–25, https://doi.org/10.5194/bg-8-17-2011, 2011.
Morris, C. E., Conen, F., Alex Huffman, J., Phillips, V., Pöschl, U., and Sands, D. C.: Bioprecipitation: a feedback cycle linking Earth history, ecosystem dynamics and land use through biological ice nucleators in the atmosphere, Glob. Change Biol., 20, 341–351, https://doi.org/10.1111/gcb.12447, 2014.
Myriokefalitakis, S., Fanourgakis, G., and Kanakidou, M.: The Contribution of bioaerosols to the organic carbon budget of the atmosphere, in Perspectives on Atmospheric Sciences, Springer International Publishing, 845–851, https://doi.org/10.1007/978-3-319-35095-0, 2017.
Nirmalkar, J., Deshmukh, D. K., Deb, M. K., Tsai, Y. I., and Pervez, S.: Characteristics of aerosol during major biomass burning events over eastern central India in winter: A tracer-based approach, Atmos. Pollut. Res., 10, 817–826, https://doi.org/10.1016/j.apr.2018.12.010, 2018.
Pashynska, V., Vermeylen, R., Vas, G., Maenhaut, W., and Claeys, M.: Development of a gas chromatographic/ion trap mass spectrometric method for the determination of levoglucosan and saccharidic compounds in atmospheric aerosols. Application to urban aerosols, J. Mass Spectrom., 37, 1249–1257, https://doi.org/10.1002/jms.391, 2002.
Perrino, C. and Marcovecchio, F.: A new method for assessing the contribution of primary biological atmospheric particles to the mass concentration of the atmospheric aerosol, Environ. Int., 87, 108–115, https://doi.org/10.1016/j.envint.2015.11.015, 2016.
Pietrogrande, M. C., Bacco, D., Visentin, M., Ferrari, S., and Casali, P.: Polar organic marker compounds in atmospheric aerosol in the Po valley during the supersito campaigns – Part 2: seasonal variations of sugars, Atmos. Environ., 97, 215–225, doi:0.1016/j.atmosenv.2014.07.056, 2014.
Pindado, O. and Perez, R. M.: Source apportionment of particulate organic compounds in a rural area of Spain by positive matrix factorization, Atmos. Pollut. Res., 2, 492–505, https://doi.org/10.5094/APR.2011.056, 2011.
Pirttilä, A. M. and Frank, A. C. (Eds.): Endophytes of forest trees, Springer Netherlands, Dordrecht, https://doi.org/10.1007/978-3-319-89833-9, 2011.
Puxbaum, H. and Tenze-Kunit, M.: Size distribution and seasonal variation of atmospheric cellulose, Atmos. Environ., 37, 3693–3699, https://doi.org/10.1016/S1352-2310(03)00451-5, 2003.
Rajput, P., Chauhan, A. S., and Gupta, T.: Bioaerosols over the indo-gangetic plain: influence of biomass burning emission and ambient meteorology, in Environmental Contaminants: measurement, modelling and control, Springer Singapore, 93–121, https://doi.org/10.1007/978-981-10-7332-8, 2018.
Ram, K., Sarin, M. M., and Hegde, P.: Long-term record of aerosol optical properties and chemical composition from a high-altitude site (Manora Peak) in Central Himalaya, Atmos. Chem. Phys., 10, 11791–11803, https://doi.org/10.5194/acp-10-11791-2010, 2010.
Ramoni, J. and Seiboth, B.: Degradation of plant cell wall polymers by fungi, in Environmental and microbial relationships, Springer International Publishing, Cham., vol. IV, 127–148, https://doi.org/10.1007/978-3-540-71840-6 2016.
Rathnayake, C. M., Metwali, N., Jayarathne, T., Kettler, J., Huang, Y., Thorne, P. S., O'Shaughnessy, P. T., and Stone, E. A.: Influence of rain on the abundance of bioaerosols in fine and coarse particles, Atmos. Chem. Phys., 17, 2459–2475, https://doi.org/10.5194/acp-17-2459-2017, 2017.
Reddy, S. M., Girisham, S., and Babu, G. N.: Applied Microbiology (agriculture, environmental, food and industrial microbiology), Scientific Publishers, doi:9789387307407, 2017.
Rogge, W. F., Medeiros, P. M., and Simoneit, B. R. T.: Organic marker compounds in surface soils of crop fields from the San Joaquin Valley fugitive dust characterization study, Atmos. Environ., 41, 8183–8204, https://doi.org/10.1016/j.atmosenv.2007.06.030, 2007.
Samaké, A., Jaffrezo, J.-L., Favez, O., Weber, S., Jacob, V., Albinet, A., Riffault, V., Perdrix, E., Waked, A., Golly, B., Salameh, D., Chevrier, F., Oliveira, D. M., Bonnaire, N., Besombes, J.-L., Martins, J. M. F., Conil, S., Guillaud, G., Mesbah, B., Rocq, B., Robic, P.-Y., Hulin, A., Le Meur, S., Descheemaecker, M., Chretien, E., Marchand, N., and Uzu, G.: Polyols and glucose particulate species as tracers of primary biogenic organic aerosols at 28 French sites, Atmos. Chem. Phys., 19, 3357–3374, https://doi.org/10.5194/acp-19-3357-2019, 2019.
Sánchez-Ochoa, A., Kasper-Giebl, A., Puxbaum, H., Gelencser, A., Legrand, M., and Pio, C.: Concentration of atmospheric cellulose: a proxy for plant debris across a west-east transect over Europe, J. Geophys. Res., 112, D23S08, https://doi.org/10.1029/2006JD008180, 2007.
Sesartic, A. and Dallafior, T. N.: Global fungal spore emissions, review and synthesis of literature data, Biogeosciences, 8, 1181-1192, https://doi.org/10.5194/bg-8-1181-2011, 2011.
Shcherbakova, L. A.: Advanced methods of plant pathogen diagnostics, in Comprehensive and molecular phytopathology, Elsevier, Amsterdam, 75–116, doi:9780080469331, 2007.
Simoneit, B. R. T., Elias, V. O., Kobayashi, M., Kawamura, K., Rushdi, A. I., Medeiros, P. M., Rogge, W. F., and Didyk, B. M.: Sugars dominant water-soluble organic compounds in soils and characterization as tracers in atmospheric particulate matter, Environ. Sci. Technol., 38, 5939–5949, https://doi.org/10.1029/2004JD004598, 2004.
Srivastava, D., Favez, O., Bonnaire, N., Lucarelli, F., Haeffelin, M., Perraudin, E., Gros, V., Villenave, E., and Albinet, A.: Speciation of organic fractions does matter for aerosol source apportionment: part 2: intensive short-term campaign in the Paris area (France), Sci. Total Environ., 634, 267–278, https://doi.org/10.1016/j.scitotenv.2018.03.296, 2018.
Sullivan, A. P., Frank, N., Kenski, D. M., and Collett, J. L.: Application of high-performance anion-exchange chromatography–pulsed amperometric detection for measuring carbohydrates in routine daily filter samples collected by a national network 2: examination of sugar alcohols/polyols, sugars, and anhydrosugars in the upper Midwest, J. Geophys. Res.-Atmos., 116, D08303, https://doi.org/10.1029/2010JD014169, 2011.
Tanarhte, M., Bacer, S., Burrows, S. M., Huffman, J. A., Pierce, K. M., Pozzer, A., Sarda-Estève, R., Savage, N. J., and Lelieveld, J.: Global modeling of fungal spores with the EMAC chemistryclimate model: uncertainties in emission parametrizations and observations, Atmos. Chem. Phys. Discuss., https://doi.org/10.5194/acp-2019-251, in review, 2019.
Vélëz, H., Glassbrook, N. J., and Daub, M. E.: Mannitol metabolism in the phytopathogenic fungus alternaria alternata, Fungal Genet. Biol., 44, 258–268, https://doi.org/10.1016/j.fgb.2006.09.008, 2007.
Verma, S. K., Kawamura, K., Chen, J., and Fu, P.: Thirteen years of observations on primary sugars and sugar alcohols over remote Chichijima Island in the western North Pacific, Atmos. Chem. Phys., 18, 81–101, https://doi.org/10.5194/acp-18-81-2018, 2018.
Vlachou, A., Daellenbach, K. R., Bozzetti, C., Chazeau, B., Salazar, G. A., Szidat, S., Jaffrezo, J.-L., Hueglin, C., Baltensperger, U., Haddad, I. E., and Prévôt, A. S. H.: Advanced source apportionment of carbonaceous aerosols by coupling offline AMS and radiocarbon size-segregated measurements over a nearly 2-year period, Atmos. Chem. Phys., 18, 6187–6206, https://doi.org/10.5194/acp-18-6187-2018, 2018.
Waked, A., Favez, O., Alleman, L. Y., Piot, C., Petit, J.-E., Delaunay, T., Verlinden, E., Golly, B., Besombes, J.-L., Jaffrezo, J.-L., and Leoz-Garziandia, E.: Source apportionment of PM10 in a north-western Europe regional urban background site (Lens, France) using positive matrix factorization and including primary biogenic emissions, Atmos. Chem. Phys., 14, 3325–3346, https://doi.org/10.5194/acp-14-3325-2014, 2014.
Wan, E. C. H. and Yu, J. Z.: Analysis of sugars and sugar polyols in atmospheric aerosols by chloride attachment in liquid chromatography/negative ion electrospray mass spectrometry, Environ. Sci. Technol., 41, 2459–2466, https://doi.org/10.1021/es062390g, 2007.
Wan, X., Kang, S., Rupakheti, M., Zhang, Q., Tripathee, L., Guo, J., Chen, P., Rupakheti, D., Panday, A. K., Lawrence, M. G., Kawamura, K., and Cong, Z.: Molecular characterization of organic aerosols in the Kathmandu Valley, Nepal: insights into primary and secondary sources, Atmos. Chem. Phys., 19, 2725–2747, https://doi.org/10.5194/acp-19-2725-2019, 2019.
Wang, X., Shen, Z., Liu, F., Lu, D., Tao, J., Lei, Y., Zhang, Q., Zeng, Y., Xu, H., Wu, Y., Zhang, R., and Cao, J.: saccharides in summer and winter PM2.5 over Xi'an, northwestern China: sources, and yearly variations of biomass burning contribution to PM2.5, Atmos. Res., 214, 410–417, https://doi.org/10.1016/j.atmosres.2018.08.024, 2018.
Weber, S., Uzu, G., Calas, A., Chevrier, F., Besombes, J.-L., Charron, A., Salameh, D., Ježek, I., Močnik, G., and Jaffrezo, J.-L.: An apportionment method for the oxidative potential of atmospheric particulate matter sources: application to a one-year study in Chamonix, France, Atmos. Chem. Phys., 18, 9617–9629, https://doi.org/10.5194/acp-18-9617-2018, 2018.
Weber, S., Salameh, D., Albinet, A., Alleman, L. Y., Waked, A., Besombes, J.-L., Jacob, V., Guillaud, G., Meshbah, B., Rocq, B., Hulin, A., Dominik-Sègue, M., Chrétien, E., Jaffrezo, J.-L., and Favez, O.: Comparison of PM10 Sources profiles at 15 French sites using a harmonized constrained positive matrix factorization approach, Atmosphere, 10, 310, https://doi.org/10.3390/atmos10060310, 2019.
Wéry, N., Galès, A., and Brunet, Y.: Bioaerosol sources, in Microbiology of Aerosols, John Wiley & Sons, Ltd., 115–135, https://doi.org/10.1002/9781119132318, 2017.
Whipps, J. M., Hand, P., Pink, D., and Bending, G. D.: Phyllosphere microbiology with special reference to diversity and plant genotype, J. Appl. Microbiol., 105, 1744–1755, https://doi.org/10.1111/j.1365-2672.2008.03906.x, 2008.
Xiao, M., Wang, Q., Qin, X., Yu, G., and Deng, C.: Composition, sources, and distribution of PM2.5 saccharides in a coastal urban site of China, Atmosphere, 9, 274, https://doi.org/10.3390/atmos9070274, 2018.
Xu, J., He, J., Xu, H., Ji, D., Snape, C., Yu, H., Jia, C., Wang, C., and Gao, J.: Simultaneous measurement of multiple organic tracers in fine aerosols from biomass burning and fungal spores by HPLC-MS/MS, RSC. Adv., 8, 34136–34150, https://doi.org/10.1039/C8RA04991B, 2018.
Yan, C., Sullivan, A. P., Cheng, Y., Zheng, M., Zhang, Y., Zhu, T., and Collett, J. L.: Characterization of saccharides and associated usage in determining biogenic and biomass burning aerosols in atmospheric fine particulate matter in the north China Plain, Sci. Total Environ., 650, 2939–2950, https://doi.org/10.1016/j.scitotenv.2018.09.325, 2019.
Yan, K., Park, T., Yan, G., Chen, C., Yang, B., Liu, Z., Nemani, R., Knyazikhin, Y., and Myneni, R.: Evaluation of MODIS LAI/FPAR product collection 6: part 1: consistency and improvements, Remote Sens., 8, 359, https://doi.org/10.3390/rs8050359, 2016a.
Yan, K., Park, T., Yan, G., Liu, Z., Yang, B., Chen, C., Nemani, R., Knyazikhin, Y., and Myneni, R.: Evaluation of MODIS LAI/FPAR product collection 6: part 2: validation and intercomparison, Remote Sens., 8, 460, https://doi.org/10.3390/rs8060460, 2016b.
Yttri, K. E., Dye, C., and Kiss, G.: Ambient aerosol concentrations of sugars and sugar-alcohols at four different sites in Norway, Atmos. Chem. Phys., 7, 4267–4279, https://doi.org/10.5194/acp-7-4267-2007, 2007.
Yttri, K. E., Simpson, D., Stenström, K., Puxbaum, H., and Svendby, T.: Source apportionment of the carbonaceous aerosol in Norway – quantitative estimates based on 14C, thermal-optical and organic tracer analysis, Atmos. Chem. Phys., 11, 9375–9394, https://doi.org/10.5194/acp-11-9375-2011, 2011a.
Yttri, K. E., Simpson, D., Nøjgaard, J. K., Kristensen, K., Genberg, J., Stenström, K., Swietlicki, E., Hillamo, R., Aurela, M., Bauer, H., Offenberg, J. H., Jaoui, M., Dye, C., Eckhardt, S., Burkhart, J. F., Stohl, A., and Glasius, M.: Source apportionment of the summer time carbonaceous aerosol at Nordic rural background sites, Atmos. Chem. Phys., 11, 13339–13357, https://doi.org/10.5194/acp-11-13339-2011, 2011b.
Yue, S., Ren, H., Fan, S., Wei, L., Zhao, J., Bao, M., Hou, S., Zhan, J., Zhao, W., Ren, L., Kang, M., Li, L., Zhang, Y., Sun, Y., Wang, Z., and Fu, P.: High abundance of fluorescent biological aerosol particles in winter in Beijing, China, ACS Earth Space Chem., 1, 493–502, https://doi.org/10.1021/acsearthspacechem.7b00062, 2017.
Zamfir, M., Gerstner, D. G., Walser, S. M., Bünger, J., Eikmann, T., Heinze, S., Kolk, A., Nowak, D., Raulf, M., Sagunski, H., Sedlmaier, N., Suchenwirth, R., Wiesmüller, G. A., Wollin, K.-M., Tesseraux, I., and Herr, C. E. W.: A systematic review of experimental animal studies on microbial bioaerosols: Dose-response data for the derivation of exposure limits, Int. J. Hyg. Environ. Health, 222, 249–259, https://doi.org/10.1016/j.ijheh.2018.11.004, 2019.
Zhang, T., Engling, G., Chan, C.-Y., Zhang, Y.-N., Zhang, Z.-S., Lin, M., Sang, X.-F., Li, Y. D., and Li, Y.-S.: Contribution of fungal spores to particulate matter in a tropical rainforest, Environ. Res. Lett., 5, 024010, https://doi.org/10.1088/1748-9326/5/2/024010, 2010.
Zhang, Z., Engling, G., Zhang, L., Kawamura, K., Yang, Y., Tao, J., Zhang, R., Chan, C., and Li, Y.: Significant influence of fungi on coarse carbonaceous and potassium aerosols in a tropical rainforest, Environ. Res. Lett., 10, 034015, https://doi.org/10.1088/1748-9326/10/3/034015, 2015.
Zhu, C., Kawamura, K., and Kunwar, B.: Organic tracers of primary biological aerosol particles at subtropical Okinawa Island in the western North Pacific Rim: organic biomarkers in the north pacific, J. Geophys. Res.-Atmos., 120, 5504–5523, 2015.
Zhu, W., Luo, L., Cheng, Z., Yan, N., Lou, S., and Ma, Y.: Characteristics and contributions of biogenic secondary organic aerosol tracers to PM2.5 in Shanghai, China, Atmos. Pollut. Res., 9, 179–188, https://doi.org/10.1016/j.apr.2017.09.001, 2018a.
Zhu, W., Cheng, Z., Luo, L., Lou, S., Ma, Y., and Yan, N.: Investigation of fungal spore characteristics in PM2.5 through organic tracers in Shanghai, China, Atmos. Pollut. Res., 9, 894–900, https://doi.org/10.1016/j.apr.2018.01.009, 2018b.