the Creative Commons Attribution 4.0 License.
the Creative Commons Attribution 4.0 License.
Severe winter haze days in the Beijing–Tianjin–Hebei region from 1985 to 2017 and the roles of anthropogenic emissions and meteorology
Ruijun Dang
Hong Liao
We applied a global 3-D chemical transport model (GEOS-Chem) to examine the variations in the frequency and intensity in severe winter haze days (SWHDs) in Beijing–Tianjin–Hebei (BTH) from 1985 to 2017 and quantified the roles of changes in anthropogenic emissions and/or meteorological parameters. Observed SWHDs were defined as the days with daily mean PM2.5 concentration exceeding 150 µg m−3, and simulated SWHDs were identified by using the same threshold but with adjustment on the basis of simulation biases. Comparisons between the simulated SWHDs and those obtained from the observed PM2.5 concentrations and atmospheric visibility showed that the model can capture the spatial and temporal variations in SWHDs in China; the correlation coefficient between the simulated and observed SWHDs is 0.98 at 161 grids in China. From 1985 to 2017, with changes in both anthropogenic emissions and meteorological parameters, the simulated frequency (total severe haze days in winter) and intensity (PM2.5 concentration averaged over severe haze days in winter) of SWHDs in BTH showed increasing trends of 4.5 d per decade and 13.5 µg m−3 per decade, respectively. The simulated frequency exhibited fluctuations from 1985 to 2017, with a sudden decrease from 1992 to 2001 (29 to 10 d) and a rapid growth from 2003 to 2012 (16 to 47 d). The sensitivity simulations indicated that variations in meteorological parameters played a dominant role during 1992–2001, while variations in both emissions and meteorological parameters were important for the simulated frequency trend during 2003–2012 (simulated trends were 27.3 and 12.5 d per decade owing to changes in emissions alone and changes in meteorology alone, respectively). The simulated intensity showed a steady increase from 1985 to 2017, which was driven by changes in both emissions and meteorology. Process analysis on all SWHDs during 1985–2017 indicated that transport was the most important process for the formation of SWHDs in BTH with a relative contribution of 65.3 %, followed by chemistry (17.6 %), cloud processes (−7.5 %), dry deposition (−6.4 %), and planetary boundary layer (PBL) mixing (3.2 %). Further examination showed that SWHDs exhibited large interannual variations in frequency and intensity, which were mainly driven by changes in meteorology. The results of this study have important implications for the control of SWHDs in BTH.
- Article
(5554 KB) - Full-text XML
-
Supplement
(599 KB) - BibTeX
- EndNote
Due to rapid industrialization and urbanization, China has suffered from frequent severe haze episodes in recent years (Cai et al., 2017; K. Li et al., 2018; Zhu et al., 2018), especially during winter (Chen and Wang, 2015; Wu et al., 2017; Wang et al., 2018). The Beijing–Tianjin–Hebei (BTH) region, which is one of the most densely populated economic zones in China, has considerably high levels of PM2.5 (Jiang et al., 2015; Chen and Wang, 2015). During severe winter haze days (SWHDs), the detected daily mean PM2.5 concentrations reached 300–600 µg m−3 in BTH (Wang et al., 2014a; Li et al., 2018b). Exposure to these fine particulate matters detrimentally affects human health, causing problems from respiratory illnesses to cardiovascular diseases and premature death (Lelieveld et al., 2015; Zhang et al., 2017). High PM2.5 levels during SWHDs also severely deteriorate ambient visibility, which endangers ground and air traffic and consequently disrupts economic activities (Wang et al., 2015; Gao et al., 2015a). Therefore, understanding the long-term variations in SWHDs is essential for air quality planning.
Previous studies on severe winter haze were mainly focused on a single episode, which reported the physical and chemical processes that led to SWHDs. Severe winter haze episodes usually occur under stagnant weather conditions and high anthropogenic emissions (Zhang et al., 2014; L. Zhang et al., 2015; J. Li et al., 2017). Stagnant weather conditions, characterized by weak surface wind speed, enhanced temperature inversion in the lower troposphere, and depressed planetary boundary layer height (PBLH) restrain the dispersion of pollutants (Liu et al., 2013; Zhao et al., 2013b). High relative humidity (RH) during SWHDs facilitates the rapid growth of secondary aerosols (Sun et al., 2014; L. Zhang et al., 2015). Regional transport from upwind areas (G. J. Zheng et al., 2015; Sun et al., 2016; Ma et al., 2017) and the feedbacks between aerosols and meteorological variables are also important drivers for the formation of severe winter haze events (Gao et al., 2015b; B. Zhang et al., 2015; Tie et al., 2017). Changes in large-scale circulation, such as the anomalous eastward extension of the Siberian high (Jia et al., 2015), weakened East Asian winter monsoon (Q. Li et al., 2016), and anomalous warm southerlies at 850 hPa (Cai et al., 2017), were also found to be conducive to the formation and maintenance of severe winter haze in BTH.
Some studies examined the changes in air quality in China during the past decades, but these studies were generally focused on the monthly or seasonal mean haze days. Because of the lack of long-term measurements of PM2.5 concentrations in China, observed atmospheric visibility was often used as a proxy for PM2.5. Haze days were defined in previous studies as the days with atmospheric visibility of less than 10 km and relative humidity of less than 90 % (Chang et al., 2009; Yang et al., 2016). Ding and Liu (2014) examined haze days at 553 sites in China and reported that annual haze days averaged over these sites increased from 2 to 4 d in the 1960s to 11–16 d after 2005. It was also reported that haze days mainly increased in economically developed eastern China and decreased in northeastern and northwestern China. Yang et al. (2016), using visibility data, found that the winter haze days averaged over eastern China (196 sites, 105–122.5∘ E, 20–45∘ N) showed a large increasing trend of 2.6 d per decade during 1980–2012. Historical changes in air quality in China were also examined through modeling studies. Using the GEOS-Chem model, Jeong and Park (2013) reported a 73 % increase in simulated DJF mean –– (SNA) concentration between 1985–1989 and 2002–2006 over East Asia (90–145∘ E, 20–45∘ N) and largely attributed this increase to changes in anthropogenic emissions. By also using the GEOS-Chem, Yang et al. (2016) obtained an increasing trend in wintertime PM2.5 concentration of 10.5 (±1.5) µg m−3per decade averaged over eastern China (105–122.5∘ E, 20–45∘ N) during 1985–2005 and found that the changes in anthropogenic emissions and meteorological parameters over the studied period contributed 83 % and 17 % to the increasing trend in PM2.5, respectively.
To date, only a few studies have examined historical changes in SWHDs in China using observed atmospheric visibility. Fu et al. (2013) defined an extremely poor visibility event as a case with atmospheric visibility of less than 5 km for at least 3 d and found that the annual frequency of such an event averaged over large cites in China (142 cities with populations of more than 1 million) increased from 1960 to 2009 with a trend of 0.68 events per decade. Using the visibility-converted daily aerosol extinction coefficient (AEC) dataset, Li et al. (2018a) examined the long-term trends in extremely high AEC (the 95th percentile in a year) at 272 sites in China and compared these trends with the trends in median AEC (the 50th percentile in a year). They showed that the extreme trends exceeded the median trends at most sites in the 1980s, the extreme trends were larger than the median trends in the south (south of 33∘ N) but smaller in the north (north of 33∘ N) in the 1990s, and most sites exhibited a faster increase in the median trends in the 2000s. These studies, performed through statistical methods based on visibility datasets, could not provide information about the historical changes in aerosol components in SWHDs and associated chemical–physical processes (transport or diffusion, chemical production or loss, wet and dry deposition). Additionally, no quantitative information has ever been given regarding the separate roles of changes in anthropogenic emissions and meteorological parameters in historical changes of SWHDs in China.
In this study, we applied the GEOS-Chem model to simulate SWHDs over China for 33 winters from 1985 to 2017 and to quantify the roles of changes in anthropogenic emissions and meteorological parameters in the variations in simulated SWHDs over BTH. The observed datasets, GEOS-Chem model and numerical experiments, and the definition of SWHDs are described in Sect. 2. In Sect. 3, simulated PM2.5 and SWHDs as well as a model evaluation are presented. In Sect. 4, the simulated changes in SWHDs over China and the BTH region from 1985 to 2015 are presented. The key processes that led to SWHDs in BTH are identified by process analysis in Sect. 5. In Sect. 6, the relative roles of changes in anthropogenic emissions and meteorological parameters in SWHDs in BTH are investigated over the studied period.
2.1 Observed PM2.5 concentrations
Hourly surface PM2.5 measurements were mainly obtained from the China National Environmental Monitoring Centre (CNEMC, 2019, http://www.cnemc.cn). The monitoring network expanded from 670 sites in 2013 to 1600 sites in 2018, covering approximately 370 cities nationwide. The 670 sites set up in 2013 have obtained continuous measurements since 2013, and 79 sites are located in BTH. Daily mean PM2.5 from these 670 sites is used in this study and averaged to the 0.5∘ latitude × 0.625∘ longitude MERRA-2 grid (corresponding to 161 model grids) to examine observed SWHDs and for model evaluation. For the BTH region, hourly PM2.5 concentrations that were observed at the US embassy in Beijing (US embassy, 2019, http://www.stateair.net/web/post/1/1.html) are also used, which are available from 2009 to June 2017.
2.2 Observed visibility
Observed atmospheric visibility data were obtained from the National Climatic Data Center (NCDC) Global Summary of Day (GSOD) database (NCDC, 2019, https://www7.ncdc.noaa.gov/CDO/cdoselect.cmd), which has been widely used in previous studies to examine the haze pollution trend in China (Che et al., 2007; Chang et al., 2009; Deng et al., 2012; Yang et al., 2016; J. Li et al., 2016). The database includes daily observations from 1985 to 2018 at 346 sites in China. The Beijing site is located at 39.56∘ N and 116.17∘ E.
2.3 GEOS-Chem model and numerical experiments
2.3.1 Model description
We simulated PM2.5 concentrations using the GEOS-Chem model (version 11-01; Harvard University, 2019, http://acmg.seas.harvard.edu/geos/) driven by MERRA-2 assimilated meteorological data (Gelaro et al., 2017) from NASA's Global Modeling and Assimilation Office (GMAO). The nested-grid capacity of GEOS-Chem over Asia (11∘ S–55∘ N, 60–150∘ E) was used with a horizontal resolution of 0.5∘ latitude by 0.625∘ longitude and 47 vertical layers up to 0.01 hPa. Boundary conditions for gases and aerosols were updated every 3 h from the coupled global GEOS-Chem simulations performed at a horizontal resolution.
The GEOS-Chem model includes fully coupled O3–NOx–hydrocarbon and aerosol chemistry with more than 80 species and 300 reactions (Bey et al., 2001; Park et al., 2004). The PM2.5 components simulated in GEOS-Chem include sulfate (Park et al., 2004), nitrate (Pye et al., 2009), ammonium, black carbon and primary organic carbon (Park et al., 2003), mineral dust (Fairlie et al., 2007), and sea salt (Alexander et al., 2005). Aerosol thermodynamic equilibrium is computed by the ISORROPIA II package, which calculates the gas–aerosol partitioning of the sulfate–nitrate–ammonium system (Fountoukis and Nenes, 2007). Heterogeneous reactions of aerosols include irreversible absorption of NO3 and NO2 on wet aerosols (Jacob, 2000), hydrolysis of N2O5 (Evans and Jacob, 2005), and the uptake of HO2 by aerosols (Thornton et al., 2008). Wet deposition, including below-cloud washout, in-cloud rainout, and scavenging in moist convective updrafts, follows the scheme of Liu et al. (2001). Dry deposition is computed based on the resistance-in-series model from Wesely (1989) with a number of modifications (Wang et al., 1998). Considering that sea salt is not a dominant aerosol species in China and that the concentrations of mineral dust aerosols are generally low in winter (Duan et al., 2006; Zhao et al., 2013a), we calculated the PM2.5 concentration in this study as the sum of the simulated mass of sulfate, nitrate, ammonium, black carbon (BC), and organic carbon (OC).
2.3.2 Emissions
For anthropogenic emissions, global SO2, NOx, NH3, and CO emissions followed the EDGAR v4.2 inventory (EC-JRC/PBL, 2011, http://edgar.jrc.ec.europa.eu/overview.php?v=42, last access: 15 August 2019). Global BC and OC emissions were taken from the BOND inventory (Bond et al., 2007). Global non-methane volatile organic compound (NMVOC) emissions followed the RETRO inventory (ftp://rain.ucis.dal.ca/ctm/RETRO, last access: 15 August 2019), where C2H6 and C3H8 were replaced with emissions from Xiao et al. (2008). In the East Asian domain, MIX 2010 (M. Li et al., 2017) was the baseline anthropogenic inventory, and annual scaling factors were applied for other years during 1985–2017. Over 1985–2009, scaling factors for all species were derived from the EDGAR v4.3 inventory (http://edgar.jrc.ec.europa.eu/overview.php?v=431, last access: 15 August 2019), except those for SO2 during 1996–1999, which were taken from Lu et al. (2011). For 2011–2017, scaling factors for all species followed the study of Zheng et al. (2018). Global biomass burning emissions were taken from GFED4 for 1997–2016 with a monthly temporal resolution (van der Werf et al., 2017). For the years out of the available range, emissions of the closest available year were used. For example, the biomass burning emissions of 1997 were used for 1985–1996.
Figure 1 shows the variations in wintertime emissions (both anthropogenic and natural emissions) of aerosols and their precursors over eastern China (105–122.5∘ E, 20–45∘ N) from 1985 to 2017. For the SO2, NOx, BC, and OC emissions, all are a two-peak type with one peak occurring in the 1990s and another in approximately 2010 (2005 for SO2). The relatively low emissions around 2000 were due to a slowdown in economic growth and a decline in fuel consumption (Streets et al., 2000; Hao et al., 2002; Streets and Aunan, 2005; Ohara et al., 2007). Emissions exhibited drastic increases in the beginning of the 21st century and decrease in recent years as a result of the strictly enforced emission reduction measures during the Eleventh and Twelfth Five-Year Plans in China (Zheng et al., 2018). The NH3 emissions continued to increase from 1985 to 2017 because of the steady growth in agricultural sources. Overall, relative to 1985, SO2, NOx, NH3, BC, and OC emissions in 2017 changed by 11 %, 88 %, 81 %, 18 %, and −24 %, respectively. The variations in emissions used in this work are consistent with those from the studies of Jeong and Park (2013) and Yang et al. (2016).
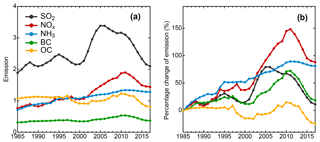
Figure 1(a) Variations in total emissions (anthropogenic plus natural emissions) of sulfur dioxide (SO2, Tg S DJF−1), nitrogen oxide (NOx, Tg N DJF−1), ammonia (NH3, Tg N DJF−1), black carbon (BC, Tg C DJF−1), and organic carbon (OC, Tg C DJF−1) over eastern China (105–123∘ E, 20–45∘ N) during December–January–February (DJF) from 1985 to 2017 and (b) the percentage changes relative to 1985 values.
2.3.3 Numerical simulations
Daily PM2.5 concentrations for winters from 1985 to 2017 were simulated using the GEOS-Chem model driven by MERRA-2 meteorological fields. The following three simulations were conducted to examine the changes in SWHDs in China from 1985 to 2017 and to identify the relative roles of changes in anthropogenic emissions and meteorological parameters. The winter (December, January, February, DJF) of a specific year includes December of this year and January and February of the following year.
-
CTRL is the control simulation with variations in meteorological parameters, anthropogenic emissions, and biomass burning emissions from 1985 to 2017.
-
EMIS is the simulation with changes in anthropogenic and biomass burning emissions over 1985–2017, while the meteorological fields were fixed at the 1985 levels. The aim of this simulation is to quantify the impacts of changes in emissions on SWHDs during 1985–2017.
-
MET is the simulation with changes in meteorological fields over 1985–2017, while anthropogenic and biomass burning emissions were fixed at the 2015 levels. This simulation is set to examine the impacts of changes in meteorological parameters on SWHDs during 1985–2017.
2.4 Definition of severe winter haze
To understand the decadal changes in SWHDs, we rely on the GEOS-Chem simulation and use the observed PM2.5 concentration and atmospheric visibility for model evaluation. SWHDs must be defined for each of the datasets of observed PM2.5, observed atmospheric visibility, and simulated PM2.5. For observed PM2.5, following the study of Cai et al. (2017), a severe winter haze day is identified when the daily mean observed PM2.5 concentration exceeds the 150 µg m−3 threshold because the Chinese government issues a “red alert” when the PM2.5 concentration is forecasted to exceed 150 µg m−3 for 72 consecutive hours.
With respect to the definition of a severe winter haze day based on observed atmospheric visibility, a severe haze day is defined as a day with visibility of less than a visibility threshold (Vt) and relative humidity of less than 90 %. A statistical approach is used to obtain Vt for each site of interest: (1) select the time period with available observations of both PM2.5 and atmospheric visibility; (2) make a scatterplot of the daily atmospheric visibility (Vis) versus daily mean PM2.5 concentration (PM2.5_obs) for all samples in the time period selected; and (3) perform an exponential fit as Vis ) and obtain the Vt that corresponds to a PM2.5_obs of 150 µg m−3. Notably, atmospheric visibility was observed manually before 2013 and has been observed automatically since 2013. To account for the discrepancies in data before and after 2013, two sets of Vt are obtained. Supplement Fig. S1 provides an example of how to compute Vt for Beijing. Observations of PM2.5 and atmospheric visibility are available for 2009–2016. Using the statistical approach described above, Vt values are calculated as 6.5 km over the manual period of 2009–2012 and 4.5 km over the automatic period of 2013–2016. Then, the Vt values obtained from 2009 to 2012 were used to obtain SWHDs for the manually observed period of 1985–2012.
To identify SWHDs based on simulated PM2.5, a severe winter haze day is defined as that with a simulated daily mean PM2.5 larger than a threshold concentration (Mt). Considering the biases in the model results caused by the representation of chemical and physical processes or the horizontal and vertical resolution in the model, Mt is also obtained from a statistical approach for each of the model grids with corresponding PM2.5 observations: (1) select the time period with both observed and simulated PM2.5 available; (2) for all samples selected in (1), calculate the mean bias (MB) between the daily simulated PM2.5 (PM2.5_mod) and daily mean observed PM2.5 (PM2.5_obs) as MB , where N is total number of all samples; and (3) set Mt=150 µg m−3 + MB. Using this approach, Mt is 150 µg m−3 if the simulated PM2.5 has no bias, and Mt is smaller (larger) than 150 µg m−3 if the simulated PM2.5 concentrations have low (high) biases. Take the grid at Baoding (115.6∘ E, 39∘ N), one of the most polluted cities in BTH, as an example. From 2013 to 2017, when both simulated and observed PM2.5 data are available, the simulated wintertime PM2.5 from GEOS-Chem has a mean bias of −28.1 µg m−3, and therefore Mt is 121.9 µg m−3. As a result, in Baoding, the number of observed SWHDs is 210 d and that of the simulated SWHDs is 186 d during 2013–2017. Figure S2 displays the calculated Mt values at 161 grids using the above statistical approach. These values were used to identify the SWHDs at each grid from 1985 to 2017.
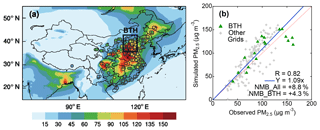
Figure 2(a) Spatial distributions of simulated (CTRL, shades) and observed (CNEMC, dots) seasonal (DJF) mean surface-layer PM2.5 concentrations (µg m−3) averaged over five winters (2013–2017). (b) Scatterplot of simulated versus observed DJF mean PM2.5 concentration (µg m−3) averaged from 2013 to 2017 for 161 grids in (a), where the green grids are 18 grids located in the BTH (Beijing–Tianjin–Hebei) region. Also shown in (b) are the y=x line (dashed), linear fit (solid line and equation), and values of r and NMB. Here, r is the correlation coefficient between simulated and observed PM2.5 concentrations. , where Oi and Mi are the observed and simulated PM2.5 concentrations, respectively. i refers to the ith site, and N is the total number of sites.
3.1 Surface-layer PM2.5 concentrations in DJF
Figure 2a presents the simulated seasonal (DJF) mean surface-layer PM2.5 concentrations averaged from 2013 to 2017 over China. These years are chosen depending on the available years with measured PM2.5 so that the model results can be evaluated by using observations. Simulated PM2.5 concentrations were high over eastern China, covering important economic zones including BTH, the Sichuan Basin (SCB), and the Yangtze River Delta (YRD). The simulated highest concentrations occurred in southern BTH, with seasonal mean PM2.5 in the range of 135–151 µg m−3. For model evaluation, observed PM2.5 concentrations from the CNEMC dataset (averaged into 161 model grids as described in Sect. 2.1) are shown in Fig. 2a. The simulated spatial patterns of PM2.5 agree well with the measurements, with a high correlation coefficient (R) of 0.82 between the observed and simulated seasonal mean PM2.5 values. Figure 2b shows the scatterplot of simulated versus observed seasonal mean PM2.5 concentrations at all 161 model grids shown in Fig. 2a. The model overestimates PM2.5 concentrations with a normalized mean bias (NMB) of +8.8 % for all grids and an NMB of +4.3 % for BTH.
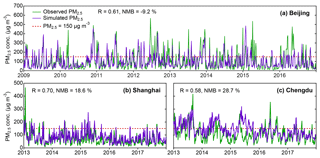
Figure 3Simulated (purple solid line, from CTRL simulation) and observed (green solid line, from the US embassy and CNEMC) daily mean surface-layer PM2.5 concentrations (µg m−3) for grids of (a) Beijing, (b) Shanghai, and (c) Chengdu over the period when observations are available. Also shown are the threshold of PM2.5=150 µg m−3 (red dashed line), the correlation coefficients (R), and NMB values between observed and simulated daily mean PM2.5 concentrations.
Figure 3 compares the time series of simulated and observed daily mean surface-layer PM2.5 concentrations at the Beijing, Shanghai, and Chengdu grids, which represent the three most polluted regions of BTH, YRD, and the Sichuan Basin, respectively. For Beijing (116.25∘ E, 40∘ N), observations at the US embassy site were used for comparison from 2009 to 2017. For Shanghai (121.25∘ E, 31∘ N) and Chengdu (103.75∘ E, 30.5∘ N), observations from the gridded CNEMC dataset were available from 2013 to 2017. The model generally captures the daily variations (peaks and troughs) in the observed PM2.5 concentrations, with R values of 0.61, 0.70, and 0.58 for Beijing, Shanghai, and Chengdu, respectively. The model has a low bias in Beijing with an NMB of −9.2 % and is unable to predict the maximum PM2.5 concentration in some cases. For example, observations show that during 19–26 December 2015, there were seven SWHDs in Beijing, and the highest PM2.5 concentration reached 537 µg m−3 on 25 December. However, the model captured only three SWHDs during this period, and the simulated PM2.5 concentration was 37 µg m−3 on this day. Such underpredictions of PM2.5 concentrations during severe haze events were also reported by previous studies (L. Zhang et al., 2015; Zhang et al., 2014; Wang et al., 2014b) and were attributed to the representation deficiency of the aqueous/heterogeneous processes in the models (Huang et al., 2014; B. Zheng et al., 2015). For Shanghai and Chengdu, the model has high biases with NMBs of 18.6 % and 28.7 %, respectively.
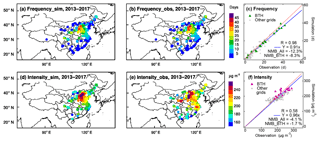
Figure 4Spatial distributions of (a) simulated and (b) observed frequencies (days) of SWHDs averaged from 2013 to 2017 at 161 model grids in China and (c) scatterplot of simulated versus observed results in (a) and (b); panels (d–f) are the same as (a–c) except that the values are SWHD intensities (µg m−3). Also shown in the scatterplots are y=x lines (dashed), linear fits (solid line and equation), correlation coefficients (R), and NMB values.
3.2 Frequency and intensity of severe winter haze days
Figure 4a shows the simulated frequencies of SWHDs at 161 model grids averaged from 2013 to 2017 over China. Consistent with the spatial distribution of seasonal mean PM2.5 in Fig. 2a, simulated SWHDs occurred most frequently in BTH. The frequency averaged over BTH was 19.4 d, which is more than twice the mean value of 8.7 d for all 161 grids. The highest frequencies of 31–39 d were located in southern BTH, indicating that more than one-third of the wintertime days experienced severe PM2.5 pollution from 2013 to 2017. For comparison, the observed frequencies of SWHDs, averaged over the same years, are presented in Fig. 4b. The SWHDs were observed most frequently in BTH, and the spatial distributions are captured fairly well by the model. The scatterplot (Fig. 4c) of simulated versus observed frequencies of SWHDs for all model grids in Fig. 4a and b indicates a high correlation coefficient R of 0.98 and an NMB of −12.3 %. Over BTH, the model underestimated the frequency of SWHDs with an NMB of −8.3 %.
Figure 4d shows the spatial distribution of simulated SWHD intensities. For each grid, the intensity is calculated as the average of the daily mean PM2.5 concentrations over all SWHDs during 2013–2017. Note that, for each grid, the simulated intensity was an adjusted value according to the model mean bias (MB) calculated in Sect. 2.4. For example, for the grid at Baoding where the simulated wintertime PM2.5 has a MB of −28.1 µg m−3, the intensity of simulated SWHDs is adjusted as 249.6 µg m−3 (221.5 µg m−3 minus −28.1 µg m−3) over 2013–2017. The simulated mean PM2.5 concentrations of SWHDs were high over the BTH and Shandong and Henan provinces. The average SWHD PM2.5 concentration was 228 µg m−3 over BTH, which is much higher than the mean value of 195 µg m−3 for all grids. The observed intensities of SWHDs over the same period are also displayed in Fig. 4e. The observed high PM2.5 values of SWHDs are centered over BTH, which is generally reflected in the simulation. The model results have low biases in YRD, the Fen-Wei Plain, and northeast China. Accounting for all model grids in Fig. 4d and e, the scatterplot (Fig. 4f) shows an R of 0.58 between simulated and observed intensities of SWHDs, and the simulated results have an NMB of −4.1 %. Over BTH, simulated intensities of SWHDs have a small NMB of −1.7 %.
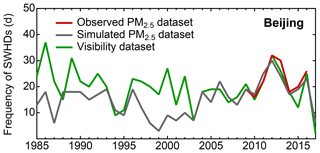
We also evaluate the model's performance to reproduce the long-term variation in SWHD frequency. To evaluate the historical changes, the SWHDs estimated from the observed atmospheric visibility are used. Beijing is the only grid with observed PM2.5 concentrations available before 2013 for establishing the visibility threshold for identifying visibility-based SWHDs over 1985–2012 (as described in Sect. 2.4). Figure 5 compares the temporal evolution of the SWHD frequency at the Beijing grid obtained from the GEOS-Chem simulation, observed PM2.5 (as described in Sect. 3.1), and observed atmospheric visibility (as described in Sect. 2.2). During 2009–2016, when all three datasets are available, frequencies obtained from the simulation and atmospheric visibility capture the interannual variation (peaks and troughs) in observed frequency well. The model underestimates the frequency with an NMB of −4.9 %, and the visibility result has an NMB of −6.6 %. Over the entire 1985–2017 period, when both observed visibility and simulation are available, the correlation coefficient R is 0.48. The frequency obtained from the atmospheric visibility exhibited a decreasing trend of −4.2 d per decade during 1985–2002 and an increasing trend of 1.3 d per decade during 2003–2017; the model partly reproduces these trends with tendencies of −5.2 d per decade from 1985 to 2002 and 3.3 d per decade from 2003 to 2017. However, a distinct low bias was found in the simulation before 2003, which may be attributed to the inconsistency problem in the atmospheric visibility dataset obtained from the NCDC. In general, the CTRL simulation can capture the spatial distributions and historical changes in SWHD frequencies and intensities in China reasonably well.
4.1 Decadal changes over China
Figure 6a and b show the spatial distributions of simulated SWHD frequencies and intensities averaged from 1985 to 2017 over China. Simulated SWHDs occurred most frequently in southern BTH, and the intensity showed the highest values in the regions of BTH and Shandong and Henan provinces. For all model grids shown in Fig. 6a, the averaged frequency of SWHDs was 5.9 d, and the mean intensity was 188 µg m−3. Figure 6c and d show the simulated temporal changes in SWHD frequency and intensity averaged over all model grids in Fig. 6a from 1985 to 2017. Both the frequency and intensity of SWHDs exhibited increasing trends over the past 3 decades. The simulated mean frequency of SWHDs increased from 1.8 d in 1985 to 4.6 d in 2017, with a large growth rate of 2.6 d per decade. The mean SWHD intensity increased from 178 µg m−3 in 1985 to 195 µg m−3 in 2017, with a linear trend of 7.1 µg m−3 per decade.
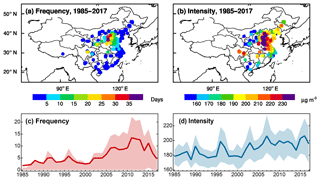
Figure 6Spatial distributions of SWHD (a) frequencies (days) and (b) intensities (µg m−3) at 161 model grids averaged from 1985 to 2017. Temporal evolutions of SWHD (c) frequency (days) and (d) intensity (µg m−3) in China from 1985 to 2017. In (c) and (d), solid lines are the averages of all samples (161 model grids), and the shades indicate the range between the first and third quartiles of the samples.
Over 1985–2017, while the SWHD intensity showed steady growth over the whole period, the changes in SWHD frequency exhibited three distinct stages. The frequency was quite stable, with a value of approximately 3.5 d per winter from 1985 to 2000, but the value increased rapidly from 2001 to 2011 and then decreased sharply during 2012–2017; this change can also be seen clearly in Fig. 7, which presents the spatial distributions of linear trends in SWHD frequencies during these three time periods. During 1985–2000, most grids showed no prominent trends, except for some grids in the Henan and Shanxi provinces as well as the Yangtze River Valley, where growth rates were in the range of 0.4–7.5 d per decade. Interestingly, negative trends were found over BTH during this period, with a maximum trend of −6.9 d per decade. From 2001 to 2011, the SWHD frequencies increased rapidly on a national scale. The largest increasing trends of more than 20 d per decade were centered on the North China Plain (NCP) and Fen-Wei Plain. Benefiting from the emission reduction actions, the frequencies in most grids began to experience a decline in 2012. Most prominent improvements occurred in the southern BTH and SCB and Shaanxi Province, with decreasing trends of greater than −45 d per decade.
4.2 Decadal changes over BTH
As shown above, BTH merits special attention because the region has high DJF mean PM2.5 concentrations, and this region has experienced the most frequently and intensely occurring severe winter haze over the years. To represent the SWHDs over BTH, a regional SWHD is defined here as the day when severe winter haze (defined in Sect. 2.4) occurs simultaneously in more than one-third of the grids in a region. Therefore, for the BTH region that includes 18 grids, a regional SWHD is identified when six grids or more report severe winter haze at a certain time. The intensity of this regional SWHD is calculated as the mean PM2.5 concentration of the grids with SWHDs on that day.
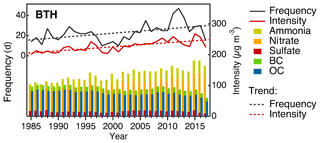
Figure 8Simulated temporal variations in frequency (days, black line), intensity (µg m−3, red line), and concentrations of PM2.5 components (µg m−3, bars): ammonia (blue), nitrate (yellow), sulfate (red), black carbon (purple), and organic aerosols (green) of regional SWHDs in BTH from 1985 to 2017. Also shown are linear trends (dashed lines) for frequency and intensity, which are statistically significant above the 95 % confidence level.
Figure 8 shows the temporal evolution of the simulated frequency and intensity, as well as the concentrations of regional SWHD aerosol components in BTH from 1985 to 2017. Differing from the mean values averaged over 161 grids shown in Fig. 6c, the frequency of regional SWHD in BTH exhibited a much higher level before 2000, indicating serious air pollution by that time. Specifically, the frequency increased from 14 d in 1985 to 29 d in 1992, followed by a sudden decrease to 10 d in 2001, a rapid growth to a peak of 47 d in 2012, and a steep decrease thereafter to 15 d in 2017, which coincides with the temporal variations presented in previous studies for haze days (Chen and Wang, 2015), aerosol extinction coefficient (J. Li et al., 2016), and PM2.5 concentration (Yang et al., 2018) in the North China Plain (NCP). From 1985 to 2017, SWHDs in BTH exhibited large increasing trends of 4.5 d per decade in frequency and 13.5 µg m−3 per decade in intensity. In comparison, the seasonal mean PM2.5 concentrations showed a smaller trend of 10.1 µg m−3 per decade (Fig. S3), implying a more serious problem with severe winter haze pollution. When considering each species, nitrate aerosols exhibited the largest increasing trend of 15.6 µg m−3 per decade, which was followed by ammonium (4.5 µg m−3 per decade). Sulfate and BC made little contribution to the increasing trend, while OC showed the opposite trend of −6.8 µg m−3 per decade, which coincided with the emission changes during this period (Fig. 1). Note that these simulated trends of PM2.5 components are uncertain, which can be influenced by the uncertainties in emission inventories of aerosols and aerosol precursors (Crippa et al., 2018; M. Li et al., 2017; Zheng et al., 2018) as well as by the chemistry scheme in the model (Chen et al., 2019). The simulations in this study did not include secondary organic aerosols; therefore, the concentrations of organic aerosols might have been underestimated. Previous studies also showed that the GEOS-Chem model tends to overestimate nitrate and underestimate sulfate in winter (Wang et al., 2013).
Concentrations of aerosols are jointly determined by emissions, transport, chemical reactions, and deposition. To further isolate and understand the roles of each process in the formation of SWHDs over BTH, a process analysis (PA) was performed for the CTRL simulation from 1985 to 2017. PA has been widely used in previous studies to identify the relative importance of atmospheric processes in specific pollution episodes (Gonçalves et al., 2009) or annual (Zhang et al., 2009) to decadal simulations (Mu and Liao, 2014; Lou et al., 2015) of air pollutants.
For each aerosol species, six processes were diagnosed at every time step, consisting of primary species emissions, horizontal and vertical transport, chemical reactions, cloud processes, dry deposition, and PBL mixing, which altogether determined the mass balance of aerosols. Here, the cloud processes include the scavenging of soluble tracers and mixing due to cloud convections. PBL mixing refers to the mass flux brought by turbulence within the planetary boundary layer. PA was carried out for the BTH box (from the surface to the 11th vertical model layer that corresponds to approximately 850 hPa) on the basis of daily values. The contribution of each process to the formation of SWHDs was calculated by the following equation:
where n is the number of processes (n=6 as described above), PCSM_i is the daily mean mass flux of process i from 1985 to 2017, and PCSWHD_i is the daily mean mass flux of process i averaged over SWHDs during 1985–2017. Note that the sum of abs( %PCi) is 100 %.
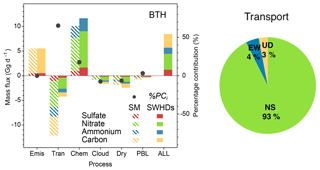
Figure 9Daily mean mass fluxes of aerosols by physical–chemical processes (bottom axis: emission, transport, chemistry, cloud processes, dry deposition, diffusion, and the sums) in the BTH box. Two kinds of averages are given here: averaged over all days during winters from 1985 to 2017 (PCSM, left stripped bars) and averaged over all SWHDs during this period (PCSWHD, right solid bars). Black dots give the relative contributions ( %PC, right axis) of each of the six processes i (unit: %) for the SWHD formation when compared with mean values. The %PCi is calculated following Eq. (1). The pie chart presents the relative contributions made by three wind components: north–south (NS), east–west (EW), and up–down (UD) for the transport difference (PC_SWHD_tran−PC_SM_tran). Note that carbon here refers to the carbonaceous aerosols, which is the sum of black carbon and organic aerosols.
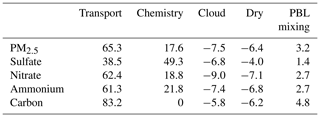
Figure 9 presents the average daily mass fluxes of PM2.5 and its components in the BTH box from each of the six processes over all days during winter from 1985 to 2017 (stripped bars) and over the SWHDs during this period (solid bars). Averaged over all days during winter from 1985 to 2017, the PM2.5 in BTH was mainly contributed by chemical reactions (10.1 Gg d−1) and local emissions (5.5 Gg d−1). Net transport had an effect of −12.1 Gg d−1, exporting the particles to the downwind areas as well as to the upper troposphere. The contributions of turbulent diffusion (PBL mixing), dry deposition, and cloud processes were small, with values of −0.8, −1.8, and −0.9 Gg d−1, respectively. For all days during winter from 1985 to 2017, the sum of all processes had a very small value of 0.004 Gg d−1. During SWHDs in the selected time period, the outflow of particles decreased greatly, from 12.1 Gg d−1 in mean state to 4.8 Gg d−1, which held more particles in BTH. More secondary aerosols were produced through chemical reactions, with an increase from a mean state of 10.0 to 12.0 Gg d−1. The suppressed PBL height further restricted the PM2.5 diffusion with reduced aerosol outflow from 0.8 to 0.4 Gg d−1. Because of the high PM2.5 concentrations during the SWHDs, cloud processes and dry deposition removed more aerosols compared to the mean state. Overall, the sum of all processes had a large positive value of 8.1 Gg d−1, leading to the accumulation of PM2.5 in BTH. The relative contributions of transport, chemistry, cloud processes, dry deposition, and PBL mixing to the SWHDs were 65.3 %, 17.6 %, −7.5 %, −6.4 %, and 3.2 % (Table 1), respectively, indicating that transport was the most important factor that facilitated the occurrence of SWHDs in BTH. Notably, the relative contribution of emissions is zero because the emissions in the model were monthly values, which were the same for either polluted or clean days. During the SWHDs, the relative contribution of transport is the largest for all aerosol species except sulfate (Table 1). For sulfate aerosols, chemical reactions had a large relative contribution of 49.3 %, which is comparable to the transport contribution (39.5 %). This finding highlighted the importance of local chemical production of sulfate during SWHDs. With regard to the carbonaceous aerosols, transport was the dominant process with a relative contribution of 83.2 % since carbonaceous aerosols are assumed to be chemically inert in the model. For nitrate and ammonium, transport had relative contributions of 62.4 % and 61.3 %, respectively. It should be noted that although process analysis is a helpful tool to quantify the contribution of each factor, it assumes a linear contribution from each factor. This may not always be true because of the covariation in meteorological parameters.
Table 1Relative contributions of each of the five processes (transport, chemistry, cloud, dry, and PBL mixing) to SWHD formation in BTH (unit: %). The process analyses are carried out for both PM2.5 and its components, following Eq. (1) described in Sect. 5.
To further explore the wind component (zonal, meridional, or vertical) that contributed most to the transport process, mass fluxes brought by winds in three directions (east–west, north–south, up–down) were also determined for the BTH box from 1985 to 2017. Then, relative contributions were calculated following Eq. (1) except that n is the number for the three directions. The north–south (NS) wind was calculated to have a relative contribution of 93 % and hence a dominant role (pie chart in Fig. 9). This result agrees with previous studies (Q. Li et al., 2016; Cai et al., 2017), which found that anomalous southerlies in the lower troposphere favor the formation and accumulation of PM2.5 during severe haze events.
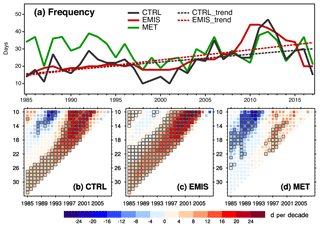
Figure 10(a) Time series of frequencies (days) of regional SWHD in BTH from three simulations (CTRL, EMIS, MET) for 1985 to 2017. (b–e) Time series of linear trends calculated over different periods for simulated frequencies of the (b) CTRL, (c) EMIS, and (d) MET simulations. The x axis indicates the start year, and the y axis indicates the number of years since the start year during which period the trend is calculated. The filled color in each square shows the calculated trend value, and those values marked with black borders are significant above the 95 % confidence level.
Figure 10a shows the time series of regional SWHD frequencies in BTH from 1985 to 2017 based on three simulations (CTRL, EMIS, and MET). In the CTRL simulation, with changes in both emissions and meteorology, the SWHD frequency in BTH increased from 1985 to 2017, with a linear trend of 4.5 d per decade (as described in Sect. 4.2). During 1985–2017, the simulated SWHD frequency exhibited an increasing trend of 5.9 d per decade in EMIS with changes in emissions alone but no significant trend was seen in the MET simulation with variations in meteorological parameters alone. Considering that the frequency trend is dependent on the selected simulation years, we show in Fig. 10b–d a more comprehensive analysis of frequency trends over different selected periods, with a minimum duration of 10 years. Here, the x axis indicates the start year, and the y axis indicates the number of years since the start year during which period the trend is calculated. As shown by the trends in the 10 years since the start year, the CTRL frequency experienced a moderate increase in the late 1980s, a significant decrease beginning in 1991, and a large increase beginning in 1997. Similar patterns are also found in the EMIS and MET simulations, although different magnitudes are simulated. During 1992–2001 when the decreasing trend (−20.1 d per decade) was the largest in the CTRL simulation, the trends in EMIS and MET were −3.3 and −20.1 d per decade, respectively, indicating that the variations in meteorological parameters dominated the decreasing trend over this period. The trend of −3.3 d per decade from 1992 to 2001 in EMIS was consistent with the emission reductions over this period (Fig. 1). During 2003–2012 when the increasing frequency trend (23.6 d per decade) was the largest in the CTRL simulation, the EMIS and MET trends were 27.3 and 12.5 d per decade, respectively, reflecting that both the increases in emissions and changes in meteorological parameters contributed to the increasing trend in CTRL, although the role of meteorology was smaller compared to that of emissions. Notably, the decrease in frequency over the 1990s in MET was mainly caused by the interdecadal variations in atmospheric circulations (Chen and Wang, 2015). The researchers found that compared to the meteorological conditions from 1993 to 2001, those from 1984 to 1992 and 2002 to 2010 were more favorable for the occurrence of severe winter haze events over north China because of the weaker wind speeds and increased moisture in the lower troposphere, weaker East Asian trough in the midtroposphere, and greater northward shift of the East Asian jet stream in the upper troposphere.
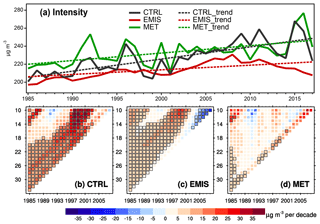
Figure 11(a) Time series of intensities (µg m−3) of regional SWHD in BTH from the three simulations (CTRL, EMIS, MET) for 1985–2017. (b–e) Time series of linear trends calculated over different periods for simulated intensities of the (b) CTRL, (c) EMIS, and (d) MET simulations. The x axis indicates the start year, and the y axis indicates the number of years since the start year during which period the trend is calculated. The filled color in each square shows the calculated trend value, and those marked with black borders are significant above the 95 % confidence level.
Figure 11a shows the time series of the regional SWHD intensities in BTH from 1985 to 2017 based on the CTRL, EMIS, and MET simulations. From 1985 to 2015, the simulated SWHD intensity exhibited increasing trends of 13.5, 5.2, and 8.3 µg m−3 per decade due to changes in both emissions and meteorology, changes in emissions alone, and changes in meteorological parameters alone. Therefore, both anthropogenic emissions and meteorological parameters were major factors that led to high PM2.5 concentrations in the SWHDs in BTH. The intensity in CTRL exhibited an overall increasing trend except for a small decrease from 1992 to 2001 (Fig. 11b), due to the reasons mentioned above.
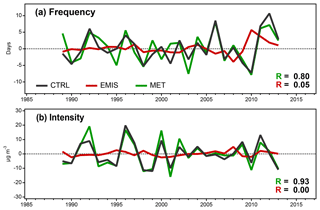
Figure 12Interannual variations in SWHD (a) frequencies (days) and (b) intensities (µg m−3) in BTH through a 9-year weighted moving average method. The nine-point high-pass Lanczos filter was used as the weighting coefficient, which effectively removes fluctuations with periods of more than 9 years and reserves the interannual anomalies. Also shown are the correlation coefficients that were calculated between the interannual signals of the CTRL and MET simulations (green R) and between the results of the CTRL and EMIS simulations (red R).
Additionally, we examine the interannual variations in SWHDs in BTH. The nine-point weighted running mean is employed for the frequencies in Fig. 10a and intensities in Fig. 11a, respectively, to remove the fluctuations in periods of more than 9 years while reserving the interannual anomalies. The weighting coefficients are based on the Lanczos filter (Duchon, 1979). Figure 12 shows the interannual variations in frequencies and intensities from the three simulations (CTRL, EMIS, and MET) from 1989 to 2013. The interannual frequency variation in MET generally resembles that from the CTRL simulation, with a high correlation coefficient R of 0.80 between the simulations, while the R between the interannual variations in CTRL and EMIS is only 0.05 (Fig. 12a). Similarly, for intensity, the interannual variation from the MET exhibited the same peaks and troughs as that in the CTRL simulation, with a high R of 0.93 between the simulations (Fig. 12b). Therefore, the interannual SWHD variations in BTH were mainly driven by variations in meteorological parameters. To quantify the interannual variation caused by the meteorological variations, the relative interannual change ( %IC) was calculated by the following equation:
where MET_IAi and MET_IAi−1 are the interannual anomalies in the MET simulation in years i and i−1, and CTL_Fi−1 is the original frequency or intensity in the CTRL simulation in year i−1. The calculated mean %IC was 26 % for frequency from 1989 to 2013, and 4.6 % for intensity over the same period. Here, the %IC indicates that on average, meteorological variations alone can lead to a change of ±26 % in frequency and ±4.6 % in PM2.5 concentrations for the SWHDs in BTH interannually. This highlights the importance of variations in meteorological parameters for policy makers when actions are taken to improve air quality in the short term.
We investigated the changes in SWHDs (days with observed PM2.5 concentrations larger than 150 µg m−3) from 1985 to 2017 and quantified the respective roles of changes in anthropogenic emissions and meteorological parameters in the simulated SWHD changes using the nested-grid version of the GEOS-Chem model.
The simulated SWHDs were evaluated using the observed PM2.5 concentrations and atmospheric visibility. The GEOS-Chem model captured the daily variations in PM2.5 concentrations fairly well. The correlation coefficient (R) and normalized mean bias (NMB) between the simulated and observed wintertime daily PM2.5 concentrations were 0.61 % and −9.2 % in Beijing from 2009 to 2016, 0.70 % and 18.6 % in Shanghai from 2013 to 2017, and 0.58 % and 28.7 % in Chengdu from 2013 to 2017. The model also captured the SWHD frequency (total severe haze days during winter) and intensity (PM2.5 concentration averaged over severe haze days during winter); compared to the observed SWHD frequency and intensity at 161 grids in China from 2013 to 2017, the simulated frequency had an R of 0.98 and NMB of −12.3 %, and the simulated intensity had an R of 0.58 and NMB of −4.1 %.
The Beijing–Tianjin–Hebei region (BTH) had the highest SWHD frequency and intensity based on the observed PM2.5 concentrations from 2013 to 2017, with a frequency of 21.2 d yr−1 and a mean intensity of 231.6 µg m−3. Historically, from 1985 to 2017, with changes in emissions and meteorology, the simulated SWHD frequency in BTH increased with a linear trend of 4.5 d per decade, and the simulated intensity increased by 13.5 µg m−3 per decade, which was larger than the increase in the seasonal mean PM2.5 concentration (10.1 µg m−3 per decade). Further process analysis was carried out to identify the key processes for SWHD occurrences in BTH. The comparisons of the six processes (emission, transport, chemistry, cloud processes, dry deposition, and PBL mixing) averaged over the SWHDs with those averaged over all days during winters from 1985 to 2017 indicate that transport (outflow of particles) had the largest change from −12.1 Gg d−1 in the mean state to −4.8 Gg d−1 in SWHDs, which had the largest contribution to SWHD formation. Transport, chemistry, cloud processes, dry deposition, and PBL mixing had relative contributions of 65.3 %, 17.6 %, −7.5 %, −6.4 %, and 3.2 %, respectively, to SWHD formation.
From 1985 to 2017, the simulated frequency of SWHDs in BTH experienced several stages, including an increase from 14 d in 1985 to 29 d in 1992, a sudden drop to 10 d in 2001, a rapid growth to the peak of 47 d in 2012, and a steep decrease thereafter to 15 d in 2017. Sensitivity studies showed that the decrease in frequency from 1992 to 2001 was mainly caused by changes in meteorological parameters. From 2003 to 2012, when the SWHD frequency increased sharply, the simulated frequency trends were 23.6, 27.3, and 12.5 d per decade owing to the changes in both emissions and meteorology, emissions alone, and meteorology alone, respectively, highlighting the contributions of both emissions and meteorological parameters. Interestingly, the simulated SWHD intensity in BTH increased steadily from 1985 to 2017; variations in emissions alone and meteorology alone both enhanced the intensity growth with trends of 5.2 and 8.3 µg m−3 per decade, respectively. These results suggest that meteorological parameters must be considered for the control of SWHDs.
Note that a number of factors contribute to the uncertainties in our results. We obtained long-term SWHDs by using the observed atmospheric visibility, which were influenced by the changes in the way of observation or relocation of observation site, especially before 2013 when observations were carried out manually. The uncertainties with emissions inventories of aerosols and aerosol precursors might lead to uncertainties in our simulated decadal changes in aerosol concentrations. Furthermore, we only accounted for anthropogenic aerosols in our simulations; natural aerosols, such as secondary organic aerosol, mineral dust, and biomass burning aerosols, contributed to the observed changes in SWHDs and should be considered for in model simulation. These issues need to be examined in future studies of severe haze trend over eastern China.
The GEOS-Chem model is an open-access model developed by the Atmospheric Chemistry Modeling group at Harvard University with support from institutes in North America, Europe, and Asia. The source codes (v11-01) can be downloaded from http://acmg.seas.harvard.edu/geos/ (Harvard University, 2019). The observed PM2.5 concentrations for 670 sites from 2013 to 2018 were derived from the national air quality monitoring network, which were managed by the China National Environmental Monitoring Centre (CNEMC) under open access at http://www.cnemc.cn (CNEMC, 2019). The long-term PM2.5 measurements at the Beijing site (2009–2017) were created by the US embassy and can be downloaded from http://www.stateair.net/web/post/1/1.html (US embassy, 2019). The long-term visibility observations were taken from the Global Summary of Day (GSOD) database which is hosted by NOAA's National Climatic Data Center (NCDC), which is available at https://www7.ncdc.noaa.gov/CDO/cdoselect.cmd (NCDC, 2019).
The supplement related to this article is available online at: https://doi.org/10.5194/acp-19-10801-2019-supplement.
HL and RD conceived of the study and designed the experiments. RD carried out the simulations and performed the analysis. RD and HL prepared the paper.
The authors declare that they have no conflict of interest.
This article is part of the special issue “Regional transport and transformation of air pollution in eastern China”. It is not associated with a conference.
We acknowledge the CNEMC, US embassy, NCDC, EDGAR, and MEP teams for making their data publicly available. We acknowledge the efforts of GEOS-Chem working groups for developing and managing the model.
This research has been supported by the National Natural Science Foundation of China (grant nos. 91544219, 91744311, and 41475137).
This paper was edited by Hailong Wang and reviewed by two anonymous referees.
Alexander, B., Park, R. J., Jacob, D. J., Li, Q. B., Yantosca, R. M., Savarino, J., Lee, C. C. W., and Thiemens, M. H.: Sulfate formation in sea-salt aerosols: Constraints from oxygen isotopes, J. Geophys. Res.-Atmos., 110, D10307, https://doi.org/10.1029/2004jd005659, 2005.
Bey, I., Jacob, D. J., Yantosca, R. M., Logan, J. A., Field, B. D., Fiore, A. M., Li, Q. B., Liu, H. G. Y., Mickley, L. J., and Schultz, M. G.: Global modeling of tropospheric chemistry with assimilated meteorology: Model description and evaluation, J. Geophys. Res.-Atmos., 106, 23073–23095, https://doi.org/10.1029/2001jd000807, 2001.
Bond, T. C., Bhardwaj, E., Dong, R., Jogani, R., Jung, S. K., Roden, C., Streets, D. G., and Trautmann, N. M.: Historical emissions of black and organic carbon aerosol from energy-related combustion, 1850–2000, Global Biogeochem. Cy., 21, Gb2018, https://doi.org/10.1029/2006gb002840, 2007.
Cai, W., Li, K., Liao, H., Wang, H., and Wu, L.: Weather conditions conducive to Beijing severe haze more frequent under climate change, Nat. Clim. Change, 7, 257–262, https://doi.org/10.1038/nclimate3249, 2017.
Chang, D., Song, Y., and Liu, B.: Visibility trends in six megacities in China 1973–2007, Atmos. Res., 94, 161–167, https://doi.org/10.1016/j.atmosres.2009.05.006, 2009.
Che, H. Z., Zhang, X. Y., Li, Y., Zhou, Z. J., and Qu, J. J.: Horizontal visibility trends in China 1981–2005, Geophys. Res. Lett., 34, L24706, https://doi.org/10.1029/2007gl031450, 2007.
Chen, H. P. and Wang, H. J.: Haze Days in North China and the associated atmospheric circulations based on daily visibility data from 1960 to 2012, J. Geophys. Res.-Atmos., 120, 5895–5909, https://doi.org/10.1002/2015jd023225, 2015.
Chen, L., Zhu, J., Liao, H., Gao, Y., Qiu, Y., Zhang, M., and Li, N.: Assessing the formation and evolution mechanisms of severe haze pollution in Beijing–Tianjin–Hebei region by using process analysis, Atmos. Chem. Phys. Discuss., https://doi.org/10.5194/acp-2019-245, in review, 2019.
CNEMC: PM2.5 monitoring network, available at: http://www.cnemc.cn, last access: 15 August 2019.
Crippa, M., Guizzardi, D., Muntean, M., Schaaf, E., Dentener, F., van Aardenne, J. A., Monni, S., Doering, U., Olivier, J. G. J., Pagliari, V., and Janssens-Maenhout, G.: Gridded emissions of air pollutants for the period 1970–2012 within EDGAR v4.3.2, Earth Syst. Sci. Data, 10, 1987–2013, https://doi.org/10.5194/essd-10-1987-2018, 2018.
Deng, J. J., Du, K., Wang, K., Yuan, C. S., and Zhao, J. J.: Long-term atmospheric visibility trend in Southeast China, 1973–2010, Atmos. Environ., 59, 11–21, https://doi.org/10.1016/j.atmosenv.2012.05.023, 2012.
Ding, Y. H. and Liu, Y. J.: Analysis of long-term variations of fog and haze in China in recent 50 years and their relations with atmospheric humidity, Sci. China Earth Sci., 57, 36–46, https://doi.org/10.1007/s11430-013-4792-1, 2014.
Duan, F. K., He, K. B., Ma, Y. L., Yang, F. M., Yu, X. C., Cadle, S. H., Chan, T., and Mulawa, P. A.: Concentration and chemical characteristics of PM2.5 in Beijing, China: 2001–2002, Sci. Total Environ., 355, 264–275, https://doi.org/10.1016/j.scitotenv.2005.03.001, 2006.
Duchon, C. E.: Lanczos Filtering in One and Two Dimensions, J. Appl. Meteorol., 18, 1016–1022, https://doi.org/10.1175/1520-0450(1979)018<1016:lfioat>2.0.co;2, 1979.
EC-JRC/PBL: European Commission, Joint Research Center/Netherlands Environmental Assessment Agency, Emission Database for Global Atmospheric Research version 4.2, available at: http://edgar.jrc.ec.europa.eu (last access: 15 August 2019), 2011.
Evans, M. J. and Jacob, D. J.: Impact of new laboratory studies of N2O5 hydrolysis on global model budgets of tropospheric nitrogen oxides, ozone, and OH, Geophys. Res. Lett., 32, L09813, https://doi.org/10.1029/2005gl022469, 2005.
Fairlie, T. D., Jacob, D. J., and Park, R. J.: The impact of transpacific transport of mineral dust in the United States, Atmos. Environ., 41, 1251–1266, https://doi.org/10.1016/j.atmosenv.2006.09.048, 2007.
Fountoukis, C. and Nenes, A.: ISORROPIA II: a computationally efficient thermodynamic equilibrium model for K+----Na+---Cl−-H2O aerosols, Atmos. Chem. Phys., 7, 4639–4659, https://doi.org/10.5194/acp-7-4639-2007, 2007.
Fu, C. B., Wu, J., Gao, Y. C., Zhao, D. M., and Han, Z. W.: Consecutive extreme visibility events in China during 1960–2009, Atmos. Environ., 68, 1–7, https://doi.org/10.1016/j.atmosenv.2012.11.035, 2013.
Gao, M., Guttikunda, S. K., Carmichael, G. R., Wang, Y. S., Liu, Z. R., Stanier, C. O., Saide, P. E., and Yu, M.: Health impacts and economic losses assessment of the 2013 severe haze event in Beijing area, Sci. Total Environ., 511, 553–561, https://doi.org/10.1016/j.scitotenv.2015.01.005, 2015a.
Gao, Y., Zhang, M., Liu, Z., Wang, L., Wang, P., Xia, X., Tao, M., and Zhu, L.: Modeling the feedback between aerosol and meteorological variables in the atmospheric boundary layer during a severe fog-haze event over the North China Plain, Atmos. Chem. Phys., 15, 4279–4295, https://doi.org/10.5194/acp-15-4279-2015, 2015b.
Gelaro, R., McCarty, W., Suarez, M. J., Todling, R., Molod, A., Takacs, L., Randles, C. A., Darmenov, A., Bosilovich, M. G., Reichle, R., Wargan, K., Coy, L., Cullather, R., Draper, C., Akella, S., Buchard, V., Conaty, A., da Silva, A. M., Gu, W., Kim, G. K., Koster, R., Lucchesi, R., Merkova, D., Nielsen, J. E., Partyka, G., Pawson, S., Putman, W., Rienecker, M., Schubert, S. D., Sienkiewicz, M., and Zhao, B.: The Modern-Era Retrospective Analysis for Research and Applications, Version 2 (MERRA-2), J. Climate, 30, 5419–5454, https://doi.org/10.1175/jcli-d-16-0758.1, 2017.
Gonçalves, M., Jiménez-Guerrero, P., and Baldasano, J. M.: Contribution of atmospheric processes affecting the dynamics of air pollution in South-Western Europe during a typical summertime photochemical episode, Atmos. Chem. Phys., 9, 849–864, https://doi.org/10.5194/acp-9-849-2009, 2009.
Hao, J. M., Tian, H. Z., and Lu, Y. Q.: Emission inventories of NOx from commercial energy consumption in China, 1995–1998, Environ. Sci. Technol., 36, 552–560, https://doi.org/10.1021/es015601k, 2002.
Harvard University: GEOS-Chem model, available at: http://acmg.seas.harvard.edu/geos/, last access: 15 August 2019.
Huang, X., Song, Y., Zhao, C., Li, M. M., Zhu, T., Zhang, Q., and Zhang, X. Y.: Pathways of sulfate enhancement by natural and anthropogenic mineral aerosols in China, J. Geophys. Res.-Atmos., 119, 14165–14179, https://doi.org/10.1002/2014jd022301, 2014.
Jacob, D. J.: Heterogeneous chemistry and tropospheric ozone, Atmos. Environ., 34, 2131–2159, https://doi.org/10.1016/s1352-2310(99)00462-8, 2000.
Jeong, J. I. and Park, R. J.: Effects of the meteorological variability on regional air quality in East Asia, Atmos. Environ., 69, 46–55, https://doi.org/10.1016/j.atmosenv.2012.11.061, 2013.
Jia, B., Wang, Y., Yao, Y., and Xie, Y.: A new indicator on the impact of large-scale circulation on wintertime particulate matter pollution over China, Atmos. Chem. Phys., 15, 11919–11929, https://doi.org/10.5194/acp-15-11919-2015, 2015.
Jiang, J. K., Zhou, W., Cheng, Z., Wang, S. X., He, K. B., and Hao, J. M.: Particulate Matter Distributions in China during a Winter Period with Frequent Pollution Episodes (January 2013), Aerosol Air Qual. Res., 15, 494–503, https://doi.org/10.4209/aaqr.2014.04.0070, 2015.
Lelieveld, J., Evans, J. S., Fnais, M., Giannadaki, D., and Pozzer, A.: The contribution of outdoor air pollution sources to premature mortality on a global scale, Nature, 525, 367–371, https://doi.org/10.1038/nature15371, 2015.
Li, J., Li, C. C., Zhao, C. S., and Su, T. N.: Changes in surface aerosol extinction trends over China during 1980-2013 inferred from quality-controlled visibility data, Geophys. Res. Lett., 43, 8713–8719, https://doi.org/10.1002/2016gl070201, 2016.
Li, J., Du, H. Y., Wang, Z. F., Sun, Y. L., Yang, W. Y., Li, J. J., Tang, X., and Fu, P. Q.: Rapid formation of a severe regional winter haze episode over a mega-city cluster on the North China Plain, Environ. Pollut., 223, 605–615, https://doi.org/10.1016/j.envpol.2017.01.063, 2017.
Li, J., Li, C., and Zhao, C.: Different trends in extreme and median surface aerosol extinction coefficients over China inferred from quality-controlled visibility data, Atmos. Chem. Phys., 18, 3289–3298, https://doi.org/10.5194/acp-18-3289-2018, 2018a.
Li, J., Sun, J., Zhou, M., Cheng, Z., Li, Q., Cao, X., and Zhang, J.: Observational analyses of dramatic developments of a severe air pollution event in the Beijing area, Atmos. Chem. Phys., 18, 3919–3935, https://doi.org/10.5194/acp-18-3919-2018, 2018b.
Li, K., Liao, H., Cai, W. J., and Yang, Y.: Attribution of Anthropogenic Influence on Atmospheric Patterns Conducive to Recent Most Severe Haze Over Eastern China, Geophys. Res. Lett., 45, 2072–2081, https://doi.org/10.1002/2017gl076570, 2018.
Li, M., Zhang, Q., Kurokawa, J.-I., Woo, J.-H., He, K., Lu, Z., Ohara, T., Song, Y., Streets, D. G., Carmichael, G. R., Cheng, Y., Hong, C., Huo, H., Jiang, X., Kang, S., Liu, F., Su, H., and Zheng, B.: MIX: a mosaic Asian anthropogenic emission inventory under the international collaboration framework of the MICS-Asia and HTAP, Atmos. Chem. Phys., 17, 935–963, https://doi.org/10.5194/acp-17-935-2017, 2017.
Li, Q., Zhang, R., and Wang, Y.: Interannual variation of the wintertime fog-haze days across central and eastern China and its relation with East Asian winter monsoon, Int. J. Climatol., 36, 346–354, https://doi.org/10.1002/joc.4350, 2016.
Liu, H. Y., Jacob, D. J., Bey, I., and Yantosca, R. M.: Constraints from 210Pb and 7Be on wet deposition and transport in a global three-dimensional chemical tracer model driven by assimilated meteorological fields, J. Geophys. Res.-Atmos., 106, 12109–12128, https://doi.org/10.1029/2000jd900839, 2001.
Liu, X. G., Li, J., Qu, Y., Han, T., Hou, L., Gu, J., Chen, C., Yang, Y., Liu, X., Yang, T., Zhang, Y., Tian, H., and Hu, M.: Formation and evolution mechanism of regional haze: a case study in the megacity Beijing, China, Atmos. Chem. Phys., 13, 4501–4514, https://doi.org/10.5194/acp-13-4501-2013, 2013.
Lou, S. J., Liao, H., Yang, Y., and Mu, Q.: Simulation of the interannual variations of tropospheric ozone over China: Roles of variations in meteorological parameters and anthropogenic emissions, Atmos. Environ., 122, 839–851, https://doi.org/10.1016/j.atmosenv.2015.08.081, 2015.
Lu, Z., Zhang, Q., and Streets, D. G.: Sulfur dioxide and primary carbonaceous aerosol emissions in China and India, 1996–2010, Atmos. Chem. Phys., 11, 9839–9864, https://doi.org/10.5194/acp-11-9839-2011, 2011.
Ma, Q., Wu, Y., Zhang, D., Wang, X., Xia, Y., Liu, X., Tian, P., Han, Z., Xia, X., Wang, Y., and Zhang, R.: Roles of regional transport and heterogeneous reactions in the PM2.5 increase during winter haze episodes in Beijing, Sci. Total Environ., 599–600, 246–253, https://doi.org/10.1016/j.scitotenv.2017.04.193, 2017.
Mu, Q. and Liao, H.: Simulation of the interannual variations of aerosols in China: role of variations in meteorological parameters, Atmos. Chem. Phys., 14, 9597–9612, https://doi.org/10.5194/acp-14-9597-2014, 2014.
NCDC: GSOD visibility dataset, available at: https://www7.ncdc.noaa.gov/CDO/cdoselect.cmd, last access: 15 August 2019.
Ohara, T., Akimoto, H., Kurokawa, J., Horii, N., Yamaji, K., Yan, X., and Hayasaka, T.: An Asian emission inventory of anthropogenic emission sources for the period 1980–2020, Atmos. Chem. Phys., 7, 4419–4444, https://doi.org/10.5194/acp-7-4419-2007, 2007.
Park, R. J., Jacob, D. J., Chin, M., and Martin, R. V.: Sources of carbonaceous aerosols over the United States and implications for natural visibility, J. Geophys. Res.-Atmos., 108, 4355, https://doi.org/10.1029/2002jd003190, 2003.
Park, R. J., Jacob, D. J., Field, B. D., Yantosca, R. M., and Chin, M.: Natural and transboundary pollution influences on sulfate-nitrate-ammonium aerosols in the United States: Implications for policy, J. Geophys. Res.-Atmos., 109, D15204, https://doi.org/10.1029/2003jd004473, 2004.
Pye, H. O. T., Liao, H., Wu, S., Mickley, L. J., Jacob, D. J., Henze, D. K., and Seinfeld, J. H.: Effect of changes in climate and emissions on future sulfate-nitrate-ammonium aerosol levels in the United States, J. Geophys. Res.-Atmos., 114, D01205, https://doi.org/10.1029/2008jd010701, 2009.
Streets, D. G. and Aunan, K.: The importance of China's household sector for black carbon emissions, Geophys. Res. Lett., 32, L12708, https://doi.org/10.1029/2005gl022960, 2005.
Streets, D. G., Tsai, N. Y., Akimoto, H., and Oka, K.: Sulfur dioxide emissions in Asia in the period 1985–1997, Atmos. Environ., 34, 4413–4424, https://doi.org/10.1016/s1352-2310(00)00187-4, 2000.
Sun, Y. L., Jiang, Q., Wang, Z. F., Fu, P. Q., Li, J., Yang, T., and Yin, Y.: Investigation of the sources and evolution processes of severe haze pollution in Beijing in January 2013, J. Geophys. Res.-Atmos., 119, 4380–4398, https://doi.org/10.1002/2014jd021641, 2014.
Sun, Y. L., Chen, C., Zhang, Y. J., Xu, W. Q., Zhou, L. B., Cheng, X. L., Zheng, H. T., Ji, D. S., Li, J., Tang, X., Fu, P. Q., and Wang, Z. F.: Rapid formation and evolution of an extreme haze episode in Northern China during winter 2015, Sci. Rep.-UK, 6, 27151, https://doi.org/10.1038/srep27151, 2016.
Thornton, J. A., Jaegle, L., and McNeill, V. F.: Assessing known pathways for HO2 loss in aqueous atmospheric aerosols: Regional and global impacts on tropospheric oxidants, J. Geophys. Res.-Atmos., 113, D05303, https://doi.org/10.1029/2007jd009236, 2008.
Tie, X., Huang, R.-J., Cao, J., Zhang, Q., Cheng, Y., Su, H., Chang, D., Pöschl, U., Hoffmann, T., Dusek, U., Li, G., Worsnop, D. R., and O'Dowd, C. D.: Severe Pollution in China Amplified by Atmospheric Moisture, Sci. Rep.-UK, 7, 15760, https://doi.org/10.1038/s41598-017-15909-1, 2017.
US embassy: PM2.5 observations, available at: http://www.stateair.net/web/post/1/1.html, last access: 15 August 2019.
van der Werf, G. R., Randerson, J. T., Giglio, L., van Leeuwen, T. T., Chen, Y., Rogers, B. M., Mu, M., van Marle, M. J. E., Morton, D. C., Collatz, G. J., Yokelson, R. J., and Kasibhatla, P. S.: Global fire emissions estimates during 1997–2016, Earth Syst. Sci. Data, 9, 697–720, https://doi.org/10.5194/essd-9-697-2017, 2017.
Wang, H., Xu, J. Y., Zhang, M., Yang, Y. Q., Shen, X. J., Wang, Y. Q., Chen, D., and Guo, J. P.: A study of the meteorological causes of a prolonged and severe haze episode in January 2013 over central-eastern China, Atmos. Environ., 98, 146–157, https://doi.org/10.1016/j.atmosenv.2014.08.053, 2014a.
Wang, L. T., Wei, Z., Yang, J., Zhang, Y., Zhang, F. F., Su, J., Meng, C. C., and Zhang, Q.: The 2013 severe haze over southern Hebei, China: model evaluation, source apportionment, and policy implications, Atmos. Chem. Phys., 14, 3151–3173, https://doi.org/10.5194/acp-14-3151-2014, 2014b.
Wang, X. Q., Wei, W., Cheng, S. Y., Li, J. B., Zhang, H. Y., and Lv, Z.: Characteristics and classification of PM2.5 pollution episodes in Beijing from 2013 to 2015, Sci. Total Environ., 612, 170–179, https://doi.org/10.1016/j.scitotenv.2017.08.206, 2018.
Wang, Y., Zhang, Q. Q., He, K., Zhang, Q., and Chai, L.: Sulfate-nitrate-ammonium aerosols over China: response to 2000–2015 emission changes of sulfur dioxide, nitrogen oxides, and ammonia, Atmos. Chem. Phys., 13, 2635–2652, https://doi.org/10.5194/acp-13-2635-2013, 2013.
Wang, Y. H., Jacob, D. J., and Logan, J. A.: Global simulation of tropospheric O3-NOx-hydrocarbon chemistry 1. Model formulation, J. Geophys. Res.-Atmos., 103, 10713–10725, https://doi.org/10.1029/98jd00158, 1998.
Wang, Y. H., Liu, Z. R., Zhang, J. K., Hu, B., Ji, D. S., Yu, Y. C., and Wang, Y. S.: Aerosol physicochemical properties and implications for visibility during an intense haze episode during winter in Beijing, Atmos. Chem. Phys., 15, 3205–3215, https://doi.org/10.5194/acp-15-3205-2015, 2015.
Wesely, M. L.: Parameterization of surface resistances to gaseous dry deposition in regional-scale numerical models, Atmos. Environ., 23, 1293–1304, https://doi.org/10.1016/0004-6981(89)90153-4, 1989.
Wu, P., Ding, Y., and Liu, Y.: Atmospheric circulation and dynamic mechanism for persistent haze events in the Beijing–Tianjin–Hebei region, Adv. Atmos. Sci., 34, 429–440, https://doi.org/10.1007/s00376-016-6158-z, 2017.
Xiao, Y. P., Logan, J. A., Jacob, D. J., Hudman, R. C., Yantosca, R., and Blake, D. R.: Global budget of ethane and regional constraints on US sources, J. Geophys. Res.-Atmos., 113, D21306, https://doi.org/10.1029/2007jd009415, 2008.
Yang, Y., Liao, H., and Lou, S.: Increase in winter haze over eastern China in recent decades: Roles of variations in meteorological parameters and anthropogenic emissions, J. Geophys. Res.-Atmos., 121, 13050–13065, https://doi.org/10.1002/2016jd025136, 2016.
Yang, Y., Wang, H. L., Smith, S. J., Zhang, R. D., Lou, S. J., Qian, Y., Ma, P. L., and Rasch, P. J.: Recent intensification of winter haze in China linked to foreign emissions and meteorology, Sci. Rep.-UK, 8, 2107, https://doi.org/10.1038/s41598-018-20437-7, 2018.
Zhang, B., Wang, Y., and Hao, J.: Simulating aerosol–radiation–cloud feedbacks on meteorology and air quality over eastern China under severe haze conditionsin winter, Atmos. Chem. Phys., 15, 2387–2404, https://doi.org/10.5194/acp-15-2387-2015, 2015.
Zhang, L., Wang, T., Lv, M. Y., and Zhang, Q.: On the severe haze in Beijing during January 2013: Unraveling the effects of meteorological anomalies with WRF-Chem, Atmos. Environ., 104, 11–21, https://doi.org/10.1016/j.atmosenv.2015.01.001, 2015.
Zhang, Q., Jiang, X. J., Tong, D., Davis, S. J., Zhao, H. Y., Geng, G. N., Feng, T., Zheng, B., Lu, Z. F., Streets, D. G., Ni, R. J., Brauer, M., van Donkelaar, A., Martin, R. V., Huo, H., Liu, Z., Pan, D., Kan, H. D., Yan, Y. Y., Lin, J. T., He, K. B., and Guan, D. B.: Transboundary health impacts of transported global air pollution and international trade, Nature, 543, 705–709, https://doi.org/10.1038/nature21712, 2017.
Zhang, R. H., Li, Q., and Zhang, R. N.: Meteorological conditions for the persistent severe fog and haze event over eastern China in January 2013, Sci. China Earth Sci., 57, 26–35, https://doi.org/10.1007/s11430-013-4774-3, 2014.
Zhang, Y., Vijayaraghavan, K., Wen, X. Y., Snell, H. E., and Jacobson, M. Z.: Probing into regional ozone and particulate matter pollution in the United States: 1. A 1 year CMAQ simulation and evaluation using surface and satellite data, J. Geophys. Res.-Atmos., 114, D22304, https://doi.org/10.1029/2009jd011898, 2009.
Zhao, P. S., Dong, F., He, D., Zhao, X. J., Zhang, X. L., Zhang, W. Z., Yao, Q., and Liu, H. Y.: Characteristics of concentrations and chemical compositions for PM2.5 in the region of Beijing, Tianjin, and Hebei, China, Atmos. Chem. Phys., 13, 4631–4644, https://doi.org/10.5194/acp-13-4631-2013, 2013a.
Zhao, X. J., Zhao, P. S., Xu, J., Meng,, W., Pu, W. W., Dong, F., He, D., and Shi, Q. F.: Analysis of a winter regional haze event and its formation mechanism in the North China Plain, Atmos. Chem. Phys., 13, 5685–5696, https://doi.org/10.5194/acp-13-5685-2013, 2013b.
Zheng, B., Zhang, Q., Zhang, Y., He, K. B., Wang, K., Zheng, G. J., Duan, F. K., Ma, Y. L., and Kimoto, T.: Heterogeneous chemistry: a mechanism missing in current models to explain secondary inorganic aerosol formation during the January 2013 haze episode in North China, Atmos. Chem. Phys., 15, 2031–2049, https://doi.org/10.5194/acp-15-2031-2015, 2015.
Zheng, B., Tong, D., Li, M., Liu, F., Hong, C., Geng, G., Li, H., Li, X., Peng, L., Qi, J., Yan, L., Zhang, Y., Zhao, H., Zheng, Y., He, K., and Zhang, Q.: Trends in China's anthropogenic emissions since 2010 as the consequence of clean air actions, Atmos. Chem. Phys., 18, 14095–14111, https://doi.org/10.5194/acp-18-14095-2018, 2018.
Zheng, G. J., Duan, F. K., Su, H., Ma, Y. L., Cheng, Y., Zheng, B., Zhang, Q., Huang, T., Kimoto, T., Chang, D., Pöschl, U., Cheng, Y. F., and He, K. B.: Exploring the severe winter haze in Beijing: the impact of synoptic weather, regional transport and heterogeneous reactions, Atmos. Chem. Phys., 15, 2969–2983, https://doi.org/10.5194/acp-15-2969-2015, 2015.
Zhu, W. H., Xu, X. D., Zheng, J., Yan, P., Wang, Y. J., and Cai, W. Y.: The characteristics of abnormal wintertime pollution events in the Jing-Jin-Ji region and its relationships with meteorological factors, Sci. Total Environ., 626, 887–898, https://doi.org/10.1016/j.scitotenv.2018.01.083, 2018.
- Abstract
- Introduction
- Methods
- Simulated severe winter haze and model evaluation
- Simulated decadal changes in severe winter haze days
- Key processes for the occurrence of SWHDs over BTH
- Roles of anthropogenic emissions and meteorological parameters
- Conclusions
- Data availability
- Author contributions
- Competing interests
- Special issue statement
- Acknowledgements
- Financial support
- Review statement
- References
- Supplement


