the Creative Commons Attribution 4.0 License.
the Creative Commons Attribution 4.0 License.
 | 21 Aug 2019
Preliminary results from the FARCE 2015 campaign: multidisciplinary study of the forest–gas–aerosol–cloud system on the tropical island of La Réunion
Valentin Duflot
Pierre Tulet
Olivier Flores
Christelle Barthe
Aurélie Colomb
Laurent Deguillaume
Mickael Vaïtilingom
Anne Perring
Alex Huffman
Mark T. Hernandez
Karine Sellegri
Ellis Robinson
David J. O'Connor
Odessa M. Gomez
Frédéric Burnet
Thierry Bourrianne
Dominique Strasberg
Manon Rocco
Allan K. Bertram
Patrick Chazette
Julien Totems
Jacques Fournel
Pierre Stamenoff
Jean-Marc Metzger
Mathilde Chabasset
Clothilde Rousseau
Eric Bourrianne
Martine Sancelme
Anne-Marie Delort
Rachel E. Wegener
Cedric Chou
Pablo Elizondo
The Forests gAses aeRosols Clouds Exploratory (FARCE) campaign was conducted in March–April 2015 on the tropical island of La Réunion. For the first time, several scientific teams from different disciplines collaborated to provide reference measurements and characterization of La Réunion vegetation, volatile organic compounds (VOCs), biogenic VOCs (BVOCs), (bio)aerosols and composition of clouds, with a strong focus on the Maïdo mountain slope area. The main observations obtained during this 2-month intensive field campaign are summarized. They include characterizations of forest structure, concentrations of VOCs and precursors emitted by forests, aerosol loading and optical properties in the planetary boundary layer (PBL), formation of new particles by nucleation of gas-phase precursors, ice-nucleating particles concentrations, and biological loading in both cloud-free and cloudy conditions. Simulations and measurements confirm that the Maïdo Observatory lies within the PBL from late morning to late evening and that, when in the PBL, the main primary sources impacting the Maïdo Observatory are of marine origin via the Indian Ocean and of biogenic origin through the dense forest cover. They also show that (i) the marine source prevails less and less while reaching the observatory; (ii) when in the PBL, depending on the localization of a horizontal wind shear, the Maïdo Observatory can be affected by air masses coming directly from the ocean and passing over the Maïdo mountain slope, or coming from inland; (iii) bio-aerosols can be observed in both cloud-free and cloudy conditions at the Maïdo Observatory; (iv) BVOC emissions by the forest covering the Maïdo mountain slope can be transported upslope within clouds and are a potential cause of secondary organic aerosol formation in the aqueous phase at the Maïdo Observatory; and (v) the simulation of dynamics parameters, emitted BVOCs and cloud life cycle in the Meso-NH model are realistic, and more advanced Meso-NH simulations should use an increased horizontal resolution (100 m) to better take into account the orography and improve the simulation of the wind shear front zone within which lies the Maïdo Observatory. Using various observations and simulations, this work draws up an inventory of the in situ studies that could be performed in La Réunion and at the Maïdo Observatory. It also aims to develop scientific collaborations and to support future scientific projects in order to better understand the forest–gas–aerosol–cloud system in an insular tropical environment.
- Article
(14268 KB) - Full-text XML
- BibTeX
- EndNote


Forests, gases (especially biogenic volatile organic compounds, BVOCs), aerosols (especially secondary organic aerosols, SOAs) and clouds are linked through deep, complex, and interdependent bio-physico-chemical mechanisms. Forests emit BVOCs whose oxidative products may undergo a phase transition and form SOA in the gas-phase chemistry (van Donkelaar et al., 2007; Carlton et al., 2009) or after dissolution and photo-oxidation in cloud water (Yao Liu et al., 2009; Chen et al., 2007; Hallquist et al., 2009; Ervens et al., 2011; Couvidat et al., 2013). Aside from modifying the Earth's radiative budget through their direct effects via scattering and absorption of radiation, aerosols also produce semi-indirect and indirect effects that modify the dynamics of the atmosphere and the cloud life cycle by adjusting their radiative and microphysical properties. Plants also release primary biological aerosol particles (PBAPs) (Després et al., 2012), which have the unique potential to act as cloud and ice nuclei under atmospheric conditions that do not trigger these impacts with any other materials (Pope, 2010; Morris et al., 2014). Finally, clouds bring water to forests, some of these which – the cloud forests – are strongly linked to the regular cycles of cloud formation.
The unrefined mechanisms stated above only exemplify the intricacy of the exchanges and interactions between forests, gases, aerosols and clouds, which imply microphysics, biochemistry and dynamics and remain one of the largest source of uncertainties in the climate system (Kulmala et al., 2004; Fuzzi et al., 2006; Boucher et al., 2013; Gettelman, 2015).
In a given thermodynamic environment, aerosol particles can be activated and nucleate cloud particles. Properties of aerosols related to their role of condensation nuclei (number, size distribution, chemical composition) have a strong impact on the chemical and physical properties of the cloud droplets formed and widely impact the cloud life cycle (Twomey, 1977; Albrecht, 1989). The partial absorption of the incoming solar radiation by light-absorbing aerosols inside the cloud locally heats the atmosphere, which can inhibit cloud formation and lead to partial evaporation of the existing clouds. However, the aerosol effects on clouds remain uncertain due to the complex dynamics–microphysics interactions (Stevens and Feingold, 2009; Boucher et al., 2013).
PBAPs are a subset of atmospheric aerosol arising from primary emissions of biological particles including plant and insect debris, spores, pollens, cells, viruses, bacteria and their component parts (Després et al., 2012). PBAPs can account for a substantial fraction (10 %–90 %) of supermicron aerosol number in a wide variety of environments (Pöschl et al., 2010; Huffman et al., 2013; Perring et al., 2015) and they are known to cause diseases and allergenic reactions in humans, animals and plants. Aside from their impacts on global biodiversity and disease transmission, PBAPs can potentially affect cloud microphysical processes because of the ability of some PBAPs to act as “giant” cloud condensation nuclei (CCN) and ice nuclei (IN) at temperatures up to −2 ∘C (Schnell and Vali, 1975; Diehl et al., 2001, 2002; Després et al., 2012). The effects of PBAPs on clouds and precipitation processes may strongly affect the location, amount and type (snow vs. rain) of precipitation and will have related impacts on cloud lifetime and optical properties (Vali et al., 1976). In part because few measurements exist to constrain their concentrations on regional and global scales, PBAP abundance in the atmosphere is poorly constrained and potential feedback on cloud hydrological pathways is not yet included in climate models (Gabey et al., 2010; Fröhlich-Nowoisky et al., 2016; Després et al., 2012). Further, ice-active bacteria and other PBAP have been hypothesized to play important roles in promoting increased rainfall, regulated by complex natural cycles (Pöschl et al., 2010; Morris et al., 2014, 2017).
Plants contain a number of BVOCs, including isoprene, terpenes, alcohols, aldehydes, ketones and esters (Meigh, 1955), which may be widely distributed throughout plant organs. Individual plant species have unique combinations of these compounds; consequently, the emission pattern for each species is also specific. For a given plant, its conditions, developmental stage, the occurrence of injury or damage, and its environment – mainly ambient temperature, light intensity and air pollution – control BVOC emissions (Kesselmeier and Staudt, 1999; Zemankova et al., 2010). The biological importance of these compounds is still debated; however, it appears that they may be important in intra-plant competition (Harborne, 1988); light or heat damage prevention (Singaas et al., 1997); and defence against pathogens, parasites or herbivores (Holopainen, 2004).
Because BVOCs substantially impact the tropospheric budget of carbon monoxide (CO), hydroxyl radical (OH) and low-level ozone (Granier et al., 2000; Poisson et al., 2000; Pfister et al., 2008), they are also an important atmospheric constituent influencing the oxidative capacity of the atmosphere (Houweling et al., 1998; Taraborrelli et al., 2012) on regional (e.g. Solmon et al., 2004; Curci et al., 2009; Sartelet et al., 2012) as well as global scales (e.g. Brasseur et al., 1998; Gauss et al., 2006; Sindelarova et al., 2014).
In addition to the significance in the gas-phase chemistry, SOA can be formed from oxidative products of some BVOCs through different processes such as homogeneous nucleation, adsorption or absorption (Hyvärinene et al., 2004; Brégonzio-Rozier et al., 2015); heterogeneous chemistry on preexisting particles; or oligomerization (Kalberer et al., 2004). However, these oxidative products can also be dissolved by mass transfer in cloud water (van Pinxteren et al., 2005), where they can be photo-oxidized and lead to the formation of semivolatile organic compounds (Yao Liu et al., 2009; Mouchel-Vallon et al., 2017). Several studies evaluated the formation of SOAs through the condensation of such semivolatile organic compounds resulting from cloud evaporation and/or through the reactivity in the aerosols aqueous phase (Chen et al., 2007; Hallquist et al., 2009; Couvidat et al., 2013). Each instant, clouds, which cover 60 % of the Earth surface, continuously appear and vanish through evaporation–condensation cycles (Pruppacher and Klett, 1997). While only 10 % of clouds precipitate, the remaining 90 % evaporate, leading to the evaporation of volatile chemical species and condensation of semivolatile organic compounds on residual aerosol particles. This recently discovered process of SOA formation in clouds is potentially important and still poorly understood and quantified, as shown by field and lab experiments (Ervens et al., 2010; Lee et al., 2012; Pratt et al., 2013).
Clouds are a complex, abstruse, changing manifestation of their environment. Multiphase chemistry can occur within cloud droplets, requiring separate study of each phase, analysis of the interactions at the interfaces and an understanding of chemical consequences inside each phase. Reactivity in clouds is considerably impacted by the microphysical processes (condensation–evaporation, drops collision–coalescence, freezing–fusion, etc.), which partition the bio-chemical compounds among the various cloud phases and modify the efficiency of the mass transfer. Photochemical processes inside clouds, and especially inside drops, are strongly amplified with respect to clear–sky situations, and homogeneous chemical reactions in the aqueous phase are most of the time faster than the equivalent ones in the gas phase (Herrmann et al., 2015). Moreover, the presence of microorganisms in the cloud aqueous phase leads to the biotransformation of chemical compounds and can compete with photo-oxidation mechanisms (Deguillaume et al., 2008, 2014; Vaïtilingom et al., 2010, 2011, 2013). Aside from improving our knowledge on cloud microphysics, it is also crucial to also study the chemical and biological composition and reactivity of chemical species in clouds in order to understand and quantify their efficiency in transforming chemical compounds and altering atmospheric chemistry (gas and aerosol particles).
La Réunion (21∘ S, 55∘ E), is a small tropical island located in the south-western Indian Ocean, affected by south-easterly trade winds near the ground and westerlies in the free troposphere. In spite of the transformation of its habitats (Strasberg et al., 2005), the island still shelters 100 000 ha of native ecosystems, included in a National Park. La Réunion is far from large anthropogenic sources. Thus disconnected from polluted air masses, the island is ideal to study the local processes of chemical formation and transformation of the natural aerosols.
The Maïdo mountain is a 2200 m high summit on the western part of the island. Recent studies of the local circulation in La Réunion (Lesouëf et al., 2011, 2013; Guilpart et al., 2017; Foucart et al., 2018) show that the Maïdo mountain is directly under the influence of air masses coming from the west-north-west downhill slope, which is a zone partially covered by a dense tropical forest. Main primary sources surrounding the Maïdo mountain site are therefore of marine origin via the Indian Ocean and of biogenic origin through this dense forest cover. The latter, together with large solar fluxes due to the tropical location and a surface temperature around 20–30 ∘C, is very propitious to BVOC emission. Moreover, the Maïdo mountain site is daily flooded by clouds: they appear around noon and vanish by the evening. Their formation mode (convection on slope) indicates mid-day interactions between cloud microphysics, BVOCs, SOAs and marine aerosols.
A 2160 m high atmospheric facility was built in 2012 at the summit of the Maïdo mountain (Baray et al., 2013). Being inside the boundary layer during the day and frequently near the free troposphere during the night, the Maïdo Observatory is dedicated to the study of the low to middle atmosphere (especially in the framework of the Network for Detection of Atmosphere Composition Change – NDACC), as well as to the investigation of the boundary layer composition and processes (especially in the framework of the Global Atmospheric Watch network – GAW). Several instruments dedicated to the monitoring of the in situ atmospheric composition (for both gases and aerosols) are permanently deployed at the Maïdo Observatory. This facility, also thanks to the west-north-west downhill slope of the Maïdo mountain linking the Indian Ocean to the facility via dense tropical forest, is therefore a remarkable laboratory for the study of the forest–gas–aerosol–cloud interactions as well as the cloud life cycle in the tropics, from their formation associated with the CCN aerosol properties, to their dissipation through evaporation. Moreover, the Maïdo Observatory is an ideal location to improve constraints on PBAP type and concentrations in a southern hemispheric tropical marine atmosphere.
The importance of the issues presented in the preceding paragraphs, together with the adequacy of the Maïdo mountain's slopes and atmospheric facility to study them, prompted the organization of an intensive campaign in March–April 2015: the Réunion FARCE (Forests gAses aeRosols Clouds Exploratory) campaign. Several scientific teams collaborated to provide reference measurements and characterization of La Réunion vegetation, (B)VOCs, (bio)aerosols, and chemical and biological composition of clouds, with a strong focus on the Maïdo mountain slope area. This exploratory campaign was conceived as a reference basis for projects and campaigns focusing on related topics.
This paper presents the preliminary results form the FARCE campaign. It aims to complete the work of Baray et al. (2013), which gives an overview of the scientific potentiality of the Maïdo Observatory but focuses especially on remote sensing instruments and free tropospheric, upper troposphere–lower stratospheric and stratospheric matters. This work intends to promote the La Réunion and Maïdo Observatory's scientific specificities and potentialities for studies dealing with planetary boundary layer (PBL) processes occurring in a tropical insular environment. It draws up an inventory of the in situ studies that could be performed in this recent atmospheric observatory using various observations and simulations to better characterize the site. It also aims to develop scientific collaborations and to support ongoing and future scientific projects.
The present publication intends to describe the Réunion FARCE campaign set-up, and to provide the preliminary results for forest structure, concentrations of VOCs and precursors emitted by forests, aerosol loading and optical properties in the planetary boundary layer, formation of new particles by nucleation of gas-phase precursors, ice-nucleating particles concentration, and biological loading in both cloud-free and cloudy conditions. More detailed and specific results will be published elsewhere. Section 2 gives an overview of the campaign as well as a description of the measurement sites. Section 3 presents the instruments, methods and model used. We finally expose and discuss the preliminary results from this campaign in Sect. 4.
The FARCE campaign took place on 6 March to 21 April 2015 and focused on the area between the coast and the Maïdo Observatory (Fig. 1). Within the area, different landscape units organized in elevation bands follow each other along the elevation profile. From seashore to 200 m above sea level (a.s.l.), human population density is maximal, and urban areas are separated by dry grasslands, more or less woody savannah depending on the level of invasion by woody exotic species and orchards. In the following elevation band up to 900 m a.s.l., sugar cane crops coexist with mixed exotic shrublands and forests present in more sloping areas. The next band comprises pastures, and more generally agricultural croplands up to 1500 m a.s.l. In this band, broad-leaved forests occur in valleys and gullies. Above that band, native broad-leaved forests with various degrees of invasion by exotic plants occupy most of the space. The highest part of this band, up to 1900 m a.s.l., consists of native forests dominated by the endemic tree species Acacia heterophylla (Fabaceae), which makes up most of standing biomass with individuals reaching 12 to 15 m high. From place to place, plantations of the coniferous species Cryptomeria japonica (Taxodiacae) occur with limited extension. Higher up along the elevation profile, the Acacia heterophylla forest, locally called “Tamarinaie”, transition more or less abruptly with mountain shrublands and heatlands, mostly dominated by endemic shrub species such as Erica reunionensis (Ericaceae) and Stoebe passerinoides (Asteraceae). Field measurements were made at four sites within this area (Fig. 1): the Cryptomeria plot (21.08∘ S, 55.34∘ E, 1248 m a.s.l.), Chez Henri (21.05∘ S, 55.35∘ E, 1305 m a.s.l.), the Tamarins plot (21.07∘ S, 55.36∘ E, 1750 m a.s.l.) and the Maïdo observatory (21.08∘ S, 55.38∘ E, 2160 m a.s.l.). Moreover, mobile measurements were performed with a lidar installed on a pick-up truck driving along the slope going from the shore up to the Maïdo Observatory.
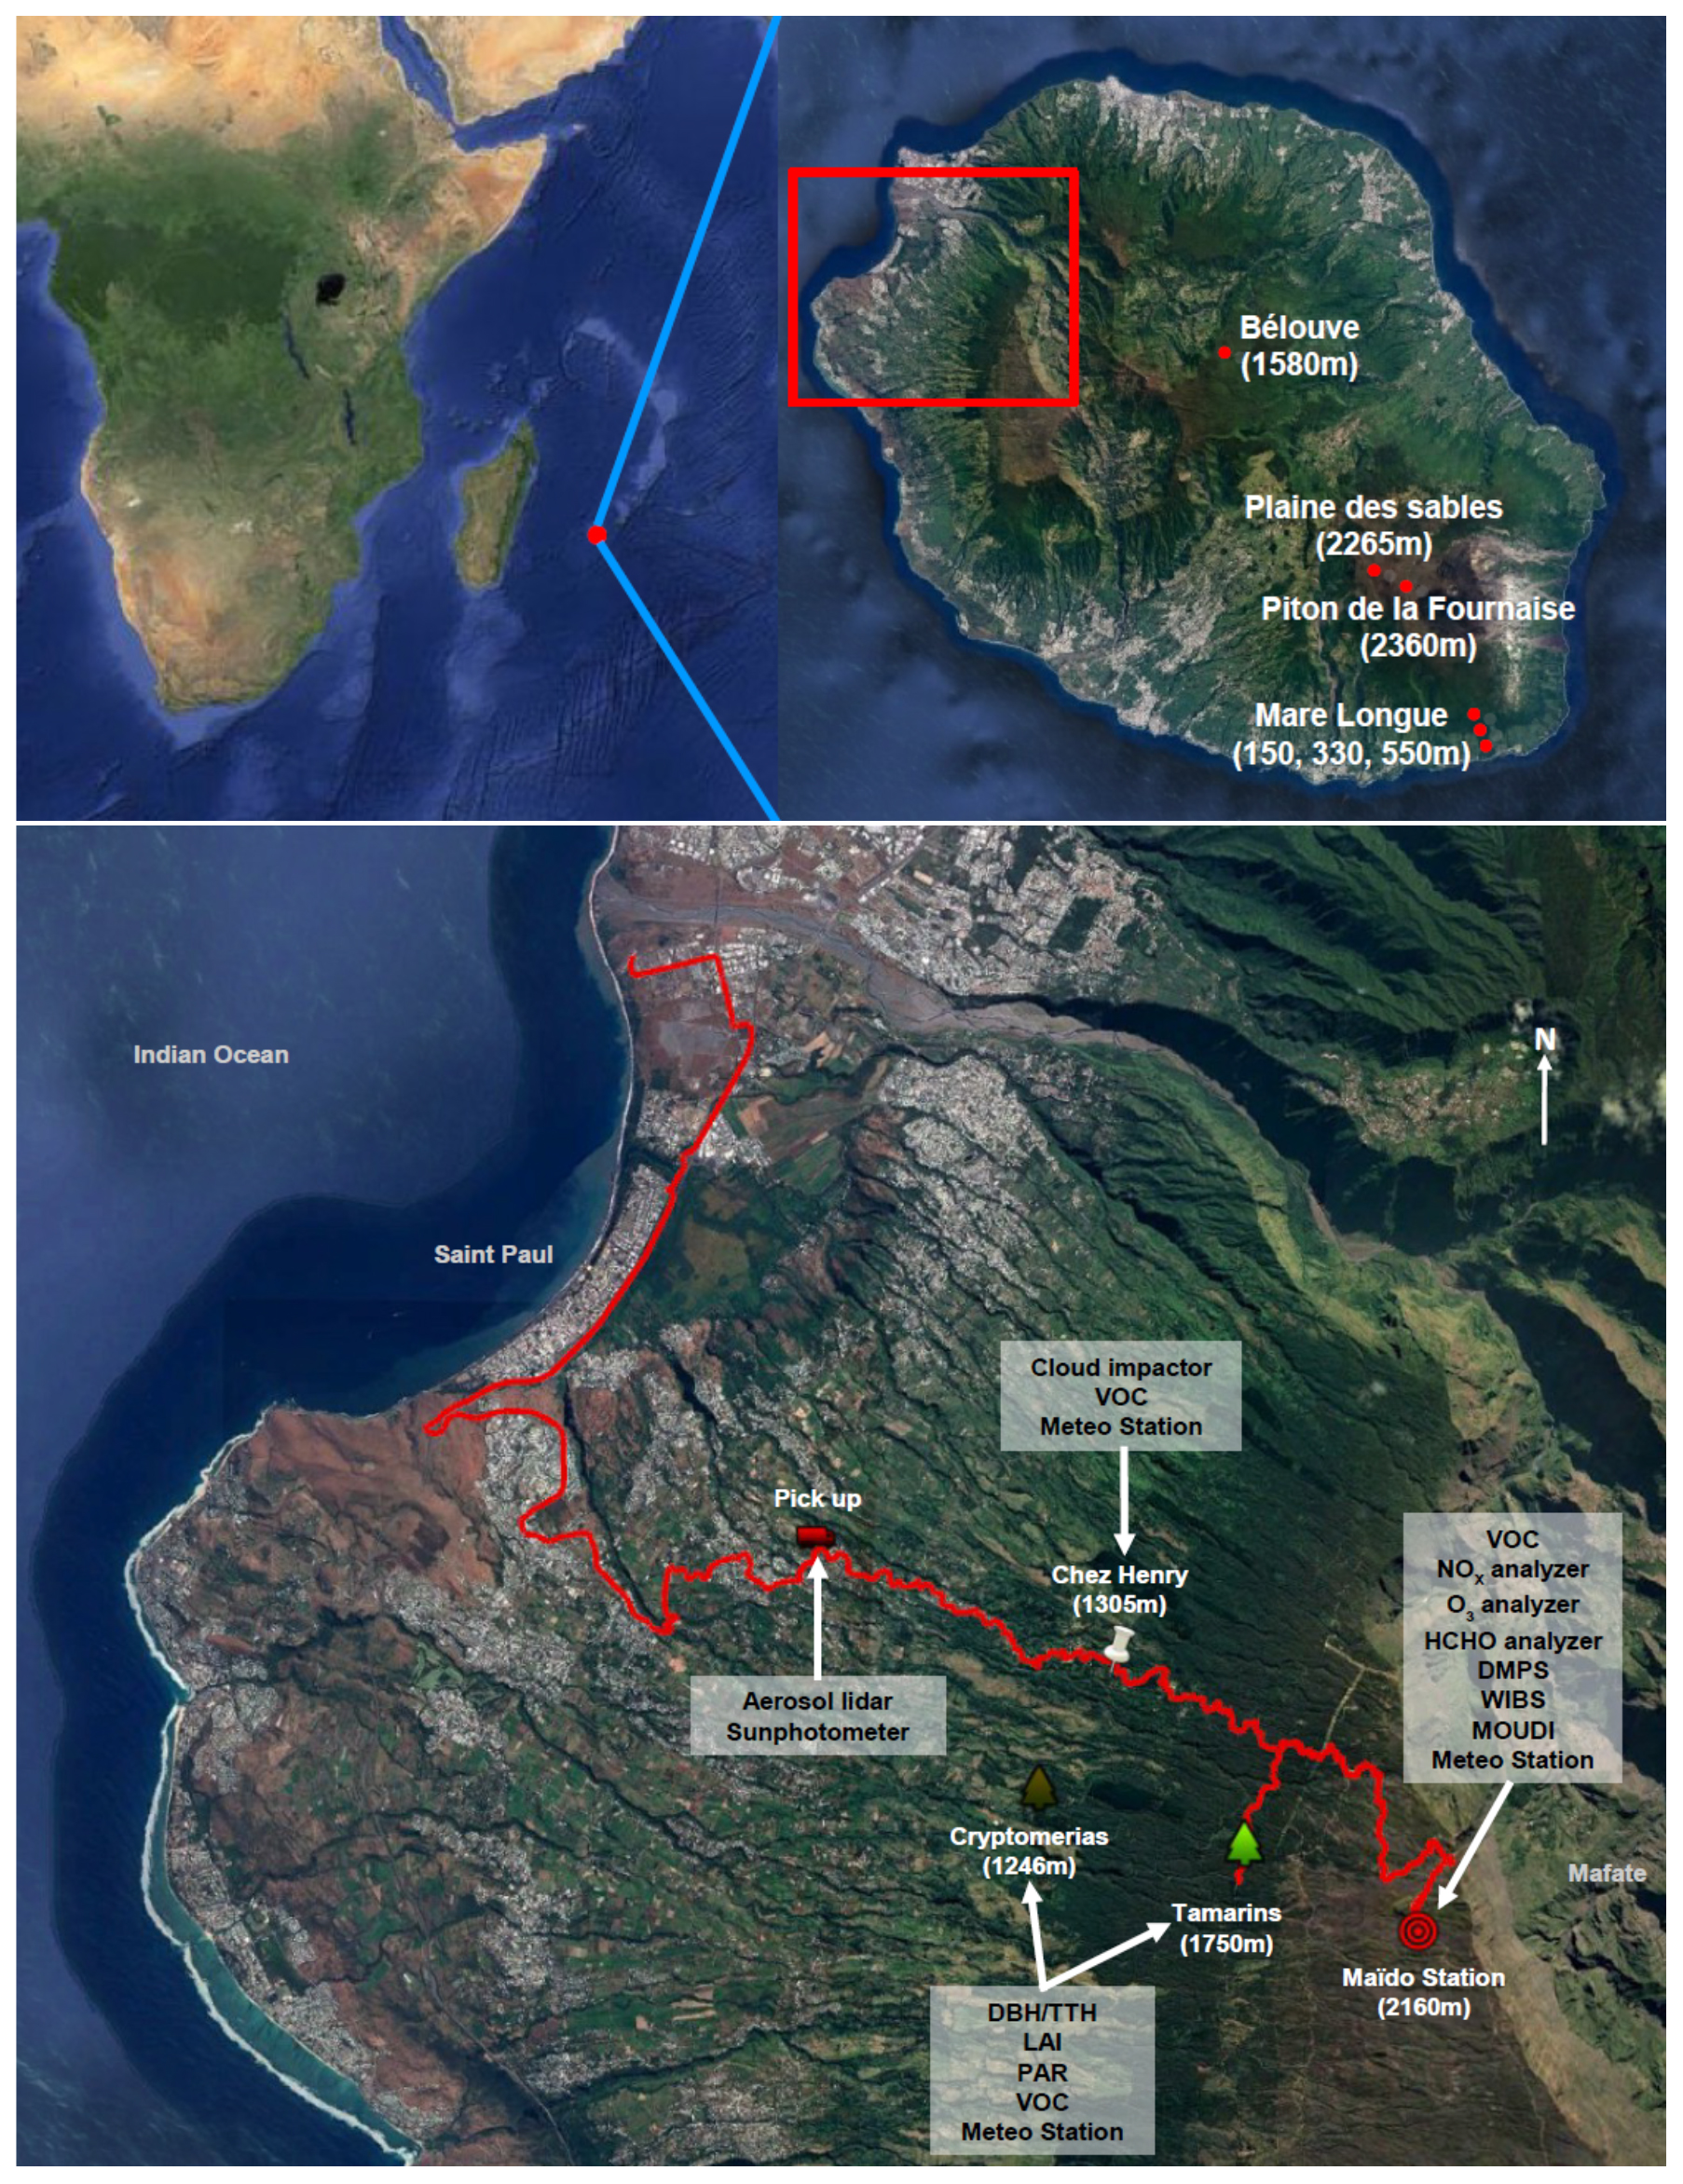
Figure 1Overview maps showing the location of La Réunion as well as of the FARCE campaign sites. Altitude and deployed instruments are given for each measurement site. The red line is the pick-up track on the 2 April 2015 (given as an example). This figure was created using ©Google Earth.
To complete the characterization of the La Réunion's forests as well as the related VOC concentrations, measurements were also made at 4 additional sites distant from the Maïdo mountain: one plot was set up in the Bélouve mountain cloud forest in the centre of the island (21.06∘ S, 55.54∘ E, 1520 m a.s.l.), and three plots in the Mare Longue forests in the south-eastern part (21.35∘ S, 55.74∘ E, 150, 330 and 550 m a.s.l.) (Fig. 1; see Shang et al., 2016, for plot details). The central Bélouve forest is a typical mountain cloud forest occurring on the foothills of the Piton des Neiges extinct volcano between 1100 and 1700 m a.s.l. The forest lies in a relatively smooth landscape with gentle eastward slope and small gullies incised in the lava substrate. It is inundated daily by clouds and fog flowing from the windward side of the island. Fern and bryophytes epiphytic species, which are dependent on high air relative humidity, are abundant in terms of both species richness and biomass, playing an important role in the local water cycle (Ah-Peng et al., 2017). However, the forest also hosts a high diversity of woody species with a large dominance of Acacia heterophylla. The three plots in the Mare Longue forest spread along one of the two ecological corridors on the island, which are uninterrupted native ecosystems in varying conservation states from lowland to highland habitats. The tropical rain forest of Mare Longue makes up the lower end of the corridor located in the south-east of the island on the slopes of the Piton de La Fournaise volcano (the second one being on the drier north-western leeward side of the island). It is the last lowland forest remnant in the Mascarenes. The forest receives several metres of rain each year and is located on recent lava flows of a few hundred years of age. It hosts a large diversity of shrub and tree species that form the canopy between 15 and 25 m high.
Finally, VOC concentrations were also measured at two locations with very low vegetation density, both in the volcano area: the Plaine des Sables and Piton de la Fournaise sites (21.23∘ S, 55.65∘ E, 2265 m, and 21.22∘ S, 55.68∘ E, 2360 m, respectively).
In the following, “forest plots” will refer to the Cryptomerias, Tamarins, Bélouve and Mare Longue (150, 330, 550 m) plots. Note that each of these forest plots has a surface ≈0.2 ha.
Table 1 gives a summary of the performed measurements for each site and date.
Table 1Summary and dates (day/month) of the measurements performed at each site.

a: Measurements performed throughout the day. b: Measurements performed on top of the 10 m mast.
3.1 Forest plots characterization
Species, forest structure and leaf area index (LAI) are key parameters for forest ecosystem comprehension and modelling. The identification of species provides insight into the related biogenic emissions. The characterization of the forest structure (diameter and height) gives information on the carbon storage capacity. LAI is important for vegetation growth estimation and characterizes the forest interaction surface and exchange efficiency with the atmosphere.
All six forest plots (i.e. Cryptomerias, Tamarins, Bélouve and Mare Longue 150, 330, and 550 m) were surveyed in order to identify species and characterize tree size distribution. Within each plot, all trees with diameter at breast height (DBH) ≥7 cm were identified at species level and localized using Cartesian coordinates at plot scale. DBH was measured using rubber tapes, and tree top height (TTH, height of the highest visible tree leaf) was estimated using a laser meter. For trees with multiple stems, all stems with DBH = 7 cm were recorded, but only the stem with maximal diameter is considered in allometry analyses.
Three different approaches were used to produce estimates of LAI in the Cryptomerias, Tamarins, Bélouve and Mare Longue 550 m plots. First, hemispherical photographs (hemiphots) were taken in 16 randomly chosen locations during periods without direct sunlight reaching the plots. Hemiphots were analysed with Gap Light Analyzer software from which the local LAI could be obtained. Three exposure levels were tested with two replicate photographs taken at each location for each exposure level. In a second approach, the LAI2000 plant canopy analyser (Li-Cor, Lincoln, NE, USA) was used to obtain estimates of LAI. We estimated LAI at five randomly chosen locations within the plots. The third method used to estimate LAI was based on the vertical decrease in light intensity due to canopy interception described by the adapted Beer–Lambert law (Cournac et al., 2002):
where I0 is the incoming light intensity on canopy top measured in open conditions (in clearing or open area), I is the in situ measured light intensity, LAI is the leaf area index above measure point, and k is an extinction coefficient. Here we measured light intensity using two different devices: a luxmeter (LX-1108, Voltcraft, Germany) and a light meter (LI-250, LiCor) equipped with a LI-190 quantum sensor for photosynthetically active radiation (PAR) measurement. Measures were made sequentially in both open and forest conditions under sky conditions as homogeneous as possible with respect to cloud cover.
3.2 BVOCs and precursors
(B)VOCs, nitrogen oxides (NOx), ozone and formaldehyde (HCHO) are deeply linked within the boundary layer, especially in tropical forests (Stickler et al., 2007; Ganzeveld et al., 2008). In the boundary layer, NOx are mainly emitted by fossil fuel combustion and soil, and their main sink is the reaction with OH radical. Boundary layer ozone has several sources, including photochemical production from anthropogenic and natural precursors, the most important being NOx, hydrocarbons and carbon monoxide (CO). HCHO is directly emitted in the atmosphere (traffic and industrial emissions, Carlier et al., 1986; biomass burning, Lee et al., 1997), or formed secondarily as a result of photochemical reactions. Secondary production of HCHO is initiated in the continental boundary layer by the oxidation of (B)VOCs (Fried et al., 1997).
3.2.1 BVOCs
BVOCs were studied at different locations: Maïdo Observatory (2160 m) with semi-continuous measurement (12 March–9 April 2015), Tamarins forest (ground level and on a 10 m mast), Cryptomeria forest (ground level), primary forest (Bélouve) (ground level and on a 10 m mast), Mare Longue forest (150 m) and Chez Henri (10 m mast) (see Table 1).
Active sampling on sorbent cartridges, using a sampling module developed by TERA Environment – a SASS (Smart Automatic Sampling System) – was performed at the Maïdo Observatory. Gaseous compounds were sampled at approximately 10 m above ground level, using a Teflon sampling line, and then trapped into one multisorbent cartridge, composed of a mixture of Tenax TA 60–80 mesh (250 mg) and carbosieve sIII (150 mg) at 100 mL min−1 for 2 h. This type of cartridge allowed C4–C14 aromatic compounds, n-alkanes, monoterpenes, isoprene and halogenated compounds to be sampled, at a flow rate of 100 mL min−1. Prior to the sampling, multisorbent-filled cartridges were conditioned by flowing purified air through them, at a flow of 30 mL min−1, during 4 h at 300 ∘C.
The sampling in the different forest plots was performed on the same cartridges using a manual pump (ACCURO 2000, DRAEGER), and 3 to 6 L of volume sampling at the ground level, and pump (KNC) associated with a mass flow controller for the mast sampling at 10 m.
The analysis of the cartridges was performed using a gas-chromatograph–mass-spectrometer system (GC/MS, Perkin Elmer) connected to an automatic thermal desorption. Each cartridge was desorbed at 270 ∘C for 15 min at a flow rate of 40 mL min−1 and reconcentrated on a second trap at −10 ∘C containing Tenax TA. After the cryofocussing, the trap was rapidly heated to 300 ∘C and the target compounds were flushed into the GC (Keita et al., 2018). The separating column was a 60 m × 0.25 mm × 0.25 µm PE-5MS (5 % phényl, 95 % PDMS) capillary column (Perkin Elmer). The temperature profile of the GC was ramped (35 ∘C for 5 min, heating at 8 ∘C min−1 to 250 ∘C, held for 2 min). The chromatography parameters were optimized to enable good separation of circa 80 identified compounds; a complete run took about 34 min. The mass spectrometer was operated in total ion current (TIC) from 35 to 350 m∕z amu (atomic mass unit).
3.2.2 NOx, ozone and HCHO at Maïdo Observatory
At the Maïdo Observatory, NOx (NO+NO2) were monitored with an Environnement SA AC31M using an ozone chemiluminescence technique. Detection limit is 0.35 ppbv and 12 % of uncertainty.
Ozone was monitored with a UV photometric analyser (Thermo Scientific model 49i). Model 49i uses a dual-cell photometer and measures the amount of ozone in the air from 0.05 ppb concentrations up to 200 ppm with a response time of 20 s and a precision of 1 ppb.
Formaldehyde (CH2O) measurements were made with a modified Aero-Laser AL4001, a commercially available instrument. This instrument is based on the Hantzsch technique, which is a sensitive chemical fluorimetric method that is specific to CH2O. The transfer of formaldehyde from the gas phase into the liquid phase is accomplished quantitatively by stripping the CH2O from the air in a stripping coil with a well-defined exchange time between gas and liquid phase. Formaldehyde was measured at 30 s time intervals and the detection limit was 100 pptv. A full description of the instrument and its performance is given in Junkermann and Burger (2006).
3.3 Profiling of boundary layer aerosol optical properties
We used mobile aerosol lidar in synergy with a handheld sun photometer to retrieve optical properties of the aerosols encountered in the PBL along the Maïdo mountain slope over 3 d (Table 1). The lidar system used in this study is a LEOSPHERE ALS450 based on a Nd:Yag laser, producing pulses with a mean energy of 16 mJ at 355 nm and a frequency of 20 Hz. The lidar measurements have been averaged over 2 min with a vertical resolution of 15 m. The lidar profiles enable us to retrieve atmospheric structures (boundary layer heights, aerosol layers and clouds) and optical properties (lidar ratio (LR) and extinction coefficient) in synergy with sun photometer measurements. It is particularly well-adapted to the study of the PBL thanks to its full-overlap height reached at ≈150 m. A more complete description of the lidar and its instrumental features can be found in Duflot et al. (2011). For this campaign, the system was installed in an air-conditioned box adapted for use in severe conditions and attached on a pick-up platform to perform mobile observations. The energy was supplied by six batteries connected to a power inverter, which give a ≈3 h autonomy to the system.
Aerosol optical thickness (AOT) measurements were performed in clear-sky conditions using a MICROTOPS II sun photometer instrument (Solar Light, Inc.). The instrument field of view is about 1∘. The AOT is measured at five wavelengths (440, 500, 675, 870 and 1020 nm). The instrument was calibrated at the NASA Goddard Space Flight Center against the AERONET reference CIMEL sun/sky radiometer. The data presented here have been quality- and cloud-screened following the methodology of Smirnov et al. (2000) and Knobelspiesse et al. (2003) and the mean uncertainty on the AOT measurements equals 0.015 (Pietras et al., 2002). The AOT at the lidar wavelength of 355 nm (AOT355) was calculated from AOT440 using the Ångström exponent (Ångström, 1964) between 440 and 675 nm. The uncertainty on the retrieved AOT355 has been computed following the approach shown by Hamonou et al. (1999).
The synergetic approach between lidar and sun photometer measurements to calibrate the lidar system, to retrieve aerosols optical properties and to evaluate the uncertainties can be found in, for example, Duflot et al. (2011). It is noteworthy that this method gives access to a height-independent LR value. The aerosols optical properties given hereafter are therefore valid for the mixture of aerosols encountered above the lidar at one point on the trajectory of its carrier.
3.4 Aerosols size distribution
Aerosols were characterized at the Maïdo observatory site (see Table 1) for their size distribution using a differential mobility particle sizer (DMPS) in the 10–550 nm size range. The DMPS was custom-built with a TSI-type differential mobility analyser (DMA) operating in a closed loop and a condensation particle counter (CPC, TSI model 3010). Particles were charged to equilibrium using an Ni-63 bipolar charger at 95 MBq. The quality of the DMPS measurements was checked for flow rates and RH according to the ACTRIS recommendations (Wiedensohler et al., 2012). DMPS measurements were performed down a Whole Air Inlet with a higher size cut-off of 25 µm (under average wind speed conditions of 4 m s−1) (Tulet et al., 2017; Foucart et al., 2018).
3.5 Cloud-free size-resolved ice nucleus concentrations
Measurements of ice-nucleating particle (INP) concentrations in the immersion mode were made at the Maïdo Observatory site (see Table 1). To estimate INP number, the micro-orifice uniform deposit impactor (MOUDI) droplet freezing technique (DFT) was used to collect and analyse INPs on a size-resolved basis between 0.18 and 18 µm (Mason et al., 2015). Each aerosol was impacted onto glass microscope cover slips coated in a hygroscopic material using a MOUDI operated at a constant flow rate of 30 L min−1. Each stage of the MOUDI cascade impactor collects a discreet range of particle sizes, and so subsequent analyses provide information about INPs as a function of aerodynamic particle diameter. A total of 23 samples were collected for 6–7 h each and then analysed using the DFT technique. Briefly, humidified air is passed over each sample until liquid droplets form around deposited particles. The temperature of the stage is reduced at a rate of −10 ∘C min−1 from 0 to −40 ∘C while images of the stage are recorded by a video camera. Post-analysis records the number and size of droplets that freeze as a function of temperature, and these data are converted to INP concentrations as a function of both particle size and freezing temperature.
3.6 Cloud-free fluorescent particle counts
The Wide-band Integrated Bioaerosol Sensor (WIBS) was installed at the Maïdo Observatory during the study period (see Table 1). This instrument measures size and fluorescence from individual particles from ≈0.8 to 10 µm. Particles are exposed to intense flashes of UV light at 280 and 370 nm and the resulting fluorescence is imaged onto two photomultiplier tubes filtered to detect light from 310 to 400 nm (saturated by the 370 nm flash) and from 420 to 650 nm. Each particle therefore may have signal above the background noise in any of three channels, denoted here as channels A (fluorescence detected between 310 and 400 nm following 280 nm excitation), B (fluorescence detected between 420 and 650 nm following 280 nm excitation) and C (fluorescence detected between 420 and 650 nm following 370 nm excitation). The excitation wavelengths and detection bands are chosen to correspond roughly to those of tryptophan and nicotinamide adenine dinucleotide (NADH), two compounds commonly found in biological systems, although other fluorophores likely also contribute to the fluorescent activity of airborne microbes.
Concentrations of fluorescent particles are then used as a proxy for PBAP. The WIBS can distinguish specific classes of PBAP (i.e. bacteria, spores and pollen) from one another using the measured size and fluorescent intensities and following an analysis framework published by Perring et al. (2015) and referenced in published responses to known bio-aerosol samples (Hernandez et al., 2016; Savage et al., 2017). In this framework each particle is assigned a unique “type” indicating which, if any, of the three possible channels had a signal above the background noise for that particle. Particles that have fluorescence above background in a single channel are assigned as type A, B or C, while particles with signal above background in multiple channels are led with each relevant channel (i.e. type AB particles have signal above background in channels A and B but not in C while type ABC had signal above background in all channels) and particles with no detected fluorescence in any channel are designated “non-fluorescent”. Application of this framework in laboratory studies shows that both bacteria and anthropogenic combustion sources tend to be detected as type A at small sizes (≈1 µm or less) while fungal spores appear as a combination of types A, AB and ABC at slightly larger sizes (2–5 µm) and pollen is detected as a combination of C, BC and ABC with less size specificity due to the prevalence of pollen fractionation. Very little that is biological appears as types B or AC; high concentrations of type B have been associated with biomass burning aerosol (Savage et al., 2017) and type AC is very rarely observed in either laboratory or ambient studies.
3.7 Biological composition of clouds
Chemical and microbial characterization was performed on five cloud water samples collected at La Réunion during the FARCE campaign (see Table 1). A mobile sampler was deployed during the campaign to sample and characterize clouds. A cloud sampler together with weather sensors and cloud droplet probe (CDP) were installed on a 10 m mast to avoid ground contamination. The cloud samples were collected with a single stage cloud collector under sterile conditions suitable for microbial analysis (Kruisz et al., 1993; Vaïtilingom et al., 2012). The chemical composition of the clouds was identified by determining the concentrations of the main inorganic ions and the major carboxylic acids using an ionic chromatography method (Jaffrezo et al., 1998), together with the concentrations of formaldehyde and hydrogen peroxide using fluorimetric methods (Vaïtilingom et al., 2013).
For the microbial analysis, the total microbial cell count has be done using flow cytometry (Hammes et al., 2008). The energetic state of the cloud's microorganisms was determined by measuring the ATP and ADP concentrations using a bioluminescent method (Lundin et al., 1986). The cloud water samples were cultivated in R2A agar medium immediately after their sampling and incubated for 1 week at 20 ∘C to allow the formation of microbial colonies. The bacteria-like (typically smooth and circular) and fungi-like (typically filamentous) colonies that formed (colony-forming unit) were counted and then isolated and purified on R2A agar medium at 17 ∘C for further identification by ribosomal RNA gene sequencing using the same protocol as Vaïtilingom et al. (2012). Bacteria and yeast were identified on the basis of their 16S or 26S rRNA gene sequences, respectively.
3.8 The Meso-NH model
The mesoscale, non-hydrostatic atmospheric model Meso-NH (Lac et al., 2018) is able to simulate both idealized systems and real meteorological events at high resolution on large domains with complex terrain. A full description of the model capabilities is available at http://mesonh.aero.obs-mip.fr/ (last access: 20 August 2019).
The model is set up with two two-way nested domains with horizontal grid spacing of 2 km (D1) and 0.5 km (D2) and grid sizes of 128×128 and 200×180 points, respectively. The innermost domain is centred over La Réunion. In the vertical, 64 levels are used, with the highest resolution near the surface. ECMWF analysis was used to initialize the model on 1 April 2015 at 12:00 UTC, and to feed the lateral boundary conditions. In the two domains, the deep convection is explicitly resolved. In the outermost domain, the shallow convection is parameterized following Pergaud et al. (2009). The microphysics scheme (Pinty and Jabouille, 1998) is a single-moment bulk scheme that predicts the mixing ratio of five microphysical species: cloud water, rain, cloud ice, snow and graupel. This scheme is derived from Lin et al. (1983). For both domains, the turbulence scheme was set in a 3-D mode with the 3-D mixing length of Deardorff (1980) used. The radiative scheme is the one used at ECMWF (Gregory et al., 2000) including the Rapid Radiative Transfer Model (RRTM) parameterization (Mlawer et al., 1997). The chemical parameterization are upon Suhre et al. (1998) and Tulet et al. (2003, 2006) (gas chemistry). The biogenics emissions are from the version 2.1 of the Model of Emissions of Gases and Aerosols from Nature (MEGAN, Guenther et al., 2012; Sindelarova et al., 2014) computed on-line by the SURFEX scheme (https://www.umr-cnrm.fr/surfex/, last access: 20 August 2019).
4.1 Forest plot characterization
We surveyed all six forest plots in order to characterize forest structure, whereas we could implement methods for LAI* in four plots only (see Table 1). Overall, 56 different species were surveyed in the plots with various species richness (Table 2). The most diverse plots are located in the Mare Longue rainforest area, with a maximum of 34 species at 550 m a.s.l. These plots also exhibit high basal area in relation with high maximal DBH and height. The two Acacia-dominated plots (Bélouve, BELO, and Tamarins, TAMA) showed low woody species diversity, with two species only present in TAMA (Acacia heterophylla and Erica arborescens). They showed lower basal area (sum of tree trunks sections) and lower tree size compared to the lowland plots in Mare Longue forest. The low basal area and the relatively low number of trees in BELO could indicate former unknown logging of Acacia heterophylla. Last, the forest plot set-up in the plantation of the exotic species Cryptomeria japonica (Cryptomerias, CRYP) hosts two species, one present as one individual only (Eucalyptus robusta).
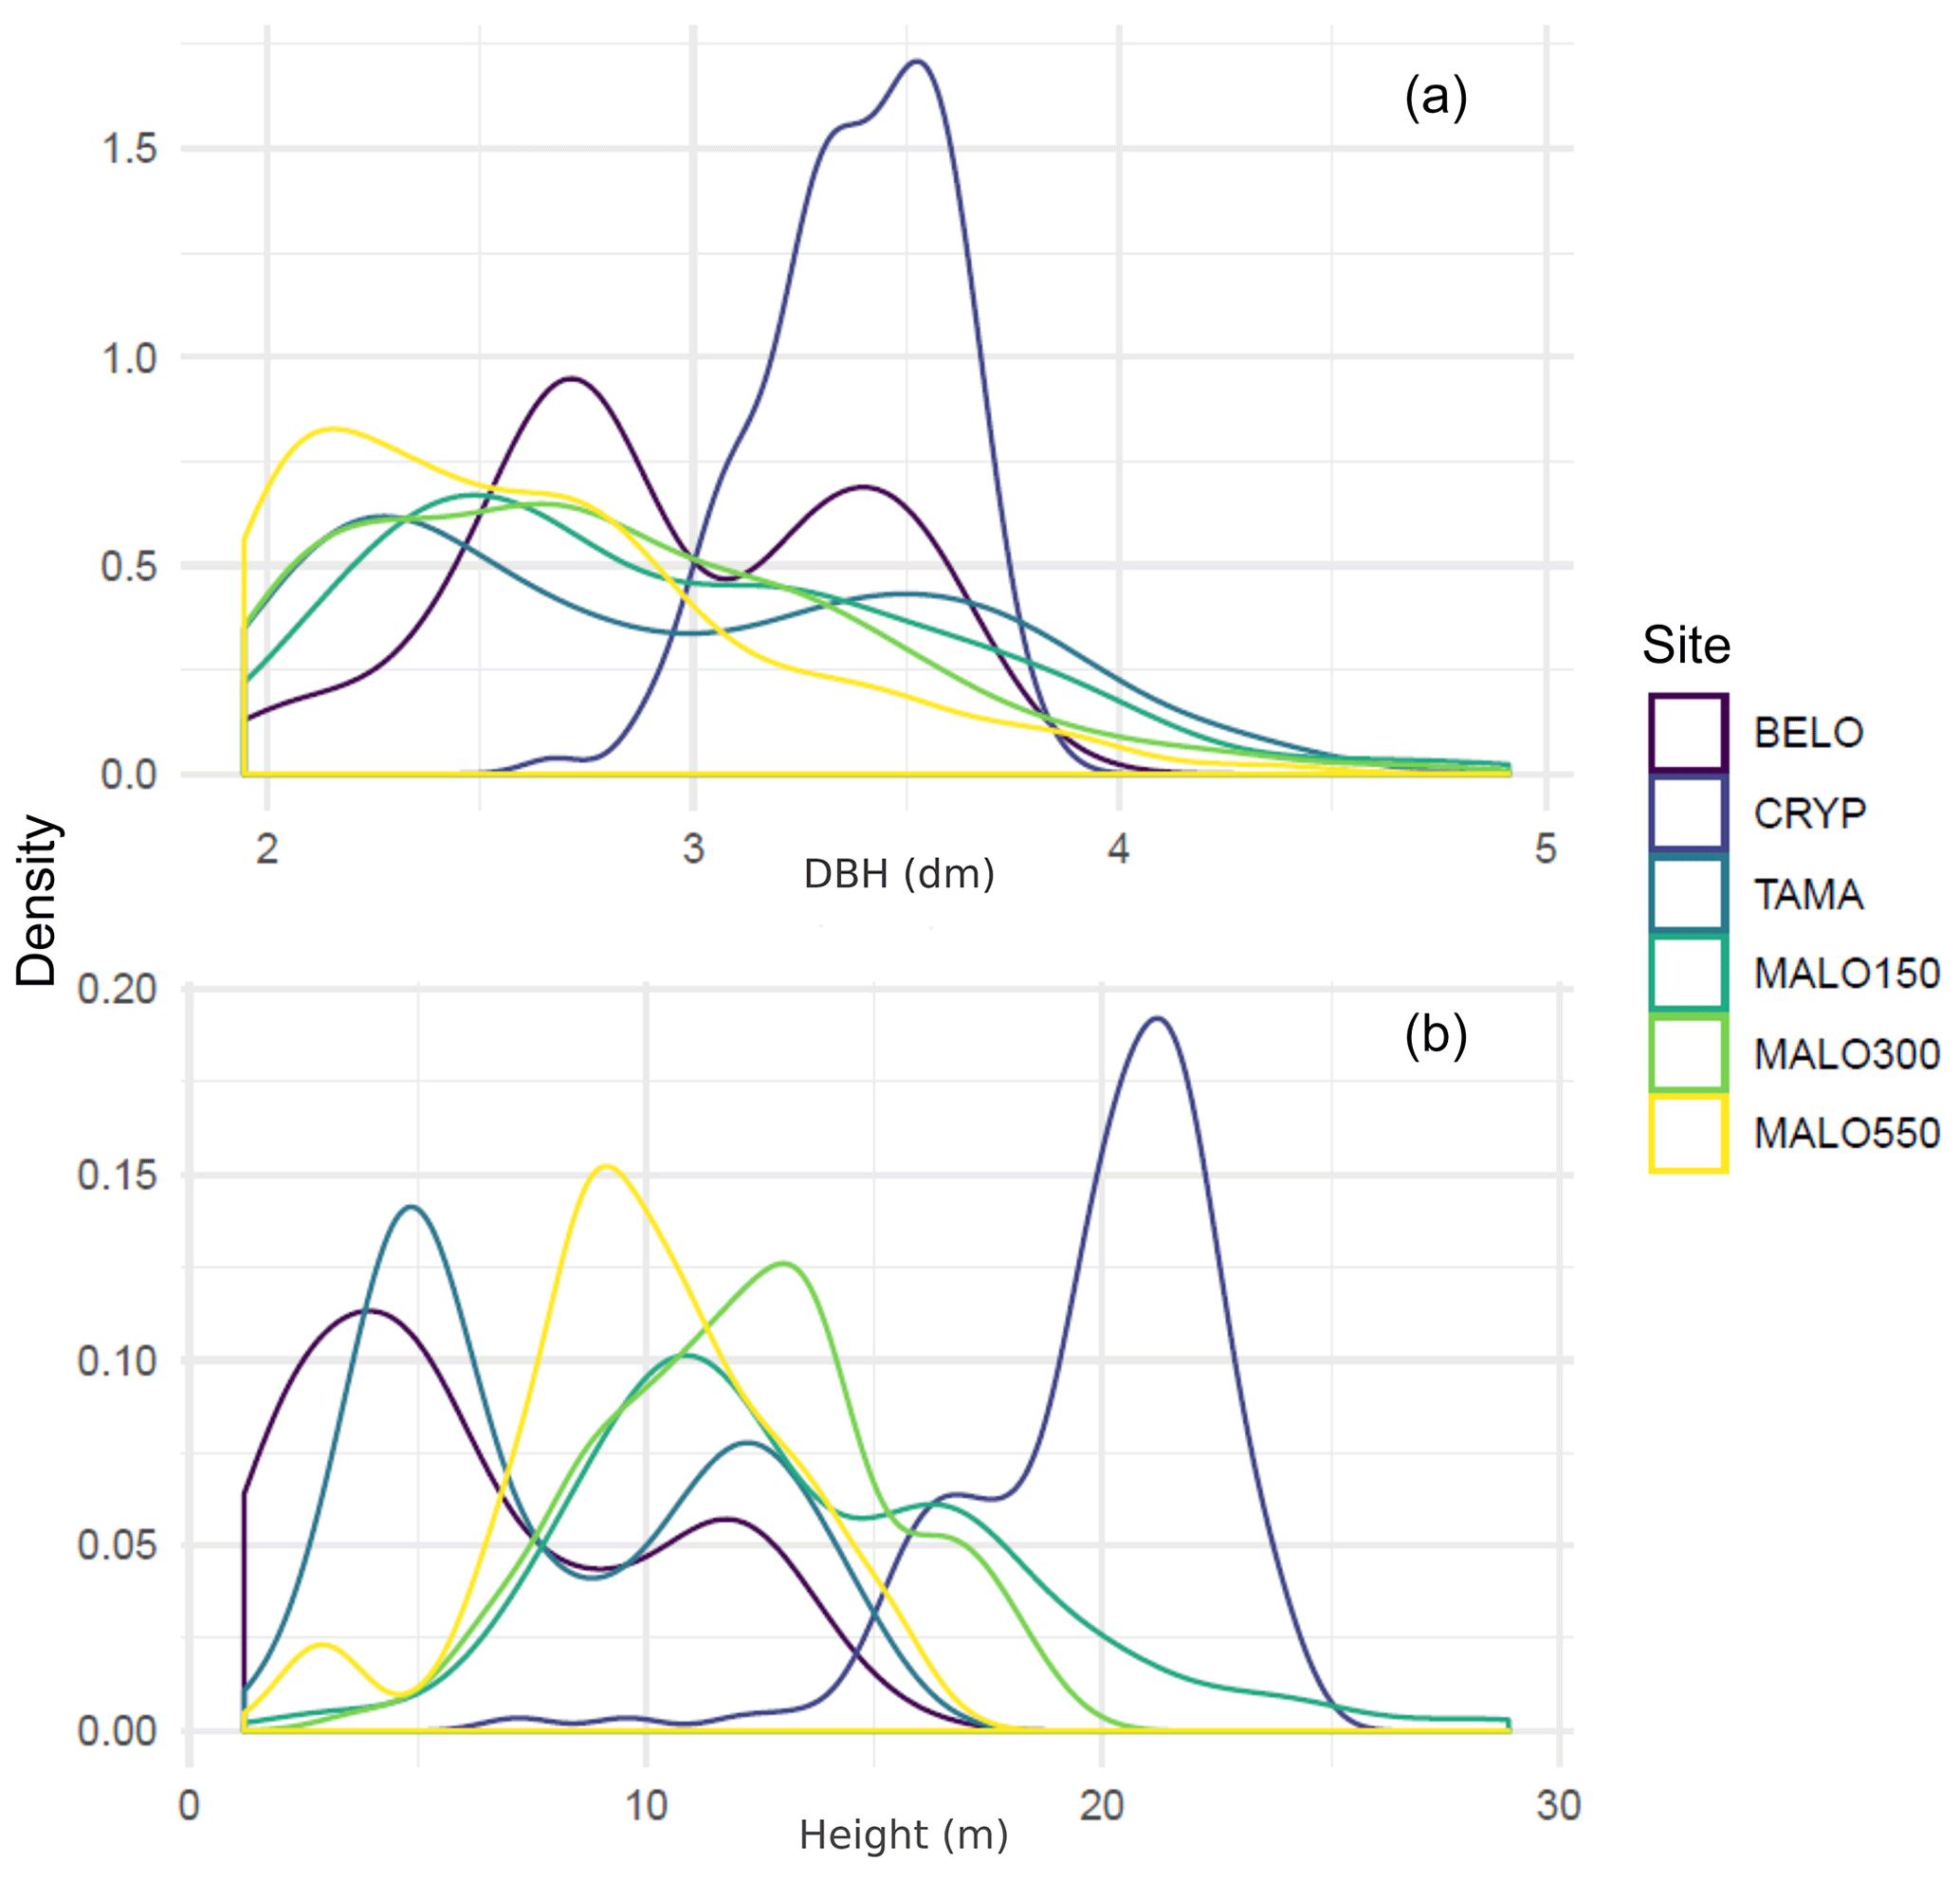
Figure 2Density distribution of diameters (DBH, in decimetres, a) and heights (in metres, b) in forest plots.
The analysis of tree diameter and height distribution (Fig. 2) reveals highly different structures, from the homogeneous and simple structure of the plantation plot (CRYP), the bi-layered structure of Acacia heterophylla forests (BELO and TAMA) as shown by the bimodal distributions of both size variables, to the more heterogeneous structure of the lowland rainforest in Mare Longue plots, as shown by higher maximal sizes and more even distributions. This variety of forest structure is also well represented in allometric relationships between tree height and diameter differing across plots (Fig. 3). These relationships highlight the role of particular species in forest structure. Hence, the lower layer in the Bélouve forest (BELO, Fig. 3) is mostly composed of the tree ferns Cyathea borbonica and Cyathea glauca, of Erica arborescens, in the Maïdo forest (TAMA), and by Pandanus purpurascens in the plot of Mare Longue forest at 550 m a.s.l. (MALO550).
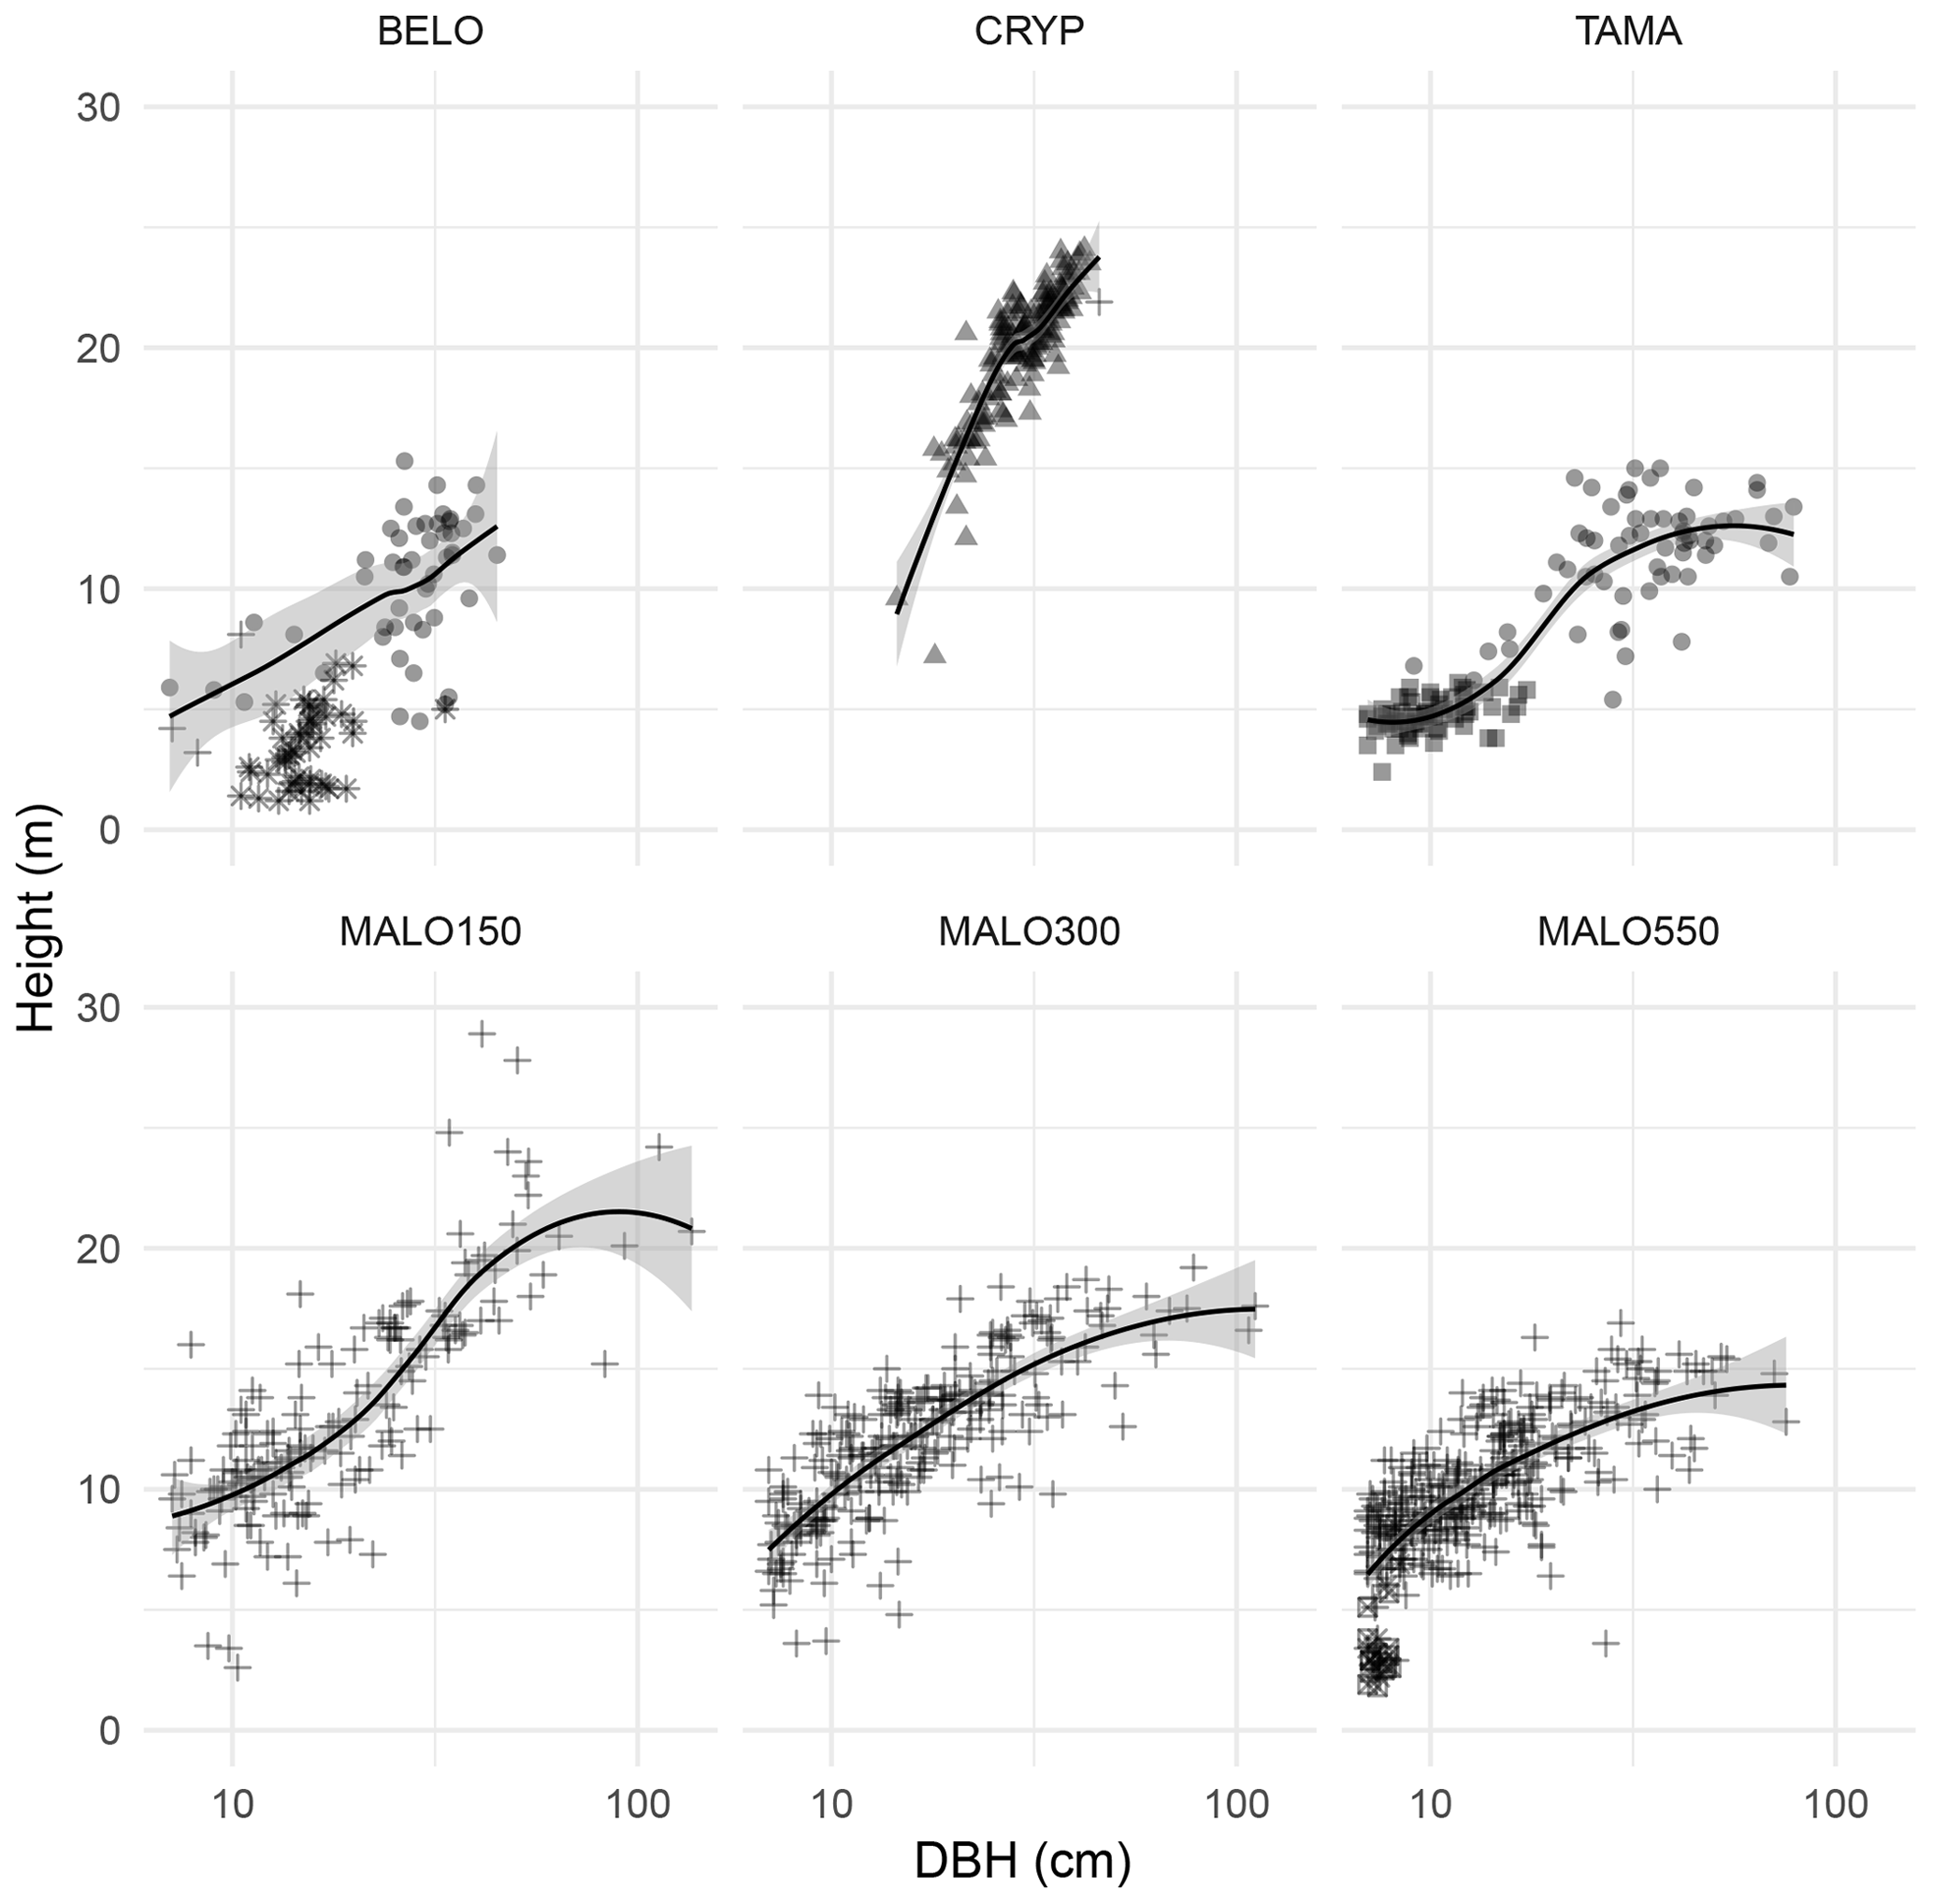
Figure 3Allometric relationships between diameter and height in forest plots. Symbols indicate the particular species or species set: • Acacia heterophylla in BELO and TAMA, * Cyathea borbonica and Cyathea glauca (tree ferns) in BELO, ▴ Cryptomeria japonica in CRYP, ▪ Erica arborescens in TAMA, ⊠ Pandanus purpurascens in MALO550, + other species. Smoothing lines are estimated without taking into account species with particular architecture (tree ferns and Pandanus purpurascens).
Regarding LAI, for the light interception method, we present here estimated values of , because we did not have independent estimates of the extinction coefficient k. The four tested methods provided roughly similar estimates (Fig. 4), although the ranks change across plots, except for hemiphots in MALO550, which under-estimated LAI*, and the luxmeter method in TAMA, which over-estimated LAI* in TAMA. The highest values of LAI* were found in the more rainy site of MALO550, which is consistent with the high biomass present in the plot, as shown by basal area and stem number (Table 2). The value obtained for the BELO plot (<1) is surprising as it is more typical of much drier ecosystems with low biomass and foliage density. It is, however, consistent with the evidenced low stand density, which seems to indicate former logging. Nevertheless, it is also close to the estimate found for the TAMA plot (≈1.5) located in Acacia heterophylla-dominated stands. This species is well-known for displaying leaf-shaped petioles (phyllodes), which are photosynthetically active but few relative to tree size, and for its clustered foliage in large crowns, which also may partly explain the deviation of the luxmeter estimate for the TAMA plot.
Table 2Summary statistics for tree stands within sampled forest plots. n: number of measured stems, S: species richness, BA: basal area (m2 ha−1) plus mean, standard deviation (SD), and maximal values for tree DBH (cm) and height (m).


Figure 4Estimates of leaf area index (LAI) in four forest plots with four methods: hemiphots (hemispherical photographs), LAI2000 and a light interception method, based on light intensity measurements using a luxmeter or a PARmeter. Points and vertical lines indicate average values and standard errors.
The extinction coefficient k of the light interception method is related partly to the optical properties of the leaves and mainly to the structural properties of the canopy (height, stem density, leaf clustering and inclination) (Cournac et al., 2002). It also depends on the radiation waveband that is measured, and k values are typically in the range 0.70–0.94 (Wirth et al., 2001). As estimates obtained by the light interception method are relatively close to estimates by hemiphots, our results suggest that in the case of the forests studied here, k is rather close to the higher end of known values, although it certainly varies from one forest type to another.
Shang et al. (2016) measured higher LAI values for the Tamarins, Cryptomeria, Bélouve and Mare-Longue 550 plots using vertical profiles of an airborne lidar with a large footprint. Bearing in mind that the nutrient availability in the ground, and consequently the LAI, can vary from one point to another in a given forest, these differences between our retrieved LAI values and theirs are due to the fact that the airborne lidar samples a much wider area compared to the measurements performed from the ground in a much smaller plot (≈0.2 ha).
The results of these species identification and LAI* measurements were used to improve the simulation of emitted BVOCs in the Meso-NH model, based on previous studies from Guenther et al. (1995, 2012).
4.2 Atmospheric dynamics
Meteorological regimes and dynamics on La Réunion have been widely studied by Lesouëf et al. (2011, 2013), Durand et al. (2014), Guilpart et al. (2017), Tulet et al. (2017) and Foucart et al. (2018). These works show that the island is affected by a south-easterly trade wind regime, which is intense in winter (June–August) and moderate in summer (December–February). This main weather regime causes an acceleration of the winds around the mountains on the south-west and north-west sides of the island. The north-western sector of the island is screened from the trade winds by high mountains, which allows the development of diurnal thermally induced circulations, combining downslope (catabatic winds) and land breezes at night, and upslope (anabatic winds) and sea breeze during the day-time. Moreover, a returning loop occurs almost every day on the north-west side of the island in the boundary layer. This north-westerly dynamic flow joins the upslope and sea breeze during the day-time to bring north-western air masses up to the Maïdo planèze. This convection on slope causes a quasi-daily formation of clouds, which are usually weakly developed vertically with a low water content.
This process is clearly visible on the Meso-NH simulation of 2 April 2015 (Fig. 5a). One can see in particular the returning loop on the north-west sector and a related west-north-westerly flow on the west flank of the mountain. One can also notice a horizontal wind shear front located under the Maïdo Observatory (noted M) and the Tamarins plot (noted T). This surface front zone coincides with the confluence of the south-easterly trade wind regime passing over the mountain and the convection on slope north-westerly flow. The location of this frontal zone, which moves throughout the day, is very important as it drives the origin of the air masses that are sampled at the Maïdo Observatory: in a north-westerly regime, the observatory will sample air masses loaded with species coming from marine, anthropogenic and biogenic sources; in a south-easterly trade wind regime, air masses come mainly from 2000 m altitude and are less impacted by surface emissions.
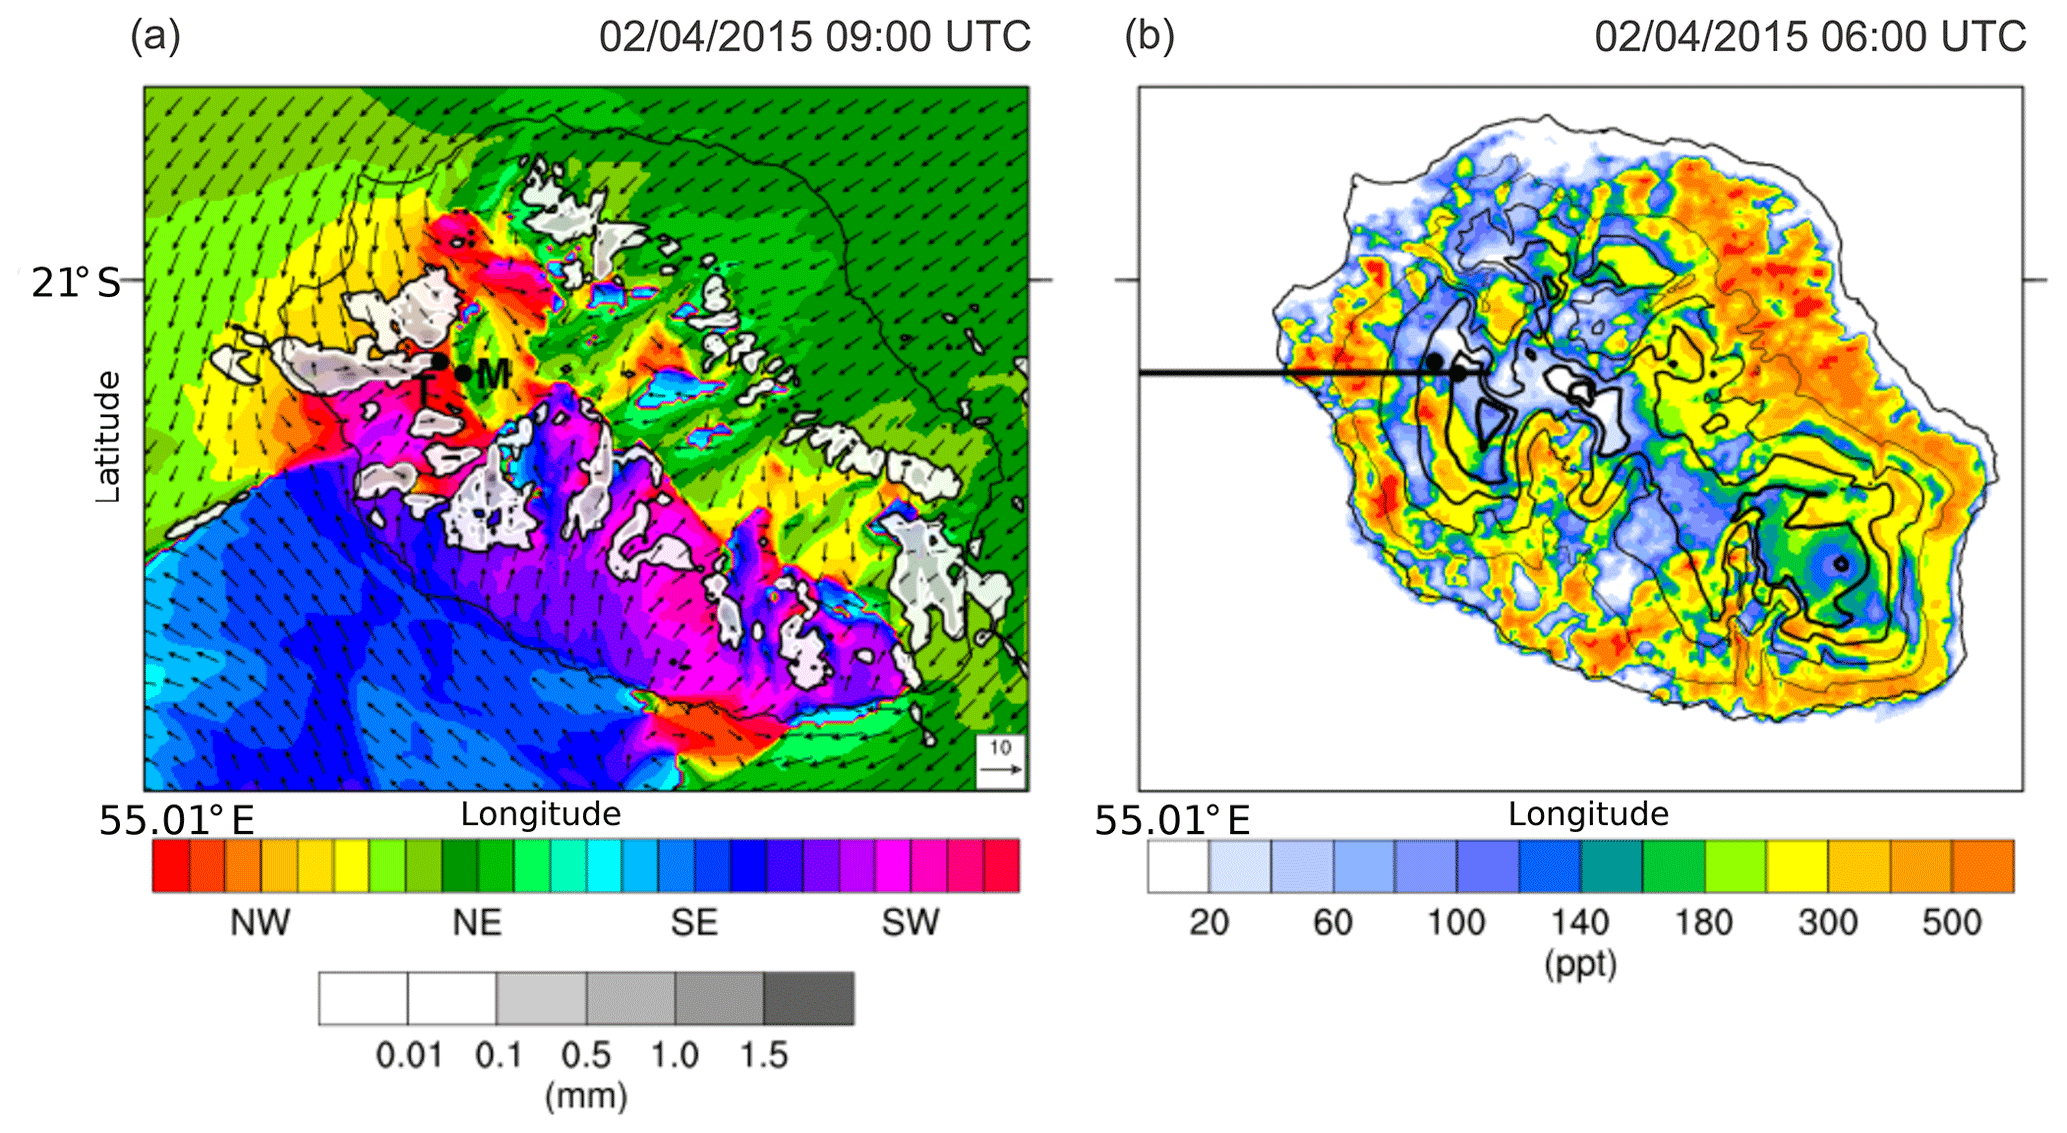
Figure 5Meso-NH simulation for 4 April 2015. (a) Surface wind direction (colour scale) and intensity (arrows in metres per second, m s−1; reference given in the lower-right corner) and integrated cloud water content (grey shaded in mm) at 09:00 UTC. The letters T and M show the location of the Tamarins plot and Maïdo Observatory, respectively; (b) isoprene concentration at 06:00 UTC. Black isolines show the orography, and the black line shows the vertical cross section shown in Fig. 7.
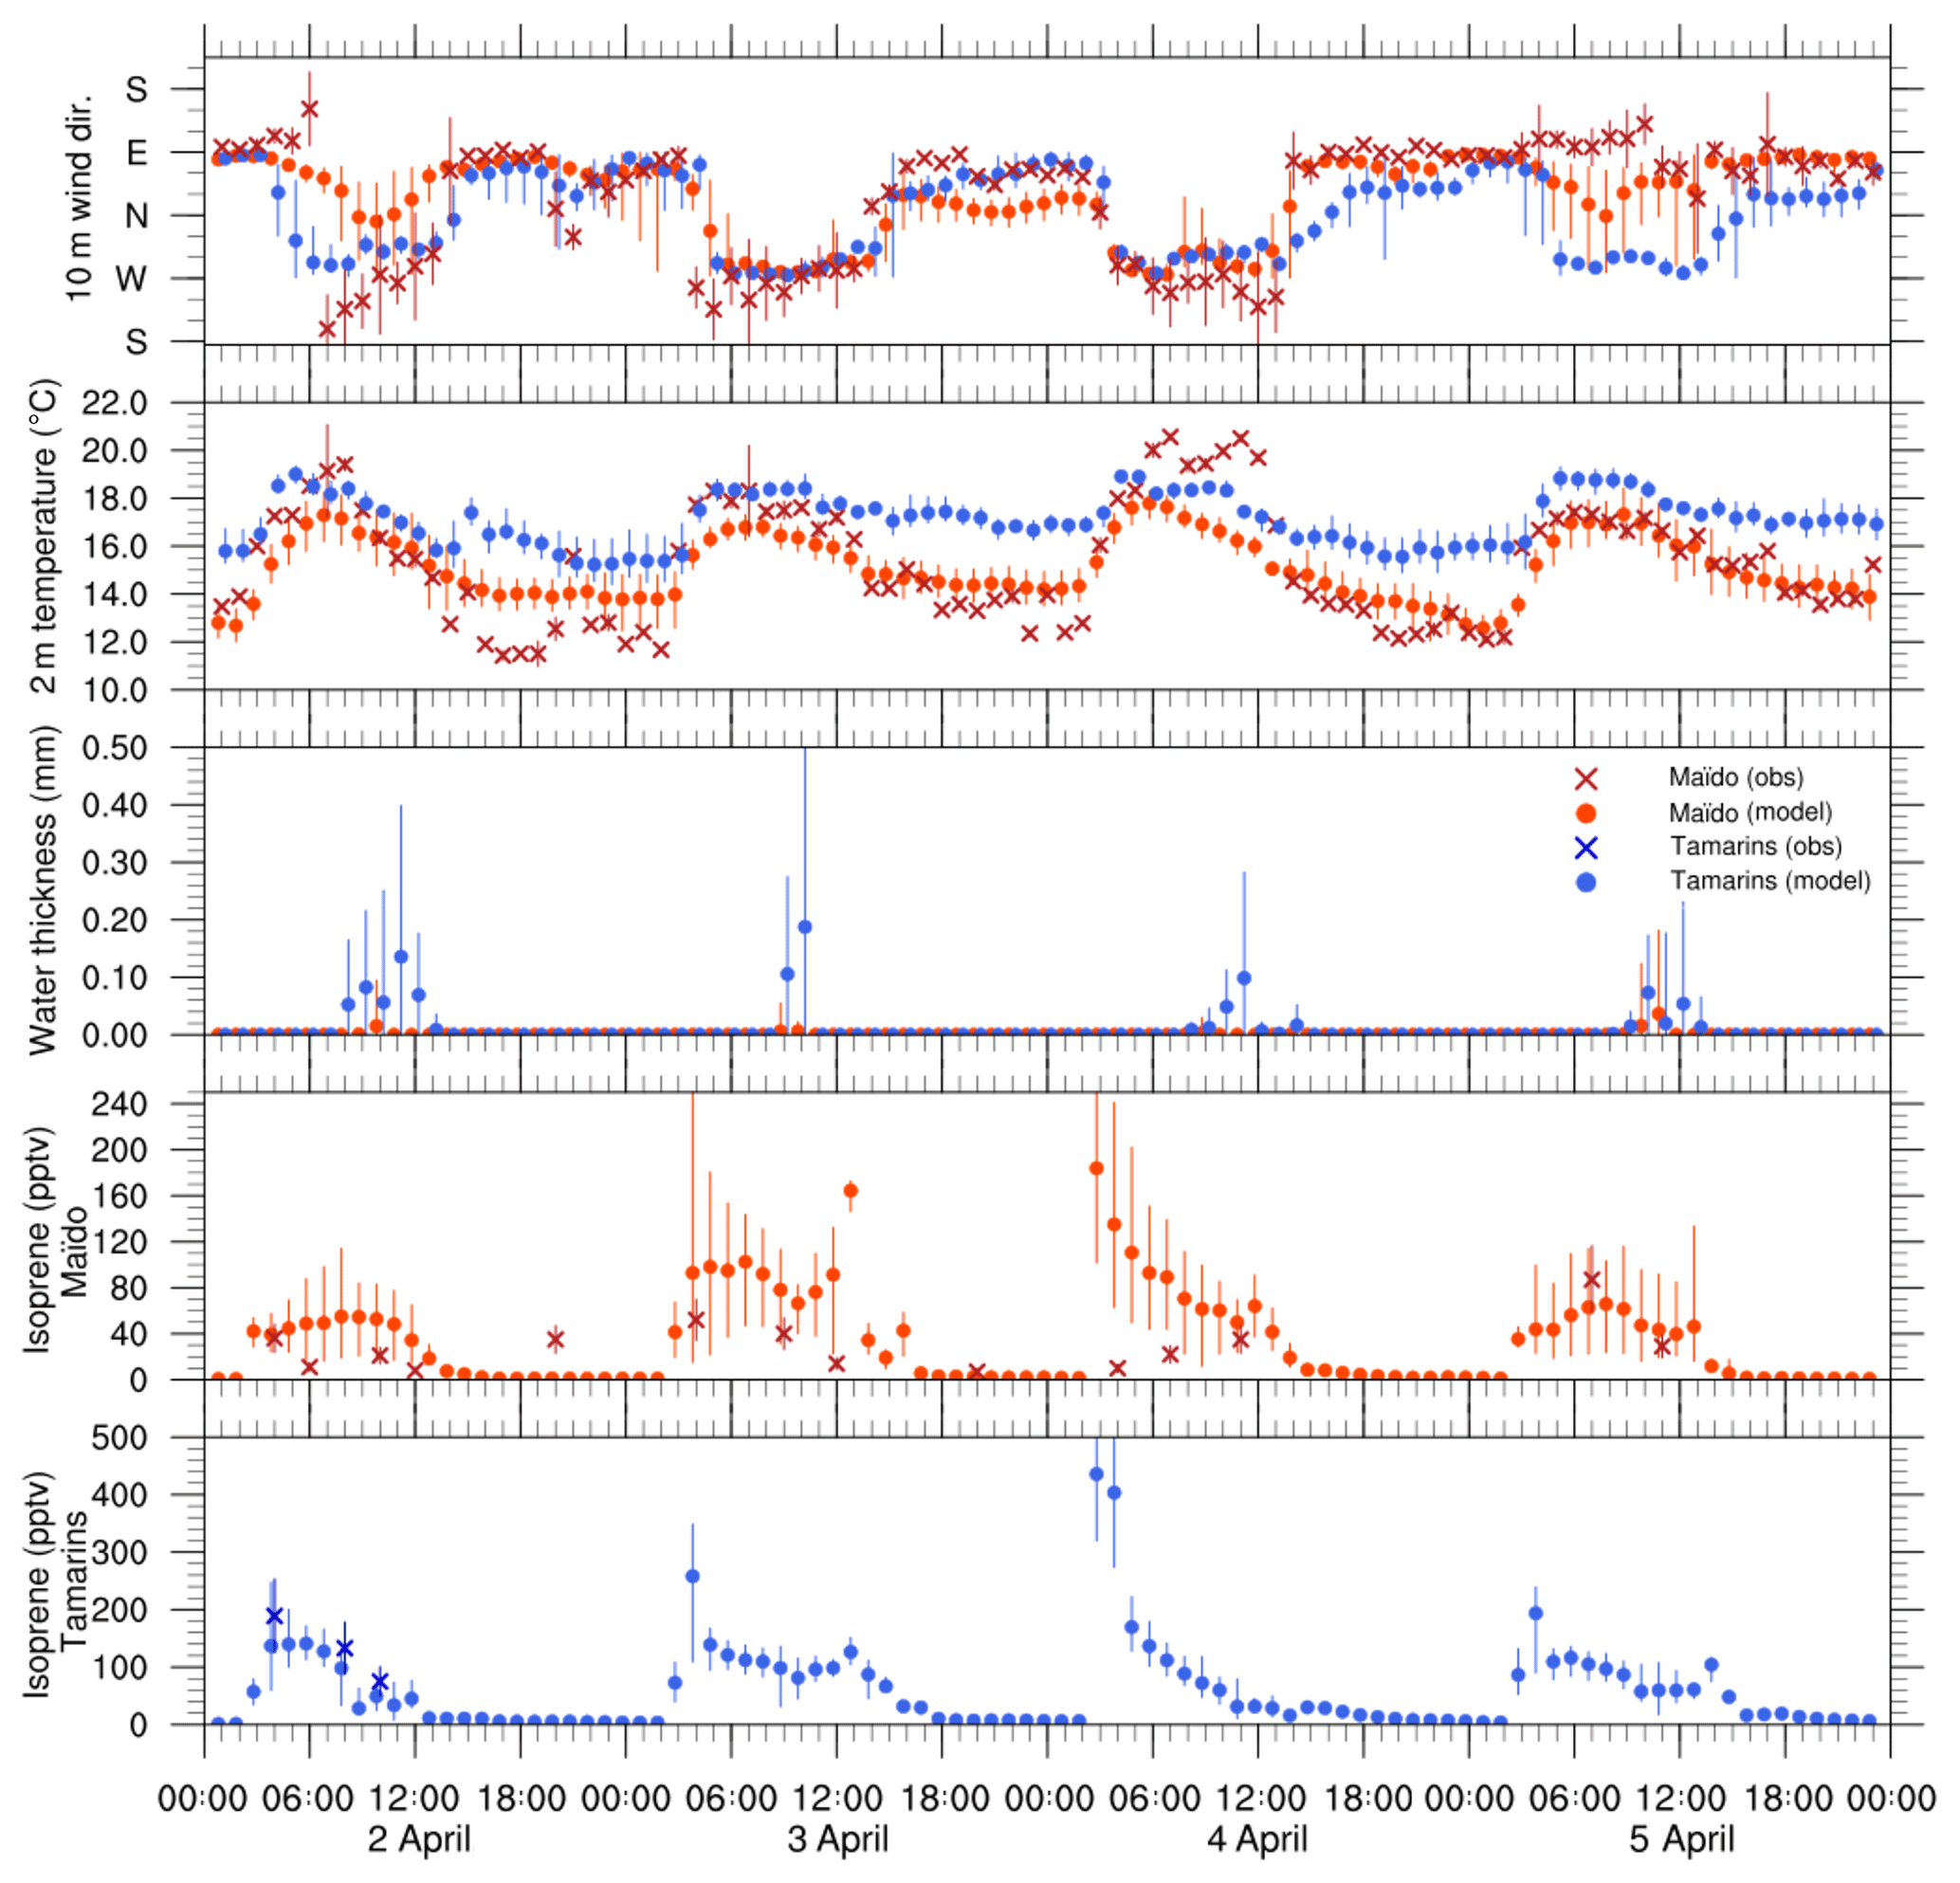
Figure 6Time series (UT) of the 10 m wind direction, 2 m temperature (∘C), integrated cloud water content (mm) and isoprene concentration (pptv) at the Tamarins plot (simulated values in blue dots and observed values in blue crosses) and at the Maïdo Observatory (simulated values in red dots and observed values in red crosses). Vertical bars show the uncertainties of the observations and dispersion of the simulated values on the model grid points surrounding both sites.
Figure 6 shows the time series of the wind direction, air temperature, and integrated cloud water content simulated during 4 d by Meso-NH at the surface level at the Maïdo Observatory and Tamarins plot. Observations of wind direction and air temperature at the Maïdo Observatory are also shown (red crosses). At the Maïdo Observatory, night-time observations show a clear prevailing easterly flow; day-time observations confirm that the observatory is located within the wind shear front zone between the trade wind flow (south-easterly) and the upwelling slop thermal breeze (north-westerly) (Fig. 5a). Temperatures range from 12 ∘C at night to 21 ∘C during day-time. It is worth mentioning that these observations should be taken as general tendencies as the sensor location on the concrete roof of the observatory makes them sensitive to the warming up of the building as well as to the turbulences generated by the building. Keeping in mind this caveat, and considering the observation error bars and the model standard deviations, one can see that there is an overall agreement between the measurements and the simulations. However, the change in the wind direction from easterly to southerly observed at Maïdo on 2 April at 06:00 UTC is not captured by the model: the location of the observatory within the convergence zone makes the numerical simulation of these flows difficult, especially with a 500 m horizontal resolution. This high horizontal variability is clearly shown by the deviations of the simulated values around the model points (vertical bars in Fig. 6): the dispersion of the simulated values is higher during day-time at the Maïdo observatory than at the Tamarins plot.
At the Tamarins plot, the wind direction simulated by the model is very stable, with a westerly flow between 05:00 and 15:00 UTC linked to the upwelling thermal breeze. Outside this period, the flow is easterly. Temperature fluctuations are also regular along the 4 simulated days. Maximum values reach 18–19 ∘C at around 04:00 UTC and temperature remains steady until 11:00 UTC. Night-time simulated minima are around 16 ∘C.
The simulated cloud life cycle exhibits a clear day-long period. On the Tamarins plot, clouds appear around 08:00 UTC and vanish around 13:00 UTC. The simulated integrated cloud water content is low (between 0.1 and 0.2 mm), which is typical for clouds weakly developed vertically. This cloud formation causes a PAR drop (not shown), which strongly reduces BVOC emissions from local noon (08:00 UTC).
At the Maïdo Observatory, simulated clouds are sporadic, and, when they appear, their water content is low. These results support the conclusion that the observatory is located within a cloud vanishing zone, which is linked to the flow shearing off and the easterly transport of dry air.
4.3 BVOCs and precursors
The mean measured isoprene mixing ratio (pptv) for all sites is represented in Fig. 8. As expected, the lowest concentrations of isoprene were found in the volcanic area with a very low vegetation density (<25 pptv), and the maxima of isoprene concentration were found within the forest plots ( pptv in the Mare-Longue 150 m plot and pptv in the Bélouve and Tamarins plots). Figure 5b gives an example of isoprene surface concentration simulated by Meso-NH on 2 April at 06:00 UTC. The highest simulated concentrations are located in the main rain forests on the east coast of the island (more dense) and at middle or low altitudes (more favourable to an optimal leaf temperature; see Guenther et al., 1995). In the north-eastern and southern forests, the model simulates isoprene concentrations of 800 and 400 pptv, respectively. On the west side, concentrations higher than 500 pptv are less extended due to higher urbanization and lower vegetation density. On the Maïdo planèze, the maximum simulated isoprene concentration is 400 pptv at 500 m a.s.l. Considering the error bars and standard deviations, one can see that there is an overall agreement between the measurements and the simulations at the island scale.
Figure 6 (lower panels) shows the time series of isoprene measurements and simulations at the Maïdo Observatory and at the Tamarins plot from 2 to 5 April. At the Maïdo observatory, observations exhibit a daily cycle of isoprene concentration, with maxima between 50±17 and 90±31 pptv during day-time. The isoprene concentration of 40±14 pptv at 20:00 UTC on 2 April is unexpected and would need further investigation. At the Tamarins plot, the isoprene measurements performed on 2 April show a similar diurnal cycle, with concentrations higher than the ones at the Maïdo Observatory: 200±68 pptv at 04:00 UTC and 100±34 pptv at 10:00 UTC. At both sites, the range of simulated isoprene concentrations agree remarkably well with the observations. Simulations exhibit a clear daily cycle with an abrupt increase at sunrise (03:00–04:00 UTC) and decrease toward 0 pptv at sunset. Taking into account error bars and standard deviations, one can see that there is an overall agreement between the measured and simulated time series of isoprene concentrations at both sites. At the Tamarins plot, the simulated isoprene concentrations on 2 April are in strikingly good agreement with the observations. At the Maïdo Observatory, the day-time situation is more complex since the observatory is located within the wind shear front zone between the trade wind flow (south-easterly) and the upwelling slop thermal breeze (north-westerly) (Fig. 5a). Simulated isoprene concentrations are directly linked to the direction of the simulated flow within which lies the Maïdo Observatory. On 3 and 4 April, the simulated north-westerly flow is intense, the Maïdo Observatory lies within an air mass that came up along the Maïdo mountain slope and, consequently, simulated isoprene concentrations reach 200 pptv on 3 and 4 April. On 2 and 5 April, the model keeps the observatory in a south-easterly flow, except between 08:00 and 11:00 UTC on 2 April and at 08:00 UTC on 5 April when the flow is northerly. Maximum simulated isoprene concentrations are therefore lower than on 3 and 4 April and stay below 80 pptv. On 2 April, the observations show that the model underestimates the upwelling thermal breeze and that the observatory is in a westerly regime during day-time. Inversely, on 5 April, observations show that the observatory is within a continuous easterly flow, whereas the model simulates a situation more similar to the one on 2 April. To sum up, Meso-NH seems to simulate dynamics and isoprene concentrations very well at the Tamarins plot, in terms of both the range of values and variations. At the Maïdo Observatory, simulations and observations agree very well in terms of the range of values, and reasonably well in terms of variations, due to the location of the observatory within the wind shear front zone.
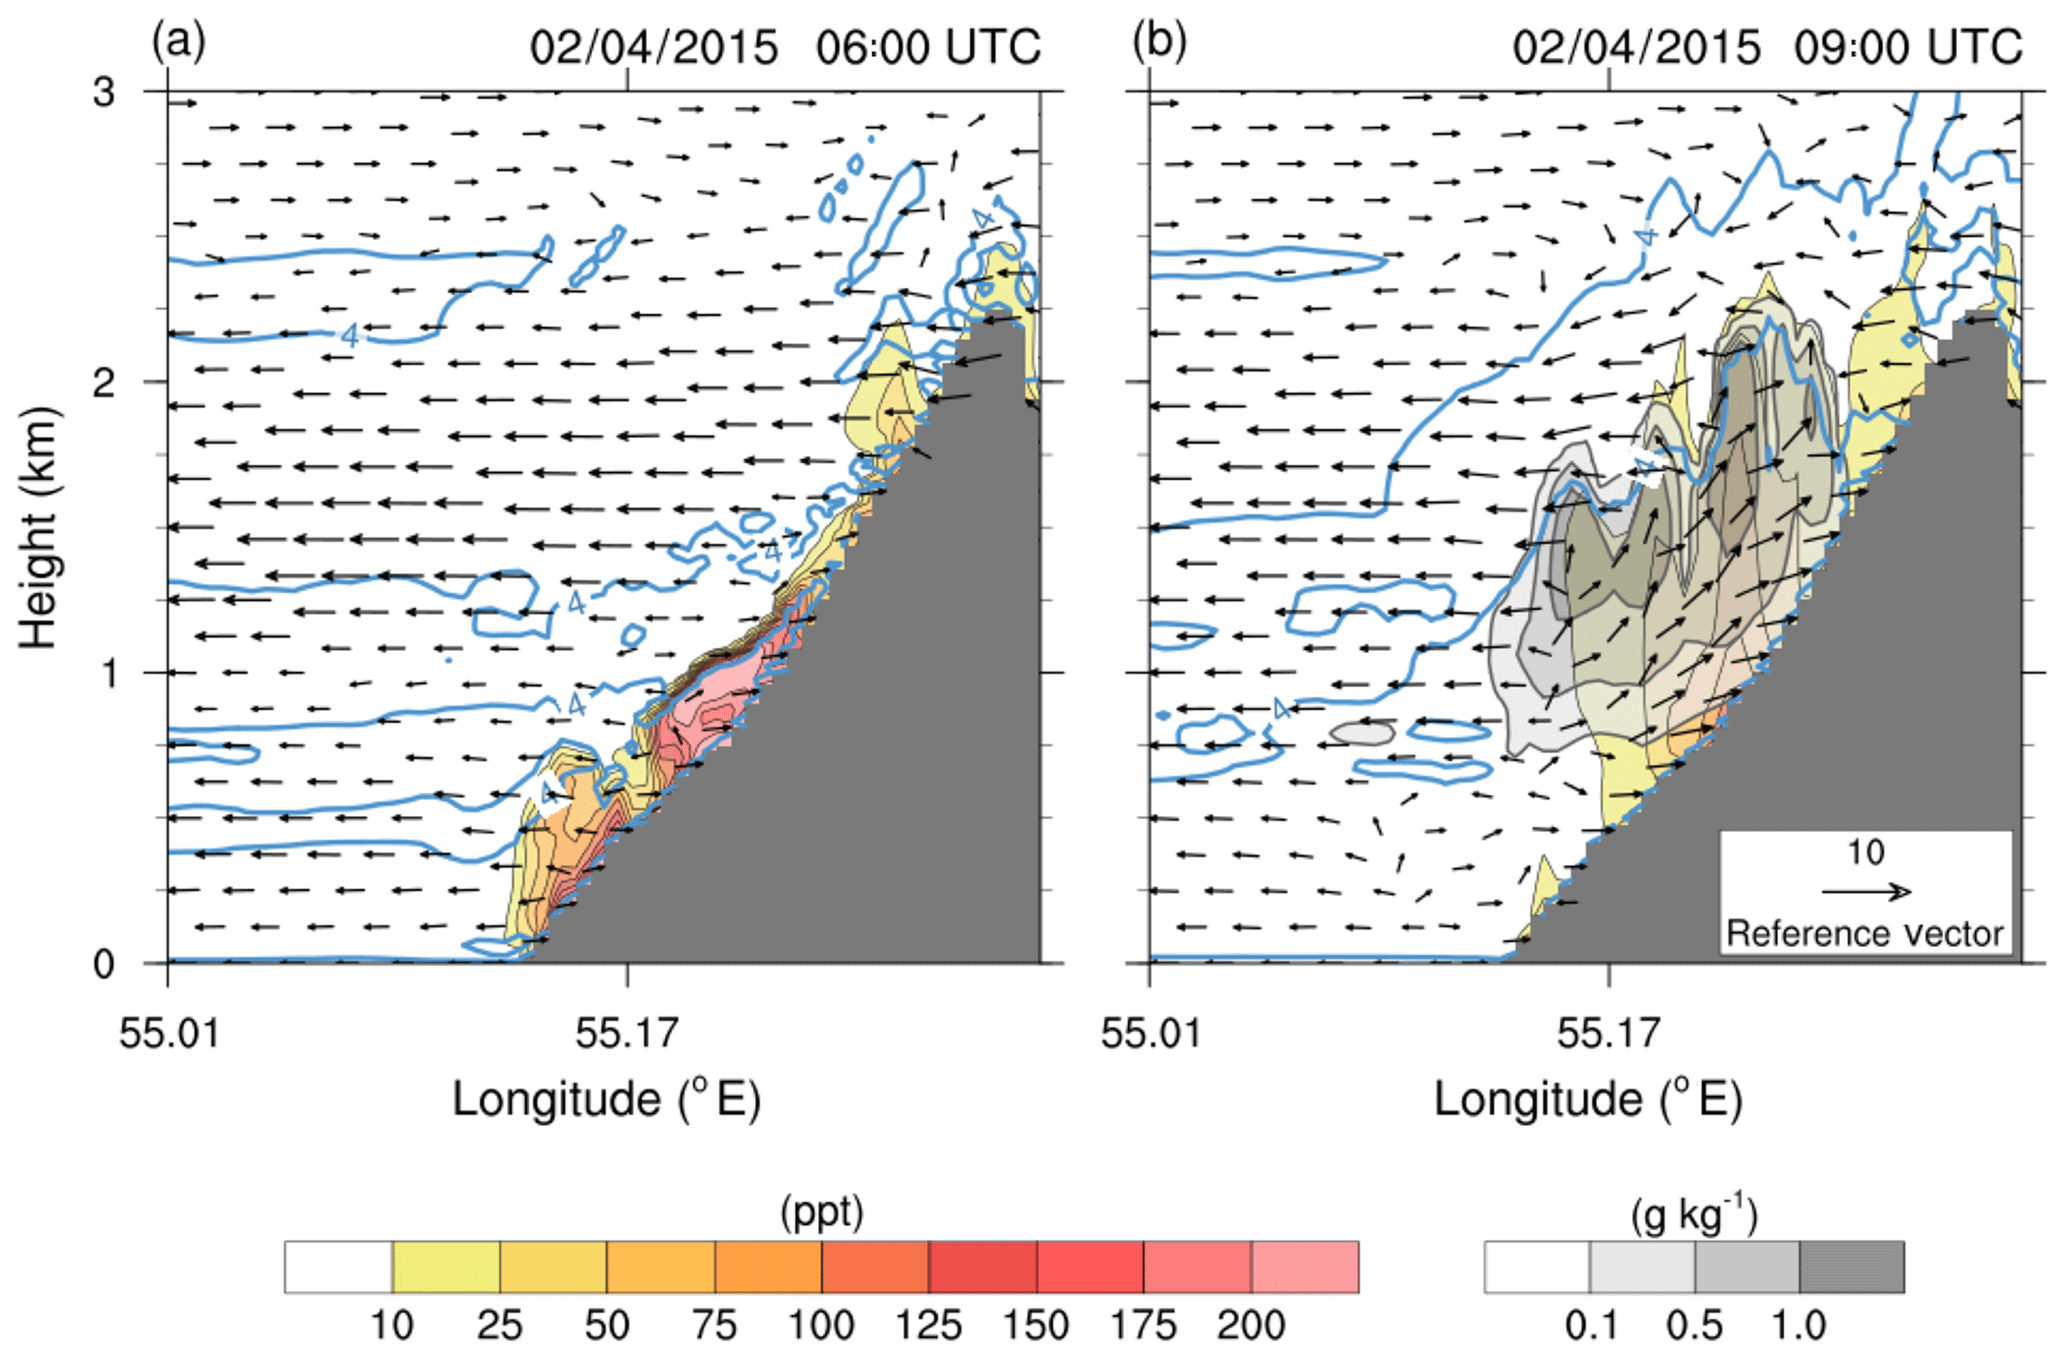
Figure 7Vertical cross section between 0 and 3 km a.s.l. along the line shown in Fig. 5 (b) showing the isoprene concentration (colour scale), cloud water (grey shaded in g kg−1), and the direction and intensity of the wind (in m s−1, scale given in the lower right corner) simulated by the Meso-NH model for 2 April 2015 at 06:00 UTC (a) and 09:00 UTC (b). Blue isolines show the square equivalent Brunt–Väisälä frequency (isoline at s−2).
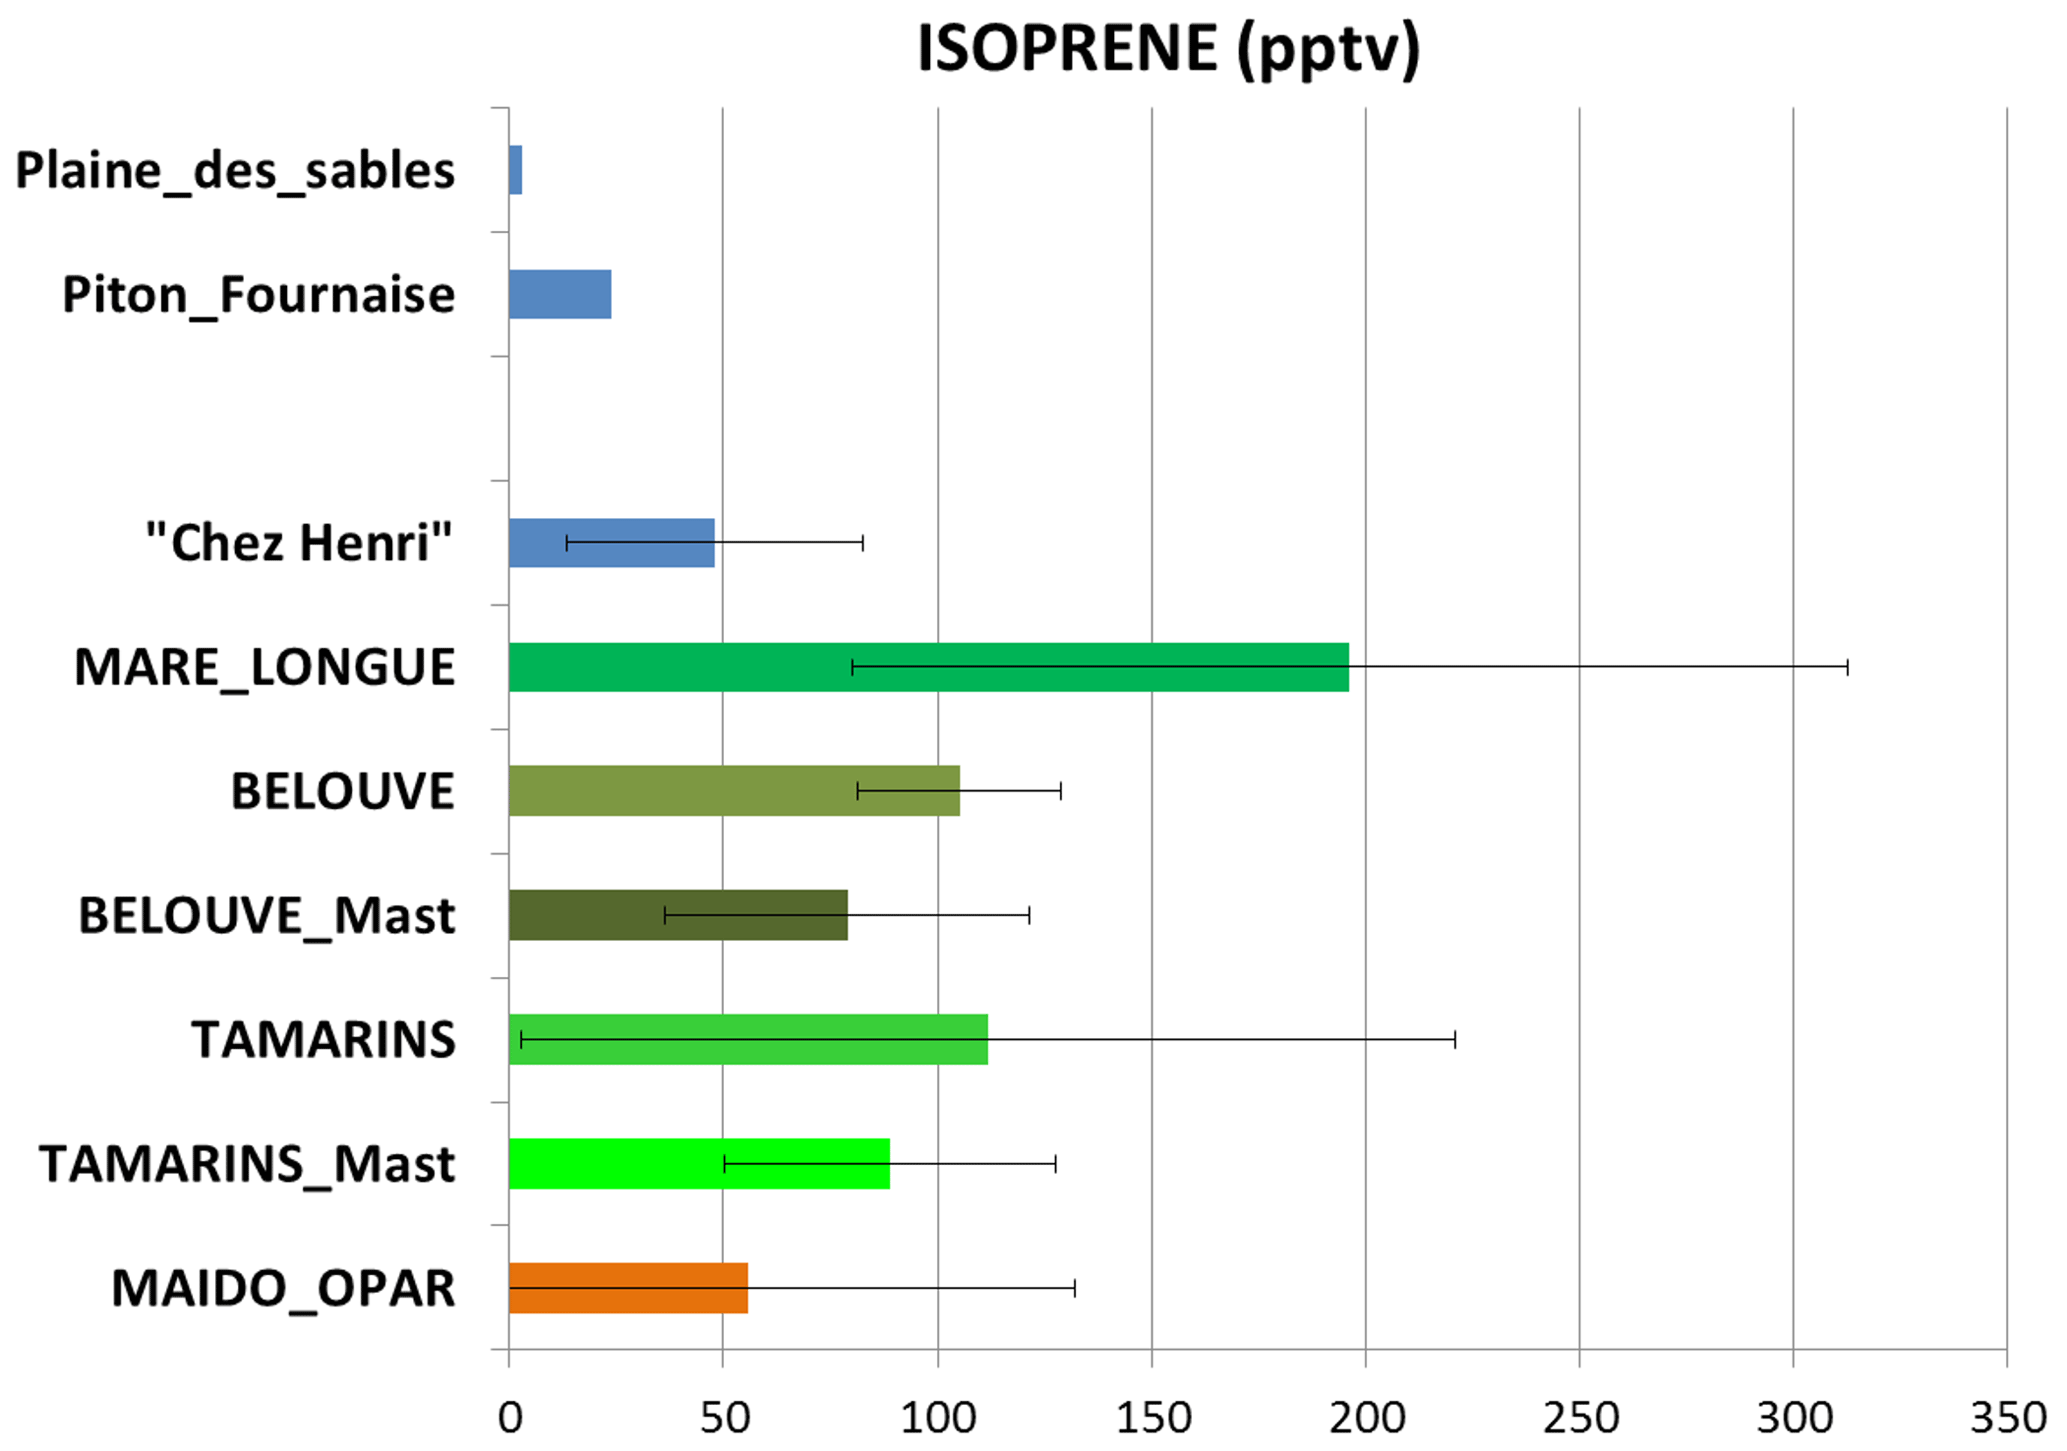
Figure 8Mean and standard deviation of isoprene mixing ratio (in pptv) for all sampling sites during the campaign.
The Meso-NH model is used in this paragraph to provide an insight into the diurnal evolution on the slope of the Maïdo mountain. Figure 7 shows the simulated vertical cross section of the isoprene concentration along the transect shown in Fig. 5b on 2 April at 06:00 (Fig. 7a) and 09:00 UTC (Fig. 7b). At 06:00 UTC, one can see a weakly developed boundary layer and an absence of clouds along the slope. With a temperature equal to 19 ∘C at 1700 m (Tamarins plot; see Fig. 6) and a stable atmosphere, Meso-NH simulates an accumulation of biogenic compounds close to the surface. For example, the maximum simulated isoprene concentrations are around 150–200 pptv at 1000 m a.s.l. within a 300 m thick layer. This thickness coincides with the top of the stable layer shown by the s−2 isoline of the square equivalent Brunt–Väisälä frequency. At 09:00 UTC, convection develops with an upwelling thermal breeze generating clouds, the base of which is located around 800 m a.s.l. and the top of which is at around 2000 m a.s.l. These clouds are in contact with the ground between 1000 and 1500 m a.s.l., which is in agreement with visual observations and lidar measurements (cloud layer observed from ≈1700 to ≈2100 m at 08:10 UTC; see Sect. 4.4 and Fig. 12). One can notice in Fig. 7 that the zone where clouds are in contact with the ground coincides with the forest areas of the Maïdo planèze. The presence of clouds causes a PAR drop, which bounds isoprene emissions, and the model simulates a decrease in the maximum concentrations down to 100 pptv. Isoprene produced before the formation of clouds is vertically transported by convection and concentrations of 50 pptv are simulated in aqueous phase. The result is important for two reasons. First, this species can be oxidized (Carlton et al., 2007; Yao Liu et al., 2009) or oligomerized (Renard et al., 2015) within the cloud to form secondary less volatile species, and potentially SOA. This is then a potential cause of SOA formation at the Maïdo Observatory. Second, this species can be used as a proxy for gases and PBAP emitted by the vegetation on the Maïdo slope.
Consequently, these preliminary results support the conclusions that (i) the simulation of dynamics parameters, emitted BVOCs and cloud life cycle in the Meso-NH model is realistic, and (ii) more advanced Meso-NH simulations should use an increased horizontal resolution (100 m) to better take into account the orography and improve the simulation of the wind shear front zone within which lies the Maïdo Observatory.
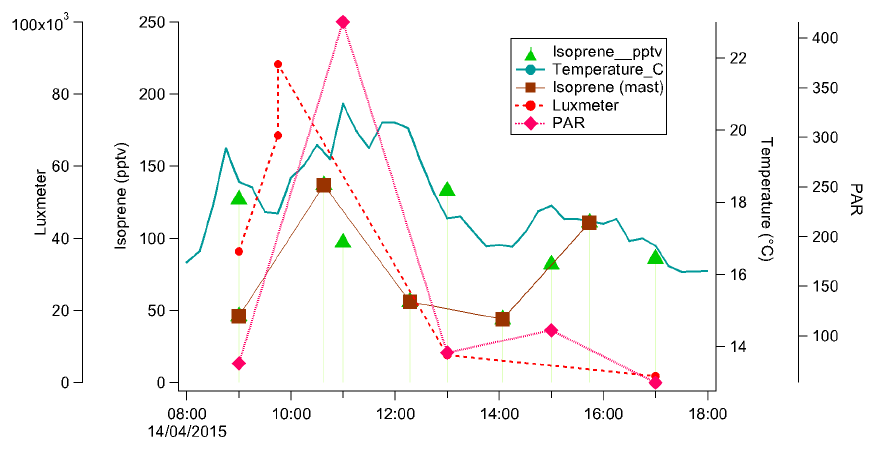
Figure 9Diurnal variation of isoprene (pptv) with PAR (µmol s−1 m−2) and temperature (∘C) in the Bélouve forest, on 14 April 2015. X axis gives local time.
Figure 9 shows the diurnal variation of isoprene concentration, temperature and PAR in the Bélouve plot on 14 April. One can see that the variations of these three parameters follow the same pattern (except at 16:00 local time when the isoprene concentration increases while the temperature and PAR decrease, which would need further investigation).
At the Maïdo Observatory, HCHO was continuously monitored from 11 March to 11 April 2015. We observe a large diurnal variation of HCHO during the whole studied period, with maxima between 08:00 and 10:00 UTC reaching up to ≈4 ppbv (Fig. 10). This period of time is associated with higher solar radiation and higher surface air temperatures that promote the occurrence of photochemical reactions (Lelieveld et al., 2002). During the night, the Maïdo Observatory is in the free troposphere under the oceanic influence (Baray et al, 2013; Guilpart et al., 2017). The low night-time concentration of HCHO (<0.4 ppbv) is representative of the marine unperturbed environment. During day-time, it is influenced by the compounds from the mixing layer.
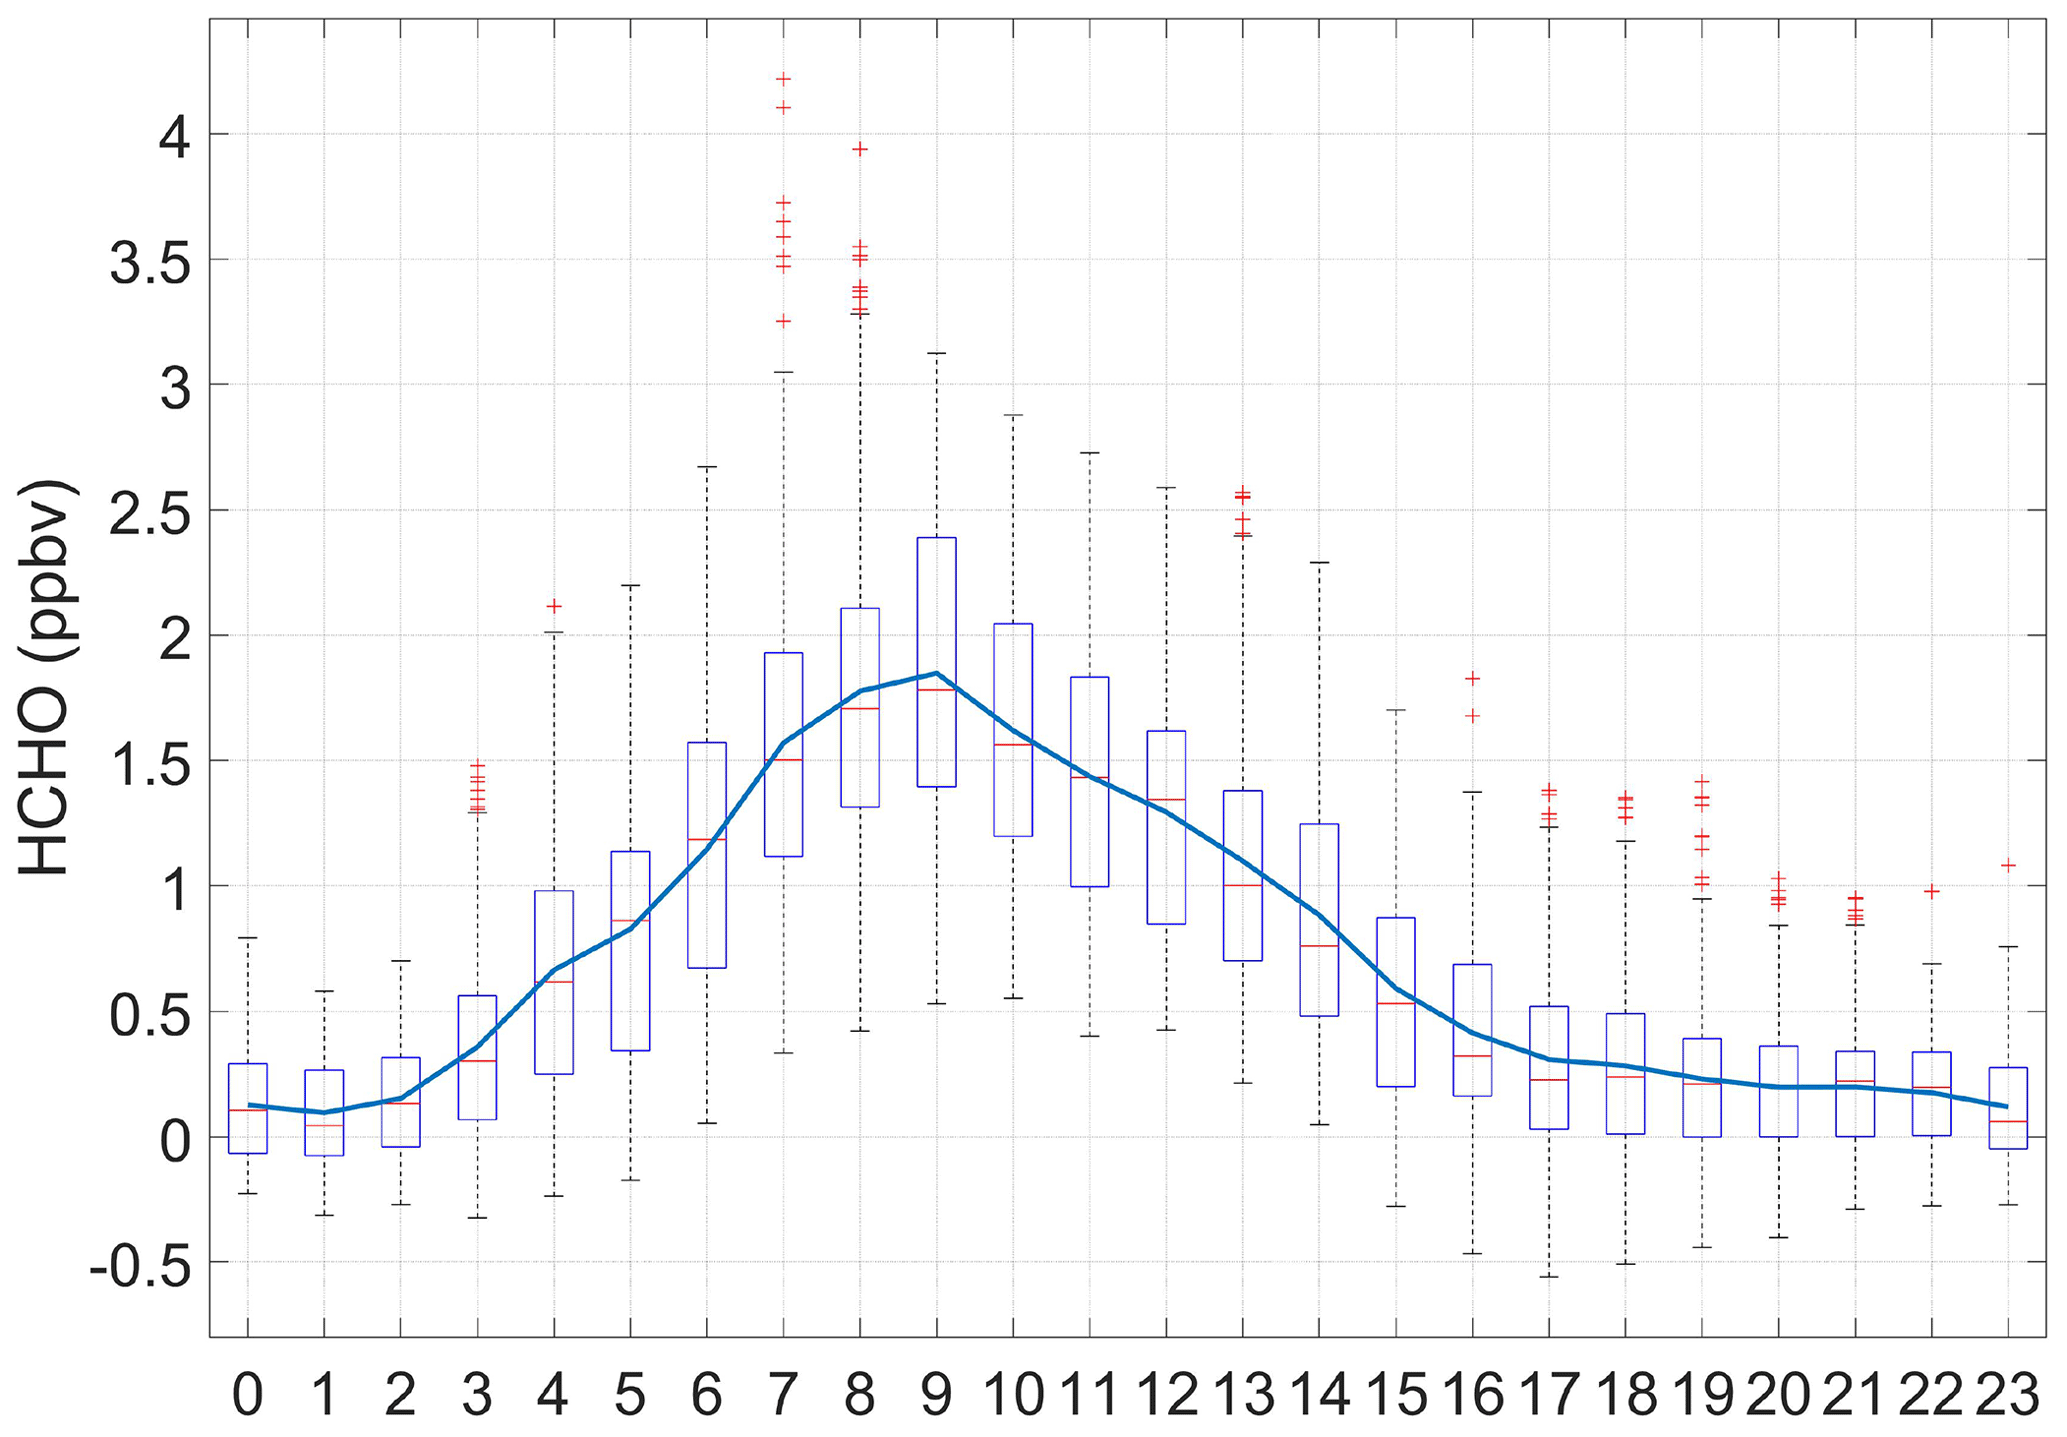
Figure 10Mean diurnal variation of formaldehyde concentration (ppbv) at the Maïdo Observatory. Measurements were performed from 11 March to 11 April 2015. Average concentration is shown by the blue line, the median is represented by red solid lines. The bottom and top edges of the box indicate the 25th and 75th percentiles, respectively. The whiskers extend to the most extreme data points and outliers are red crosses. Time is UTC.
Biogenic compounds like isoprene react rapidly with OH to form secondary HCHO. But HCHO can be also produced primarily by anthropogenic or biogenic emissions. One of the key points is to determine what the sources of HCHO at the Maïdo Observatory are: primary versus secondary, and anthropogenic versus biogenic. The scatter plot of HCHO versus NOx is shown in Fig. 11. We differentiate two kinds of situation: when ozone concentration is higher than 35 ppbv and NOx concentration is below 2 ppbv (blue squares), and when ozone concentration is below 30 ppbv and NOx concentration is above 3 ppbv (red diamonds). The blue domain could represent the HCHO photochemically produced from VOC photo-oxidation, including isoprene oxidation. In the red domain, HCHO is well correlated with high NOx and low ozone, which could be due to anthropogenic emissions along the coast and the upwind situation. HCHO sources at La Réunion will be further investigated using kinetics calculations and positive matrix factorization approach in a dedicated paper.
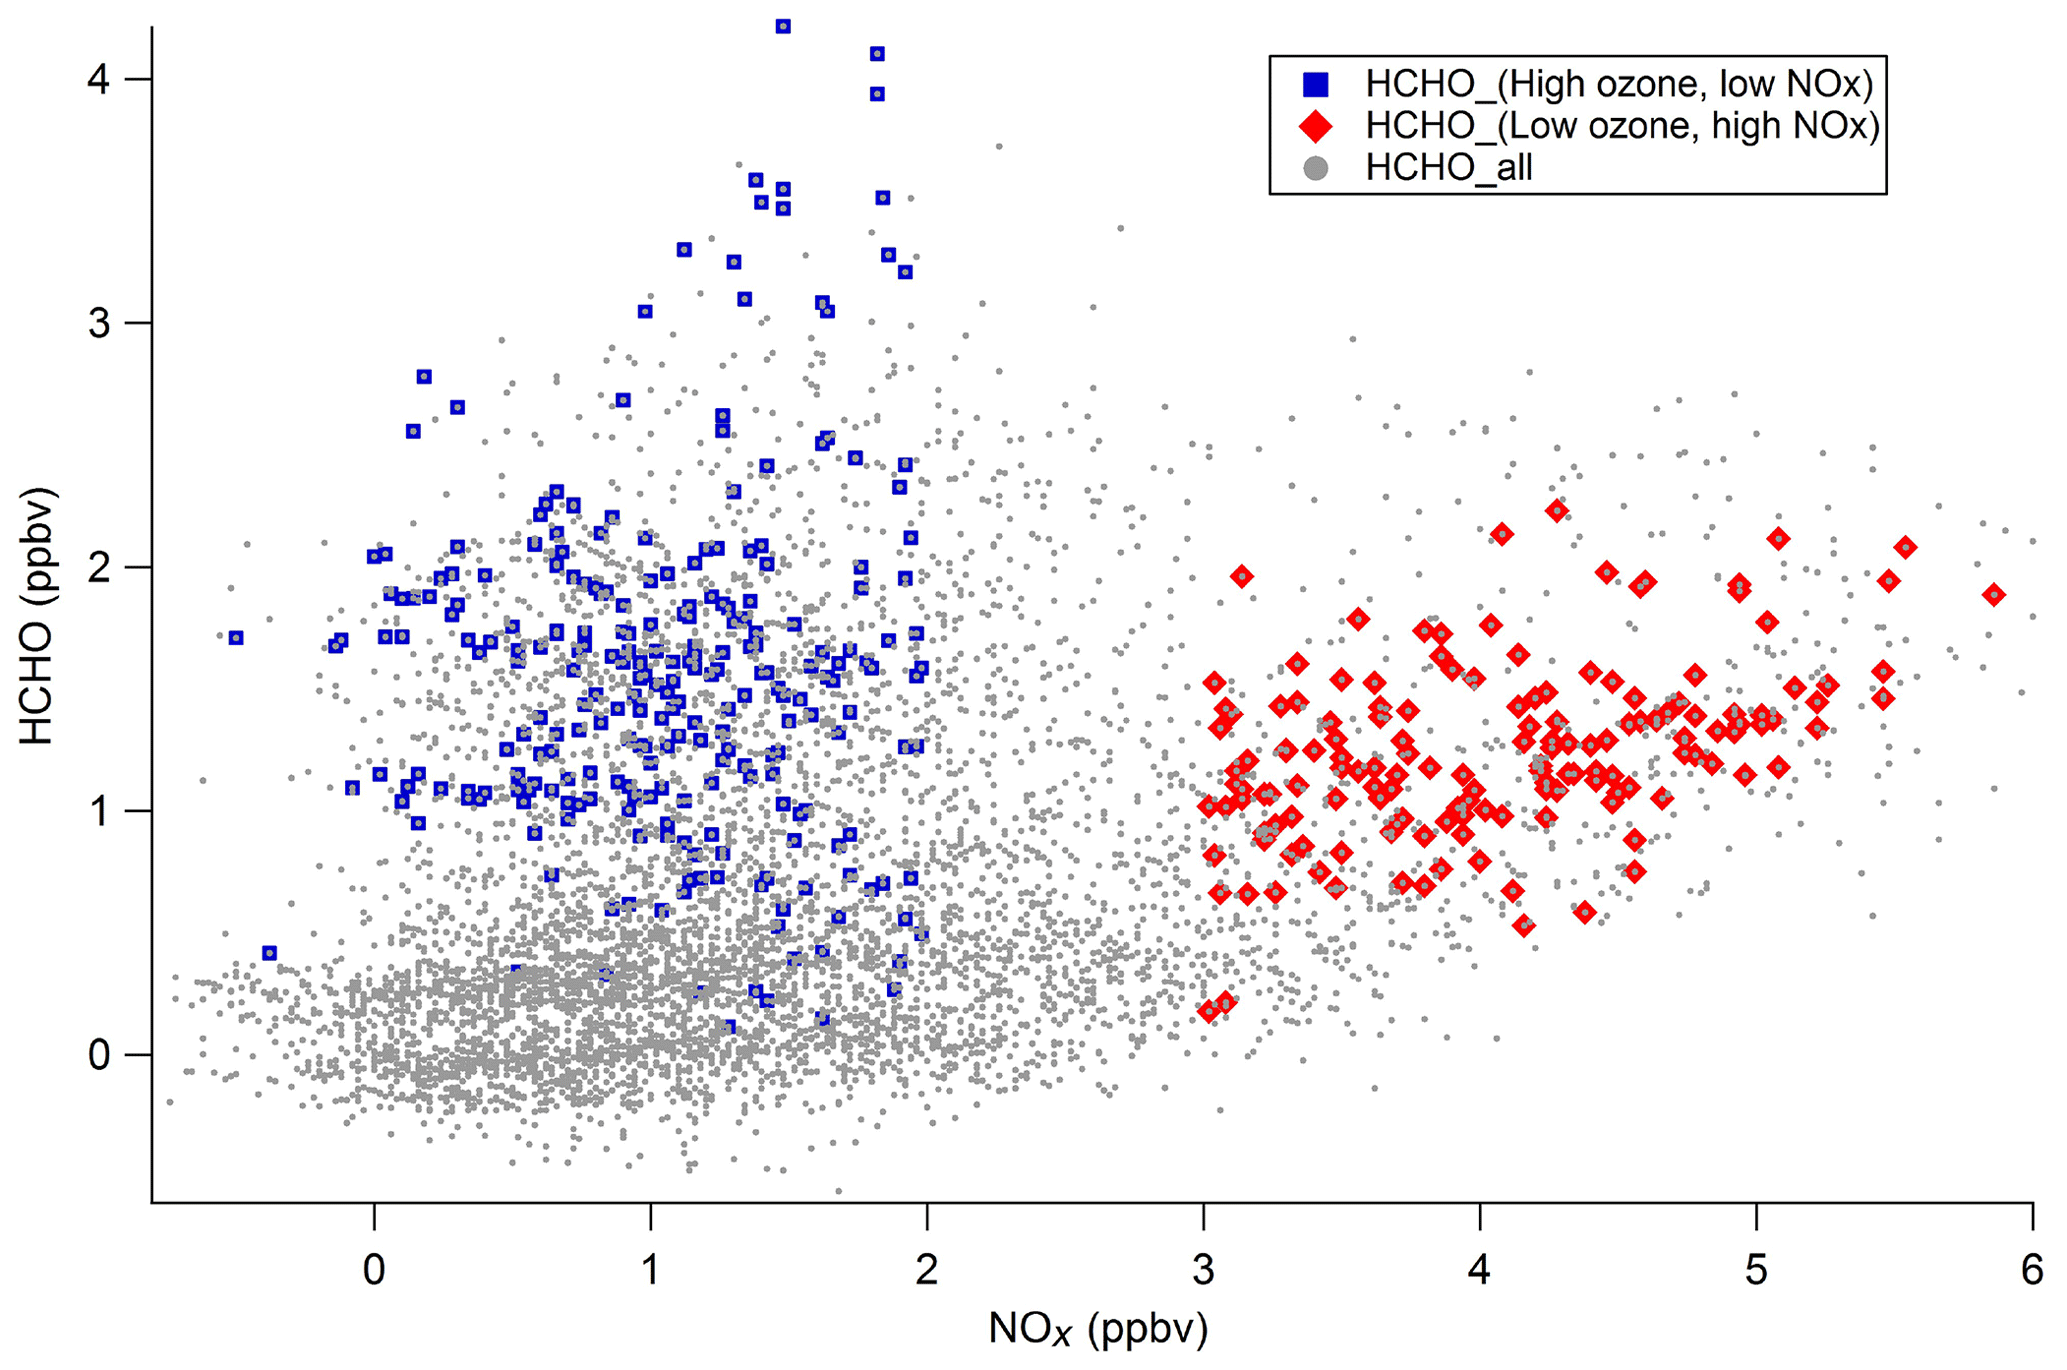
Figure 11HCHO versus NOx (ppbv) measured at the Maïdo Observatory from 11 March to 11 April 2015 (grey dots). Blue squares are for high ozone concentrations (>35 ppbv) and low NOx concentrations (<2 ppbv), and red diamonds are for low ozone concentrations (<30 ppbv) and high NOx concentrations (>3 ppbv).
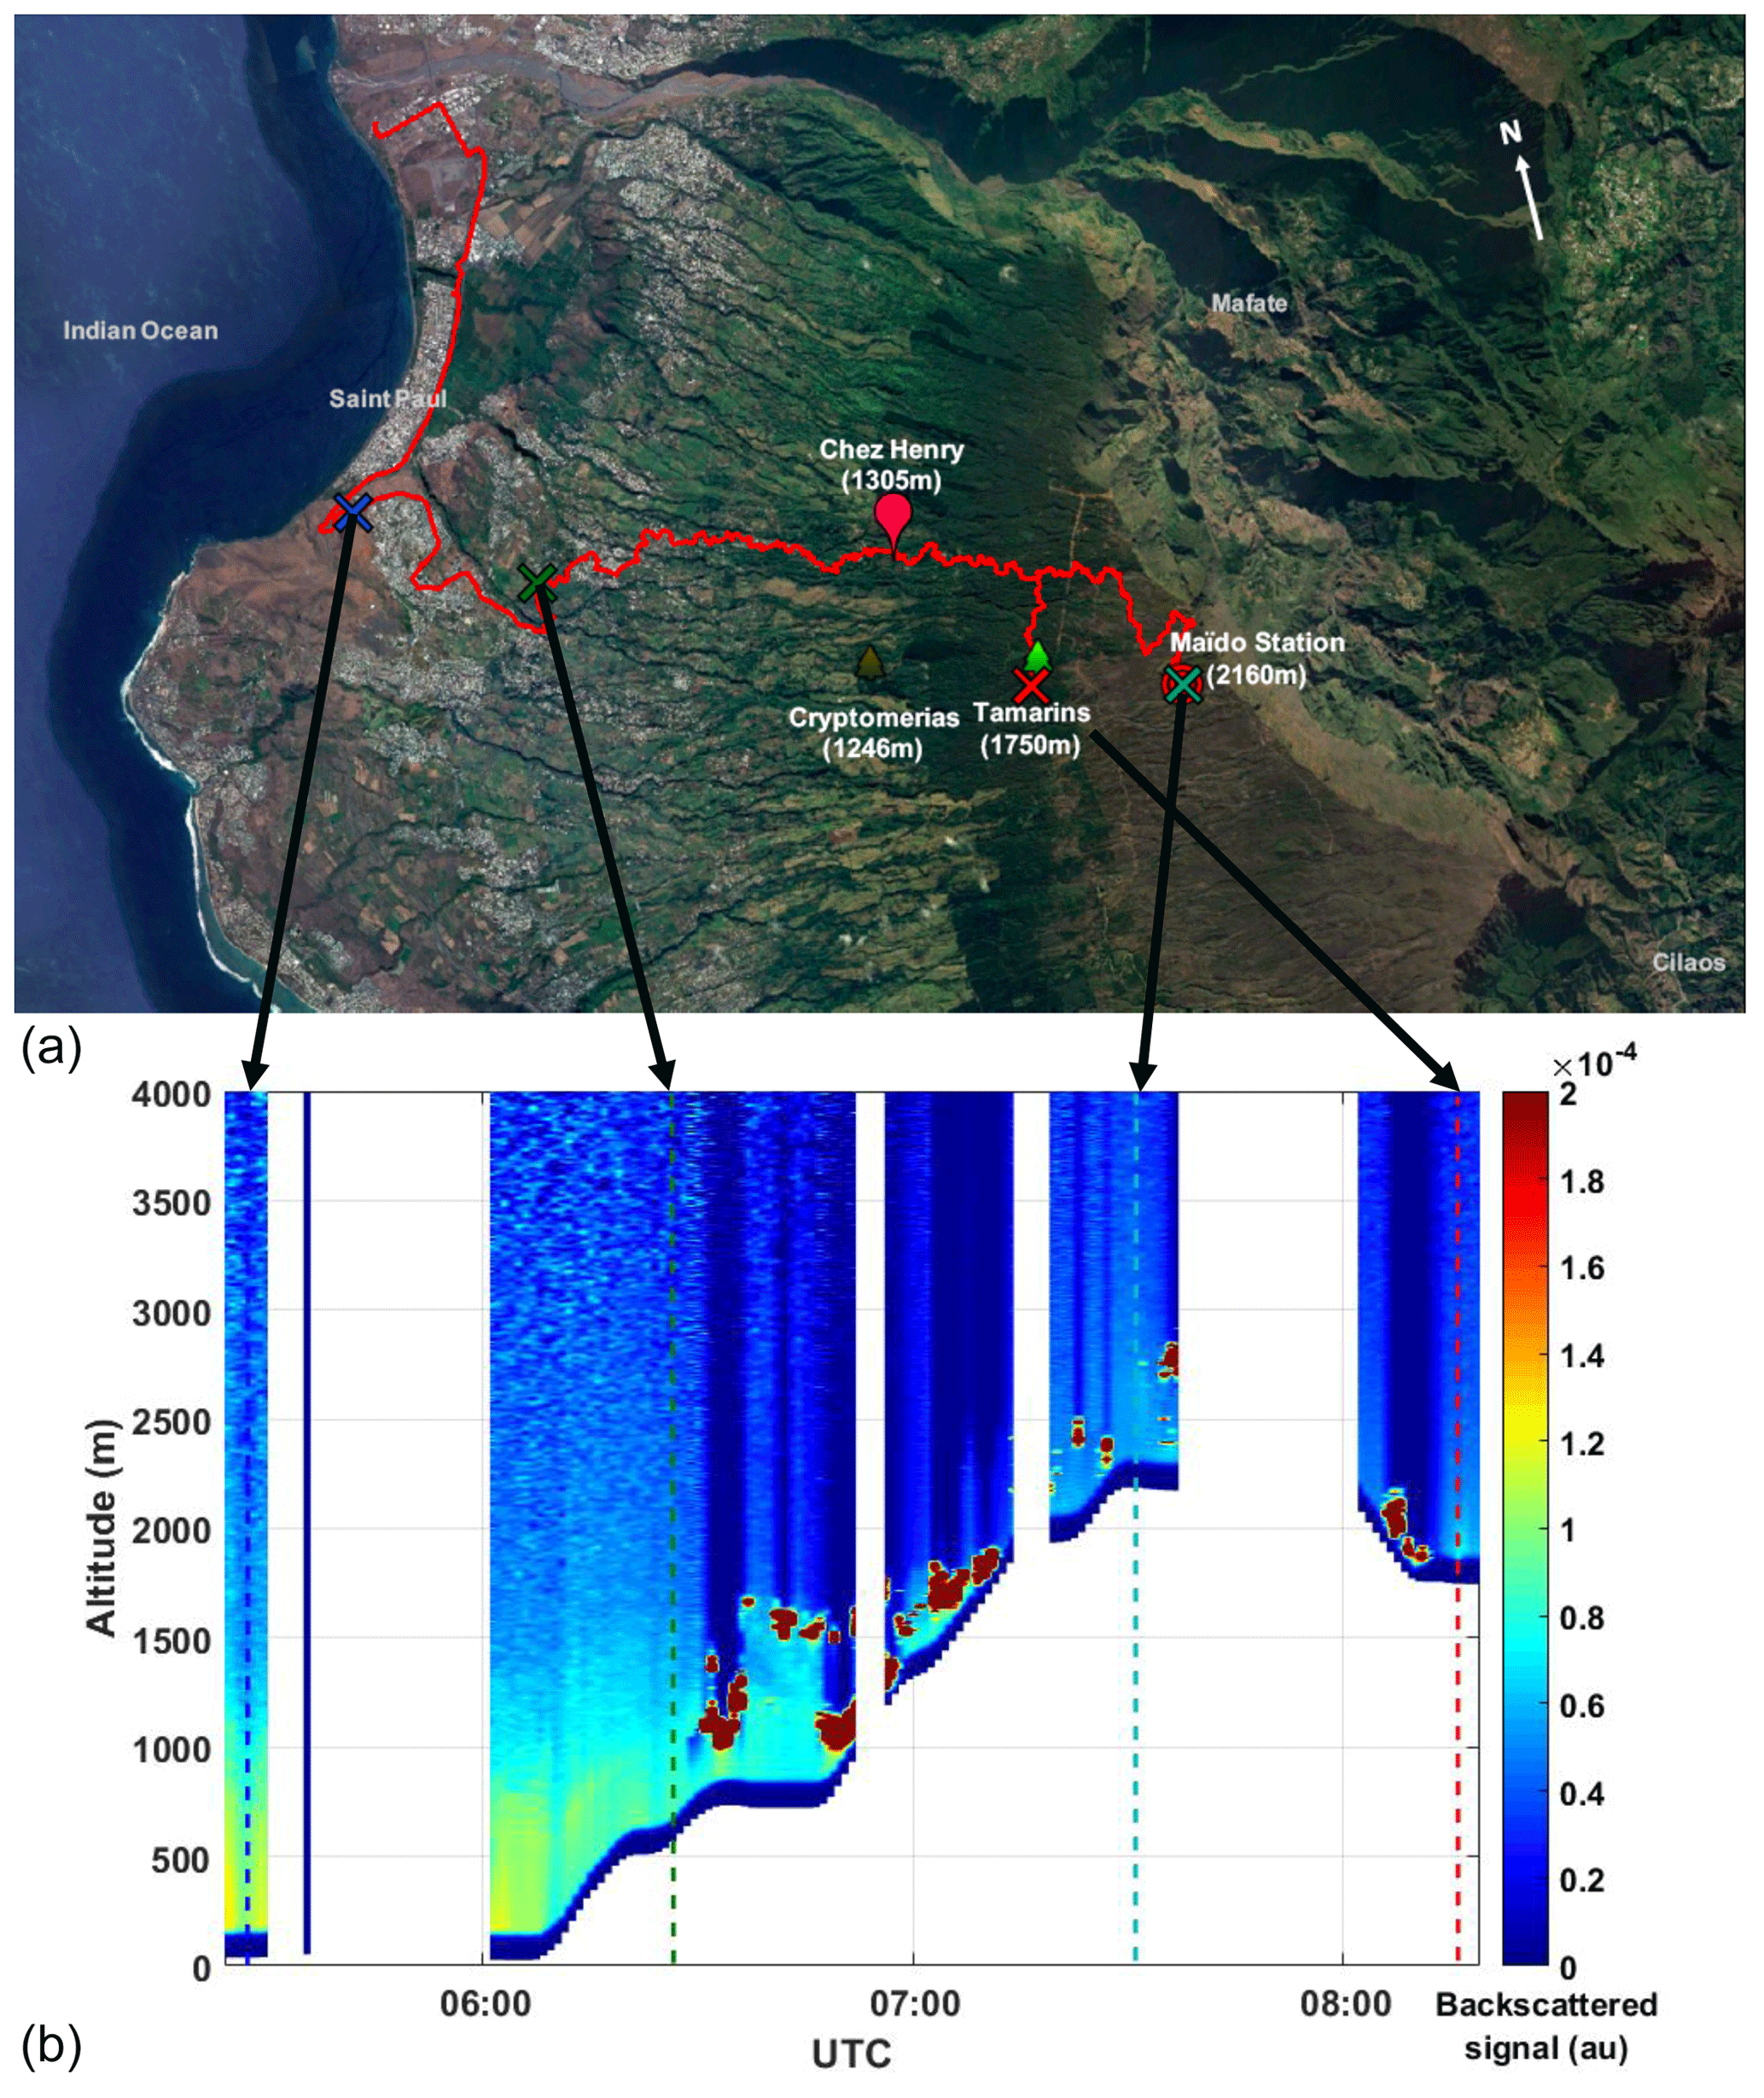
Figure 12(a) Map showing the track of the pick-up carrying the mobile aerosol lidar from Saint Paul up to the Maïdo station on 2 April 2015. Campaign sites are shown similarly to Fig. 1. This figure was created using ©Google Earth. (b) Lidar backscattered signals along the lidar track. Coloured crosses (a) and dotted lines (bottom panel) show the location of the lidar corresponding to the extinction profiles shown in Fig. 13.
4.4 Boundary layer aerosols along the Maïdo slope
On 2 April, the lidar system was operated on the pick-up from the shore up to the Maïdo station (Fig. 12a). Figure 12b gives the time series of the lidar backscattered signal along the track of the pick-up (blank periods are due to defaults of the system). At the beginning of the track, one can see an aerosol-loaded layer extending up to ≈1500 m above ground level (a.g.l.), narrowing gradually while the pick-up goes up. Clouds start to appear at ≈250 m a.g.l. when the lidar is at ≈750 m a.s.l. (≈06:30 UTC).
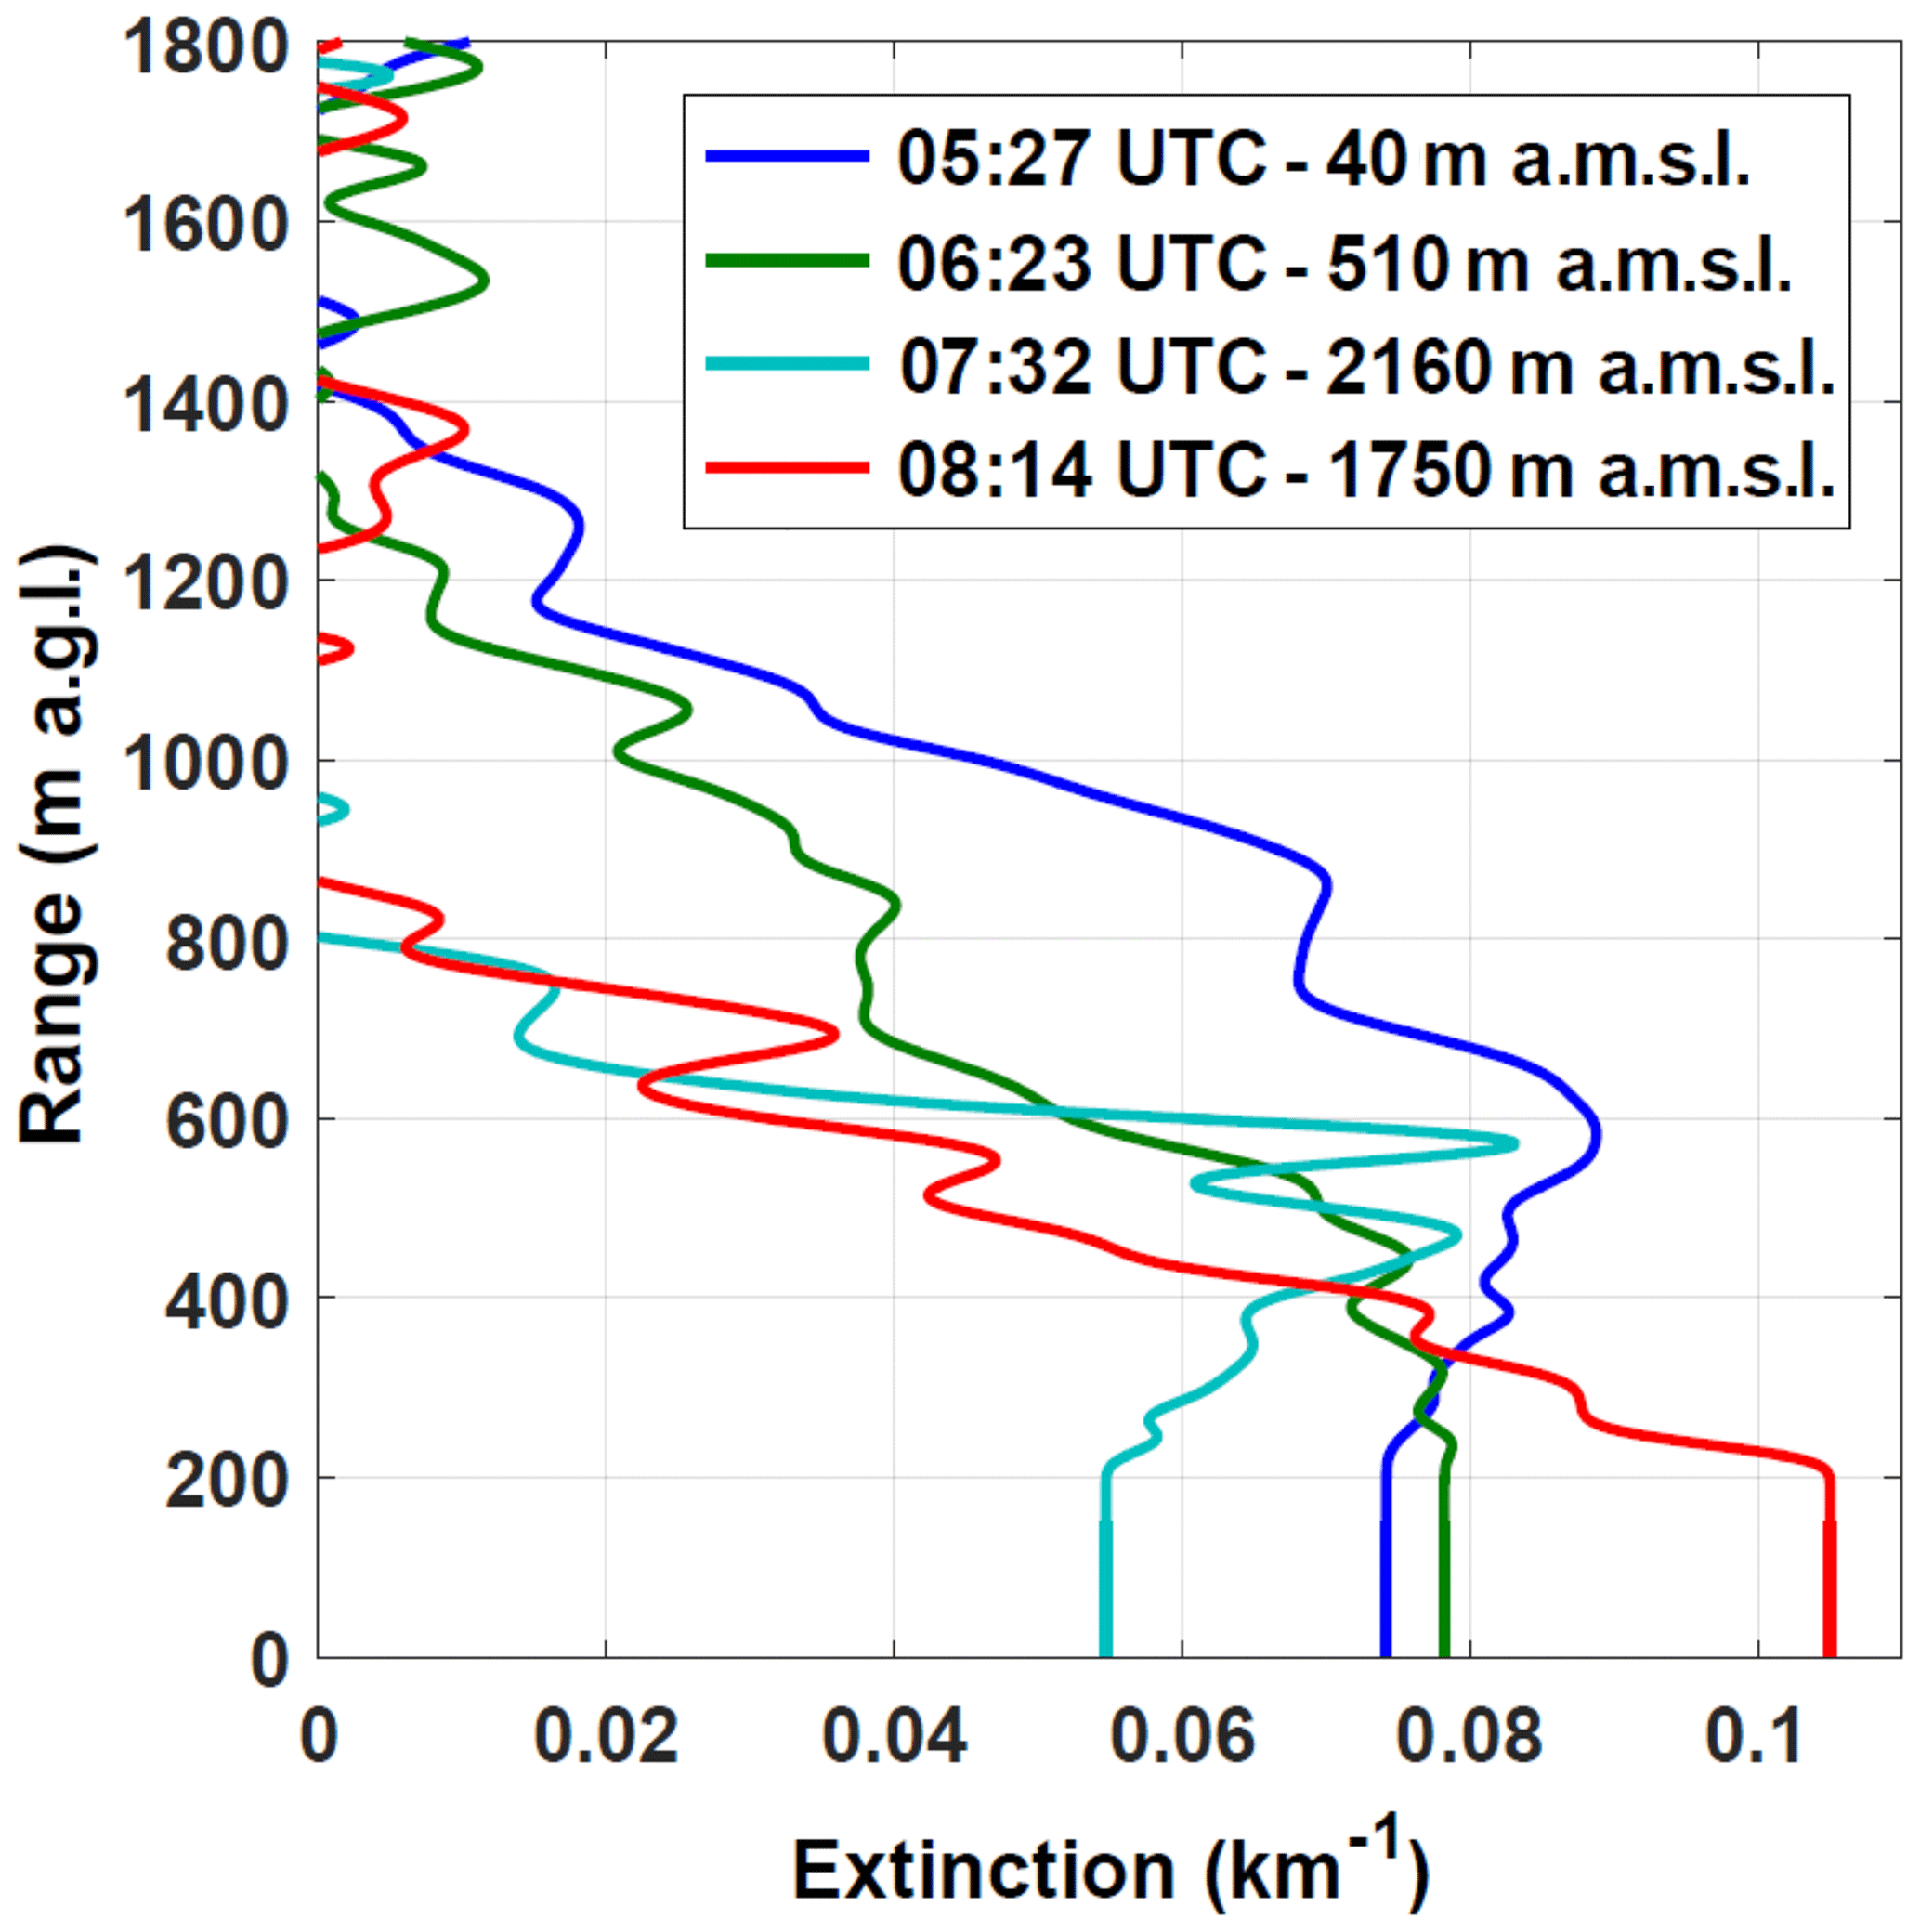
Figure 13 shows the extinction profiles retrieved using simultaneous sun photometer measurements at 05:27, 06:23, 07:32 and 08:14 UTC (crosses in Fig. 12a and vertical dashed lines Fig. 12b). Table 3 summarizes the lidar altitude (Zl) and distance from the shore (Ds), the measured AOT355 and Ångström coefficient between 500 and 870 nm (Å), and the retrieved LR at 355 nm (LR355) and vertical extension of the aerosol layer (Ha) for each of these four local times. One can first notice that AOT355 decreases with the lidar altitude Zl (from 0.08±0.02 at 40 m to 0.02±0.005 at 2160 m), and that, consistently, the retrieved extinction profiles show a decreasing Ha with increasing Zl (from ≈1400 m at 40 m to ≈800 m at 2160 m), showing that the thickness of the probed aerosol layer decreases while the lidar is getting closer to the free troposphere. Oppositely, Å increases with Zl (from 1.06±0.16 at 40 m to 1.38±0.21 at 2160 m), showing that the probed aerosols get smaller while the lidar gets further from the shore. Similarly, LR355 increases from 30±8 sr at 40 m to 50±13 sr at 2160 m.
Table 3Lidar altitude (Zl) and distance from the shore (Ds), AOT355, Ångström coefficient between 500 and 870 nm (Å), retrieved LR at 355 nm (LR355), and vertical extension of the aerosol layer (Ha) for the four extinction profiles shown in Figs. 15 and 16.
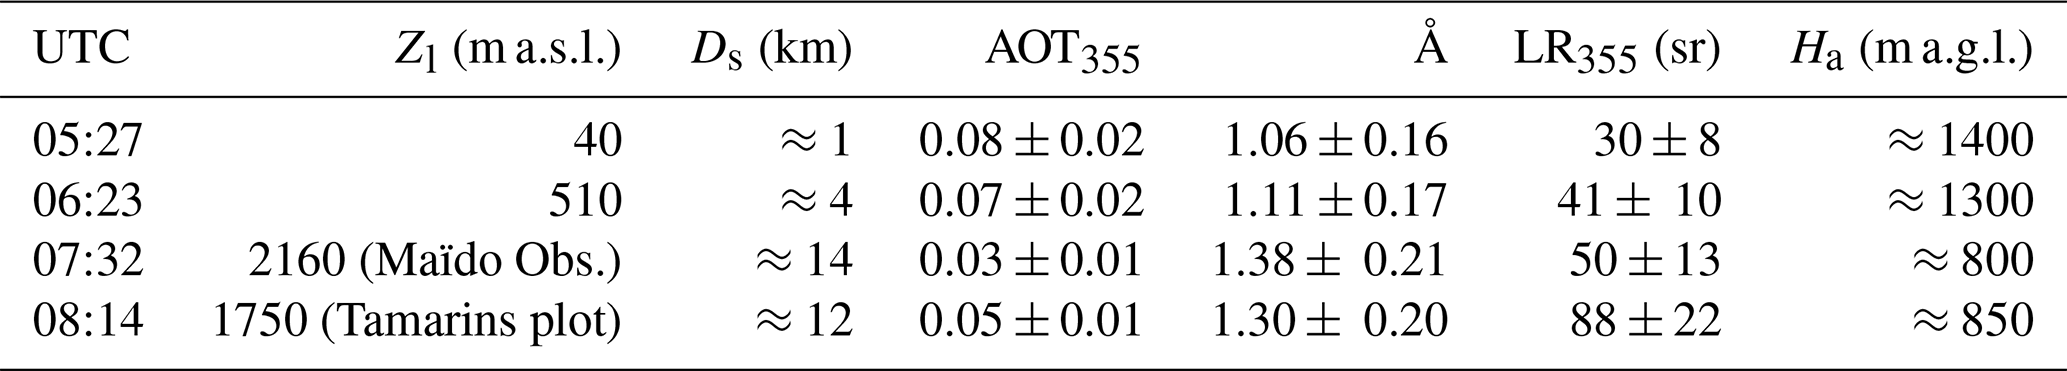
While the Å values give information on the average size of the encountered aerosols, LR355 values give information on the absorption efficiency of the particle ensemble, and thus on the type of aerosols. At 05:27 UTC, LR355 equals 30±8 sr, which is in the range of typical LR355 values for marine aerosols (sea salts) (Cattral et al., 2004; Duflot et al., 2011). At 06:23 and 07:32 UTC, getting further from the shore, LR355 rises up to 41±10 and 50±13 sr, respectively, which is higher than typical LR355 values for marine aerosols and is most probably a signature of a marine, anthropogenic/urban and biogenic aerosol mixture. To sum up, between the shore and the Maïdo station, the aerosol optical depth, the aerosol layer thickness and the aerosol average size decrease, while their absorption efficiency increases: the lidar gets closer to the free troposphere and the sea salt loading decreases.
At 08:14 UTC (Tamarins plot), Ha and AOT355 values (≈850 m and 0.05±0.01, respectively) are slightly higher that the ones at the Maïdo station (≈800 m and 0.03±0.008, respectively), showing that the probed aerosol layer is slightly thicker at the Tamarins plot than the one probed at the Maïdo station. Å values are similar at the two measurement locations (1.30±0.20 and 1.38±0.21 at the Tamarins plot and at the Maïdo station, respectively), which indicates that the average size of the probed aerosols is similar. However, surprisingly, LR355 equals 88±22 sr at the Tamarins plot, which is in the range of typical LR355 values for relatively strongly absorbing aerosols, such as combustion aerosols (biomass burning and anthropogenic/urban/industrial aerosols). Our best-case scenario to explain this LR355 value is a contribution from local anthropogenic/urban sources reaching the Tamarins plot at this time.
4.5 Nucleation and bio-aerosols
The previous sections focus on the general boundary layer dynamics, cloud life cycle, meteorological parameters, BOVCs and their precursors prevailing on La Réunion and, especially, on the Maïdo mountain slope during the FARCE campaign. The present section focuses on the impacts of these prevailing conditions on the formation of aerosols, INPs, and biological loading in both cloud-free and cloudy conditions.
4.5.1 Impact on aerosols formation
The formation of new particles by nucleation of gas-phase precursors was observed every day of the field campaign except on 30 and 31 March and on 6 April. A typical new particle formation event occurring during the campaign is shown in Fig. 14 for 3 April.
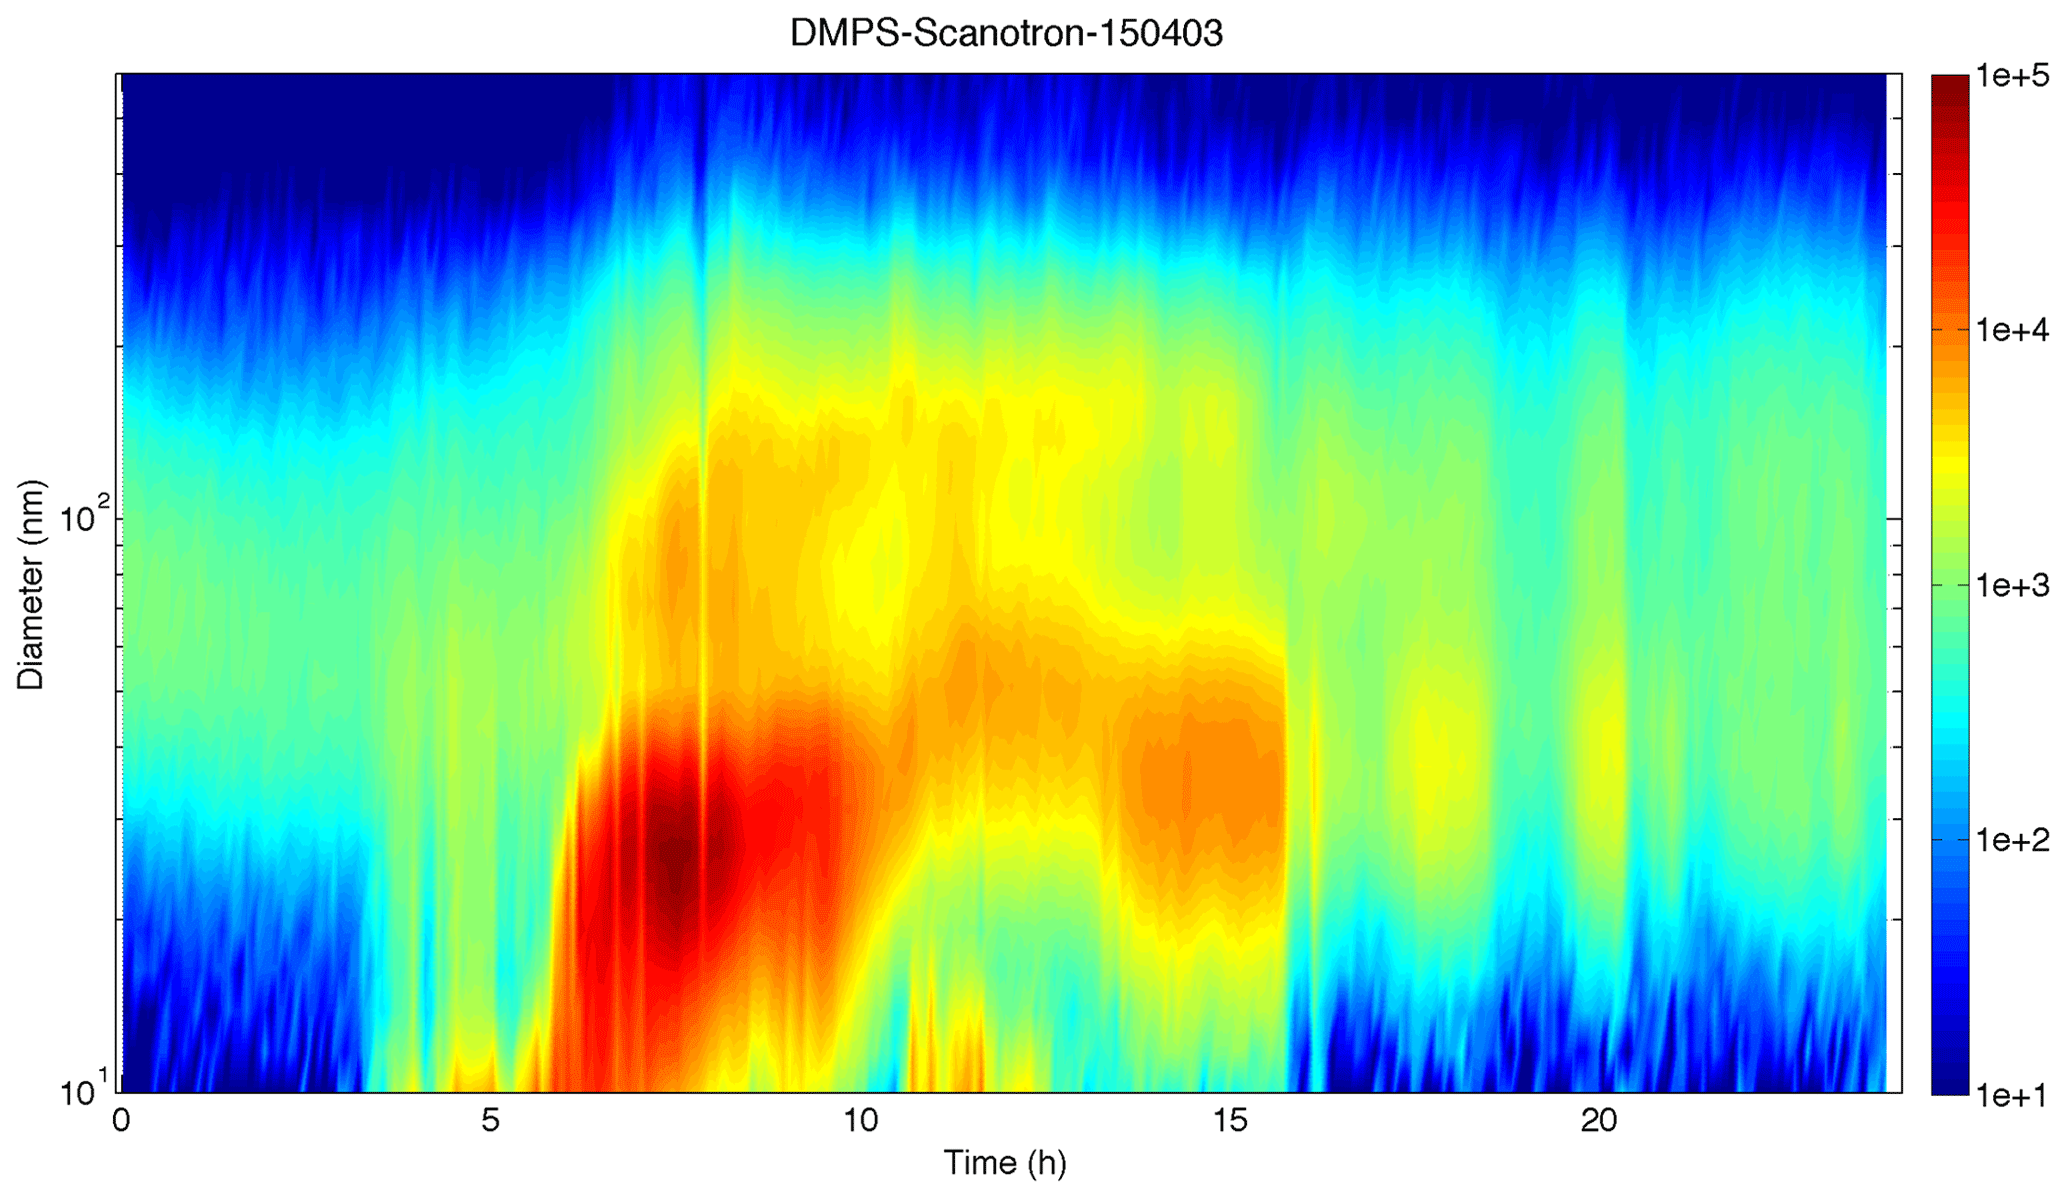
Figure 14Daily variation of the aerosol size distribution (10–550 nm) observed on 3 April 2015. The aerosol concentration (dN∕dLogDp) is illustrated with the colour bar, time is on the x axis (UTC) and aerosol diameter is on the y axis.
The aerosol concentration is increasing at the lowest size range from 03:00 UTC and progressively at slightly higher diameters during the following hours, showing the aerosol early growth after they have been formed. On 3 April, the observed (and modelled) wind direction is shifting from easterly to westerly at 04:00 UTC (Fig. 6). In parallel, the isoprene concentration is observed (and modelled) to increase from around 03:00 UTC (Fig. 6), in correspondence with the appearance of ultrafine particles. The appearance of isoprene concentrations 1 h before the wind shift would correspond to the advection of an eastern counterflow over the Mafate area, which was in contact with the vegetation on the eastern side of the island. Hence, for explaining the presence of ultrafine particles at 03:00 UTC, only biogenic or marine precursors can be invoked.
At around 06:00 UTC, the intensity of the nucleation mode is abruptly increased, followed 1 h later by the arrival of an additional mode particles in the 80–100 nm size range (accumulation mode particles). The appearance of such an additional mode indicates that the boundary layer reaches the site and contains primary particles. The growth of the newly formed particles continues during the day by condensation of low volatility gas-phase compounds, until they reach 40–50 nm. Note that it is not clear which precursors are responsible for the aerosol growth, as marine, biogenic and anthropogenic contributions are expected along the air mass track. Some of these particles may directly contribute to the CCN population for high cloud sursaturations, or they can grow to larger sizes during the following day to be active as CCN at lower sursaturation. At 16:00 UTC, the air mass is changing to a particle-poor regime, indicating that the station is sampling free tropospheric air again, under the influence of catabatic winds going downhill (see Sect. 4.2).
4.5.2 Ice-nucleating particles concentration
The results of the MOUDI-DFT measurements performed at the Maïdo Observatory are summarized in Table 4. The average INP concentration values observed here are remarkable, in part, because of the low values observed at each temperature. In contrast, INP concentration values summarized by Mason et al. (2016) from six locations in North America and Europe, also determined using the MOUDI-DFT technique, are shown in the table. At the two temperatures (−25 and −20 ∘C) available for comparison, concentration values reported by Mason et al. (2016) are 1–2 orders of magnitude higher. In addition to the low concentrations, the relative fraction of large particles (>1.0 µm) observed at the Réunion site are substantially higher than the range of similar size fractions reported by Mason et al. (2016). Because of the long sample periods (6–7 h), MOUDI samples were generally mixed from multiple air mass types (i.e. free tropospheric, trade wind or locally emitted), and so specific conclusions about air mass origin is challenging.
Table 4Overview of INP measurements from the FARCE campaign. INP concentration and INP fraction at two particle size cut-point shown as mean values ± standard deviation. The range of observed values from six measurement locations summarized by Mason et al. (2016) are shown for comparison. Values at −30 ∘C are not reported (nr) by Mason et al. (2016). Number of samples showing measurable INPs shown.
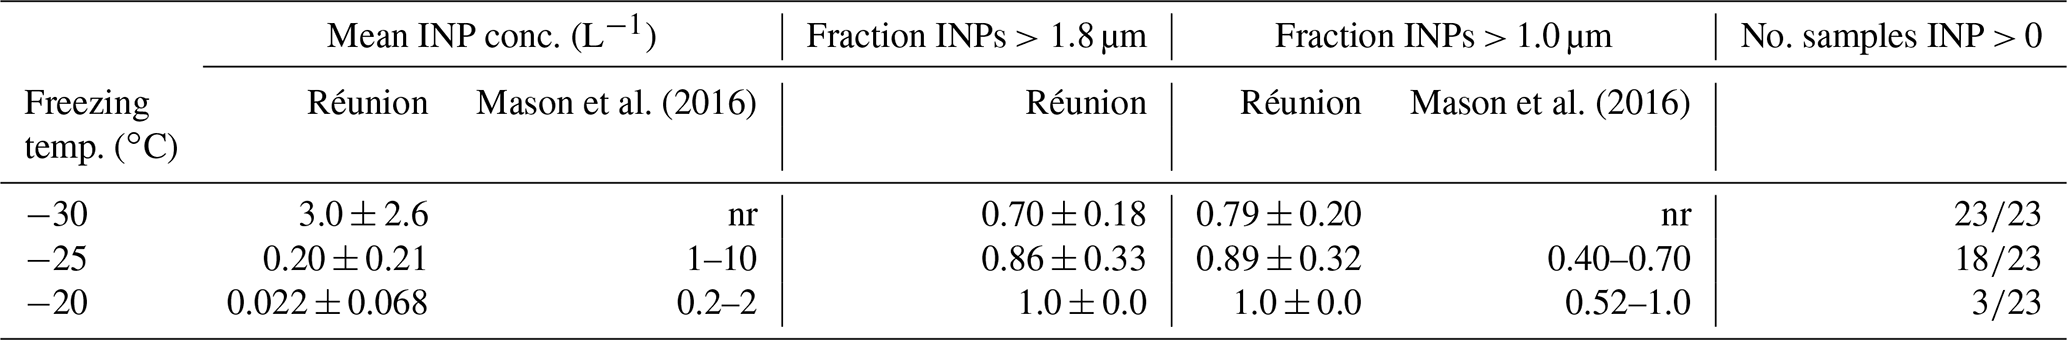
Much has been recently stated about the lack of observations in remote areas of the Southern Hemisphere. The results summarized here are suggestive that INP concentrations in relatively remote stations such as on La Réunion may indeed be considerably lower than in areas more commonly accessed for observation in continental areas of the Northern Hemisphere, as has been suggested previously (e.g. Burrows et al., 2013; McCluskey et al., 2018).
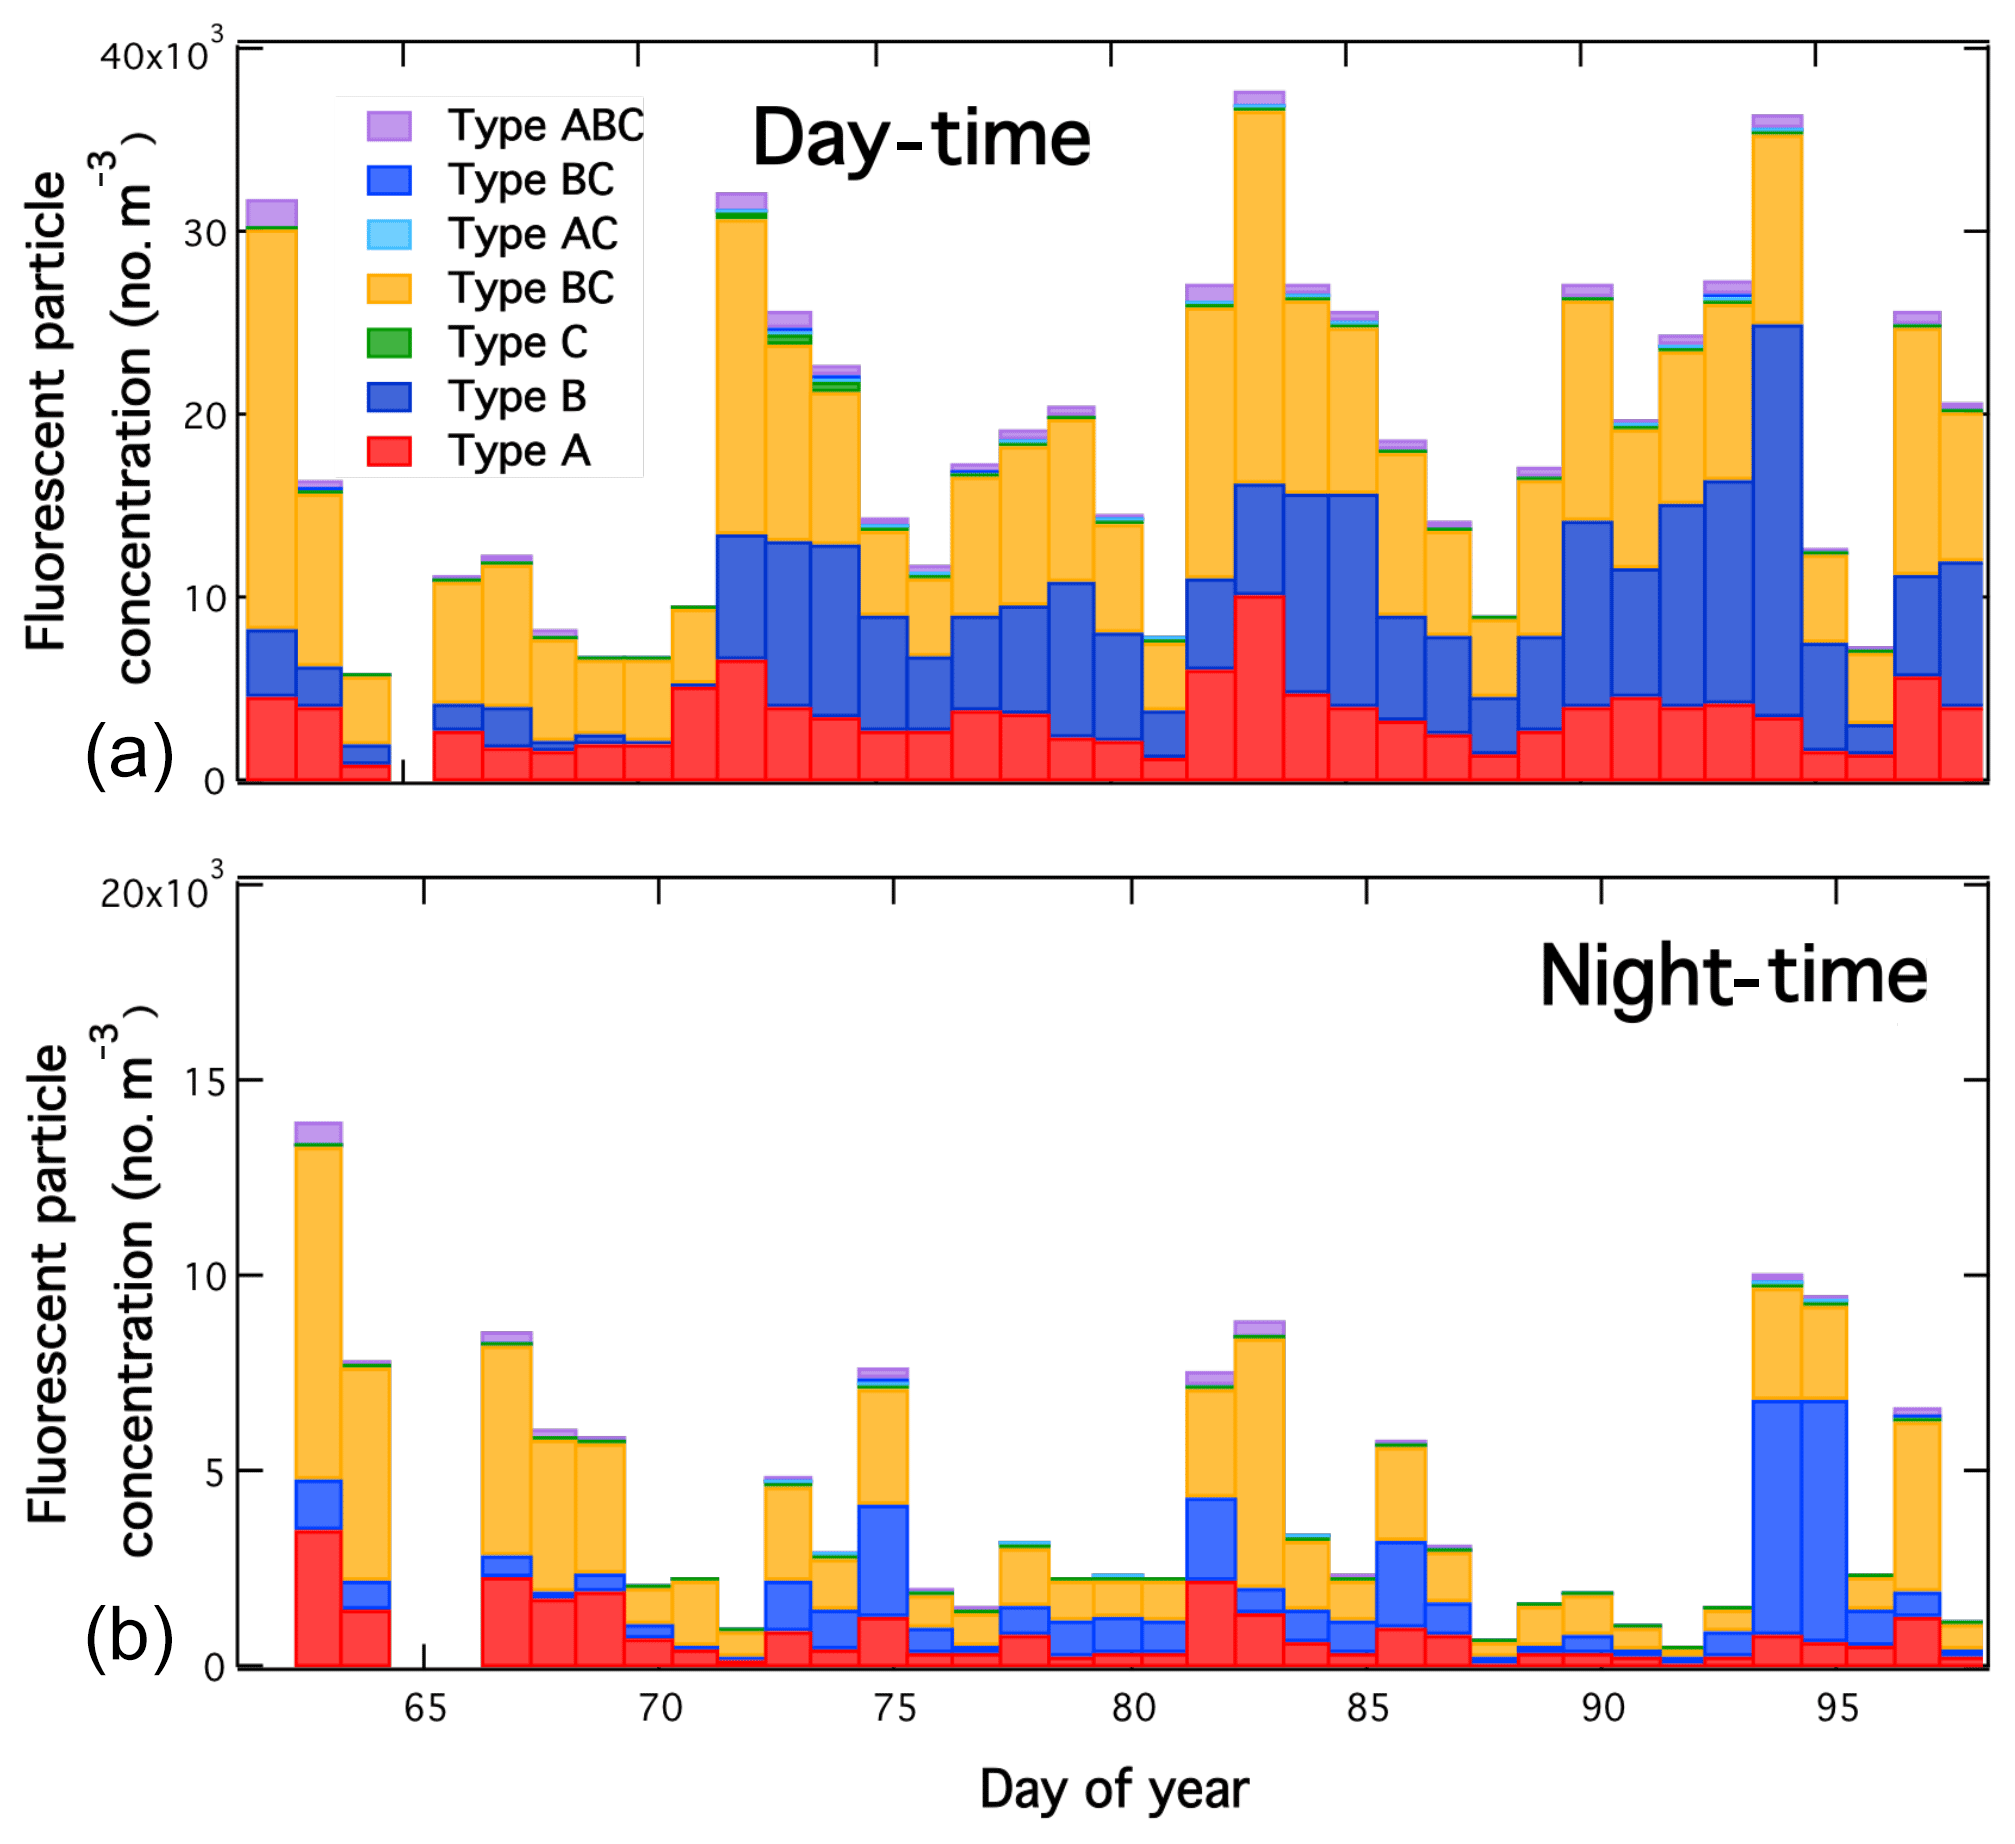
Figure 15Day-time (a) and night-time (b) fluorescent particle concentrations observed at the Maïdo Observatory.
4.5.3 Biological loading in cloud-free and cloudy conditions
Figure 15 shows supermicron fluorescent aerosol loadings observed by the WIBS during day-time (07:00–14:00 UTC) and night-time (20:00 to 04:00 UTC) for the duration of the project colour coded by the fluorescent particle type. Day-time concentrations are generally higher than night-time concentrations although even the highest day-time concentrations observed are low to moderate in comparison to those reported for various continental locations (Schumacher et al., 2013; Perring et al., 2015). Both the fluorescent particle type distribution (dominated by types A and AB) and observed number distributions (not shown but peaking between 2 and 5 µm for types A, AB and ABC) are similar to what is observed for laboratory sampling of fungal spores. The contribution from type B particles is sometimes substantial and likely reflects a local biomass burning influence, a hypothesis also supported by the type B number distribution which shows the number distribution increasing down to 0.5 µm (the lower limit of detection of the WIBS) implying a peak below this size, likely coincident with the accumulation mode. Fluorescent aerosol concentrations were lowest early in the campaign during a strong tropical storm (named “Haliba”, which was ≈60 km south-west of La Réunion on the night of 9–10 March, days 68 and 69 in Figs. 17 and 18) when wet deposition would be expected to depress aerosol concentrations including PBAP though they recovered quickly following the storm. After the storm, PBAP concentrations vary episodically.

Figure 16Relative humidity (dark blue dots for night-time and light blue dots for day-time) and supermicron fluorescent fraction observed throughout the study period (green dots for night-time and orange dots for day-time) at the Maïdo Observatory.
The fraction of total supermicron aerosol that was identified as fluorescent during day-time and night-time periods is shown in Fig. 16 along with average day-time and night-time relative humidity. The fluorescent fraction was often higher at night than during the day and was not obviously related to variations in humidity. The highest fluorescent fractions were observed during the tropical storm Haliba (although the particle concentrations were very low), possibly indicating a small local source that persisted through the storm which would elevate the fluorescent fraction substantially due to the efficient removal of the vast majority of particles transported to the site. The low fluorescent fraction following Haliba is hypothesized to result from a sudden increase in non-biological anthropogenic aerosols following the storm, after which people on the island were finally able to drive after several days of significant road closures. After this initial post-storm depression, fluorescent fractions varied from 5 % to 30 %, similar to fractions that have been observed previously in continental locations.
The liquid water content (LWC) of the collected clouds were low (mean value = 0.11 g m3) and the period of cloud occurrence was most of the time less than 2 h; for these reasons the collected liquid volumes were rather low (<15 mL) and did not allow a full chemical characterization. However, the concentration of mono- and di-carboxylic acids, formaldehyde, H2O2, iron and the main inorganic ions were quantified systematically. The mean dissolved organic carbon value was 5.7 mg C L−1, which is close to value observed in mid-latitude sites such as the Puy de Dôme station (5.5 mg C L−1 in average; Deguillaume et al., 2014). The main organic acid was formic acid, followed by acetic, oxalic and succinic acids. The inorganic ions were largely dominated by Cl− and Na+, with a ratio of 1.3, typical for areas under marine influence. The seawater Cl∕Na ratio is 1.5. Compared to this ratio, the marine aerosol has experienced some modification during emission to the atmosphere and activation to cloud droplets, with a substantial chloride depletion. This process was already observed in primary marine aerosol (Schwier et al., 2017), indicating that further chloride depletion is likely not occurring after the aerosol has activated to cloud droplets.
For the microbial analysis, the energetic states of the cloud microflora given by the ADP ∕ ATP ratio were not significantly higher than those evaluated for cloud samples collected at a mid-latitude site (Puy de Dôme) (Vaïtilingom et al., 2012). The tropical location presents warmer temperatures (mean = 23 ∘C) in comparison to the Puy de Dôme (mean = 4 ∘C) but the microbial survival in clouds does not seem to be correlated with the temperature. The mean microbial cell content was 3.8×10⁴ cells mL−1, which is lower but of the same order of magnitude as values from the Puy de Dôme site (5.4×10⁴ cells mL−1).
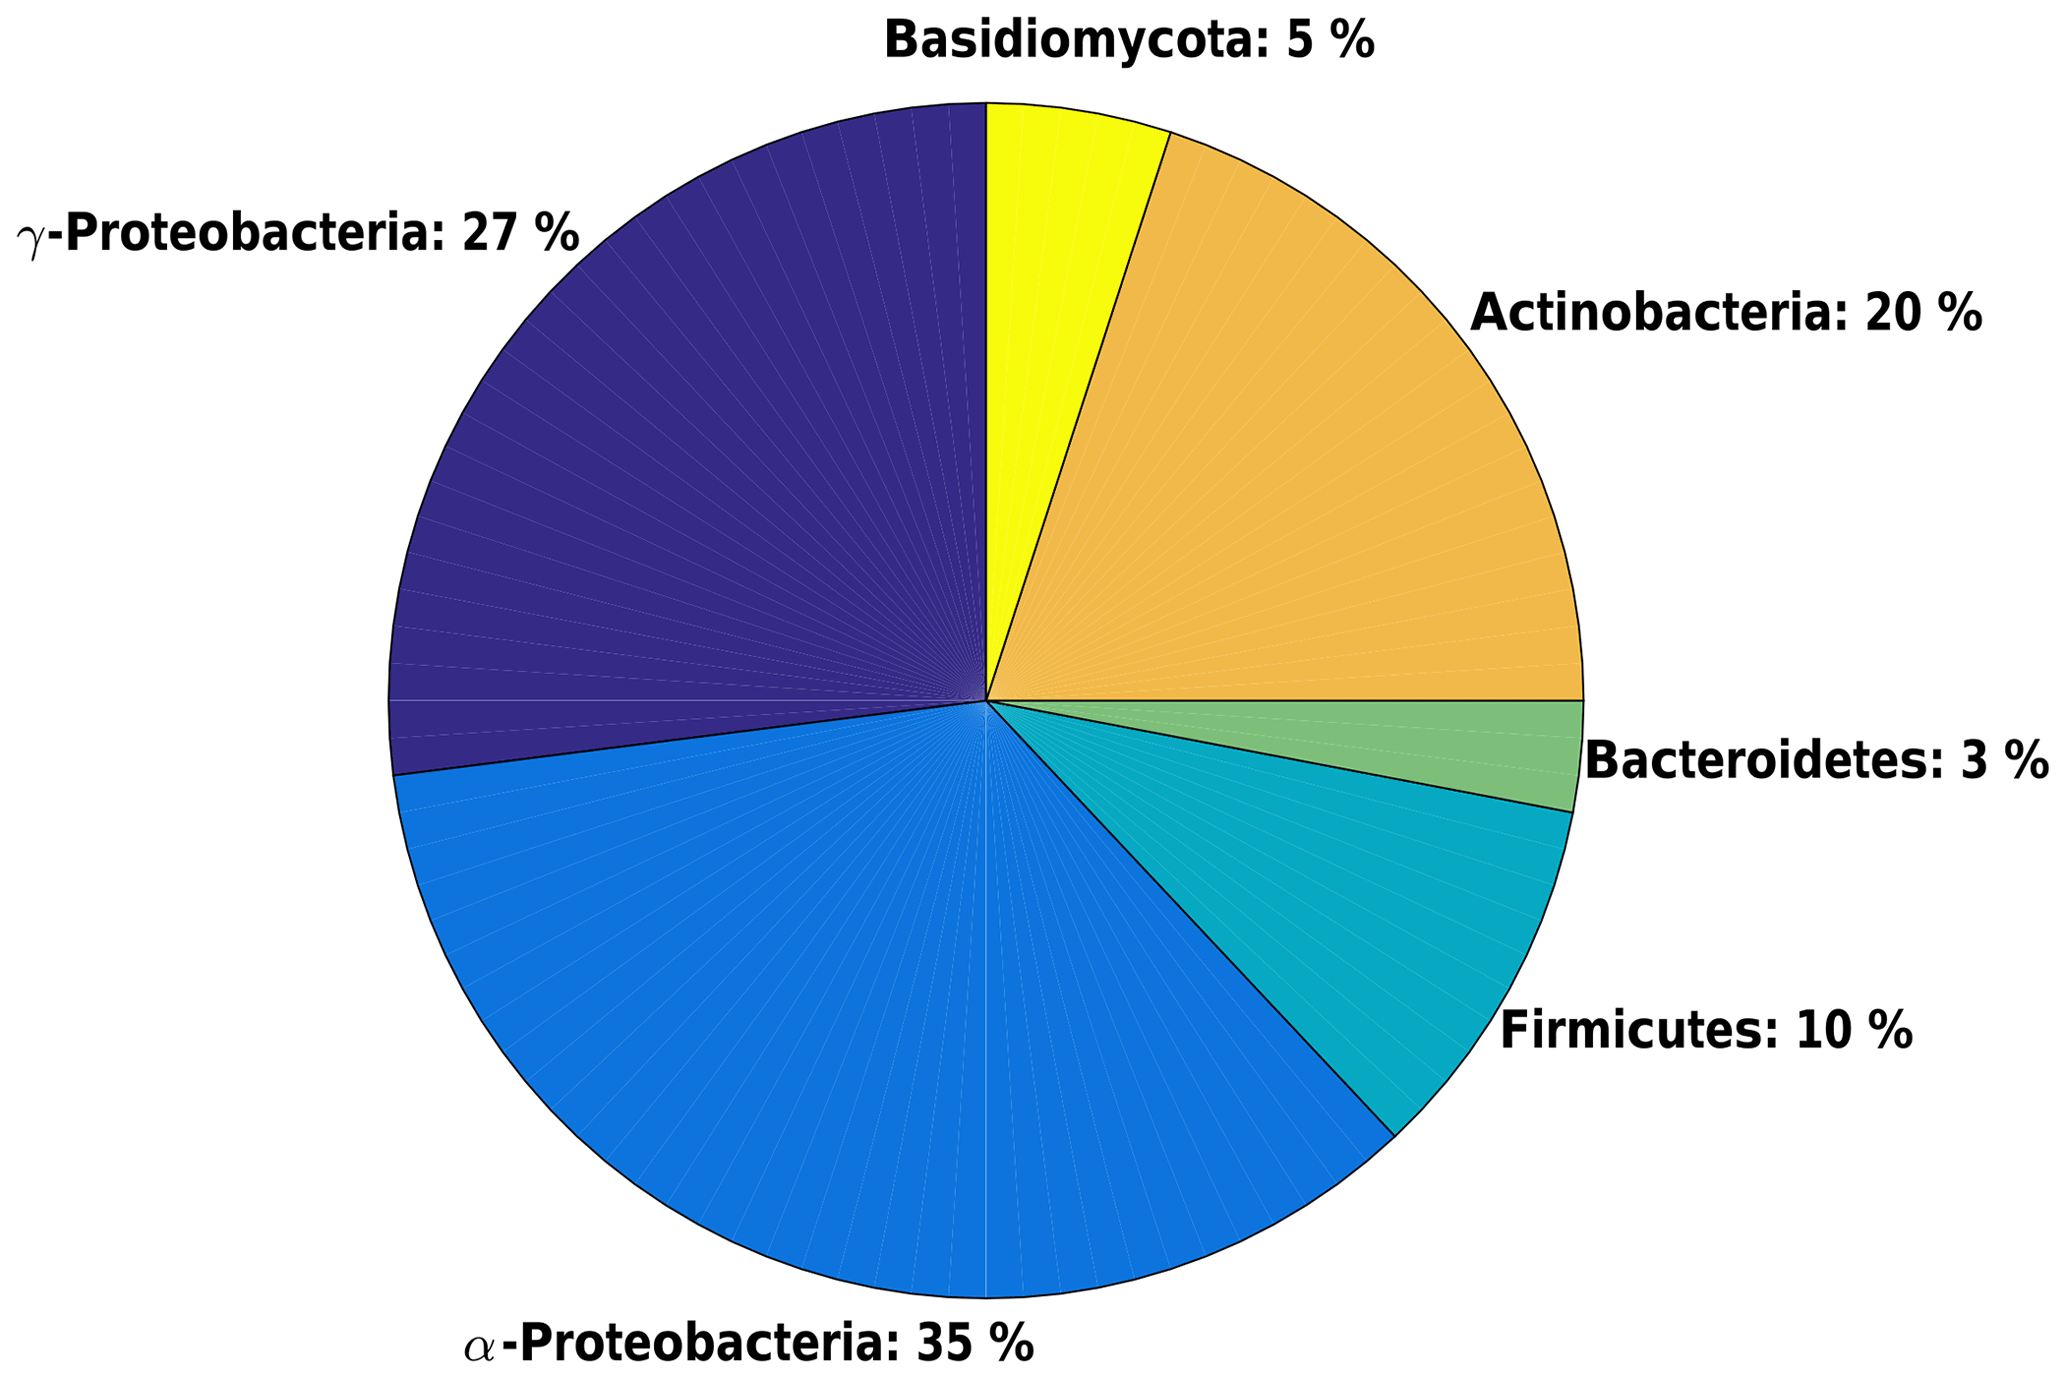
A total of 54 pure microbial strains have been isolated and identified (Fig. 17); the main phylla found in La Réunion samples are Actinobacteria (36 %), Alpha- (20 %) and Gammaproteobacteria (17 %), and Firmicutes (18 %). Microbial strains that form these phylla are mainly associated with phyllosphere, soil and marine media. The main primary sources surrounding the Maïdo site are therefore of marine origin via the Indian Ocean and of biogenic origin through the dense forest cover. Bacteria from Firmicutes and Actinobacteria are twice as frequent in La Réunion samples than at the Puy de Dôme (Vaïtilingom et al., 2012). This indicates an important role of microorganisms originating from the soil in the collected samples. It is also important to note a high presence of phytopathogenic bacteria in these samples (full identification in progress).
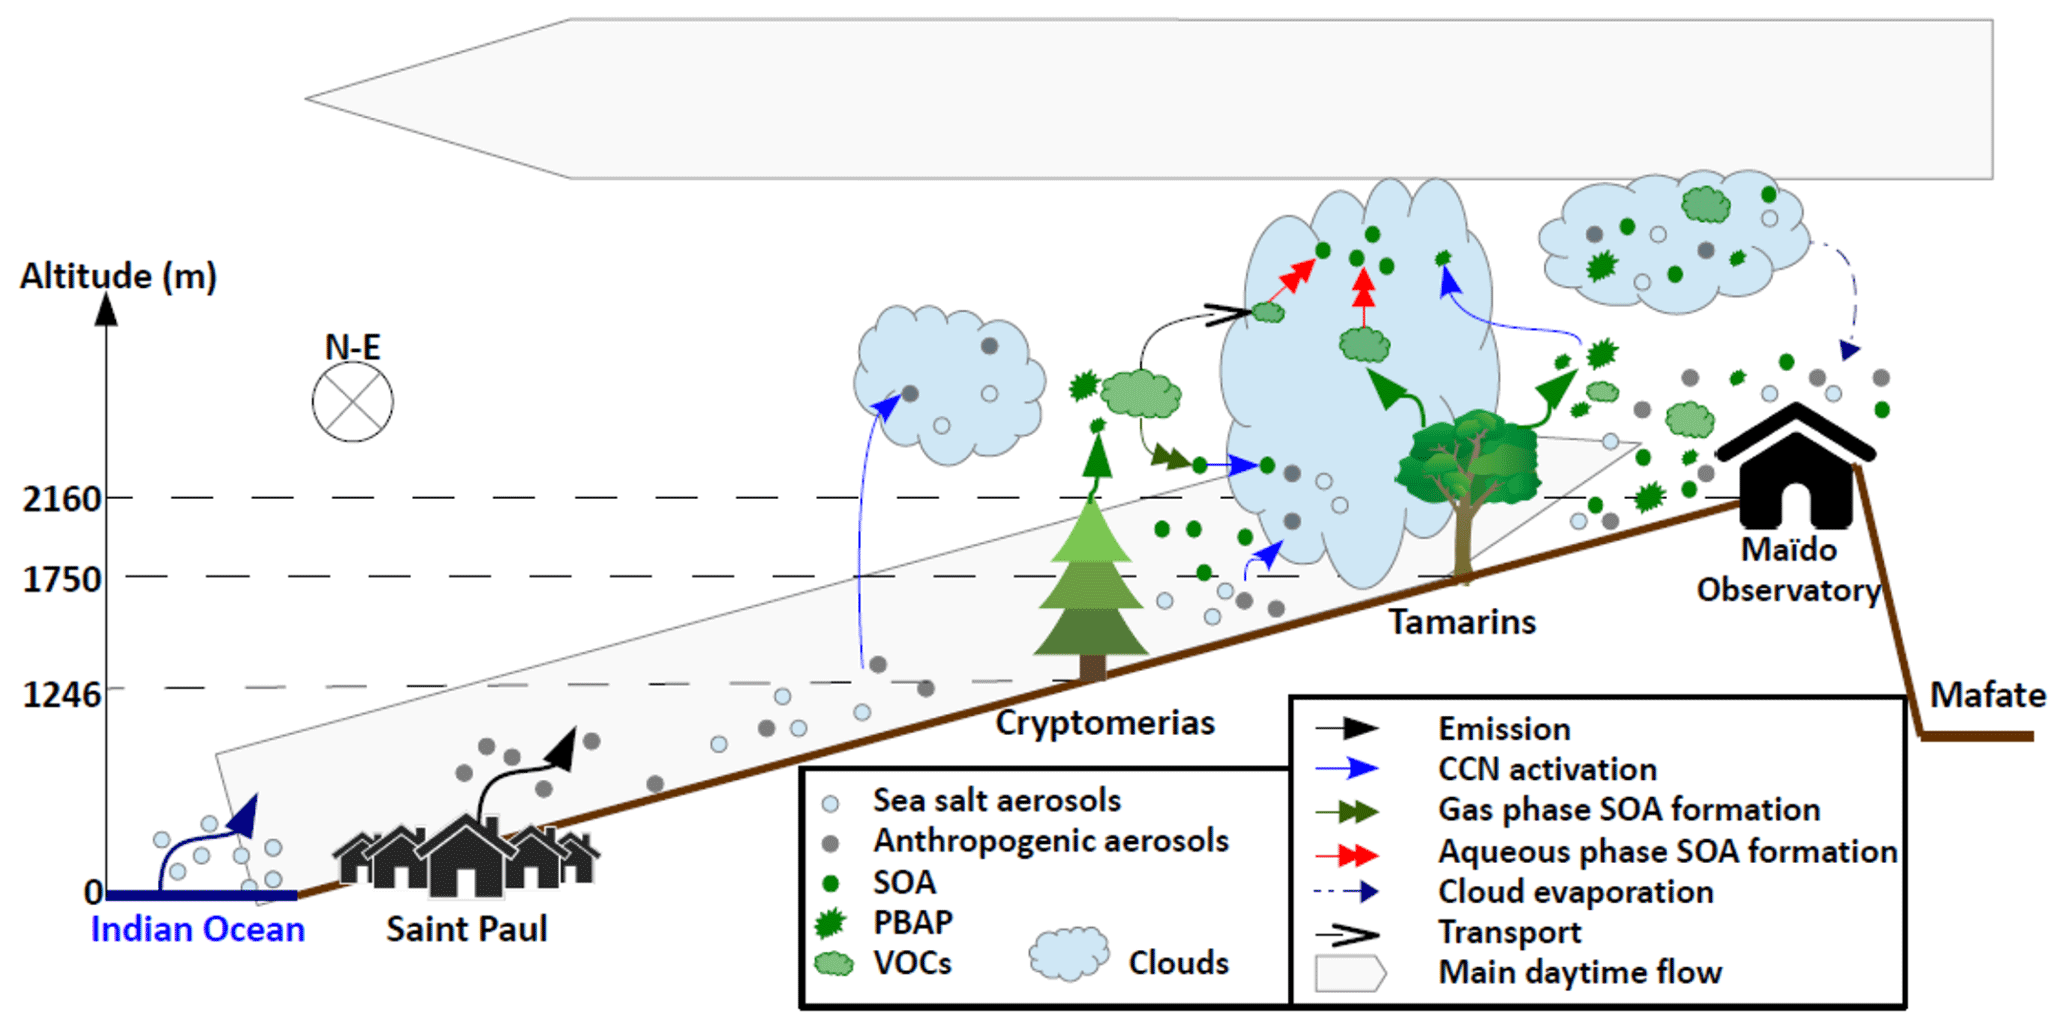
Figure 18Compendious overview of the main processes occurring along the Maïdo mountain slope that are related to the Réunion FARCE campaign.
The FARCE campaign was designed to explore the forest–gas–aerosol–cloud system in the tropical island of La Réunion. It lasted from 6 March to 26 April 2015 and mainly focused on the area between the coast and the Maïdo Observatory. Figure 18 gives a compendious overview of the main processes occurring along the Maïdo mountain slope that are related to the FARCE campaign. The goal was to improve our knowledge on the forest structure and LAI, concentrations of VOCs and precursors emitted by forests, aerosol loading and optical properties in the planetary boundary layer, formation of new particles by the nucleation of gas-phase precursors, ice-nucleating particles concentration, and biological loading in both cloud-free and cloudy conditions. This campaign required a significant human and scientific investment and a major effort for the coordination of a multidisciplinary international team. These new results have been made possible by sustained efforts of cross-disciplinary collaborations between biologists, chemists and meteorologists, developing shared scientific language, methods and objectives over several years.
A total of 56 different plant species were identified within the forest plots with various species richness, together with highly different structures. LAI* values were estimated through four methods, which exhibit roughly similar estimates.
Isoprene concentrations were measured at all sites. Lowest concentrations of isoprene were found in the volcanic area with a very low vegetation density ( pptv), and the maxima of isoprene concentration were found within the forest plots (200±68 pptv in the Mare-Longue 150 m plot). Variation of the isoprene concentration was found to be well correlated to the variations of temperature and PAR. We observed a large diurnal variation of HCHO concentration at the Maïdo Observatory, which can be explained, during day-time, by the influence of boundary layer compounds associated with higher solar radiation and higher surface air temperatures, and, during night-time, with the free tropospheric unperturbed marine environment.
Vertical distribution and optical properties of boundary layer aerosols were retrieved using a lidar in synergy with a handheld sun photometer along the Maïdo mountain slope. Measurements show that, between the shore and the Maïdo Observatory, the aerosol optical depth, the aerosol layer thickness and the aerosol average size decrease, while their absorption efficiency increases, indicating that the sea salt loading decreases as the lidar travels uphill toward the free troposphere.
The formation of new particles by nucleation of gas-phase precursors was observed almost every day of the FARCE campaign at the Maïdo Observatory. A typical measurement day shows that the aerosol concentration increases at the lowest size range from 03:00 UTC, increases progressively at higher diameters during the following hours and abruptly increases at around 06:00 UTC, showing that the boundary layer reaches the site. By late afternoon, the air mass is changing to a free tropospheric particle-poor regime. The contribution of BVOCs to the formation and growth of new particles is an open question at this stage. The contribution of BVOCs to nucleation will be investigated by the comparison of the time evolution of nanoscale particle concentration with the time evolution of the BVOC concentrations. The contribution of BVOC to the growth of newly formed particles to larger sizes will be investigated by the comparison of the evolution of the condensational sink with the time evolution of the BVOC concentration (as performed in Sellegri et al., 2005). In order to exclude the contribution of any anthropogenic species to the formation and growth of new particles, this will be explored using anthropogenic gas-phase tracers and black carbon.
INP concentrations and size were measured at the Maïdo Observatory, showing remarkably low average concentration values and higher average fraction of INPs >1 µm compared to previous measurements in North America and Europe.
Supermicron PBAP loadings and a fraction of total supermicron PBAPs were measured at the Maïdo Observatory. Loading measurements exhibit low to moderate concentrations in comparison to those reported for various continental locations, with higher concentrations during day-time than during night-time. Both the fluorescent particle type distribution and observed number distributions are similar to what is observed for laboratory sampling of fungal spores, with substantial local biomass burning influence. Fluorescent aerosol concentrations were lowest and fluorescent fractions were highest when a strong tropical storm was close to La Réunion and, after the storm, fluorescent aerosol concentrations varied episodically, a finding which will be further explored in a future work. More in-depth analysis of supermicron PBAP loadings and a fraction of total supermicron PBAP data will be presented in a forthcoming paper. Local and regional bio-aerosol sources will be examined using both observed meteorological parameters at the site and back trajectories. Both diurnal and multi-day episodic cycles in bio-aerosol loadings observed at Maïdo will be investigated as well as correlations between observed bio-aerosol and other parameters of interest such as formaldehyde, temperature and RH. To address questions regarding bio-aerosol in the more regional remote marine free troposphere, fluorescent particle concentrations will be assessed during periods of night-time subsidence of free tropospheric air at the observatory and will be identified manually based on observed abrupt changes in temperature, RH and ozone based on the supposition that FT-influenced air will be warmer, drier and have higher ozone than more locally influenced air. Fluorescent particle concentration data will be considered in conjunction with size-resolved observations of INP concentrations and genetic and component analysis of filter samples to identify key linkages between biological materials, observed fluorescent loadings and their potential impacts on cloud properties.
Clouds were collected at various locations during the FARCE campaign for chemical and microbial characterization. Mean dissolved organic carbon value is close to values observed in mid-latitude sites, and the inorganic ion concentrations are typical for areas under marine influence. A total of 54 pure microbial strains have been isolated and identified and are mainly associated with phyllosphere, soil and marine media, confirming that the main primary sources surrounding the Maïdo Observatory are of marine origin via the Indian Ocean and of biogenic origin through the dense forest cover. The description of the microbial content from these samples will be published in a forthcoming article and will be the first report on the bio-physico-chemistry of tropical clouds.
Preliminary numerical simulations confirm the main dynamics prevailing over the whole island and over the Maïdo mountain slope. Simulated isoprene surface concentrations, wind direction, air temperature and clouds agree well with observations on the Maïdo slope. Simulations show the existence of a horizontal wind shear front located close to the Maïdo Observatory, the location of which drives the origin of the air masses that are sampled at the observatory and the vanishing of clouds. They also support the hypothesis of a potential cause of SOA formation in the aqueous phase at the Maïdo Observatory.
To sum up, these results corroborate the following conclusions:
-
The Maïdo Observatory lies within the PBL from late morning to late evening.
-
When in the PBL, the main primary sources impacting the Maïdo Observatory are of marine origin via the Indian Ocean and of biogenic origin through the dense forest cover.
New conclusions can be inferred from these results:
-
The marine source prevails less and less while reaching the observatory.
-
When in the PBL, depending on the localization of a horizontal wind shear front with respect to the Maïdo Observatory, the observatory can be affected by air masses coming directly from the ocean and passing over the Maïdo mountain slope, or coming from inland.
-
Bio-aerosols can be observed in both dry air and clouds at the Maïdo Observatory.
-
BVOC emissions by the forest covering the Maïdo mountain slope can be transported upslope within clouds and are a potential cause of SOA formation in aqueous phase at the Maïdo Observatory.
-
The simulation of dynamics parameters, emitted BVOCs and cloud life cycle in the Meso-NH model is realistic, and more advanced Meso-NH simulations should use an increased horizontal resolution (100 m) to better take into account the orography and improve the simulation of the wind shear front zone within which lies the Maïdo Observatory.
This article intends to promote the Maïdo Observatory's scientific specificities and potentialities for studies dealing with PBL processes occurring in a tropical insular environment. It draws up an inventory of the in situ studies that could be performed in this recent atmospheric observatory using various observations and simulations to better characterize the site. It also aims to develop scientific collaborations and to support ongoing and future scientific projects. As a matter of fact, these results largely contributed to the setting up of the ongoing OCTAVE 2017–2019 (Oxygenated Compounds in the Tropical Atmosphere: Variability and Exchanges) and the starting Biomaïdo 2019–2021 projects. The OCTAVE project aims at studying sources and seasonal cycles of VOCs and halogens from forests and the Indian Ocean as well as quantifying the contribution of marine/biogenic sources to submicron organic aerosols at the Maïdo Observatory. The OCTAVE-related campaign took place in La Réunion in February–April 2018. The Biomaïdo project focuses on the contribution of the aqueous reactivity to the SOA budget and the related campaign took place in March–April 2019. The FARCE campaign provides a unique set of multi-disciplinary data and results that can be used as a reference basis to better understand the forest–gas–aerosol–cloud system in an insular tropical environment. These results will help to reduce uncertainties in the understanding and the modelling of the formation and transformation of atmospheric aerosols. This is needed to properly quantify the impacts of these particles on air quality, health and climate change.
The data used for this study are available under open-access by request to scientists mentioned hereafter: forest plots characterization (olivier.flores@cirad.fr); BVOCs, NOx, HCHO and ozone concentrations (a.colomb@opgc.univ-bpclermont.fr); lidar measurements (valentin.duflot@univ-reunion.fr); aerosol size distribution (k.sellegri@opgc.univ-bpclermont.fr); cloud-free size-resolved ice nucleus concentrations (alex.huffman@du.edu); cloud-free fluorescent particle counts (anne.perring@noaa.gov); biological composition of clouds (l.deguillaume@opgc.univ-bpclermont.fr); and Meso-NH simulations (pierre.tulet@univ-reunion.fr).
All authors contributed significantly to this paper. VD wrote the manuscript draft with contributions from PT, OF, CB, AC, LD, MV, AP, AH, KS and MR. All authors analysed the data. PT, OF, CB, AC, LD, MV, AP, AH, MTH, ER, OG, FB, TB, JF, PS, JMM, MC, CR, EB and VD performed the experiments. All authors revised the manuscript draft and provided valuable suggestions for the revision.
The authors declare that they have no conflict of interest.
The authors acknowledge the European Communities, the Région Réunion, CNRS and Université de la Réunion for their support and contributions in the construction phase of the research infrastructure OPAR (Observatoire de Physique de l'Atmosphère de La Réunion). OPAR is presently funded by CNRS (INSU) and Université de La Réunion and managed by OSU-R (Observatoire des Sciences de l'Univers de La Réunion, UMS 3365). The Service National d'Observation (SNO) CLimate relevant Aerosol Properties from near surface observations (CLAP) and the ACTRIS-2 EU project are also acknowledged. Henri Legros receives our gratitude for the provision of an observation site.
This research has been supported by the CNRS (INSU), by the Université de la Réunion through the federation Observatoire des Milieux Naturels et des Changements Globaux (OMNCG) of the OSU-R, and by the French national programme LEFE/INSU in the frame of the project entitled “Biophysicochimie des nuages tropicaux de l'Ile de la Réunion”.
This paper was edited by Eliza Harris and reviewed by two anonymous referees.
Ah-Peng C., Williamson Cardoso, A., Flores, O., West, A., Wilding, N., Strasberg, D., and Hedderson, T. A. J.: The role of epiphytic bryophytes in interception, storage, and theregulated release of atmospheric moisture in a tropical montane cloudforest, J. Hydrol., 548, 665–673, 2017.
Albrecht, B. A.: Aerosols, cloud microphysics and fractional cloudiness, Science, 245, 1227–1230, 1989.
Ångström, A.: The parameters of atmospheric turbidity, Tellus, 16, 64–75, https://doi.org/10.1111/j.2153-3490.1964.tb00144.x, 1964.
Atkinson, R. and Arey, J.: Gas-phase tropospheric chemistry of biogenic volatile organic compounds: a review, Atmos. Environ., 37, 197–219, 2003.
Baray, J.-L., Courcoux, Y., Keckhut, P., Portafaix, T., Tulet, P., Cammas, J.-P., Hauchecorne, A., Godin Beekmann, S., De Mazière, M., Hermans, C., Desmet, F., Sellegri, K., Colomb, A., Ramonet, M., Sciare, J., Vuillemin, C., Hoareau, C., Dionisi, D., Duflot, V., Vérèmes, H., Porteneuve, J., Gabarrot, F., Gaudo, T., Metzger, J.-M., Payen, G., Leclair de Bellevue, J., Barthe, C., Posny, F., Ricaud, P., Abchiche, A., and Delmas, R.: Maïdo observatory: a new high-altitude station facility at Reunion Island (21∘ S, 55∘ E) for long-term atmospheric remote sensing and in situ measurements, Atmos. Meas. Tech., 6, 2865–2877, https://doi.org/10.5194/amt-6-2865-2013, 2013.
Boucher, O., Randall, D., Artaxo, P., Bretherton, C., Feingold, G., Forster, P., Kerminen, V.-M., Kondo, Y., Liao, H., Lohmann, U., Rasch, P., Satheesh, S. K., Sherwood, S., Stevens, B., and Zhang, X. Y.: Clouds and Aerosols, in: Climate Change 2013: The Physical Science Basis, Contribution of Working Group I to the Fifth Assessment Report of the Intergovernmental Panel on Climate Change, edited by: Stocker, T. F., Qin, D., Plattner, G.-K., Tignor, M., Allen, S. K., Boschung, J., Nauels, A., Xia, Y., Bex, V., and Midgley, P. M., Cambridge Universtiy Press, 571–657, 2013.
Brasseur, G. P., Kiehl, J. T., Müller, J.-F., Schneider, T., Cgranier, C., Tie, X., and Hauglustaine, D.: Past and future changes in global tropospheric ozone: Impact on radiative forcing, Geophys. Res. Lett., 25, 3807–3810, 1998.
Brégonzio-Rozier, L., Siekmann, F., Giorio, C., Pangui, E., Morales, S. B., Temime-Roussel, B., Gratien, A., Michoud, V., Ravier, S., Cazaunau, M., Tapparo, A., Monod, A., and Doussin, J.-F.: Gaseous products and secondary organic aerosol formation during long term oxidation of isoprene and methacrolein, Atmos. Chem. Phys., 15, 2953–2968, https://doi.org/10.5194/acp-15-2953-2015, 2015.
Burrows, S. M., Hoose, C., Pöschl, U., and Lawrence, M. G.: Ice nuclei in marine air: biogenic particles or dust?, Atmos. Chem. Phys., 13, 245–267, https://doi.org/10.5194/acp-13-245-2013, 2013.
Carlier P., Hannachi H., and Mouvier G.: The chemistry of carbonyl compounds in the atmosphere – A review, Atmos. Environ., 20, 2079–2099, 1986.
Carlton, A. G., Turpin, B. J., Altieri, K. E., Seitzinger, S., Reff, A., Lim, H.-J., and Ervens, B.: Atmospheric oxalic acid and SOA production from glyoxal: Results of aqueous photooxidation experiments, Atmos. Environ., 41, 7588–7602, 2007.
Carlton, A. G., Wiedinmyer, C., and Kroll, J. H.: A review of Secondary Organic Aerosol (SOA) formation from isoprene, Atmos. Chem. Phys., 9, 4987–5005, https://doi.org/10.5194/acp-9-4987-2009, 2009.
Cattrall, C., J. Reagan, K. Thome, and O. Dubovik: Variability of aerosol and spectral lidar and backscatter and extinction ratios of key aerosol types derived from selected Aerosol Robotic Network locations, J. Geophys. Res., 110, D10S11, https://doi.org/10.1029/2004JD005124, 2005.
Chen, J., Griffin, R. J., Grini, A., and Tulet, P.: Modeling secondary organic aerosol formation through cloud processing of organic compounds, Atmos. Chem. Phys., 7, 5343–5355, https://doi.org/10.5194/acp-7-5343-2007, 2007.
Cournac, L., Dubois, M. A., Chave, J., and Riera, B.: Fast Determination of Light Availability and Leaf Area Index in Tropical Forests, J. Trop. Ecol., 18, 295–302, 2002.
Couvidat, F., Kim, Y., Sartelet, K., Seigneur, C., Marchand, N., and Sciare, J.: Modeling secondary organic aerosol in an urban area: application to Paris, France, Atmos. Chem. Phys., 13, 983–996, https://doi.org/10.5194/acp-13-983-2013, 2013.
Curci, G., Beekman, M., Vautard, R., Smiatek, G., and Steinbrecher, R.: Modelling study of the impact of isoprene and terpene biogenic emissions on European ozone levels, Atmos. Environ., 43, 1444–1455, 2009.
Deardorff, J. W.: Stratocumulus-capped mixed layers derived from a three-dimensional model, Bound.-Lay. Meteorol., 18, 495–527, 1980.
Deguillaume, L., Leriche, M., Amato, P., Ariya, P. A., Delort, A.- M., Pöschl, U., Chaumerliac, N., Bauer, H., Flossmann, A. I., and Morris, C. E.: Microbiology and atmospheric processes: chemical interactions of primary biological aerosols, Biogeosciences, 5, 1073–1084, https://doi.org/10.5194/bg-5-1073-2008, 2008.
Deguillaume, L., Charbouillot, T., Joly, M., Vaïtilingom, M., Parazols, M., Marinoni, A., Amato, P., Delort, A.M., Vinatier, V., Flossmann, A., Chaumerliac, N., Pichon, J. M., Houdier, S., Laj, P., Sellegri, K., Colomb, A., Brigante, M., and Mailhot, G.: Classification of clouds sampled at the puy de Dôme (France) based on 10 yr of monitoring of their physicochemical properties, Atmos. Chem. Phys., 14, 1485–1506, https://doi.org/10.5194/acp-14-1485-2014, 2014.
Després, V. R., Huffman, J. A., Burrows, S. M., Hosse, C., Safatov, A. S., Buryak, G., Fröhlich-Nowoisky, J., Elbert, W., Andreae, M. O., Pöschl, U., and Jaenicke, R.: Primary biological aerosol particles in the atmosphere: A review, Tellus B, 64, 15598, https://doi.org/10.3402/tellusb.v64i0.15598, 2012.
Diehl, K., Quick, C., Matthias-Maser, S., Mitra, S. K., and Jaenicke, R.: The ice nucleating ability of pollen – Part I: Laboratory studies in deposition and condensation freezing modes, Atmos. Res., 58, 75–87, 2001.
Diehl, K., Matthias-Maser, S., Jaenicke, R., and Mitra, S. K.: The ice nucleating ability of pollen: Part II. Laboratory studies in immersion and contact freezing modes, Atmos. Res., 61, 125–133, 2002.
Duflot, V., Royer, P., Chazette, P., Baray, J.-L., Courcoux, Y., and Delmas, R.: Marine and biomass burning aerosols in the southern Indian Ocean: Retrieval of aerosol optical properties from shipborne lidar and Sun photometer measurements, J. Geophys. Res., 116, D18208, https://doi.org/10.1029/2011JD015839, 2011.
Durand, J., Tulet, P., Leriche, M., Bielli, S., Villeneuve, N., Di Muro, A., and Fillipi, J.-B.: Modeling the lava heat flux during severe effusive volcanic eruption an important impact on surface air quality, J. Geophys. Res.-Atmos., 119, 11729–11742, https://doi.org/10.1002/2014JD022034, 2014.
Ervens, B., Turpin, B. J., and Weber, R. J.: Secondary organic aerosol formation in cloud droplets and aqueous particles (aqSOA): a review of laboratory, field and model studies, Atmos. Chem. Phys., 11, 11069–11102, https://doi.org/10.5194/acp-11-11069-2011, 2011.
Foucart, B., Sellegri, K., Tulet, P., Rose, C., Metzger, J.-M., and Picard, D.: High occurrence of new particle formation events at the Maïdo high-altitude observatory (2150 m), Réunion (Indian Ocean), Atmos. Chem. Phys., 18, 9243–9261, https://doi.org/10.5194/acp-18-9243-2018, 2018.
Fried, A., McKeen, S., Sewell, S., Harder, J., Henry, B., Goldan, P., Kuster, W., Williams, E., Baumann, K., Shetter, R., and Cantrell, C.: Photochemistry of formaldehyde during the 1993 Tropospheric OH Photochemistry Experiment, J. Geophys. Res.-Atmos., 102, 6283–6296, 1997.
Fröhlich-Nowoisky J., Kampf, C. J., Weber, B., Huffman, J. A., Pöhlker, C., Andreae, M. O., Lang-Yona, N., Burrows, S. M., Gunthe, S. S., Elbert, W., Su, H., Hoor, P., Thines, E., Hoffmann, T., Després, V. R., and Pöschl, U.: Bioaerosols in the Earth system: Climate, health, and ecosystem interactions, Atmos. Res., 182, 346–376, 2016.
Fuzzi, S., Andreae, M. O., Huebert, B. J., Kulmala, M., Bond, T. C., Boy, M., Doherty, S. J., Guenther, A., Kanakidou, M., Kawamura, K., Kerminen, V.-M., Lohmann, U., Russell, L. M., and Pöschl, U.: Critical assessment of the current state of scientific knowledge, terminology, and research needs concerning the role of organic aerosols in the atmosphere, climate, and global change, Atmos. Chem. Phys., 6, 2017–2038, https://doi.org/10.5194/acp-6-2017-2006, 2006.
Gabey, A. M., Gallagher, M. W., Whitehead, J., Dorsey, J. R., Kaye, P. H., and Stanley, W. R.: Measurements and comparison of primary biological aerosol above and below a tropical forest canopy using a dual channel fluorescence spectrometer, Atmos. Chem. Phys., 10, 4453–4466, https://doi.org/10.5194/acp-10-4453-2010, 2010.
Ganzeveld, L., Eerdekens, G., Feig, G., Fischer, H., Harder, H., Königstedt, R., Kubistin, D., Martinez, M., Meixner, F. X., Scheeren, H. A., Sinha, V., Taraborrelli, D., Williams, J., Vilà-Guerau de Arellano, J., and Lelieveld, J.: Surface and boundary layer exchanges of volatile organic compounds, nitrogen oxides and ozone during the GABRIEL campaign, Atmos. Chem. Phys., 8, 6223–6243, https://doi.org/10.5194/acp-8-6223-2008, 2008.
Gauss, M., Myhre, G., Isaksen, I. S. A., Grewe, V., Pitari, G., Wild, O., Collins, W. J., Dentener, F. J., Ellingsen, K., Gohar, L. K., Hauglustaine, D. A., Iachetti, D., Lamarque, F., Mancini, E., Mickley, L. J., Prather, M. J., Pyle, J. A., Sanderson, M. G., Shine, K. P., Stevenson, D. S., Sudo, K., Szopa, S., and Zeng, G.: Radiative forcing since preindustrial times due to ozone change in the troposphere and the lower stratosphere, Atmos. Chem. Phys., 6, 575–599, https://doi.org/10.5194/acp-6-575-2006, 2006.
Gettelman, A.: Putting the clouds back in aerosol–cloud interactions, Atmos. Chem. Phys., 15, 12397–12411, https://doi.org/10.5194/acp-15-12397-2015, 2015.
Granier, C., Pétron, G., Müller, J.-F., and Brasseur, G.: The impact of natural and anthropogenic hydrocarbons on the tropospheric budget of carbon monoxide, Atmos. Environ., 34, 5255–5270, 2000.
Gregory D., Morcrette,J.-J., Jakob, C., Beljaars, A. C. M., and Stockdale, T.: Revision of convection, radiation and cloud schemes in the ECMWF Integrated Forecasting System, Q. J. R. Meteor. Soc., 1685–1710, 2000.
Guenther, A. B., Hewitt, C. N., Erickson, D., Fall, R., Geron, C., Graedel, T., Harley, P., Klinger, L., Lerdau, M., McKay, W. A., Pierce, T., Scholes, B., Steinbrecher, R., Tallamraju, R., Taylor, J., and Zimmerman, P.: A global model of natural volatile organic compound emissions, J. Geophys. Res.-Atmos., 100, 8873–8892, 1995.
Guenther, A. B., Jiang, X., Heald, C. L., Sakulyanontvittaya, T., Duhl, T., Emmons, L. K., and Wang, X.: The Model of Emissions of Gases and Aerosols from Nature version 2.1 (MEGAN2.1): an extended and updated framework for modeling biogenic emissions, Geosci. Model Dev., 5, 1471–1492, https://doi.org/10.5194/gmd-5-1471-2012, 2012.
Guilpart, E., Vimeux, F., Evan, S., Brioude, J., Metzger, J.-M., Barthe, C., Risi, C., and Cattani, O.: The isotopic composition of near-surface water vapor at the Maïdo observatory (Reunion Island, southwestern Indian Ocean) documents the controls of the humidity of the subtropical troposphere, J. Geophys. Res.-Atmos., 122, 9628–9650, https://doi.org/10.1002/2017JD026791, 2017.
Hallquist, M., Wenger, J. C., Baltensperger, U., Rudich, Y., Simpson, D., Claeys, M., Dommen, J., Donahue, N. M., George, C., Goldstein, A. H., Hamilton, J. F., Herrmann, H., Hoffmann, T., Iinuma, Y., Jang, M., Jenkin, M. E., Jimenez, J. L., Kiendler-Scharr, A., Maenhaut, W., McFiggans, G., Mentel, Th. F., Monod, A., Prévôt, A. S. H., Seinfeld, J. H., Surratt, J. D., Szmigielski, R., and Wildt, J.: The formation, properties and impact of secondary organic aerosol: current and emerging issues, Atmos. Chem. Phys., 9, 5155–5236, https://doi.org/10.5194/acp-9-5155-2009, 2009.
Hammes, F., Berney, M., Wang, Y., Vital, M., Köster, O., and Egli, T.: Flow-cytometric total bacterial cell counts as a descriptive microbiological parameter for drinking water treatment processes, Water Res., 42, 269–277, https://doi.org/10.1016/j.watres.2007.07.009, 2008.
Hamonou, E., Chazette, P., Balis, D., Dulac, F., Schneider, X., Galani, E., Ancellet, G., and Papayannis, A.: Characterization of the vertical structure of Saharan dust export to the Mediterranean basin, J. Geophys. Res., 104, 22257–22270, 1999.
Harborne, J. B.: Introduction to Ecological Biochemistry, Academic Press, London, 384 pp., 1988.
Hernandez, M., Perring, A. E., McCabe, K., Kok, G., Granger, G., and Baumgardner, D.: Chamber catalogues of optical and fluorescent signatures distinguish bioaerosol classes, Atmos. Meas. Tech., 9, 3283–3292, https://doi.org/10.5194/amt-9-3283-2016, 2016.
Herrmann, H., Schaefer, T., Tilgner, A., Styler, S. A., Weller, C., Teich, M., and Otto, T.: Tropospheric Aqueous-Phase Chemistry: Kinetics, Mechanisms, and Its Coupling to a Changing Gas Phase, Chem. Rev., 115, 4259–4334, 2015.
Holopainen, J. K.: Multiple functions of inducible plant volatiles, Trends in Plant, Science, 9, 529–533, 2004.
Houweling, S., Dentener, F., and Lelieveld, J.: The impact of nonmethane hydrocarbon compounds on tropospheric photochemistry, J. Geophys. Res., 103, 10673–10696, 1998.
Huffman, J. A., Prenni, A. J., DeMott, P. J., Pöhlker, C., Mason, R. H., Robinson, N. H., Fröhlich-Nowoisky, J., Tobo, Y., Després, V. R., Garcia, E., Gochis, D. J., Harris, E., Müller-Germann, I., Ruzene, C., Schmer, B., Sinha, B., Day, D. A., Andreae, M. O., Jimenez, J. L., Gallagher, M., Kreidenweis, S. M., Bertram, A. K., and Pöschl, U.: High concentrations of biological aerosol particles and ice nuclei during and after rain, Atmos. Chem. Phys., 13, 6151–6164, https://doi.org/10.5194/acp-13-6151-2013, 2013.
Hyvärinen, A.-P., Lihavainen, H., Viisanen, Y., and Kulmala, M.: Homogeneous nucleation rates of higher n-alcohols measured in a laminar flow diffusion chamber, J. Chem. Phys., 120, 11621, https://doi.org/10.1063/1.1751398, 2004.
Jaffrezo, J. L., Calas, N., and Bouchet, M.: Carboxylic acids measurements with ionic chromatography, Atmos. Environ., 32, 2705–2708, 1998.
Junkermann W. and Burger, J. M.: A new portable instrument for continuous measurement of formaldehyde in ambient air, J. Atmos. Ocean. Technol., 23, 38–45, 2006.
Kalberer, M., Paulsen, D., Sax, M., Steinbacher, M., Dommen, J.,5 Prevot, A. S. H., Fisseha, R., Weingartner, E., Frankevich, V.,Zenobi, R., and Baltensperger, U.: Identification of Polymers as Major Components of Atmospheric Organic Aerosols, Science, 303, 1659–1662, 2004.
Keita, S., Liousse, C., Yoboué, V., Dominutti, P., Guinot, B., Assamoi, E.-M., Borbon, A., Haslett, S. L., Bouvier, L., Colomb, A., Coe, H., Akpo, A., Adon, J., Bahino, J., Doumbia, M., Djossou, J., Galy-Lacaux, C., Gardrat, E., Gnamien, S., Léon, J. F., Ossohou, M., N'Datchoh, E. T., and Roblou, L.: Particle and VOC emission factor measurements for anthropogenic sources in West Africa, Atmos. Chem. Phys., 18, 7691–7708, https://doi.org/10.5194/acp-18-7691-2018, 2018.
Kesselmeier, J. and Staudt, M.: Biogenic volatile organic compounds (VOC): an overview on emission, physiology and ecology, J. Atmos. Chem., 33, 23–88, 1999.
Knobelspiesse, K., Pietras, C., and Fargion, G.: Sun-Pointing-Error Correction for Sea Deployment of the MICROTOPS II Handheld Sun Photometer, J. Atmos. Ocean. Technol., 20, 767–771, 2003.
Kruisz, C., Berner, A., and Brandner, B.: A cloud water sampler for high wind speeds, in: Presented at the Proceedings of the EUROTRAC Symposium 1992 SPB Academic Publishing bv, edited by: Borrell, P. M., Borrell, P., Cvitas, T., and Seiler, W., 523–525, 1993.
Kulmala, M., Suni, T., Lehtinen, K. E. J., Dal Maso, M., Boy, M., Reissell, A., Rannik, Ü., Aalto, P., Keronen, P., Hakola, H., Bäck, J., Hoffmann, T., Vesala, T., and Hari, P.: A new feedback mechanism linking forests, aerosols, and climate, Atmos. Chem. Phys., 4, 557–562, https://doi.org/10.5194/acp-4-557-2004, 2004.
Lac, C., Chaboureau, J.-P., Masson, V., Pinty, J.-P., Tulet, P., Escobar, J., Leriche, M., Barthe, C., Aouizerats, B., Augros, C., Aumond, P., Auguste, F., Bechtold, P., Berthet, S., Bielli, S., Bosseur, F., Caumont, O., Cohard, J.-M., Colin, J., Couvreux, F., Cuxart, J., Delautier, G., Dauhut, T., Ducrocq, V., Filippi, J.-B., Gazen, D., Geoffroy, O., Gheusi, F., Honnert, R., Lafore, J.-P., Lebeaupin Brossier, C., Libois, Q., Lunet, T., Mari, C., Maric, T., Mascart, P., Mogé, M., Molinié, G., Nuissier, O., Pantillon, F., Peyrillé, P., Pergaud, J., Perraud, E., Pianezze, J., Redelsperger, J.-L., Ricard, D., Richard, E., Riette, S., Rodier, Q., Schoetter, R., Seyfried, L., Stein, J., Suhre, K., Taufour, M., Thouron, O., Turner, S., Verrelle, A., Vié, B., Visentin, F., Vionnet, V., and Wautelet, P.: Overview of the Meso-NH model version 5.4 and its applications, Geosci. Model Dev., 11, 1929–1969, https://doi.org/10.5194/gmd-11-1929-2018, 2018.
Lee, A. K. Y., Hayden, K. L., Herckes, P., Leaitch, W. R., Liggio, J., Macdonald, A. M., and Abbatt, J. P. D.: Characterization of aerosol and cloud water at a mountain site during WACS 2010: secondary organic aerosol formation through oxidative cloud processing, Atmos. Chem. Phys., 12, 7103–7116, https://doi.org/10.5194/acp-12-7103-2012, 2012.
Lelieveld, J., Peters, W., Dentener, F. J., and Krol: M. Stability of tropospheric hydroxyl chemistry, J. Geophys. Res., 107, D234715, https://doi.org/10.1029/2002JD002272, 2002.
Lesouëf, D., Gheusi, F., Delmas, R., and Escobar, J.: Numerical simulations of local circulations and pollution transport over Reunion Island, Ann. Geophys., 29, 53–69, https://doi.org/10.5194/angeo-29-53-2011, 2011.
Lesouëf D., Gheusi, F., Chazette, P., Delmas, R., and Sanak, J.: Low Tropospheric Layers Over Reunion Island in Lidar-Derived Observations and a High-Resolution Model, Bound.-Lay. Meteorol., 149, 425–453, 2013.
Lin, Y-L, Farley, R. D., and Orville, H. D.: Bulk parameterization of the snow field in a cloud model, J. Clim. Appl. Meteorol., 22, 1065–1092, 1983.
Lundin, A., Hasenson, M., Persson, J., Pousette, A., Marlene, A., and DeLuca, W. D. M.: Estimation of biomass in growing cell lines by adenosine triphosphate assay, in: Methods in Enzymology, Academic Press, 27–42, 1986.
Mason, R. H., Chou, C., McCluskey, C. S., Levin, E. J. T., Schiller, C. L., Hill, T. C. J., Huffman, J. A., DeMott, P. J., and Bertram, A. K.: The micro-orifice uniform deposit impactor-droplet freezing technique (MOUDI-DFT) for measuring concentrations of ice nucleating particles as a function of size: improvements and initial validation, Atmos. Meas. Tech., 8, 2449–2462, https://doi.org/10.5194/amt-8-2449-2015, 2015.
Mason, R. H., Si, M., Chou, C., Irish, V. E., Dickie, R., Elizondo, P., Wong, R., Brintnell, M., Elsasser, M., Lassar, W. M., Pierce, K. M., Leaitch, W. R., MacDonald, A. M., Platt, A., Toom-Sauntry, D., Sarda-Estève, R., Schiller, C. L., Suski, K. J., Hill, T. C. J., Abbatt, J. P. D., Huffman, J. A., DeMott, P. J., and Bertram, A. K.: Size-resolved measurements of ice-nucleating particles at six locations in North America and one in Europe, Atmos. Chem. Phys., 16, 1637–1651, https://doi.org/10.5194/acp-16-1637-2016, 2016.
McCluskey, C. S., Hill, T. C. J., Humphries, R. S., Rauker, A. M., Moreau, S., Strutton, P. G., Chambers, S. D., Williams, A. G., McRobert, I., Ward, J., Keywood, M. D., Harnwell, J, Ponsonby, W., Loh, Z. M., Krumme, P. B. , Protat, A., Kreidenweis, S. M., and DeMott, P. J.: Observations of ice nucleating particles over Southern Ocean waters, Geophys. Res. Lett., 45, GL079989, https://doi.org/10.1029/2018GL079981, 2018.
Meigh, D. F.: Volatile alcohols, aldehydes, ketones and esters, Modern Methods of Plant Analysism, edited by: Paech, M. and Tracey, M. V., Vol. 2, Springer-Verlag, Berlin, 403–443, 1955.
Mlawer, E. J., Taubman, S. J., Brown, P. D., Iacono, M. J., and Clough, S. A.: Radiative transfer for inhomogeneous atmospheres: RRTM, a validated corrolated-k model for the longwave, J. Geophys. Res. D, 102, 16663–16682, 1997.
Morris, C. E., F. Conen, J. A. Huffman, V. Phillips, U. Pöschl, and Sands, D. C.: Bioprecipitation: a feedback cycle linking Earth history, ecosystem dynamics and land use through biological ice nucleators in the atmosphere, Glob. Change Biol., 20, 341–351, https://doi.org/10.1111/gcb.12447, 2014.
Morris, C. E., Soubeyrand, S., Bigg, E. K., Creamean, J. M., and Sands, D. C.: Mapping rainfall feedback to reveal the potential sensitivity of precipitation to biological aerosols, B. Am. Meteorol. Soc., 98, 1109–1118, 2017.
Mouchel-Vallon, C., Deguillaume, L., Monod, A., Perroux, H., Rose, C., Ghigo, G., Long, Y., Leriche, M., Aumont, B., Patryl, L., Armand, P., and Chaumerliac, N.: CLEPS 1.0: A new protocol for cloud aqueous phase oxidation of VOC mechanisms, Geosci. Model Dev., 10, 1339–1362, https://doi.org/10.5194/gmd-10-1339-2017, 2017.
Pergaud, J., Masson, V., Malardel, S., and Couvreux, F.: A Parameterization of Dry Thermals and Shallow Cumuli for Mesoscale Numerical Weather Prediction, Bound.-Lay. Meteorol., 132, 83–106, 2009.
Perring, A. E., Schwarz, J. P., Baumgardner, D., Hernandez, M. T., Spracklen, D. V., Heald, C. L., Gao, R. S., Kok, G., McMeeking, G. R., McQuaid, J. B., and Fahey, D. W.: Airborne observations of regional variation in fluorescent aerosol across the United States, J. Geophys. Res.-Atmos., 120, 1153–1170, 2015.
Pfister, G., Emmons, L., Hess, P., Lamarque, J.-F., Orlando, J.,Walters, S., Guenther, A., Palmer, P., and Lawrence, P.: Contribution of isoprene to chemical budgets: a model tracer study with the NCAR CTM MOZART-4, J. Geophys. Res.-Atmos., 113, D05308, https://doi.org/10.1029/2007JD008948, 2008.
Pietras, C., Knobelspiesse, K. D., Frouin, R., Holben, B., and Voss, K.: Calibration of Sun photometers and sky radiance sensors, in: Ocean Optics Protocols for Satellite Ocean Color Sensor Validation, Revision 3, edited by: Mueller, L. and Fargion, G. S., NASA Tech. Memo., TM-20021-210004, 1, 76–90, 2002.
Pinty, J.-P. and Jabouille, P.: A mixed-phase cloud parameterization for use in a mesoscale non-hydrostatic model: simulations of a squall line and of orographic precipitations, in: Proc. AMS conference on cloud physics, 17–21 August 1998, Everett, Wa, USA, 217–220, 1998.
Poisson, N., Kanakidou, M., and Crutzen, P. J.: Impact of nonmethane hydrocarbons on tropospheric chemistry and the oxidizing power of the global troposphere: 3-dimensional modelling results, J. Atmos. Chem., 36, 157–230, 2000.
Pope, F. D.: Pollen grains are efficient cloud condensation nuclei, Environ. Res. Lett., 5, 044015, https://doi.org/10.1088/1748-9326/5/4/044015, 2010.
Pöschl, U., Martin, S. T., Sinha, B., Chen, Q., Gunthe, S. S., Huffman, J. A., Borrmann, S., Farmer, D. K., Garland, R. M., Helas, G., Jimenez, J. L., King, S. M., Manzi, A., Mikhailov, E., Pauliquevis, T., Petters, M. D., Prenni, A. J., Roldin, P., Rose, D., Schneider, J., Su, H., Zorn, S. R., Artaxo, P., and Andreae, M. O.: Rainforest Aerosols as Biogenic Nuclei of Clouds and Precipitation in the Amazon, Science, 329, 1513–1516, 2010.
Pratt, K. A., Fiddler, M. N., Shepson, P. B., Carlton, A. G., and Surratt, J. D.: Organosulfates in cloud water above the Ozarks' isoprene source region, Atmos. Environ., 77, 231–238, 2013.
Pruppacher, H. R. and Klett, J. D.: Microphysics of Clouds and Precipitation, 2nd Edn., Vol. 954, Reidel, Dordrecht, 954 pp., 1997.
Renard, P., Siekmann, F., Salque, G., Demelas, C., Coulomb, B., Vassalo, L., Ravier, S., Temime-Roussel, B., Voisin, D., and Monod, A.: Aqueous-phase oligomerization of methyl vinyl ketone through photooxidation – Part 1: Aging processes of oligomers, Atmos. Chem. Phys., 15, 21–35, https://doi.org/10.5194/acp-15-21-2015, 2015.
Sartelet, K. N., Couvidat, F., Seigneur, C., and Roustan, Y.: Impact of biogenic emissions on air quality over Europe and North America, Atmos. Environ., 53, 131–141, 2012.
Savage, N. J., Krentz, C. E., Könemann, T., Han, T. T., Mainelis, G., Pöhlker, C., and Huffman, J. A.: Systematic characterization and fluorescence threshold strategies for the wideband integrated bioaerosol sensor (WIBS) using size-resolved biological and interfering particles, Atmos. Meas. Tech., 10, 4279–4302, https://doi.org/10.5194/amt-10-4279-2017, 2017.
Schnell, R. C. and Vali, G.: Freezing nuclei in marine waters, Tellus, 27, 321–323, https://doi.org/10.1111/j.2153-3490.1975.tb01682.x, 1975.
Schumacher, C. J., Pöhlker, C., Aalto, P., Hiltunen, V., Petäjä, T., Kulmala, M., Pöschl, U., and Huffman, J. A.: Seasonal cycles of fluorescent biological aerosol particles in boreal and semi-arid forests of Finland and Colorado, Atmos. Chem. Phys., 13, 11987–12001, https://doi.org/10.5194/acp-13-11987-2013, 2013.
Schwier, A. N., Sellegri, K., Mas, S., Charrière, B., Pey, J., Rose, C., Temime-Roussel, B., Jaffrezo, J.-L., Parin, D., Picard, D., Ribeiro, M., Roberts, G., Sempéré, R., Marchand, N., and D'Anna, B.: Primary marine aerosol physical flux and chemical composition during a nutrient enrichment experiment in mesocosms in the Mediterranean Sea, Atmos. Chem. Phys., 17, 14645–14660, https://doi.org/10.5194/acp-17-14645-2017, 2017.
Seinfeld, J. H. and Pandis, S. N.: Atmospheric Chemistry and Physics, John Wiley and Sons Inc., USA, 1152 pp., 1998.
Sellegri, K., Hanke, M., Umann, B., Arnold F., and Kulmala, M.: Measurements of atmospheric Organic Gases during Nucleation Events in the Boreal Forest Atmosphere during QUEST, Atmos. Chem. Phys., 5, 373–384, 2005.
Shang, X., Chazette, P., Totems, J., Dieudonné, E., Hamonou, E., Duflot, V., Strasberg, D., Flores, O., Fournel, J., and Tulet, P.: Tropical Forests of Réunion Island Classified from Airborne Full-Waveform LiDAR Measurements, Remote Sens., 8, 401–422, https://doi.org/10.3390/rs8010043, 2016.
Sindelarova, K., Granier, C., Bouarar, I., Guenther, A., Tilmes, S., Stavrakou, T., Müller, J.-F., Kuhn, U., Stefani, P., and Knorr, W.: Global data set of biogenic VOC emissions calculated by the MEGAN model over the last 30 years, Atmos. Chem. Phys., 14, 9317–9341, https://doi.org/10.5194/acp-14-9317-2014, 2014.
Singaas, E. L., Lerdau, M., Winter, K., and Sharkey, T. D.: Isoprene increases thermotolerance of isoprene-emitting species, Plant Physiol., 115, 1413–1420, 1997.
Smirnov, A., Holben, B. N., Eck, T. F., Dubovik, O., and Slutsker, I.: Cloud screening and quality control algorithms for the AERONET database, Remote Sens. Environ., 73, 337–349, https://doi.org/10.1016/S0034-4257(00)00109-7, 2000.
Solmon, F., Sarrat, C., Serca, D., Tulet, P., and Rosset, R.: Isoprene and monoterpenes biogenic emissions in France: modeling and impact during a regional pollution episode, Atmos. Environ., 38, 3853–3865, 2004.
Stevens, B. and Feingold, G.: Untangling aerosol effects on clouds and precipitation in a buffered system, Nature, 461, 607–613, 2009.
Stickler, A., Fischer, H., Bozem, H., Gurk, C., Schiller, C., Martinez-Harder, M., Kubistin, D., Harder, H., Williams, J., Eerdekens, G., Yassaa, N., Ganzeveld, L., Sander, R., and Lelieveld, J.: Chemistry, transport and dry deposition of trace gases in the boundary layer over the tropical Atlantic Ocean and the Guyanas during the GABRIEL field campaign, Atmos. Chem. Phys., 7, 3933–3956, https://doi.org/10.5194/acp-7-3933-2007, 2007.
Strasberg, D., Rouget, M., Richardson, D. M., Baret, S., Dupont, J., and Cowling, R. M.: An Assessment of Habitat Diversity and Transformation on La Réunion Island (Mascarene Islands, Indian Ocean) as a Basis for Identifying Broad-scale Conservation Priorities, Biodivers. Conserv., 14, 3015–3032, 2005.
Suhre, K., Mari, C., Bates, T. S., Johnson, J. E., Rosset, R., Wang, Q., Bandy, A. R., Blake, D. R., Businger, S., Eisele, F. L., Huebert, B. J., Kok, G. L., Mauldin III, R. L., Prévôt, A. S. H., Schillawski, R. D., Tanner, D. J., and Thornton, D. C.: Physico-chemical modeling of the first aerosolcharacterization experiment (ACE 1) Lagrangian B: 1. A moving column approach, J. Geophys. Res., 103, 16433–16455, 1998.
Taraborrelli, D., Lawrence, M., Crowley, J., Dillon, T., Gromov, S., Groß, C., Vereecken, L., and Lelieveld, J.: Hydroxyl radical buffered by isoprene oxidation over tropical forests, Nat. Geosci., 5, 190–193, 2012.
Tulet, P., Crassier, V., Solmon, F., Guedalia, D., and Rosset, R.: Description of the Mesoscale Nonhydrostatic Chemistrymodel and application to a transboundary pollution episode between northern France and southern England, J. Geophys. Res., 108, 4021, https://doi.org/10.1029/2000JD000301, 2003.
Tulet, P., Grini, A., Griffin, R. J., and Petitcol, S.: ORILAM-SOA: A computationally efficient model for predictingsecondary organic aerosols in three-dimensional atmospheric models, J. Geophys. Res., 111, D23208, https://doi.org/10.1029/2006JD007152, 2006.
Tulet, P., Di Muro, A., Colomb, A., Denjean, C., Duflot, V., Arellano, S., Foucart, B., Brioude, J., Sellegri, K., Peltier, A., Aiuppa, A., Barthe, C., Bhugwant, C., Bielli, S., Boissier, P., Boudoire, G., Bourrianne, T., Brunet, C., Burnet, F., Cammas, J.-P., Gabarrot, F., Galle, B., Giudice, G., Guadagno, C., Jeamblu, F., Kowalski, P., Leclair de Bellevue, J., Marquestaut, N., Mékies, D., Metzger, J.-M., Pianezze, J., Portafaix, T., Sciare, J., Tournigand, A., and Villeneuve, N.: First results of the Piton de la Fournaise STRAP 2015 experiment: multidisciplinary tracking of a volcanic gas and aerosol plume, Atmos. Chem. Phys., 17, 5355–5378, https://doi.org/10.5194/acp-17-5355-2017, 2017.
Twomey, S.: The influence of pollution on the shortwave albedo of clouds, J. Atmos. Sci., 34, 1149–1152, 1977.
Vaïtilingom, M., Amato, P., Sancelme, M., Laj, P., Leriche, M., and Delort, A.-M.: Contribution of microbial activity to carbon chemistry in clouds, Appl. Environ. Microb., 76, 23–29, https://doi.org/10.1128/aem.01127-09, 2010.
Vaïtilingom, M., Charbouillot, T., Deguillaume, L., Maisonobe, R., Parazols, M., Amato, P., Sancelme, M., and Delort, A.-M.: Atmospheric chemistry of carboxylic acids: microbial implication versus photochemistry, Atmos. Chem. Phys., 11, 8721–8733, https://doi.org/10.5194/acp-11-8721-2011, 2011.
Vaïtilingom, M., Attard, E., Gaiani, N., Sancelme, M., Deguillaume, L., Flossmann, A. I., Amato, P., and Delort, A.-M.: Long-term features of cloud microbiology at the puy de Dôme (France), Atmos. Environ. 56, 88–100, https://doi.org/10.1016/j.atmosenv.2012.03.072, 2012.
Vaïtilingom, M., Deguillaume, L., Vinatier, V., Sancelme, M., Amato, P., Chaumerliac, N., and Delort, A.-M.: Potential impact of microbial activity on the oxidant capacity and organic carbon budget in clouds, P. Natl. Acad. Sci. USA, 110, 559–564, https://doi.org/10.1073/pnas.1205743110, 2013.
Vali, G., Christensen, M., Fresh, R. W., Galyan, E. L., Maki, L. R., and Schnell, R. C.: Biogenic ice nuclei, Part II: bacterial sources, J. Atmos. Sci., 33, 1565–1570, 1976.
van Donkelaar, A., Martin, R. V., Park, R. J., Heald, C. L., Tzung-May Fu, H. L., and Guenther, A.: Model evidence for a significant source of secondary organic aerosol from isoprene, Atmos. Environ., 41, 1267–1274, 2007.
van Pinxteren, D., Plewka, A., Hofmann, D., Müller, K., Kramberger, H., Svrcina, B., Bächmann, K., Jaeschke, W., Mertes, S., Collett Jr, J. L., and Herrmann, H.: Schmücke hill cap cloud and valley stations aerosol characterisation during FEBUKO (II): Organic compounds, Atmos. Environ., 39, 4305–4320, 2005.
Wiedensohler, A., Birmili, W., Nowak, A., Sonntag, A., Weinhold, K., Merkel, M., Wehner, B., Tuch, T., Pfeifer, S., Fiebig, M., Fjäraa, A. M., Asmi, E., Sellegri, K., Depuy, R., Venzac, H., Villani, P., Laj, P., Aalto, P., Ogren, J. A., Swietlicki, E., Williams, P., Roldin, P., Quincey, P., Hüglin, C., Fierz- Schmidhauser, R., Gysel, M., Weingartner, E., Riccobono, F., Santos, S., Grüning, C., Faloon, K., Beddows, D., Harrison, R., Monahan, C., Jennings, S. G., O'Dowd, C. D., Marinoni, A., Horn, H.-G., Keck, L., Jiang, J., Scheckman, J., Mcmurry, P. H., Deng, Z., Zhao, C. S., Moerman, M., Henzing, B., De Leeuw, G., Löschau, G., and Bastian, S.: Mobility particle size spectrometers: harmonization of technical standards and data structure to facilitate high quality long-term observations of atmospheric particle number size distributions, Atmos. Meas. Tech., 5, 657–685, https://doi.org/10.5194/amt-5-657-2012, 2012.
Wirth, R., Weber, B., and Ryel, R. J.: Spatial and Temporal Variability of Canopy Structure in a Tropical Moist Forest, Acta Oecol., 22, 235–244, https://doi.org/10.1016/S1146-609X(01)01123-7, 2001.
Yao Liu, El Haddad, I., Scarfogliero, M., Nieto-Gligorovski, L., Temime-Roussel, B., Quivet, E., Marchand, N., Picquet-Varrault, B., and Monod, A.: In-cloud processes of methacrolein under simulated conditions – Part 1: Aqueous phase photooxidation, Atmos. Chem. Phys., 9, 5093–5105, https://doi.org/10.5194/acp-9-5093-2009, 2009.
Zemankova, K. and Brechler, J.: Emissions of biogenic VOC from forest ecosystems in central Europe: Estimation and comparison with anthropogenic emission inventory, Environ. Pollut., 158, 462–469, 2010.