the Creative Commons Attribution 4.0 License.
the Creative Commons Attribution 4.0 License.
 | 21 Aug 2019
Molecular characteristics and diurnal variations of organic aerosols at a rural site in the North China Plain with implications for the influence of regional biomass burning
Jianjun Li
Jin Li
Can Wu
Wenqing Jiang
Limin Zeng
Field burning of crop residue in early summer releases a large amount of pollutants into the atmosphere with significant impacts on the air quality and aerosol properties in the North China Plain (NCP). In order to investigate the influence of this regional anthropogenic activity on molecular characteristics of organic aerosols, PM2.5 filter samples were collected with a 3 h interval at a rural site of NCP from 10 to 25 June 2013 and analyzed for more than 100 organic tracer compounds, including both primary (n-alkanes, fatty acids/alcohols, sugar compounds, polycyclic aromatic hydrocarbons, hopanes, and phthalate esters) and secondary organic aerosol (SOA) tracers (phthalic acids, isoprene-, α-/β-pinene, β-caryophyllene, and toluene-derived products), as well as organic carbon (OC), elemental carbon (EC), and water-soluble organic carbon (WSOC). Total concentrations of the measured organics ranged from 177 to 6248 ng m−3 (mean 1806±1308 ng m−3) during the study period, most of which were contributed by sugar compounds, followed by fatty acids and fatty alcohols. Levoglucosan (240±288 ng m−3) was the most abundant single compound and strongly correlated with OC and WSOC, suggesting that biomass burning (BB) is an important source of summertime organic aerosols in this rural region. Based on the analysis of fire spots and backward trajectories of air masses, two representative periods were classified, which are (1) Period 1 (P1), 13 June 21:00–16 June at 15:00 CST (China Standard Time), when air masses were uniformly distributed from the southeast part of NCP, where intensive open-field biomass burning occurred; and (2) Period 2 (P2), 22 June at 12:00 to 24 June at 06:00 CST, which is representative of local emission. Nearly all the measured PM components showed much higher concentrations in P1 than in P2. Although n-alkanes, fatty acids, and fatty alcohols presented similar temporal–diurnal variations as those of levoglucosan throughout the entire period, their molecular distributions were more dominated by high molecular weight (HMW) compounds in P1, demonstrating an enhanced contribution from BB emissions. In contrast, intensive BB emission in P1 seems to have limited influence on the concentrations of polycyclic aromatic hydrocarbons (PAHs), hopanes, and phthalate esters. Both 3-hydroxyglutaric acid and β-caryophyllinic acid showed strong linearly correlations with levoglucosan (R2=0.72 and 0.80, respectively), indicating that BB is also an important source for terpene-derived SOA formation. A tracer-based method was used to estimate the distributions of biomass-burning OC, fungal-spore OC, and secondary organic carbon (SOC) derived from isoprene, α-/β-pinene, β-caryophyllene, and toluene in the different periods. The results showed that the contribution of biomass-burning OC to total OC in P1 (27.6 %) was 1.7 times that in P2 (17.1 %). However, the contribution of SOC from oxidation of the four kinds of volatile organic compounds (VOCs) increased slightly from 16.3 % in P1 to 21.1 % in P2.
- Article
(7899 KB) - Full-text XML
-
Supplement
(475 KB) - BibTeX
- EndNote


Organic aerosols (OAs, i.e., the organic fraction of particles) constitute a substantial fraction (∼10 %–90 %) of atmospheric particles (Jimenez et al., 2009; Q. Zhang et al., 2007; Hallquist et al., 2009) and have significant effects on global and regional climate (Venkataraman et al., 2005; Kanakidou et al., 2005), air quality (Aggarwal et al., 2013; Wang et al., 2006b), human health (Lelieveld et al., 2015), and ecosystems (Tie et al., 2016). Organic aerosols in the atmosphere can be emitted directly from various sources, such as fossil fuel combustion, biomass burning, plant emission, and so on, which is defined as primary organic aerosols (POAs). On the other hand, atmospheric secondary OAs (SOAs) are produced from photochemical oxidation products of volatile organic compounds (VOCs) via gas–particle conversion processes such as nucleation, condensation and heterogeneous chemical reactions (Hallquist et al., 2009). These organic species could modify physicochemical characteristics of atmospheric aerosols such as hygroscopicity, albedo, and oxidation state (Dinar et al., 2008; Chan et al., 2005; Fu et al., 2010). Thus, a thorough understanding of molecular composition and source of organic aerosols is necessary in order to address aerosol-related environmental issues and to improve the accuracy of modeling studies.
Tremendous amounts of air pollutants including both particulate matter (PM) and its gaseous precursors (e.g., SO2, NOx, NH3, and VOCs) are emitted into the atmosphere from power plants, industries, and vehicles due to rapid economy development in China, leading to serious air pollution in recent decades (Zhang et al., 2009; Guo et al., 2014; Wang et al., 2016; Huang et al., 2014; Li et al., 2017). The North China Plain (NCP) has been recognized as one of the most polluted regions in the world, with very high concentrations of PM2.5 on the ground surface (van Donkelaar et al., 2010). The NCP is also one of the most significant aerosol sources in the world, which has a significant impact on the East China Sea and western North Pacific (Andreae and Rosenfeld, 2008). Thus, extensive efforts have been made in recent years to characterize the sources, properties, and processes of PM in the NCP. Most of these results concluded that the severe air pollution in the region is related to the source strength and frequently happens under stagnant weather conditions. Recent studies showed that the rapid growth of secondary aerosols could lead to a severe haze event in China under certain meteorological conditions (Wang et al., 2016; Sun et al., 2014; Quan et al., 2013).
In the rural area of the NCP, biomass burning for domestic cooking and heating, and agricultural waste disposal is an important source of atmospheric PM (Wang et al., 2009b; Li et al., 2010; Zhang et al., 2016). Particularly, the open-field burning is still a common way to dispose of crop residues (mainly wheat straw) in early summer (Li et al., 2007). This traditional activity could release huge amounts of pollutants into the atmosphere and significantly affect air quality and aerosol properties in the region. Zhu et al. (2016) examined the amounts of VOCs in the air at a rural site of Yucheng (Shandong province, east China) and found that their concentrations during the wheat straw burning period are approximately twice as large as those in normal periods. Model results also revealed a significant influence of open crop residual burning on ozone, CO, black carbon (BC), and organic carbon (OC) concentrations in NCP. Moreover, both offline (Fu et al., 2012; Wang et al., 2009b, 2011) and online (Sun et al., 2016) observations indicated that the intensive emission from wheat straw burning in the region could change the molecular distribution of organic aerosols in the downwind urban or mountain areas.
During 10 to 25 June 2013, we conducted a continuous sampling campaign at a rural site in the northern part of NCP. PM2.5 filter samples were collected with a 3 h time resolution and determined for more than 100 organic compounds including aliphatic lipids, sugar compounds, hopanes, polycyclic aromatic hydrocarbons (PAHs), phthalate esters, and secondary oxidation products. The first objective of this study was to get an overall understanding of temporal–diurnal variation and molecular distribution of summertime OA in the rural region. The second objective was to compare the results in two representative periods to investigate the influence of regional field burning of wheat straw on the molecular characteristics of organic aerosols.
2.1 Sample collection
The sampling was performed at the Integrated Ecological-Meteorological Observation and Experiment Station of Chinese Academy of Meteorological Sciences (39∘08′ N, 115∘40′ E; 15.2 m a.s.l.), which is located in a rural area of Gucheng, Hebei province. Detailed information of the station and sampling campaign was described in Li et al. (2018). Briefly, time-resolved (06:00–09:00, 09:00–12:00, 12:00–15:00, 15:00–18:00, 18:00–21:00, 21:00–24:00, 00:00–03:00, and 03:00–06:00 CST – China Standard Time) PM2.5 samples were collected on the rooftop (about 10 m above the ground) of a three-story building on the campus of the Gucheng station. The sampling was conducted by using a high volume (1.13 m3 min−1) sampler (Anderson) with a PM2.5 inlet from 10 to 25 June 2013. This period was chosen because open-field burning of wheat straw in NCP mainly occur in mid-June. All samples were collected onto pre-baked (450 ∘C, 6–8 h) quartz fiber filters. Field blank samples were also collected by mounting blank filters onto the sampler for about 15 min without pumping any air. After sampling, the sample filter was individually sealed in aluminum foil bags and stored in a freezer (−20 ∘C) prior to analysis.
2.2 Organic compound determination
A size of 12.5–25 cm2 of the filter sample was cut and extracted with a mixture of dichloromethane and methanol (2 : 1, v∕v) under ultrasonication. The extracts were concentrated using a rotary evaporator under vacuum conditions and then blown down to dryness using pure nitrogen. After reaction with N,O-bis(trimethylsilyl) trifluoroacetamide (BSTFA) at 70 ∘C for 3 h, the derivatives were determined using gas chromatography/electron ionization mass spectrometry (GC/EI-MS) (Li et al., 2013b).
GC/EI-MS analysis of the derivatized fraction was performed using an Agilent 7890A GC coupled with an Agilent 5975C MS detector (MSD). The GC separation was carried out on a DB-5MS fused silica capillary column with the GC oven temperature programmed from 50 ∘C (2 min) to 120 ∘C at 15 ∘C min−1 and then to 300 ∘C at 5 ∘C min−1 with a final isothermal hold at 300 ∘C for 16 min. The sample was injected in a splitless mode at an injector temperature of 280 ∘C and scanned from 50 to 650 Daltons using electron impact (EI) mode at 70 eV.
GC/EI-MS response factors of all the target compounds were determined using authentic standards except several isoprene-derived SOA tracers. Response factors of isoprene-derived SOA tracers were substituted by those of related surrogated standards, which were described in Li et al. (2018). No significant contamination (<5 % of those in the samples) was found in the blanks. Recoveries of all the target compounds ranged from 80 % to 120 %. Data presented were corrected for the field blanks but not corrected for the recoveries.
2.3 OC, EC, and WSOC analysis
OC (organic carbon) and EC (elemental carbon) were analyzed using DRI Model 2001 carbon analyzer following the Interagency Monitoring of Protected Visual Environments (IMPROVE) thermal–optical reflectance (TOR) protocol. A size of 0.526 cm2 sample filter was placed in a quartz boat inside the analyzer and stepwise heated to temperatures of 140 ∘C (OC1), 280 ∘C (OC2), 480 ∘C (OC3), and 580 ∘C (OC4) in non-oxidizing helium (He) atmosphere, and 580 ∘C (EC1), 740 ∘C (EC2), and 840 ∘C (EC3) in an oxidizing atmosphere of 2 % oxygen in helium. Pyrolyzed carbon (PC) is determined by reflectance and transmittance of 633 nm light. One sample was randomly selected from every 10 samples and reanalyzed. Differences determined from the replicate analyses were <5 % for total carbon (TC) and <10 % for OC and EC.
Another aliquot of filter sample was extracted with organic-free Milli-Q water under ultrasonication (15 min each, repeated three times) and filtered through a polytetrafluoroethylene (PTFE) filter to remove any particles and filter debris. Then, the water extract was analyzed for water-soluble organic carbon (WSOC) using a total organic carbon (TOC) analyzer (TOC-L CPH, Shimadzu, Japan). The difference between OC and WSOC was considered as water-insoluble OC (WIOC). All carbonaceous components data reported here were corrected by the field blanks.
3.1 Fire spots and air masses
At present, open-field burning is still a common activity for disposal of crop residue in the rural area of the North China Plain, especially during the wheat harvest period from the end of May to the middle of June (Fu et al., 2012). These extensive emissions from regional biomass burning in the provinces of Anhui, Jiangsu, Shandong, Henan, and Hebei in NCP can cause severe air pollution on a local and regional scale. In our previous study, the fire spots in NCP during the sampling period were provided based on the NASA satellite observation (https://firms.modaps.eosdis.nasa.gov, last access: 28 December 2018). Combining with information on air mass back-trajectories (http://ready.arl.noaa.gov/HYSPLIT.php, last access: 28 December 2018), the sampling period was divided into two sections: (1) 10–18 June, when air masses were mainly transported via long distances from the southeast part of NCP, where intensive emissions from wheat straw burning occurred; (2) 19–25 June, when air masses were mostly influenced by local emissions and regional emission from biomass burning decreased dramatically (Li et al., 2018). In this study, we further selected two representative periods to estimate the contribution of regional biomass burning. Period 1 (P1) designates 13 June at 21:00 to 16 June at 15:00, during which air masses were influenced by intensive biomass burning and transported uniformly from the southeast part of NCP (Figs. 1a and b, and S1 in the Supplement). Period 2 (P2) designates 22 June at 12:00 to 24 June at 06:00, during which fire spots in the regions were relatively scarce and air masses came predominantly from the surrounding areas of the sampling site (Fig. 1c and d). In addition, there were several instances of intermittent rainfall during 20–22 June, which are favorable for wet deposition of atmospheric pollutants. Thus, aerosols collected in P2 are well representative of local fresh emission. It is worthwhile to note that the two samples collected during 21 June at 18:00–24:00 were excluded from P2, because they were highly affected by near-site biomass-burning emission (detailed information is provided in Sect. 3.3).
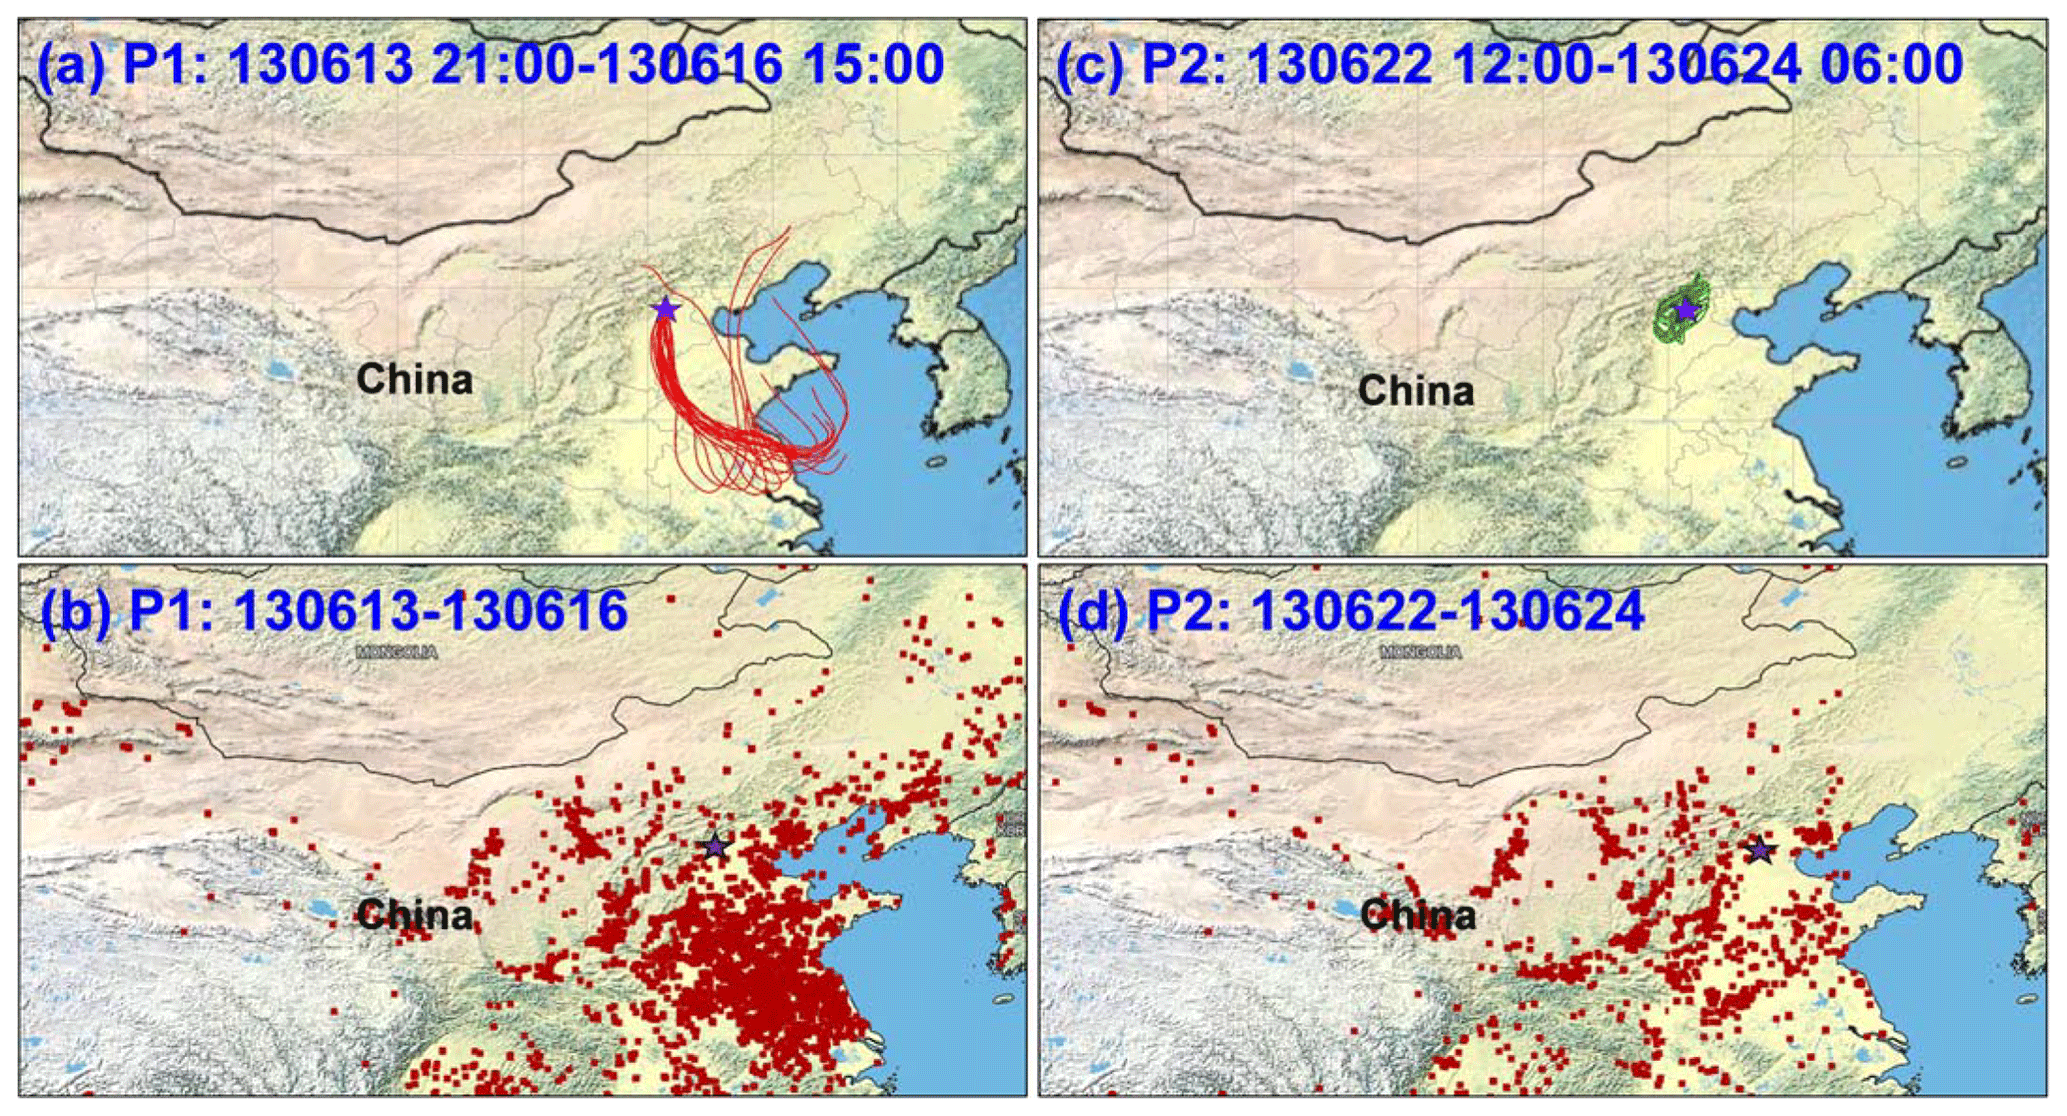
Figure 1Backward trajectories of air masses (a, c) (provided by the NOAA HYSPLIT modeling system; http://ready.arl.noaa.gov/HYSPLIT.php) and fire spots (b, d) (provided by Fire Information for Resource Management System, FIRMS; https://firms.modaps.eosdis.nasa.gov, last access: 28 December 2018), during Period 1 (P1) (13 June 2013 at 21:00 to 16 June 2013 at 15:00 CST) and Period 2 (P2) (22 June at 12:00 to 24 June 2013 at 06:00 CST). The map was obtained from https://firms.modaps.eosdis.nasa.gov. The sampling site is represented as a purple star.
3.2 Concentrations of PM2.5, OC, EC, WSOC, and WIOC
Concentrations of PM2.5 and carbonaceous components are presented in Table 1. PM2.5 concentrations range from 21 to 395 µg m−3 with a mean value at 159±89 µg m−3 during the whole sampling period. As shown in Fig. 2, PM2.5 concentrations in P1 (average of µg m−3) increase continuously from around 150 µg m−3 to higher than 300 µg m−3, indicating the occurrence of a severe air pollution episode. In contrast, PM2.5 concentration during P2 is as low as 43±14 µg m−3. Similarly, the average concentration of OC is 29.4±7.8 µg m−3 in P1, which is more than 5 times higher than that in P2 (5.5±1.7 µg m−3). EC concentrations also decrease dramatically from P1 (12.1±4.0 µg m−3) to P2 (1.5±1.5 µg m−3). The average OC ∕ EC ratio is 3.0±0.9 for the whole sampling period, but the ratio in P2 (3.8±1.0) is higher than that in P1 (2.5±0.4), mainly due to the high SOA formation activities in the rural areas of NCP in summer. It is worthwhile to note that the average OC ∕ EC ratio during the BB-influenced P1 is much lower than the results reported for wheat straw burning in combustion chambers (12.9±2.1) (Tian et al., 2017) and residential stoves (6.3–11.1) (Li et al., 2009). The first reason is that fossil fuel burning (such as coal burning and vehicle exhaust) with lower OC ∕ EC ratio (Tian et al., 2017) is still an important source in the region, which is also discussed in Sect. 3.4. On the other hand, this phenomenon may also be related to different combustion conditions of agricultural residuals in the open field. Li et al. (2009) found that the flaming fire from biomass burning would result in more EC emission and lower OC ∕ EC ratio compared to smoldering fire. Actually, Hays et al. (2005) obtained a similar low OC ∕ EC ratio of 2.4 for open wheat straw burning smoke in the state of Washington, USA. Thus, the lower ratio of OC ∕ EC observed in this work may indicate that wheat straw combustion in NCP during P1 mainly occurred in the flaming phase.
Table 1Concentrations of carbonaceous components in the time-resolved (3 h) PM2.5 samples in the rural site of NCP during the whole sampling period, Period 1 (P1), and Period 2 (P2).
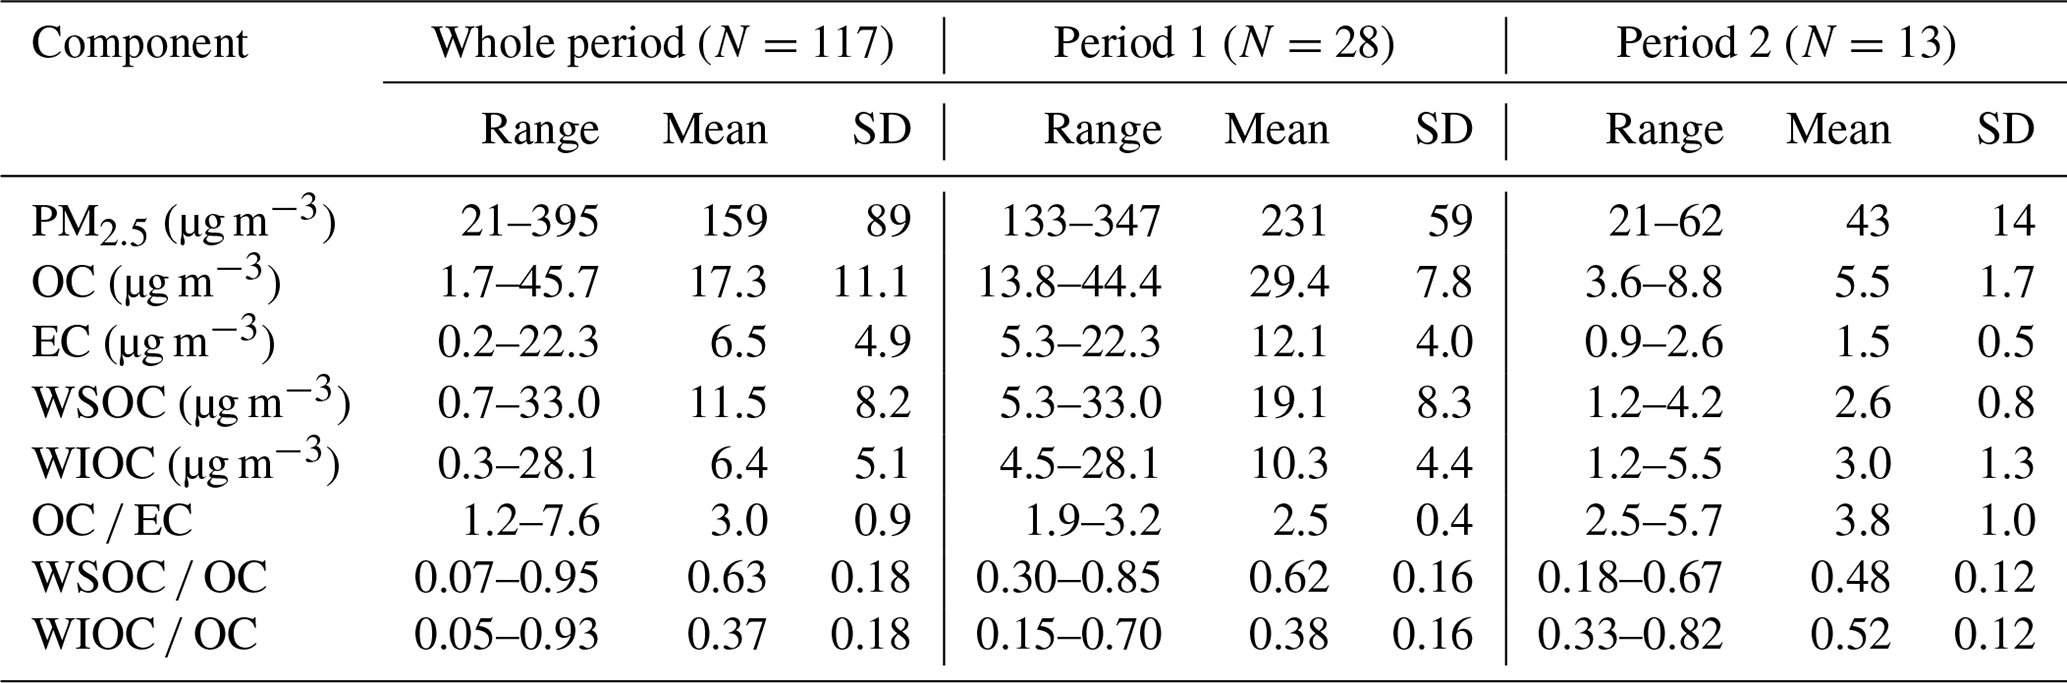
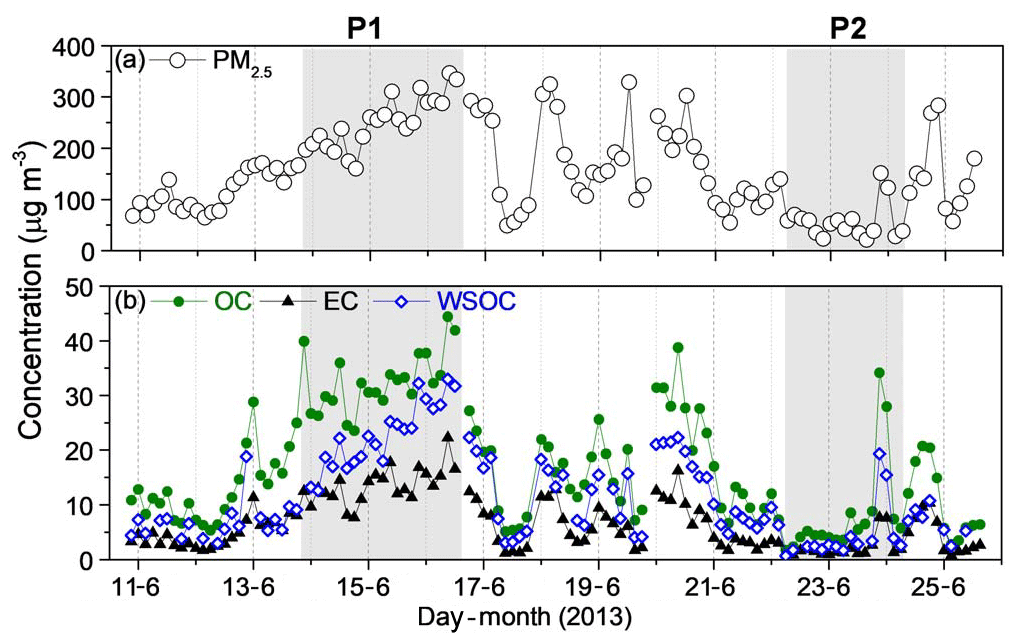
Figure 2Temporal variations of PM2.5, OC, EC, and WSOC during the whole sampling period. Shadows denote the two representative periods.
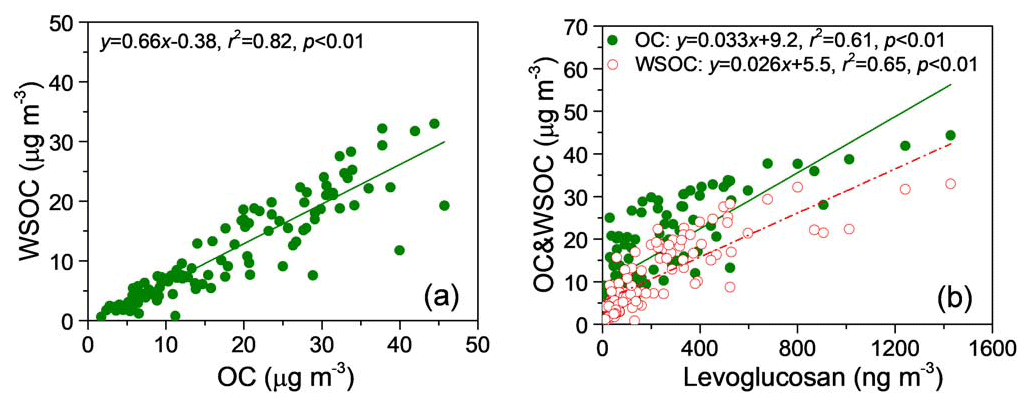
As shown in Figs. 2 and 3, the concentrations of WSOC show a consistent temporal variation with those of OC (R2=0.82), highlighting the fact that WSOC is an important fraction of OC in this region. In addition, the average ratio of WSOC ∕ OC is higher during P1 (0.62±0.16) than during P2 (0.48±0.12), mainly due to enhanced emissions of water-soluble organic compounds (such as sugars, fatty alcohols/acids) from biomass burning during P1. Due to the removal effect of the intermittent raining, concentrations of water-insoluble OC in P2 (3.0±1.3 µg m−3) are also much lower than those in P1 (10.3±4.4 µg m−3).
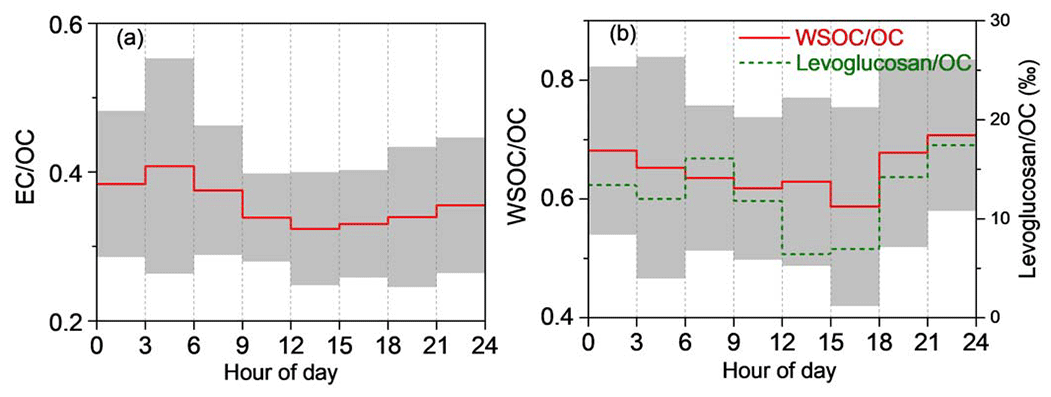
The diurnal variation profiles of EC ∕ OC and WSOC ∕ OC are shown in Fig. 4. EC ∕ OC is generally lower in the daytime and the lowest values occur during 12:00–15:00, mainly due to enhanced daytime formation of SOC. Previous studies have shown that SOAs are mainly composed of water-soluble compounds, e.g., polyacids/polyalcohols and phenols (Kondo et al., 2007; Wang et al., 2009a). However, these compounds can be emitted from primary emissions as well, especially from biomass burning (Shen et al., 2017; Fu et al., 2012). In this study, the WSOC ∕ OC ratio presents lower value during daytime, especially in the afternoon when photo-chemical oxidation is favorable. In addition, the diurnal variation pattern of WSOC ∕ OC is similar to that of levoglucosan ∕ OC. Given that levoglucosan is a marker of biomass-burning emissions (Simoneit et al., 1999, 2004a), and many kinds of SOA could be produced in the biomass-burning plumes during the long-range transport (detailed discussions are given in Sect. 3.3), these results indicate that particulate WSOC in the region is mostly derived from biomass-burning activities including direct emission and secondary oxidation.
3.3 Organic molecular composition
More than 100 organic species were detected in the aerosol samples, and their concentrations are shown in Tables 2 and S1. In this study, these organic compositions are grouped into 10 compound classes based on functional groups and sources. Total concentrations of the measured organics range from 177 to 6248 ng m−3 (average of 1806±1308 ng m−3) during the whole sampling period with the predominance of sugar compounds, followed by fatty acids and fatty alcohols. The temporal variation profiles of the determined organic groups are shown in Fig. 5. Nearly all the measured organic species, especially n-alkanes, fatty acids, fatty alcohols, sugar compounds, and PAHs show much higher concentrations in P1 than in P2 (Fig. S2), indicating an important influence of regional biomass burning on airborne organic aerosols in NCP.
Table 2Average concentrations of the organic compound classes (ng m−3) in the time-resolved (3 h) PM2.5 samples in the rural site of NCP during the whole study period, Period 1 (P1), and Period 2 (P2).
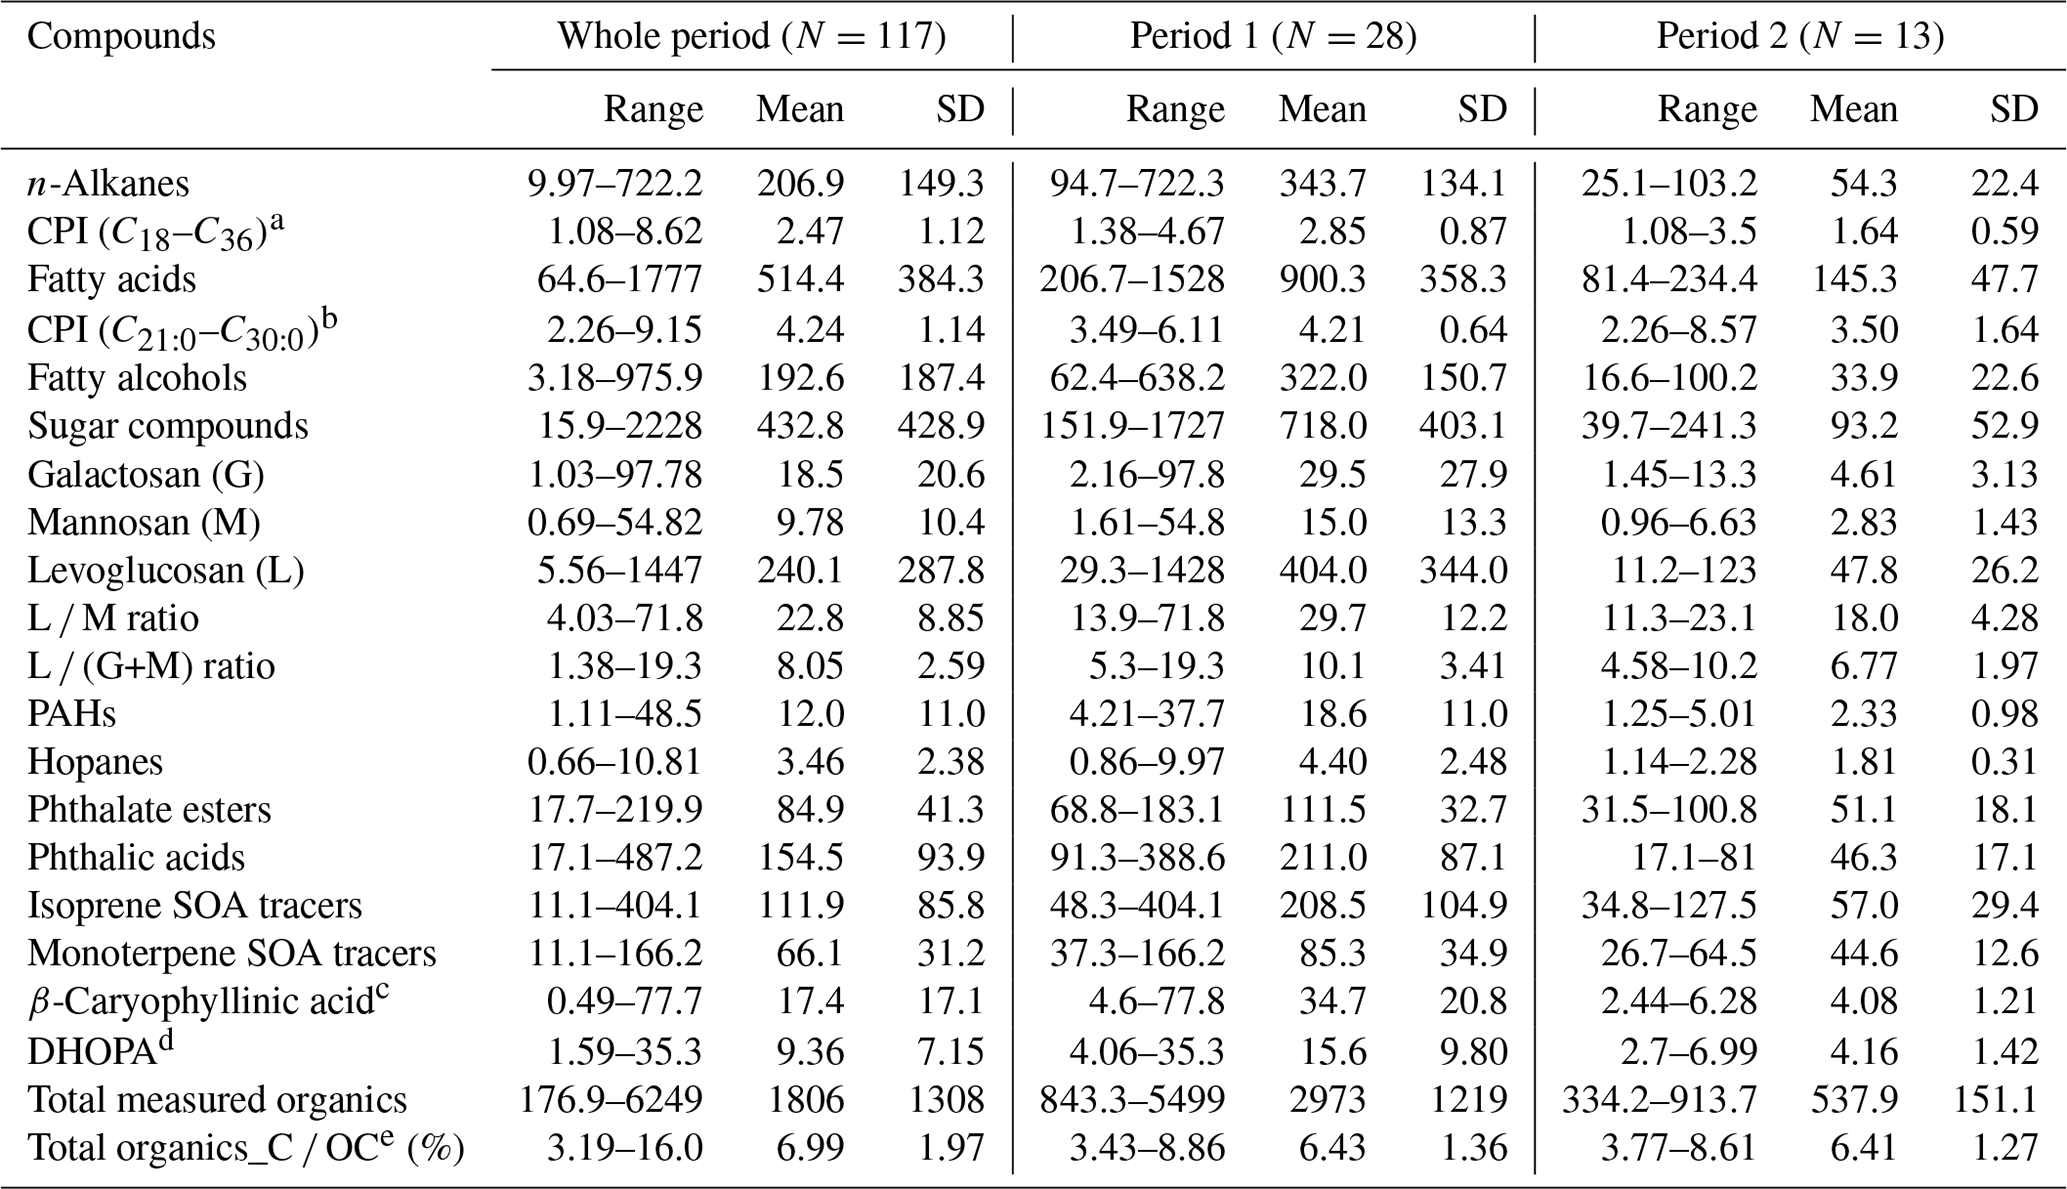
a CPI (C18–C36): carbon preference index for n-alkanes . b CPI (C21:0–C30:0): carbon preference index for fatty acids . c β-Caryophyllinic acid: a tracer of β-caryophyllene-derived SOA. d DHOPA: 2,3-dihydroxy-4-oxopentanoic acid, a tracer of toluene-derived SOA. e All the quantified organic compounds were converted to their carbon contents to calculate the OC ratios.
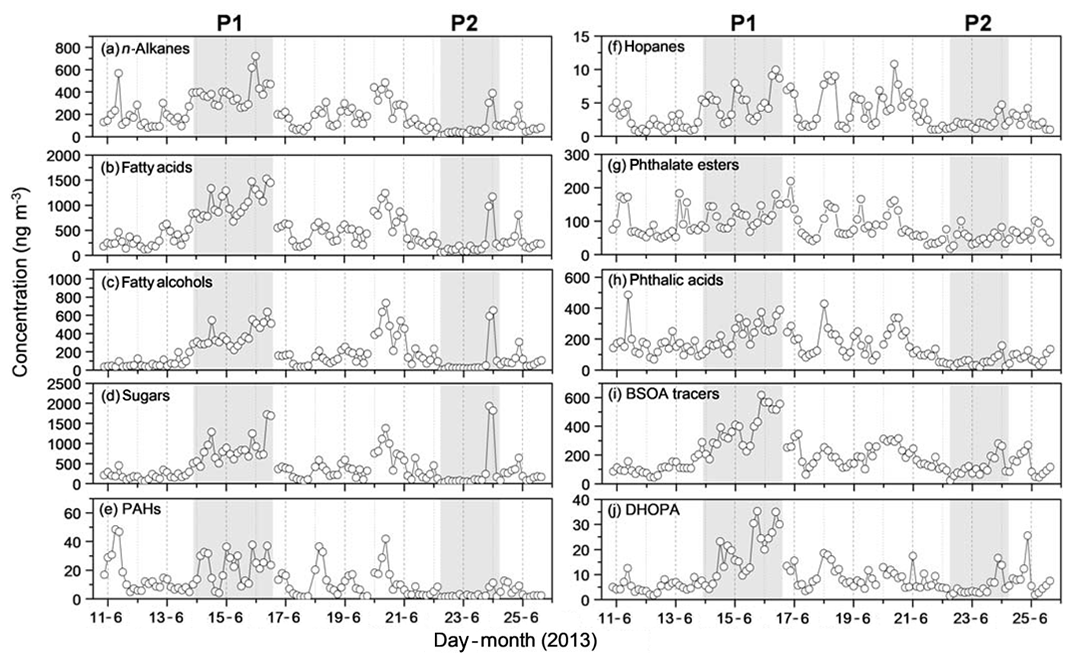
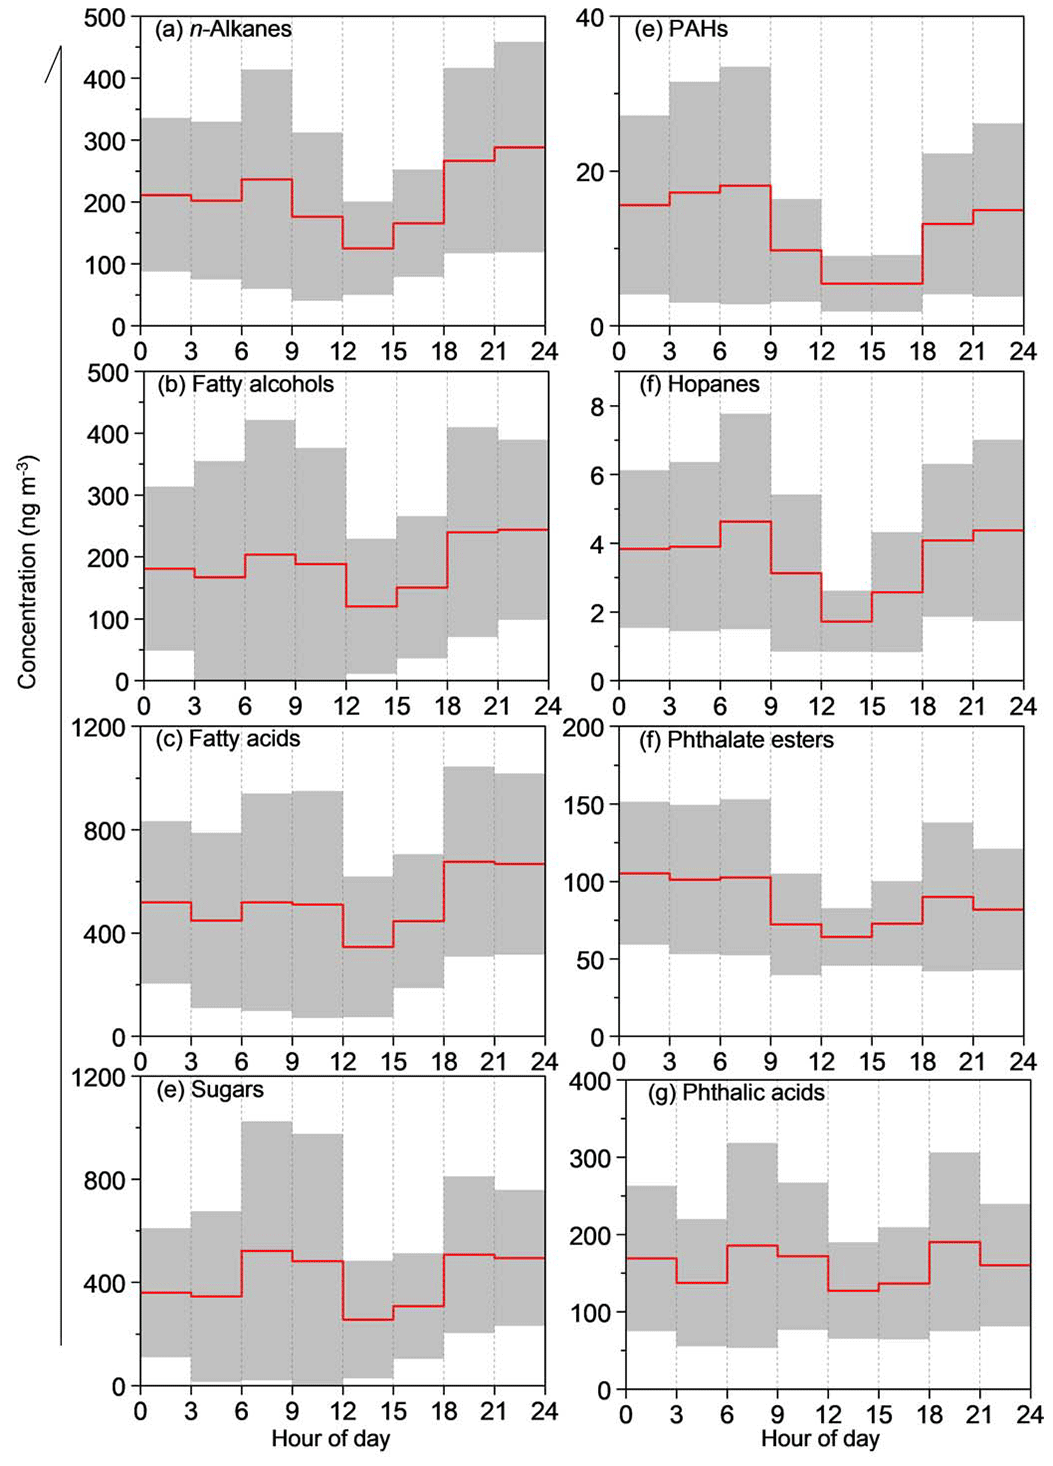
Figure 5Temporal variations of 10 organic compound classes detected in the summertime PM2.5 samples at the rural site of NCP.
3.3.1 Biomass-burning tracers
As described in Sect. 3.1, intensive emissions of open biomass burning were observed in the southern part of NCP during 13–16 June (P1), which is an important reason for the severe regional air pollution during this period. Levoglucosan, which is produced in large quantities during pyrolysis of cellulose, is a key tracer for biomass-burning emissions (Simoneit, 2002; Simoneit et al., 1999). As shown in Table 2, levoglucosan is the most abundant single compound in the whole sampling period, ranging from 5.6 to 1447 ng m−3 with a mean concentration of 240±288 ng m−3. Levoglucosan shows good positive correlations with both OC (R2=0.61) and WSOC (R2=0.65) (Fig. 3), confirming that biomass burning is an important source of both aerosol OC and WSOC in the rural region of NCP during the sampling period. As clearly shown in Fig. 6, the concentrations of levoglucosan present a continual increasing trend during P1 with a mean value of 404±344 ng m−3. However, the tracer presents very low concentrations (11–123 ng m−3) for most of the time during 20–22 June. Interestingly, the concentration of levoglucosan suddenly increased by more than 10 times on 21 June at 18:00 to approximately 1200 ng m−3 within less than 3 h and then decreased to its beginning concentration (less than 100 ng m−3) within 6 h (two samples) afterwards. The concentrations of OC, WSOC, and EC also showed obvious peaks during this event. However, based on analyses of back-trajectories (Fig. 1c) and wind conditions (Fig. S1), no significant change of air mass origins was observed. Also, not all organic markers showed similar variations to levoglucosan. For example, the concentrations of PAHs, hopanes, and phthalate esters changed little during this event. Thus, it is plausible to conclude that this variation was caused by emissions from biomass-burning activities near the sampling site. For this reason, the data of the two samples were excluded from P2.
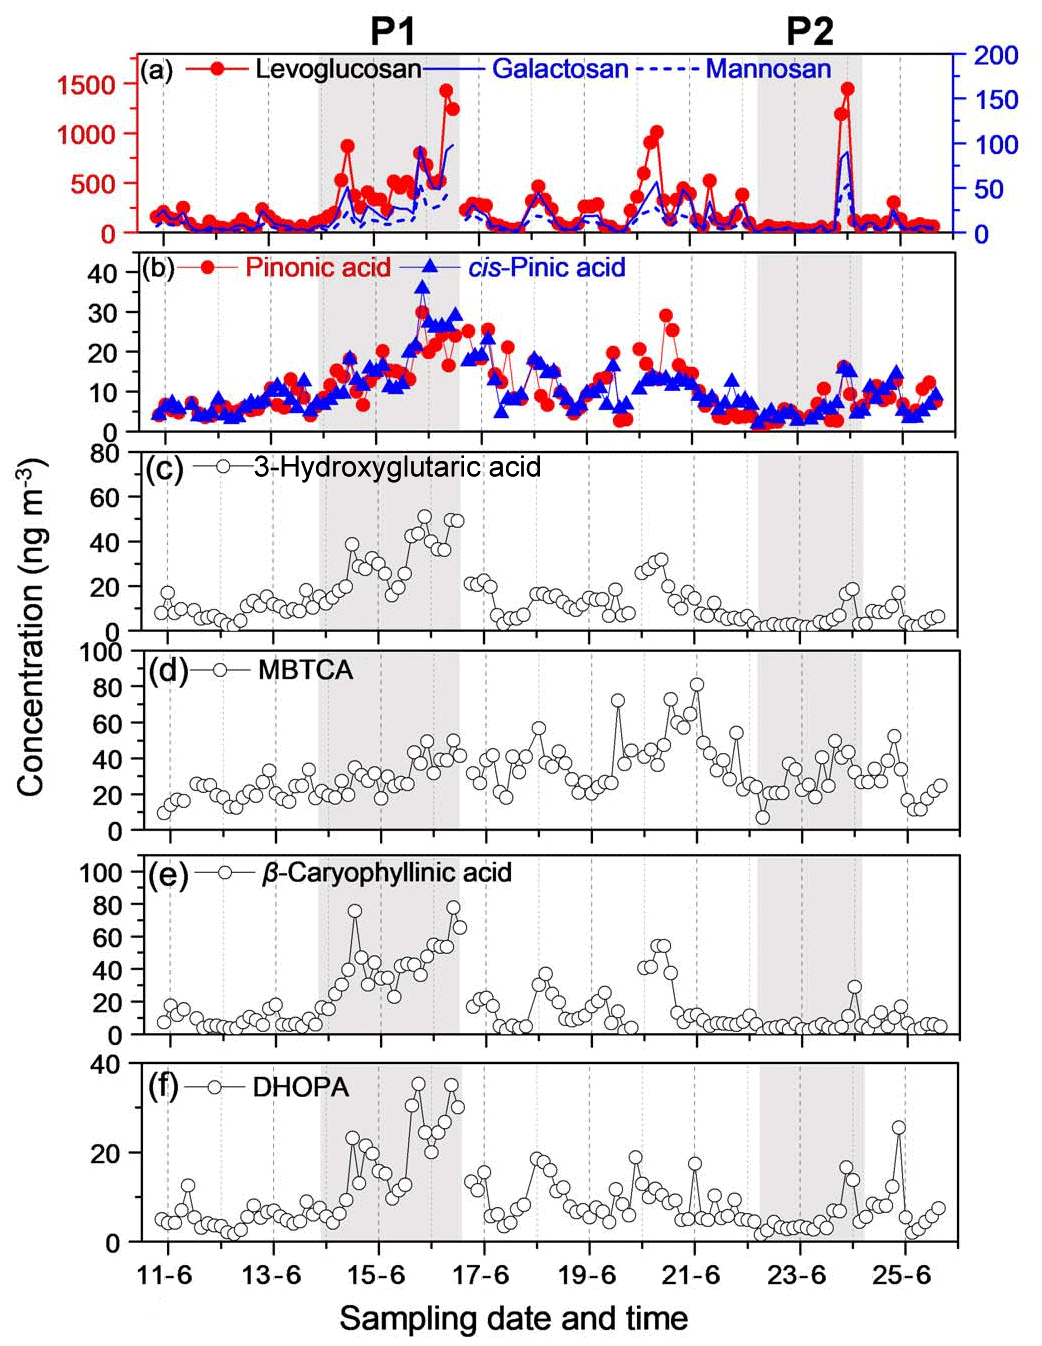
Figure 6Temporal variations of organic tracers for biomass burning (a), and secondary products derived from α-/β-pinene (b–d), β-caryophyllene (e), and toluene (f).
The two isomers of levoglucosan, galactosan and mannosan, are also produced by the pyrolysis of cellulose/hemicelluloses (Simoneit, 2002) and thus also considered important markers of biomass burning. Similar to levoglucosan, the concentrations of these two anhydrosugars in P1 are 5–6 times higher than those in P2. The isomeric ratios of levoglucosan to other anhydrosugars are considered as good indicators of biomass burning. Fabbri et al. (2009) compared the concentrations of the three anhydrosaccharides in the smokes from different fuel types and proposed that levoglucosan ∕ (galactosan+mannosan) (L ∕ G+M) and levoglucosan ∕ mannosan (L ∕ M) values range 0.2–18 and 0.23–33 for various source tests for biomass burning as compared to the average of 54 and 54 for lignites. As shown in Table 2, average ratios of L ∕ G+M and L ∕ M during P1 (10.1±3.41 and 6.77±1.97, respectively) and P2 (29.7±12.2 and 18.0±4.28) suggest that biomass burning is always the dominant contributor for these compounds in the rural area of NCP in summer.
3.3.2 Aliphatic lipid composition
The average concentration of all the n-alkanes (C18–C36) measured in this study is 207±149 ng m−3, with the most abundant individual compound being nonacosane () (Table S1). n-Alkanes derived from terrestrial plants are dominated by high molecular weight (HMW, carbon number >25) species with an odd number preference. In contrast, fossil-fuel-derived n-alkanes do not have odd/even number preference (Rogge et al., 1993a; Simoneit et al., 2004b). In general, n-alkanes with a carbon preference index (CPI, odd/even) more than five are considered as plant wax, while those with a CPI near unity are mostly derived from fossil fuel combustion (Rogge et al., 1993a, b). In this study, the mean value of CPI is 2.47±1.12, indicating that both fossil fuel and plant wax contribute to n-alkanes in the rural areas of NCP in summer. However, n-alkanes show a stronger odd/even carbon number predominance in P1 (CPI of 2.85) than in P2 (CPI of 1.64). In addition, all the low molecular weight (LMW, carbon number <25) n-alkanes present a higher contribution to total n-alkanes in P2 than in P1 (Fig. 7a and d). These results demonstrate that plant waxes from biomass-burning emissions made a bigger contribution to organic aerosols in the sampling region during P1.
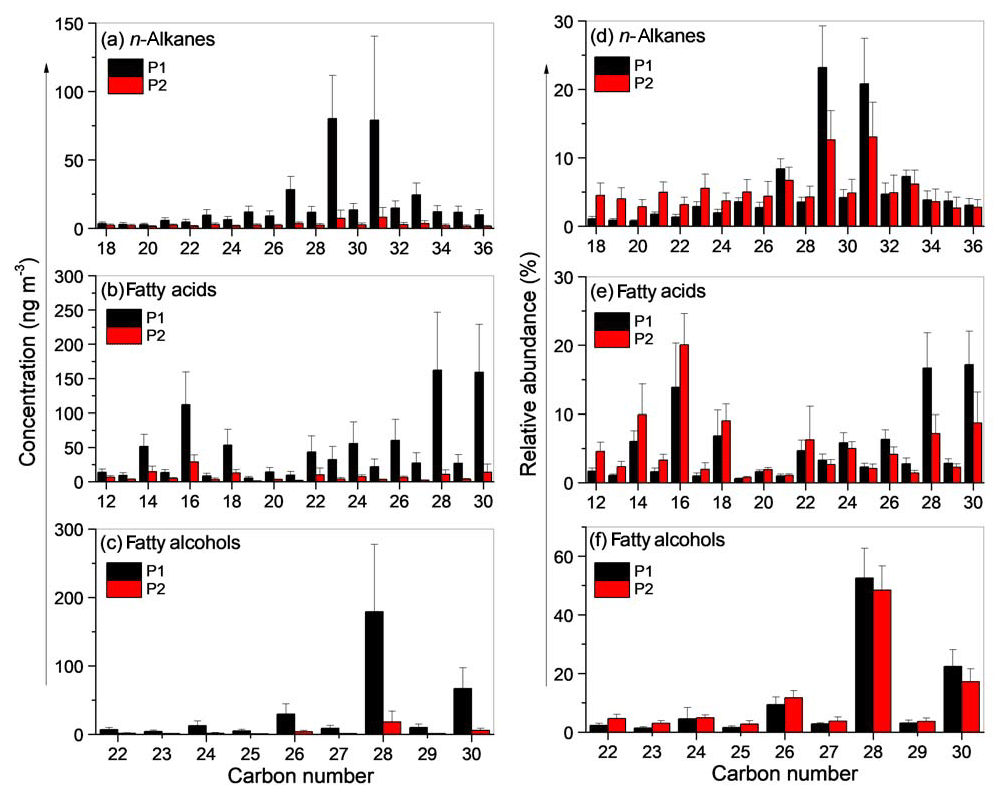
Figure 7Molecular distributions of n-alkanes (a, d), fatty acids (b, e), and fatty alcohols (c, f) in the PM2.5 of the rural area.
A homologous series of 19 saturated fatty acids (C12:0–C32:0) and three unsaturated fatty acids (C16:1, C18:1, and C18:2) were detected (Table S1), and their total concentration is 514±384 ng m−3 during the whole period. A strong even carbon number predominance is observed with Cmax at C28:0 and C16:0 (Table S1). HMW fatty acids (≥C20) are derived from terrestrial plant waxes, while LMW fatty acids (≤C19) have multiple sources such as vascular plants, microbes, and marine phytoplankton as well as kitchen emissions (Rogge et al., 1993b; Kawamura et al., 2003). The total concentrations of fatty acids present similar temporal variation to levoglucosan with a robust linear correlation (R2=0.72) (Fig. 8a), indicating that fatty acids are mostly affected by biomass-burning emission during the whole sampling period. Still, there is some evidence that regional emission from wheat straw burning significantly affected the distribution of fatty acids in the aerosols of Gucheng during P1. Firstly, the total concentrations of fatty acids in P1 (900±358 ng m−3) are more than 6 times higher than those in P2 (145±48 ng m−3). Secondly, the concentrations and relative contributions of HMW fatty acids (C20:0–C32:0) are much higher in P1 than in P2, similar to the results of n-alkanes. In addition, the mean value of CPI of HMW fatty acids in P1 (4.21±1.14) is also higher than that in P2 (3.50±1.64).
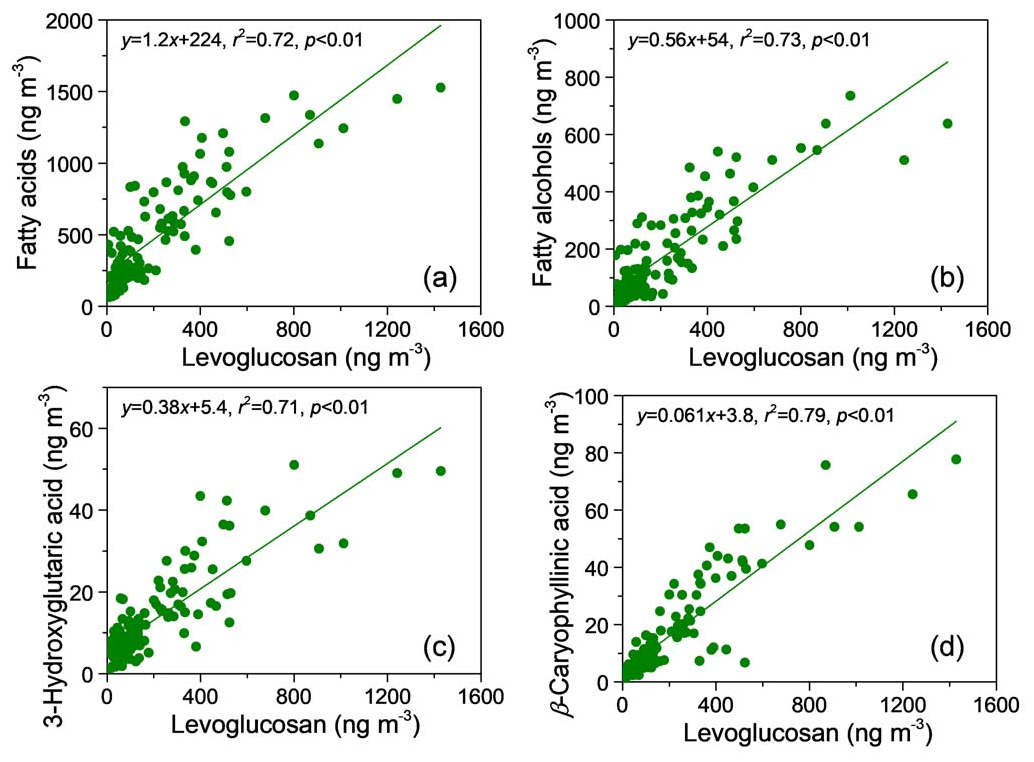
Figure 8Linear correlations of fatty acids (a), fatty alcohols (b), 3-hydroxyglutaric acid (c), and β-caryophyllinic acid (d) with levoglucosan.
Fatty alcohols in the range of C22–C30 were detected for the PM2.5 samples with a mean concentration of 193±187 ng m−3 (Table 2 and S1) during the whole sampling period. Their distributions are characterized by even carbon number predominance with a maximum at C28 (Fig. 7c and f). The total concentration of fatty alcohols strongly correlates with levoglucosan (R2=0.73) (Fig. 8b), suggesting that they can also be emitted from biomass burning. It is reasonable since HMW fatty alcohols (≥C20) are abundantly present in higher plants and loess deposits (Wang and Kawamura, 2005). Similar to fatty acids, nearly 10 times higher concentration of fatty alcohols is observed in P1 (322±151 ng m−3) compared with those in P2 (34±23 ng m−3).
3.3.3 Primary saccharides
In addition to the three anhydrosugars, four primary sugars (fructose, glucose, sucrose, and trehalose) and three sugar alcohols (arabitol, mannitol, and inositol) were detected in the samples. Primary saccharides have been used as biomarkers for primary biota emissions (Wang et al., 2011). Their mean concentrations range from 3.6 to 49 ng m−3 during the whole sampling period. In this study, concentrations of fructose, sucrose, and trehalose in P1 are 7–10 times higher than those in P2 (Table S1). They correlate well with levoglucosan (R2=0.47–0.62, Fig. S3) during P1, in contrast to P2, during which no relationships are found between them. These results indicate that these primary sugars are also affected by open-field emissions of biomass burning during P1. Sugar alcohols, mainly arabitol and mannitol, are abundant in airborne fungal spores (Graham et al., 2002). Some studies suggested that biomass-burning activities can enhance the emission of sugar alcohols at a certain level (Engling et al., 2009; Fu et al., 2012; Yang et al., 2012). However, no significant relationship (R2<0.10) can be found between these sugar alcohols and levoglucosan even in P1, indicating the negligible contribution of biomass burning to the tracers in this study.
3.3.4 PAHs, hopanes, and phthalates
As shown in Fig. 5, the temporal variation of PAHs, hopanes, and phthalate esters were clearly different from those of the molecular tracers for biomass burning, especially in P1. In contrast to the continuous increase of sugars, fatty acids, fatty alcohols, and n-alkanes during P1, the concentrations of PAHs, hopanes, and phthalate esters show obvious day–night variations, indicating that biomass-burning activities contribute little to these species. Phthalates are widely used as plasticizers in synthetic polymers or softeners in polyvinyl chlorides (PVCs) (Simoneit et al., 2004b) and can be directly emitted from the matrix into the air as they are not chemically bonded with the matrix. A total of six phthalate esters were detected in the sampling aerosols, i.e., dimethyl (DMP), diethyl (DEP), diisobutyl (DiBP), butyl isobutyl (BiBP), di-n-butyl (DnBP), and bis(2-ethylhexyl) (BEHP) phthalates (Table S1). The concentrations of total detected phthalate esters in P1 (112±33 ng m−3) are around 2 times only higher than those in P2 (51±18 ng m−3). Hopanes are abundant in coal and crude oils, and enriched in lubricant oil fraction (Oros and Simoneit, 2000; Kawamura et al., 1995). They can be emitted to the atmosphere from coal burning and/or internal combustion of fuel in engines. Only two dominant hopanes, 17α(H),21β(H)-30-norhopane(C29αβ) and 17α(H),21β(H)-hopane(C30αβ), were detected in all of the samples in this study. Their average concentration in P1 (4.40±2.48 ng m−3) is ∼2.5 times of that in P2 (1.81±0.31 ng m−3). Considering the much higher concentrations of levoglucosan in P1 (on average ∼8 times higher than in P2), these results again confirm a limited influence of biomass burning on concentrations of phthalate esters and hopanes in the aerosols in the rural region. Thus, there were no significant concentration changes of the two species on 21 June at 18:00–24:00, when the air masses were highly affected by nearby biomass-burning activities.
PAHs are the products of incomplete combustion of carbon-containing materials and are of high toxicity and carcinogenicity (Halek et al., 2008; Sultan et al., 2001). Previous studies indicated that PAHs are mainly emitted from coal burning and vehicle exhaust in most areas of China (Wang et al., 2006a). However, it has been reported that combustion of biomass materials can also contribute to the PAHs in the atmosphere (Simoneit, 2002; Ge et al., 2012; Young et al., 2016). In this study, PAH has no significant correlation with levoglucosan during the whole sampling period. Yet the concentrations of total PAHs in P1 (18.6±11 ng m−3) are nearly 8 times higher than those in P2 (2.3±1.0 ng m−3). These results suggest that although the emission of biomass burning is not the most important source for PAHs during the entire period, the intensive regional burning of wheat straw in P1 can also enhance the PAH concentration in the atmosphere of Gucheng.
As shown in Fig. 9, all the primary aerosol markers mentioned above show lower concentrations in daytime with lowest concentrations in the afternoon (12:00–18:00 CST), consistent with the favorable dispersion conditions caused by high temperature and planetary boundary layer (PBL) height. However, the day–night variation of PAHs, hopanes, and phthalate esters are more obvious than other species, again confirming the lower contribution of biomass burning to these organic compositions.
3.3.5 SOA tracers
Overall, eight compounds were identified as isoprene oxidation products in the PM2.5 samples, including two methyltetrahydrofuran diols, three C5-alkene triols, two 2-methyltetrols, and 2-methylglyceric acid (Table S1). Detailed information about formation and contribution of these compositions was discussed in our previous paper (Li et al., 2018). The concentrations of total detected isoprene-derived products are 112±86 ng m−3, with much higher concentration in P1 (209±105 ng m−3) than in P2 (57±29 ng m−3).
cis-Pinonic acid (PNA), pinic acid (PA), 3-hydroxyglutaric acid (HGA), and 3-methyl-1,2,3-butanetricarboxylic acid (MBTCA) were detected as tracers for α-/β-pinene oxidation in this study, and their concentrations are shown in Table S1. The concentration of total detected α-/β-pinene oxidation tracers is 66±31 ng m−3, with MBTCA (31±14 ng m−3) being the major compound during the whole sampling period. PNA and PA are considered as first-generation products of α-/β-pinene oxidation. They can be produced by further oxidation of carbonyl-substituted Criegee intermediates formed by α-pinene ozonolysis (Jenkin et al., 2000; Ma et al., 2008), or by OH oxidation of α-pinene under NOx-free conditions (Eddingsaas et al., 2012; Xuan et al., 2015). The formation of 3-HGA is supposed to be based on a ring-opening mechanism and may be related to a heterogeneous reaction of these monoterpenes with irradiation in the presence of NOx (Jaoui et al., 2005; Claeys et al., 2007). As shown in Fig. 6b–d, PNA, PA, and HGA present similar temporal variations and correlated well with each other (R2=0.48–0.76, Fig. S4). The formation of MBTCA is explained by further photodegradation of cis-pinonic acid and pinic acid with an OH radical (Müller et al., 2012; Szmigielski et al., 2007). As a later-generation oxidation product, MBTCA shows an obviously different temporal variation profile than those of PNA and PA, and has no significant increase during P1. In addition, the concentrations of PNA, PA, and HGA in P1 are 2–8 times higher than those in P2. However, the concentrations of MBTCA in the two periods are comparable. These results are consistent with the longer timescales of formation pathway, lower volatility, and longer lifetime of MBTCA in the atmosphere compared to the first-generation products of α-/β-pinene oxidation. β-Caryophyllinic acid, formed either by ozonolysis or photooxidation of β-caryophyllene (a sesquiterpene) (Jaoui et al., 2007), was also determined in this study, and its concentration ranges from 0.49 to 78 ng m−3 (average of 17±17 ng m−3). The mean concentration of β-caryophyllinic acid in P1 is 35±21 ng m−3, 5 times higher than that in P2 (4.1±1.2 ng m−3).
Undoubtedly, the combustion of biomass materials can release a large amount of VOCs, including isoprene and terpenoids (Andreae and Merlet, 2001). As shown in Figs. 5 and 6, total biogenic SOA tracers, the sum of detected tracers of isoprene, α-/β-pinene, and β-caryophyllene-derived SOA, show a similar temporal variation pattern as levoglucosan with a moderate correlation (R2=0.56, Fig. S5a). Specifically, levoglucosan shows strong linearly correlations with 3-hydroxyglutaric acid (R2=0.72) (Fig. 8c) and β-caryophyllinic acid (R2=0.80) (Fig. 8d), indicating a significant contribution of biomass-burning emissions to the formation of SOA derived from mono- and sesquiterpene oxidation. In our previous paper (Li et al., 2018), we discussed the different diurnal variations of isoprene-derived SOA tracers. In this study, the diurnal variations of other SOA tracers are shown in Fig. 10. All the SOA tracers present weaker day–night variations compared to primary organic aerosol markers because of the competition between the enhanced daytime formation by photooxidation and the nighttime accumulation associated with a low PBL. Yet, there are some differences between these SOA tracers. For example, PNA and PA present lowest concentrations in the afternoon (12:00–18:00) due to their relatively high volatilities, which is unfavorable for gas-to-particle phase partitioning. However, the later-generation product of PNA and PA, i.e., the less volatile MBTCA, continuously increases during the daytime.
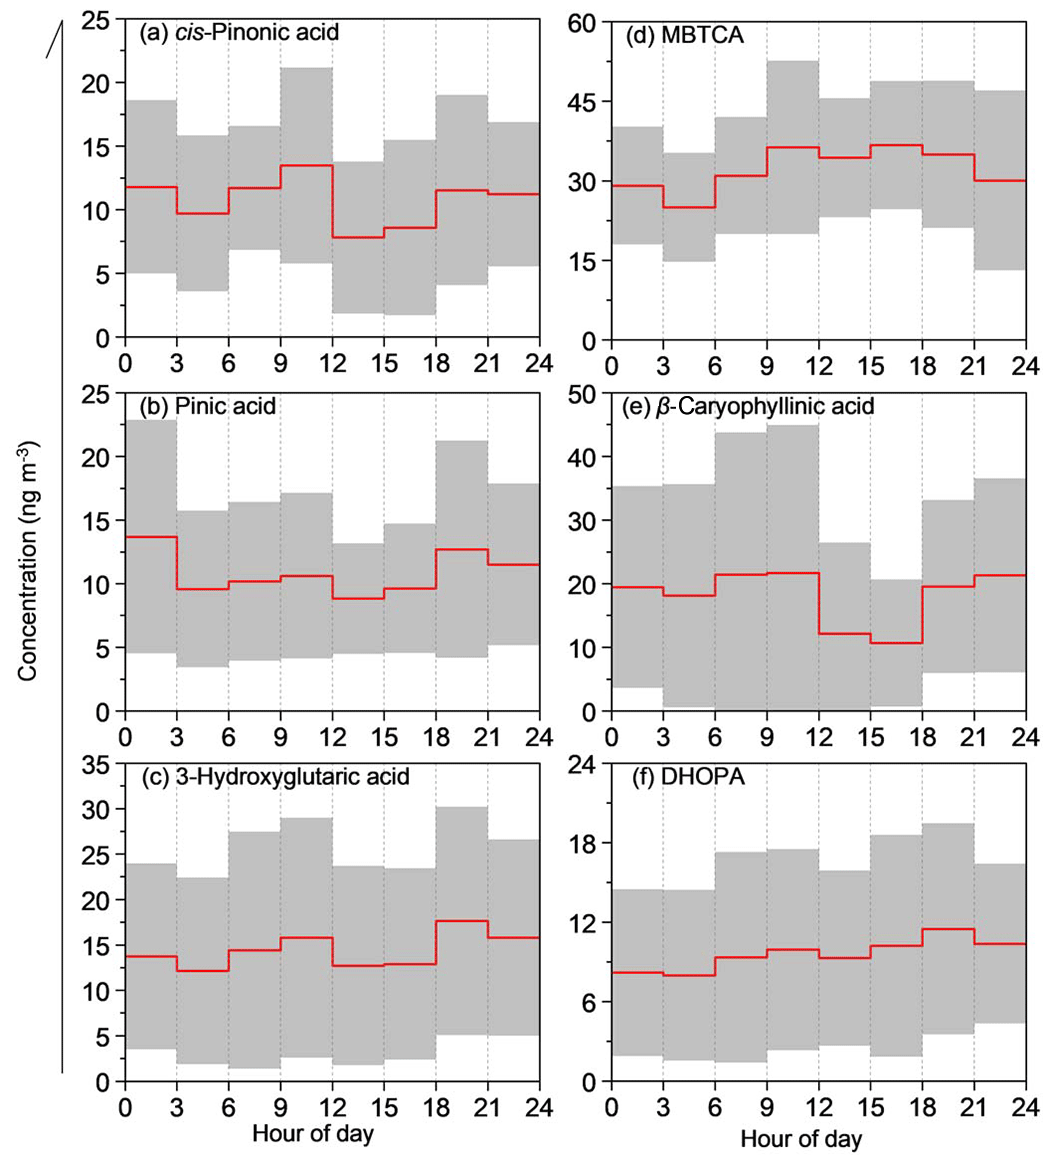
Figure 10Diurnal variation of the SOA tracers derived from oxidation of α-/β-pinene (a–d), β-caryophyllene (e), and toluene (f).
Two classes of aromatic SOA markers, phthalic acids and 2,3-dihydroxy-4-oxopentanoic acid (DHOPA), were detected in the samples as well. Phthalic acids are believed to be produced by the oxidation of naphthalene and other PAHs (Kawamura et al., 2005; Kawamura and Ikushima, 1993; Kanakidou et al., 2005). The mean concentrations of total phthalic acids in the whole sampling period range from 17 to 487 ng m−3 with a mean value of 155±94 ng m−3. Their different temporal variation patterns than levoglucosan suggest that biomass-burning emission contributes little to phthalic acid formation in the region. The DHOPA was considered to be a tracer compound for toluene-derived SOA (Kleindienst et al., 2004). DHOPA presents a similar temporal variation and a moderate correlation with levoglucosan (R2=0.51, Fig. S5b), indicating a certain contribution of biomass burning. Similar to MBTCA, the volatility of DHOPA is quite low and thus mainly exists in the particle phase at field temperature (Ding et al., 2017). Thus, DHOPA shows a similar diurnal variation to MBTCA, with higher concentrations during daytime.
3.4 Assessment of source contributions
In order to investigate the differences in organic aerosol sources between the two representative periods, we classified all the measured organic compounds into seven different sources: (a) “plant emission” represented by higher plant wax n-alkanes, HMW fatty acids and fatty alcohols (≥C20); (b) “fossil fuel combustion” mainly represented by fossil-fuel-derived n-alkanes, hopanes, and PAHs; (c) “biomass burning” represented by levoglucosan and its isomers; (d) “marine/microbial source” represented by LMW fatty acids (< C20); (e) “soil/fungal spore/pollen” represented by primary saccharides and sugar alcohols; (f) “plastic emission” represented by phthalate esters; and (g) “secondary oxidation” represented by biogenic SOA tracers, DHOPA, and phthalic acids. The concentrations of individual classes and their contributions to OC content during P1 and P2 are summarized in Fig. 11. Plant emission-derived compounds accounted for a larger fraction of PM2.5 OC during P1 than during P2 (mean fractions of 28.7±9.3 ‰ in P1 vs. 16.5±7.2 ‰ in P2). The average faction of biomass-burning-derived organics in P1 (6.0±3.9 ‰) is also higher than that in P2 (4.6±2.1 ‰), as are organics derived from soil/fungal spore/pollen. However, organic molecules from the other four sources present a higher contribution to OC in P2 than in P1.
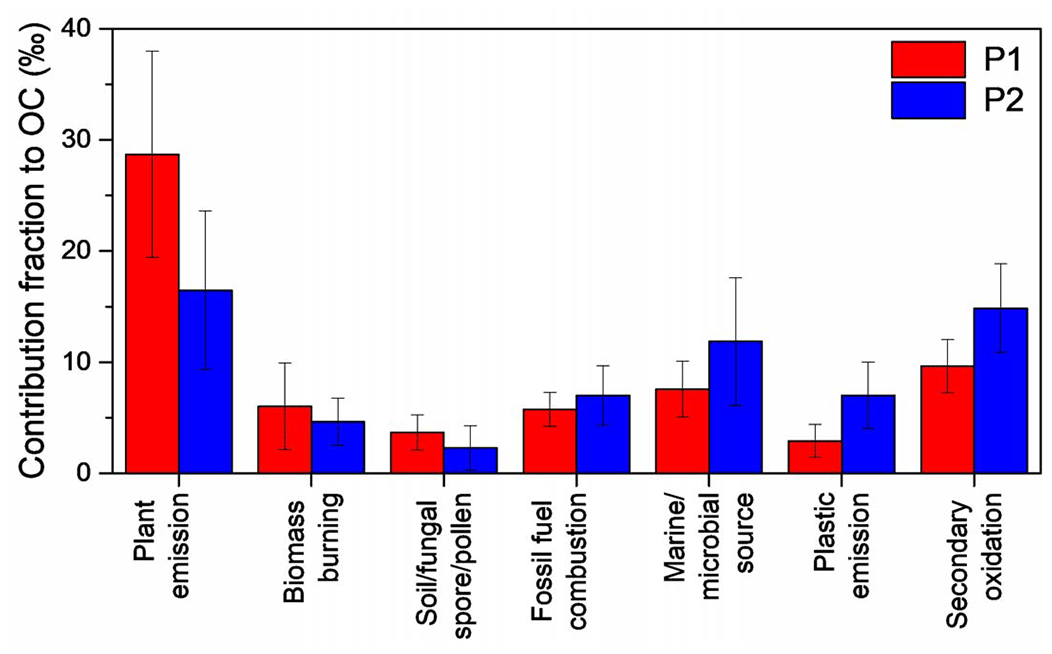
Figure 11A comparison of the average contributions of different source-derived organics (converted to carbon content) to OC during P1 and P2.
Since organic compounds in the PM2.5 samples cannot be completely determined and some of them are of different sources, the above classification based on the measured compounds could result in certain uncertainty in assessing source contributions (Simoneit et al., 2004b). Here, we further used a tracer-based source apportionment method to quantitatively estimate the contributions of primary and secondary sources to the fine particulate OC at the rural site. As described above, two samples collected on 21 June at 18:00–24:00 were considered to be highly affected by the direct emission from biomass burning near the sampling site. Thus, the average OC ∕ levoglucosan ratio in the smoke of biomass burning ((OC / Levo)BB) can be estimated by using the following equation:
where OCn and Levon are the average concentrations of OC and levoglucosan in the two PM2.5 samples affected by the nearby sources. OCbefore and Levobefore are the concentrations of OC and levoglucosan in the samples collected before the event, while OCafter and Levoafter are the concentrations of OC and levoglucosan in the samples collected after the event. The mean values in the “before” and the “after” samples were subtracted to minimize the influence of local background contribution. The calculated (OC / Levo)BB in this study is 18.7, which is somewhat higher than the average value of 12.1 measured in PM2.5 aerosols emitted from the burning of three types of cereal straws (i.e., wheat, maize, and rice) in China (Y. Zhang et al., 2007). This difference can be attributed to the differences of burning conditions. For other sources, the measured concentrations of mannitol were used to calculate the contributions of fungal spores to OC (Bauer et al., 2008), and SOA tracers were used to estimate the SOC formed from the oxidation of isoprene, α-/β-pinene, β-caryophyllene, and toluene (Kleindienst et al., 2007). Also, these tracer-based approaches tend to have large uncertainties, especially for SOC estimation (Li et al., 2013a). However, our results are still meaningful to understand the relative abundances of organic aerosols from these sources in different periods.
As shown in Fig. 12, biomass-burning-derived OC, ranging from 0.11 to 27.5 µg C m−3, is the dominant source, which accounts for 1.16 %–74.8 % (average of 22.6 %) of OC in the aerosols of the rural region during the whole sampling period. Fungal-spore-derived OC (0.003–5.12 µg C m−3) is a minor source, only accounting for 0.43 % (0.003 %–5.12 %) of OC. The contribution of total SOC derived from oxidation of isoprene, α-/β-pinene, β-caryophyllene, and toluene to OC ranged from 5.90 % to 34.1 % with an average of 16.7 %. Among the four SOC precursors, toluene-derived products account for 7.78 % (2.06 %–21.7 %) of OC, being the most important SOC contributor. The relative abundances of these sources show clear temporal variations during the whole sampling period (Fig. 12). The contribution of biomass-burning-derived OC to total OC in P1 (27.6 %) is 1.7 times that in P2 (17.1 %) (Fig. 13), further indicating the strong regional impact of open-field wheat straw burning on the molecular compositions of organic aerosols in the rural area of NCP. The contribution of SOC from oxidation of the four VOCs increases slightly from P1 (16.3 %) to P2 (21.1 %). It should be noted that biomass burning can also release a large amount of VOCs, which may produce more secondary organic aerosols during the long-range transport. Thus, the impact of intensive biomass burning in the southern region of NCP on organic aerosols in the Gucheng area is likely even stronger than the estimation presented above with implications for regional climate.
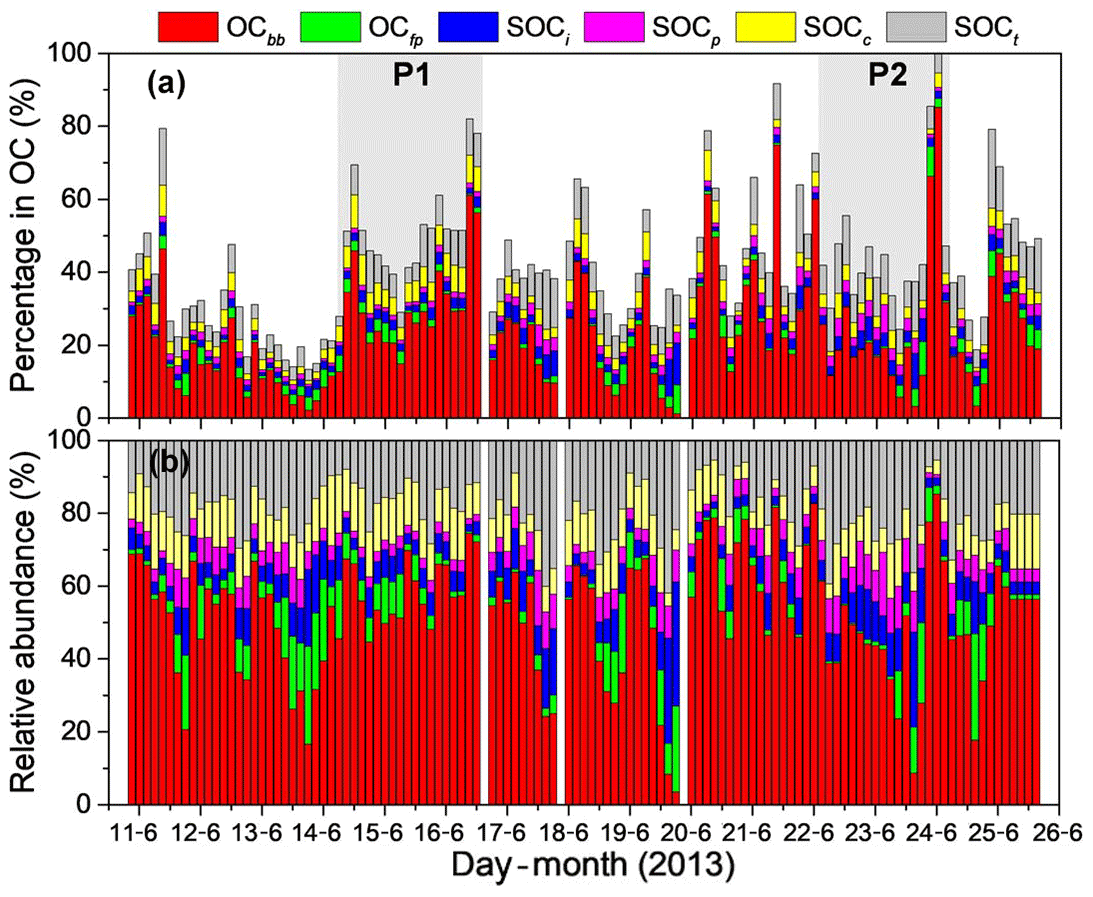
Figure 12Contributions (a) of primary organic carbon from biomass burning (OCbb) and fungal spores (OCfp), and secondary organic carbon from isoprene (SOCi), α-/β-pinene (SOCp), β-caryophyllene (SOCp), and toluene (SOCt) to OC in the time-resolved (3 h) rural aerosols, and their relative abundances (b). All the contributions were estimated by the tracer-based method.
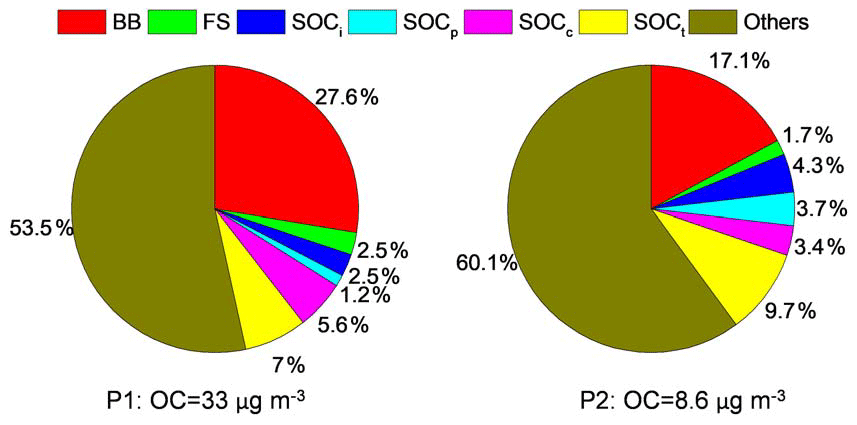
Figure 13Average contributions of direct emissions from biomass burning (BB) and fungal spores (OCfp), secondary oxidation from isoprene (SOCi), α-/β-pinene (SOCp), β-caryophyllene (SOCp), and toluene (SOCt) to OC in P1 and P2. All the contributions were estimated by the tracer-based method.
During the entire sampling period, OC and WSOC showed strong positive correlations with levoglucosan, and the diurnal variation of WSOC ∕ OC was similar to that of levoglucosan ∕ OC, suggesting that summertime organic aerosols in the rural area of NCP are highly affected by direct emission of BB. Higher relative abundances and CPI values of HMW n-alkanes, fatty acids, and fatty alcohols in P1 indicated an enhanced effect of open-field biomass burning on molecular composition of organic aerosols. PAHs, hopanes, and phthalate esters presented different temporal and diurnal variations to levoglucosan because of the lower contribution of BB to these organic compositions. The total biogenic SOA tracers showed a similar temporal variation and a moderate correlation with levoglucosan, demonstrating the enhancing effect of BB emission on biogenic SOA (BSOA) formation. Later-generation SOA products, e.g., MBTCA in this study, were unlikely affected directly by BB emission and thus showed little changes in concentrations between the two periods. The source distribution results derived using a tracer-based method demonstrated that the contribution of BB to organic aerosols increased by more than 50 % during the period influenced by regional open-field biomass burning (P1) compared to the period when local emissions were more dominant (P2). However, this contribution may even be underestimated since BB can also release a large amount of VOCs enhancing the formation of SOA in the atmosphere. Our results confirmed that intensive field burning of biomass fuels can significantly influence the concentration and composition of aerosols and thus affect atmospheric chemistry and climate on a regional scale.
Data are available by contacting the corresponding authors.
The supplement related to this article is available online at: https://doi.org/10.5194/acp-19-10481-2019-supplement.
GW designed the experiment. GW, TZ, and LZ arranged the sample collection. JiaL and GW collected the samples. JiaL, GW, JinL, CW, and WJ analyzed the samples. JiaL and GW performed the data interpretation. JiaL, GW, and QZ wrote the paper.
The authors declare that they have no conflict of interest.
This article is part of the special issue “Regional transport and transformation of air pollution in eastern China”. It is not associated with a conference.
The authors gratefully acknowledge the use of fire spot data products from the Land, Atmosphere Near real-time Capability for EOS (LANCE) system operated by the NASA/GSFC/Earth Science Data and Information System (ESDIS) with funding provided by NASA/HQ (https://firms.modaps.eosdis.nasa.gov), and the NOAA Air Resources Laboratory (ARL) for the provision of the HYSPLIT transport and dispersion model and/or READY website (http://www.ready.noaa.gov, last access: 28 December 2018) used in this publication.
This research has been supported by the National Nature Science Foundation of China (grant nos. 41773117, 91543116, 41405122).
This paper was edited by Luisa Molina and reviewed by three anonymous referees.
Aggarwal, S. G., Kawamura, K., Umarji, G. S., Tachibana, E., Patil, R. S., and Gupta, P. K.: Organic and inorganic markers and stable C-, N-isotopic compositions of tropical coastal aerosols from megacity Mumbai: sources of organic aerosols and atmospheric processing, Atmos. Chem. Phys., 13, 4667–4680, https://doi.org/10.5194/acp-13-4667-2013, 2013.
Andreae, M. O. and Merlet, P.: Emission of trace gases and aerosols from biomass burning, Global Biogeochem. Cy., 15, 955–966, https://doi.org/10.1029/2000gb001382, 2001.
Andreae, M. O. and Rosenfeld, D.: Aerosol–cloud–precipitation interactions. Part 1. The nature and sources of cloud-active aerosols, Earth-Sci. Rev., 89, 13–41, https://doi.org/10.1016/j.earscirev.2008.03.001, 2008.
Bauer, H., Claeys, M., Vermeylen, R., Schueller, E., Weinke, G., Berger, A., and Puxbaum, H.: Arabitol and mannitol as tracers for the quantification of airborne fungal spores, Atmos. Environ., 42, 588–593, https://doi.org/10.1016/j.atmosenv.2007.10.013, 2008.
Chan, M. N., Choi, M. Y., Ng, N. L., and Chan, C. K.: Hygroscopicity of water-soluble organic compounds in atmospheric aerosols: Amino acids and biomass burning derived organic species, Environ. Sci. Technol., 39, 1555–1562, https://doi.org/10.1021/es049584l, 2005.
Claeys, M., Szmigielski, R., Kourtchev, I., Van der Veken, P., Vermeylen, R., Maenhaut, W., Jaoui, M., Kleindienst, T. E., Lewandowski, M., Offenberg, J. H., and Edney, E. O.: Hydroxydicarboxylic Acids:? Markers for Secondary Organic Aerosol from the Photooxidation of α-Pinene, Environ. Sci. Technol., 41, 1628–1634, https://doi.org/10.1021/es0620181, 2007.
Dinar, E., Anttila, T., and Rudich, Y.: CCN activity and hygroscopic growth of organic aerosols following reactive uptake of ammonia, Environ. Sci. Technol., 42, 793–799, https://doi.org/10.1021/es071874p, 2008.
Ding, X., Zhang, Y. Q., He, Q. F., Yu, Q. Q., Wang, J. Q., Shen, R. Q., Song, W., Wang, Y. S., and Wang, X. M.: Significant Increase of Aromatics-Derived Secondary Organic Aerosol during Fall to Winter in China, Environ. Sci. Technol., 51, 7432–7441, https://doi.org/10.1021/acs.est.6b06408, 2017.
Eddingsaas, N. C., Loza, C. L., Yee, L. D., Chan, M., Schilling, K. A., Chhabra, P. S., Seinfeld, J. H., and Wennberg, P. O.: α-pinene photooxidation under controlled chemical conditions – Part 2: SOA yield and composition in low- and high-NOx environments, Atmos. Chem. Phys., 12, 7413–7427, https://doi.org/10.5194/acp-12-7413-2012, 2012.
Engling, G., Lee, J. J., Tsai, Y. W., Lung, S. C. C., Chou, C. C. K., and Chan, C. Y.: Size-Resolved Anhydrosugar Composition in Smoke Aerosol from Controlled Field Burning of Rice Straw, Aerosol Sci. Tech., 43, 662–672, https://doi.org/10.1080/02786820902825113, 2009.
Fabbri, D., Torri, C., Simoneit, B. R. T., Marynowski, L., Rushdi, A. I., and Fabiańska, M. J.: Levoglucosan and other cellulose and lignin markers in emissions from burning of Miocene lignites, Atmos. Environ., 43, 2286–2295, 2009.
Fu, P. Q., Kawamura, K., Pavuluri, C. M., Swaminathan, T., and Chen, J.: Molecular characterization of urban organic aerosol in tropical India: contributions of primary emissions and secondary photooxidation, Atmos. Chem. Phys., 10, 2663–2689, https://doi.org/10.5194/acp-10-2663-2010, 2010.
Fu, P. Q., Kawamura, K., Chen, J., Li, J., Sun, Y. L., Liu, Y., Tachibana, E., Aggarwal, S. G., Okuzawa, K., Tanimoto, H., Kanaya, Y., and Wang, Z. F.: Diurnal variations of organic molecular tracers and stable carbon isotopic composition in atmospheric aerosols over Mt. Tai in the North China Plain: an influence of biomass burning, Atmos. Chem. Phys., 12, 8359–8375, https://doi.org/10.5194/acp-12-8359-2012, 2012.
Ge, X., Setyan, A., Sun, Y., and Zhang, Q.: Primary and secondary organic aerosols in Fresno, California during wintertime: Results from high resolution aerosol mass spectrometry, J. Geophys. Res.-Atmos., 117, D19301, https://doi.org/10.1029/2012jd018026, 2012.
Graham, B., Mayol-Bracero, O. L., Guyon, P., Roberts, G. C., Decesari, S., Facchini, M. C., Artaxo, P., Maenhaut, W., Koll, P., and Andreae, M. O.: Water-soluble organic compounds in biomass burning aerosols over Amazonia – 1. Characterization by NMR and GC-MS, J. Geophys. Res.-Atmos., 107, 8047, https://doi.org/10.1029/2001JD000336, 2002.
Guo, S., Hu, M., Zamora, M. L., Peng, J., Shang, D., Zheng, J., Du, Z., Wu, Z., Shao, M., Zeng, L., Molina, M. J., and Zhang, R.: Elucidating severe urban haze formation in China, P. Natl. Acad. Sci. USA, 111, 17373–17378, https://doi.org/10.1073/pnas.1419604111, 2014.
Halek, F., Nabi, G., and Kavousi, A.: Polycyclic aromatic hydrocarbons study and toxic equivalency factor (TEFs) in Tehran, IRAN, Environ. Monit. Assess., 143, 303–311, https://doi.org/10.1007/s10661-007-9983-9, 2008.
Hallquist, M., Wenger, J. C., Baltensperger, U., Rudich, Y., Simpson, D., Claeys, M., Dommen, J., Donahue, N. M., George, C., Goldstein, A. H., Hamilton, J. F., Herrmann, H., Hoffmann, T., Iinuma, Y., Jang, M., Jenkin, M. E., Jimenez, J. L., Kiendler-Scharr, A., Maenhaut, W., McFiggans, G., Mentel, Th. F., Monod, A., Prévôt, A. S. H., Seinfeld, J. H., Surratt, J. D., Szmigielski, R., and Wildt, J.: The formation, properties and impact of secondary organic aerosol: current and emerging issues, Atmos. Chem. Phys., 9, 5155–5236, https://doi.org/10.5194/acp-9-5155-2009, 2009.
Hays, M. D., Fine, P. M., Geron, C. D., Kleeman, M. J., and Gullett, B. K.: Open burning of agricultural biomass: Physical and chemical properties of particle-phase emissions, Atmos. Environ., 39, 6747–6764, https://doi.org/10.1016/j.atmosenv.2005.07.072, 2005.
Huang, R. J., Zhang, Y. L., Bozzetti, C., Ho, K. F., Cao, J. J., Han, Y. M., Daellenbach, K. R., Slowik, J. G., Platt, S. M., Canonaco, F., Zotter, P., Wolf, R., Pieber, S. M., Bruns, E. A., Crippa, M., Ciarelli, G., Piazzalunga, A., Schwikowski, M., Abbaszade, G., Schnelle-Kreis, J., Zimmermann, R., An, Z. S., Szidat, S., Baltensperger, U., El Haddad, I., and Prevot, A. S. H.: High secondary aerosol contribution to particulate pollution during haze events in China, Nature, 514, 218–222, https://doi.org/10.1038/nature13774, 2014.
Jaoui, M., Kleindienst, T. E., Lewandowski, M., Offenberg, J. H., and Edney, E. O.: Identification and quantification of aerosol polar oxygenated compounds bearing carboxylic or hydroxyl groups. 2. Organic tracer compounds from monoterpenes, Environ. Sci. Technol., 39, 5661–5673, https://doi.org/10.1021/es048111b, 2005.
Jaoui, M., Lewandowski, M., Kleindienst, T. E., Offenberg, J. H., and Edney, E. O.: β-caryophyllinic acid: An atmospheric tracer for β-caryophyllene secondary organic aerosol, Geophys. Res. Lett., 34, L05816, https://doi.org/10.1029/2006GL028827, 2007.
Jenkin, M. E., Shallcross, D. E., and Harvey, J. N.: Development and application of a possible mechanism for the generation of cis -pinic acid from the ozonolysis of α- and β-pinene, Atmos. Environ., 34, 2837–2850, 2000.
Jimenez, J. L., Canagaratna, M. R., Donahue, N. M., Prevot, A. S. H., Zhang, Q., Kroll, J. H., Decarlo, P. F., Allan, J. D., Coe, H., and Ng, N. L.: Evolution of organic aerosols in the atmosphere, Science, 326, 1525–1529, 2009.
Kanakidou, M., Seinfeld, J. H., Pandis, S. N., Barnes, I., Dentener, F. J., Facchini, M. C., Van Dingenen, R., Ervens, B., Nenes, A., Nielsen, C. J., Swietlicki, E., Putaud, J. P., Balkanski, Y., Fuzzi, S., Horth, J., Moortgat, G. K., Winterhalter, R., Myhre, C. E. L., Tsigaridis, K., Vignati, E., Stephanou, E. G., and Wilson, J.: Organic aerosol and global climate modelling: a review, Atmos. Chem. Phys., 5, 1053–1123, https://doi.org/10.5194/acp-5-1053-2005, 2005.
Kawamura, K. and Ikushima, K.: Seasonal changes in the distribution of dicarboxylic acids in the urban atmosphere, Environ. Sci. Technol., 27, 2227–2235, 1993.
Kawamura, K., Kosaka, M., and Sempere, R.: Distributions and seasonal changes in hydrocarbons in urban aerosols and rain waters, Chikyu Kagaku (Geochemistry), 29, 1–15, 1995 (in Japanese).
Kawamura, K., Ishimura, Y., and Yamazaki, K.: Four years' observations of terrestrial lipid class compounds in marine aerosols from the western North Pacific, Global Biogeochem. Cy., 17, 1003, https://doi.org/10.1029/2001gb001810, 2003.
Kawamura, K., Imai, Y., and Barrie, L. A.: Photochemical production and loss of organic acids in high Arctic aerosols during long-range transport and polar sunrise ozone depletion events, Atmos. Environ., 39, 599–614, https://doi.org/10.1016/j.atmosenv.2004.10.020, 2005.
Kleindienst, T. E., Conver, T. S., McIver, C. D., and Edney, E. O.: Determination of secondary organic aerosol products from the photooxidation of toluene and their implications in ambient PM2.5, J. Atmos. Chem., 47, 79–100, 2004.
Kleindienst, T. E., Jaoui, M., Lewandowski, M., Offenberg, J. H., Lewis, C. W., Bhave, P. V., and Edney, E. O.: Estimates of the contributions of biogenic and anthropogenic hydrocarbons to secondary organic aerosol at a southeastern US location, Atmos. Environ., 41, 8288–8300, https://doi.org/10.1016/j.atmosenv.2007.06.045, 2007.
Kondo, Y., Miyazaki, Y., Takegawa, N., Miyakawa, T., Weber, R. J., Jimenez, J. L., Zhang, Q., and Worsnop, D. R.: Oxygenated and water-soluble organic aerosols in Tokyo, J. Geophys. Res., 112, D01203, https://doi.org/10.1029/2006jd007056, 2007.
Lelieveld, J., Evans, J. S., Fnais, M., Giannadaki, D., and Pozzer, A.: The contribution of outdoor air pollution sources to premature mortality on a global scale, Nature, 525, 367–371, https://doi.org/10.1038/nature15371, 2015.
Li, J. J., Wang, G. H., Cao, J. J., Wang, X. M., and Zhang, R. J.: Observation of biogenic secondary organic aerosols in the atmosphere of a mountain site in central China: temperature and relative humidity effects, Atmos. Chem. Phys., 13, 11535–11549, https://doi.org/10.5194/acp-13-11535-2013, 2013a.
Li, J. J., Wang, G. H., Wang, X. M., Cao, J. J., Sun, T., Cheng, C. L., Meng, J. J., Hu, T. F., and Liu, S. X.: Abundance, composition and source of atmospheric PM2.5 at a remote site in the Tibetan Plateau, China, Tellus B, 65, 20281, https://doi.org/10.3402/tellusb.v65i0.20281, 2013b.
Li, J. J., Wang, G. H., Wu, C., Cao, C., Ren, Y. Q., Wang, J. Y., Li, J., Cao, J. J., Zeng, L. M., and Zhu, T.: Characterization of isoprene-derived secondary organic aerosols at a rural site in North China Plain with implications for anthropogenic pollution effects, Sci. Rep., 8, 535, https://doi.org/10.1038/s41598-017-18983-7, 2018.
Li, W. J., Shao, L. Y., and Buseck, P. R.: Haze types in Beijing and the influence of agricultural biomass burning, Atmos. Chem. Phys., 10, 8119–8130, https://doi.org/10.5194/acp-10-8119-2010, 2010.
Li, X., Wang, S., Duan, L., Hao, J., and Nie, Y.: Carbonaceous Aerosol Emissions from Household Biofuel Combustion in China, Environ. Sci. Technol., 43, 6076–6081, https://doi.org/10.1021/es803330j, 2009.
Li, Y. J., Sun, Y., Zhang, Q., Li, X., Li, M., Zhou, Z., and Chan, C. K.: Real-time chemical characterization of atmospheric particulate matter in China: A review, Atmos. Environ., 158, 270–304, https://doi.org/10.1016/j.atmosenv.2017.02.027, 2017.
Li, Z. Q., Xia, X. G., Cribb, M., Mi, W., Holben, B., Wang, P. C., Chen, H. B., Tsay, S. C., Eck, T. F., Zhao, F. S., Dutton, E. G., and Dickerson, R. R.: Aerosol optical properties and their radiative effects in northern China, J. Geophys. Res.-Atmos., 112, D22S01, https://doi.org/10.1029/2006jd007382, 2007.
Ma, Y., Russell, A. T., and Marston, G.: Mechanisms for the formation of secondary organic aerosol components from the gas-phase ozonolysis of alpha-pinene, Phys. Chem. Chem. Phys., 10, 4294–4312, https://doi.org/10.1039/b803283a, 2008.
Müller, L., Reinnig, M.-C., Naumann, K. H., Saathoff, H., Mentel, T. F., Donahue, N. M., and Hoffmann, T.: Formation of 3-methyl-1,2,3-butanetricarboxylic acid via gas phase oxidation of pinonic acid – a mass spectrometric study of SOA aging, Atmos. Chem. Phys., 12, 1483-1496, https://doi.org/10.5194/acp-12-1483-2012, 2012.
Oros, D. R. and Simoneit, B. R. T.: Identification and emission rates of molecular tracers in coal smoke particulate matter, Fuel, 79, 515–536, https://doi.org/10.1016/S0016-2361(99)00153-2, 2000.
Quan, J. N., Gao, Y., Zhang, Q., Tie, X. X., Cao, J. J., Han, S. Q., Meng, J. W., Chen, P. F., and Zhao, D. L.: Evolution of planetary boundary layer under different weather conditions, and its impact on aerosol concentrations, Particuology, 11, 34–40, https://doi.org/10.1016/j.partic.2012.04.005, 2013.
Rogge, W. F., Hildemann, L. M., Mazurek, M. A., Cass, G. R., and Simoneit, B. R. T.: Sources of Fine Organic Aerosols. 2. Noncatalyst and Catalyst-equipped Automobile and Heavy-duty Diesel Trucks, Environ. Sci. Technol., 27, 636–651, 1993a.
Rogge, W. F., Hildemann, L. M., Mazurek, M. A., Cass, G. R., and Simoneit, B. R. T.: Sources of Fine Organic Aerosols .4. Particulate Abrasion Products from Leaf Surfaces of Urban Plants, Environ. Sci. Technol., 27, 2700–2711, 1993b.
Shen, Z., Zhang, Q., Cao, J., Zhang, L., Lei, Y., Huang, Y., Huang, R. J., Gao, J., Zhao, Z., Zhu, C., Yin, X., Zheng, C., Xu, H., and Liu, S.: Optical properties and possible sources of brown carbon in PM2.5 over Xi'an, China, Atmos. Environ., 150, 322–330, https://doi.org/10.1016/j.atmosenv.2016.11.024, 2017.
Simoneit, B. R. T.: Biomass burning – A review of organic tracers for smoke from incomplete combustion, Appl. Geochem., 17, 129–162, 2002.
Simoneit, B. R. T., Schauer, J. J., Nolte, C. G., Oros, D. R., Elias, V. O., Fraser, M. P., Rogge, W. F., and Cass, G. R.: Levoglucosan, a tracer for cellulose in biomass burning and atmospheric particles, Atmos. Environ., 33, 173–182, 1999.
Simoneit, B. R. T., Elias, V. O., Kobayashi, M., Kawamura, K., Rushdi, A. I., Medeiros, P. M., Rogge, W. F., and Didyk, B. M.: Sugars – Dominant water-soluble organic compounds in soils and characterization as tracers in atmospheric particulate matter, Environ. Sci. Technol., 38, 5939–5949, https://doi.org/10.1021/es0403099, 2004a.
Simoneit, B. R. T., Kobayashi, M., Mochida, M., Kawamura, K., Lee, M., Lim, H. J., Turpin, B. J., and Komazaki, Y.: Composition and major sources of organic compounds of aerosol particulate matter sampled during the ACE-Asia campaign, J. Geophys. Res.-Atmos., 109, D19S10, https://doi.org/10.1029/2004jd004598, 2004b.
Sultan, C., Balaguer, P., Terouanne, B., Georget, V., Paris, F., Jeandel, C., Lumbroso, S., and Nicolas, J. C.: Environmental xenoestrogens, antiandrogens and disorders of male sexual differentiation, Mol. Cell. Endocrinol., 178, 99–105, https://doi.org/10.1016/s0303-7207(01)00430-0, 2001.
Sun, Y. L., Jiang, Q., Wang, Z. F., Fu, P. Q., Li, J., Yang, T., and Yin, Y.: Investigation of the sources and evolution processes of severe haze pollution in Beijing in January 2013, J. Geophys. Res.-Atmos., 119, 4380–4398, https://doi.org/10.1002/2014jd021641, 2014.
Sun, Y. L., Jiang, Q., Xu, Y. S., Ma, Y., Zhang, Y. J., Liu, X. G., Li, W. J., Wang, F., Li, J., Wang, P. C., and Li, Z. Q.: Aerosol characterization over the North China Plain: Haze life cycle and biomass burning impacts in summer, J. Geophys. Res.-Atmos., 121, 2508–2521, https://doi.org/10.1002/2015jd024261, 2016.
Szmigielski, R., Surratt, J. D., Gomez-Gonzalez, Y., Van der Veken, P., Kourtchev, I., Vermeylen, R., Blockhuys, F., Jaoui, M., Kleindienst, T. E., Lewandowski, M., Offenberg, J. H., Edney, E. O., Seinfeld, J. H., Maenhaut, W., and Claeys, M.: 3-methyl-1,2,3-butanetricarboxylic acid: An atmospheric tracer for terpene secondary organic aerosol, Geophys. Res. Lett., 34, L24811, https://doi.org/10.1029/2007gl031338, 2007.
Tian, J., Ni, H. Y., Cao, J. J., Han, Y. M., Wang, Q. Y., Wang, X. L., Chen, L. W. A., Chow, J. C., Watson, J. G., Wei, C., Sun, J., Zhang, T., and Huang, R. J.: Characteristics of carbonaceous particles from residential coal combustion and agricultural biomass burning in China, Atmos. Pollut. Res., 8, 521–527, https://doi.org/10.1016/j.apr.2016.12.006, 2017.
Tie, X. X., Huang, R. J., Dai, W. T., Cao, J. J., Long, X., Su, X. L., Zhao, S. Y., Wang, Q. Y., and Li, G. H.: Effect of heavy haze and aerosol pollution on rice and wheat productions in China, Sci. Rep., 6, 29612, https://doi.org/10.1038/srep29612, 2016.
van Donkelaar, A., Martin, R. V., Brauer, M., Kahn, R., Levy, R., Verduzco, C., and Villeneuve, P. J.: Global Estimates of Ambient Fine Particulate Matter Concentrations from Satellite-Based Aerosol Optical Depth: Development and Application, Environ. Health Persp., 118, 847–855, https://doi.org/10.1289/ehp.0901623, 2010.
Venkataraman, C., Habib, G., Eiguren-Fernandez, A., Miguel, A. H., and Friedlander, S. K.: Residential biofuels in south Asia: Carbonaceous aerosol emissions and climate impacts, Science, 307, 1454–1456, https://doi.org/10.1126/science.1104359, 2005.
Wang, G. H. and Kawamura, K.: Molecular characteristics of urban organic aerosols from Nanjing: A case study of a mega-city in China, Environ. Sci. Technol., 39, 7430–7438, https://doi.org/10.1021/es051055+, 2005.
Wang, G. H., Kawamura, K., Lee, S., Ho, K. F., and Cao, J. J.: Molecular, seasonal, and spatial distributions of organic aerosols from fourteen Chinese cities, Environ. Sci. Technol., 40, 4619–4625, https://doi.org/10.1021/es060291x, 2006a.
Wang, G. H., Kawamura, K., Watanabe, T., Lee, S. C., Ho, K. F., and Cao, J. J.: High loadings and source strengths of organic aerosols in China, Geophys. Res. Lett., 33, L22801, https://doi.org/10.1029/2006gl027624, 2006b.
Wang, G. H., Kawamura, K., Umemoto, N., Xie, M. J., Hu, S. Y., and Wang, Z. F.: Water-soluble organic compounds in PM2.5 and size-segregated aerosols over Mount Tai in North China Plain, J. Geophys. Res.-Atmos., 114, D19208, https://doi.org/10.1029/2008jd011390, 2009a.
Wang, G. H., Kawamura, K., Xie, M. J., Hu, S. Y., Cao, J. J., An, Z. S., Waston, J. G., and Chow, J. C.: Organic Molecular Compositions and Size Distributions of Chinese Summer and Autumn Aerosols from Nanjing: Characteristic Haze Event Caused by Wheat Straw Burning, Environ. Sci. Technol., 43, 6493–6499, https://doi.org/10.1021/es803086g, 2009b.
Wang, G. H., Chen, C. L., Li, J. J., Zhou, B. H., Xie, M. J., Hu, S. Y., Kawamura, K., and Chen, Y.: Molecular composition and size distribution of sugars, sugar-alcohols and carboxylic acids in airborne particles during a severe urban haze event caused by wheat straw burning, Atmos. Environ., 45, 2473–2479, https://doi.org/10.1016/j.atmosenv.2011.02.045, 2011.
Wang, G. H., Zhang, R. Y., Gomez, M. E., Yang, L. X., Zamora, M. L., Hu, M., Lin, Y., Peng, J. F., Guo, S., Meng, J. J., Li, J. J., Cheng, C. L., Hu, T. F., Ren, Y. Q., Wang, Y. S., Gao, J., Cao, J. J., An, Z. S., Zhou, W. J., Li, G. H., Wang, J. Y., Tian, P. F., Marrero-Ortiz, W., Secrest, J., Du, Z. F., Zheng, J., Shang, D. J., Zeng, L. M., Shao, M., Wang, W. G., Huang, Y., Wang, Y., Zhu, Y. J., Li, Y. X., Hu, J. X., Pan, B., Cai, L., Cheng, Y. T., Ji, Y. M., Zhang, F., Rosenfeld, D., Liss, P. S., Duce, R. A., Kolb, C. E., and Molina, M. J.: Persistent sulfate formation from London Fog to Chinese haze, P. Natl. Acad. Sci. USA, 113, 13630–13635, https://doi.org/10.1073/pnas.1616540113, 2016.
Xuan, Z., Renee C, M., Dan D, H., Nathan F, D., Bernard, A., Richard, C. F., and John H, S.: Formation and evolution of molecular products in α-pinene secondary organic aerosol, P. Natl. Acad. Sci. USA, 112, 14168–14173, 2015.
Yang, Y. H., Chan, C. Y., Tao, J., Lin, M., Engling, G., Zhang, Z. S., Zhang, T., and Su, L.: Observation of elevated fungal tracers due to biomass burning in the Sichuan Basin at Chengdu City, China, Sci. Total Environ., 431, 68–77, https://doi.org/10.1016/j.scitotenv.2012.05.033, 2012.
Young, D. E., Kim, H., Parworth, C., Zhou, S., Zhang, X., Cappa, C. D., Seco, R., Kim, S., and Zhang, Q.: Influences of emission sources and meteorology on aerosol chemistry in a polluted urban environment: results from DISCOVER-AQ California, Atmos. Chem. Phys., 16, 5427–5451, https://doi.org/10.5194/acp-16-5427-2016, 2016.
Zhang, J. K., Cheng, M. T., Ji, D. S., Liu, Z. R., Hu, B., Sun, Y., and Wang, Y. S.: Characterization of submicron particles during biomass burning and coal combustion periods in Beijing, China, Sci. Total Environ., 562, 812–821, https://doi.org/10.1016/j.scitotenv.2016.04.015, 2016.
Zhang, Q., Jimenez, J. L., Canagaratna, M. R., Allan, J. D., Coe, H., Ulbrich, I., Alfarra, M. R., Takami, A., Middlebrook, A. M., and Sun, Y. L.: Ubiquity and dominance of oxygenated species in organic aerosols in anthropogenically-influenced Northern Hemisphere midlatitudes, Geophys. Res. Lett., 34, L13801, https://doi.org/10.1029/2007GL029979, 2007.
Zhang, Q., Streets, D. G., Carmichael, G. R., He, K. B., Huo, H., Kannari, A., Klimont, Z., Park, I. S., Reddy, S., Fu, J. S., Chen, D., Duan, L., Lei, Y., Wang, L. T., and Yao, Z. L.: Asian emissions in 2006 for the NASA INTEX-B mission, Atmos. Chem. Phys., 9, 5131–5153, https://doi.org/10.5194/acp-9-5131-2009, 2009.
Zhang, Y., Shao, M., Zhang, Y., Zeng, L., He, L., Zhu, B., Wei, Y., and Zhu, X.: Source profiles of particulate organic matters emitted from cereal straw burnings, J. Environ. Sci., 19, 167–175, https://doi.org/10.1016/S1001-0742(07)60027-8, 2007.
Zhu, Y., Yang, L., Chen, J., Wang, X., Xue, L., Sui, X., Wen, L., Xu, C., Yao, L., Zhang, J., Shao, M., Lu, S., and Wang, W.: Characteristics of ambient volatile organic compounds and the influence of biomass burning at a rural site in Northern China during summer 2013, Atmos. Environ., 124, 156–165, https://doi.org/10.1016/j.atmosenv.2015.08.097, 2016.