the Creative Commons Attribution 4.0 License.
the Creative Commons Attribution 4.0 License.
Revisiting the Agung 1963 volcanic forcing – impact of one or two eruptions
Ulrike Niemeier
Claudia Timmreck
Kirstin Krüger
In 1963 a series of eruptions of Mt. Agung, Indonesia, resulted in the third largest eruption of the 20th century and claimed about 1900 lives. Two eruptions of this series injected SO2 into the stratosphere, which can create a long-lasting stratospheric sulfate layer. The estimated mass flux of the first eruption was about twice as large as the mass flux of the second eruption. We followed the estimated emission profiles and assumed for the first eruption on 17 March an injection rate of 4.7 Tg SO2 and 2.3 Tg SO2 for the second eruption on 16 May. The injected sulfur forms a sulfate layer in the stratosphere. The evolution of sulfur is nonlinear and depends on the injection rate and aerosol background conditions. We performed ensembles of two model experiments, one with a single eruption and a second one with two eruptions. The two smaller eruptions result in a lower sulfur burden, smaller aerosol particles, and 0.1 to 0.3 Wm−2 (10 %–20 %) lower radiative forcing in monthly mean global average compared to the individual eruption experiment. The differences are the consequence of slightly stronger meridional transport due to different seasons of the eruptions, lower injection height of the second eruption, and the resulting different aerosol evolution.
Overall, the evolution of the volcanic clouds is different in case of two eruptions than with a single eruption only. The differences between the two experiments are significant. We conclude that there is no justification to use one eruption only and both climatic eruptions should be taken into account in future emission datasets.
- Article
(3140 KB) - Full-text XML
-
Supplement
(921 KB) - BibTeX
- EndNote
In September 2017 Mt. Agung, a volcano on Bali, Indonesia (8.342∘ S, 115.58∘ E), became restless. Earthquakes, steam, ash clouds, and lahars resulted in the evacuation of nearly 150 000 people from the volcano's environment within a radius of 9–12 km in November 2017 (Gertisser et al., 2018). The eruption resulted in an ash cloud reaching up to an altitude of about 9.3 km (Marchese et al., 2018) and about 10 DU SO2 above Bali (Hansen, 2017), which was not large and high enough to result in a climatic impact. The last climatic eruption of Mt. Agung dates back more than 50 years. From February 1963 to January 1964 a series of eruptions from Mt. Agung are documented (Fontijn et al., 2015). The initial unrest resulted in the third largest eruption of the 20th century global volcano record and claimed about 1900 lives. Revising the literature, it is obvious that not just one of the eruptions was strong enough to inject SO2 into the stratosphere, a requirement of creating a long-lasting stratospheric sulfate layer, but also a second one (Self and Rampino, 2012). The mass flux of the second eruption on 16 March was about half the size of the mass flux of the first eruption on 17 March. Self and Rampino (2012) estimate the volumetric eruption rate for 17 March to be m3s−1 over a ∼3.5 h duration. The volumetric eruption rate of the 16 May event was m3s−1 over a ∼4 h duration. The resulting sulfate layer caused a climatic impact by scattering and absorbing solar and terrestrial radiation leading to a temperature decrease of about 0.4 K in the tropical troposphere (Hansen et al., 1978).
The sulfate load of the Mt. Agung eruptions was estimated to 7–7.5 Tg SO2 from observations of aerosol optical depth (AOD) a couple of months after the eruption (Self and King, 1996). It was impossible to distinguish between single eruptions with this method. This could be the reason that up to now, recent volcanic forcing datasets assume one large eruption phase of 7 Tg SO2 for Mt. Agung, the one in March 1963, but neglect the second one. Within this paper we examine whether or not it is important to consider both eruption phases individually when simulating sulfate evolution and transport, as well as the impact on radiative forcing of the Mt. Agung eruption.
The radiative forcing of the sulfate aerosols can be simulated by either calculating the evolution and transport of sulfur with an aerosol microphysical model or, much simpler, prescribing the optical parameters of the volcanic aerosols. The first needs volcanic injection data and information on emission strength and altitude, and the latter optical properties like the aerosol optical depth (AOD). Most datasets base the estimated global coverage of sulfate aerosols after the Mt. Agung eruption on ground-based measurements and on ice core measurements, and provide the AOD (e.g., Sato et al., 1993; Stenchikov et al., 1998; Ammann et al., 2003; Crowley et al., 2008; Crowley and Unterman, 2013). Satellite data were not yet available in 1963. Newer datasets not only rely on measurements, but they also include simulated sulfate distributions, e.g., results of an empirical aerosol forcing generator like Easy Volcanic Aerosol (EVA) (Toohey et al., 2016) or complex aerosol models, which simulate the evolution of the aerosol, e.g., Arfeuille et al. (2014) for the SAGE-4λ dataset. On the other hand new volcanic eruption datasets are released, providing the SO2 injection rate for large climate-relevant volcanic eruptions, e.g. Volcanic Emissions for Earth System Models (VolcanEESM) (Neely III and Schmidt, 2016) and the eVolv2k dataset (Toohey and Sigl, 2017), and sulfur injection data. These newer datasets include one eruption phase only for Mt. Agung, the main eruption in March 1963, and assume the injected amount of SO2 of 7 Tg following the estimates of Self and King (1996).
The evolution of the volcanic aerosols is strongly nonlinear. In particular, the particle size depends on the erupted mass (Timmreck et al., 2010; Niemeier and Timmreck, 2015) and sulfur injected into an existing volcanic sulfate layer evolves differently than sulfur injected into background conditions (Laakso et al., 2016). Additionally, many chemical processes depend on particle size and sulfate concentrations. For example stratospheric OH, NOx, and ozone concentrations change under high sulfur load. SPARC (2010) shows in Figure 8.20 the temperature response of different stratospheric chemistry models to volcanic sulfate aerosols. Models using full aerosol microphysics or prescribing surface aerosol density tend to overestimate the measured heating in the stratosphere after the Mt. Agung eruption. This might be related to the assumption of one eruption phase only, especially as for the Mt. Pinatubo eruption in 1991 the models show a slightly better result.
In this study we would like to address the following question: is there a significant difference when simulating two medium eruptions instead of a single large one? We performed two experiments to provide an answer to this question. We describe the model and the simulations in more detail in Sect. 2, and show results in Sect. 3 where we describe the different burden results of the two experiment ensembles (Sect. 3.1) and the cumulative impact of the eruptions (Sect. 3.2). Finally, we compare our results to measurements in Sect. 4 before we conclude in Sect. 5.
2.1 Model setup
The model simulations of this study were performed with the middle atmosphere version of the general circulation model (GCM) MAECHAM5 (Giorgetta et al., 2006). The aerosol microphysical model HAM (Stier et al., 2005) is interactively coupled to the GCM and was extended to a stratospheric version (Niemeier et al., 2009). MAECHAM5–HAM, ECHAM–HAM later in the text, was applied with the spectral truncation at wave number 42 (T42), a horizontal grid size of about 2.8∘, and 90 vertical layers (L90) up to 0.01 hPa. The model is not coupled to an ocean model and shows pure volcanic forcing response only. The sea surface temperatures (SSTs) are set to monthly mean climatological values based on the Atmospheric Model Intercomparison Project (AMIP) SST observational dataset (Hurrell et al., 2008). Thus, the SST does not reflect the historical date but rather represents a climatological mean.
HAM calculates the evolution of sulfate from the injected SO2 to sulfate aerosol, including nucleation, accumulation, condensation, and coagulation, as well as transport and sink processes like sedimentation and deposition (Stier et al., 2005). A simple stratospheric sulfur chemistry is applied above the tropopause (Timmreck, 2001; Hommel et al., 2011) and the sulfate is radiatively active. The model setup is described in more detail in Niemeier et al. (2009) and Niemeier and Schmidt (2017).
The L90 version of MAECHAM5–HAM interactively generates a quasi-biennial oscillation (QBO) (Giorgetta et al., 2006). However, we decided to nudge the QBO in the tropical stratosphere to the observed monthly mean winds at the Equator (updated Naujokat, 1986), as described in Giorgetta and Bengtsson (1999). This allows us to inject the volcanic sulfur into the observed QBO phase and still include the better resolved transport processes of the L90 version, e.g., a less permeable subtropical transport barrier (Niemeier and Schmidt, 2017). Nudging the QBO prescribes the feedbacks of the sulfate aerosol heating in the stratosphere on the QBO winds as observed. However, the QBO winds are prescribed on a monthly basis. This may suppress very short-term changes in the transport due to dynamical changes caused by aerosol heating at the equatorial stratosphere.
2.2 Model simulations
We performed experiments of two scenarios for the 1963 eruption of Mt. Agung. We assumed for the first experiment one eruption phase at 17 March (AGUNG1) with an injection of 7 Tg SO2 over 3 h. For the second scenario two eruptions were simulated with a ratio of the injection rate of 2:1. This reflects the ratio of the volumetric eruption rate and the mass flux of 4 and 2 kg s−1 given in Table 3 in Self and Rampino (2012). The altitudes of the eruptions were taken as the average of the range of estimated altitudes in Self and Rampino (2012). This resulted for the second experiment in the following assumption of two eruption phases (AGUNG2): the first on 17 March, over 3 h with an injection rate of 4.7 Tg SO2 at an altitude of 50 hPa, and a second on 16 May, over 4 h with an injection rate of 2.3 Tg SO2 at a slightly lower altitude of 70 hPa. The ECHAM5–HAM input data for the eruptions are summarized in Table 1.
We performed a set of six ensemble members for each eruption case. See Supplement for further details. All six simulations were used to calculate an ensemble mean. Additionally, we performed a single simulation where an eruption altitude of 50 hPa was assumed for both eruptions (AGUNG2-50hPa).
Table 1Overview of the performed simulations and information to the eruption details, after Self and Rampino (2012).

2.3 Observations
We compare our simulation results to observations and volcanic datasets provided for the Climate Model Intercomparison Project (CMIP). The AOD prescribed for the years 1963 to 1964 in the CMIP5 simulations of the Max Planck Institute for Meteorology is based on Sato et al. (1993) and Stenchikov et al. (1998). The data rely mainly on astronomical observations summarized by Dyer and Hicks (1968), as no satellite data are available for the period. The AOD data for CMIP6 were taken from the SAGE-3λ database (Luo, 2016; Revell et al., 2017). They combine ice core data (Gao et al., 2008) and AOD data (Stothers, 2001) with aerosol microphysical model simulations and include only one eruption of Mt. Agung in their preparatory model simulations (Arfeuille et al., 2014).
Stothers (2001) assembled a revised chronology of observed AOD after the Mt. Agung eruption. The data contain mainly measurements of atmospheric attenuation of starlight and direct sunlight. Stothers (2001) provides values of monthly mean AOD data as an average over different measurement sites, between 20 and 40∘ N and 20 and 40∘ S and results of monthly mean data of single measurement sites. Stothers (2001) excluded data of tropical measurement sites because they were not reliable.
Radiosonde temperature measurements provide information on the heating of the stratospheric aerosol layer after the eruption. This heating causes changes in stratospheric dynamics (Aquila et al., 2014; Toohey et al., 2013) and is, therefore, an important value which should be taken into account correctly. Free and Lanzante (2009) provide vertical temperature anomalies after volcanic eruptions from radiosonde data (RATPAC). The carefully examined dataset contains data of 85 radiosonde stations, 32 of them in the tropics (Free et al., 2005). The QBO and El Niño–Southern Oscillation (ENSO) signals in the temperature were removed. To calculate the temperature anomalies, the average of the 2 years before the eruption was subtracted from the average over the 2 years after the eruption. The corresponding model data of AGUNG1 and AGUNG2 were calculated by averaging over the 2 years after the first eruption and subtracting an ensemble mean of control simulations with nudged QBO data, but no volcanic eruption, for the years 1964 to 1965. This provides the anomaly and removes the QBO signal at the same time.
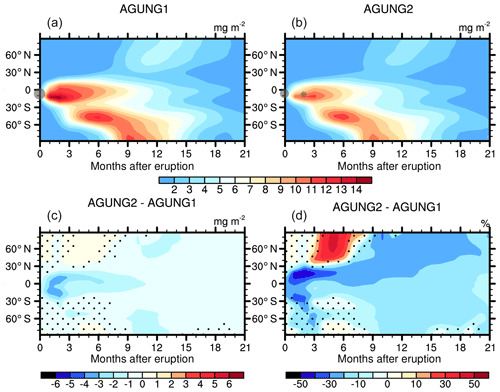
Figure 1Ensemble mean of sulfate burden of experiments AGUNG1 (a) and AGUNG2 (b). Absolute (c) and relative differences (d) of the two ensembles. The x axis gives the months after the first eruption in March 1963. Stippling indicates non-significant differences at the 99 % level, following a Student's t test. The gray dots mark the location and size of the volcanic eruptions.
Figure 1 shows the monthly and zonally averaged sulfate burden of the ensemble mean. Mt. Agung is located at 8∘ in the Southern Hemisphere (SH) tropics. Thus, the main transport direction of the aerosols is southward and, hence, burden values in the Northern Hemisphere (NH) remain small. The ensemble mean shows for both experiments, AGUNG1 and AGUNG2, two areas with high burden: a maximum in the southern tropics in the months 1 to 3 after the eruption, and about four months later in the SH midlatitudes and high latitudes with a secondary maximum between 30 and 60∘ S. The maximum burden is slightly above 14 mg m−2 in the ensemble of AGUNG1 and 10 mg m−2, about 30 % lower, in the ensemble of AGUNG2, reflecting the ratio of the initial injection. The initially higher injection in the ensemble of AGUNG1 results in a higher burden over almost all simulated months and regions. The strongest absolute difference between the two ensembles occurs in the time period between both climatic eruptions, when the injected sulfur amount in AGUNG2 is still smaller. The relative difference highlights that more aerosols are transported into the NH tropics in AGUNG2 in the first months after the second eruption (months 4 to 6). The burden of AGUNG2 increases slightly after the second eruption but, overall, the tropical maximum of the burden is smaller and occurs later than in AGUNG1. In the SH extratropics the differences between the two ensembles are below 20 %, 1 to 2 mg m−2. In contrast, the burden is up to 50 % larger in AGUNG2 in months 6 to 10 in the NH extratropics, poleward of 30∘ N, but with small absolute values. Also towards NH winter the relative difference between the two simulations is larger in the NH than in the SH, which indicates differences in the transport regime and wind systems.
3.1 Transport of aerosols
The ensemble of AGUNG2 results in a lower sulfate burden than AGUNG1 in most areas and at most times (Fig. 1). An exception is the sulfate burden in the extratropics in the first months after the second eruption. This indicates a stronger meridional transport in AGUNG2. The second eruption occurs 2 months later and thus in a different season with a different stratospheric transport pattern. Additionally, the injection altitude is lower, 70 hPa instead of 50 hPa. Figure 2 shows the monthly mean zonal wind (shaded) and the residual stream function for April and June 1963, 1 month after the eruption each, of AGUNG2 (see Fig. S5 for results of AGUNG1). Nudging of the QBO at the Equator results in similar zonal mean zonal winds in the tropics between the two experiments. Differences of the zonal mean zonal wind in the extratropics, around ±10 %, are not significant and are mainly caused by a meridional shift of the higher-latitude wind systems.
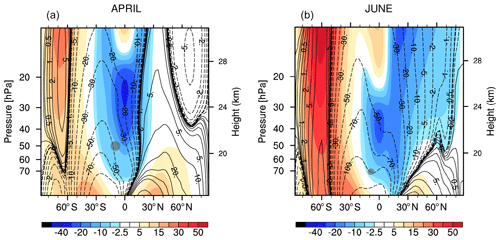
Figure 2Monthly mean zonal wind (m s−1) of AGUNG2 for April (a) and June (b) 1963 in shading. Contour lines show the stream function (kg s−1). Positive (solid) streamlines describe clockwise circulation, negative (dashed) ones counterclockwise circulation. The gray dots mark the injection location of the two volcanic eruptions.
Punge et al. (2009) showed that meridional transport in the tropics and subtropics depends on the QBO phase. Figure 2 shows that both eruption phases inject into easterly zonal wind. Thus, the QBO phase should not play an important role in transport characteristics of both experiments. Seasonality seems more important. The streamlines show that the zero line, indicating the tropical pipe, is shifted northward in June, allowing more sulfate to be transported into the NH. Additionally, the second eruption occurs at a lower altitude, 70 hPa, where the subtropical transport barrier is weaker than at 50 hPa. This allows more meridional transport than at 50 hPa: the streamline at 70 hPa in June is stronger than at 50 hPa in April, 100 kg s−1 and around 50 kg s−1, respectively.
3.2 Cumulative impact – a sum over time
The zonally averaged cumulative burden (Fig. 3a), time integrated monthly mean values over 21 months, starting with the month of the first eruption, is roughly 20 % lower for AGUNG2 than AGUNG1. The difference between the two results is larger in the tropics than in the secondary maximum around 50∘ S. This results from the stronger meridional transport towards the SH in AGUNG2. Thus, one eruption with larger SO2 injection results in higher burden than the same injected amount of SO2, but split into two eruptions and in a slightly stronger tropical confinement of the aerosols. However, the shaded areas indicate that the variance within each ensemble is larger than the differences between the ensemble mean values.
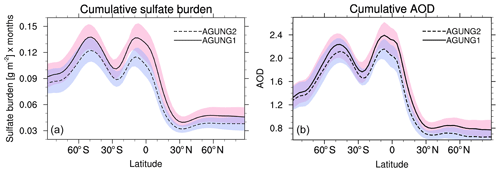
Figure 3Cumulative values, integral over 21 monthly mean values, of (a) zonally averaged sulfate burden and (b) AOD at 550 nm. The shadings indicate the maximum and minimum values of the single simulations in the ensemble.
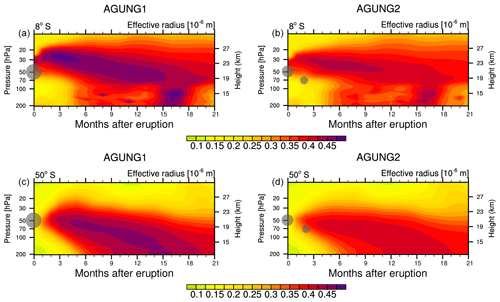
Figure 4Time series of monthly mean effective radius (µm) of sulfate at the grid point corresponding to 8∘ S (a, b) and 50∘ S (c, d).
This result is confirmed in the cumulative AOD (Fig. 3b). But the AOD of AGUNG1 and AGUNG2 differs less (about 10 %) than the burden (about 20 %) in the tropics and even less in the SH extratropics (about 6 %). The reason for this is different particle radii. Scattering of sulfate aerosols decreases with increasing particle radius. The maximum effective radii of the sulfate aerosols reach 0.5 µm at 8∘ S for AGUNG1 and stay below 0.45 µm for AGUNG2 (Fig. 4a, b). Sulfate particles are 0.05 µm smaller in AGUNG2. Thus, they scatter more intensely and the AOD difference between the two experiments gets smaller. These smaller radii are the consequence of the lower injection rate of the first eruption in AGUNG2. Particle sizes increase with increasing injection rate (Niemeier and Timmreck, 2015). Laakso et al. (2016) simulated a volcanic eruption into background sulfate level and into elevated sulfate level from continuous injections for climate engineering (CE). They show a shorter lifetime and larger particles under CE conditions. Thus, following Laakso et al. (2016), we would expect stronger coagulation after the second eruption, as newly formed particles coagulate fast with available larger particles. But the second eruption occurs at lower altitude, where sulfate concentration and particle radii are smaller. Thus, coagulation is less important. We performed an additional sensitivity study where we injected the SO2 in both eruptions at 50 hPa to differentiate better between injection rates and emission height. The sensitivity simulation AGUNG2-50hPa, with both eruptions at the same altitude, results in particle radii very similar to AGUNG1 and about 0.05 µm larger than in AGUNG2. This reflects the results of Laakso et al. (2016). See Sect. 2 in the Supplement for more information and figures.
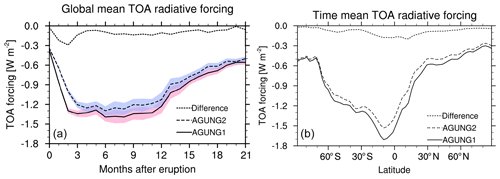
Figure 5Top of the atmosphere (TOA) radiative forcing of sulfate aerosols under all-sky conditions. Aerosol forcing was calculated using a radiation double call. (a) Global mean TOA forcing over time. The shadings indicate the 2σ variability range for both ensembles. (b) Zonally averaged radiative forcing as an average over time (21 months).
The climatic impact can be derived from the aerosol radiative forcing at the top of the atmosphere (TOA), which was calculated with a radiation double call (Fig. 5a). The spread of the single ensemble members is large, but the average of the AGUNG2 ensemble is just outside of the 2σ ensemble variability of AGUNG1. The global monthly mean TOA forcing of sulfate is about 0.1 to 0.3 Wm−2 larger in AGUNG1. The average difference in the short-term volcanic forcing over the first 21 post-eruption months is 3 to 10 times larger than the long-term forcing radiative forcing of stratospheric ozone (−0.033 Wm−2) in CMIP6 (Checa-Garcia et al., 2018) and comparable to the long-term radiative forcing of the total ozone column (0.28 Wm−2 in CMIP6). The long-term radiative forcing of anthropogenic sulfate aerosols is assumed to be −0.4 Wm−2 (Stocker et al., 2013).
We estimate surface temperature changes (ΔTs) to give a rough estimate of the consequences of this forcing difference. ΔTs relates to forcing as ΔTs=αF, with F the radiative forcing and α the climate sensitivity (Gregory and Webb, 2008; Ramaswamy et al., 2001). α is a constant which differs for each model. Thus in our case
with F(AGUNG1) and F(AGUNG2) the averages over the global radiative forcing of months 3 to 9 after the eruption (Fig. 5a). Thus, we overestimate the surface cooling in AGUNG1 by a factor of 1.1 or 10 %. Both experiments show the strongest difference of radiative forcing in the tropics (Fig. 5b) and the strongest surface cooling occurs in the tropics as well.
The zonally averaged AOD of AGUNG1 and AGUNG2 differs mainly in the tropics (Fig. 6a, b) and is rather similar in the SH extratropics. Our results agree quite well with the CMIP6 AOD (Fig. 6d), which shows, however, slower transport into the extratropics and no secondary maximum at 40 to 50∘ S. Less aerosol reaches the SH high latitudes in CMIP6, but it has a longer lifetime. The CMIP5 volcanic forcing data used for the MPI-ESM simulations show a very different evolution (Fig. 6c), which might be related to not reliable measurements in the tropics (Stothers, 2001).
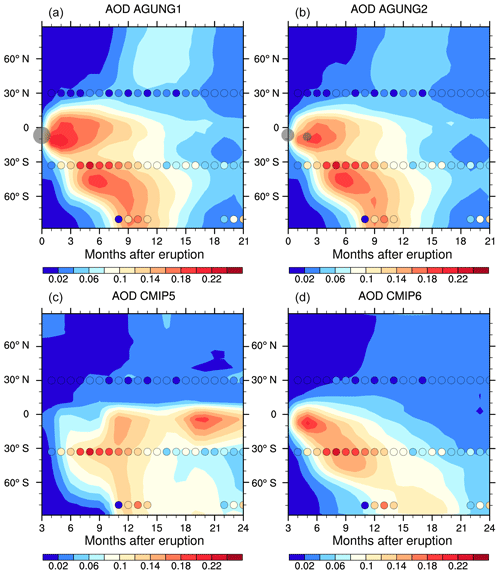
Figure 6Monthly mean AOD at 550 µm over time. (a, b) AGUNG1 and AGUNG2 ensembles. (c) AOD used for CMIP5 simulations (Stenchikov et al., 1998) and (d) AOD for CMIP6 simulations Luo (2016). Overlaid as colored circles are measurements of monthly mean AOD averaged over the regions 20 to 40∘ N and 20 to 40∘ S, given in Table 3 of Stothers (2001), and single values for the south pole (after Fig. 2, same paper). The gray circles mark the volcanic eruptions, and the size represents the size of the eruption.
Both AGUNG experiments fit in general well to the measurements of Stothers (2001), which are included as circles in Fig. 6. The simulated NH AOD is slightly larger than the measurements. Thus, it seems that ECHAM–HAM overestimates the northward transport, but we have to take into account that Stothers (2001) noted the measured NH AOD is barely above noise level. In the SH the modeled AOD is smaller than the measurements, but larger than the CMIP6 data. In ECHAM–HAM, meridional exchange within the subtropics results in lower values between 20 and 30∘ S and a maximum at 50∘ S where the meridional transport is blocked by the edge of the polar vortex. This maximum AOD, above 0.2, is more similar to the measured AOD between 20 and 40∘ S which could be an indication of too strong meridional transport in ECHAM–HAM. The AOD measurements of the months 19 to 21 and the CMIP6 data may indicate a too short lifetime of the simulated aerosols at the SH high latitudes. This is most probably related to too intense sedimentation at high latitudes (Brühl et al., 2018) in the T42 resolution of ECHAM5. The consequence is too high wet deposition at high latitudes, a well-known phenomena of ECHAM–HAM.
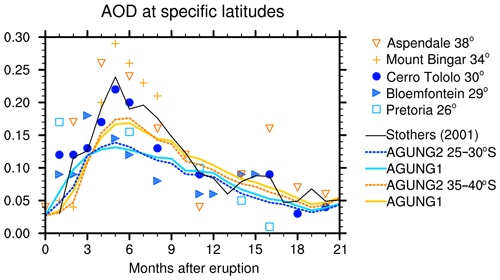
Figure 7Monthly mean SH AOD (550 µm) over time. Colored lines show model results averaged over 25 to 30∘ S (blue) and 35 to 40∘ S (orange) each for both ensembles. The black line gives data of Stothers (2001), the average of measurements between 20 and 40∘ S. Single markers show single measurement data, estimated from Fig. 1 in Stothers (2001), with a similar color code to the model data.
A more detailed analysis of the SH extratropics is shown in Fig. 7. We averaged the model data over latitude bands 25 to 30∘ S and 35 to 40∘ S to compare those to the single measurement data given in Fig. 1 of Stothers (2001). The simulated AOD is clearly smaller than the point measurements, but one should take into account that horizontal gradients in a volcanic cloud can be large. Thus, a point measurement should give a higher value than an area mean of a model, which represents an area of several hundred kilometers. Additionally, measurements and simulated values depend not only on sulfate evolution but also on transport. Further possible reasons for the differences were stated before. In the first 3 months after the eruption, the simulated AOD agrees well with the measurements. The onset of the meridional transport is similar, but the simulated volcanic cloud arrives slightly later in 25 to 30∘ S (see also Fig. 6). The agreement between the model simulations and the individual stations differs with time. Between 35 and 40∘ S, the model agrees better with the data of Mt. Bingar (yellow cross) than with the Aspendale data (red triangle) in the first months after the eruption, where the sulfate values increase 2 months earlier although the station is closer to the tropics. This may indicate the dependency of the point source on the position of the volcanic cloud. Both the timing of the maximum and the onset of the decline agree well in measurements and model results.
Measured data of particle radii are not available, but the following references provide some estimates, which are helpful for a rough comparison. Arfeuille et al. (2014) simulated for the SAGE-4λ dataset effective radii of 0.3 to 0.4 µm for eruptions of the size of the Agung eruption. Stothers (2001) estimates a radius of 0.35 µm from the measurement data of the year 1963 at Bloemfontein, South Africa (29∘ S). Our simulated radii at the Equator (above 0.45 µm) and at 50∘ S (above 0.4 µm) are larger than these values for both experiments (Fig. 4), with a better agreement in AGUNG2. A smaller radius of the aerosols would cause a larger AOD. The larger radii in our experiments lead us to the question of the requirement to include an OH-limitation process for modeling the sulfate evolution, which is a still open research question. In the case of high SO2 concentrations OH might be limited for further SO2 oxidation (Bekki et al., 1996). The slower formation of sulfuric acid vapor would result in smaller particles. Bekki et al. (1996) assumed that OH limitation occurs only in the case of a super-eruption, but Mills et al. (2017) show OH limitation after the Mt. Pinatubo eruption as well. On the other hand, LeGrande et al. (2016) showed that water vapor in the eruption cloud increases the amount of available OH. This reaction was not included in the two studies cited above. The results presented here use a fixed monthly mean OH concentration which is not influenced by the volcanic cloud. Following Mills et al. (2017), this missing OH limitation leads to faster formation of sulfate resulting in larger sulfate particles. Therefore, we performed one simulation with a simple parameterization of OH limitation; see the Supplement for details. This simulation shows slower sulfate formation, which agrees less with the measurements, and only a slightly higher AOD half a year after the eruption (Figs. S4 and S5) for the OH-limited case. As we use a simplistic parameterization these results are very limited.
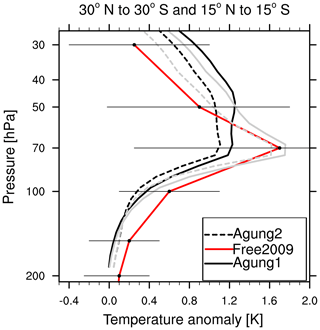
Figure 8Profiles of temperature anomaly (K) for the model data and RATPAC radiosonde measurements taken from Free and Lanzante (2009), averaged over 2 years after the Agung eruption(s). Model results are averaged over 30∘ N to 30∘ S (black) and 15∘ N to 15∘ S (gray), whereas radiosonde data are averaged for the tropics only (30∘ N to 30∘ S; red line). The horizontal lines mark the 95 % confidence interval for the RATPAC radiosonde data.
Sulfate aerosol absorbs terrestrial radiation and warms the stratosphere. This temperature signal depends in the model on the coupling to radiation. We compare the results of the ensemble mean temperature data to radiosonde data of Free and Lanzante (2009). Both model and measurement data are independent of QBO temperature relations (see Sect. 2.3). The measurements, averaged over stations between 30∘ N and 30∘ S, shows a strong maximum at 70 hPa (Fig. 8). The average over 30∘ N to 30∘ S of the model results (black lines) show a smaller anomaly and a stronger vertical extension of the heated area, more in AGUNG1 than in AGUNG2. Below the maximum at 70 hPa the simulated temperature is lower than the measurements. Both features indicate too strong vertical lofting in the model. Figures 6 and 7 indicated a too low AOD in the model results around 30∘ S. Therefore, we added a second temperature profile, averaged over the main volcanic cloud at 15∘ N to 15∘ S (gray line), to Fig. 8. Now, the maximum is represented better. However, more important is the better agreement with the temperature decrease between 50 hPa and 70 hPa, especially for AGUNG2. The easterly phase of the QBO is related to downward motion and suppresses the vertical lofting caused by the heating, but is also related to stronger vertical transport in the secondary meridional circulation around 30∘ north and south. This upwelling seems to be stronger in the model than in the measurements, causing the too high vertical extension of the simulated volcanic cloud. While these results compare well to the radiosonde data, simulated temperature anomalies are only half of those observed in the SH (not shown). This may hint towards a too short lifetime of the simulated sulfate aerosols (see Fig. 6a, b).
We compared results of two scenarios for the Mt. Agung eruption in 1963: the commonly used one-eruption scenario with a strength of 7 Tg SO2 and a scenario with two eruptions. From AOD measurements one single number of the injected sulfur amount was estimated, but observation and detection of the mass flux show a scenario of two eruptions. Therefore, we assumed a scenario with two climatic eruptions of 4.7 Tg SO2 and 2.3 Tg SO2 respectively. We simulated a lower burden in the tropics, but slightly stronger meridional flow into the extratropics in the simulation with two eruptions, AGUNG2, compared to AGUNG1. We relate the stronger meridional flow to the lower injection altitude of the second eruption, where the tropical transport barrier is weaker. Additionally, the position of the tropical pipe is further northward in May than in March. This allows more aerosols to be transported into the NH. The smaller injection rate and the two different injection altitudes cause the particles to grow less than in AGUNG1. These processes result in 10 % to 20 % lower radiative forcing, or 0.1 to 0.3 Wm−2 in monthly mean global average, and estimated 10 % less surface cooling in AGUNG2. The strongest signal would occur in the tropics.
When comparing to the few available measurements we see that the differences to the measurements are larger than the differences between the two experiments. We seem to underestimate the observed AOD and simulate larger particle radii. The timing of the aerosol evolution in the model seems to be supported by the measurements. Given the low number of observations at that time, especially in the tropics, it is difficult to validate the two experiments. Overall, the smaller particle size and slightly better shape of the temperature anomaly in the vertical profile of AGUNG2 are consequences of different transport and microphysical processes between the two experiments. These are arguments to include both climatic eruptions in future emission datasets.
One could also argue that the large model spread, as described by Marshall et al. (2018) and Zanchettin et al. (2016), limits the interpretation of our model results. Other models may obtain quantitatively different results, but most probably the simulated difference between the two eruption scenarios would be qualitatively similar: a lower radiative forcing of the Agung 1963 eruption when including two eruption phases. Including a more sophisticated atmospheric chemistry (including OH chemistry, water vapor, and ozone) may increase the differences between the scenarios. Lower SO2 injection rates in AGUNG2 would cause less impact on OH and ozone, and thus on chemical species in the stratosphere. Taking two eruption phases into account will be important for processes in the early evolution of sulfate. Ash and ice are important species in this early phase. Both were not taken into account in the simulations presented here but are planned for the future.
Overall, differences of around 10 % in the global annual averaged radiative forcing between AGUNG1 and AGUNG2 should justify changes in the volcanic emission datasets. The more recent volcano datasets are rather detailed. Also, future studies using high horizontal and vertical resolution and more sophisticated models will demand detailed input data. Details of our assumptions on the Agung eruptions might be critically reviewed again but, we recommend including both eruptions of Mt. Agung in upcoming datasets.
Primary data and scripts used in the analysis and Supplement that may be useful in reproducing the author's work are archived by the Max Planck Institute for Meteorology and can be obtained by contacting publications@mpimet.mpg.de. Model results are available under https://cera-www.dkrz.de/WDCC/ui/cerasearch/entry?acronym=DKRZ_LTA_550_ds00002 Niemeier et al., 2019.
The supplement related to this article is available online at: https://doi.org/10.5194/acp-19-10379-2019-supplement.
CT had the main idea for the study. UN, CT, and KK discussed the experiment design. UN performed the experiments. UN prepared the text with contributions of all co-authors.
The authors declare that they have no conflict of interest.
This article is part of the special issue “The Model Intercomparison Project on the climatic response to Volcanic forcing (VolMIP) (ESD/GMD/ACP/CP inter-journal SI)”. It is not associated with a conference.
We thank Hauke Schmidt for implementing the QBO nudging into ECHAM5–HAM and Elisa Manzini, Alan Robock, and the anonymous reviewer for valuable comments. A discussion about the OH limitation in WACCM with Simone Tilmes helped to modify ECHAM5–HAM. The simulations were performed on the computer of the Deutsches Klima Rechenzentrum (DKRZ). Kirstin Krüger would like to thank Hauke Schmidt and MPI for Meteorology for the Guest Scientist invitation and UiO for the sabbatical that allowed the scientific exchange.
This research has been supported by FP7
Environment STRATOCLIM (grant no. FP7-ENV.2013.6.1-2), the Deutsche Forschungsgemeinschaft priority program “Climate Engineering:
Risks, Challenges, Opportunities?” (grant no. SPP1689, project CELARIT, UN), the German federal Ministry of Education research program MiKlip (grant no. FKZ:01LP1517(CT)), and the DFG Research Unit VollImpact (FOR2820, UN CT).
The article processing charges for this open-access
publication were covered by the Max Planck Society.
This paper was edited by Slimane Bekki and reviewed by Alan Robock and one anonymous referee.
Ammann, C. M., Meehl, G. A., Washington, W. M., and Zender, C. S.: A monthly and latitudinally varying volcanic forcing dataset in simulations of 20th century climate, Geophys. Res. Lett., 30, 1657, https://doi.org/10.1029/2003GL016875, 2003. a
Aquila, V., Garfinkel, C. I., Newman, P., Oman, L. D., and Waugh, D. W.: Modifications of the quasi-biennial oscillation by a geoengineering perturbation of the stratospheric aerosol layer, Geophys. Res. Lett., 41, 1738–1744, https://doi.org/10.1002/2013GL058818, 2014. a
Arfeuille, F., Weisenstein, D., Mack, H., Rozanov, E., Peter, T., and Brönnimann, S.: Volcanic forcing for climate modeling: a new microphysics-based data set covering years 1600–present, Clim. Past, 10, 359–375, https://doi.org/10.5194/cp-10-359-2014, 2014. a, b, c
Bekki, S., Pyle, J. A., Zhong, W., Haigh, R. T. J. D., and Pyle, D. M.: The role of microphysical and chemical processes in prolonging the climate forcing of the Toba eruption, Geophys. Res. Lett., 23, 2669–2672, 1996. a, b
Brühl, C., Schallock, J., Klingmüller, K., Robert, C., Bingen, C., Clarisse, L., Heckel, A., North, P., and Rieger, L.: Stratospheric aerosol radiative forcing simulated by the chemistry climate model EMAC using Aerosol CCI satellite data, Atmos. Chem. Phys., 18, 12845–12857, https://doi.org/10.5194/acp-18-12845-2018, 2018. a
SPARC: SPARC Report on the Evaluation of Chemistry-Climate Models, sPARC Report No. 5, WCRP-132, WMO/TD-No. 1526, edited by: Eyring, V., Shepherd, T. G., and Waugh, D. W., 426 pp., available at: http://www.atmosp.physics.utoronto.ca/SPARC, 2010. a
Checa-Garcia, R., Hegglin, M. I., Kinnison, D., Plummer, D. A., and Shine, K. P.: Historical Tropospheric and Stratospheric Ozone Radiative Forcing Using the CMIP6 Database, Geophys. Res. Lett., 45, 3264–3273, https://doi.org/10.1002/2017GL076770, 2018. a
Crowley, T., Zielinski, G., Vinther, B., Udisti, R., Kreutz, K., Cole-Dai, J., and Castellano, E.: Volcanism and the little ice age, PAGES News, 16, 22–23, 2008. a
Crowley, T. J. and Unterman, M. B.: Technical details concerning development of a 1200 yr proxy index for global volcanism, Earth Syst. Sci. Data, 5, 187–197, https://doi.org/10.5194/essd-5-187-2013, 2013. a
Dyer, A. J. and Hicks, B. B.: Global spread of volcanic dust from the Bali eruption of 1963, Q. J. Roy. Meteorol. Soc., 94, 545–554, https://doi.org/10.1002/qj.49709440209, 1968. a
Fontijn, K., Costa, F., Sutawidjaja, I., Newhall, C. G., and Herrin, J. S.: A 5000-year record of multiple highly explosive mafic eruptions from Gunung Agung (Bali, Indonesia): implications for eruption frequency and volcanic hazards, B. Volcanol., 77, 59, https://doi.org/10.1007/s00445-015-0943-x, 2015. a
Free, M. and Lanzante, J.: Effect of volcanic eruptions on the verti- cal temperature profile in radiosonde data and climate models, J. Clim., 22, 2925–2939, https://doi.org/10.1175/2008JCLI2562.1, 2009. a, b
Free, M., Seidel, D. J., Angell, J. K., Lanzante, J., Durre, I., and Peterson, T. C.: Radiosonde Atmospheric Temperature Products for Assessing Climate (RATPAC): A new data set of large-area anomaly time series, J. Geophys. Res.-Atmos, 110, D22101, https://doi.org/10.1029/2005JD006169, 2005. a
Gao, C., Robock, A., and Ammann, C.: Volcanic forcing of climate over the past 1500 years: An improved ice core-based index for climate models, J. Geophys. Res.-Atmos., 113, D23111, https://doi.org/10.1029/2008JD010239, 2008. a
Gertisser, R., Deegan, F., Troll, V., and Preece, K.: When the gods are angry: volcanic crisis and eruption at Bali's great volcano, Geology Today, 34, 62–65, https://doi.org/10.1111/gto.12224, 2018. a
Giorgetta, M. A. and Bengtsson, L.: Potential role of the quasi–biennial oscillation in the stratosphere–troposphere exchange as found in water vapor in general circulation model experiments, J. Geophys. Res., 104, 6003–6019, 1999. a
Giorgetta, M. A., Manzini, E., Roeckner, E., Esch, M., and Bengtsson, L.: Climatology and forcing of the quasi–biennial oscillation in the MAECHAM5 model, J. Clim., 19, 3882–3901, 2006. a, b
Gregory, J. and Webb, M.: Tropospheric adjustment induces a cloud component in CO2 forcing, J. Clim., 21, 58–71, https://doi.org/10.1175/2007JCLI1834.1, 2008. a
Hansen, J. E., Wang, W.-C., and Lacis, A. A.: Mount Agung Eruption Provides Test of a Global Climatic Perturbation, Science, 199, 1065–1068, https://doi.org/10.1126/science.199.4333.1065,1978. a
Hansen, K.: NASA Earth Observatory: Tracking the Sulfur Dioxide from Mount Agung, available at: https://earthobservatory.nasa.gov/images/91329/tracking-the-sulfur-dioxide-from-mount-agung (last access: 28 February 2019), 2017. a
Hommel, R., Timmreck, C., and Graf, H. F.: The global middle-atmosphere aerosol model MAECHAM5-SAM2: comparison with satellite and in-situ observations, Geosci. Model Dev., 4, 809–834, https://doi.org/10.5194/gmd-4-809-2011, 2011. a
Hurrell, J. W., Hack, J. J., Shea, D., Caron, J. M., and Rosinski, J.: A New Sea Surface Temperature and Sea Ice Boundary Dataset for the Community Atmosphere Model, J. Clim., 21, 5145–5153, https://doi.org/10.1175/2008JCLI2292.1, 2008. a
Laakso, A., Kokkola, H., Partanen, A.-I., Niemeier, U., Timmreck, C., Lehtinen, K. E. J., Hakkarainen, H., and Korhonen, H.: Radiative and climate impacts of a large volcanic eruption during stratospheric sulfur geoengineering, Atmos. Chem. Phys., 16, 305–323, https://doi.org/10.5194/acp-16-305-2016, 2016. a, b, c, d
LeGrande, A. N., Tsigaridis, K., and Bauer, S.: Role of atmospheric chemistry in the climate impacts of stratospheric volcanic injections, Nat. Geosci., 9, 652–655, https://doi.org/10.1038/ngeo2771, 2016. a
Luo, B.: Stratospheric aerosol data for use in CMIP6 models – data description, available at: ftp://iacftp.ethz.ch/pub_read/luo/CMIP6/Readme_Data_Description.pdf (last access: 8 January 2019), 2016. a, b
Marchese, F., Falconieri, A., Pergola, N., and Tramutoli, V.: Monitoring the Agung (Indonesia) Ash Plume of November 2017 by Means of Infrared Himawari 8 Data, Remote Sens., 10, 919, https://doi.org/10.3390/rs10060919, 2018. a
Marshall, L., Schmidt, A., Toohey, M., Carslaw, K. S., Mann, G. W., Sigl, M., Khodri, M., Timmreck, C., Zanchettin, D., Ball, W. T., Bekki, S., Brooke, J. S. A., Dhomse, S., Johnson, C., Lamarque, J.-F., LeGrande, A. N., Mills, M. J., Niemeier, U., Pope, J. O., Poulain, V., Robock, A., Rozanov, E., Stenke, A., Sukhodolov, T., Tilmes, S., Tsigaridis, K., and Tummon, F.: Multi-model comparison of the volcanic sulfate deposition from the 1815 eruption of Mt. Tambora, Atmos. Chem. Phys., 18, 2307–2328, https://doi.org/10.5194/acp-18-2307-2018, 2018. a
Mills, M. J., Richter, J. H., Tilmes, S., Kravitz, B., MacMartin, D. G., Glanville, A. A., Tribbia, J. J., Lamarque, J.-F., Vitt, F., Schmidt, A., Gettelman, A., Hannay, C., Bacmeister, J. T., and Kinnison, D. E.: Radiative and Chemical Response to Interactive Stratospheric Sulfate Aerosols in Fully Coupled CESM1(WACCM), J. Geophys. Res.-Atmos., 122, 13061–13078, https://doi.org/10.1002/2017JD027006, 2017. a, b
Naujokat, B.: An update of the observed quasi–biennial oscillation of the stratospheric winds over the tropics, J. Atmos. Sci., 43, 1873–1877, 1986. a
Neely III, R. and Schmidt, A.: VolcanEESM: Global volcanic sulphur dioxide (SO2) emissions database from 1850 to present – Version 1.0., https://doi.org/10.5285/76ebdc0b-0eed-4f70-b89e-55e606bcd568, last access: 4 February 2016. a
Niemeier, U. and Schmidt, H.: Changing transport processes in the stratosphere by radiative heating of sulfate aerosols, Atmos. Chem. Phys., 17, 14871–14886, https://doi.org/10.5194/acp-17-14871-2017, 2017. a, b
Niemeier, U. and Timmreck, C.: What is the limit of climate engineering by stratospheric injection of SO2?, Atmos. Chem. Phys., 15, 9129–9141, https://doi.org/10.5194/acp-15-9129-2015, 2015. a, b
Niemeier, U., Timmreck, C., Graf, H.-F., Kinne, S., Rast, S., and Self, S.: Initial fate of fine ash and sulfur from large volcanic eruptions, Atmos. Chem. Phys., 9, 9043–9057, https://doi.org/10.5194/acp-9-9043-2009, 2009. a, b
Niemeier, U., Timmreck, C., and Krueger, K.: Revisiting the Agung 1963 volcanic forcing – impact of one or two eruptions, World Data Center for Climate (WDCC) at DKRZ, https://doi.org/10.5194/acp-19-1-2019, 2019.
Punge, H. J., Konopka, P., Giorgetta, M. A., and Müller, R.: Effects of the quasi-biennial oscillation on low-latitude transport in the stratosphere derived from trajectory calculations, J. Geophys. Res., 114, D03102, https://doi.org/10.1029/2008JD010518, 2009. a
Ramaswamy, V., Boucher, O., Haigh, J., Hauglustaine, D., Haywood, J., Myhre, G., Nakajima, T., Shi, G., and Solomon, S.: Radiative Forcing of Climate Change, in: Climate Change 2001: The Scientific Basis, Contribution of Working Group I to the Third Assessment Report of the Intergovernmental Panel on Climate Change, edited by: Houghton, J., Ding, Y., Griggs, D., M. Noguer, P. v. d. L., Dai, X., Maskell, K., and Johnson, C., chap. 6, Cambridge University Press, Cambridge, United Kingdom and New York, NY, USA, 881 pp., 2001. a
Revell, L. E., Stenke, A., Luo, B., Kremser, S., Rozanov, E., Sukhodolov, T., and Peter, T.: Impacts of Mt Pinatubo volcanic aerosol on the tropical stratosphere in chemistry-climate model simulations using CCMI and CMIP6 stratospheric aerosol data, Atmos. Chem. Phys., 17, 13139–13150, https://doi.org/10.5194/acp-17-13139-2017, 2017. a
Sato, M., Hansen, J. E., McCormick, M. P., and Pollack, J. B.: Stratospheric aerosol optical depths, J. Geophys. Res., 98, 22987, https://doi.org/10.1029/93JD02553, 1993. a, b
Self, S. and King, A. J.: Petrology and sulfur and chlorine emissions of the 1963 eruption of Gunung Agung, Bali, Indonesia, B. Volcanol., 58, 263–285, https://doi.org/10.1007/s004450050139, 1996. a, b
Self, S. and Rampino, M. R.: The 1963–1964 eruption of Agung volcano (Bali, Indonesia), B. Volcanol., 74, 1521–1536, https://doi.org/10.1007/s00445-012-0615-z, 2012. a, b, c, d, e
Stenchikov, G. L., Kirchner, I., Robock, A., Graf, H.-F., Antuña, J. C., Grainger, R. G., Lambert, A., and Thomason, L.: Radiative forcing from the 1991 Mount Pinatubo volcanic eruption, J. Geophys. Res., 103, 13837–13858, 1998. a, b, c
Stier, P., Feichter, J., Kinne, S., Kloster, S., Vignati, E., Wilson, J., Ganzeveld, L., Tegen, I., Werner, M., Balkanski, Y., Schulz, M., Boucher, O., Minikin, A., and Petzold, A.: The aerosol-climate model ECHAM5-HAM, Atmos. Chem. Phys., 5, 1125–1156, https://doi.org/10.5194/acp-5-1125-2005, 2005. a, b
Stocker, T. F., Dahe, Q., and Plattner, G.-K.: Climate Change 2013: The Physical Science Basis, Working Group I Contribution to the Fifth Assessment Report of the Intergovernmental Panel on Climate Change, Summary for Policymakers (IPCC, 2013), 2013. a
Stothers, R. B.: Major optical depth perturbations to the stratosphere from volcanic eruptions: Stellar extinction period, 1961–1978, J. Geophys. Res.-Atmos., 106, 2993–3003, https://doi.org/10.1029/2000JD900652, 2001. a, b, c, d, e, f, g, h, i, j, k, l
Timmreck, C.: Three–dimensional simulation of stratospheric background aerosol: First results of a multiannual general circulation model simulation, J. Geophys. Res., 106, 28313–28332, 2001. a
Timmreck, C., Graf, H.-F., Lorenz, S. J., Niemeier, U., Zanchettin, D., Matei, D., Jungclaus, J. H., and Crowley, T. J.: Aerosol size confines climate response to volcanic super-eruptions, Geophys. Res. Lett., 37, L2470, https://doi.org/10.1029/2010GL045464, 2010. a
Toohey, M. and Sigl, M.: Volcanic stratospheric sulfur injections and aerosol optical depth from 500 BCE to 1900 CE, Earth Syst. Sci. Data, 9, 809–831, https://doi.org/10.5194/essd-9-809-2017, 2017. a
Toohey, M., Krüger, K., and Timmreck, C.: Volcanic sulfate deposition to Greenland and Antarctica: A modeling sensitivity study, J. Geophys. Res.-Atmos., 118, 4788–4800, https://doi.org/10.1002/jgrd.50428, 2013. a
Toohey, M., Stevens, B., Schmidt, H., and Timmreck, C.: Easy Volcanic Aerosol (EVA v1.0): an idealized forcing generator for climate simulations, Geosci. Model Dev., 9, 4049–4070, https://doi.org/10.5194/gmd-9-4049-2016, 2016. a
Zanchettin, D., Khodri, M., Timmreck, C., Toohey, M., Schmidt, A., Gerber, E. P., Hegerl, G., Robock, A., Pausata, F. S. R., Ball, W. T., Bauer, S. E., Bekki, S., Dhomse, S. S., LeGrande, A. N., Mann, G. W., Marshall, L., Mills, M., Marchand, M., Niemeier, U., Poulain, V., Rozanov, E., Rubino, A., Stenke, A., Tsigaridis, K., and Tummon, F.: The Model Intercomparison Project on the climatic response to Volcanic forcing (VolMIP): experimental design and forcing input data for CMIP6, Geosci. Model Dev., 9, 2701–2719, https://doi.org/10.5194/gmd-9-2701-2016, 2016. a


