the Creative Commons Attribution 4.0 License.
the Creative Commons Attribution 4.0 License.
 | 13 Aug 2019
Summertime aerosol volatility measurements in Beijing, China
Weiqi Xu
Conghui Xie
Eleni Karnezi
Junfeng Wang
Spyros N. Pandis
Xinlei Ge
Jingwei Zhang
Junling An
Qingqing Wang
Jian Zhao
Yanmei Qiu
Yao He
Jie Li
Pingqing Fu
Zifa Wang
Douglas R. Worsnop
Volatility plays a key role in affecting mass concentrations and the lifetime of aerosol particles in the atmosphere, yet our knowledge of aerosol volatility in relatively polluted environment, e.g., north China, remains poor. Here aerosol volatility in Beijing in summer 2017 and 2018 was measured using a thermodenuder (TD) coupled with an Aerodyne high-resolution aerosol mass spectrometer (AMS) and a soot particle AMS. Our results showed overall similar thermograms for most non-refractory aerosol species compared with those reported in previous studies. However, high mass fraction remaining and ratio for chloride and nitrate, each above 200 ∘C, indicated the presence of considerable metallic salts and organic nitrates in Beijing. The volatility distributions of organic aerosol (OA) and four OA factors that were resolved from positive matrix factorization were estimated using a mass transfer model. The ambient OA comprised mainly semi-volatile organic compounds (SVOCs; 63 %) with an average effective saturation concentration (C*) of 0.55 µg m−3, suggesting overall more volatile properties than OA in megacities of Europe and the US. Further analysis showed that the freshly oxidized secondary OA was the most volatile OA factor (SVOC = 70 %) followed by hydrocarbon-like OA (HOA). In contrast, the volatility of more oxidized oxygenated OA (MO-OOA) was comparable to that of cooking OA with SVOC on average accounting for 60.2 %. We also compared the volatility of ambient and black-carbon-containing OA. Our results showed that the BC-containing primary OA (POA) was much more volatile than ambient POA ( µg m−3 vs. 0.37 µg m−3), while the BC-containing SOA was much less volatile, highlighting the very different composition and properties between BC-containing and ambient aerosol particles.
- Article
(2307 KB) - Full-text XML
- Companion paper
-
Supplement
(471 KB) - BibTeX
- EndNote


Atmospheric aerosols can cause a series of health risks (Lelieveld et al., 2015) and affect the earth's radiative balance (Boucher et al., 2013). As one of the most important properties, volatility modulates mass concentrations and size distributions of aerosol particles via gas-particle partitioning and hence influences hygroscopicity, optical properties, and the fate of related compounds (Topping and McFiggans, 2012; Donahue et al., 2012). Traditionally, the “two-product model” (Odum et al., 1996) has been used to parameterize the volatility distribution of secondary organic aerosol (SOA), yet it often underestimates ambient SOA substantially (Li et al., 2013; Heald et al., 2005). Donahue et al. (2006) updated the volatility distribution framework using the “Volatility Basis Set” (VBS) consisting of logarithmically spaced effective saturation concentration (C*) bins over a wide range which improves the model simulations of SOA significantly. However, there is still a large model–observation gap in predicting atmospheric organic aerosol (Zhang et al., 2013). One reason is our incomplete understanding of organic aerosol (OA) volatility in various environments.
The thermodenuder (TD) coupled with Aerodyne aerosol mass spectrometer (AMS) has been widely used to measure chemically resolved aerosol volatility in field campaigns (Huffman et al., 2009a, b) and laboratory studies (Kolesar et al., 2015; Saha and Grieshop, 2016). The mass or volume fraction remaining (MFR ∕ VFR), a ratio of the mass ∕ volume of the aerosol remaining after passing through a heated section to the species mass ∕ volume without heating, is often used as an indicator of volatility, and a larger MFR indicates lower volatility (Huffman et al., 2009a; An et al., 2007). For example, Huffman et al. (2009b) found that both ambient primary OA (POA) and SOA showed semi-volatile properties that contradicted the representation of OA volatility in most traditional models. The MFR is also affected by the enthalpy of vaporization, initial concentration, residence time in heated section, aerosol size distribution, and potential mass transfer resistances (Saleh et al., 2011); therefore, it may lead to erroneous conclusions using an MFR only as an indicator of volatility. For example, Kostenidou et al. (2018) found that SOA species with a higher MFR can be more volatile because of lower enthalpy of vaporization. As a result, a mass transfer model that, during the dynamic evaporation of the aerosol, takes into account all these properties that affect volatility, such as vaporization enthalpy residence time, particle size, and OA concentration, is needed for better interpretation of OA volatility measurements (Riipinen et al., 2010).
A number of studies have been conducted to investigate the OA volatility using thermogram models assuming fixed effective vaporization enthalpy and mass accommodation coefficient (Cappa and Jimenez, 2010; Lee et al., 2010; Paciga et al., 2016; Louvaris et al., 2017; Kostenidou et al., 2018). The results showed that OA volatility distributions may vary from place to place, and the estimated OA volatility was sensitive to the assumed values of the effective vaporization enthalpy and the mass accommodation coefficient (Riipinen et al., 2010). Saha et al. (2015) used a “dual thermodenuder” system to better constrain the estimated values by varying both temperature and residence time. Karnezi et al. (2014) proposed an improved experimental approach combining TD and isothermal dilution measurements and introduced a method for the estimation and the uncertainty range for the estimated volatility distribution together with the vaporization enthalpy and accommodation coefficient. Aerosol volatility can also be estimated with a semiempirical approach from the gas and particle phase measurements of molecules using a chemical ionization mass spectrometer equipped with a filter inlet for gases and AEROsols (FIGAERO–CIMS). Recently, Stark et al. (2017) evaluated the volatility distributions of OA from three different methods and found that the thermogram method from TD-AMS measurements could be the best for the quantification of aerosol volatility distributions.
Despite this, few volatility measurements have been reported in China, especially in northern China with high concentrations of PM2.5 (Sun et al., 2015; Li et al., 2017). Bi et al. (2015) measured the volatility of individual aerosol particles in the Pearl River Delta (PRD) region using a single particle AMS coupled with a TD. The results showed that the volatility of elemental-carbon (EC)-containing particles may depend on particle types and molecular formulas of secondary ions. Cao et al. (2018) investigated aerosol volatility in winter in the PRD region using a TD-AMS system. The results of MFRs showed that hydrocarbon-like OA (HOA) was the most volatile OA component followed by less oxidized oxygenated OA (LO-OOA), cooking and biomass burning OA (BBOA), and more oxidized oxygenated OA (MO-OOA). However, aerosol volatility in different seasons and different regions in China remains poorly understood.
In this study, aerosol volatility was measured using a TD coupled with a high-resolution AMS (TD-HR-AMS) and soot particle AMS (TD-SP-AMS) in summer 2018 and 2017 in Beijing. The OA composition and variations are analyzed with positive matrix factorization (PMF), and the volatility distributions of OA and OA factors are quantified using the mass transfer model (Riipinen et al., 2010) together with the method of Karnezi et al. (2014). The volatility distributions between ambient OA and BC-containing OA and the differences between 2017 and 2018 are elucidated.
2.1 Sampling and instrumentation
All measurements were conducted at the urban site of the Institute of Atmospheric Physics, Chinese Academy of Sciences (39∘58′28′′ N, 116∘22′16′′ E). A detailed description of the sampling site is given in Xu et al. (2015). Ambient particles larger than 2.5 µm were first filtered out by a PM2.5 cyclone. After being dried by a Nafion dryer, the remaining particles passed through an Aerodyne TD and were then sampled by an HR-AMS and a cavity-attenuated phase shift single scattering albedo monitor (CAPS PMSSA, Aerodyne Research Inc.) with a total flow rate of 1.4 L min−1. The TD was operated by alternating the bypass line (25∘ C) and TD line every 15 min from 20 May to 23 June in 2018, and the HR-AMS was operated in V-mode with a time resolution of 3 min. The temperatures in the heating section of the TD were set at 50, 120, and 250 ∘C, corresponding to the measured temperatures of 50, 116, and 226 ∘C, respectively. In addition, the data during the ramp period of temperature were also analyzed and grouped into four bins, i.e., 127, 109, 90, and 70 ∘C. In summer 2017, a TD made by the University of California, Davis (Zhou et al., 2016), coupled with the HR-AMS and SP-AMS was used to measure aerosol volatility from 4 June to 13 June. The temperature settings were 50, 100, 150, and 260 ∘C. While the operations of the HR-AMS were the same as those in 2018, the SP-AMS was operated with a laser vaporizer only, and thus it only measured refractory BC (rBC) and BC-containing aerosol species in ambient air. Considering the relatively short time measurements in 2017, discussions regarding the summer of 2017 focus primarily on the volatility comparisons between ambient OA and BC-containing OA. Note that the air residence time (RT) calculated as an average plug flow rate through the heated section was 1.9 and 7.4 s in 2017 and 2018, respectively, due to the different flow rates. As a result, the thermograms of aerosol species from the two campaigns cannot be directly compared (Saha et al., 2017; An et al., 2007). All data in this study are reported in Beijing local time.
2.2 AMS data analysis
The HR-AMS data were analyzed by PIKA V 1.15D (http://cires1.colorado.edu/jimenez-group/ToFAMSResourc es/ToFSoftware/index.html, last access: 20 July 2018). The ionization efficiency (IE) and relative ionization efficiencies (RIEs) were calibrated using pure NH4NO3 and (NH4)2SO4 following the standard protocols (Jayne et al., 2000). The RIEs used in this study were 1.4 for sulfate and 4.3 for ammonium and the default values for organics (1.4), nitrate (1.1), and chloride (1.3). Because aerosol particles were dried and only slightly acidic as indicated by (0.92 and 0.94 in 2018 and 2017, respectively), we applied a collection efficiency (CE) as function of ammonium nitrate mass fraction to ambient data and a constant CE (0.5) to TD data (Huffman et al., 2009a). The elemental composition of OA was determined with the “Improved-Ambient (I-A)” method (Canagaratna et al., 2015). The data analysis of the SP-AMS is similar to that of the HR-AMS that was detailed in Wang et al. (2019).
The particle losses through TD were corrected by the comparisons of rBC measured by SP-AMS in 2017 and the aerosolized NaCl measured by a scanning mobility particle sizer (SMPS; TSI Inc.) in 2018 between bypass line and TD line (Huffman et al., 2008). As shown in Fig. S1 in the Supplement, the mass fraction remaining at different TD temperatures was relatively constant at approximately 95 % in 2017 and ∼90 % in 2018, which are close to the values reported in London (Xu et al., 2016) and Shenzhen (Cao et al., 2018). In addition, the periods with low concentrations of aerosol species and OA factors were removed in data analysis due to the large uncertainties in calculating MFRs (Table S1 in the Supplement).
2.3 Source apportionment of OA
The high-resolution OA mass spectra of both ambient (MSambient) and the combined ambient and thermally denuded data (MSambient+TD) were analyzed with PMF to resolve potential OA factors (Paatero and Tapper, 1994; Ulbrich et al., 2009). Previous studies showed that the combined thermal denuded and bypass line data can enhance the contrast for different OA compounds and facilitate the separation of OA factors (Huffman et al., 2009a). We found that the HOA spectrum from a four-factor solution showed unrealistically high m∕z 44 in both MSambient and MSambient+TD. Therefore, the mass spectrum of HOA resolved from the period with high impacts of vehicle emissions (26 May–7 June 2018) and cooking OA (COA) from a five-factor solution were used as constraints in subsequent multilinear engine (ME-2) analysis (Paatero, 1999). Four OA factors were identified: LO-OOA, MO-OOA, and two primary factors (HOA and COA). Each factor was separated into ambient data and TD data according to the temperature shift timing recorded by the software of the TD. The mass spectra and time series of the four OA factors are shown in Fig. 1, and the comparisons between MSambient and MSambient+TD are shown in Fig. S2. The PMF analysis of MSambient+TD in 2017 identified four OA factors: HOA, COA, LO-OOA, and MO-OOA. On the other hand, that of BC-containing OA resolved a rBC-rich factor, an HOA-rich factor, and two oxygenated OA factors (LO-OOA and MO-OOA). Note that COA was not resolved from BC-containing OA, likely due to the fact that COA and BC were externally mixed (Wang et al., 2019). Compared with the HR-AMS, OA factors resolved from the SP-AMS spectra were much less oxidized. The O∕C ratios of BC-containing ambient LO-OOA and MO-OOA were 0.26 and 0.60, which was much lower than 0.62 and 1.21 for non-refractory OA. These results suggest that BC-containing OA, accounting for 49 % of OA, can be substantially different from the ambient OA. A detailed description of the source apportionment of BC-containing OA is given in Wang et al. (2019).
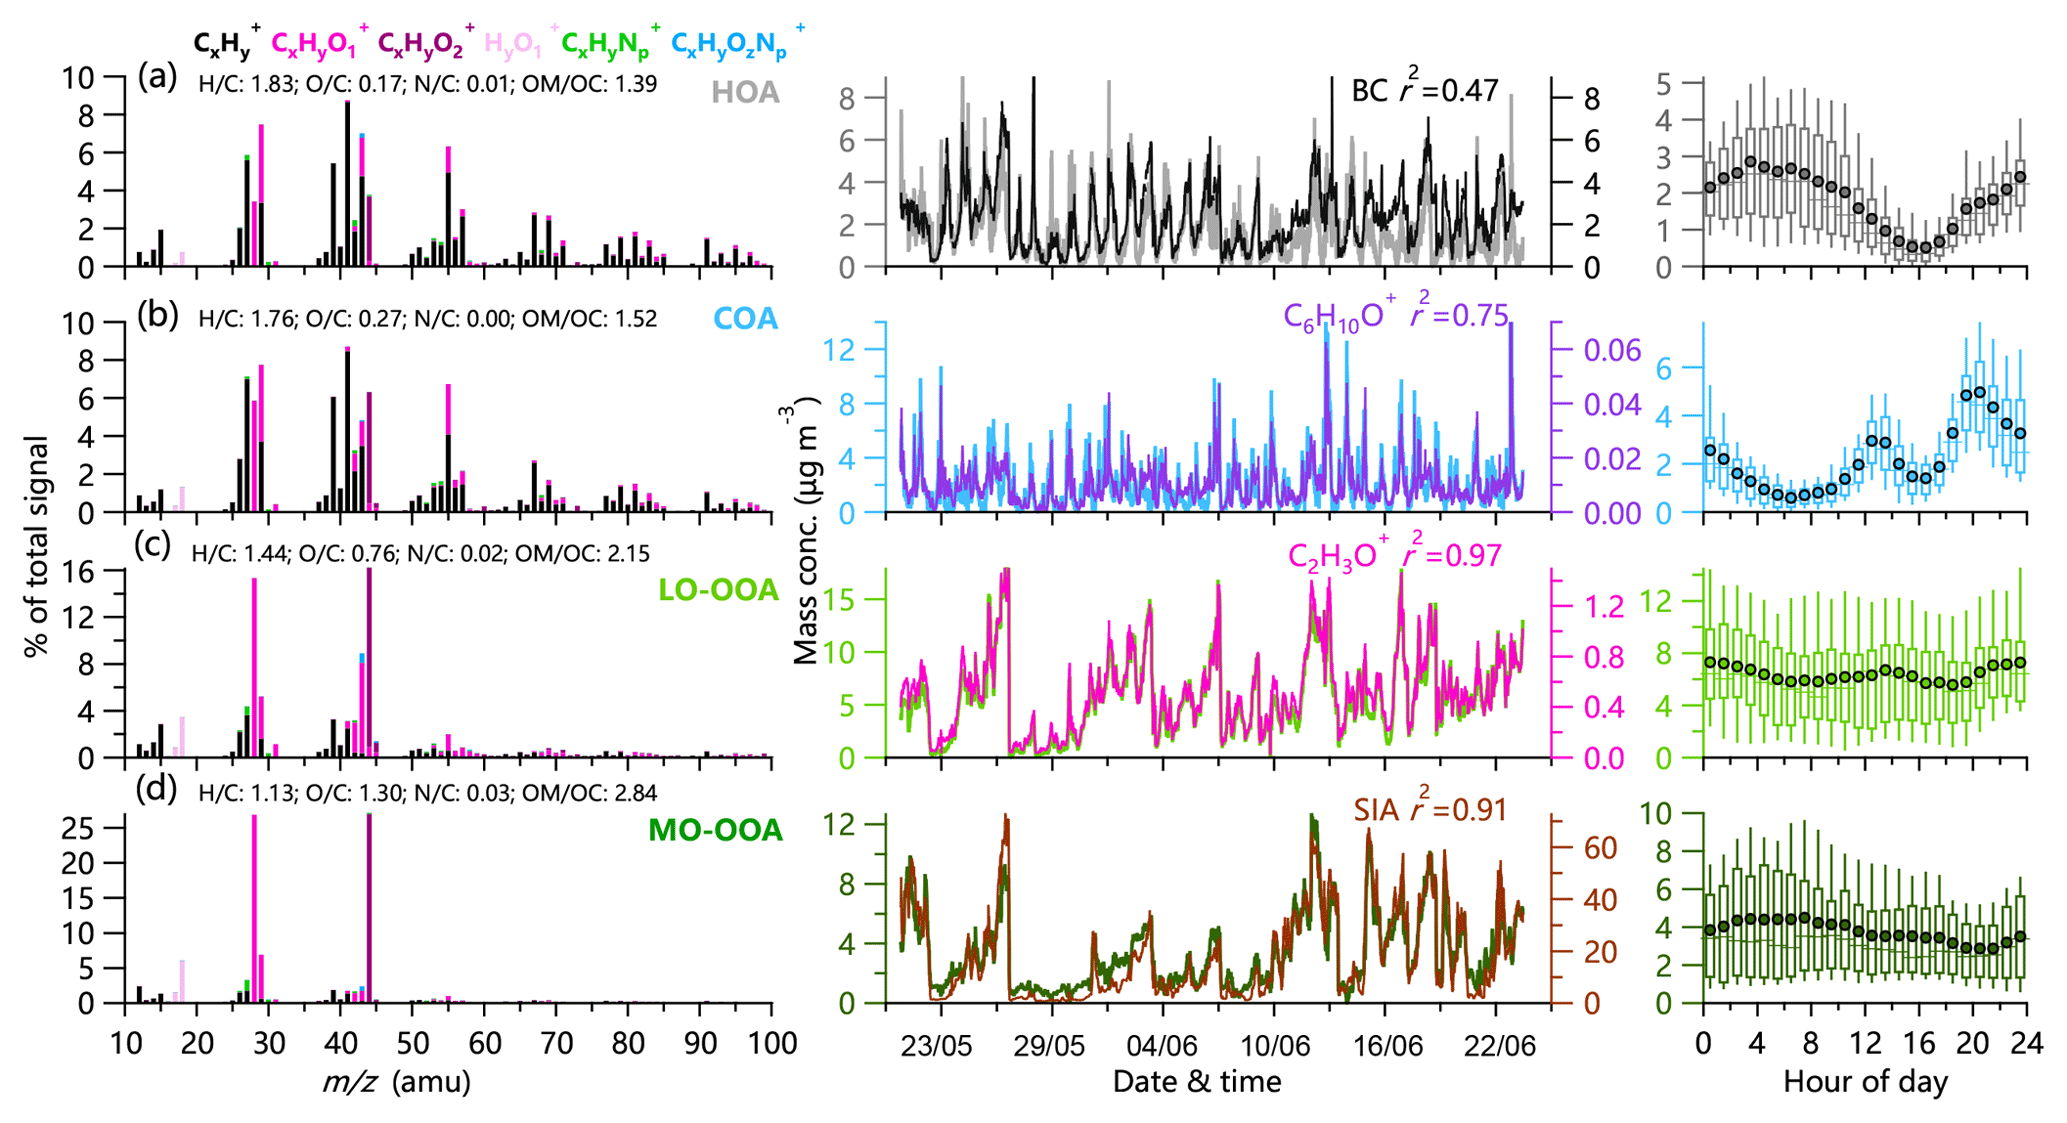
Figure 1High-resolution mass spectra (left panels), time series (middle panels), and diurnal patterns (right panels) of four OA factors in summer 2018: (a) HOA, (b) COA, (c) LO-OOA, and (d) MO-OOA. Also shown in the middle panels are the time series of other tracers, including BC, C6H10O+, C2H3O+, and SIA.
2.4 Estimation of OA volatility distribution
The time-dependent aerosol evaporation in TD was simulated using the dynamic mass transfer model (Riipinen et al., 2010). The inputs of the model include the initial mass concentration, particle size, density calculated using the method of Kuwata et al. (2011), residence time, loss-corrected MFRs, and corresponding temperatures. The particle sizes we used for fitting are presented in Table S2. The size distribution of SOA was derived from that of m∕z 44 by normalizing the integrated signals of m∕z 44 between 30 and 1500 nm to the total concentration of SOA (Zhang et al., 2005). This approach is rational because SOA was highly correlated with m∕z 44 (R2=0.98), while m∕z 44 in the mass spectra of POA was generally small. The size distribution of POA was then calculated as the difference between total OA and SOA (Xu et al., 2015).
The measured thermograms were fitted using six logarithmically spaced C* bins including 100, 10, 1, 0.1, 0.01, and 0.001 µg m−3 (or 0.00001 µg m−3), and different volatility ranges were chosen for each factor based on the best fits between the measured and predicted thermograms. Since the OA was on the order of 15 µg m−3, the thermograms contain little information on the partitioning of compounds with µg m−3. The enthalpy of vaporization and the mass accommodation coefficient were also estimated, which can affect the evaporation rate and corresponding volatilities. In order to explore the solution space in more detail, we discretized the parameter space and simulated all combinations of volatilities, ΔHvap, and am. Briefly, we used logarithmically spaced effective saturation concentration bins, varying the mass fraction of each bin from 0 to 1 with a step of 0.1, the vaporization enthalpy with discrete values of 20, 50, 80, 100, 150, and 200 kJ mol−1, and the accommodation coefficient with discrete values of 0.01, 0.05,0.1, 0.2, 0.5, and 1. In this case, we derived 96 516 different results by fitting the TD data. The combinations of all properties with the smallest error (top 1 %) were chosen to calculate the “best estimate” following the methods described in Karnezi et al. (2014).
3.1 Thermograms of aerosol species
Figure 2 shows the thermograms of non-refractory submicron aerosol (NR-PM1) species and OA factors in the summer of 2018. Consistent with previous studies, MFRs of all species show decreasing trends with increasing TD temperature. The total mass concentration of NR-PM1 decreased significantly from 31.0 to 2.0 µg m−3 with ∼7 % mass left at 226 ∘C, suggesting the presence of low-volatility compounds. MFRs varied differently among different aerosol species. Nitrate showed the fastest decreasing rate in thermograms, consistent with the results observed in London (Xu et al., 2016) and Shenzhen (Cao et al., 2018). Although ammonium nitrate is semi-volatile, ∼10 % nitrate mass was still observed at 226 ∘C. Such a considerable remaining fraction at the highest temperature was also observed in southern China (Cao et al., 2018). A possible explanation is that nitrate measured by HR-AMS also contained less volatile organic and inorganic nitrates (e.g., metallic nitrate and organic nitrates) during summertime in Beijing in 2018. As shown in Fig. 3, the ratio of NO+ to increased substantially as a function of TD temperature reaching ∼5.5 at 116 ∘C, which is much higher than that of pure NH4NO3 observed from the IE calibration (∼3.5). This result supports the presence of low-volatility organic nitrates (Ng et al., 2017; Häkkinen et al., 2012). According to the method suggested by Farmer et al. (2010), the mass concentration of organic nitrate was estimated to be 1.3–3.0 µg m−3, assuming that the ratio of (RON) of organic nitrates was 5–10. Organic nitrates on average accounted for 27 % at RON=5 (11 % at RON=10) of the total measured nitrates, which was lower than those during summertime in the south of China but was comparable to those during autumn and spring (Yu et al., 2019). As shown in Fig. 3, nitrogen-containing organic ions (e.g., C2H6N+, CHNO+) showed a higher MFR than inorganic NO+ and across different temperatures, supporting the lower volatility of nitrogen-containing compounds than ammonium nitrate.

Figure 2Thermograms of (a) non-refractory submicron aerosol (NR-PM1) species, (b) OA factors, and O∕C in summer 2018. Panels (c) and (d) show mass fractions of NR-PM1 aerosol species and OA factors versus TD temperature.
Chloride showed a moderate decreasing rate with 30 % mass left at 226 ∘C, a behavior quite different from pure NH4Cl that completely evaporated at 80 ∘C (Huffman et al., 2009a). This result suggests that a considerable fraction of chloride measured by HR-AMS was also in the form of less volatile chloride salts (e.g., KCl) rather than ammonium chloride. The MFR of sulfate changed slowly before 80 ∘C and then decreased rapidly to approximately 88 % at 226 ∘C for the 2018 campaign. This is different from the behavior in 2017 when the MFR started declining above 150 ∘C (Fig. S4). Such differences are due a large extent to different TD characteristics (e.g., residence time). We noticed the changes in and ratios after 100 ∘C, suggesting the changes in sulfate composition. One explanation is the presence of organosulfates or other inorganic sulfate salts. As shown in Fig. 3, the MFR of , a marker ion for methanesulfonic acid (MSA) (Ge et al., 2012), showed a different thermogram compared to SO+, , and , supporting the different volatility of sulfate and sulfur-containing organic compounds.
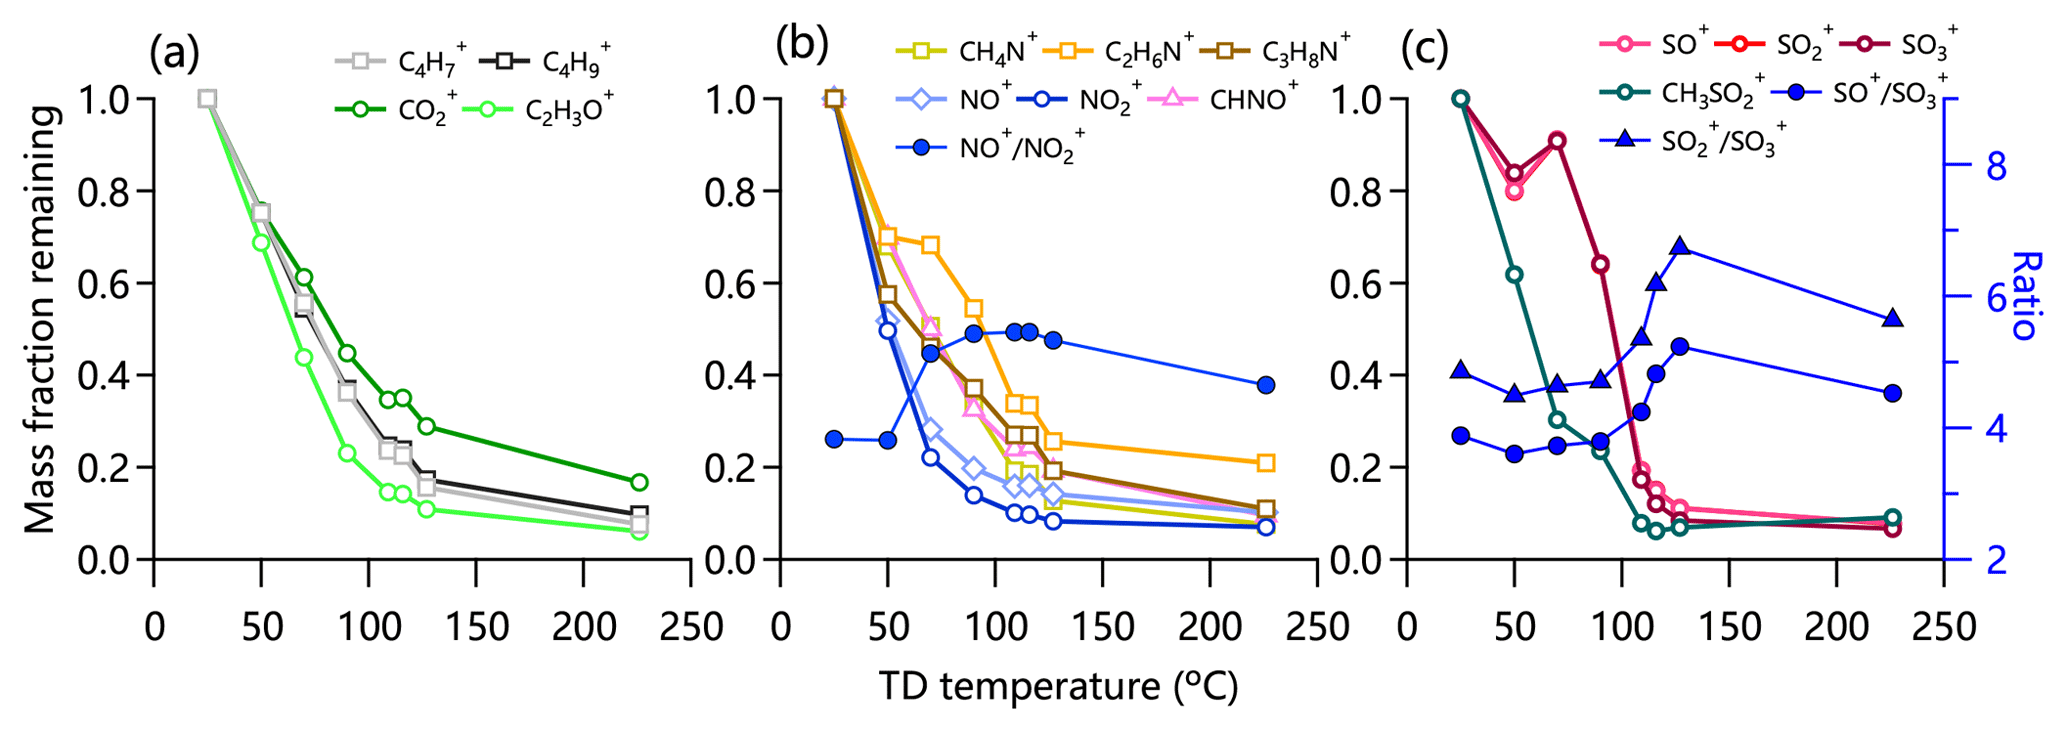
Figure 3Thermograms of (a) , , , and C2H3O+; (b) CH4N+, C2H6N+, C3H8N+, NO+, , and CHNO+; and (c) SO+, , , and in summer 2018. The variations in ratios of , , and are shown in (b) and (c).
At 226 ∘C, around 10 % of the organic mass remained, accounting for ∼50 % of the total NR-PM1 mass (Fig. 2) and indicating an important role of organics in low-volatility compounds. While the contribution of low-volatility OA is close to that in London (Xu et al., 2016), it is much lower than that observed during the SOAR-1 and MILAGRO campaign (Huffman et al., 2009a), which might be due to the differences in sources and composition at different sampling sites besides the different residence time and TD properties.
3.2 OA composition and thermograms of OA factors
PMF analysis identified four OA factors in the summer of 2018 and 2017: LO-OOA, MO-OOA, and two primary factors (HOA and COA). Consistent with previous studies, HOA was well correlated with BC (r2=0.47), and COA was correlated with C6H10O+ (r2=0.75). Similarly, LO-OOA and MO-OOA were highly correlated with C2H3O+ (m∕z 43, r2=0.97) and secondary inorganic aerosol (SIA; r2=0.91), respectively. More diagnostic correlations between OA factors and tracers are shown in Fig. S3. The diurnal patterns of four OA factors were also similar to those previously reported in urban Beijing. For example, HOA presented a pronounced diurnal cycle with high concentrations at night, and COA showed two pronounced peaks during mealtimes. Similarly, the diurnal profiles of both LO-OOA and MO-OOA were relatively flat, yet the time series were quite different. As shown in Fig. 4, SOA (LO-OOA+MO-OOA as a surrogate) dominated OA during both periods, on average accounting for 65 % and 72 % in 2017 and 2018, respectively, consistent with the results from previous studies (Sun et al., 2018; Hu et al., 2016). LO-OOA was the dominant SOA factor, accounting for 39 % and 45 % of the total OA in 2017 and 2018, respectively, while the contribution of MO-OOA was comparable (∼26 %–27 %). The differences in POA (HOA+COA as a surrogate) composition between 2017 and 2018 were also observed. Although the contribution of HOA was comparable (11 % vs. 13 %), that of COA decreased from 24 % in 2017 to 15 % in 2018.
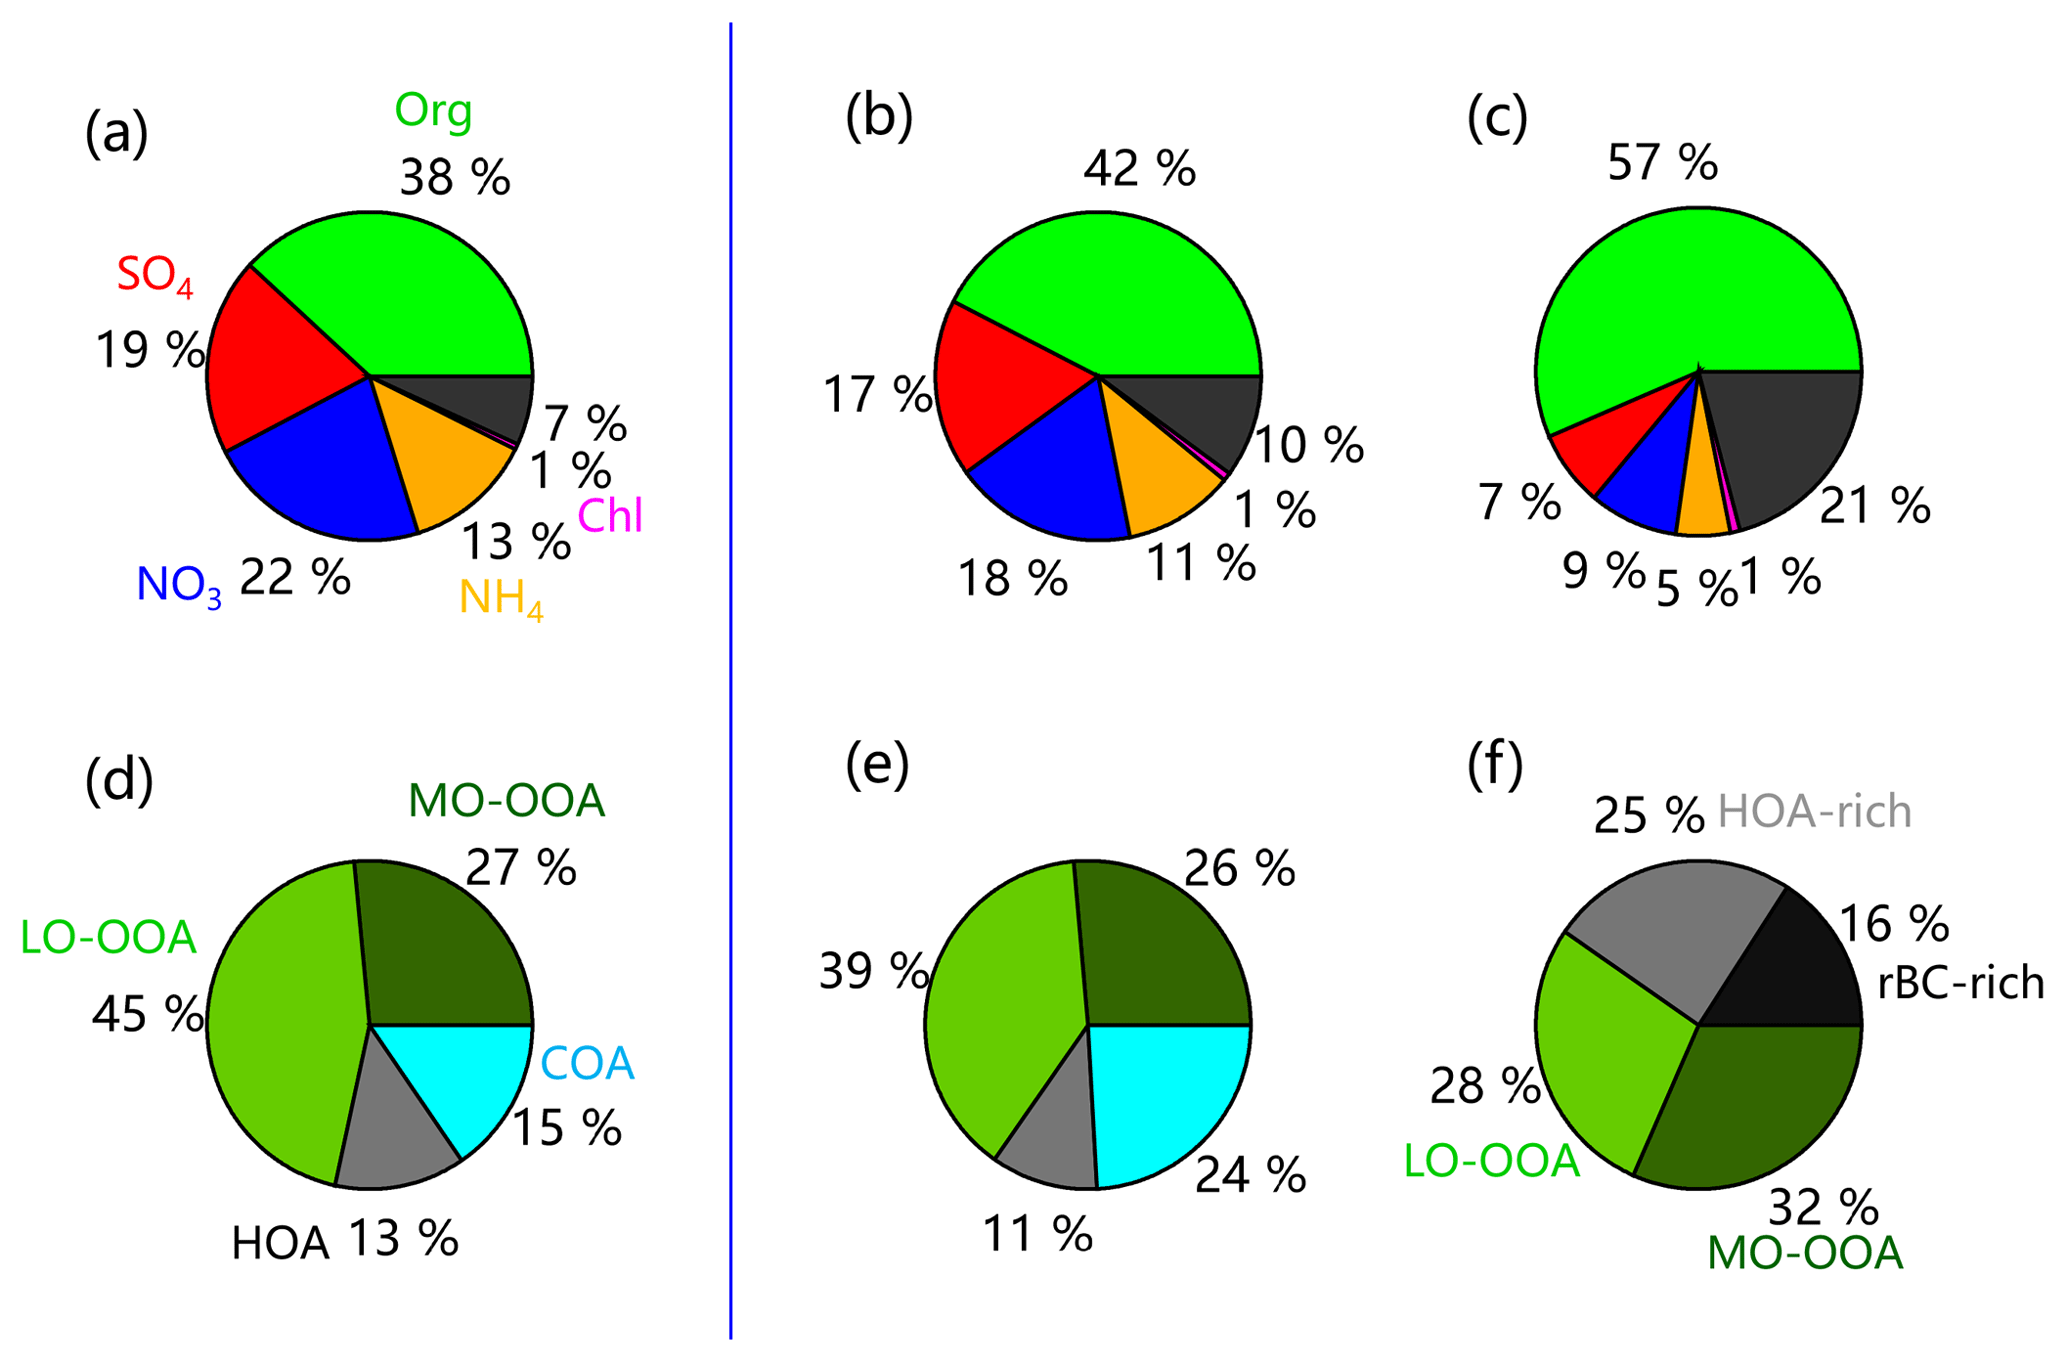
Figure 4Average composition of PM1 and OA in summer (a, d) 2018 and (b, e) 2017. The average composition of BC-containing aerosol and OA in summer 2017 is shown in (c, f).
As shown in Fig. 2, the MFR of HOA was 0.73 at 50 ∘C and then decreased to 0.1 at 226 ∘C. Half of the HOA mass evaporated at ∼70 ∘C (T50), which was comparable to what was measured during the MILAGRO and SOAR-1 campaigns (Huffman et al., 2009a) but slightly higher than in Shenzhen (Cao et al., 2018) and Paris (T50 = 49–54 ∘C) (Paciga et al., 2016). Although the mass concentration of HOA decreased substantially at higher TD temperatures, its fraction in OA remained relatively constant (∼15 %). Such results are consistent with those observed at the North Kensington site (16 %) and Detling (19 %) (Xu et al., 2016), yet larger than that reported in Shenzhen (Cao et al., 2018). Compared to HOA, COA showed a higher T50 (∼85 ∘C), but this was lower than that observed in Shenzhen (Cao et al., 2018) and Paris (Paciga et al., 2016), suggesting that COA in Beijing might contain a higher fraction of compounds with high volatility . One reason might be the different cooking methods generating OA with different volatility. Note that the MFR of COA showed slightly higher values than HOA in the range of 50 to 120 ∘C, suggesting that COA contained more compounds with high C* compared with HOA. This was also supported by the higher fraction of µg m−3 for HOA (51 %) than COA (37 %; see Sect. 3.3 for more details).
LO-OOA evaporated 33 % at T=50 ∘C in Beijing, which is comparable to Shenzhen (30 %) (Cao et al., 2018) and Paris (Paciga et al., 2016) but higher than in Centreville (Kostenidou et al., 2018). The concentration of LO-OOA decreased from 5.7 µg m−3 at ambient temperature to 0.15 µg m−3 at T=226 ∘C, and its contribution to OA also decreased from 45 % to 15 %. Similarly, the MFR of MO-OOA showed the slowest decreasing rate in thermograms among all OA factors. As a result, the fraction of MO-OOA in OA showed an increasing trend and became the dominant component at 226 ∘C (Fig. 2). Previous studies showed that such nonvolatile organic compounds might be associated with humic-like substances (HULIS) (Wu et al., 2009), an important component of fine particles in Beijing (Ma et al., 2018). However, MO-OOA in this study evaporated faster than at other sites, e.g., ∼16 % evaporation at T=50 ∘C compared with 1 %–10 % in Shenzhen (Cao et al., 2018) and SOAR-1 and MILAGRO campaigns (Huffman et al., 2009a). These results might suggest that MO-OOA in this study showed a higher fraction of compounds with relatively high volatility than those previously reported at other sites due to different SOA composition and properties. We further checked the thermograms of NR-PM1 species and OA factors at different time periods in a day. As shown in Fig. S5, MO-OOA appeared less volatile at nighttime than daytime, while the diurnal changes in LO-OOA volatility were small. The reasons for the differences in the diurnal variability are likely the different volatile organic compounds' (VOCs') precursors, formation mechanisms, and meteorological conditions between day and night.
The O∕C increased as a function of TD temperature varying from 0.68 in ambient air to 1.17 at 226 ∘C (Fig. 2). Such a behavior was consistent with that previously observed at other sites (Xu et al., 2016; Cao et al., 2018), suggesting that the OA remaining at a higher temperature was more oxidized. This is further supported by the higher MFR of oxygenated ions than that of CxHyO+ (Fig. S6). Note that O∕C and the MFR were weakly correlated (r<0.21), suggesting that O∕C might not be a good proxy to indicate the volatility (Hildebrandt et al., 2010; Xu et al., 2016).
3.3 Volatility distribution of OA factors
Figure 5 summarizes the volatility distributions of the total OA and four OA factors. The predicted thermograms and absolute OA concentrations in different volatility bins are depicted in Figs. S7 and S8. The average C* at different sites can be directly compared in the same VBS volatility range (Table S3). In summer 2018, the average C* of OA was 0.55 µg m−3 with vaporization enthalpy (ΔH) and the mass accommodation coefficient (am) being 105 KJ mol−1 and 0.33, respectively. The compounds with , 10, and 100 µg m−3 referring to semi-volatile organic compounds (SVOCs) (Murphy et al., 2014) contributed 17 %, 19 %, and 28 % to the total OA, respectively. Similarly, low-volatility organic compounds (LVOCs) with and 0.1 µg m−3 (Murphy et al., 2014) accounted for 11 % and 12 %, respectively. In addition, OA consisted of ∼13 % extremely low-volatility compounds (ELVOCs with µg m−3), consistent with the remaining organic mass fraction at 226 ∘C (9 %). The SVOC fraction in Beijing in summer 2018 was overall larger than those reported in Finokalia (30 %–60 %) (Lee et al., 2010), Athens (38 %) (Louvaris et al., 2017), Centreville and Raleigh (60 %) (Saha et al., 2017), and Mexico City (39 %–73 %; Cappa and Jimenez, 2010). Such results might suggest relatively higher volatility of OA in summer in Beijing than at other sites, consistent with the fact that the fraction of evaporated particulate organics (28 %) at 50 ∘C was larger than that observed in Shenzhen (∼10 %) (Cao et al., 2018), Centreville and Raleigh (Kostenidou et al., 2018; Saha et al., 2017), and Athens (Louvaris et al., 2017). Note that the ELVOCs in Beijing in summer 2018 were comparable to that reported in Centreville and Raleigh (14 %) (Saha et al., 2017), yet lower than that in Athens (30 %) (Louvaris et al., 2017).

Figure 5Predicted volatility distributions of OA and four OA factors in 2018. The error bars are the uncertainties derived using the approach of Karnezi et al. (2014). Vaporization enthalpies, accommodation coefficients, and volatility fractions of SVOC and LVOC for four OA factors are shown in (f).
The volatility of four OA factors was different. The average volatility of MO-OOA was µg m−3 (ΔH=57 KJ mol−1 and am=0.31). LVOC on average accounted for 40 % of MO-OOA, which is comparable to that in Centreville (44 %, ΔH=89 KJ mol−1 and am=1) during summertime (Kostenidou et al., 2018), yet lower than those observed during summertime in Athens and Paris (Louvaris et al., 2017; Paciga et al., 2016). These results supported a relatively more volatile nature of MO-OOA in Beijing during summertime compared with other cities. Similar to the variation in MFRs in thermograms, LO-OOA with an average contribution of LVOC of 30 % was more volatile ( µg m−3) than MO-OOA. This result suggests that the freshly oxidized SOA in Beijing is quite volatile and may affect OA concentration substantially via gas-particle partitioning (Kostenidou et al., 2018).
SVOC on average contributed 67 % to HOA, which was much higher than that from diesel vehicles (May et al., 2013), and traffic emissions near a road (Saha et al., 2018), yet close to that observed in Paris (63 %) (Paciga et al., 2016). These results suggest that HOA from vehicle emissions in Beijing was relatively more volatile. One reason is the different types of fuel used for vehicles (Saha et al., 2018). Another reason might be the much lower diesel emissions in Beijing city because diesel trucks are only allowed to enter the 6th Ring Road between 00:00 and 06:00. This is consistent with the lowest MFR for HOA during 00:00–6:00 at T>100 ∘C (Fig. S5). It should be noted that ELVOCs accounted for 13% of HOA, which was lower than in Athens (30 %) (Louvaris et al., 2017) but comparable to Paris (11 %–13 %) (Paciga et al., 2016). These results indicate that a considerable fraction of HOA was nonvolatile although it was regarded as one of the most volatile OA factors (Paciga et al., 2016; Cao et al., 2018). The C* of COA was 0.79 µg m−3 (ΔH=95 KJ mol−1 and am=0.39), and LVOC on average accounted for 40%. The average COA volatility was relatively comparable to that of MO-OOA, possibly due to the fact that COA was dominated by fatty acids with relatively low volatilities (Mohr et al., 2009). However, compared with previous studies in Athens and Paris, the fraction of LVOC in COA in Beijing was much lower (40 % vs. 63 %–75 %) (Louvaris et al., 2017; Paciga et al., 2016), suggesting that COA in Beijing contained more volatile compounds, likely due to the differences in cooking oils and styles.
3.4 Volatility comparisons between ambient OA and BC-containing OA
Figure 4 presents a comparison of aerosol composition between HR-AMS and SP-AMS in summer 2017. The BC-containing aerosol particles were dominated by OA (57 %), which was much higher than that (42 %) from HR-AMS measurements, while the contributions of secondary inorganic aerosols (nitrate, sulfate, and ammonium) were correspondingly lower (21 % vs. 46 %). The composition of BC-containing OA was also substantially different from ambient OA. First, cooking OA was not observed in BC-containing OA, suggesting that COA was externally mixed with BC and was unlikely coated on BC. Further support is that the diurnal pattern of BC-containing OA did not present two pronounced COA peaks as ambient OA (Fig. S9). Second, OA coated on BC was much less oxidized compared with those in ambient aerosol (O∕C = 0.36 vs. 0.57 on average). As a result, the volatility of BC-containing OA was expected to be different from ambient OA. The estimated volatility distributions and thermograms of ambient OA and BC-containing OA are presented in Figs. S10 and S11.
As shown in Fig. 6, the average volatility of BC-containing OA was µg m−3, which is larger than that of ambient OA ( µg m−3). Consistently, a lower fraction of LVOC (41 %) was observed for BC-containing OA than ambient OA (46 %), indicating that the BC-containing OA was overall more volatile than ambient OA. We noticed that such differences in volatility appeared to contradict the variations in thermograms, which show that more than 81 % of ambient OA was evaporated at T=260 ∘C, while it was only 66 % for BC-containing OA (Fig. S4). Such discrepancies can be explained by the lower effective vaporization enthalpy of BC-containing OA (71 vs. 54 KJ mol−1). The volatility of BC-containing ambient POA and SOA were also different from those of ambient OA. As shown in Fig. S9, the MFR of BC-containing ambient POA was ubiquitously higher than that of ambient POA across different TD temperatures and also much higher than ambient POA after excluding the influences of COA. As indicated by the estimated volatility distribution, the average volatility of BC-containing ambient POA was µg m−3, which was much higher than that of ambient POA ( µg m−3), and the contribution of LVOC was correspondingly lower (43 % vs. 45 %). In contrast, the BC-containing ambient SOA showed a lower volatility than ambient SOA as indicated by lower C* (0.30 µg m−3 vs. 0.49 µg m−3) and the fraction of SVOC (52 % vs. 57 %). These results suggest that the BC-containing ambient POA contains more volatile compounds compared to ambient POA. One reason was likely the fact that the BC-containing OA contains refractory primary species which cannot be measured by HR-AMS. Another reason was that some low-volatility OAs from primary emissions were not coated on BC, for example COA, which was supported by the comparable average volatility between BC-containing ambient POA and the ambient POA after excluding COA (0.69 µg m−3 vs. 0.64 µg m−3).
Figure 6Predicted volatility distributions of OA, POA, and SOA measured by TD-HR-AMS and TD-SP-AMS in 2017. The error bars are the uncertainties derived using the approach of Karnezi et al. (2014).
The Weather Research and Forecasting – Chemistry (WRF-Chem, version 3.7.1) model was used to simulate the volatility distribution of SOA in the summer of 2017. The detailed physical and chemical schemes have been given in Zhang et al. (2019). As shown in Fig. 7, the compounds with C* = 10 and 100 µg m−3 estimated from the thermogram method contributed 18 % and 19 % to the total OA, respectively, which was comparable to that simulated by WRF-Chem (35 % in total). However, considerable discrepancies in contributions of compounds with relatively small C* were observed. For example, the fraction of compounds with µg m−3 estimated by WRF-Chem was 45 %, which was much larger than that from the thermogram method (21 %). Similarly, the compounds with , 0.01, and 0.1 µg m−3 estimated from the thermogram method were correspondingly higher (43 % vs. 19 %). These results suggest that the current WRF-Chem model might underestimate the fraction of low-volatility compounds considerably. One of the major uncertainties in predicting the volatility distribution of SOA in WRF-Chem arises from the emission inventories, especially volatile, semi-volatile, and intermediate-volatility organic compounds. For example, Streets et al. (2003) estimated the overall uncertainty in non-methane VOC (NMVOC) emissions in Asia for the year 2000 to be ±130 %, and the uncertainty in NMVOC emissions in China for the year 2005–2006 was in the range of −68 % to 120 % (Bo et al., 2008; Wei et al., 2008; Zhang et al., 2009; Zheng et al., 2009). Therefore, semi-volatile and intermediate-volatility organic compound emissions in China are too limited to be used in SOA simulations (Liu et al., 2017). In addition, model underestimation of atmospheric oxidation capacity, especially in polluted areas, due mainly only to the inclusion of the key gas-phase production of HONO in air quality models (Sarwar et al., 2008; Li et al., 2010, 2011; Zhang et al., 2019), and few volatility bins used in WRF-Chem, especially for volatility bins of less than 1 µg m−3 at 300 K, all contributed to the discrepancies between model simulation and observations.
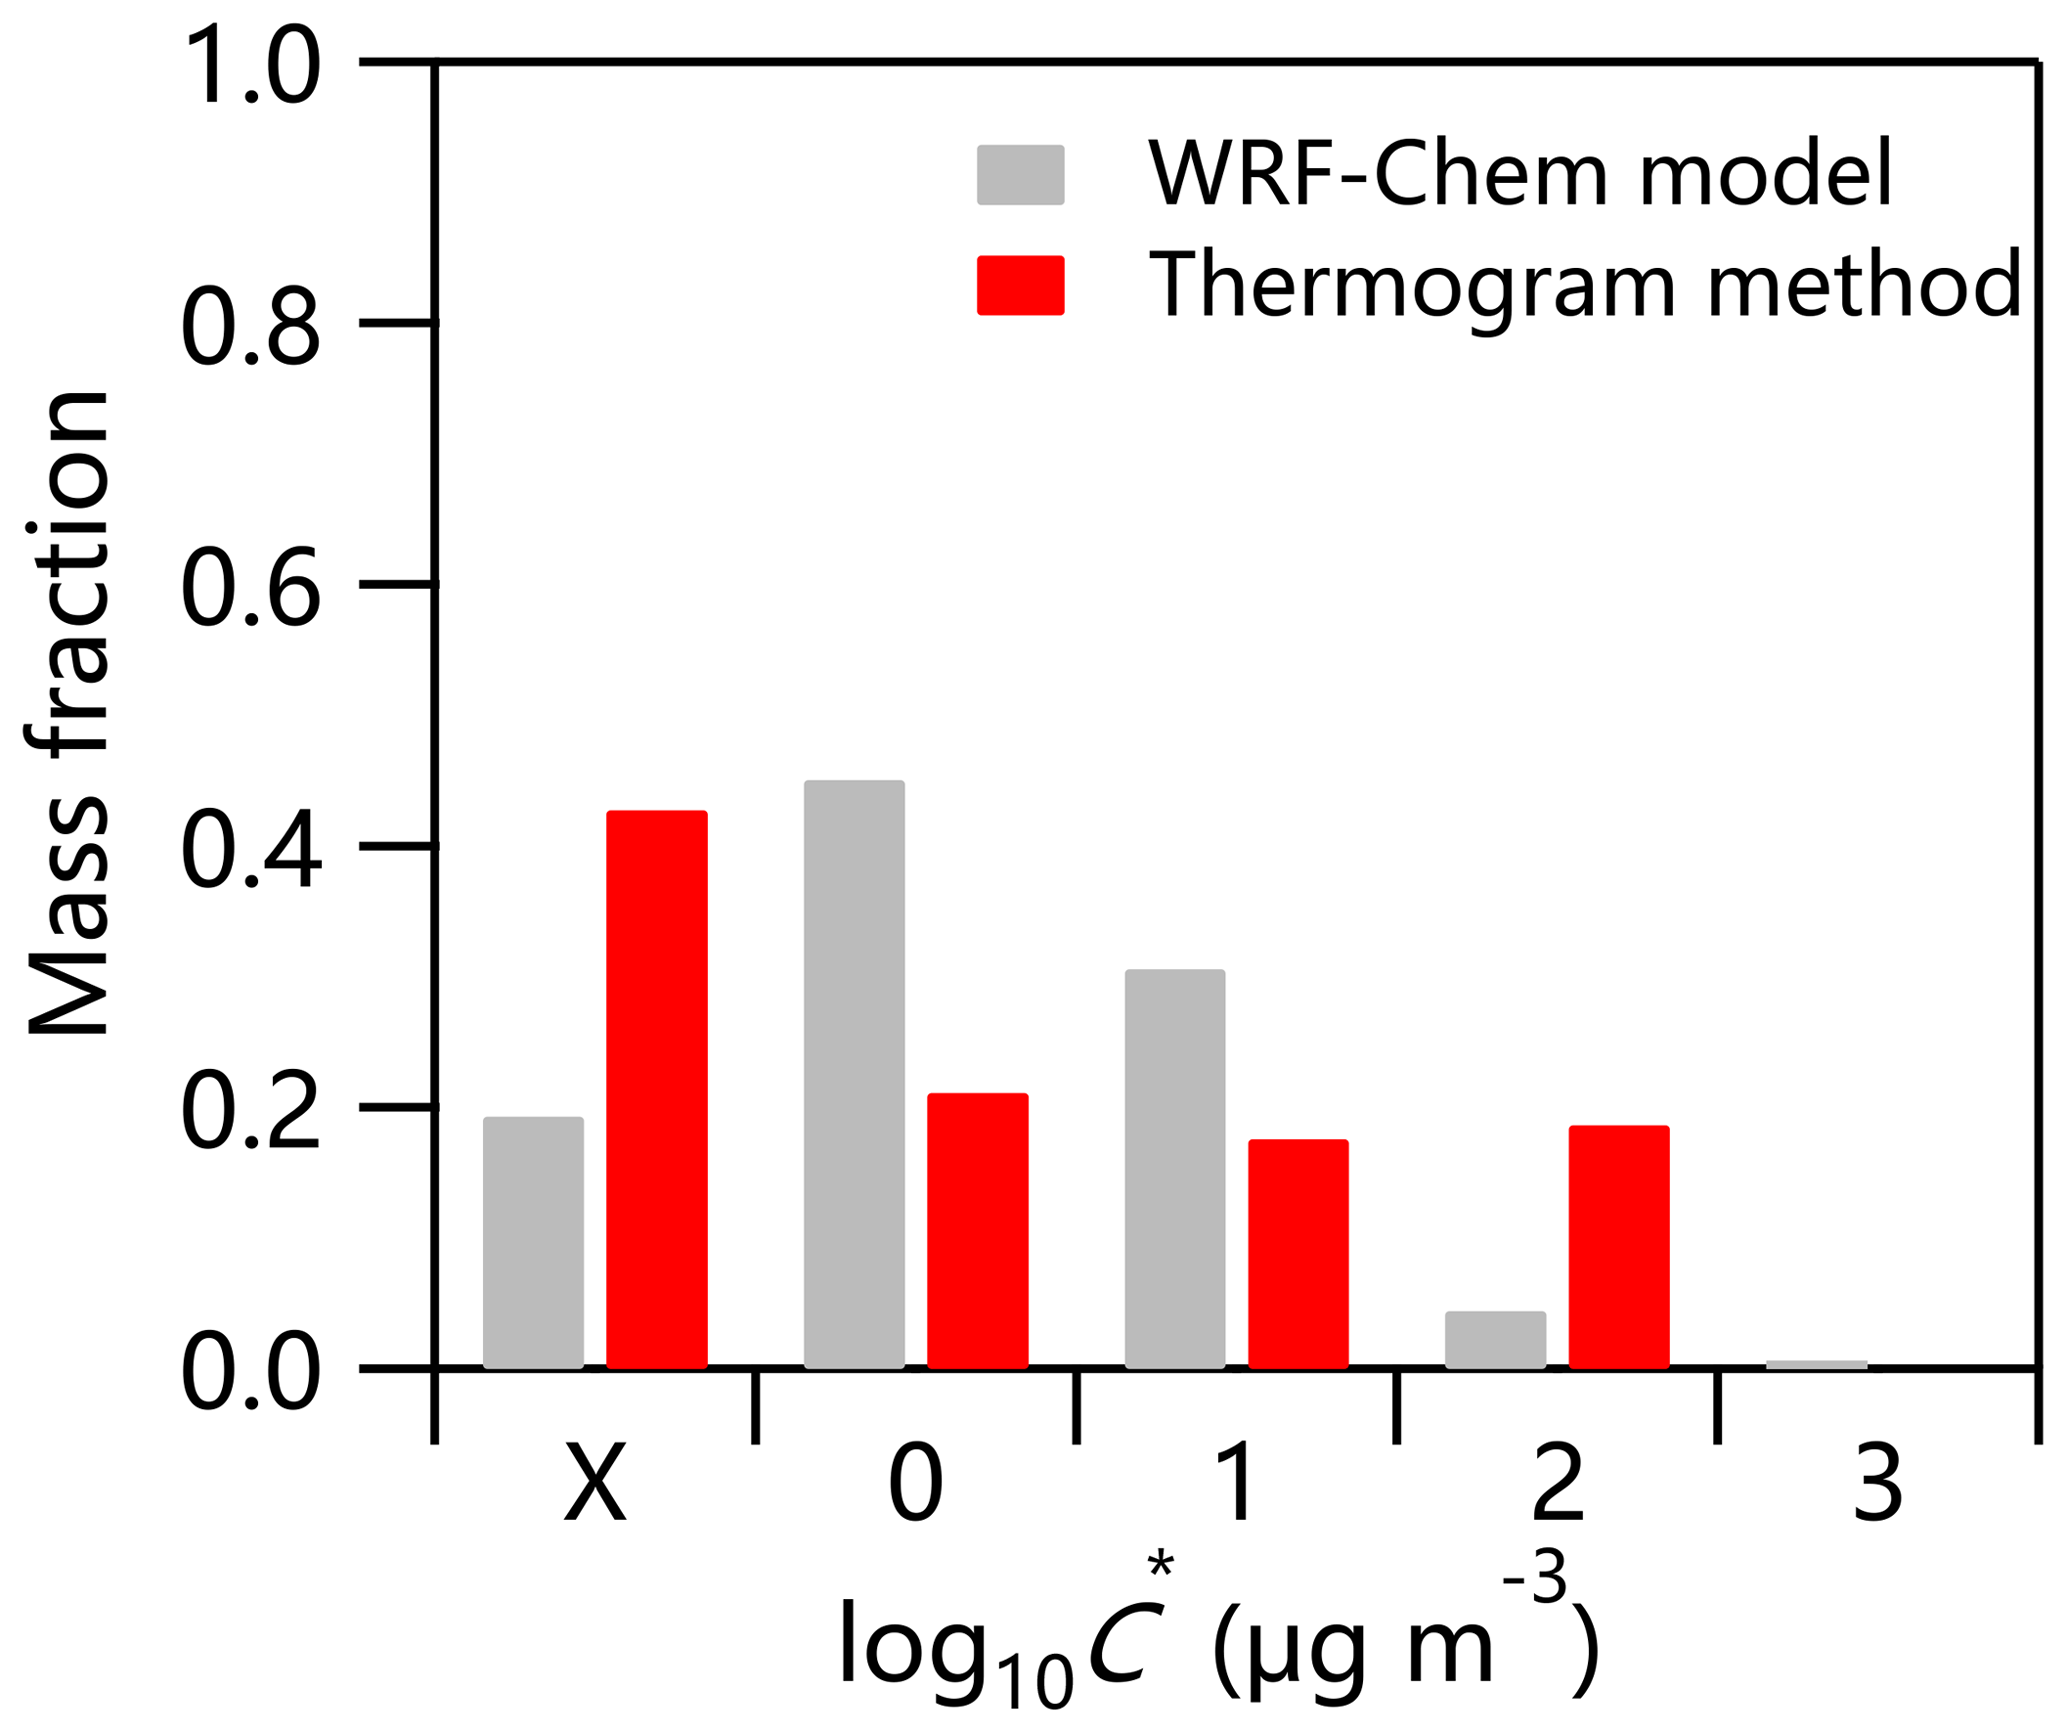
Figure 7Volatility distributions of SOA estimated by WRF-Chem model and thermogram method in summer 2017.
Aerosol volatility was measured using a TD-AMS system in Beijing in the summer of 2017 and 2018. Our results showed overall higher fractions of SVOC and saturation concentrations for OA in Beijing compared with those in other megacities in Europe and the US, suggesting that OA was more volatile in Beijing. In contrast, inorganic nitrate and chloride showed higher MFRs in thermograms, suggesting the presence of organic nitrates and metallic salts other than ammonium nitrate and ammonium chloride. The volatility of OA and four OA factors was estimated with a mass transfer model. MO-OOA and COA showed lower volatility than LO-OOA and HOA, with the contributions of LVOC being 39.8 % and 40.5 %, respectively. Similarly, LO-OOA and HOA presented higher contributions of SVOC (70 % and 67 %, respectively). We also compared the volatility of ambient OA with that of BC-containing OA. The results showed that the BC-containing ambient POA showed much higher volatility compared with that of ambient POA ( µg m−3 vs. 0.37 µg m−3), while the volatility of SOA was lower ( µg m−3 vs. 0.49 µg m−3), highlighting the very different aerosol composition and volatility between ambient OA and BC-containing OA. The volatility distributions of SOA estimated from the measurement in Beijing were compared with those predicted by the WRF-Chem model in the summer of 2017. Compared to the results of the WRF-Chem model, the lower fraction of compounds with µg m−3 (21 % vs. 45 %) and the higher fraction of compounds with µg m−3 (43 % vs. 19 %) estimated from thermogram methods suggest that the current WRF-Chem model might underestimate the fraction of low-volatility compounds considerably. Therefore, the uncertainties in emission inventories of VOCs and semi-volatile and intermediate-volatility organic compounds need to be reduced substantially to improve the model simulations of OA. Also, comparisons of more model-based and observation-based volatility bins (e.g., 8 or 12 bins) are needed in the future.
The data in this study are available from the authors upon request (sunyele@mail.iap.ac.cn).
The supplement related to this article is available online at: https://doi.org/10.5194/acp-19-10205-2019-supplement.
YS and WX designed the research. WX, CX, JW, XG, QW, JianZ, WD, YQ, WZ, and YH conducted the measurements. WX, EK, CX, and JW analyzed the data. QZ supported the TD, and EK and SP supported the mass transfer model analysis. JingZ and JA provided WRF-Chem data. YL, JL, PF, ZW, and DW reviewed and commented on the paper. WX and YS wrote the paper.
Douglas R. Worsnop is an employee of Aerodyne Research, Inc. (ARI), which developed HR-AMS and SP-AMS utilized in this study.
The authors would like to acknowledge Lu Xu at the California Institute of Technology, Wenyi Yang at the Institute of Atmospheric Physics, Chinese Academy of Sciences, and Thomas Berkemeier at the Max Planck Institute for Chemistry for helpful discussions.
This research has been supported by the National Natural Science Foundation of China (grant nos. 91744207, 41575120, 41571130034) and the National Key Research and Development Program of China (grant nos. 2017YFC0209601 and 2017YFC0212704).
This paper was edited by Manabu Shiraiwa and reviewed by two anonymous referees.
An, W. J., Pathak, R. K., Lee, B.-H., and Pandis, S. N.: Aerosol volatility measurement using an improved thermodenuder: Application to secondary organic aerosol, J. Aerosol Sci., 38, 305–314, https://doi.org/10.1016/j.jaerosci.2006.12.002, 2007.
Bi, X., Dai, S., Zhang, G., Qiu, N., Li, M., Wang, X., Chen, D., Peng, P. a., Sheng, G., Fu, J., and Zhou, Z.: Real-time and single-particle volatility of elemental carbon-containing particles in the urban area of Pearl River Delta region, China, Atmos. Environ., 118, 194–202, https://doi.org/10.1016/j.atmosenv.2015.08.012, 2015.
Bo, Y., Cai, H., and Xie, S. D.: Spatial and temporal variation of historical anthropogenic NMVOCs emission inventories in China, Atmos. Chem. Phys., 8, 7297–7316, https://doi.org/10.5194/acp-8-7297-2008, 2008.
Boucher, O., Randall, D., Artaxo, P., Bretherton, C., Feingold, G., Forster, P., Kerminen, V.-M., Kondo, Y., Liao, H., Lohmann, U., Rasch, P., Satheesh, S. K., Sherwood, S., Stevens, B., and Zhang, X. Y.: Clouds and Aerosols, in: Climate Change 2013: The Physical Science Basis. Contribution of Working Group I to the Fifth Assessment Report of the Intergovernmental Panel on Climate Change, Cambridge University Press, 2013.
Canagaratna, M. R., Jimenez, J. L., Kroll, J. H., Chen, Q., Kessler, S. H., Massoli, P., Hildebrandt Ruiz, L., Fortner, E., Williams, L. R., Wilson, K. R., Surratt, J. D., Donahue, N. M., Jayne, J. T., and Worsnop, D. R.: Elemental ratio measurements of organic compounds using aerosol mass spectrometry: characterization, improved calibration, and implications, Atmos. Chem. Phys., 15, 253–272, https://doi.org/10.5194/acp-15-253-2015, 2015.
Cao, L.-M., Huang, X.-F., Li, Y.-Y., Hu, M., and He, L.-Y.: Volatility measurement of atmospheric submicron aerosols in an urban atmosphere in southern China, Atmos. Chem. Phys., 18, 1729–1743, https://doi.org/10.5194/acp-18-1729-2018, 2018.
Cappa, C. D. and Jimenez, J. L.: Quantitative estimates of the volatility of ambient organic aerosol, Atmos. Chem. Phys., 10, 5409–5424, https://doi.org/10.5194/acp-10-5409-2010, 2010.
Donahue, N. M., Robinson, A. L., Stanier, C. O., and Pandis, S. N.: Coupled partitioning, dilution, and chemical aging of semivolatile organics, Environ. Sci. Technol., 40, 2635–2643, 2006.
Donahue, N. M., Henry, K. M., Mentel, T. F., Kiendler-Scharr, A., Spindler, C., Bohn, B., Brauers, T., Dorn, H. P., Fuchs, H., Tillmann, R., Wahner, A., Saathoff, H., Naumann, K.-H., Möhler, O., Leisner, T., Müller, L., Reinnig, M.-C., Hoffmann, T., Salo, K., Hallquist, M., Frosch, M., Bilde, M., Tritscher, T., Barmet, P., Praplan, A. P., DeCarlo, P. F., Dommen, J., Prévôt, A. S. H., and Baltensperger, U.: Aging of biogenic secondary organic aerosol via gas-phase OH radical reactions, P. Natl. Acad. Sci. USA, 109, 13503–13508, https://doi.org/10.1073/pnas.1115186109, 2012.
Farmer, D. K., Matsunaga, A., Docherty, K. S., Surratt, J. D., Seinfeld, J. H., Ziemann, P. J., and Jimenez, J. L.: Response of an aerosol mass spectrometer to organonitrates and organosulfates and implications for atmospheric chemistry, P. Natl. Acad. Sci. USA, 107, 6670–6675, https://doi.org/10.1073/pnas.0912340107, 2010.
Ge, X., Zhang, Q., Sun, Y., Ruehl, C. R., and Setyan, A.: Effect of aqueous-phase processing on aerosol chemistry and size distributions in Fresno, California, during wintertime, Environ. Chem., 9, 221–235, 2012.
Häkkinen, S. A. K., Äijälä, M., Lehtipalo, K., Junninen, H., Backman, J., Virkkula, A., Nieminen, T., Vestenius, M., Hakola, H., Ehn, M., Worsnop, D. R., Kulmala, M., Petäjä, T., and Riipinen, I.: Long-term volatility measurements of submicron atmospheric aerosol in Hyytiälä, Finland, Atmos. Chem. Phys., 12, 10771–10786, https://doi.org/10.5194/acp-12-10771-2012, 2012.
Heald, C. L., Jacob, D. J., Park, R. J., Russell, L. M., Huebert, B. J., Seinfeld, J. H., Liao, H., and Weber, R. J.: A large organic aerosol source in the free troposphere missing from current models, Geophys. Res. Lett., 32, L18809, https://doi.org/10.1029/2005GL023831, 2005.
Hildebrandt, L., Engelhart, G. J., Mohr, C., Kostenidou, E., Lanz, V. A., Bougiatioti, A., DeCarlo, P. F., Prevot, A. S. H., Baltensperger, U., Mihalopoulos, N., Donahue, N. M., and Pandis, S. N.: Aged organic aerosol in the Eastern Mediterranean: the Finokalia Aerosol Measurement Experiment – 2008, Atmos. Chem. Phys., 10, 4167–4186, https://doi.org/10.5194/acp-10-4167-2010, 2010.
Hu, W., Hu, M., Hu, W., Jimenez, J. L., Yuan, B., Chen, W., Wang, M., Wu, Y., Chen, C., Wang, Z., Peng, J., Zeng, L., and Shao, M.: Chemical composition, sources, and aging process of submicron aerosols in Beijing: Contrast between summer and winter, J. Geophys. Res.-Atmos., 121, 1955–1977, https://doi.org/10.1002/2015jd024020, 2016.
Huffman, J. A., Ziemann, P. J., Jayne, J. T., Worsnop, D. R., and Jimenez, J. L.: Development and Characterization of a Fast-Stepping/Scanning Thermodenuder for Chemically-Resolved Aerosol Volatility Measurements, Aerosol Sci. Tech., 42, 395–407, 2008.
Huffman, J. A., Docherty, K. S., Aiken, A. C., Cubison, M. J., Ulbrich, I. M., DeCarlo, P. F., Sueper, D., Jayne, J. T., Worsnop, D. R., Ziemann, P. J., and Jimenez, J. L.: Chemically-resolved aerosol volatility measurements from two megacity field studies, Atmos. Chem. Phys., 9, 7161–7182, https://doi.org/10.5194/acp-9-7161-2009, 2009a.
Huffman, J. A., Docherty, K. S., Mohr, C., Cubison, M. J., Ulbrich, I. M., Ziemann, P. J., Onasch, T. B., and Jimenez, J. L.: Chemically-Resolved Volatility Measurements of Organic Aerosol from Different Sources, Environ. Sci. Technol., 43, 5351–5357, https://doi.org/10.1021/es803539d, 2009b.
Jayne, J. T., Leard, D. C., Zhang, X., Davidovits, P., Smith, K. A., Kolb, C. E., and Worsnop, D. R.: Development of an aerosol mass spectrometer for size and composition analysis of submicron particles, Aerosol Sci. Tech., 33, 49–70, 2000.
Karnezi, E., Riipinen, I., and Pandis, S. N.: Measuring the atmospheric organic aerosol volatility distribution: a theoretical analysis, Atmos. Meas. Tech., 7, 2953–2965, https://doi.org/10.5194/amt-7-2953-2014, 2014.
Kolesar, K. R., Li, Z. Y., Wilson, K. R., and Cappa, C. D.: Heating-Induced Evaporation of Nine Different Secondary Organic Aerosol Types, Environ. Sci. Technol., 49, 12242–12252, https://doi.org/10.1021/acs.est.5b03038, 2015.
Kostenidou, E., Karnezi, E., Hite Jr., J. R., Bougiatioti, A., Cerully, K., Xu, L., Ng, N. L., Nenes, A., and Pandis, S. N.: Organic aerosol in the summertime southeastern United States: components and their link to volatility distribution, oxidation state and hygroscopicity, Atmos. Chem. Phys., 18, 5799–5819, https://doi.org/10.5194/acp-18-5799-2018, 2018.
Kuwata, M., Zorn, S. R., and Martin, S. T.: Using Elemental Ratios to Predict the Density of Organic Material Composed of Carbon, Hydrogen, and Oxygen, Environ. Sci. Technol., 46, 787–794, https://doi.org/10.1021/es202525q, 2011.
Lee, B. H., Kostenidou, E., Hildebrandt, L., Riipinen, I., Engelhart, G. J., Mohr, C., DeCarlo, P. F., Mihalopoulos, N., Prevot, A. S. H., Baltensperger, U., and Pandis, S. N.: Measurement of the ambient organic aerosol volatility distribution: application during the Finokalia Aerosol Measurement Experiment (FAME-2008), Atmos. Chem. Phys., 10, 12149–12160, https://doi.org/10.5194/acp-10-12149-2010, 2010.
Lelieveld, J., Evans, J. S., Fnais, M., Giannadaki, D., and Pozzer, A.: The contribution of outdoor air pollution sources to premature mortality on a global scale, Nature, 525, 367–371, https://doi.org/10.1038/nature15371, 2015.
Li, G., Lei, W., Zavala, M., Volkamer, R., Dusanter, S., Stevens, P., and Molina, L. T.: Impacts of HONO sources on the photochemistry in Mexico City during the MCMA-2006/MILAGO Campaign, Atmos. Chem. Phys., 10, 6551–6567, https://doi.org/10.5194/acp-10-6551-2010, 2010.
Li, Y., An, J., Min, M., Zhang, W., Wang, F., and Xie, P.: Impacts of HONO sources on the air quality in Beijing, Tianjin and Hebei Province of China, Atmos. Environ., 45, 4735–4744, https://doi.org/10.1016/j.atmosenv.2011.04.086, 2011.
Li, Y. J., Sun, Y., Zhang, Q., Li, X., Li, M., Zhou, Z., and Chan, C. K.: Real-time chemical characterization of atmospheric particulate matter in China: A review, Atmos. Environ., 158, 270–304, https://doi.org/10.1016/j.atmosenv.2017.02.027, 2017.
Li, Y. P., Elbern, H., Lu, K. D., Friese, E., Kiendler-Scharr, A., Mentel, Th. F., Wang, X. S., Wahner, A., and Zhang, Y. H.: Updated aerosol module and its application to simulate secondary organic aerosols during IMPACT campaign May 2008, Atmos. Chem. Phys., 13, 6289–6304, https://doi.org/10.5194/acp-13-6289-2013, 2013.
Liu, H., Man, H., Cui, H., Wang, Y., Deng, F., Wang, Y., Yang, X., Xiao, Q., Zhang, Q., Ding, Y., and He, K.: An updated emission inventory of vehicular VOCs and IVOCs in China, Atmos. Chem. Phys., 17, 12709–12724, https://doi.org/10.5194/acp-17-12709-2017, 2017.
Louvaris, E. E., Florou, K., Karnezi, E., Papanastasiou, D. K., Gkatzelis, G. I., and Pandis, S. N.: Volatility of source apportioned wintertime organic aerosol in the city of Athens, Atmos. Environ., 158, 138–147, https://doi.org/10.1016/j.atmosenv.2017.03.042, 2017.
Ma, Y., Cheng, Y., Qiu, X., Cao, G., Fang, Y., Wang, J., Zhu, T., Yu, J., and Hu, D.: Sources and oxidative potential of water-soluble humic-like substances (HULISWS) in fine particulate matter (PM2.5) in Beijing, Atmos. Chem. Phys., 18, 5607–5617, https://doi.org/10.5194/acp-18-5607-2018, 2018.
May, A. A., Presto, A. A., Hennigan, C. J., Nguyen, N. T., Gordon, T. D., and Robinson, A. L.: Gas-Particle Partitioning of Primary Organic Aerosol Emissions: (2) Diesel Vehicles, Environ. Sci. Technol., 47, 8288–8296, https://doi.org/10.1021/es400782j, 2013.
Mohr, C., Huffman, J. A., Cubison, M. J., Aiken, A. C., Docherty, K. S., Kimmel, J. R., Ulbrich, I. M., Hannigan, M., and Jimenez, J. L.: Characterization of primary organic aerosol emissions from meat cooking, trash burning, and motor vehicles with High-Resolution Aerosol Mass Spectrometry and comparison with ambient and chamber observations, Environ. Sci. Technol., 43, 2443–2449, https://doi.org/10.1021/es8011518, 2009.
Murphy, B. N., Donahue, N. M., Robinson, A. L., and Pandis, S. N.: A naming convention for atmospheric organic aerosol, Atmos. Chem. Phys., 14, 5825–5839, https://doi.org/10.5194/acp-14-5825-2014, 2014.
Ng, N. L., Brown, S. S., Archibald, A. T., Atlas, E., Cohen, R. C., Crowley, J. N., Day, D. A., Donahue, N. M., Fry, J. L., Fuchs, H., Griffin, R. J., Guzman, M. I., Herrmann, H., Hodzic, A., Iinuma, Y., Jimenez, J. L., Kiendler-Scharr, A., Lee, B. H., Luecken, D. J., Mao, J., McLaren, R., Mutzel, A., Osthoff, H. D., Ouyang, B., Picquet-Varrault, B., Platt, U., Pye, H. O. T., Rudich, Y., Schwantes, R. H., Shiraiwa, M., Stutz, J., Thornton, J. A., Tilgner, A., Williams, B. J., and Zaveri, R. A.: Nitrate radicals and biogenic volatile organic compounds: oxidation, mechanisms, and organic aerosol, Atmos. Chem. Phys., 17, 2103–2162, https://doi.org/10.5194/acp-17-2103-2017, 2017.
Odum, J. R., Hoffmann, T., Bowman, F., Collins, D., Flagan, R. C., and Seinfeld, J. H.: Gas/particle partitioning and secondary organic aerosol yields, Environ. Sci. Technol., 30, 2580–2585, 1996.
Paatero, P.: The multilinear engine – A table-driven, least squares program for solving multilinear problems, including the n-way parallel factor analysis model, J. Comput. Graph. Stat., 8, 854–888, 1999.
Paatero, P. and Tapper, U.: Positive matrix factorization: A non-negative factor model with optimal utilization of error estimates of data values, Environmetrics, 5, 111–126, 1994.
Paciga, A., Karnezi, E., Kostenidou, E., Hildebrandt, L., Psichoudaki, M., Engelhart, G. J., Lee, B.-H., Crippa, M., Prévôt, A. S. H., Baltensperger, U., and Pandis, S. N.: Volatility of organic aerosol and its components in the megacity of Paris, Atmos. Chem. Phys., 16, 2013–2023, https://doi.org/10.5194/acp-16-2013-2016, 2016.
Riipinen, I., Pierce, J. R., Donahue, N. M., and Pandis, S. N.: Equilibration time scales of organic aerosol inside thermodenuders: Evaporation kinetics versus thermodynamics, Atmos. Environ., 44, 597–607, https://doi.org/10.1016/j.atmosenv.2009.11.022, 2010.
Saha, P. K. and Grieshop, A. P.: Exploring Divergent Volatility Properties from Yield and Thermodenuder Measurements of Secondary Organic Aerosol from alpha-Pinene Ozonolysis, Environ. Sci. Technol., 50, 5740–5749, https://doi.org/10.1021/acs.est.6b00303, 2016.
Saha, P. K., Khlystov, A., and Grieshop, A. P.: Determining Aerosol Volatility Parameters Using a “Dual Thermodenuder” System: Application to Laboratory-Generated Organic Aerosols, Aerosol Sci. Tech., 49, 620–632, https://doi.org/10.1080/02786826.2015.1056769, 2015.
Saha, P. K., Khlystov, A., Yahya, K., Zhang, Y., Xu, L., Ng, N. L., and Grieshop, A. P.: Quantifying the volatility of organic aerosol in the southeastern US, Atmos. Chem. Phys., 17, 501–520, https://doi.org/10.5194/acp-17-501-2017, 2017.
Saha, P. K., Khlystov, A., and Grieshop, A. P.: Downwind evolution of the volatility and mixing state of near-road aerosols near a US interstate highway, Atmos. Chem. Phys., 18, 2139–2154, https://doi.org/10.5194/acp-18-2139-2018, 2018.
Saleh, R., Shihadeh, A., and Khlystov, A.: On transport phenomena and equilibration time scales in thermodenuders, Atmos. Meas. Tech., 4, 571–581, https://doi.org/10.5194/amt-4-571-2011, 2011.
Sarwar, G., Roselle, S. J., Mathur, R., Appel, W., Dennis, R. L., and Vogel, B.: A comparison of CMAQ HONO predictions with observations from the northeast oxidant and particle study, Atmos. Environ., 42, 5760–5770, https://doi.org/10.1016/j.atmosenv.2007.12.065, 2008.
Stark, H., Yatavelli, R. L. N., Thompson, S. L., Kang, H., Krechmer, J. E., Kimmel, J. R., Palm, B. B., Hu, W., Hayes, P. L., Day, D. A., Campuzano-Jost, P., Canagaratna, M. R., Jayne, J. T., Worsnop, D. R., and Jimenez, J. L.: Impact of Thermal Decomposition on Thermal Desorption Instruments: Advantage of Thermogram Analysis for Quantifying Volatility Distributions of Organic Species, Environ. Sci. Technol., 51, 8491–8500, https://doi.org/10.1021/acs.est.7b00160, 2017.
Streets, D. G., Bond, T. C., Carmichael, G. R., Fernandes, S. D., Fu, Q., He, D., Klimont, Z., Nelson, S. M., Tsai, N. Y., and Wang, M. Q.: An inventory of gaseous and primary aerosol emissions in Asia in the year 2000, J. Geophys. Res.-Atmos., 108, 8809, https://doi.org/10.1029/2002JD003093, 2003.
Sun, Y., Xu, W., Zhang, Q., Jiang, Q., Canonaco, F., Prévôt, A. S. H., Fu, P., Li, J., Jayne, J., Worsnop, D. R., and Wang, Z.: Source apportionment of organic aerosol from 2-year highly time-resolved measurements by an aerosol chemical speciation monitor in Beijing, China, Atmos. Chem. Phys., 18, 8469–8489, https://doi.org/10.5194/acp-18-8469-2018, 2018.
Sun, Y. L., Wang, Z. F., Du, W., Zhang, Q., Wang, Q. Q., Fu, P. Q., Pan, X. L., Li, J., Jayne, J., and Worsnop, D. R.: Long-term real-time measurements of aerosol particle composition in Beijing, China: seasonal variations, meteorological effects, and source analysis, Atmos. Chem. Phys., 15, 10149–10165, https://doi.org/10.5194/acp-15-10149-2015, 2015.
Topping, D. O. and McFiggans, G.: Tight coupling of particle size, number and composition in atmospheric cloud droplet activation, Atmos. Chem. Phys., 12, 3253–3260, https://doi.org/10.5194/acp-12-3253-2012, 2012.
Ulbrich, I. M., Canagaratna, M. R., Zhang, Q., Worsnop, D. R., and Jimenez, J. L.: Interpretation of organic components from Positive Matrix Factorization of aerosol mass spectrometric data, Atmos. Chem. Phys., 9, 2891–2918, https://doi.org/10.5194/acp-9-2891-2009, 2009.
Wang, J., Liu, D., Ge, X., Wu, Y., Shen, F., Chen, M., Zhao, J., Xie, C., Wang, Q., Xu, W., Zhang, J., Hu, J., Allan, J., Joshi, R., Fu, P., Coe, H., and Sun, Y.: Characterization of black carbon-containing fine particles in Beijing during wintertime, Atmos. Chem. Phys., 19, 447–458, https://doi.org/10.5194/acp-19-447-2019, 2019.
Wei, W., Wang, S., Chatani, S., Klimont, Z., Cofala, J., and Hao, J.: Emission and speciation of non-methane volatile organic compounds from anthropogenic sources in China, Atmos. Environ., 42, 4976–4988, https://doi.org/10.1016/j.atmosenv.2008.02.044, 2008.
Wu, Z., Poulain, L., Wehner, B., Wiedensohler, A., and Herrmann, H.: Characterization of the volatile fraction of laboratory-generated aerosol particles by thermodenuder-aerosol mass spectrometer coupling experiments, J. Aerosol Sci., 40, 603–612, 2009.
Xu, L., Williams, L. R., Young, D. E., Allan, J. D., Coe, H., Massoli, P., Fortner, E., Chhabra, P., Herndon, S., Brooks, W. A., Jayne, J. T., Worsnop, D. R., Aiken, A. C., Liu, S., Gorkowski, K., Dubey, M. K., Fleming, Z. L., Visser, S., Prévôt, A. S. H., and Ng, N. L.: Wintertime aerosol chemical composition, volatility, and spatial variability in the greater London area, Atmos. Chem. Phys., 16, 1139–1160, https://doi.org/10.5194/acp-16-1139-2016, 2016.
Xu, W. Q., Sun, Y. L., Chen, C., Du, W., Han, T. T., Wang, Q. Q., Fu, P. Q., Wang, Z. F., Zhao, X. J., Zhou, L. B., Ji, D. S., Wang, P. C., and Worsnop, D. R.: Aerosol composition, oxidation properties, and sources in Beijing: results from the 2014 Asia-Pacific Economic Cooperation summit study, Atmos. Chem. Phys., 15, 13681–13698, https://doi.org/10.5194/acp-15-13681-2015, 2015.
Yu, K., Zhu, Q., Du, K., and Huang, X.-F.: Characterization of nighttime formation of particulate organic nitrates based on high-resolution aerosol mass spectrometry in an urban atmosphere in China, Atmos. Chem. Phys., 19, 5235–5249, https://doi.org/10.5194/acp-19-5235-2019, 2019.
Zhang, J., An, J., Qu, Y., Liu, X., and Chen, Y.: Impacts of potential HONO sources on the concentrations of oxidants and secondary organic aerosols in the Beijing-Tianjin-Hebei region of China, Sci. Total Environ., 647, 836–852, https://doi.org/10.1016/j.scitotenv.2018.08.030, 2019.
Zhang, Q., Worsnop, D. R., Canagaratna, M. R., and Jimenez, J. L.: Hydrocarbon-like and oxygenated organic aerosols in Pittsburgh: insights into sources and processes of organic aerosols, Atmos. Chem. Phys., 5, 3289–3311, https://doi.org/10.5194/acp-5-3289-2005, 2005.
Zhang, Q., Streets, D. G., Carmichael, G. R., He, K. B., Huo, H., Kannari, A., Klimont, Z., Park, I. S., Reddy, S., Fu, J. S., Chen, D., Duan, L., Lei, Y., Wang, L. T., and Yao, Z. L.: Asian emissions in 2006 for the NASA INTEX-B mission, Atmos. Chem. Phys., 9, 5131–5153, https://doi.org/10.5194/acp-9-5131-2009, 2009.
Zhang, Q. J., Beekmann, M., Drewnick, F., Freutel, F., Schneider, J., Crippa, M., Prevot, A. S. H., Baltensperger, U., Poulain, L., Wiedensohler, A., Sciare, J., Gros, V., Borbon, A., Colomb, A., Michoud, V., Doussin, J.-F., Denier van der Gon, H. A. C., Haeffelin, M., Dupont, J.-C., Siour, G., Petetin, H., Bessagnet, B., Pandis, S. N., Hodzic, A., Sanchez, O., Honoré, C., and Perrussel, O.: Formation of organic aerosol in the Paris region during the MEGAPOLI summer campaign: evaluation of the volatility-basis-set approach within the CHIMERE model, Atmos. Chem. Phys., 13, 5767–5790, https://doi.org/10.5194/acp-13-5767-2013, 2013.
Zheng, J., Zhang, L., Che, W., Zheng, Z., and Yin, S.: A highly resolved temporal and spatial air pollutant emission inventory for the Pearl River Delta region, China and its uncertainty assessment, Atmos. Environ., 43, 5112–5122, https://doi.org/10.1016/j.atmosenv.2009.04.060, 2009.
Zhou, S., Collier, S., Xu, J., Mei, F., Wang, J., Lee, Y.-N., Sedlacek, A. J., Springston, S. R., Sun, Y., and Zhang, Q.: Influences of upwind emission sources and atmospheric processing on aerosol chemistry and properties at a rural location in the Northeastern U.S, J. Geophys. Res.-Atmos., 121, 6049–6065, https://doi.org/10.1002/2015jd024568, 2016.