the Creative Commons Attribution 4.0 License.
the Creative Commons Attribution 4.0 License.
 | 25 Jan 2019
Speciated and total emission factors of particulate organics from burning western US wildland fuels and their dependence on combustion efficiency
Lindsay E. Hatch
Vanessa Selimovic
Robert J. Yokelson
Robert Weber
Arantza E. Fernandez
Nathan M. Kreisberg
Kelley C. Barsanti
Allen H. Goldstein
Western US wildlands experience frequent and large-scale wildfires which are predicted to increase in the future. As a result, wildfire smoke emissions are expected to play an increasing role in atmospheric chemistry while negatively impacting regional air quality and human health. Understanding the impacts of smoke on the environment is informed by identifying and quantifying the chemical compounds that are emitted during wildfires and by providing empirical relationships that describe how the amount and composition of the emissions change based upon different fire conditions and fuels. This study examined particulate organic compounds emitted from burning common western US wildland fuels at the US Forest Service Fire Science Laboratory. Thousands of intermediate and semi-volatile organic compounds (I/SVOCs) were separated and quantified into fire-integrated emission factors (EFs) using a thermal desorption, two-dimensional gas chromatograph with online derivatization coupled to an electron ionization/vacuum ultraviolet high-resolution time-of-flight mass spectrometer (TD-GC × GC-EI/VUV-HRToFMS). Mass spectra, EFs as a function of modified combustion efficiency (MCE), fuel source, and other defining characteristics for the separated compounds are provided in the accompanying mass spectral library. Results show that EFs for total organic carbon (OC), chemical families of I/SVOCs, and most individual I/SVOCs span 2–5 orders of magnitude, with higher EFs at smoldering conditions (low MCE) than flaming. Logarithmic fits applied to the observations showed that log (EFs) for particulate organic compounds were inversely proportional to MCE. These measurements and relationships provide useful estimates of EFs for OC, elemental carbon (EC), organic chemical families, and individual I/SVOCs as a function of fire conditions.
- Article
(3003 KB) - Full-text XML
-
Supplement
(615 KB) - BibTeX
- EndNote


Wildfires in the western US have become larger and more frequent, and this trend is expected to continue in the coming decades (Dennison et al., 2014; Miller et al., 2009). This is due to historical wildfire suppression, leading to high fuel loading and climate changes that include longer springs and summers, earlier snowmelts, and prolonged droughts (Dennison et al., 2014; Jolly et al., 2015; Spracklen et al., 2009; Westerling et al., 2006). Smoke emissions from wildfires primarily contain carbon dioxide (CO2), carbon monoxide (CO), and thousands of organic compounds in the gas and particle phases. These organic compounds can significantly influence atmospheric chemistry, cloud formation, regional visibility, and human health. Thus, increased occurrences and magnitudes of wildfires will likely lead to greater smoke impacts on regional and global environments.
The extent to which smoke will adversely impact human health and the environment depends, in part, on the chemical composition and amount of emissions produced. In general, biomass burning, which includes wildfires, is the main global source of fine carbonaceous aerosol particles (∼ 75 %) in the atmosphere (Andreae and Merlet, 2001; Bond and Bergstrom, 2006; IPCC, 2014; Park et al., 2007). Individual and categorized organic emissions from wildfires have previously been identified and quantified (Akagi et al., 2011; Andreae and Merlet, 2001; Hatch et al., 2015; Kim et al., 2013; Koss et al., 2018; Liu et al., 2017; Mazzoleni et al., 2007; Naeher et al., 2007; Oros et al., 2006; Oros and Simoneit, 2001a; Simoneit, 2002; Stockwell et al., 2015; Yokelson et al., 2013). The bulk of previous studies on speciated organic compound emissions focused on gas-phase volatile organic compounds (VOCs). Particle-phase results are typically reported as total organic carbon (OC) or particulate matter (PM) with aerodynamic diameters less than 10 or 2.5 µm (PM10 and PM2.5). These types of measurements provide no chemical specificity of the particle phase and thus limit the ability to predict how smoke will age in the atmosphere and impact the environment.
Several studies have examined specific particle-phase organic compounds in smoke such as toxic retene and other polycyclic aromatic hydrocarbons (PAHs) (e.g., Jayarathne et al., 2018; Kim et al., 2013; Naeher et al., 2007; Sullivan et al., 2014) or abundant tracer compounds, like levoglucosan and vanillic acid (Simoneit et al., 1999). Out of the likely thousands of unique compounds, roughly 400 known particle-phase organic compounds and their amounts produced per mass of dry fuel burned (a quantity known as the emission factor, EF) have been published and organized by wildland type (Oros et al., 2006, 2001a, b). These compounds span many chemical families (i.e., functionalities), like sugars and methoxyphenols, and provide key insights into how different wildland burns lead to different organic particulate composition and EFs.
New advances in instrumentation, such as two-dimensional gas chromatography or electrospray ionization coupled to high-resolution mass spectrometers (Isaacman et al., 2011; Laskin et al., 2009), now allow for unprecedented levels of molecular speciation of atmospheric aerosol particles that can further identify and quantify the thousands of previously unreported biomass burning compounds. Nevertheless, current fire and atmospheric chemistry models that predict the amount of smoke produced, its atmospheric transformation/transportation, and its physiochemical properties (e.g., French et al., 2011; Reinhardt et al., 1997; Wiedinmyer et al., 2011) do not model the thousands of organic compounds emitted from fires, due primarily to limited computational resources. To address this deficiency, Alvarado et al. (2015) used measured volatility distribution bins of organic compounds from fresh smoke and modeled their atmospheric aging by assuming shifts in volatility distribution via reactions with ozone and hydroxl radicals. Though this approach does better predict secondary organic aerosol particle formation, it still does not consider the wide variety of chemical compounds found in smoke, thus limiting its ability to predict physiochemical properties of aged smoke particles and their impacts on the environment. Therefore, a better or estimable representation of the chemical composition in smoke particles within models requires condensing the information from molecular-level speciation into useable relationships that correlate typical particle composition to a measurable burn variable.
The purpose of this study is to (1) identify, classify, and quantify organic compounds in smoke particles produced during laboratory burns and (2) provide scalable EFs of individual compounds and their chemical families from various fuels as a function of fire conditions. A selection of fuels and fuel combinations commonly consumed in western US wildland fires were burned at the US Forest Service Fire Sciences Laboratory (FSL) in Missoula, MT, during the NOAA Fire Influence on Regional and Global Environments Experiment (FIREX) campaign in 2016 (Selimovic et al., 2018). Regression models representing EFs as a function of fire conditions are provided for groupings of organic compounds that vary in chemical complexity, from generalized organic carbon and total particulate organic compounds to specific chemical families and individual compounds. In addition, a mass spectral database, compatible with the National Institute of Standards and Technology (NIST) Mass Spectral Search program, containing the mass spectra, retention indices, and identities/compound classifications for all the separated compounds observed from the various burns, is included. This database will be a valuable resource for the community for identifying specific chemicals in air masses impacted by biomass burning plumes and understanding the dominant source materials burned, fire characteristics, and atmospheric transformations.
A total of 34 different fuels were combusted in 75 “stack” burns during the 2016 FIREX campaign at FSL (Selimovic et al., 2018). Most fuels were representative of common biomass components found in the western US wildlands. Non-western US wildland fuels were also burned and are used to demonstrate the applicability of the reported regression models across a wider range of fuels. A detailed description of the FSL combustion room can be found elsewhere (Christian et al., 2004; Stockwell et al., 2014) with pertinent details described here. The 12.5 m × 12.5 m × 22 m combustion room contained a fuel bed on the floor. Fuels were placed in the fuel bed and ignited by resistance-heated coils. Above the fuel bed was a 3.6 m inverted funnel connected to a 1.6 m diameter exhaust stack that vented through the roof of the combustion room. The room was kept at positive pressure to provide a constant air flow that diluted and carried the smoke up the stack. A platform was located 17 m above the fuel bed and allowed instrument sampling access into the stack (see Fig. S1 in the Supplement). The samples studied here were collected from the platform and thus represent fresh emissions.
Smoke from the stack was pulled through a custom-built sampler known as DEFCON, Direct Emission Fire CONcentrator (see diagram in Fig. S2). DEFCON's inlet was a 20.3 cm × 1.3 cm OD stainless steel tube that reached 15.2 cm into the stack. 10.3 LPM of smoke was pulled through the inlet, with two 150 ccm flows branching off from the main sample flow. These low-flow channels went to two parallel flows consisting of a Teflon filter followed by sorbent tube for gas-phase sample collection; analysis of those samples will be described in future publications. The remaining 10 LPM was passed through a 1.0 µm cutoff cyclone before being sampled onto a 10 cm quartz fiber filter (Pallflex Tissuquartz). Total residence time was ∼ 2 s. One quartz fiber filter collected both particles and likely low volatility gases for the duration of each fire which lasted ∼ 5–50 min. These filters were analyzed for this study. A few fires were terminated “early” when a small amount of fuel and smoldering combustion remained. Prior to collection, filters were baked at 550 ∘C for 12 h and packed in similarly baked aluminum foil inside Mylar bags. The flows were monitored to ensure constant flow rates. Flow paths within DEFCON were passivated with Inertium® (Advanced Materials Components Express, Lemont, PA) which has been shown to reduce losses of oxygenated organics (Williams et al., 2006). After each burn, the inlet of DEFCON was replaced with a clean tube and the remainder of the system was purged with clean air. A background filter sample was collected each morning prior to the burns to estimate background contributions from sampling components and room air.
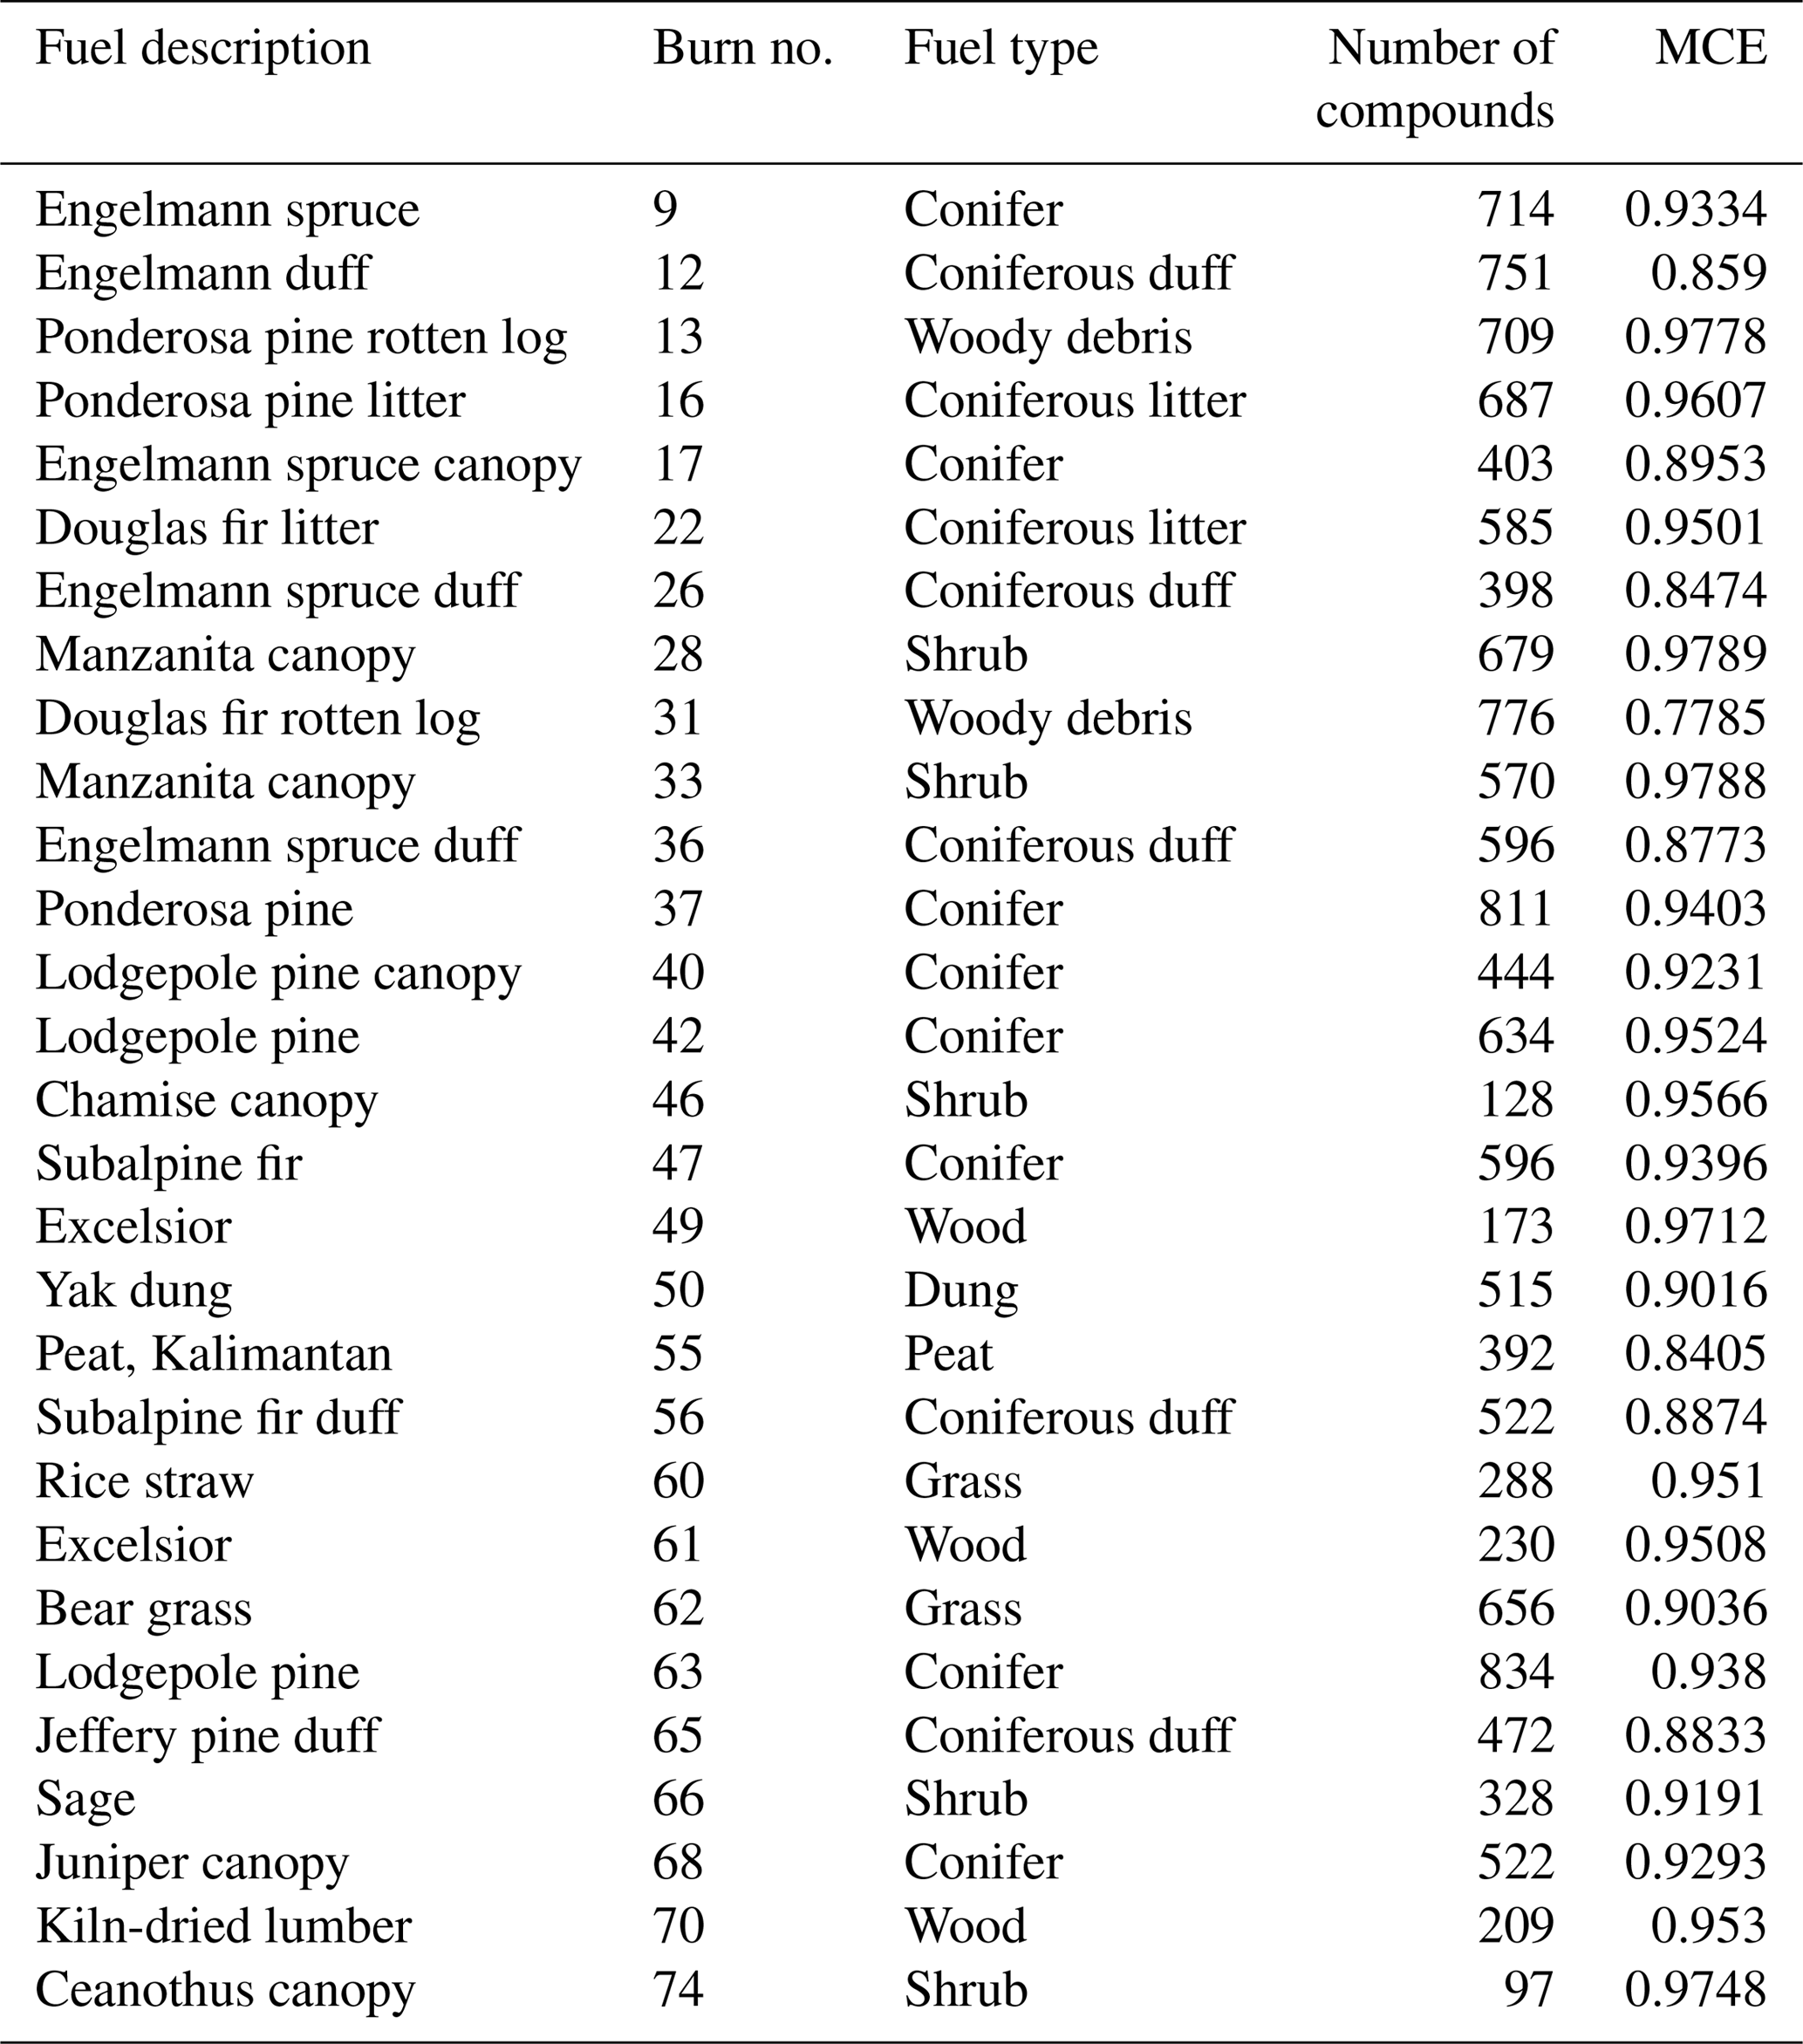
Table 1List of fuels analyzed, with the number of compounds separated and quantified from each burn. Note conifer fuel type refers to a realistic mixture of a coniferous ecosystem unless otherwise noted.
A total of 29 fire-integrated smoke filter samples, including one from each specific fuel (with some replicates), were selected and analyzed using a thermal desorption, two-dimensional gas chromatograph with online derivatization coupled to an electron ionization/vacuum ultraviolet ionization high-resolution time-of-flight mass spectrometer (TD-GC × GC-EI/VUV-HRToFMS) (Isaacman et al., 2012; Worton et al., 2017). A list of analyzed fuels is given in Table 1. Chromatograms from replicate burns showed minor variation; thus the remaining 46 burns were not analyzed in detail. Punched samples of each filter (0.21–1.64 cm2) were thermally desorbed at 320 ∘C under a helium flow using a thermal desorption system (TDS3 and TDSA2, Gerstel). Desorbed samples were then mixed with a gaseous derivatization agent, MSFTA (N-methyl-N-(trimethylsilyl)trifluoroacetamide). MSFTA replaces the hydrogen in polar hydroxyl, amino, and thiol groups with the trimethylsilyl group, creating a less polar and thus elutable compound. Derivatized samples then were focused on a quartz wool glass liner at 30 ∘C (cooled injection system, CIS4, Gerstel) before rapid heating to 320 ∘C for injection into the gas chromatograph (GC, Agilent 7890). GC × GC separation was achieved with a 60 m × 0.25 mm × 0.25 µm semi-nonpolar capillary column (Rxi-5Sil MS, Restek) followed by a medium-polarity, second-dimension column (1 m × 0.25 mm × 0.25 µm, Rtx-200MS, Restek). A dual-stage thermal modulator (Zoex), consisting of a guard column (1 m × 0.25 mm, Rxi, Restek), was used to cryogenically focus the effluent from the first column prior to heated injection onto the second column (modulation period of 2.3 s). The main GC × GC oven ramped at 3.5 ∘C min−1 from 40 to 320 ∘C and was held at the final temperature for 5 min and the secondary oven ramped at the same rate from 90 to 330 ∘C and was held for 40 min. Separated compounds were then ionized either by traditional EI (70 eV) or VUV light (10.5 eV). The HRToFMS (ToFWerk) was used to detect the ions and was operated with a resolution of 4000 and transfer line and ionizer chamber temperatures of 270 ∘C. VUV light was provided by the Advanced Light Source, beamline 9.0.2, at Lawrence Berkeley National Laboratories. During the VUV experiments, the HRToFMS operated at a lower ionizer chamber temperature of 170 ∘C to further reduce molecular fragmentation (Isaacman et al., 2012).
Punches from the filter samples were also analyzed for organic and elemental carbon (OC and EC, respectively) using a Sunset Model 5 Lab OCEC Aerosol Analyzer following the NIOSH870 protocol in the Air Quality Research Center at the University of California, Davis. Thermal pyrolysis (charring) was corrected using laser transmittance. OC and EC were also measured on the background filters.
2.1 Emission factor calculations
The mass loadings for all separated compounds measured by TD-GC × GC-EI/VUV-HRToFMS were determined using a set of calibration curves. Full details of the data conversion to mass loadings and emission factors with associated uncertainties are provided in the Supplement with important steps outlined here. The TD-GC × GC-EI/VUV-HRToFMS responses to a wide range of standard compounds commonly found in biomass burning samples were measured at varying mass loadings to create calibration curves. Measured peaks from the filters were calibrated using a standard compound that exhibited similar first- and second-dimension retention times and compound classification. For example, a sampled compound classified as sugar was quantified using the nearest sugar standard compound in the chromatogram. Unknown compounds were matched to the nearest eluting standard compound, similar to the approach taken by Zhang et al. (2018). The mass loadings of all observed compounds were then background subtracted; however, the mass on the background filter for all compounds was negligible. The compound's emission factor (EFcompound) was then calculated by normalizing mass loadings by background-corrected sampled CO2 mass. This ratio was then multiplied by the corresponding EF, as given in Selimovic et al. (2018). EFs for OC and EC were calculated similarly, using background-corrected OC and EC mass loadings.
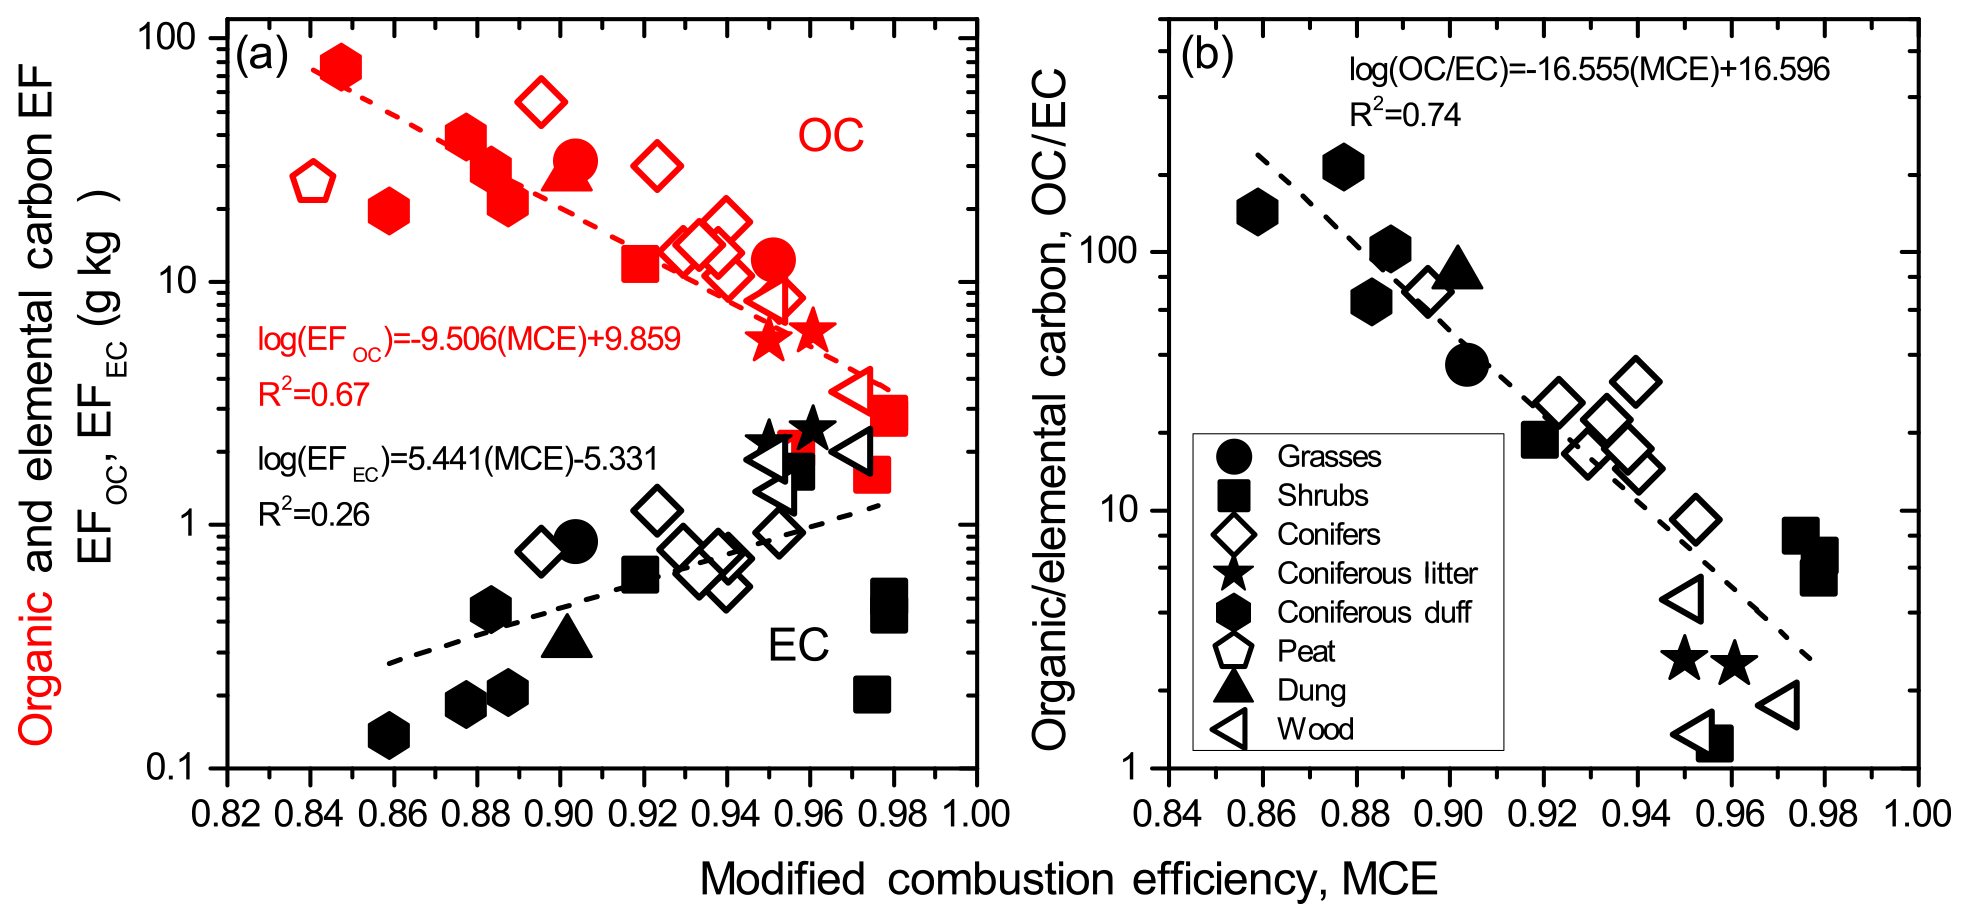
Figure 1(a) Measured organic and elemental carbon (OC and EC, respectively) as a function of modified combustion efficiency (MCE) and (b) OC∕EC as a function of MCE. Symbols indicate the different fuel types.
3.1 Emission factors of organic and elemental carbon
OC and EC EFs were first related to the fire-integrated modified combustion efficiency (MCE). MCE reflects the mix of combustion processes in the fire and is defined as background-corrected values of (Akagi et al., 2011; Ward and Radke, 1993). MCE values near 1 indicate almost pure flaming, while values near 0.8 are almost pure smoldering, with 0.9 representing a roughly equal mix of these processes. Figure 1a shows the EFs of OC and EC (EFOC and EFEC) as a function of MCE across a variety of fuel types (see Table 1). Decreasing MCE (more smoldering) results in increased OC and decreased EC emissions across all studied fuel types. These observed trends are in general agreement with previous studies (e.g., Christian et al., 2003; Hosseini et al., 2013). EFs for OC and EC generally follow a logarithmic relationship such that log(EFOC) is inversely proportional to MCE (slope of −9.506) and log(EFEC) is directly proportional to MCE (slope 5.441). Comparison of the slopes suggests that decreasing MCE of a fire will produce an increasing amount of OC compared to EC. This is further confirmed by examining the ratio of OC to EC (OC∕EC) with MCE. Figure 1b illustrates how OC∕EC sharply increases with more smoldering fire conditions (slope of −16.555). This trend also follows a similar inversely proportional logarithmic relationship as EFOC vs. MCE but with even stronger correlation (R2=0.85 compared to 0.66, respectively). Note that values for Douglas fir rotten log (burn 31), peat (burn 55), rice straw (burn 60), and Engelmann spruce duff (burn 26) fires are not shown due to measured EC at background levels. In addition, significant losses (∼ 40 %) of organic compounds were only observed for the Douglas fir rotten log burn and were determined by comparing GC × GC chromatograms taken ∼ 1 month after collection at FSL and ∼ 2 years after collection prior to OC∕EC analysis. The combined results clearly show that flaming combustion produces slightly more particulate EC compared to OC, whereas smoldering combustion emits levels of OC 1–2 orders of magnitude higher compared to EC.
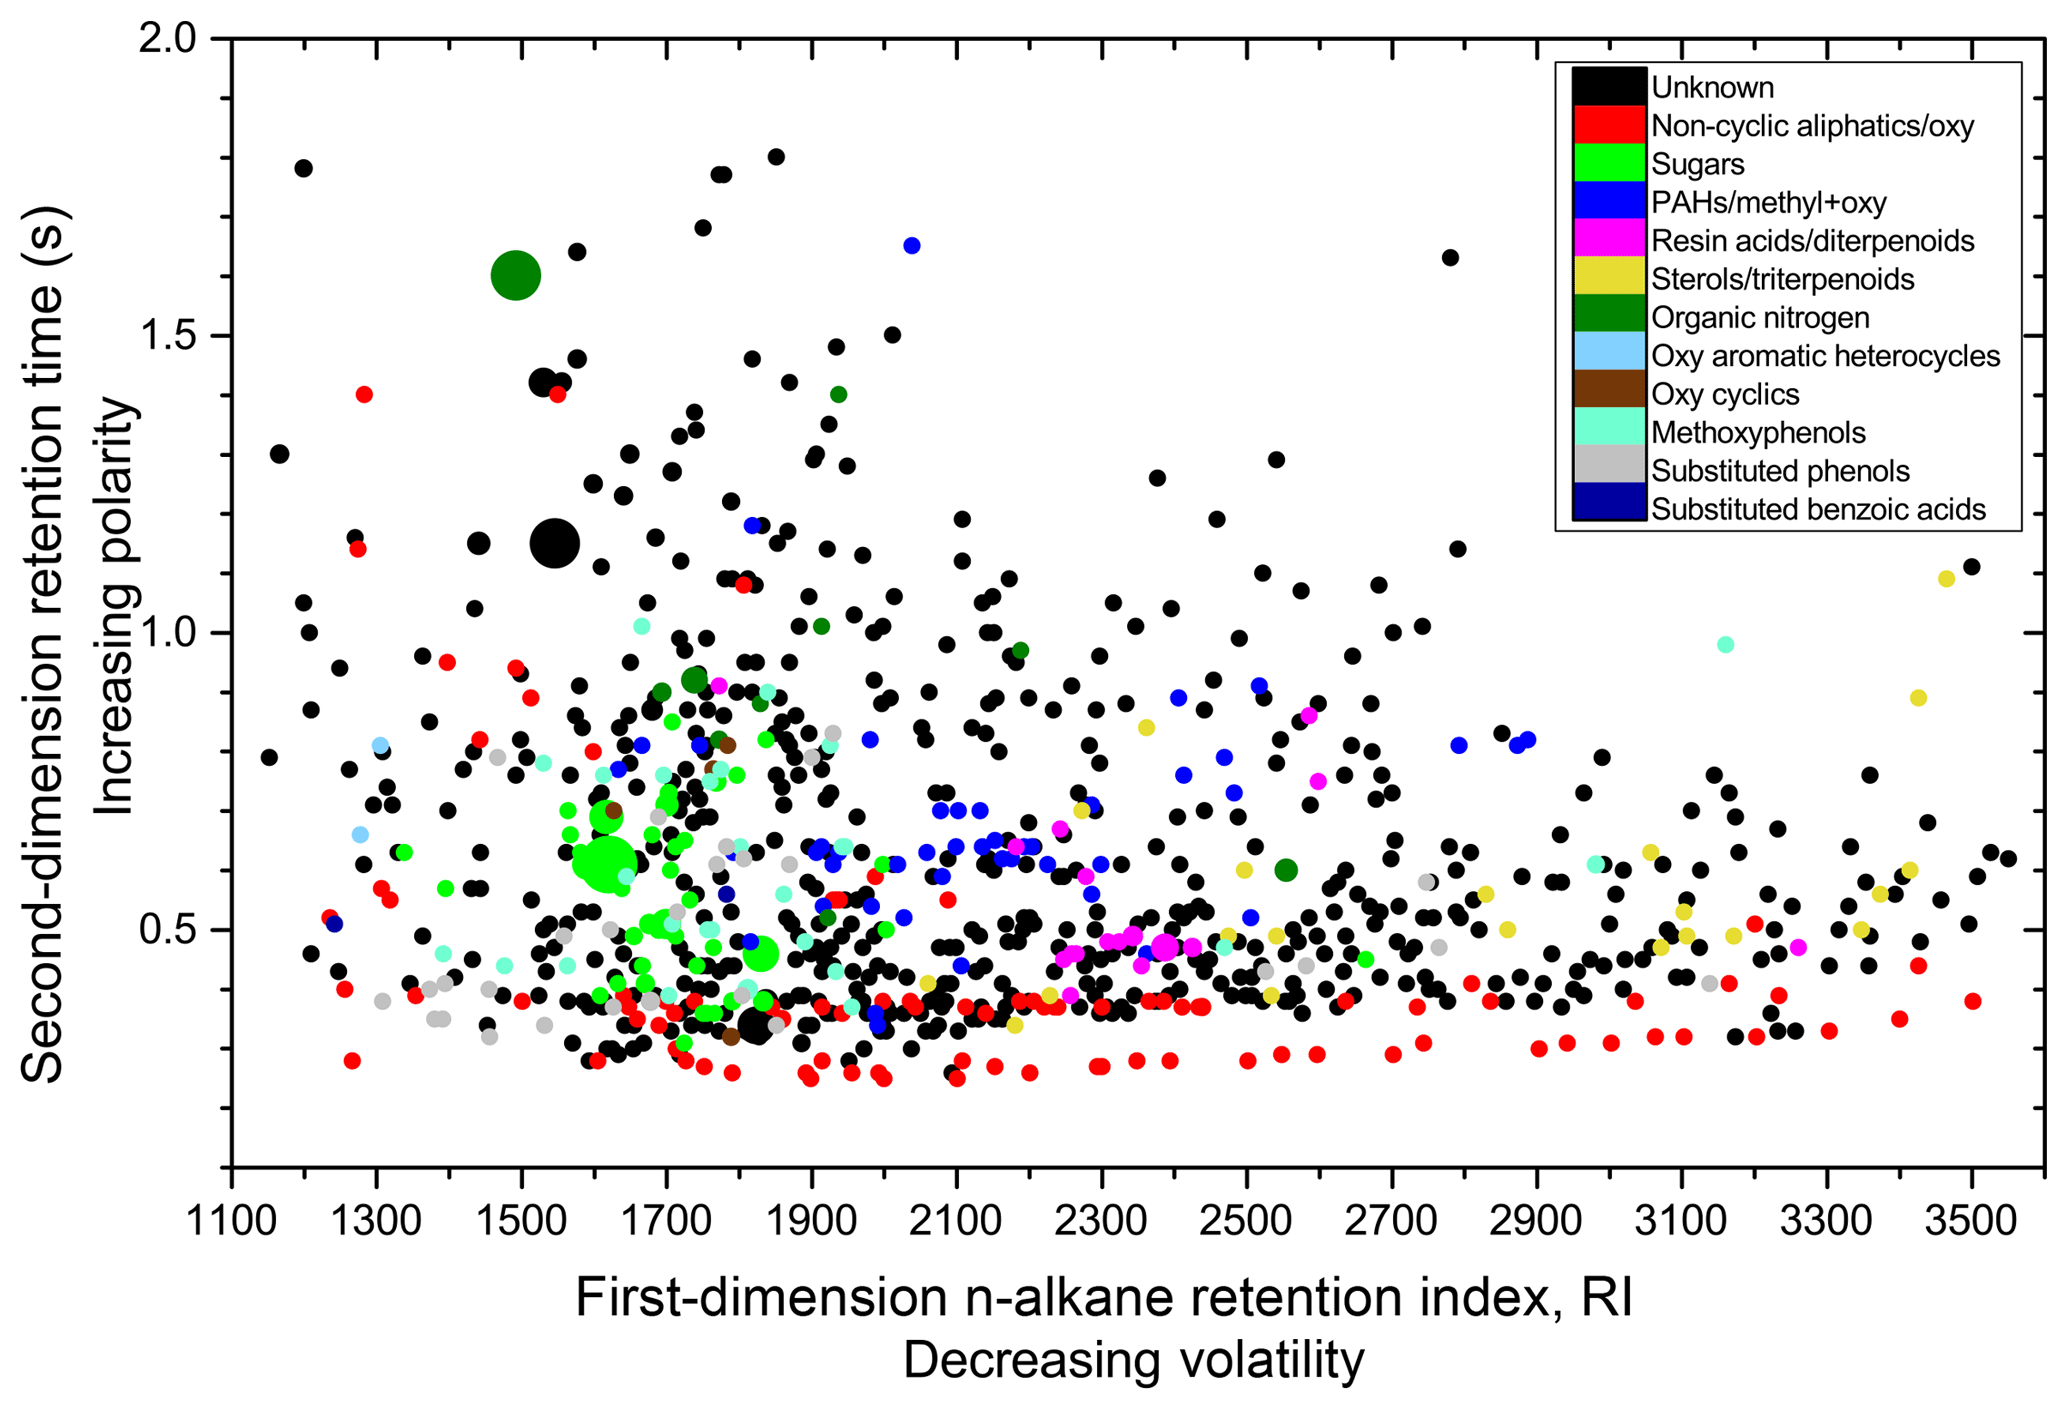
Figure 2Two-dimensional chromatogram of smoke collected from burning lodgepole pine (burn 63). The first dimension separates compounds by their volatility and the second dimension by their polarity. Each point (∼ 800 in total) represents a separated compound with the colors signifying the compound's classification. Size of a point approximately scales with its emission factor (see Sect. S3).
3.2 Identification and quantification of I/SVOCs
Filter samples were analyzed for intermediate and semi-volatile organic compounds (I/SVOCs) using the TD-GC × GC EI-VUV-HRToFMS. Between 100 and 850 peaks (i.e., unique compounds) were separated in each fire-integrated chromatogram, with fewer peaks observed for more flaming fires such as from shrub fuels (see Table 1). An example two-dimensional chromatogram of a lodgepole pine burn (burn 63) is shown in Fig. 2. Based on the GC × GC configuration, all compounds elute between dodecane (C∗ ∼ 106 µg m−3 and n-alkane retention index, RI, of 1200) and hexatriacontane (C∗ ∼ 10−1 µg m−3, RI = 3600) and thus are classified as I/SVOCs, with a small fraction classified as low-volatility organic compounds (Donahue et al., 2009). In total, approximately 3000 unique compounds were separated across the 29 analyzed burns (see Table 1). From those compounds, 149 compounds were identified using a combination of matching authentic standards, RI, EI mass spectrum (via NIST Mass Spectral database, 2014 version), and VUV parent and fragment mass ions. True positive identification requires analysis of a standard compound on the instrument; however comparing the NIST match to parent mass determined from VUV mass spectrum analysis can also provide a level of identification (Worton et al., 2017). Identified compounds account for 4 %–37 % of the total observed organic mass (mean of 20 % with a standard deviation of 9 %). A table of these identified compounds with their identifying methods (e.g., standard matching, previous literature, or NIST Mass Spectral database), RI, five most abundant mass ions from the EI mass spectra, and fuel source(s) is given in Table S1 in the Supplement.
To help reduce the chemical complexity from the 3000 observed compounds, each separated compound was sorted into a chemical family. This was achieved using a combination of parent ion mass (VUV), fragment ion mass spectra (VUV and EI), RI, and second-dimension retention time to estimate the compound's functionality. More details on the classification process and examples within each category can be found in the Supplement. The chemical families were broadly named and include non-cyclic aliphatic/oxygenated, sugars, PAHs/methylated + oxygenated, resin acids/diterpenoids, sterols/ triterpenoids, organic nitrogen, oxygenated aromatic heterocycles, oxygenated cyclic alkanes, methoxyphenols, substituted phenols, and substituted benzoic acids. Almost 400 compounds, including the identified and most frequently observed compounds in the analyzed burns, were grouped into these families. The remainder of the compounds, which were both uncategorizable and unidentifiable, were placed into the unknown category. Figure 2 illustrates the chemical families (indicated by color) of all the separated compounds emitted from an example lodgepole pine burn.
Despite many compounds remaining unknown, their defining traits such as mass spectra or retention index (i.e., volatility) can be compared to atmospheric samples to help the community better define the composition of biomass-burning-derived, particle-phase organic compounds. As such, all ∼ 3000 observed compounds have been compiled into a publicly available mass spectral database and first reported here as the University of California, Berkeley, Goldstein Library of Organic Biogenic and Environmental Spectra (UCB-GLOBES) for FIREX (see Supplement). This spectral library is compatible with NIST Mass Spectral Search and contains mass spectra, n-alkane RI, potential compound identification or chemical families, EFs as a function of fire conditions, and fuel sources of all unique compounds detected from the 29 analyzed burns.

Figure 3(a) Contributions of unknown mass to the total observed mass for the 29 analyzed burns. (b) Mass fractions for each chemical family compared to total classified mass. Fuels are grouped by type, and numbers after fuel name indicate the burn number during the FIREX campaign.
3.3 Average observed I/SVOC composition
The masses of observed I/SVOCs from each chemical family were summed over each fire-integrated sample and normalized to either the total observed I/SVOC mass or total classified I/SVOC mass. Figure 3a illustrates mass fractions of the unidentified and unclassified (unknown) compounds out of the total observed mass from the 29 analyzed burns. Mass fractions for each chemical family out of the total observed mass are given in Table S5. Unknowns represent ∼ 35 %–90 % of I/SVOCs mass emitted during the analyzed burns, with woody debris (rotten logs) exhibiting the highest mass fraction of unknowns (∼ 90 %). Since the compounds that make up the unknown mass fraction varied between burns, differences in the mass fractions between fuel types are not indicative of higher emissions of any particular compound. However, notably the two woody debris burns showed similar unknown compounds (i.e., 99 % of the unknown mass was of compounds found in both burns) but occurred under two different fire conditions (burn 13 at MCE = 0.98 and burn 31 at MCE = 0.78). In both cases, the unknown mass fractions were similar at 87 %–89 %. This observation provides some indication that fuel type plays a larger role than MCE in determining the unknown organic mass fraction in smoke particles.
Given that the unknown compounds typically varied between burns, the mass of each classified chemical family was normalized to the total observed classified mass (i.e., excluding the unknown mass) in order to better compare classified compounds between burns. These results are shown in Fig. 3b. Conifers, coniferous litter, and wood exhibited the highest fraction of sugars (38 %, 29 %, and 44 %, respectively) compared to other fuels (between 6 %–30 %). Furthermore, levoglucosan was the largest single contributor to the sugars for these burns and ranged from 10 % to 40 % of the total sugars. These observations are consistent with previous studies that have shown high levoglucosan emissions from cellulose-rich wood samples (Mazzoleni et al., 2007; Simoneit et al., 1999). Coniferous fuels also emitted higher amounts of resin acids/diterpenoids (7 %, 16 %, 7 %, and 3 % for conifers, coniferous litter, coniferous duff, and woody debris respectively), as previously observed (Hays et al., 2002; Oros and Simoneit, 2001a; Schauer et al., 2001). Peat (from Indonesia) emitted the largest fraction of aliphatic compounds (52 %) compared to other fuels, in agreement with previous observations (George et al., 2016; Iinuma et al., 2007; Jayarathne et al., 2018). Manzanita burns produced the highest amounts of substituted phenols (34 % of total classified mass compared to 1 %–4 % for other fuels), mostly as hydroquinone (Hatch et al., 2018; Jen et al., 2018). Organic nitrogen compounds, most of which were nitro-organics, also contributed significantly (up to 43 %) to the total observed classified mass for all fuels. These compounds tend to absorb light (Laskin et al., 2015) and may contribute to observed brown carbon light absorption from these burns (Selimovic et al., 2018). However, it should be noted that the instrument is not as sensitive to this class of compounds. Thus, the EF uncertainty is high (factor of 2) for compounds that are not positively identified with a standard but are categorized as organic nitrogen.
Figure 3b also provides some evidence that fuels within the same type generally show similar mass fractions of chemical families. For example, conifers, which consist of a mixture of coniferous ecosystem fuel components (e.g., canopy, duff, litter, and twigs), exhibit relatively similar mass fractions, with sugars accounting for 30 %–50 %, 4 %–28 % non-cyclic aliphatic, 13 %–30 % organic nitrogen, 2 %–20 % resin acid/diterpenoids, and 1 %–4 % PAH/methyl + oxy across the MCE range of 0.90–0.95. Coniferous duff (MCE = 0.85–0.89) exhibited a lower sugar fraction (11 %–31 %) but higher non-cyclic aliphatics (15 %–38 %) than the conifers. Burning grasses (MCE = 0.90–0.95) produced roughly equal amounts of sugars and organic nitrogen compounds (30 %) and higher amounts of oxygenated cyclic compounds (3 %–11 %), like lactones, than the coniferous fuels (∼ 1 %). Shrubs (MCE = 0.92–0.98) exhibited the largest ranges in chemical family mass fractions (e.g., 0 %–42 % organic nitrogen compounds and 2 %–43 % substituted phenols), suggesting that plants in this fuel type are less similar to each other than coniferous fuels. This may be due to a wider range of plant chemical composition for shrubs than for the other fuel types. Overall, the I/SVOC mass fractions tend to be more similar for fuels within a fuel type with the most variation exhibited for fuel mixtures and shrubs.
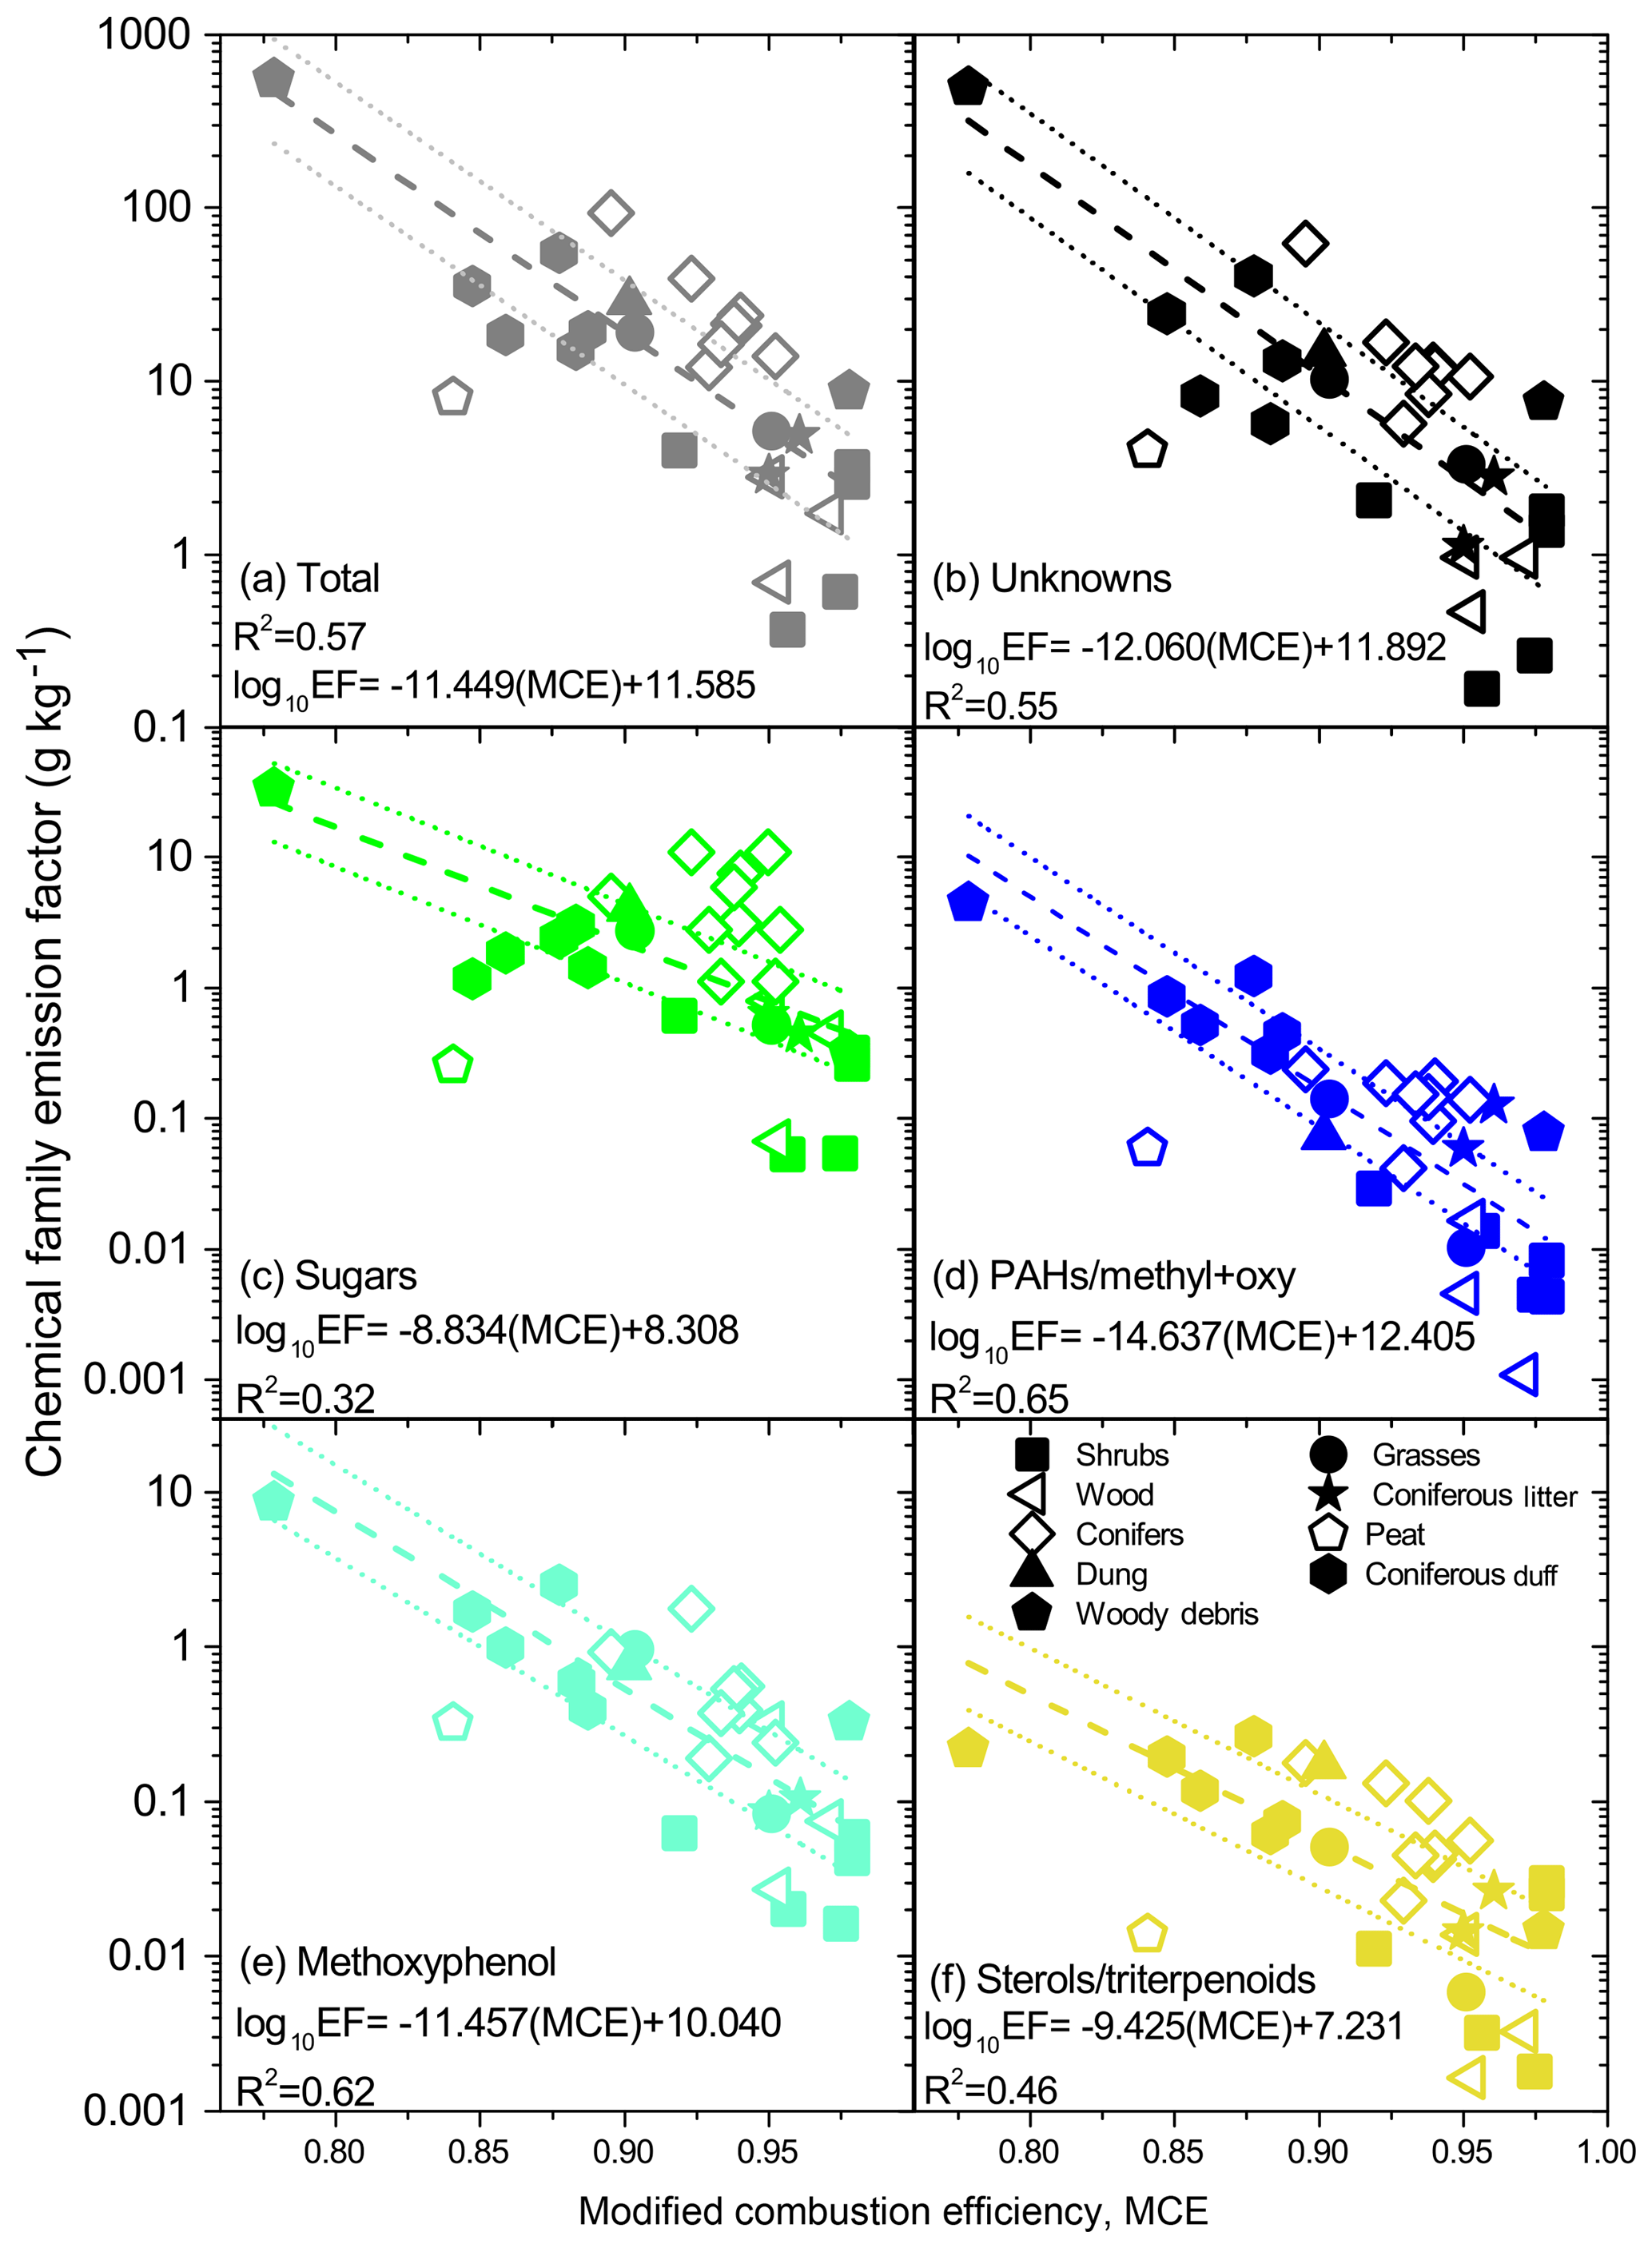
Figure 4Summed emission factors (EFs) within a chemical family for each burn as a function of modified combustion efficiency (MCE). Each panel depicts a different family with (a) total observed I/SVOC EF, (b) unknowns, (c), sugars, (d) polycyclic aromatic hydrocarbons (PAHs, including methylated and oxygenated forms), (e) methoxyphenols, and (f) sterols/triterpenoids. Dashed lines represent a log fit of the form log(EF) inversely proportional to MCE. The dotted lines represented a factor of 2 above and below the model. Symbols denote different fuel types.
3.4 EFs as a function of fire conditions (MCE)
Unlike the dependence of chemical family mass fractions on fuel type, EFs for each chemical family showed a correlation with MCE across all fuels examined and to a much lesser extent than fuel type. Figure 4 presents EFs for total observed organic compounds and five of the chemical families (unknowns, sugars, PAHs/methyl/oxy, methoxyphenols, and sterols/triterpenoids, with others given in Fig. S4) as a function of MCE. Fuels not found in the western US are also included in these figures to demonstrate that their EFs generally follow the trend with MCE. The notable exception is peat, a semi-fossilized fuel (Stockwell et al., 2016), whose EFs for all chemical families are roughly an order of magnitude lower than other fuels at similar MCE values, except non-cyclic aliphatic/oxygenated EF, which is approximately equal to burns at similar MCE (see Fig. S4). In general, EFs measured by the TD-GC × GC-EI/VUV-HRToFMS agree with previous literature (Hays et al., 2002; McDonald et al., 2000; Oros et al., 2006; Oros and Simoneit, 2001a, b). For example, Oros and Simoneit (2001a) provided the sum of carboxylic acids and alkanes–alkanes–alkanols for conifer burns at ∼ 1 g kg−1, which is within our reported range of 0.4–2.3 g kg−1 (MCE = 0.90–0.95) for non-cyclic aliphatic/oxygenated emitted from burning conifers. Other chemical family EFs presented here for conifers, including PAHs (0.4 g kg−1), diterpenoids (1–3 g kg−1), and methoxyphenols (1 g kg−1), are also in good agreement with those published in Oros and Simoneit (2001a). Hays et al. (2002) reported EFs for unknown compounds from ponderosa pine of ∼ 20 g kg−1, higher than 11 g kg−1 (MCE = 0.94) for the ponderosa pine burn studied here. This may be due to more compounds being classified here than in Hays et al. (2002) or differences in MCE between the studies. In contrast to previous work, EFs for chemical families reported here were measured over a wider range of fire conditions and fuel types and show a clear relationship with MCE.
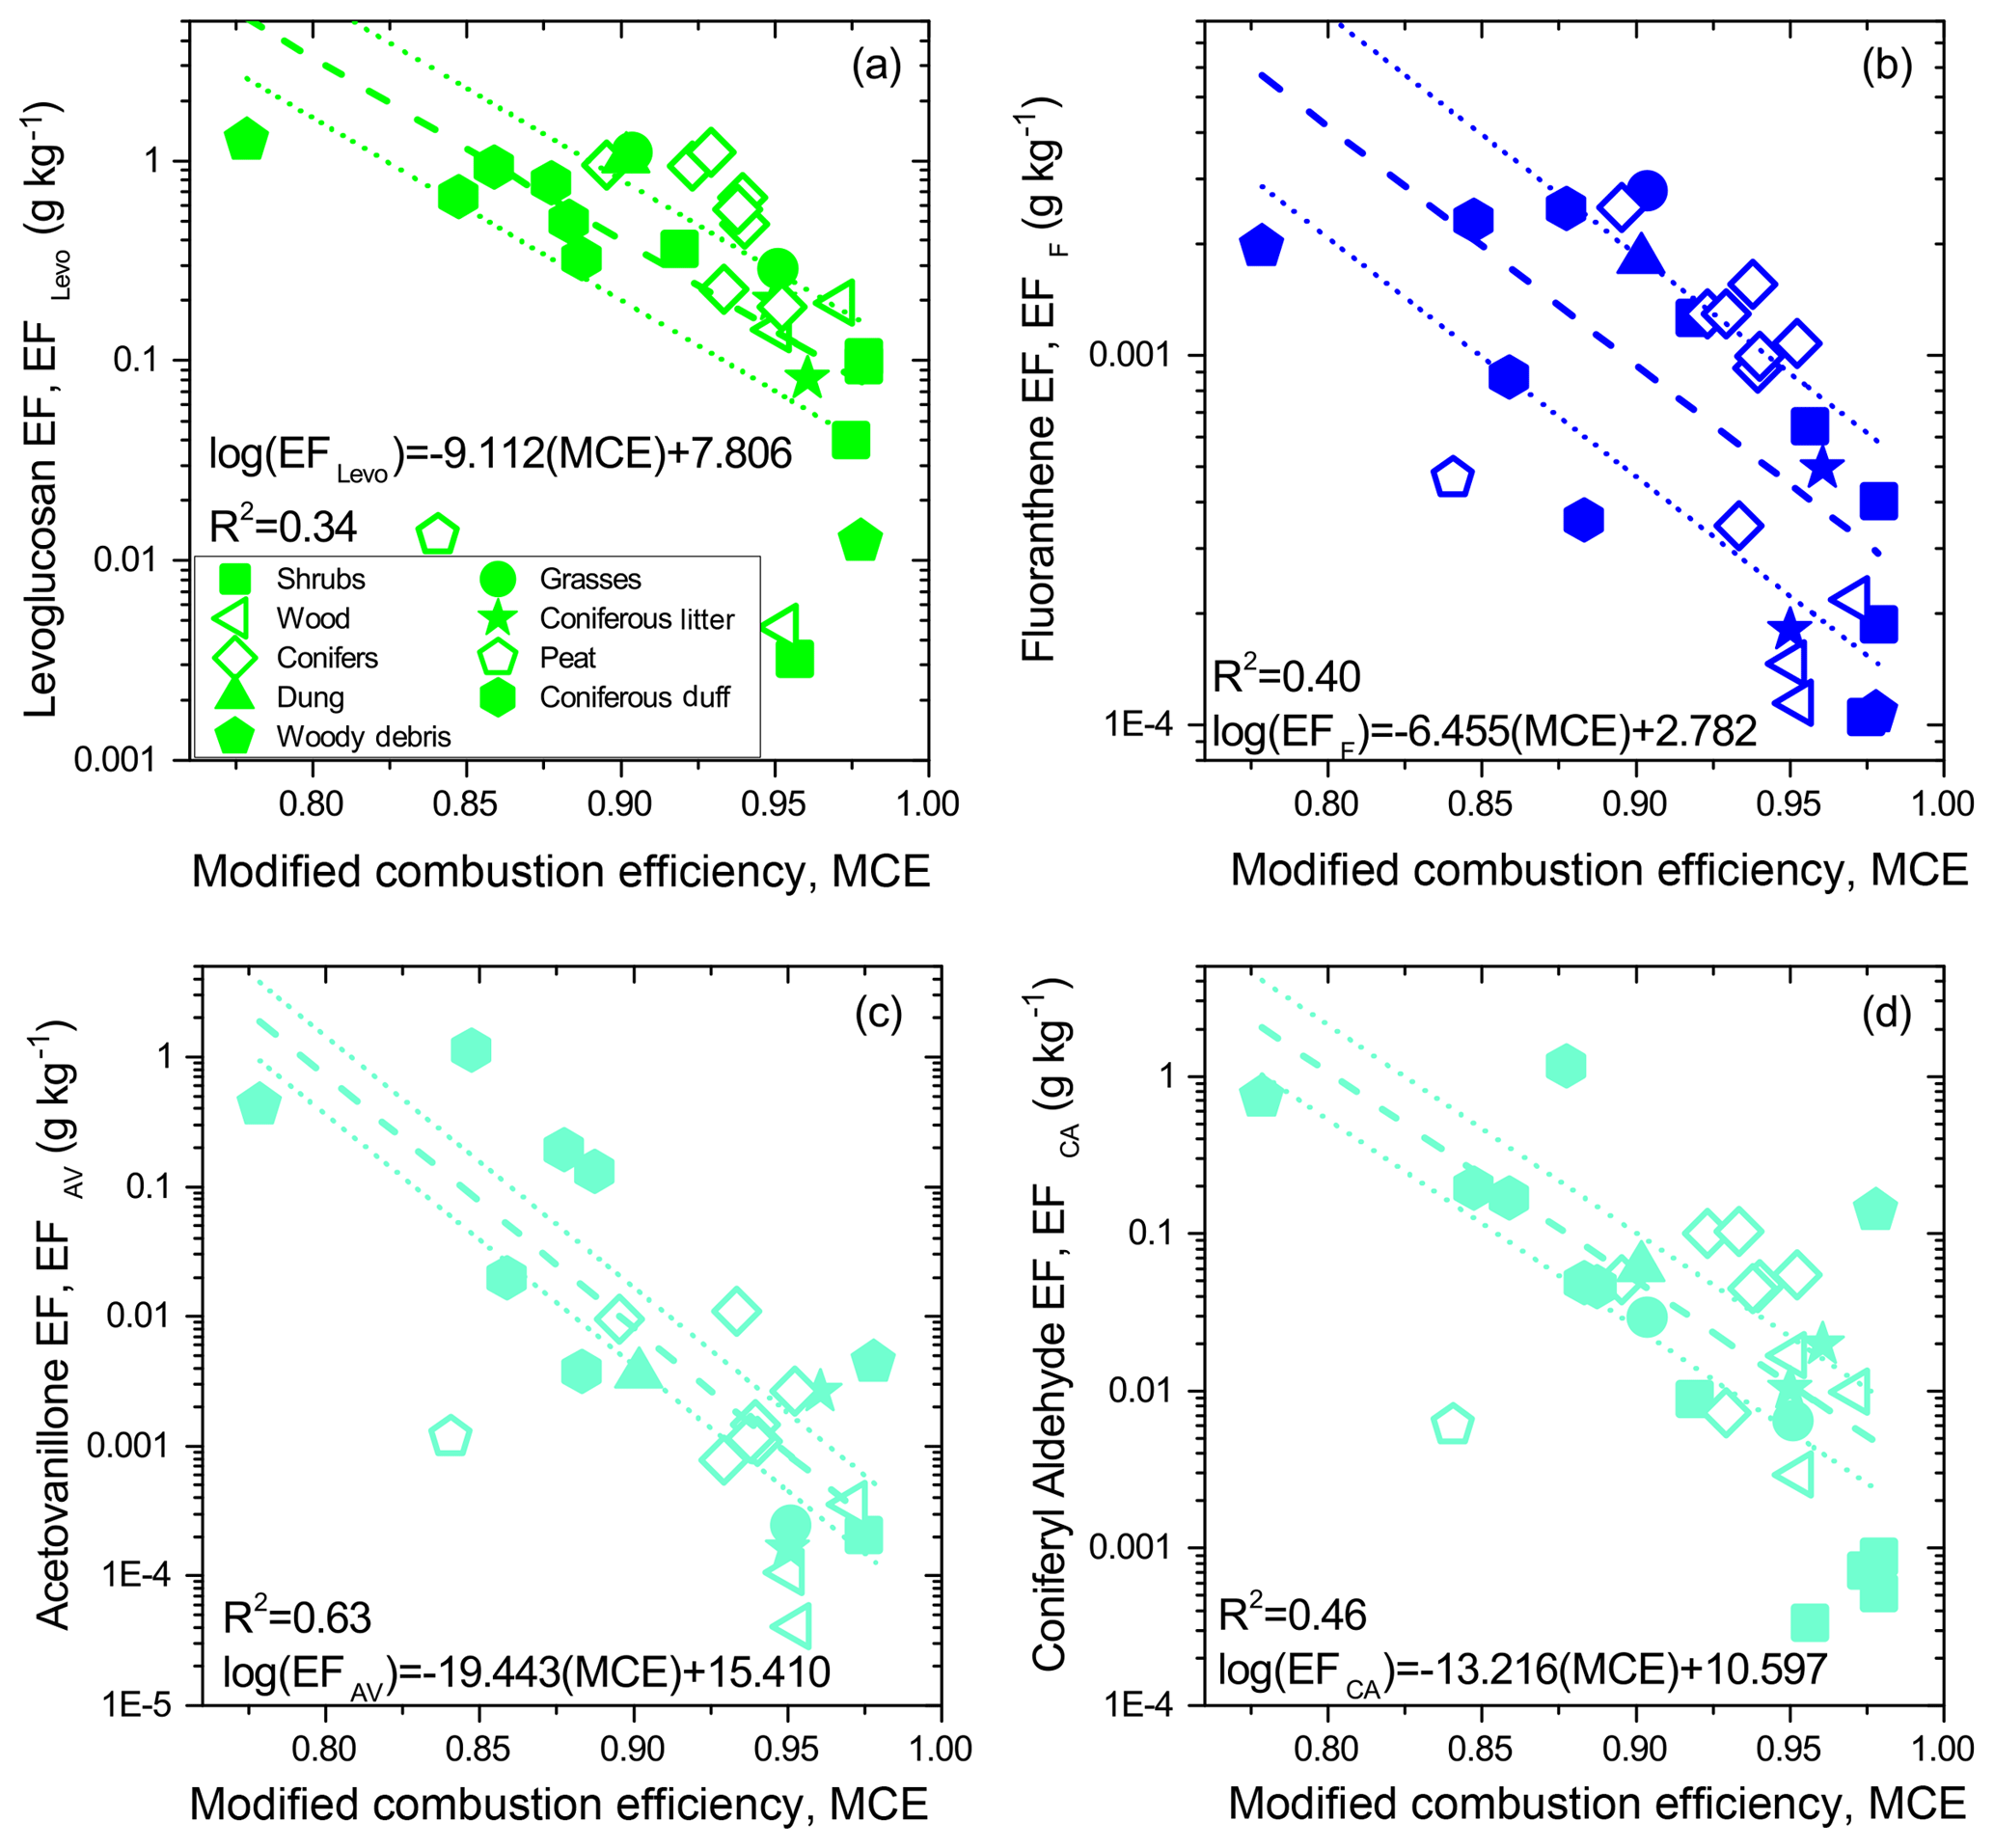
Figure 5Emission factors (EFs) of (a) levoglucosan (sugar), (b) fluoranthene (PAH), (c) acetovanillone (methoxyphenol), and (d) coniferyl aldehyde (methoxyphenol) for various fuel burns as a function of MCE. Dashed lines indicate a log fit of the form log(EF) inversely proportional to MCE. Dotted lines show a factor of 2 above and below the model. Note that peat (open pentagon) is not included in any of the fits. Different symbols represent fuel categories.
Chemical family EFs span ∼ 3 orders of magnitude, and therefore logarithmic fits (given as a dashed line in the semi-log graphs of Fig. 4) were applied to all the measurements excluding peat. Slopes range between −9.425 for sterols/triterpenoids and −14.637 for PAHs/methyl + oxy (fitted slopes, intercepts, and their errors for all chemical families are provided in Table S6). Three decimal places are provided for both the slope and intercept in order to reproduce the regression line. The R2 values for the sugars (Fig. 4) and resin acids/diterpenoids (Fig. S4) are noticeably lower at 0.32 and 0.31, respectively, than the other chemical families (R2∼0.4). This is primarily due to the high mass fraction of sugars and resin acids/diterpenoids found in conifers, as stated above, and suggests that high emissions of both types of compounds are indicative of burning conifers. Also, coniferous litter emitted high amounts of resin acids/diterpenoids. Removing conifers from the semi-logarithmic model for sugars yields a log10(EF(MCE) + 9.361 with R2=0.66, and removing conifers and coniferous litter for resin acids/diterpenoids results in log10(EF(MCE) + 16.360 with R2=0.77. These R2 values are then more similar to those of other chemical families. In general, these results indicate that MCE can be used to estimate EFs for various chemicals across a broad range of fuels, including those not found in the western US wildlands except peat, with a minimal dependence on fuel type.
The goodness-of-fit for the multi-fuel regression models can be evaluated by comparing the predicted EFs to those measured for the various fuel types in this study and others (Liu et al., 2017). As evident in Fig. 4a, the predicted total I/SVOCs to observed EFs are between 0.7 and 11 times higher for shrubs, 0.90 and 0.97 for grasses, 0.22 and 0.74 for conifers, 0.63 and 3.0 for coniferous duff, and 0.28 and 0.85 for woody debris. The model is also compared to previously reported EFs from wildfires. Specifically, Liu et al. (2017) reported MCE values from three different California wildfires and total organic aerosol (OA) particle EFs, which are the most equivalent to total I/SVOC EFs measured here (though at MCE values of <0.8, we observed higher IVOC mass loadings in our chromatograms which would likely not be included in the OA EFs at lower particle mass loadings; May et al., 2013). Liu et al. (2017) measured MCE values of 0.935, 0.877, and 0.923, with OA EFs of 23.3, 30.9, and 18.8 g kg−1, respectively. The model given in Fig. 4a predicts total I/SVOC EFs of 8, 35, and 10 g kg−1 for those MCE values. The predicted EFs are within a factor of 2–3, consistent with measured total I/SVOC EFs reported here. No other previous experiments report chemical family EFs from wildfires with corresponding MCE values; thus the accuracy of applying the chemical family regressions cannot be evaluated at this time. Without this information, uncertainty in using the reported regression models in predicting EFs of various chemical families is estimated to be a factor of 3. However, this uncertainty in EFs is minor when compared to uncertainties in estimating the amount of fuel burned in large-scale carbon emission fire models (French et al., 2011; Urbanski et al., 2011), which is primarily due to high spatial and temporal variations in fuel loadings and lack of observational data. Thus, these regressions can be used to approximate EFs of various chemical families for a wide range of fuels and fuel mixtures from measured MCE values.
Figure 5 shows the fire-integrated EFs of four specific compounds, levoglucosan (sugar), fluoranthene (PAH), acetovanillone (methoxyphenol), and coniferyl aldehyde (methoxyphenol), as a function of MCE. Acetovanillone and coniferyl aldehyde, both methoxyphenols, have been reported previously as tracers for lignin pyrolysis and levoglucosan (and more broadly sugars) from cellulose (Hawthorne et al., 1989; Oros and Simoneit, 2001a; Schauer et al., 2001; Simoneit, 2002). In addition, fluoranthene and other PAHs are known carcinogenic compounds (Boffetta et al., 1997; Kim et al., 2013). EFs for levoglucosan, the most widely reported particulate tracer compound for biomass burning (Mazzoleni et al., 2007; Simoneit et al., 1999; Sullivan et al., 2014), range between ∼ 0.004 and 1 g kg−1 from this study. Hosseini et al. (2013) reported EFlevo for chaparral ecosystems at 0.02–0.1 g kg−1, similar to EFlevo for shrubs measured (0.004–0.1) in this study. Schuaer et al. (2001) provided average EFlevo for pine trees at 1.4 g kg−1, roughly a factor of 2 higher than the average 0.6 g kg−1 EFlevo for conifers of this study. Oros and Simoneit (2001a) examined levoglucosan emissions from various types of pine trees, with an average EFlevo of 0.02 g kg−1, a factor of 30 lower than reported here. Many reasons could explain this difference, such as different smoke sampling and filter extraction procedures and different MCE conditions during sampling. Regardless, the levoglucosan EFs reported in this study generally fall within the ranges measured by previous groups.
EFs for the compounds shown in Fig. 5 span 2–5 orders of magnitude across fire conditions and fuels, including fuels found outside of the western US. Similar to the chemical family EFs, peat displays significantly lower EFs (factor of ∼ 10) than the other fuels. Consequently, applied logarithmic fits, given as dashed lines in Fig. 5, exclude peat. Slopes of these fits range from −6.455 to −19.443 for the four displayed compounds. Figure 5a also shows that the R2 value for levoglucosan is the lowest (0.34) compared to the other compounds (0.40–0.63). This poorer correlation with MCE is similar to that seen for the sugar EFs in Fig. 4c, which shows that EFs from burning conifers were higher than the model predicted. Removing the conifers' levoglucosan EFs results in log(EF(MCE) + 8.041 and improves the correlation (R2=0.43). Nonetheless, these measurements suggest compound EFs do depend to some extent on fuel type in addition to MCE. However, the spread of measured EFs around the logarithmic fit in Fig. 5 indicates a factor of 3 uncertainty in estimating EFs from MCE.
In addition to the well-known biomass burning particulate compounds shown in Fig. 5, these measurements provide useful models to estimate EFs for hundreds of previously unreported compounds (not shown in Fig. 5). These commonly detected compounds (i.e., found in >10 burns and occurring in almost all fuel types) exhibited EFs that were inversely proportional to MCE. Regression parameters for compounds not displayed here are provided in the UCB-GLOBES FIREX mass spectral library. Many of these compounds still remain unidentified or unknown (see Fig. 3) but are now quantified as a function of fire conditions. Future work can be done to identify these compounds and ultimately, with the use of these regressions, estimate their contribution to I/SVOC mass in fresh smoke and model how they chemically transform in the atmosphere.
Smoke produced from burning a wide variety fuels, primarily from the western US wildlands, was collected onto quartz fiber filters at the Fire Science Laboratory and analyzed for elemental and organic carbon. The organic carbon fraction was further separated, identified, classified, and quantified using the TD-GC × GC-EI/VUV-HRToFMS with online derivatization. Each separated compound's mass spectrum, n-alkane retention index, chemical family, EF vs. MCE relationship, and fuel source are reported here in a publicly available mass spectral library (UCB-GLOBES FIREX) for future comparisons and identification of biomass burning organic compounds in atmospheric samples. Between 10 % and 65 % of the I/SVOC mass for each burn could be specifically identified or placed into a chemical family. Fuels within the same type tended to exhibit similar mass fractions, regardless of fire condition (as quantitated modified combustion efficiency, MCE). For example, similar unknown compounds accounted for ∼ 90 % of the total observed mass for the two woody debris burns (MCE = 0.78–0.98). Conifers exhibited similar sugar and resin acid/diterpenoid mass fractions (out of total classified mass) of 30 %–50 % and 2 %–20 %, respectively (MCE = 0.90–0.95). Burns of coniferous duff (MCE = 0.85–0.89) emitted higher classified mass fractions of methoxyphenols (6 %–18 %) than conifers. Peat, a semi-fossilized fuel, displayed a high classified mass fraction of non-cyclic aliphatic/oxy compounds (52 %). Shrubs showed the widest range in mass fractions, indicating fuels in this type were the most dissimilar.
Unlike mass fractions which depend primarily on fuel type, measured emission factors (EFs), classified into either organic carbon, chemical families, or specific compounds, primarily depended on fire conditions (MCE). Regardless of classification, EFs spanned 2–5 orders of magnitude from smoldering to flaming conditions. EFs were shown to follow an inversely proportional relationship to MCE across the wide variety of all fuels studied. However, peat EFs for chemical families (except non-cyclic aliphatic compounds) and specific compounds were approximately a factor of 10 lower than fuels at similar MCE values. This is likely due to significant differences in the fuel structure of peat. Furthermore, conifers exhibited higher sugar (factor of 5) and levoglucosan (factor of 3) emissions compared to other fuels within the same MCE range. This indicates that fuel type and specific fuels play some role in the EFs, though more minor compared to MCE. This is particularly true for nitrogen species and fuel-specific tracer compounds, i.e. compounds that are only emitted from a particular fuel, which will be discussed in a forthcoming paper. However, in general, EFs for these particulate compounds primarily depend on MCE and can be estimated from the fire conditions.
To provide modelers with useful relationships in estimating particle-phase I/SVOC emissions, logarithmic fits were applied to the measured EFs as a function of MCE. These regression models can be used to approximate EFs of I/SVOCs or their chemical families from average MCE of real wildfires, for which fuel loadings, fuel types, and fuel mixtures are often unknown. For example, comparison with Liu et al. (2017) shows the estimated particulate organics from the regression model to be within a factor of 2–3 of those measured in that study. The comparison between predicted and previously measured EFs is affected by methodology, concentration regime, and the definitions of I/SVOC. Regardless, these regression models provide approximate EFs (within a factor of 3) of numerous chemical families and organic species as solely a function of fire conditions across a wide variety of fuels. These regressions will allow modelers and other experimentalists to better define the chemical composition of smoke particles emitted from wildland burns in the western US and potentially other parts of the world.
UCB-GLOBES can be downloaded from the Goldstein website at https://nature.berkeley.edu/ahg/data/MSLibrary/ (last access: 29 May 2018). The specific library for FIREX is “FSL_FIREX2016_vX.msp”, where “X” is the version number. The library contains information on all separated compounds observed during the FSL FIREX campaign in 2016 and will be periodically updated as compounds are matched across other campaigns. Observed emission factors for all of the observed compounds for each of the analyzed burns can be accessed for free through the NOAA FIREX data archives (http://esrl.noaa.gov/csd/groups/csd7/measurements/2016firex/FireLab/DataDownload/, last access: 29 May 2018).
The supplement related to this article is available online at: https://doi.org/10.5194/acp-19-1013-2019-supplement.
CNJ, LEH, VS, RJY, NMK, KCB, and AHG formulated the science question and designed the experimental setup. CNJ, LEH, VS, RJY, and AEF collected the data at FSL. CNJ and AHG analyzed the I/SVOC data. VS and RJY analyzed the CO and CO2 data. RW organized the ALS campaign. CNJ wrote the manuscript, with all authors contributing comments.
The authors declare that they have no conflict of interest.
This work was supported by NOAA (NA16OAR4310107, NA16OAR4310103, and
NA16OAR4310100) to UCB, UCR, and UM. Coty N. Jen acknowledges support from
NSF PFS (AGS-1524211). Indonesian peat sampling was supported by NASA grant
NNX13AP46G. Authors thank the staff at FSL and organizers of FIREX. The
Advanced Light Source provided the VUV light and is supported by DOE. Special
thanks are given to Bruce Rude and Kevin Wilson at LBNL for their assistance during the
beamline campaign.
Edited by: Nga Lee
Ng
Reviewed by: two anonymous referees
Akagi, S. K., Yokelson, R. J., Wiedinmyer, C., Alvarado, M. J., Reid, J. S., Karl, T., Crounse, J. D., and Wennberg, P. O.: Emission factors for open and domestic biomass burning for use in atmospheric models, Atmos. Chem. Phys., 11, 4039–4072, https://doi.org/10.5194/acp-11-4039-2011, 2011.
Alvarado, M. J., Lonsdale, C. R., Yokelson, R. J., Akagi, S. K., Coe, H., Craven, J. S., Fischer, E. V., McMeeking, G. R., Seinfeld, J. H., Soni, T., Taylor, J. W., Weise, D. R., and Wold, C. E.: Investigating the links between ozone and organic aerosol chemistry in a biomass burning plume from a prescribed fire in California chaparral, Atmos. Chem. Phys., 15, 6667–6688, https://doi.org/10.5194/acp-15-6667-2015, 2015.
Andreae, M. O. and Merlet, P.: Emission of trace gases and aerosols from biomass burning, Global Biogeochem. Cy., 15, 955–966, https://doi.org/10.1029/2000GB001382, 2001.
Boffetta, P., Jourenkova, N., and Gustavsson, P.: Cancer risk from occupational and environmental exposure to polycyclic aromatic hydrocarbons, Cancer Caus. Control, 8, 444–472, https://doi.org/10.1023/A:1018465507029, 1997.
Bond, T. C. and Bergstrom, R. W.: Light Absorption by Carbonaceous Particles: An Investigative Review, Aerosol Sci. Tech., 40, 27–67, https://doi.org/10.1080/02786820500421521, 2006.
Christian, T. J., Kleiss, B., Yokelson, R. J., Holzinger, R., Crutzen, P. J., Hao, W. M., Saharjo, B. H., and Ward, D. E.: Comprehensive laboratory measurements of biomass-burning emissions: 1. Emissions from Indonesian, African, and other fuels, J. Geophys. Res.-Atmos., 108, 148–227, https://doi.org/10.1029/2003JD003704, 2003.
Christian, T. J., Kleiss, B., Yokelson, R. J., Holzinger, R., Crutzen, P. J., Hao, W. M., Shirai, T., and Blake, D. R.: Comprehensive laboratory measurements of biomass-burning emissions: 2. First intercomparison of open-path FTIR, PTR-MS, and GC-MS/FID/ECD, J. Geophys. Res.-Atmos., 109, D02311, https://doi.org/10.1029/2003JD003874, 2004.
Dennison, P. E., Brewer, S. C., Arnold, J. D., and Moritz, M. A.: Large wildfire trends in the western United States, 1984–2011, Geophys. Res. Lett., 41, 2928–2933, https://doi.org/10.1002/2014GL059576, 2014.
Donahue, N. M., Robinson, A. L., and Pandis, S. N.: Atmospheric organic particulate matter: From smoke to secondary organic aerosol, Atmos. Environ., 43, 94–106, https://doi.org/10.1016/j.atmosenv.2008.09.055, 2009.
French, N. H. F., de Groot, W. J., Jenkins, L. K., Rogers, B. M., Alvarado, E., Amiro, B., de Jong, B., Goetz, S., Hoy, E., Hyer, E., Keane, R., Law, B. E., McKenzie, D., McNulty, S. G., Ottmar, R., Pérez-Salicrup, D. R., Randerson, J., Robertson, K. M., and Turetsky, M.: Model comparisons for estimating carbon emissions from North American wildland fire, J. Geophys. Res.-Biogeo., 116, G00K05, https://doi.org/10.1029/2010JG001469, 2011.
George, I. J., Black, R. R., Geron, C. D., Aurell, J., Hays, M. D., Preston, W. T., and Gullett, B. K.: Volatile and semivolatile organic compounds in laboratory peat fire emissions, Atmos. Environ., 132, 163–170, https://doi.org/10.1016/j.atmosenv.2016.02.025, 2016.
Hatch, L. E., Luo, W., Pankow, J. F., Yokelson, R. J., Stockwell, C. E., and Barsanti, K. C.: Identification and quantification of gaseous organic compounds emitted from biomass burning using two-dimensional gas chromatography-time-of-flight mass spectrometry, Atmos. Chem. Phys., 15, 1865–1899, https://doi.org/10.5194/acp-15-1865-2015, 2015.
Hatch, L. E., Rivas-Ubach, A., Jen, C. N., Lipton, M., Goldstein, A. H., and Barsanti, K. C.: Measurements of I/SVOCs in biomass-burning smoke using solid-phase extraction disks and two-dimensional gas chromatography, Atmos. Chem. Phys., 18, 17801–17817, https://doi.org/10.5194/acp-18-17801-2018, 2018.
Hawthorne, S. B., Krieger, M. S., Miller, D. J., and Mathiason, M. B.: Collection and quantitation of methoxylated phenol tracers for atmospheric pollution from residential wood stoves, Environ. Sci. Technol., 23, 470–475, https://doi.org/10.1021/es00181a013, 1989.
Hays, M. D., Geron, C. D., Linna, K. J., Smith, N. D., and Schauer, J. J.: Speciation of Gas-Phase and Fine Particle Emissions from Burning of Foliar Fuels, Environ. Sci. Technol., 36, 2281–2295, https://doi.org/10.1021/es0111683, 2002.
Hosseini, S., Urbanski, S. P., Dixit, P., Qi, L., Burling, I. R., Yokelson, R. J., Johnson, T. J., Shrivastava, M., Jung, H. S., Weise, D. R., Miller, J. W., and Cocker, D. R.: Laboratory characterization of PM emissions from combustion of wildland biomass fuels, J. Geophys. Res.-Atmos., 118, 9914–9929, https://doi.org/10.1002/jgrd.50481, 2013.
Iinuma, Y., Brüggemann, E., Gnauk, T., Müller, K., Andreae, M. O., Helas, G., Parmar, R., and Herrmann, H.: Source characterization of biomass burning particles: The combustion of selected European conifers, African hardwood, savanna grass, and German and Indonesian peat, J. Geophys. Res.-Atmos., 112, D08209, https://doi.org/10.1029/2006JD007120, 2007.
IPCC: Climate Change 2014, in: Impacts, Adaptation, and Vulnerability, Part A: Global and Sectoral Aspects, Contribution of Working Group II to the Fifth Assessment Report of the Intergovernmental Panel on Climate Change, edited by: Field, C. B., Barros, V. R. Dokken, D. J., Mach, K. J., Mastrandrea, M. D., Bilir, T. E., Chatterjee, M., Ebi, K. L., Estrada, Y. O., Genova, R. C., Girma, B., Kissel, E. S., Levy, A. N., MacCracken, S., Mastrandrea, P. R., and White, L. L., Cambridge University Press, Cambridge, United Kingdom and New York, NY, USA, 2014.
Isaacman, G., Worton, D. R., Kreisberg, N. M., Hennigan, C. J., Teng, A. P., Hering, S. V., Robinson, A. L., Donahue, N. M., and Goldstein, A. H.: Understanding evolution of product composition and volatility distribution through in-situ GC × GC analysis: a case study of longifolene ozonolysis, Atmos. Chem. Phys., 11, 5335–5346, https://doi.org/10.5194/acp-11-5335-2011, 2011.
Isaacman, G., Wilson, K. R., Chan, A. W. H., Worton, D. R., Kimmel, J. R., Nah, T., Hohaus, T., Gonin, M., Kroll, J. H., Worsnop, D. R., and Goldstein, A. H.: Improved resolution of hydrocarbon structures and constitutional isomers in complex mixtures using gas chromatography-vacuum ultraviolet-mass spectrometry, Anal. Chem., 84, 2335–2342, https://doi.org/10.1021/ac2030464, 2012.
Jayarathne, T., Stockwell, C. E., Bhave, P. V., Praveen, P. S., Rathnayake, C. M., Islam, Md. R., Panday, A. K., Adhikari, S., Maharjan, R., Goetz, J. D., DeCarlo, P. F., Saikawa, E., Yokelson, R. J., and Stone, E. A.: Nepal Ambient Monitoring and Source Testing Experiment (NAMaSTE): emissions of particulate matter from wood- and dung-fueled cooking fires, garbage and crop residue burning, brick kilns, and other sources, Atmos. Chem. Phys., 18, 2259–2286, https://doi.org/10.5194/acp-18-2259-2018, 2018.
Jen, C. N., Liang, Y., Hatch, L. E., Kreisberg, N. M., Stamatis, C., Kristensen, K., Battles, J. J., Stephens, S. L., York, R. A., Barsanti, K. C, and Goldstein, A. H.: High Hydroquinone Emissions from Burning Manzanita, Environ. Sci. Tech. Lett., 5, 309–314, https://doi.org/10.1021/acs.estlett.8b00222, 2018.
Jolly, W. M., Cochrane, M. A., Freeborn, P. H., Holden, Z. A., Brown, T. J., Williamson, G. J., and Bowman, D. M. J. S.: Climate-induced variations in global wildfire danger from 1979 to 2013, Nat. Commun., 6, 7537, https://doi.org/10.1038/ncomms8537, 2015.
Kim, K.-H., Jahan, S. A., Kabir, E., and Brown, R. J. C.: A review of airborne polycyclic aromatic hydrocarbons (PAHs) and their human health effects, Environ. Int., 60, 71–80, https://doi.org/10.1016/j.envint.2013.07.019, 2013.
Koss, A. R., Sekimoto, K., Gilman, J. B., Selimovic, V., Coggon, M. M., Zarzana, K. J., Yuan, B., Lerner, B. M., Brown, S. S., Jimenez, J. L., Krechmer, J., Roberts, J. M., Warneke, C., Yokelson, R. J., and de Gouw, J.: Non-methane organic gas emissions from biomass burning: identification, quantification, and emission factors from PTR-ToF during the FIREX 2016 laboratory experiment, Atmos. Chem. Phys., 18, 3299–3319, https://doi.org/10.5194/acp-18-3299-2018, 2018.
Laskin, A., Smith, J. S., and Laskin, J.: Molecular Characterization of Nitrogen-Containing Organic Compounds in Biomass Burning Aerosols Using High-Resolution Mass Spectrometry, Environ. Sci. Technol., 43, 3764–3771, https://doi.org/10.1021/es803456n, 2009.
Laskin, A., Laskin, J., and Nizkorodov, S. A.: Chemistry of Atmospheric Brown Carbon, Chem. Rev., 115, 4335–4382, https://doi.org/10.1021/cr5006167, 2015.
Liu, X., Huey, L. G., Yokelson, R. J., Selimovic, V., Simpson, I. J., Müller, M., Jimenez, J. L., Campuzano-Jost, P., Beyersdorf, A. J., Blake, D. R., Butterfield, Z., Choi, Y., Crounse, J. D., Day, D. A., Diskin, G. S., Dubey, M. K., Fortner, E., Hanisco, T. F., Hu, W., King, L. E., Kleinman, L., Meinardi, S., Mikoviny, T., Onasch, T. B., Palm, B. B., Peischl, J., Pollack, I. B., Ryerson, T. B., Sachse, G. W., Sedlacek, A. J., Shilling, J. E., Springston, S., St. Clair, J. M., Tanner, D. J., Teng, A. P., Wennberg, P. O., Wisthaler, A., and Wolfe, G. M.: Airborne measurements of western US wildfire emissions: Comparison with prescribed burning and air quality implications, J. Geophys. Res.-Atmos., 122, 6108–6129, https://doi.org/10.1002/2016JD026315, 2017.
May, A. A., Levin, E. J. T., Hennigan, C. J., Riipinen, I., Lee, T., Collett, J. L., Jimenez, J. L., Kreidenweis, S. M., and Robinson, A. L.: Gas-particle partitioning of primary organic aerosol emissions: 3. Biomass burning, J. Geophys. Res.-Atmos., 118, 327–338, https://doi.org/10.1002/jgrd.50828, 2013.
Mazzoleni, L. R., Zielinska, B., and Moosmüller, H.: Emissions of Levoglucosan, Methoxy Phenols, and Organic Acids from Prescribed Burns, Laboratory Combustion of Wildland Fuels, and Residential Wood Combustion, Environ. Sci. Technol., 41, 2115–2122, https://doi.org/10.1021/es061702c, 2007.
McDonald, J. D., Zielinska, B., Fujita, E. M., Sagebiel, J. C., Chow, J. C., and Watson, J. G.: Fine Particle and Gaseous Emission Rates from Residential Wood Combustion, Environ. Sci. Technol., 34, 2080–2091, https://doi.org/10.1021/es9909632, 2000.
Miller, J. D., Safford, H. D., Crimmins, M., and Thode, A. E.: Quantitative Evidence for Increasing Forest Fire Severity in the Sierra Nevada and Southern Cascade Mountains, California and Nevada, USA, Ecosystems, 12, 16–32, https://doi.org/10.1007/s10021-008-9201-9, 2009.
Naeher, L. P., Brauer, M., Lipsett, M., Zelikoff, J. T., Simpson, C. D., Koenig, J. Q., and Smith, K. R.: Woodsmoke Health Effects: A Review, Inhal. Toxicol., 19, 67–106, https://doi.org/10.1080/08958370600985875, 2007.
Oros, D. R. and Simoneit, B. R. T.: Identification and emission factors of molecular tracers in organic aerosols from biomass burning Part 1, Temperate climate conifers, Appl. Geochem., 16, 1513–1544, https://doi.org/10.1016/S0883-2927(01)00021-X, 2001a.
Oros, D. R. and Simoneit, B. R. T.: Identification and emission factors of molecular tracers in organic aerosols from biomass burning Part 2, Deciduous trees, Appl. Geochem., 16, 1545–1565, https://doi.org/10.1016/S0883-2927(01)00022-1, 2001b.
Oros, D. R., Abas, M. R., Omar, N. Y. M. J., Rahman, N. A., and Simoneit, B. R. T.: Identification and emission factors of molecular tracers in organic aerosols from biomass burning: Part 3, Grasses, Appl. Geochem., 21, 919–940, https://doi.org/10.1016/j.apgeochem.2006.01.008, 2006.
Park, R. J., Jacob, D. J., and Logan, J. A.: Fire and biofuel contributions to annual mean aerosol mass concentrations in the United States, Atmos. Environ., 41, 7389–7400, https://doi.org/10.1016/j.atmosenv.2007.05.061, 2007.
Reinhardt, E. D., Keane, R. E., and Brown, J. K.: First Order Fire Effects Model: FOFEM 4.0, user's guide, Gen Tech Rep INT-GTR-344 Ogden UT US Dep. Agric. For. Serv. Intermt. Res. Stn., 65, 344, https://doi.org/10.2737/INT-GTR-344, 1997.
Schauer, J. J., Kleeman, M. J., Cass, G. R., and Simoneit, B. R. T.: Measurement of Emissions from Air Pollution Sources, 3. C1-C29 Organic Compounds from Fireplace Combustion of Wood, Environ. Sci. Technol., 35, 1716–1728, https://doi.org/10.1021/es001331e, 2001.
Selimovic, V., Yokelson, R. J., Warneke, C., Roberts, J. M., de Gouw, J., Reardon, J., and Griffith, D. W. T.: Aerosol optical properties and trace gas emissions by PAX and OP-FTIR for laboratory-simulated western US wildfires during FIREX, Atmos. Chem. Phys., 18, 2929–2948, https://doi.org/10.5194/acp-18-2929-2018, 2018.
Simoneit, B. R. T.: Biomass burning – a review of organic tracers for smoke from incomplete combustion, Appl. Geochem., 17, 129–162, https://doi.org/10.1016/S0883-2927(01)00061-0, 2002.
Simoneit, B. R. T., Schauer, J. J., Nolte, C. G., Oros, D. R., Elias, V. O., Fraser, M. P., Rogge, W. F., and Cass, G. R.: Levoglucosan, a tracer for cellulose in biomass burning and atmospheric particles, Atmos. Environ., 33, 173–182, https://doi.org/10.1016/S1352-2310(98)00145-9, 1999.
Spracklen, D. V., Mickley, L. J., Logan, J. A., Hudman, R. C., Yevich, R., Flannigan, M. D., and Westerling, A. L.: Impacts of climate change from 2000 to 2050 on wildfire activity and carbonaceous aerosol concentrations in the western United States, J. Geophys. Res.-Atmos., 114, D20301, https://doi.org/10.1029/2008JD010966, 2009.
Stockwell, C. E., Yokelson, R. J., Kreidenweis, S. M., Robinson, A. L., DeMott, P. J., Sullivan, R. C., Reardon, J., Ryan, K. C., Griffith, D. W. T., and Stevens, L.: Trace gas emissions from combustion of peat, crop residue, domestic biofuels, grasses, and other fuels: configuration and Fourier transform infrared (FTIR) component of the fourth Fire Lab at Missoula Experiment (FLAME-4), Atmos. Chem. Phys., 14, 9727–9754, https://doi.org/10.5194/acp-14-9727-2014, 2014.
Stockwell, C. E., Veres, P. R., Williams, J., and Yokelson, R. J.: Characterization of biomass burning emissions from cooking fires, peat, crop residue, and other fuels with high-resolution proton-transfer-reaction time-of-flight mass spectrometry, Atmos. Chem. Phys., 15, 845–865, https://doi.org/10.5194/acp-15-845-2015, 2015
Stockwell, C. E., Jayarathne, T., Cochrane, M. A., Ryan, K. C., Putra, E. I., Saharjo, B. H., Nurhayati, A. D., Albar, I., Blake, D. R., Simpson, I. J., Stone, E. A., and Yokelson, R. J.: Field measurements of trace gases and aerosols emitted by peat fires in Central Kalimantan, Indonesia, during the 2015 El Niño, Atmos. Chem. Phys., 16, 11711–11732, https://doi.org/10.5194/acp-16-11711-2016, 2016.
Sullivan, A. P., May, A. A., Lee, T., McMeeking, G. R., Kreidenweis, S. M., Akagi, S. K., Yokelson, R. J., Urbanski, S. P., and Collett Jr., J. L.: Airborne characterization of smoke marker ratios from prescribed burning, Atmos. Chem. Phys., 14, 10535–10545, https://doi.org/10.5194/acp-14-10535-2014, 2014.
Urbanski, S. P., Hao, W. M., and Nordgren, B.: The wildland fire emission inventory: western United States emission estimates and an evaluation of uncertainty, Atmos. Chem. Phys., 11, 12973–13000, https://doi.org/10.5194/acp-11-12973-2011, 2011.
Ward, D. E. and Radke, L. F.: Emissions measurements from vegetation fires: A comparative evaluation of methods and results, in: Fire in the Environment: The Ecological, Atmospheric, and Climatic Importance of Vegetation Fires, edited by: Crutzen, P. J. and Goldammer, J. G., Dahlem Workshop Reports: Environmental Sciences Research Report 13, Chischester, England, John Wiley & Sons, 53–76, 1993.
Westerling, A. L., Hidalgo, H. G., Cayan, D. R., and Swetnam, T. W.: Warming and Earlier Spring Increase Western US Forest Wildfire Activity, Science, 313, 940–943, https://doi.org/10.1126/science.1128834, 2006.
Wiedinmyer, C., Akagi, S. K., Yokelson, R. J., Emmons, L. K., Al-Saadi, J. A., Orlando, J. J., and Soja, A. J.: The Fire INventory from NCAR (FINN): a high resolution global model to estimate the emissions from open burning, Geosci. Model Dev., 4, 625–641, https://doi.org/10.5194/gmd-4-625-2011, 2011.
Williams, B. J., Goldstein, A. H., Kreisberg, N. M., and Hering, S. V.: An in-situ instrument for speciated organic composition of atmospheric aerosols: Thermal Desorption Aerosol GC/MS-FID (TAG), Aerosol Sci. Technol., 40, 627–638, https://doi.org/10.1080/02786820600754631, 2006.
Worton, D. R., Decker, M., Isaacman-VanWertz, G., Chan, A. W. H., Wilson, K. R., and Goldstein, A. H.: Improved molecular level identification of organic compounds using comprehensive two-dimensional chromatography, dual ionization energies and high resolution mass spectrometry, Analyst, 142, 2395–2403, https://doi.org/10.1039/C7AN00625J, 2017.
Yokelson, R. J., Burling, I. R., Gilman, J. B., Warneke, C., Stockwell, C. E., de Gouw, J., Akagi, S. K., Urbanski, S. P., Veres, P., Roberts, J. M., Kuster, W. C., Reardon, J., Griffith, D. W. T., Johnson, T. J., Hosseini, S., Miller, J. W., Cocker III, D. R., Jung, H., and Weise, D. R.: Coupling field and laboratory measurements to estimate the emission factors of identified and unidentified trace gases for prescribed fires, Atmos. Chem. Phys., 13, 89–116, https://doi.org/10.5194/acp-13-89-2013, 2013.
Zhang, H., Yee, L. D., Lee, B. H., Curtis, M. P., Worton, D. R., Isaacman-VanWertz, G., Offenberg, J. H., Lewandowski, M., Kleindienst, T. E., Beaver, M. R., Holder, A. L., Lonneman, W. A., Docherty, K. S., Jaoui, M., Pye, H. O. T., Hu, W., Day, D. A., Campuzano-Jost, P., Jimenez, J. L., Guo, H., Weber, R. J., Gouw, J. de, Koss, A. R., Edgerton, E. S., Brune, W., Mohr, C., Lopez-Hilfiker, F. D., Lutz, A., Kreisberg, N. M., Spielman, S. R., Hering, S. V., Wilson, K. R., Thornton, J. A., and Goldstein, A. H.: Monoterpenes are the largest source of summertime organic aerosol in the southeastern United States, P. Natl. Acad. Sci. USA, 115, 2038–2043, https://doi.org/10.1073/pnas.1717513115, 2018.