the Creative Commons Attribution 4.0 License.
the Creative Commons Attribution 4.0 License.
The efficiency of secondary organic aerosol particles acting as ice-nucleating particles under mixed-phase cloud conditions
Dawei Hu
James Dorsey
M. Rami Alfarra
Aki Pajunoja
Annele Virtanen
Paul Connolly
Gordon McFiggans
Secondary organic aerosol (SOA) particles have been found to be efficient ice-nucleating particles under the cold conditions of (tropical) upper-tropospheric cirrus clouds. Whether they also are efficient at initiating freezing under slightly warmer conditions as found in mixed-phase clouds remains undetermined. Here, we study the ice-nucleating ability of photochemically produced SOA particles with the combination of the Manchester Aerosol Chamber and Manchester Ice Cloud Chamber. Three SOA systems were tested resembling biogenic and anthropogenic particles as well as particles of different phase state. These are namely α-pinene, heptadecane, and 1,3,5-trimethylbenzene. After the aerosol particles were formed, they were transferred into the cloud chamber, where subsequent quasi-adiabatic cloud activation experiments were performed. Additionally, the ice-forming abilities of ammonium sulfate and kaolinite were investigated as a reference to test the experimental setup.
Clouds were formed in the temperature range of −20 to −28.6 ∘C. Only the reference experiment using dust particles showed evidence of ice nucleation. No ice particles were observed in any other experiment. Thus, we conclude that SOA particles produced under the conditions of the reported experiments are not efficient ice-nucleating particles starting at liquid saturation under mixed-phase cloud conditions.
- Article
(1443 KB) - Full-text XML
-
Supplement
(979 KB) - BibTeX
- EndNote
Clouds and their feedbacks are major sources of uncertainty in future-climate predictions. Aerosol particles, to a significant extent, determine the condensation of water to form liquid droplets and ice crystals. The transition into the ice phase is particularly important, e.g. for formation of precipitation, but is as yet poorly understood in detail. While certain aerosol particles such as dust are known to be important ice-nucleating particles (INPs), others are highly abundant, yet their ice-forming abilities remain poorly understood. One example of such particles is secondary organic aerosol (SOA; see also a recent review about the role of organic aerosol as INPs by Knopf et al., 2018). They originate from biogenic and anthropogenic sources, e.g. from the oxidation of plant, biomass burning, and combustion emissions. SOA particles can exist in different phase states. The traditional understanding conceived them as homogeneous well-mixed liquids, but they can occur in amorphous semi-solid or solid (also termed glassy) states (Virtanen et al., 2010). The state of the particles is dependent on the relative humidity (RH) and temperature (Koop et al., 2011; Berkemeier et al., 2014). The amorphous phase state of glassy particles has been shown to influence their ability to act as ice-nucleating particles. For example Murray et al. (2010) have found glassy organic particles to be efficient INPs in the depositional mode in the tropical tropopause layer. In their experiments, Murray et al. (2010) found that glassy aerosol particles nucleated ice crystals at lower relative humidities (with respect to ice) than the same aerosol in a non-glassy phase state. Furthermore, fewer particles nucleated on the glassy particles, allowing higher in-cloud humidities. Several further studies have investigated the ice-forming capability of different SOA particles (e.g. Prenni et al., 2009; Wang et al., 2012; Ladino et al., 2014; Schill et al., 2014; Ignatius et al., 2016; Wagner et al., 2017) in the laboratory. The procedures for generation of the SOA particles as well as the methods of initiating ice nucleation do vary substantially among these experiments. For example, SOA formation has been initiated by dark ozonolysis (Prenni et al., 2009; Wagner et al., 2017) or photochemical reactions (Ladino et al., 2014; Ignatius et al., 2016), using gas-phase reactions (Wang et al., 2012; Ignatius et al., 2016) or aqueous processing (Wilson et al., 2012; Baustian et al., 2013; Schill et al., 2014). Ice nucleation has been tested e.g. in expansion chambers (Murray et al., 2010; Wilson et al., 2012; Wagner et al., 2017), in continuous-flow diffusion chambers and flow tubes (Ladino et al., 2014; Ignatius et al., 2016), and in microscope systems (Wang et al., 2012; Baustian et al., 2013). Whether these formation pathways and ice nucleation initiation methods have an impact on the ice nucleation ability of the SOA particles is not clear. In addition to the different particle generation procedures, the resulting particle sizes vary, too, which certainly alters the ice nucleation capability (larger particles provide a larger surface area and are more likely to form ice). The findings of the above-mentioned studies can be summarized as follows: Wang et al. (2012) and Ignatius et al. (2016) found that atmospheric SOA particles are potentially important for ice nucleation due to their semi-solid or solid phase states by investigating SOA from naphthalene and α-pinene, respectively, whereas Ladino et al. (2014) and Wagner et al. (2017) found that α-pinene SOA at first is an inefficient INP at cirrus temperatures, but after precooling of the SOA particles, ice nucleation ability is increased. Schill et al. (2014) found that semi-solid or glassy SOA from aqueous processing of methylglyoxal with methylamine is a poor depositional INP; however, Wilson et al. (2012) found other aqueous glassy aerosol to nucleate ice heterogeneously at temperatures relevant for cirrus formation in the tropical tropopause layer. All these studies investigated the ice-forming abilities of the SOA particles at temperatures in the cirrus regime (i.e. below −40 ∘C). Investigations of the ice nucleation potential of SOA in mixed-phase cloud conditions are scarce. One example of a study conducted at mixed-phase cloud temperatures is reported by Prenni et al. (2009). They looked at the ice-nucleating ability of alkenes at −30 ∘C and found them to be unlikely to participate in heterogeneous nucleation. However, they formed the SOA particles by dark ozonolysis of precursors. To our knowledge, the efficiency of photochemically produced SOA particles as ice-nucleating particles under mixed-phase cloud conditions has not been determined.
Modelling studies generally predict that SOA particles are efficient INPs under cirrus conditions, i.e. low temperature and humidities (e.g. Koop et al., 2011; Berkemeier et al., 2014; Price et al., 2015) as the SOA particles are in a glassy phase state under those conditions. Furthermore, Shiraiwa et al. (2017) state that even in the middle troposphere SOA should be mostly in the glassy state, which may promote ice nucleation. They found SOA to undergo their glass transition above 2 km altitude. Similarly, Mikhailov et al. (2009) state that a moisture-induced glass transition may play a role in the lower troposphere, depending on the relative humidity. Thus, SOA might play a role as INPs in mixed-phase clouds, too.
The freezing and eventual sublimation of ice from the aerosol particle may change its properties (e.g. Adler et al., 2014): so-called cloud processing. Thus, such a freeze–drying cycle might increase their ice-nucleating abilities. Wagner et al. (2014), for example, found that preactivated aerosol particles, i.e. temporarily cooled particles, have an increased ability for heterogeneous ice nucleation. Cloud processing also happens in warm clouds (e.g. Hoose et al., 2008), where the aerosol particle characteristics can be changed e.g. through additional uptake of atmospheric gases, and chemical reactions with the soluble part of the contained aerosol particle take place in the aqueous phase. Upon evaporation of the cloud, aerosol particles are re-emitted, and these particles have changed chemical properties and are larger than the initial particles (Pruppacher and Klett, 1997); therefore, the aerosol size distribution is also affected by cloud processing. Comparison of the size distribution of interstitial aerosol within the cloud with the size distribution below the cloud clearly indicates that the processing of the aerosol through (nonprecipitating) stratus can lead to increased mass of the subset of particles which had served as cloud condensation nuclei (CCN; Hoppel et al., 1994).
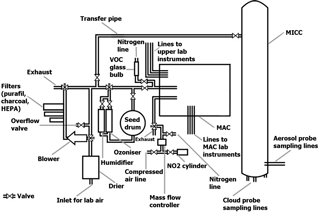
Figure 1Drawing of the aerosol (MAC) and cloud (MICC) chambers, air system, connecting pipes, and various sampling lines.
This work aims to investigate the ice-nucleating ability of photochemically produced SOA particles under mixed-phase cloud conditions in the Manchester Aerosol Chamber (MAC) and Manchester Ice Cloud Chamber (MICC). Here, we report on the results of the measurements (Sect. 3, including the experimental setup), after an introduction of the chambers and instrumentation (Sect. 2). The results are discussed in relation to previous studies and their impact for atmospheric processes (Sect. 4) and summarized in the conclusions (Sect. 5).
For the current study the MICC and MAC were used, which are connected by a transfer pipe. The chambers and their instrumentation are described in the following. An overview is given in Fig. 1.
2.1 Manchester Aerosol Chamber (MAC)
The Manchester Aerosol Chamber (MAC) is a photochemical aerosol chamber comprising a 18 m3 teflon bag (Hamilton et al., 2011; Alfarra et al., 2013) surrounded by a temperature- and RH-controlled housing. The teflon bag is held by three frames such that the upper and lower frame can freely move to allow expansion and collapsing of the chamber during fill cycles or sampling (thus removing air) from the chamber. Attached to the chamber is an air system that contains a series of filters (Purafil, Purafil Inc., USA; charcoal; HEPA, Donaldson Filtration, USA), a humidifier, an ozonizer, and a seed drum. NOx can be added (as NO2) as well as the target volatile organic compounds (VOCs) for SOA formation. The precursors are introduced through injection into a heated glass bulb and transferred into the chamber by a flow of filtered, high-purity nitrogen (ECD grade, 99.997 %). Thus, the composition of gaseous precursors and relative humidity can be controlled. Two 6 kW xenon arc lamps and further halogen bulbs are mounted on the inside of the bag's housing to simulate the solar spectrum and enable photochemistry. Furthermore, the housing is covered with reflective space blanket, in order to maximize the irradiance in the bag and to ensure even illumination. The xenon arc lamps are mounted on two opposite sides of the enclosure at different heights. The illumination setup has been tuned to mimic the atmospheric actinic spectrum over the wavelength range 290–800 nm. Air conditioning ensures that the chamber is kept at an operating temperature of typically 25 ∘C during experiments (under illumination). Further details on the chamber and illumination can be found in Alfarra et al. (2013).
The aerosol chamber is equipped with a set of instruments to measure temperature, humidity, aerosol number, particle size distribution, mass concentration, and chemical composition. Relative humidity and temperature are measured at the centre and on the side of the chamber by a dew point hygrometer, a thermocouple, and a resistance probe. A water-based condensation particle counter (WCPC 3785, TSI Inc., USA; with a cut-off diameter of 5 nm) is used to measure the aerosol number concentrations. A differential mobility particle sizer (DMPS, custom made) observes particle size and mass distributions for sizes between 40 and 640 nm with the sheath flow taken from the chamber as well. A chemiluminescence gas analyser (Model 42i, Thermo Scientific, USA) is used for measuring NO and NO2 mixing ratios, and ozone was measured by a UV photometric gas detector (Model 49C, Thermo Scientific, USA).
A transfer pipe connects the aerosol chamber to the cloud chamber (as indicated in Fig. 1). The pipe has a diameter of 1 in. and is approximately 33 m long.
2.2 Manchester Ice Cloud Chamber (MICC)
The Manchester Ice Cloud Chamber (MICC) is a 10 m high stainless-steel tube of 1 m diameter which is contained in three cold rooms (spanning over three floors; Connolly et al., 2012; Emersic et al., 2015). The cold rooms can be temperature-controlled from room temperature to approximately −50 ∘C. Two scroll pumps are used to evacuate the chamber in order to form clouds in these experiments. The chamber can be refilled, e.g. with filtered air or air from the aerosol chamber, via the transfer pipe (cf. Fig. 1).
MICC is instrumented to measure ambient conditions such as temperature, pressure, and humidity, and furthermore cloud particle and aerosol particle concentrations. The following instruments are in use: eight thermocouples (K type) at different heights, reaching alternately 10 cm (thermocouples Tc1, Tc3, Tc5, Tc7) or 50 cm (thermocouples Tc2, Tc4, Tc6, Tc8) into the chamber. The thermocouples were calibrated before the experiments at temperatures between −78.5 ∘C (dry ice) and 100 ∘C (boiling point of water). The thermocouples have a time constant of about 60 s; see Appendix A for more detail. A modified (for lower temperatures) Keller Lex1 pressure sensor with accuracy of 0.2 % of full scale monitors the chamber pressure. Humidity can be measured at ambient pressure by a CR-4 hygrometer. For the measurements of cloud particle properties such as number concentrations, size distributions, and shapes, a Forward Scattering Spectrometer Probe (FSSP; Dye and Baumgardner, 1984) and a Cloud Particle Imager (CPI, version 1.0; Connolly et al., 2007) were deployed. Aerosol particle numbers and size distributions in the cloud chamber have been obtained by a condensation particle counter (CPC, Model 3010, TSI Inc., USA; with a cut-off diameter at 10 nm) and a scanning mobility particle sizer (SMPS, Model 3080, TSI Inc., USA) for size and mass distributions in the size range 13.8–626.4 nm.
2.3 Cleaning procedures
In order to clean the chambers, the attached air system accommodates three filters (see description in Sect. 2.1 and Fig. 1) to remove any particles and reactive gases.
The aerosol chamber is cleaned by several cycles of filling and flushing (at least five times) until the aerosol number concentrations stay constant below 5 cm−3 (dark concentration). The cleaning procedure includes flushing the pipes around the seed drum and ozonizer. After the last flushing cycle, ozone is added into the chamber and left overnight in order to oxidize any leftover reactants. Typically for this purpose, ozone concentrations are about 500–600 nmol mol−1. The content of the chamber is then replaced with clean air using a series of fill–flush cycles prior to the experiment. Once a week a SOA background experiment (see Sect. 3.2 for details) is conducted where the UV lights are switched on. These background experiments could be seen as “harsh” cleaning procedures, and the combination of the daily cleaning (fill–flush cycles and ozone overnight) and background cycles has been found to keep the chamber sufficiently clean.
The cloud chamber is cleaned by repeated evacuations of the chamber to 200 hPa followed by refilling from the air system with filtered air until aerosol concentrations stay constant below 1 cm−3. The number of necessary cleaning cycles is dependent on the aerosol number concentrations left from a previous experiment.
As the cloud chamber is fitted with several outlets/openings, which for evacuation are sealed off, there are sources for leakages. These have been measured by evacuating the chamber to 200 hPa and leaving it at this pressure for approximately 2 h. A leakage rate of 0.12 hPa min−1 was found, which should only allow introduction of a small number of unspecified aerosol from the lab air. An estimate including previous leak checks and concurrent aerosol concentration measurements suggests an introduction of less than 1.5 cm−3 when leaving the chamber 5 min at 200 hPa. (Less aerosol is introduced through leakages at higher pressures in the cloud chamber.) The leak check included the transfer pipe; i.e. the valve to the transfer pipe on the cloud chamber side was open and just closed at the entrance to the air system. The refilling of the cloud chamber with air from the aerosol chamber was performed as quickly as possible, to reduce time when MICC and the transfer pipe are underpressured and can potentially be contaminated (typically started within 1 min). A transfer, i.e. the refilling of the cloud chamber from the aerosol chamber to ambient pressure, takes about 10 min.
The air system itself is a complex system with various fittings; therefore, it presents a further potential source of contamination during transfers. This was tested by “clean bag” transfers, where both chambers are cleaned and a transfer is performed with (almost) particle-free air from the aerosol chamber bag (measurements are shown in Supplement).
In addition to the cleaning procedures, MICC is regularly defrosted to avoid build-up of ice on the sample line outlets to the cloud particle instrumentation that would eventually lead to particle losses.
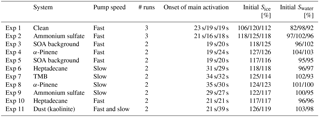
The experimental programme was constructed to test the efficiency of SOA to act as ice-nucleating particles under conditions roughly resembling mixed-phase clouds where dust starts to become important as ice-nucleating particle. Experiments were started at −20 ∘C and close to water saturation to allow formation of liquid clouds which then glaciate. Thus, the setup also allows for testing of immersion freezing, i.e. whether the activated cloud droplets contain efficient (semi-)solid INP inclusions. Three different SOA systems were used to perform the experiments. They were chosen to be representative of a typical range of SOA particles of varying sources found in the atmosphere, including anthropogenic and biogenic particles as well as particles of different phase state (here liquid and semi-solid particles; Virtanen et al., 2010, see also Sect. 3.1). The SOA were photochemically formed from the following precursors: α-pinene (biogenic and semi-solid phase state), 1,3,5-trimethylbenzene (TMB; anthropogenic and semi-solid), and heptadecane (anthropogenic and liquid). In order to test the experimental setup, the experiments using SOA particles for cloud formation were accompanied with experiments using ammonium sulfate. Ammonium sulfate was chosen as it is a well-known system that does not nucleate ice under the chosen experimental conditions. Furthermore, it can easily be tested with a model to assess whether the ammonium sulfate measurements are meaningful (see Sect. 3.4). A further control experiment was performed using dust (kaolinite) as this is known to be an ice-nucleating particle at the given temperature. Some systems have been tested with two different pump speeds during the cloud activation experiments, which alters the cooling rate. Cooling rates were approximately 10.1 and 6.2 K min−1 for fast and slow pump speed, respectively. An overview of the performed experiments is given in Table 1.
3.1 Particle bounce measurements
Amorphous solid particles have been observed to bounce in an aerosol impactor; thus, the bounce of particles can be used to infer their phase state (Virtanen et al., 2010). In a previous experiment using the combination of MAC and MICC, transfer experiments on some of the same (and some additional) systems were performed, and the phase state of particles was determined by particle bounce measurements (see Saukko et al., 2012b, a, for a detailed description of the methods). Here an upgraded version of the bounce system, the Aerosol Bounce Instrument (ABI; Pajunoja et al., 2015), was employed. ABI consists of a particle size selection unit (neutralizer containing bipolar 210Po strip and Vienna type long DMA), a humidification unit (Permapure PD-240-12SS, Nafion multitube), impactor unit (MOUDI stage #14 with upstream pressure pinitial=0.85 bar and downstream pressure pfinal=0.7 bar, leading to a cut-off aerodynamic diameter da=67.09 nm), and two CPCs (TSI, Model 3010) for measuring the particle number concentration before and after the impactor. ABI determines a bounced fraction (BF) of particles, which is used as an indicator of the phase state of particles; particles with BF of 0 are mechanically liquid, whereas particles with 0.1 < BF < 1 are mechanically solid or semi-solid. Calculation and calibration of bounce measurements are described in more detail by Saukko et al. (2012a).
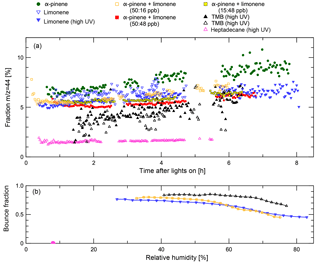
Figure 2Composition and bounced fraction of SOA particles in MAC. Open symbols represent data collected in experiments where there was no quantitative ice nucleation data. Panel (a) shows the mass fraction of the aerosol mass spectrometer (AMS) fragments measured at m∕z = 44 throughout their growth in the aerosol chamber. Panel (b) shows bounced fractions for heptadecane, α-pinene and limonene, and limonene experiments as a function of RH at the latest available time before transfer. In general higher bounce fractions are found at lower relative humidity. It can clearly be seen that SOA from the heptadecane experiment exhibit very different behaviour, maintaining a bounced fraction of less than 0.012 even at the lowest available RH. All other bounced fraction data are similar to the other examples shown. The heptadecane experiment also shows a much lower m∕z = 44 fraction than in other experiments.
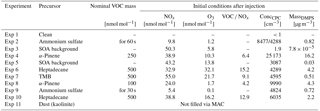
Table 2Initial nominal conditions for SOA formation in the aerosol chamber. For a description of how the VOCs are injected into the chamber see Sect. 3.2.
In Fig. 2, the bounced fractions measured for TMB, heptadecane, α-pinene and limonene, and limonene experiments as a function of RH are shown. In general higher bounce fractions are found at lower relative humidity. For TMB, limonene, and α-pinene and limonene cases the bounced fractions are high under dry conditions and stay elevated (BF > 0.4) up to RH 80 %, indicating semi-solid phase of the particles at elevated humidities. It can clearly be seen that SOA from the heptadecane experiment exhibit very different behaviour, maintaining a bounced fraction of less than 0.012 even at the lowest available RH, indicating liquid phase state already under dry conditions. Similar liquid behaviour was observed for heptadecane earlier by Saukko et al. (2012b). The heptadecane experiment also shows a much lower m∕z = 44 fraction than in other experiments. Even though these bounce measurements were not performed simultaneously to the ice nucleation experiments that we report here, the bounce measurements were conducted under very similar conditions in the same chamber using the same particle generation procedures. Therefore, we believe that the results are applicable to the SOA particles formed in our recent experiments. Unfortunately, no bounce measurements with pure α-pinene were performed; however, several studies (e.g. Saukko et al., 2012a; Pajunoja et al., 2015; Ignatius et al., 2016) have shown that α-pinene SOA is semi-solid under the conditions relevant here.
3.2 Experimental design
An experiment always followed the outlined procedure: after careful cleaning of the chambers and the air inlet system, the desired particles are created in MAC. To prepare the system for injection of relevant gases for particle formation in MAC, the volatile organic compound (VOC) injection glass bulb is heated and continuously flushed with nitrogen. The precursors for the SOA are injected into the glass bulb in the form of high-purity liquids, where they evaporate immediately. The vapourized VOCs and NOx are then injected during the last filling of the MAC air bag. By filling through the humidifier, water vapour is added. Mixing within the bag is ensured by the main filling air stream. Photochemistry is started by switching on the lights. Ozone is injected as well just after the lights are switched on as a source of OH to speed up aerosol nucleation and to increase particle numbers. After sufficient time for the photochemistry, the lights are switched off and the cloud chamber is evacuated to prepare for the transfer. Table 2 shows the initial concentrations and other chamber conditions used for the formation of SOA particles. A typical development of the formation of a SOA system is shown in Fig. 3.
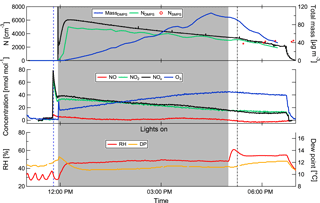
Figure 3Development of SOA particles in the aerosol chamber. The blue dashed line indicates the injection of the SOA precursors, the grey dash-dotted line the beginning of the transfer to the cloud chamber. The grey shading indicates the time with the lights switched on. This example shows the development of SOA from the heptadecane precursor (experiment 8; see Table 1).
Table 3Conditions in the aerosol chamber shortly before transfer to the cloud chamber and aerosol properties after transfer in MICC.
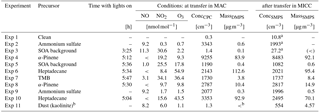
a SMPS
data not available (too-low number concentrations) or faulty; concentrations taken from CPC.
b Dust injected into MICC directly.
< means below detection limit.
When total aerosol particle mass reaches equilibrium in MAC, a transfer is performed from MAC to MICC. For the transfer MICC is evacuated to 200 hPa and then refilled from MAC to ambient pressure. Thus, the desired aerosol population is transferred into the cloud chamber and slightly diluted by the remaining air in MICC; i.e. approximately 8 m3 of air from MAC is transferred to MICC and mixed with the approximately 2 m3 of remaining clean air. Table 3 specifies the conditions in MAC shortly before and in MICC after the transfer. The dilution leads to a tendency of the semi-volatile components of the aerosol to evaporate. Since the air is cooled at the same time, there also is the opposing tendency of condensation, and any semi-volatile component in the aerosol will have a tendency to transfer between phases accordingly. As there is neither humidity nor organic vapour measurement during the transfer, the exact state of the aerosol is unknown. The transfer is then followed by measuring aerosol total number concentration and size distribution in MICC (using the CPC and SMPS). Temperatures in MICC fluctuate during a transfer, decreasing during chamber evacuation and increasing during refill, even above the target temperature of 253 K, as the aerosol chamber is operated at room temperature, and the transferred air needs time to cool. Therefore, further aerosol measurements are obtained after MICC temperatures have settled back to the target temperature. Comparison of aerosol size distributions from just after transfer and just before a cloud activation experiment, i.e. after the temperatures have settled, reveals that there is no significant change. Therefore, we conclude that either no significant evaporation and condensation took place or both effects cancel each other. As the chamber walls are ice-coated, any humidity in excess of RHice would have condensed onto the chamber walls following the transfer. However, given the dimensions of the chamber and the low speed of the diffusion process, supersaturation is not depleted until the start of the experiments: immediately following the later aerosol measurements, a cloud activation run is performed; i.e. MICC was pumped down to 700 hPa with the cloud probes sampling from the chamber as well. Two different pump speeds were tested, a faster pump speed using both main pumps and the pumps attached to the cloud probes, and a slower pump speed using one of the main pumps only in addition to the cloud probes. A faster pump speed, assuming adiabaticity, will lead to a faster cooling rate and higher supersaturations. MICC is refilled again from MAC, to avoid further dilution of the aerosol by mixing with filtered air. Again, aerosol number concentrations and size distributions are measured in MICC two times, and a further cloud expansion is performed. If there is still enough air remaining in MAC, it is used to refill MICC, which allows for a third cloud run.
Additionally, cloud activation experiments on background transfers were performed. The background experiments normally contain all of the chemical substances as in a typical SOA experiment, with the exception of the main precursor. They are conducted to quantify the contribution of background VOCs and oxidants to the overall SOA formation and to ensure that the SOA formed during actual experiments is a result of the oxidation of the precursors being studied (i.e. not originating from compounds coming off the chamber walls or from the air used to fill the chamber).
3.3 Results
Instead of showing data for all cloud expansions here, we will only illustrate in detail two examples, one using heptadecane as precursor and one using α-pinene, as the latter looks fairly similar to the TMB experiment. For the sake of completeness, figures for all other cloud activation runs can be found in the Supplement. An example of a cloud activation run on SOA formed on the heptadecane precursor with the faster pump speed is shown in Fig. 4. The uppermost panel shows the aerosol size distribution measured by the SMPS prior to the chamber evacuation, along with the numbers for total aerosol concentration as observed by the SMPS. Agreement of the size distributions observed after transfer and before expansion shows that there is no significant alteration of the aerosol size distribution as a result of the time spent in MICC while the temperatures settle. The mean mode diameter of the aerosol is located at about 370 nm, while the second mode diameter is at about 200 nm. Thus, these aerosol particles are large enough to potentially act as ice-nucleating particles. Simultaneously with the aerosol measurements, humidity was scanned in MICC. These observations show that MICC was almost saturated with respect to water (RHw = 96 %, supersaturated with respect to ice); the dew point was at 252.6 K after the transfer and at 252.7 K before the expansion. The further panels in Fig. 4 show the time series of the cloud development, with the size distribution and mean volume diameter (MVD) of cloud particles (panel b) observed by the FSSP, total water content (TWC) and number concentration (N; panel c), pressure and temperature (panel d), and some example images taken by the CPI (pictures at the bottom of the figure). Cloud particles observed just at the start of the expansion potentially stem from opening the valve to the instrument inlet and should not be considered.
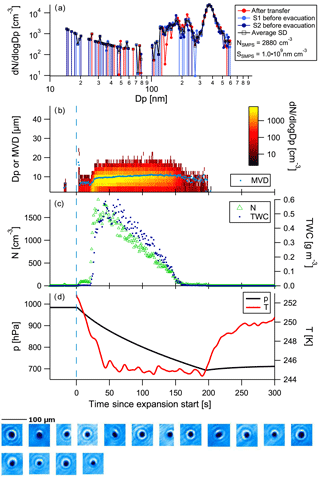
Figure 4Example of a cloud evacuation performed on heptadecane precursor aerosol (experiment 10; see Table 1). Panel (a) shows the SMPS size distributions obtained before the expansion, followed by time series of FSSP measurements, size distribution and mean volume diameter (MVD, panel b), total water content (TWC) and number concentration (N, panel c), and temperature and pressure (panel d) during evacuation. Below the time series images captured by the CPI are shown. This was the second run on the aerosol population with a fast pump speed.
At the beginning of the cloud activation run (first 20 s) a small number of aerosol particles (approx. 30 cm−3) activate to cloud particles with sizes mostly below 10 µm. The main activation takes place at 21 s, apparent from the cloud particle size distribution time series. High numbers of small hydrometeors are observed that subsequently grow to slightly larger sizes (cf. yellow colours showing the main particle size mode and superimposed mean volume diameter (MVD, light blue) in the plot). The CPI only detected spherical particles during the expansion. We would expect that potential ice particles would grow to larger sizes than the observed sizes. Taking the sizes and the imaged spherical shapes into consideration, it can be reasonably assumed that the observed particles were water droplets.
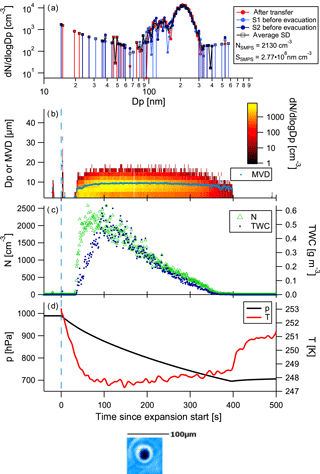
Figure 5 shows the example of a cloud activation run performed with a slow pump speed on SOA generated from α-pinene. The mean mode diameter of the aerosol is at approximately 210 nm. Activation of aerosol to cloud particles starts at 30 s into the cloud run. Particle sizes stay below 20 µm; the mean volume diameter reaches about 9 µm at about 90 s into the cloud activation run and stays fairly constant until the cloud diminishes. Only one spherical particle was imaged by the CPI. Given that there was no further growth in particle size and particle sizes are rather small, we conclude that the particles were in the liquid phase and not frozen. In the case of frozen particles, we would have expected quicker growth to larger sizes, such as in the dust example below.
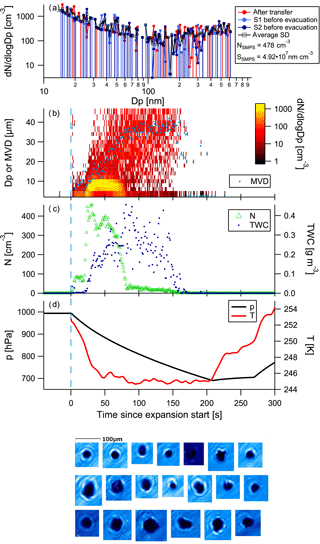
Figure 6Control experiment using kaolinite dust (experiment 11; see Table 1). Panels as in Fig. 4; the data shown here stem from the first run, using a high pump speed. The data show formation of ice in a second mode, and the decrease and almost disappearance of particle numbers of smaller drops over time (Wegener–Bergeron–Findeisen process).
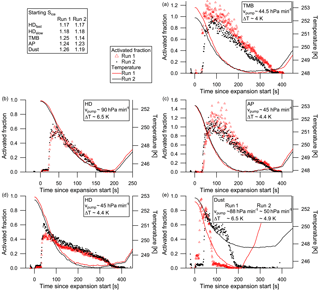
Figure 7Activated fractions of aerosol to cloud particles for heptadecane (HD; b, d), TMB (TMB; a), α-pinene (AP; c), and dust (e). The first cloud evacuation run is shown by the red triangles, the second run by black dots. Pump speed and temperature drop during evacuation are given in the legends.
In order to show that ice can be formed under the experimental conditions, kaolinite dust particles were injected into the cloud chamber. The kaolinite dust (KGa-1b) was injected into the cloud chamber with the help of a dust generator (PALAS RBG 1000) directly attached to the chamber (not via the air system). To ensure proper mixing of the dust and air in the chamber, an evacuation to 700 hPa was performed directly after the injection. The results of the dust run using the high pump speed are shown in Fig. 6. Dust particles of a wide range of sizes were present (see SMPS size distribution). At first, small particles with mean volume diameters between 4 and 10 µm were observed that were presumably large (swollen) dust particles. Upon activation at 21 s, small particles activated in the droplet mode (cf. yellow colours in the size distribution time series), followed by particle growth and a diminishing of the small droplet mode. The drop in cloud particle numbers at about 80 s into the cloud activation run is caused by the growth of the larger ice particles, at the expense of the small droplets (Wegener–Bergeron–Findeisen process). The CPI images show the presence of non-spherical particles, i.e. ice particles.
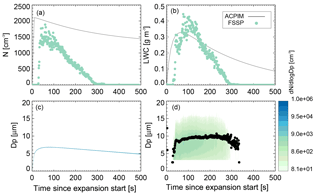
Figure 8Comparison of ammonium sulfate measurements (experiment 9, run 2; see Table 1) and ACPIM simulation of number concentrations (a), LWC (b), and size distribution and mean volume diameter (c: simulated, d: measured).
The two successive cloud activation runs in each experiment can be used to look at activated fractions in order to see whether the aerosol properties change after one activation–deactivation cycle (cloud processing). The activated fraction here is simply calculated by dividing the pre-expansion aerosol number concentration by the peak cloud particle number concentration. Furthermore, when a second experiment is available with a different pump speed, this can be used to determine the effect of the cooling rate on the activation of the aerosol. Figure 7 shows the activated fractions of five experiments: the already shown heptadecane (panel b), α-pinene (panel c), and dust (panel e) activation runs accompanied by the respective other runs in the same experiments, plus a further heptadecane experiment with altered pump speed (panel d) and the TMB experiment (panel a). Instrument error margins may lead to an activated fraction of more than 1. The fast-pump-speed heptadecane experiment shows no significant cloud processing; activated fractions of both runs are very similar. In the slower-pump-speed experiment, however, the second heptadecane run shows a higher activated fraction than the first run, though initial ice supersaturation are the same and temperatures in both runs are within 0.2 ∘C. Thus, the aerosol becomes more efficient at activating to cloud droplets. The first run here exhibits lower activated fractions than the fast-pump-speed runs; the second run peak activated fraction is about the same as in the fast-pump-speed runs. The α-pinene slow-pump-speed experiment shows the opposite behaviour; the second cloud run has slightly lower activated fractions than the first. The same is true for the TMB slow-pump-speed runs. However, the initial temperatures differ by about 0.7 ∘C in the TMB case, resulting in a less strong temperature drop during the expansion, and also the initial ice supersaturation differs. Caution needs to be taken with the outliers in the first α-pinene run, which might be due to oversampling in the FSSP. The dust runs were performed at different pump speeds; the second run using the slower pump speed shows slightly lower activated fractions than the fast-pump-speed run.
3.4 Model comparison for ammonium sulfate control experiment
The Aerosol-Cloud and Precipitation Interactions Model (ACPIM; Connolly et al., 2012) was chosen for testing of the experimental data of the ammonium sulfate control runs. The model is adapted to be used with chamber measurement data such as the ones reported here. The observed temperature and pressure curves as well as the initial relative humidity and aerosol size distribution and number concentrations are used to initialize the model. Figure 8 shows the results of the ACPIM simulation in comparison to the measurements of cloud droplet number concentrations, liquid water content (LWC), and size distribution of the cloud activation run 2 of experiment 9. The model predicts complete activation of the aerosol particles. The measurements show some outliers, which might indicate that the capacity of the instrument for measuring particle numbers has been reached; i.e. too many particles lead to overcounting, which is apparent in the outliers. Apart from the outliers, the measured cloud particle numbers are a little smaller than the modelled numbers; again in high concentrations the instrument is prone to measurement coincidence errors, not only overcounting but also multiple particles in the sample volume at one time, leading to a general undercounting. As all aerosol particles in ACPIM activate, they grow subsequently into a very narrow size distribution as theory predicts. The simulated sizes are somewhat smaller than the mean volume diameter measured by the FSSP. This could be the reason for the smaller LWC predicted than measured as well. The simulation predicts cloud particle appearance earlier than the observations show; this is thought to be due to boundary layer effects in the cloud chamber. Due to e.g. wall heating, the air next to the walls may stay cloud-free for longer than in the interior of the chamber, where the cloud forms earlier on. As the sample lines are attached to the bottom and will first suck air from the boundary layer; it takes time for the cloud to extend downwards to the bottom and be sampled; see also the discussion in Möhler et al. (2003) for similar effects in the Aerosol Interactions and Dynamics in the Atmosphere (AIDA) cloud chamber.
The observed cloud particle size distribution is wider than the simulated one. This could be due to effects of non-uniformity in temperature and humidity that lead to broadening of the size distribution. For example, as the chamber walls will stay close to their initial temperature while the chamber centre cools adiabatically during an expansion, wall heating effects can create a temperature gradient within the chamber (warmer towards the walls and colder towards the chamber centre), which will induce a humidity gradient as well. The incoming air stream causes mixing, which on the one hand can reduce this gradient but on the other hand can induce inhomogeneous temperature and humidity fields, leading to variations in the activation and growth of the cloud particles. However, the simulation and measurements are similar enough to conclude that the measurements behave reasonably as expected.
The goal of this study was to characterize the ice-nucleating abilities of photochemically produced SOA under mixed-phase cloud conditions. Three different precursors were chosen for SOA formation in this study, to cover biogenic and anthropogenic particles as well as particles in different phase states (here semi-solid and liquid). The photo-oxidized SOA particles were transferred into a cloud chamber, and their ice-nucleating abilities were tested at temperatures of −20 to about −28 ∘C. The chamber was close to water saturation at the start of the measurements, thus providing the environment for cloud formation. The most important finding from this study is that the SOA particles tested were not efficient ice-nucleating particles at the chosen temperature and relative humidity range (i.e. in the mixed-phase cloud regime). While the sensitivity runs performed on kaolinite dust particles clearly show nucleation of ice, ice nucleation was not measurable in any of the other SOA or ammonium sulfate runs. Generally, measurements of ice nucleation (or lack of ice nucleation) at temperatures above the cirrus regime are scarce. One example is the study by Prenni et al. (2009), who also found no measurable ice nucleation in continuous-flow chamber measurements at −30 ∘C. However, the residence time of the aerosol particles in the measurements of Prenni et al. in the continuous-flow chamber are in the order of seconds, compared to several minutes here. Furthermore, they formed the SOA particles through dark ozonolysis of precursors using excessive amounts of ozone, whereas in this study photo-oxidation of precursors with less ozone was used. While our results are in line with the findings e.g. of Prenni et al. (2009) and Schill et al. (2014), who concluded that their aqueous SOA is a poor depositional ice nucleus even though the aerosol particles were in a semi-solid or glassy phase state, other studies at lower temperatures have found SOA to be an efficient INP (e.g. Wang et al., 2012; Ignatius et al., 2016) and thus potentially important for atmospheric ice nucleation. Further studies found that SOA from α-pinene is initially an inefficient INP under cirrus cloud conditions and shows an increased ice nucleation ability when precooled or preactivated, i.e. after cloud processing, where the aerosol first activated to supercooled cloud droplets and then froze homogeneously (Ladino et al., 2014; Wagner et al., 2017). These and other studies on the ice-nucleating ability of SOA particles are summarized in Hoose and Möhler (2012) and Knopf et al. (2018). It has to be stressed that in the above-mentioned studies and our study the SOA generation procedures and conditions can vary significantly, as can the methods used to measure ice nucleation; see the Introduction for details. The precise impact the different SOA formation procedures and conditions have on the ability of the SOA as INPs, e.g. whether SOA formed by dark or light ozonolysis would behave differently if temperatures and humidities during the generation were the same, is not clear. In order to help initiate the photochemistry, NOx was used in the SOA formation here, which might be different to other SOA formation conditions. However, to the authors' knowledge, there is no systematic study of the effect of NOx on particle composition or properties, so whether this has an effect on the ice-nucleating ability of the formed SOA is not known. It should be noted, though, that the O : C of produced SOA was also relatively low in our experiments. As shown in Pajunoja et al. (2015), the particle viscosity (or bounce behaviour) at elevated RHs depends strongly on O : C. This is because the particle hygroscopicity (i.e. the particle-phase water content at certain humidity) increases with O : C. Hence, not only the NOx but also the oxidation conditions more generally might affect the composition or viscosity. Furthermore, the main sizes of the produced SOA particles show large differences, ranging from below 100 nm to 40 µm, which will impact their ice-nucleating ability due to the available surface area. While most studies generate their SOA particles at room temperature and (almost) 0 % RH, only Wang et al. (2012) and our experiments stand out with 35 ± 5 and 45–50 % RH, respectively. SOA generated at different temperatures and humidities might exhibit different IN potential, as such conditions impact the phase state of the particles (see e.g. discussion in Berkemeier et al., 2014). We aimed at generating SOA in our experiments under conditions which are close to realistic conditions in the lower boundary layer, where precursor gases for SOA formation are emitted (here: room temperature and relative humidities with regard to water of 45–50 %). Berkemeier et al. (2014) further state that humidification in typical atmospheric updrafts (or cloud chamber experiments) may be fast enough to cause a difference in phase state from that of equilibrium, as the time for diffusion of the water into the particle is longer than the time for humidification. This can result in a particle that has a liquid outer shell but still contains solid inclusions or a solid core even at RH above the quasi-equilibrium glass transition. Thus, SOA particles could potentially act as immersion freezing nuclei in conditions where they are supposed to be liquid, if in equilibrium. Even if Mikhailov et al. (2009) and Shiraiwa et al. (2017) are correct in assuming that glass transition plays a role at ambient temperatures in the lower troposphere (above roughly 2 km), SOA particles according to this study and Prenni et al. (2009) will not be (efficient) ice-nucleating particles, whether as depositional or as immersion freezing nucleus. Thus, even though they are abundant, SOA particles might not play a role in ice formation at lower altitudes.
There seems to be a twofold activation of cloud droplets in the heptadecane experiments. Upon the onset of activation a few seconds after the evacuation starts, a smaller amount of cloud particles are observed with the FSSP with a low LWC, until the second mode of activation commences and larger numbers of particles activate and the LWC peaks. The mean volume diameter of the cloud particles in the first activation mode is a little smaller than in the second mode, though not always clearly apparent. Two modes were observed in the size distribution in the kaolinite dust experiments as well. Here, however, it is likely that the first mode comprises larger (possibly swollen) dust particles and not cloud particles. Cloud particles appear in the second mode. The experiments with SOA particles from α-pinene and TMB precursors show a different behaviour with only the main activation mode. The aerosol particles formed from these precursors are both in a semi-solid phase state, i.e. more viscous than the particles generated from heptadecane at the same temperature and relative humidity. Thus, it takes a longer time for these viscous SOA particles to take on water vapour and grow due to diffusion limitations. A speculative explanation for the behaviour of the heptadecane SOA particles could be that the particles, or rather a subset thereof, already start activating during the transfer. The relatively warm air from the aerosol chamber flows into the cold cloud chamber and starts cooling; the relative humidity increases accordingly. Some vapour will condense onto the walls, but the relative humidity might increase enough to start activation of aerosol particles that have already made it into the chamber. These activated particles then grow, while further, later-arriving particles may stay unactivated. When the evacuation of the cloud chamber starts, cooling will be much higher and all other heptadecane particles will activate as well. Indeed, an effect of different temperatures in the chambers or sampling lines was found and discussed by e.g. Ignatius et al. (2016) and Knopf et al. (2018). However, the aerosol chamber DMPS and cloud chamber SMPS aerosol size distributions do not indicate major growth of particles between transfer and cloud evacuation. A different explanation for our observations could be that larger heptadecane particles were present (and similarly larger dust particles in the dust experiment) before the evacuation started. Such particles could have swollen or activated into cloud particles sooner than the main mode. The SMPS size distributions only extend to 615 nm; thus, we cannot say whether larger particles were indeed present. Another explanation that cannot be ruled out completely is that other aerosol particles from background contamination are activated and cause the first activation mode. However, it is not clear why contamination should only be existent in the heptadecane experiments and not in the α-pinene and TMB experiments as well.
As Mikhailov et al. (2009) point out, organic (semi-)solid amorphous particles can kinetically limit the water uptake and may thus influence the growth activation as cloud condensation nuclei. Thus, the phase state of the aerosol particles (represented by their bounciness) could play a role in the onset of activation, as hinted at in measurements by Ignatius et al. (2016), Ladino et al. (2014), and Wagner et al. (2014). As the cloud chamber is generally close to water saturation at the beginning of each expansion, an earlier activation to cloud particles would be expected than is seen here. It is likely that the observation of cloud particles is delayed due to wall heating effects, i.e. the cloud forms in the middle of the chamber, but when air starts to be pumped through the sample lines to the cloud particle instrumentation, air from the boundary layer between wall and chamber interior is drawn into the lines first, which might be at slightly higher temperatures and therefore at lower relative humidity and cloud-free. Such wall effects have also been observed in other cloud chambers, such as the AIDA chamber (Möhler et al., 2003).
The comparison of activated fractions shows some differences between the investigated aerosol particles: while most experiments show no or only little signs of cloud processing in terms of a changed activated fraction of aerosol particles to cloud particles, TMB activated fractions in the second run are lower than in the first run. Thus, after the first cloud cycle the TMB particles are less likely to form cloud droplets, though the mean mode diameter shifted slightly to larger sizes, which should foster faster droplet activation. α-Pinene shows a similar, though less obvious, behaviour. Generally, cloud processing is thought to increase the efficiency of activation into cloud particles (e.g. Hoose et al., 2008), through changing the internal chemical structure and/or composition of the aerosol particles. However, as the experiments reported here exhibit pure SOA aerosol, and we expect no other organic and inorganic material (or vapours) in the chambers, cloud processing here will only change the aerosol mass, not aerosol chemistry. Only remaining organic vapour can condense into the droplets. Uptake of organic vapours during the first cloud cycle, and thus less vapour available during the second cloud cycle, could lead to a smaller effect of co-condensation (Topping et al., 2013) and thus smaller cloud particle numbers and reduced activated fractions. Dust also showed a higher activated fraction during the first run; however, one has to bear in mind the higher pump speed used in that run. Heptadecane shows a contrary behaviour to the other SOA compounds: in the slow-pump-speed experiment, the second cloud cycle exhibits higher activated fractions than the first cycle, with numbers comparable to those in the cloud cycles of the fast-pump-speed experiment. In the latter no significant difference in activated fractions between the two cloud runs can be distinguished. It has to be noted that the mean mode diameter of the aerosol in the runs using the fast pump speed were about 400 nm, but approximately 500 nm in the slow runs. In general, the heptadecane runs show significantly smaller activated fractions than the runs using the compounds in semi-solid phase state, even though the aerosol mean mode diameters are larger than in the TMB and α-pinene experiments. Therefore, we speculate that the phase state of the SOA particles shows an impact on cloud activation here.
Precooling of SOA particles has the potential to increase the aerosol particles' ability to act as INPs (e.g. Ladino et al., 2014; Wagner et al., 2014). Thus, there could have been a higher chance of ice formation in the respective second cloud activation runs. However, apparently the minimum temperatures reached during the first cloud runs here were not cold enough for such a preactivation of the aerosol particles, and hence no ice had formed.
A further small difference between the compounds in semi-solid and liquid phase state is the growth of particle sizes during cloud activation runs: while in the heptadecane runs (liquid) the MVD increases slightly with time, it stays fairly constant in the α-pinene and TMB runs. This might be due to the smaller activated fractions in the heptadecane experiments which leave more water vapour for further growth of the particles further into the cloud evacuation.
The coupled system of the Manchester Aerosol and Ice Cloud Chamber has been used to investigate the ice-nucleating ability of SOA particles at temperatures and relative humidities that are relevant to mixed-phase clouds. SOA particles were formed on precursors in the aerosol chamber by photo-oxidation. Clouds were formed by evacuation of the cloud chamber, which led to a quasi-adiabatic drop in temperature from approximately −20 to about −28 and −25.5 ∘C (fast and slow pump speed, respectively), fostering cloud formation. At the start of the chamber evacuation the humidity inside the chamber was close to water saturation, allowing for a speedy onset of cloud formation. The measurements show that the photo-oxidized SOA particles are not efficient ice-nucleating particles in the tested temperature range: no ice formation was observed, irrespective of the type of SOA particles that were used (from α-pinene, heptadecane, and TMB precursors), resembling biogenic/anthropogenic and semi-solid/liquid compounds. A sensitivity experiment using kaolinite showed that ice formation was possible with the given setup.
While the phase state (which is represented by particle bounciness; see Sect. 3.1) of the particles has no measurable impact on ice nucleation under the reported conditions, the SOA particles of different phase state show differences in activation and cloud processing. The semi-solid SOA particles from TMB and α-pinene precursors show (slightly) reduced activated fractions in a subsequent cloud cycle; the liquid SOA particles from the heptadecane precursor reveal increased activated fractions. The exact reasons can only be speculated on as for example no measurements of organic vapours in the chambers are available. Furthermore, the heptadecane experiments show a twofold cloud activation feature that is absent in the TMB and α-pinene experiments. Again, these cannot be fully explained here as measurements which would be able to support or disprove the speculations are missing.
The main conclusions from these experiments are that the tested photo-oxidized SOA particles do not nucleate ice under the mixed-phase cloud regime, whether in depositional or immersion freezing mode. Thus, even in their high abundance in nature, SOA particles will act as cloud condensation nuclei and only as ice-nucleating particles when cold enough (likely below the homogeneous freezing threshold).
As the chambers are part of the EUROCHAMP consortium, the data will be made available at the EUROCHAMP data centre. Until then, they will be distributed upon request.
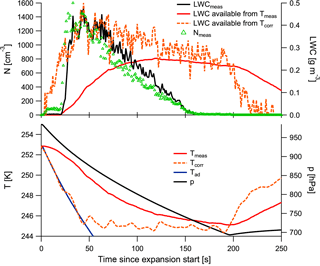
During evacuations the temperature change in the cloud chamber is quasi-adiabatic if no clouds form. When the time constant is considered, a quasi-adiabatic temperature drop can be seen at the beginning of the expansion, while heating effects become stronger later on from wall heating and latent-heat release from droplet formation.
Figure A1 shows the temperatures during a cloud expansion (in the lower panel): measured temperature in red, calculated adiabatic temperature in blue, and the corrected temperature considering the time constant in orange and dashed. The corrected temperature is smoothed with a 20 s running mean due to the small-scale fluctuations in the temperature measurements that otherwise propagate into the corrected temperature. Additionally, the plot shows the pressure. In the upper panel the measured cloud particle number concentrations are displayed as green triangles. The sharp increase in cloud particle numbers at 20 s (i.e. the major activation) coincides with the departure in the corrected temperature curve from the adiabatic curve. By calculating the theoretically available humidity from these retrieved temperatures, we find a good match with our LWC observations, as the calculated available LWCs in the upper panel show.
The supplement related to this article is available online at: https://doi.org/10.5194/acp-18-9393-2018-supplement.
WF and DH performed the main measurement operations and (preliminary – DH) data analysis, with the help of JD and RA. The concept was developed by GM and PC. WF did the main writing. All authors contributed to discussions and fine tuning of the manuscript.
The authors declare that they have no conflict of interest.
The authors would like to thank Lee Paul and Barry Gale for technical help with the
chambers and the air system. The experiments reported in this paper were
carried out in the project CCN-Vol_IN_Bounce, which was funded by the Natural
Environment Research Council (NERC) under the grant code NE/L007827/1. PC
acknowledges funding from the European Union's 7th Framework Programme (FP7)
BACCHUS (FP7/2007-2013) under grant agreement number 603445. The MAC received
funding from the European Union's FP7 EUROCHAMP2 network, and MAC and
MICC both currently receive funding from the Horizon 2020 research and
innovation programme through the EUROCHAMP-2020 Infrastructure Activity under
grant agreement no. 730997. AV acknowledges funding from the European
Research Council (ERC-StG QAPPA, 335478).
Edited by: Markus Petters
Reviewed by: two anonymous referees
Adler, G., Haspel, C., Moise, T., and Rudich, Y.: Optical extinction of highly porous aerosol following atmospheric freeze drying, J. Geophys. Res.-Atmos., 119, 6768–6787, https://doi.org/10.1002/2013JD021314, 2014. a
Alfarra, M. R., Good, N., Wyche, K. P., Hamilton, J. F., Monks, P. S., Lewis, A. C., and McFiggans, G.: Water uptake is independent of the inferred composition of secondary aerosols derived from multiple biogenic VOCs, Atmos. Chem. Phys., 13, 11769–11789, https://doi.org/10.5194/acp-13-11769-2013, 2013. a, b
Baustian, K. J., Wise, M. E., Jensen, E. J., Schill, G. P., Freedman, M. A., and Tolbert, M. A.: State transformations and ice nucleation in amorphous (semi-)solid organic aerosol, Atmos. Chem. Phys., 13, 5615–5628, https://doi.org/10.5194/acp-13-5615-2013, 2013. a, b
Berkemeier, T., Shiraiwa, M., Pöschl, U., and Koop, T.: Competition between water uptake and ice nucleation by glassy organic aerosol particles, Atmos. Chem. Phys., 14, 12513–12531, https://doi.org/10.5194/acp-14-12513-2014, 2014. a, b, c, d
Connolly, P. J., Flynn, M. J., Ulanowski, Z., Choularton, T. W., Gallagher, M. W., and Bower, K. N.: Calibration of the Cloud Particle Imager Probes Using Calibration Beads and Ice Crystal Analogs: The Depth of Field, J. Atmos. Ocean. Tech., 24, 1860–1879, https://doi.org/10.1175/JTECH2096.1, 2007. a
Connolly, P. J., Emersic, C., and Field, P. R.: A laboratory investigation into the aggregation efficiency of small ice crystals, Atmos. Chem. Phys., 12, 2055–2076, https://doi.org/10.5194/acp-12-2055-2012, 2012. a, b
Dye, J. E. and Baumgardner, D.: Evaluation of the Forward Scattering Spectrometer Probe. Part I: Electronic and Optical Studies, J. Atmos. Ocean. Tech., 1, 329–344, 1984. a
Emersic, C., Connolly, P. J., Boult, S., Campana, M., and Li, Z.: Investigating the discrepancy between wet-suspension- and dry-dispersion-derived ice nucleation efficiency of mineral particles, Atmos. Chem. Phys., 15, 11311–11326, https://doi.org/10.5194/acp-15-11311-2015, 2015. a
Hamilton, J. F., Rami Alfarra, M., Wyche, K. P., Ward, M. W., Lewis, A. C., McFiggans, G. B., Good, N., Monks, P. S., Carr, T., White, I. R., and Purvis, R. M.: Investigating the use of secondary organic aerosol as seed particles in simulation chamber experiments, Atmos. Chem. Phys., 11, 5917–5929, https://doi.org/10.5194/acp-11-5917-2011, 2011. a
Hoose, C. and Möhler, O.: Heterogeneous ice nucleation on atmospheric aerosols: a review of results from laboratory experiments, Atmos. Chem. Phys., 12, 9817-9854, https://doi.org/10.5194/acp-12-9817-2012, 2012. a
Hoose, C., Lohmann, U., Bennartz, R., Croft, B., and Lesins, G.: Global simulations of aerosol processing in clouds, Atmos. Chem. Phys., 8, 6939–6963, https://doi.org/10.5194/acp-8-6939-2008, 2008. a, b
Hoppel, W. A., Frick, G. M., Fitzgerald, J. W., and Larson, R. E.: Marine boundary layer measurements of new particle formation and the effects nonprecipitating clouds have on aerosol size distribution, J. Geophys. Res., 99, 14443–14459, https://doi.org/10.1029/94JD00797, 1994. a
Ignatius, K., Kristensen, T. B., Järvinen, E., Nichman, L., Fuchs, C., Gordon, H., Herenz, P., Hoyle, C. R., Duplissy, J., Garimella, S., Dias, A., Frege, C., Höppel, N., Tröstl, J., Wagner, R., Yan, C., Amorim, A., Baltensperger, U., Curtius, J., Donahue, N. M., Gallagher, M. W., Kirkby, J., Kulmala, M., Möhler, O., Saathoff, H., Schnaiter, M., Tomé, A., Virtanen, A., Worsnop, D., and Stratmann, F.: Heterogeneous ice nucleation of viscous secondary organic aerosol produced from ozonolysis of a-pinene, Atmos. Chem. Phys., 16, 6495–6509, https://doi.org/10.5194/acp-16-6495-2016, 2016. a, b, c, d, e, f, g, h, i
Knopf, D. A., Alpert, P. A., and Wang, B.: The Role of Organic Aerosol in Atmospheric Ice Nucleation: A Review, ACS Earth Space Chem., 2, 168–202, https://doi.org/10.1021/acsearthspacechem.7b00120, 2018. a, b, c
Koop, T., Bookhold, J., Shiraiwa, M., and Pöschl, U.: Glass transition and phase state of organic compounds: dependency on molecular properties and implications for secondary organic aerosols in the atmosphere, Phys. Chem. Chem. Phys., 13, 19238–19255, https://doi.org/10.1039/C1CP22617G, 2011. a, b
Ladino, L. A., Zhou, S., Yakobi-Hancock, J. D., Aljawhary, D., and Abbatt, J. P. D.: Factors controlling the ice nucleating abilities of α-pinene SOA particles, J. Geophys. Res.-Atmos., 119, 9041–9051, https://doi.org/10.1002/2014JD021578, 2014. a, b, c, d, e, f, g
Mikhailov, E., Vlasenko, S., Martin, S. T., Koop, T., and Pöschl, U.: Amorphous and crystalline aerosol particles interacting with water vapor: conceptual framework and experimental evidence for restructuring, phase transitions and kinetic limitations, Atmos. Chem. Phys., 9, 9491–9522, https://doi.org/10.5194/acp-9-9491-2009, 2009. a, b, c
Möhler, O., Stetzer, O., Schaefers, S., Linke, C., Schnaiter, M., Tiede, R., Saathoff, H., Krämer, M., Mangold, A., Budz, P., Zink, P., Schreiner, J., Mauersberger, K., Haag, W., Kärcher, B., and Schurath, U.: Experimental investigation of homogeneous freezing of sulphuric acid particles in the aerosol chamber AIDA, Atmos. Chem. Phys., 3, 211–223, https://doi.org/10.5194/acp-3-211-2003, 2003. a, b
Murray, B. J., Wilson, T. W., Dobbie, S., Cui, Z., Al-Jumur, S. M. R. K., Möhler, O., Schnaiter, M., Wagner, R., Benz, S., Niemand, M., Saathoff, H., Ebert, V., Wagner, S., and Kärcher, B.: Heterogeneous nucleation of ice particles on glassy aerosols under cirrus conditions, Nat. Geosci., 3, 233–237, https://doi.org/10.1038/ngeo817, 2010. a, b, c
Pajunoja, A., Lambe, A. T., Hakala, J., Rastak, N., Cummings, M. J., Brogan, J. F., Hao, L., Paramonov, M., Hong, J., Prisle, N. L., Malila, J., Romakkaniemi, S., Lehtinen, K. E. J., Laaksonen, A., Kulmala, M., Massoli, P., Onasch, T. B., Donahue, N. M., Riipinen, I., Davidovits, P., Worsnop, D. R., Petäjä, T., and Virtanen, A.: Adsorptive uptake of water by semisolid secondary organic aerosols, Geophys. Res. Lett., 42, 3063–3068, https://doi.org/10.1002/2015GL063142, 2015. a, b, c
Prenni, A. J., Petters, M. D., Faulhaber, A., Carrico, C. M., Ziemann, P. J., Kreidenweis, S. M., and DeMott, P. J.: Heterogeneous ice nucleation measurements of secondary organic aerosol generated from ozonolysis of alkenes, Geophys. Res. Lett., 36, L06808, https://doi.org/10.1029/2008GL036957, 2009. a, b, c, d, e, f
Price, H. C., Mattsson, J., Zhang, Y., Bertram, A. K., Davies, J. F., Grayson, J. W., Martin, S. T., O'Sullivan, D., Reid, J. P., Rickards, A. M. J., and Murray, B. J.: Water diffusion in atmospherically relevant α-pinene secondary organic material, Chem. Sci., 6, 4876–4883, https://doi.org/10.1039/c5sc00685f, 2015. a
Pruppacher, H. R. and Klett, J. D.: Microphysics of Clouds and Precipitation, vol. 18 of Atmospheric and Oceanographic Science Library, Kluwer Academic Publishers, 2nd edn., 1997. a
Saukko, E., Kuuluvainen, H., and Virtanen, A.: A method to resolve the phase state of aerosol particles, Atmos. Meas. Tech., 5, 259–265, https://doi.org/10.5194/amt-5-259-2012, 2012a. a, b, c
Saukko, E., Lambe, A. T., Massoli, P., Koop, T., Wright, J. P., Croasdale, D. R., Pedernera, D. A., Onasch, T. B., Laaksonen, A., Davidovits, P., Worsnop, D. R., and Virtanen, A.: Humidity-dependent phase state of SOA particles from biogenic and anthropogenic precursors, Atmos. Chem. Phys., 12, 7517–7529, https://doi.org/10.5194/acp-12-7517-2012, 2012b. a, b
Schill, G. P., De Haan, D. O., and Tolbert, M. A.: Heterogeneous Ice Nucleation on Simulated Secondary Organic Aerosol, Environ. Sci. Technol., 48, 1675–1682, https://doi.org/10.1021/es4046428, 2014. a, b, c, d
Shiraiwa, M., Li, Y., Tsimpidi, A. P., Karydis, V. A., Berkemeier, T., Pandis, S. N., Lelieveld, J., Koop, T., and Pöschl, U.: Global distribution of particle phase state in atmospheric secondary organic aerosols, Nat. Commun., 8, 15002, https://doi.org/10.1038/ncomms15002, 2017. a, b
Topping, D., Connolly, P., and McFiggans, G.: Cloud droplet number enhanced by co-condensation of organic vapours, Nat. Geosci., 6, 443–446, https://doi.org/10.1038/ngeo1809, 2013. a
Virtanen, A., Joutsensaari, J., Koop, T., Kannosto, J., Yli-Pirila, P., Leskinen, J., Makela, J. M., Holopainen, J. K., Poschl, U., Kulmala, M., Worsnop, D. R., and Laaksonen, A.: An amorphous solid state of biogenic secondary organic aerosol particles, Nature, 467, 824–827, https://doi.org/10.1038/nature09455, 2010. a, b, c
Wagner, R., Möhler, O., Saathoff, H., and Schnaiter, M.: Enhanced high-temperature ice nucleation ability of crystallized aerosol particles after preactivation at low temperature, J. Geophys. Res.-Atmos., 119, 8212–8230, https://doi.org/10.1002/2014JD021741, 2014. a, b, c
Wagner, R., Höhler, K., Huang, W., Kiselev, A., Möhler, O., Mohr, C., Pajunoja, A., Saathoff, H., Schiebel, T., Shen, X., and Virtanen, A.: Heterogeneous ice nucleation of alpha-pinene SOA particles before and after ice cloud processing, J. Geophys. Res.-Atmos., 122, 4924–4943, https://doi.org/10.1002/2016JD026401, 2017. a, b, c, d, e
Wang, B., Lambe, A. T., Massoli, P., Onasch, T. B., Davidovits, P., Worsnop, D. R., and Knopf, D. A.: The deposition ice nucleation and immersion freezing potential of amorphous secondary organic aerosol: Pathways for ice and mixed-phase cloud formation, J. Geophys. Res.-Atmos., 117, D16209, https://doi.org/10.1029/2012JD018063, 2012. a, b, c, d, e, f
Wilson, T. W., Murray, B. J., Wagner, R., Möhler, O., Saathoff, H., Schnaiter, M., Skrotzki, J., Price, H. C., Malkin, T. L., Dobbie, S., and Al-Jumur, S. M. R. K.: Glassy aerosols with a range of compositions nucleate ice heterogeneously at cirrus temperatures, Atmos. Chem. Phys., 12, 8611–8632, https://doi.org/10.5194/acp-12-8611-2012, 2012. a, b, c


