the Creative Commons Attribution 4.0 License.
the Creative Commons Attribution 4.0 License.
 | 21 Jun 2018
Occurrence and spatial distribution of neutral perfluoroalkyl substances and cyclic volatile methylsiloxanes in the atmosphere of the Tibetan Plateau
Jasmin Schuster
Kevin C. Jones
Ping Gong
Due to their properties of bioaccumulation, toxicity, and long-range atmospheric transport, polyfluoroalkyl and perfluoroalkyl substances (PFASs) and cyclic volatile methylsiloxanes (cVMSs) are currently being considered as emerging persistent organic pollutants (POPs) for regulation. To date, there are limited data on PFASs and cVMSs in the atmosphere of the Tibetan Plateau (TP), a remote environment which can provide information on global background conditions. Sorbent-impregnated polyurethane foam (SIP) disc passive air samplers were therefore deployed for 3 months (May to July 2011 and 2013) at 16 locations across the TP. Using previously reported methods for estimating the air volume sampled by SIP discs, the derived atmospheric concentrations ranged as follows: 18–565 ng m−3 for ΣcVMS (including D3, D4, D5, and D6); 65–223 pg m−3 for fluorotelomer alcohols (ΣFTOHs); 1.2–12.8 pg m−3 for fluorinated sulfonamides (ΣFOSA); and 0.29–1.02 pg m−3 for fluorinated sulfonamidoethanols (ΣFOSE). The highest ΣcVMS occurred at Lhasa, the capital city of the TP, indicating the local contribution to the emerging pollutants. Higher levels of ΣFTOHs were observed at sites close to the transport channel of the Yarlung Tsangpo Grand Canyon, indicating possible long-range atmospheric transport (LRAT). Elevated concentrations of shorter-chain volatile PFAS precursors (4 : 2 FTOH and fluorobutane sulfonamidoethanol) were found in most air samples, reflecting the shift in production from long- to short-chain PFASs in Asia. Overall, concentrations of emerging POPs at background sites of the TP were 1–3 orders of magnitude higher than those reported for legacy POPs.
- Article
(1023 KB) - Full-text XML
-
Supplement
(1023 KB) - BibTeX
- EndNote


Persistent organic pollutants (POPs) have attracted significant attention due to their wide distribution in the environment and high toxicity to humans and wildlife (Hung et al., 2016a, b; Magulova and Priceputu, 2016; Rigét et al., 2010). In the first stage, the Stockholm Convention included 12 POPs normally considered the legacy POPs (Rigét et al., 2010), including dichlorodiphenyltrichloroethane (DDT), hexachlorobenzene (HCB), and hexachlorocyclohexanes (HCHs). With the prohibition of these legacy POPs, their levels in the environment have largely deceased (Hung et al., 2016a, b). Compared with these legacy POPs, other organic substances, such as perfluoroalkyl substances (PFASs) and volatile methylsiloxanes (VMS), have attracted more attention in recent years in the environmental chemistry research community (Pedersen et al., 2016; Shi et al., 2015; D.-G. Wang et al., 2015; Xiao et al., 2015) due to their widespread production, bioaccumulative behaviour, and toxicity. In 2009, perfluorooctanesulfonic acid (PFOS) and perfluorooctane sulfonyl fluoride (POSF) based chemicals were listed under Annex B of the restricted substances of the Stockholm Convention (Zushi et al., 2012).
In addition, the use of VMS in personal care products has also been restricted by the European Chemical Agency (ECHA, 2012). Due to their widespread use in inks, waxes, firefighting foams, metal plating and cleaning, coating formulations, and repellents for leather, paper, and textiles, large quantities of PFASs have been discharged into the environment (Shoeib et al., 2006). Taking PFOS as an example, the total historical worldwide production of “PFOS equivalent”, including secondary reaction products and precursors, was estimated to be 122 500 t between 1970 and 2002 (Guerranti et al., 2013; Paul et al., 2009). However, since 2002, the emission of PFASs has shifted from North America, Europe, and Japan to emerging Asian economies, especially China and India (Li et al., 2011; Sharma et al., 2016). Passive air sampling results have found that fluorotelomer alcohols (FTOH) and fluorinated telomere olefins (FTOs) are major compound classes occurring in the urban air of China and Japan, while 4 : 2 FTOH is a predominant chemical in remote regions of China and India (Li et al., 2011).
Methylsiloxanes are widely used in industrial and commercial applications, including additives in fuel, car polish, cleaners, waxes, and personal care products (cosmetics, deodorants, and lotions; Borga et al., 2013; Buser et al., 2013). Cyclic volatile methylsiloxanes (cVMSs) include hexamethylcyclotrisiloxane (D3), octamethylcyclotetrasiloxane (D4), and their rearrangement products such as decamethylcyclopentasiloxane (D5) and dodecamethylcyclohexasiloxane (D6). These chemicals are the subject of increasing concern because of their high emissions, long persistence (Navea et al., 2011), and toxicities (Mackay et al., 2015). D4 and D5 have been categorized as high-production-volume chemicals (McLachlan et al., 2010) and identified as new persistent and bioaccumulative chemicals in commerce (Borga et al., 2013; McGoldrick et al., 2014). Due to the high volatility, VMS can be released into the atmosphere during use and production (Xu et al., 2014). The half-lives of VMS in the atmosphere range from days to weeks (Xu et al., 2014; Xu and Wania, 2013), which allow them to undergo long-range atmospheric transport (LRAT) and arrive at remote regions such as the Arctic and Antarctic.
Despite minor local emissions, remote regions can also receive pollutants by LRAT and the contamination levels of pollutants in these areas reflect the extent to which the remote area has been contaminated. Studies on the occurrence and distribution of PFASs and cVMSs have been conducted in various environmental media of the Arctic (Krogseth et al., 2013) and Antarctic (Sanchís et al., 2015), where unexpectedly high concentrations were found. In addition to the Arctic and Antarctic, the Tibetan Plateau (TP) is often referred to as the “third pole”, isolated in the mid-latitude Northern Hemisphere with a harsh environment and high elevation. The transport (Sheng et al., 2013), distribution (Wang et al., 2010, 2016b), and bioaccumulation (Ren et al., 2016) of legacy POPs in the Tibetan environment have already been investigated; however, there is still a gap in knowledge regarding the distribution of emerging organic contaminants, such as PFASs and cVMSs.
In this study, sorbent-impregnated polyurethane foam (SIP) disc passive air samplers were deployed across the TP (16 sites) to obtain the spatial distribution of PFASs and cVMSs in the atmosphere. These sites include densely populated cities and background sites in order to test how local emission and LRAT contaminate the TP. Combining the results of this study with the published data regarding legacy POPs in the TP and emerging POPs in other Asian regions will provide useful insights to understand the exposure risks of legacy and emerging POPs in the Tibetan environment and gain a comprehensive understanding of the distribution pattern of emerging POPs in Asia.
2.1 Preparation of SIPs
Air monitoring in remote areas is especially challenging due to the lack of electricity. Passive air samplers (PASs) have the advantage that they do not require electricity and are also cheap and easy to handle. Among the various PASs, SIP uses polyurethane foam (PUF) coated with polystyrene divinylbenzene copolymeric resin (XAD-4) as the absorption medium, which has been widely used for a range of POPs, including PFASs, VMS, and PCBs (Ahrens et al., 2013; Genualdi et al., 2010, 2011; Shoeib et al., 2008). The preparation of SIP was conducted at Lancaster University, UK, following the previously published method (Shoeib et al., 2008). Briefly, PUF discs (Tisch Environmental) were pre-extracted in a Soxhlet with acetone (12 h) and petroleum ether (18 h). Amberlite XAD-4 was pre-cleaned by sonication in methanol, dichloromethane, and hexane (30 min each). The pre-cleaned Amberlite XAD-4 was ground to a powder using a Retsch planetary ball mill (particle diameter approximately 0.75 µm). The PUF discs were coated with the XAD-4 by dipping the pre-cleaned discs in a dispersion of the powdered Amberlite XAD-4 slurry in hexane. SIP-PUF discs were dried under vacuum, and an average of 435 ± 30 mg of XAD-4 coated each disc (n=80; each sampling had 32 samples and 8 field blanks), which was similar to the Global Passive Atmospheric Sampling programme (Genualdi et al., 2010). All prepared SIP discs were stored in sealed metal tins at −17 ∘C until they were transferred to the sampling locations.
2.2 Sampling campaign
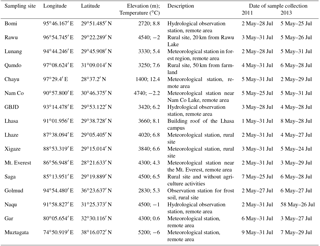
Taking advantage of the Tibetan Observation and Research Platform (Wang et al., 2016a), a passive air monitoring network comprising 16 sampling sites across the TP has been established with good spatial coverage of the TP (Fig. S1 in the Supplement) and has already produced results regarding the spatial and temporal pattern of legacy POPs (Wang et al., 2010, 2016b). In this study, duplicate SIP-PASs were deployed at each sampling site for about 100 days from May to July for sampling PFASs (2011) and cVMSs (2013). During the sampling, another PUF sampler was co-deployed to obtain the site-specific sampling rate using four depuration compounds (DCs; PCB-30, PCB-54, PCB-104, and PCB-188; Pozo et al., 2009). Details relating to the DCs can be found in Text S1 in the Supplement. The sampling programme and meteorological conditions at each site are provided in Table 1. Field blanks were unpacked and exposed in air for 1 min at the sampling site and then treated as real samples. At the end of the deployment period, the collected SIP-PUF and PUF discs were sealed in metal tins and transported to the clean lab in Lhasa for extraction.
2.3 Sample extraction and analysis
The target PFASs were neutral PFASs, including fluorotelomer olefin (8 : 2 FTO), fluorotelomer acrylates (6 : 2, 8 : 2 FTA), fluorotelomer alcohols (4 : 2, 6 : 2, 8 : 2, 10 : 2, and 12 : 2 FTOH), sulfonamides (NMeFBSA, NMeFOSA, and NEtFOSA), and sulfonamidoethanols (NMeFBSE, NMeFOSE, and NEtFOSE); the four target cVMSs were D3, D4, D5, and D6. PFAS standards were purchased from Wellington Laboratories Inc. (Guelph, Ontario, Canada), and D3, D4, D5, and D6 were purchased from Tokyo Chemical Industries America (Portland, OR).
Extraction of the PFASs was performed by sequential cold-column extraction with ethyl acetate as the extraction solvent. Field blanks and lab blanks were extracted along with samples in the same way. After the spiking of the recovery standard (see Table S1 in the Supplement for the composition), SIP was extracted by three separate immersions (30 min) in ethyl acetate, and all three extracts were combined and concentrated. These extracts were then filtered by Millipore Millex syringe filter unite (0.45 µm, 4 mm), reduced to a volume of 1 mL, and cleaned up by 2 cm of ENVI-Carb. Finally, after adding the internal standard (Table S1), the extracts were reduced to 50 µL for injection. The analysis of volatile PFASs was performed using GC-MS equipped with a SUPELCOWAX column (60 m, 0.25 mm inner diameter, 0.25 µm film; Supelco, Bellefonte, PA) under positive chemical ionization mode. Details about the GC programme are provided in Text S2.
Before sampling, the SIP discs were spiked with recovery mixture each containing 13C4-D4, 13C5-D5, and 13C6-D6, and after sampling, they were Soxhlet extracted with petroleum ether ∕ acetone (85 ∕ 15, v∕v) for around 6 h. All extracts were then concentrated by rotary evaporation, followed by gentle nitrogen blowdown to 0.5 mL using isooctane as a keeper for the extracts. Mirex was added to the final extract as an internal standard. The separation and detection of the cVMSs was performed using GC-MS in selective ion monitoring mode using a DB-5 column (60 m, 0.25 mm inner diameter, 0.25 µm film; J&W Scientific). Methods regarding the GC programme and MS detection ions are provided in Text S2.
2.4 Quality assurance and quality control
Samples were extracted in a clean lab with filtered, charcoal-stripped air and positive pressure conditions. All glassware used for sample collection was cleaned and baked at 450 ∘C before use. Powder-free nitrile gloves were used for all handling of the samples. All personnel involved in sample collection and analysis refrained from using personal care products to avoid contamination. A total of eight field blanks and six lab blanks were analysed for target PFASs. In the lab blanks, only 8 : 2 FTOH and 10 : 2 FTOH were screened, which showed low concentrations, while 4 : 2 FTOH, 8 : 2 FTOH, 10 : 2 FTOH, NEtFOSA, NMeFOSE, and NEtFOSE were observed in field blanks, with concentrations ranging between 50 and 321 pg sample−1 (Table S2). Similarly, eight field blanks and six lab blanks were arranged for evaluating the uncertainties of cVMS concentrations due to contamination and loss processes (during the extraction and clean-up procedures and storage). D3, D4, D5, and D6 in field blanks were, on average, 34, 57, 380, and 59 ng sample−1, respectively, which were approximately 6 % of the sample concentration. Method detection limits (MDLs) were calculated from the blanks: average of blanks + 3 × standard deviation (σ). Based on this principle, MDLs of volatile PFASs ranged between 37 and 419 pg sample−1, while MDLs of cVMSs ranged between 52 and 681 ng sample−1 (Table S3). Details on the MDLs for each congener are provided in Tables S2 and S3.
The average recoveries of internal standard were 88 ± 27, 79 ± 34, 71 ± 27, 95 ± 21, and 107 ± 19 % for 5 : 1 FTOH, 7 : 1 FTOH, [M+5]8 : 2 FTOH, 9 : 1 FTOH, and 11 : 1 FTOH, respectively, and 117 ± 33, 105 ± 27, 89 ± 37, 93 ± 33, and 92 ± 29 % for [M+3]NMeFOSA, [M+5]NEtFOSA, [M+7]NMeFOSE, and [M+9]NEtFOSE, respectively. These recoveries were broadly in line with previous passive air sampling for Asian counties in which the same SIP discs were deployed (Li et al., 2011). The recoveries were 116.0 ± 5.9, 90 ± 8.5, and 98.2 ± 1.7 % for 13C-D4, 13C-D5, and 13C-D6, respectively.
2.5 Sampling rate calculation
Generally, the uptake profile of a chemical to the passive sampler medium (PSM) includes three stages: (1) quick, linear uptake when the amount of chemicals in the PSM is small; (2) curvilinear uptake (slow uptake); and (3) equilibrium uptake when the amount of chemicals in the PSM reaches a plateau. Volatile compounds usually have short linear phase absorption and equilibrate after a few weeks in SIP (Ahrens et al., 2013; Shoeib et al., 2008), while longer linear phases will occur if SIP is operated at colder temperatures (Ahrens et al., 2013). In a previous calibration study (in which the sampling temperature was 18 ∘C), the linear phase uptake of PFASs in SIP was reported (Ahrens et al., 2013) due to the greater capacity of SIP-PAS to PFASs. However, the sampling temperature in the present study (Table 1) was much lower, so linear phase absorption should be expected to occur. For this reason, the previously reported average linear sampling rate (R) of 4 m3 d−1 reported by Ahrens et al. (2013) for PFASs (including FTOHs, FOSAs, and FOSE) was chosen to estimate the final sample air volume of the SIP-PAS (multiplying 4 m3 d−1 by the number of days of deployment). Based on this estimation, volumetric concentrations of target compounds were obtained and are presented in Table S4. The MDLs in Table S4 were also calculated based on the 90-day exposure duration.
The volume of air sampled for cVMSs in SIP discs can be described by the following equation:
where Vair is the air volume sampled by the SIP disc, KSIP-A is the SIP-air partition coefficient, VSIP is the volume of the SIP disc (cm3), ASIP is the planar surface area of the SIP disc (cm2), kA is the air-side mass transfer coefficient (m day−1), and t is deployment time (days). KSIP-A is highly temperature dependent and can be calculated using its correlations with KOA (Ahrens et al., 2014). Details about the calculation are presented in Table S5. Values of kA can be derived from the site-specific sampling rate (Rs) and the surface area of the SIP disc (ASIP). The Rs values were calculated from the use of DCs on the PUF discs that were co-deployed at each site. Details on these calculations have been previously reported and are presented in Text S2 and Table S6. The values of log (KSIP-A) for D3, D4, D5, and D6 are listed in Table S7, and the air volumes sampled by the SIP disc are provided in Table S8. Volumetric concentrations of D4, D5, and D6 are presented in Table S9.
3.1 Concentration of neutral PFASs and cVMSs
From Table S5, with the exception of fluorotelomer acrylates (6 : 2, 8 : 2 FTA), all neutral PFAS congeners were quantitatively detected in all samples. This implies that the neutral PFAS were ubiquitous in the air of the TP. The dominant compounds were FT alcohols, with a total concentration of FTOH (sum of 4 : 2 FTOH, 6 : 2 FTOH, 8 : 2 FTOH, 10 : 2 FTOH, and 12 : 2 FTOH) ranging from 65 to 223 pg m−3. These values are lower than those measured in Chinese cities such as Beijing, Taiyuan, and Changsa (Li et al., 2011) but are higher than those reported at background sites, including remote mountains in China (80–120 pg m−3, Li et al., 2011), Antarctica (13.5–46.9 pg m−3, Z. Wang et al., 2015), and the Arctic (7.7–49 pg m−3, Shoeib et al., 2006). Among all the FTOHs, concentrations of 8 : 2 and 4 : 2 FTOH were the highest, being in the tens of (up to 100) pg m−3. Generally, 8 : 2 FTOH was the prevailing compound found in the gas phase. This may be due to its relatively high volatility and long atmospheric lifetime (Rayne et al., 2009). However, concentrations of 8 : 2 FTO were in the range of 0.88 to 4.56 pg m−3, which is lower than values measured in other background regions (∼ tens of pg m−3, Li et al., 2011). The levels of fluorinated sulfonamides (sum of NMeFBSA, NMeFOSA, and NEtFOSA) in Table S4 can reach a maximum of around 10 pg m−3, while the total concentration of sulfonamidoethanols (including NMeFBSE, NMeFOSE, and NEtFOSE) was only a few pg m−3, which is an order of magnitude lower than those observed for sulfonamides. It is clear that the proportion of FTOHs was much higher than FOSEs and FOSAs, which may be due to FOSEs and FOSAs being prone to absorption on particles (Li et al., 2011). This can also be caused by different phasing-out times for these chemicals. Products containing FOSEs and FOSAs were mostly produced by 3M and mostly phased out in 2002, while products releasing 8 : 2 FTOH were more recently phased out.
The measurements reported here represent the first survey of concentrations of cVMSs in the TP (also known as “the third pole”; Qiu, 2008). All measured cVMS concentrations were above the MDL, suggesting that cVMSs were also ubiquitous in the Tibetan atmosphere (Table S6). The average atmospheric concentrations for D3, D4, D5, and D6 were 29.1, 38.8, 88.6, and 1.6 ng m−3, respectively (Table S9). Concentrations of D5 were higher than D3 and D4, which is different from the reported concentrations of 17, 16, 4.0, and 0.54 ng m−3 for D3, D4, D5, and D6 at the Zeppelin Observatory (Arctic) using the same SIP discs for sampling (Genualdi et al., 2011). However, similar to other Arctic results, D5 was the dominant congener in air (Krogseth et al., 2013). D5 is the most frequently used cVMS in personal care products and is therefore the predominant cVMS in the urban atmosphere (McLachlan et al., 2010). However, the dominance of D5 has been observed in both the Arctic and Antarctic region, highlighting its persistence in atmosphere and LRAT potential. The obtained cVMS concentrations in the TP are higher than those reported for the Arctic and remote Sweden, indicating possible local contamination. Both PFASs and cVMSs are closely associated with human activities, and their concentrations usually show positive correlations with population (Genualdi et al., 2010; Nguyen et al., 2016). Therefore, we would expect high concentrations of volatile PFASs and cVMSs in the atmosphere of Lhasa and Golmud, which are the two largest cities on the TP, with relatively large populations and fast urbanization. From Tables S4 and S9, in Lhasa (the capital and also the largest city in the Tibet autonomous region), the concentrations of 8 : 2 FTOH and 4 : 2 FTOH were 71 and 43 pg m−3, respectively, and similar levels were also found for Golmud. Additionally, concentrations of D5 in Lhasa and Golmud were 465 and 208 ng m−3, respectively, which were the two highest D5 concentrations in the Tibetan atmosphere (Table S10). Although these levels were still orders of magnitude lower than those reported for other megacities (Genualdi et al., 2010; Mackay, 2015), the elevated concentrations suggest that the expansion and development of cities, followed by the migration of rural populations, may lead to an increase of emerging pollutants in Tibet.
3.2 Spatial distribution and congener profile of neutral PFASs
An important objective of this study was to improve knowledge on the spatial patterns of emerging POPs in the background air across the TP. In previous studies, the spatial distributions of atmospheric legacy organochlorine pesticides over the TP have been reported and were found to be strongly related to the air circulation patterns of the TP, i.e. the Indian monsoon and westerly winds (Fig. S2, Wang et al., 2010, 2016b). For example, DDT-related chemicals were major chemicals in the atmosphere of the south-eastern TP, which is influenced by the Indian monsoon air masses (Wang et al., 2010), whereas the north-western TP was dominated by HCB in the atmosphere caused by the westerly-driven European air masses (Wang et al., 2016b). Similarly, ice cores collected in different regions of the TP indicated that PFOS existed in the Muztagata glacier (western TP), while in the Zuoqiupu glacier located in the eastern TP, PFOS was below the detection limit, but concentrations of short-chain perfluorobutanoic acid have increased during recent years (Wang et al., 2014). All these results suggest that differences in the concentrations and composition profiles of POPs likely reflect the upwind sources affecting the different parts of the TP (e.g. European and central Asian sources for the west TP and Indian sources for the east TP).
Figure 1 presents the spatial patterns of 8 : 2 FTO, FTOHs, FOSAs, and FOSEs. The spatial distribution of 8 : 2 FTO shows a decreasing gradient from the east to the west of the TP (Fig. 1). One-way analysis of variance (ANOVA) was performed to determine the statistical differences in the values of individual chemicals among different sampling sites. If the p value is lower than 0.05, we conclude that significant differences occur. On the basis of the ANOVA results, significantly high values of 8 : 2 FTO were found at Qamdo and Bomi (Table S10). However, spatial variation was found in total FTOHs (Fig. 1), and significant differences only occurred in the east regions (Chayu, Rawu, and Lulang) and the western sites (Gar and Muztagata; Table S7). It is noted that the highest ΣFTOH concentration occurred at Chayu (222 pg m−3), which is on the southern slopes of the Himalaya and close to the China–India border. Levels of ΣFTOHs in Chayu were even higher than those in Lhasa (180 pg m−3), suggesting that the south-east part of the TP may receive considerable inputs of PFASs from south Asia. Regarding ΣFOSAs and ΣFOSEs, higher levels were seen in both the east and west of the TP (Fig. 1) compared to the middle of the TP. A previous study observed high levels of atmospheric DDTs at sites (e.g. Chayu, Rawu, Bomi, etc.) close to the Yarlung Tsangpo Grand Canyon (Wang et al., 2016b). Here, ΣFTOHs, ΣFOSAs, and ΣFOSEs also showed higher levels at these sites (Fig. 1), which confirms previous results that show that the Yarlung Tsangpo Grand Canyon is a channel for receiving pollutants from southern Asia (Sheng et al., 2013; Wang et al., 2016b). Medium ΣFOSA and ΣFOSE concentrations found in the Muztagata region broadly agree with the previous results that air masses originating from European sources are generally clean (Wang et al., 2016b).
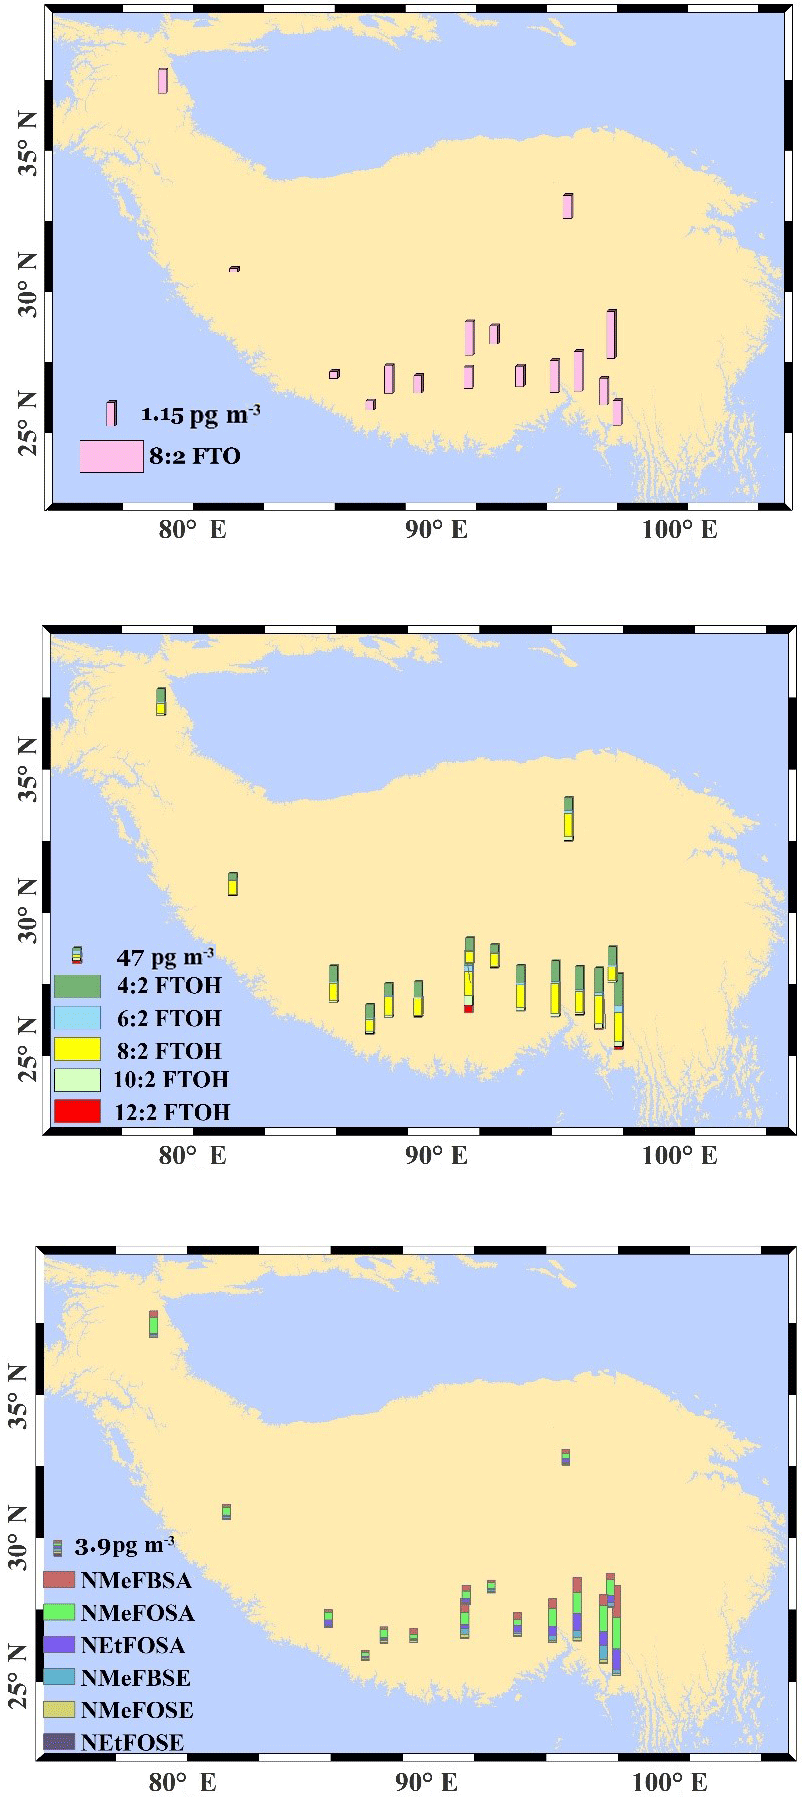
As mentioned above, the composition profile of POPs is closely associated with air circulation patterns in the TP and can reflect the upwind sources. However, congener profiles of neutral PFASs in this study did not show any clear difference between western sites (e.g. Muztagata, Gar) and eastern sites (Chayu, Bomi, Lulang, etc.; Fig. 1), which may be because the sampling period was too short (∼ 3 months) and only covered the monsoon season (June to September). Elevated 4 : 2 FTOH and NMeFBSE concentrations were found in most of the samples of the present study and a dominance of shorter-chain volatile PFAS precursors was the feature of the south Asian sources (Li et al., 2011). This similarity suggests that neutral PFASs in the TP may originate mainly from south Asia, most likely by LRAT.
Table 2Correlation (r) of individual compounds among all the samples.
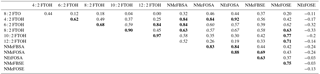
Bold and italic are significant at p < 0.01 and p < 0.05, respectively.
Although the congener profiles cannot be used to distinguish the European and Indian sources in this study, the ratio of 8 : 2 to 10 : 2 to 6 : 2 FTOH is an excellent indicator of LRAT for atmospheric PFASs (Z. Wang et al., 2015). The transport fate of atmospheric PFASs can be influenced by photochemical degradation. A higher ratio indicates the aged nature of the air mass because of the fast photochemical degradation of 6 : 2 FTOH (half-life of 50 days) in the air compared with 10 : 2 FTOH (70 days) and 8 : 2 FTOH (80 days; Piekarz et al., 2007). During LRAT, more 6 : 2 and 10 : 2 FTOH will be removed from the atmosphere. For example, ratios of 6.4 : 2.1 : 1.0 were observed in the Arctic (Ahrens et al., 2011) and 35.6 : 6.5 : 1.0 was found in the Antarctic (Z. Wang et al., 2015). In the present study, low ratios were observed in the cities; i.e. 2.4 : 1.7 : 1 and 6.8 : 1.2 : 1 were observed for Lhasa and Golmud, respectively. This indicates that cities are possible fresh emission sources of neutral PFASs. According to a previous study, there are three climate zones over the TP – namely, the monsoon region, westerly region, and transition region (Wang et al., 2016b). The sampling sites of this study can be grouped into these three zones (Fig. S2, Table S11). The average ratios of 8 : 2 to 10 : 2 to 6 : 2 FTOH were 8.4 : 1.2 : 1 for the monsoon region, 8.8 : 1 : 1 for the westerly region and 10.6 : 1.2 : 1 for the transition zone (Fig. S2, Table S11). Overall, these values are comparable to those reported for the Arctic. On the other hand, a decrease in 6 : 2 FTOH and an increase in 8 : 2 and 10 : 2 FTOH occurred from the edge regions to the central part of the TP (Table S11). The high ratios indicate the aged nature of atmospheric PFASs in the atmosphere of the TP, especially around the transition zone (Table S11). Given that the transition zone is located in the hinterland (central part) of Tibet, where both monsoon and westerly winds become weak, and that the fresh impact of source regions in either India or Europe and central Asia is limited, the aged and/or old PFASs in the air of the central TP are expected and reasonable.
3.3 Correlations between PFAS compounds
Correlations between concentrations of pollutants can be used to test whether they have some common sources or undergo similar environmental fates. A correlation matrix was therefore prepared and showed that some chemicals were significantly correlated (Table 2). Good correlations (r > 0.80, p < 0.01) were observed between 8 : 2 FTOH and 10 : 2 FTOH (r=0.90) and between 10 : 2 FTOH and 12 : 2 FTOH (r=0.97). This phenomenon has been observed in other studies (Ahrens et al., 2012; Cai et al., 2012; Li et al., 2011) and usually suggests that 8 : 2 FTOH, 10 : 2 FTOH, and 12 : 2 FTOH have the same source. Correlations between 4 : 2–6 : 2 FTOH and other FTOHs are generally low or not significant, indicating that 4 : 2 FTOH and 6 : 2 FTOH may come from different sources. There is much evidence that the manufacture of PFASs has shifted from longer-chain chemicals (C8 or above) to shorter-chain ones (C4 or C6; Butt et al., 2010; Hogue, 2012), which may lead to the poor correlation between short-chain FTOH and other FTOHs. Given that the new production of shorter-chain PFASs is mainly centred in Asian countries such as China and India (Hogue, 2012), it is not surprising that high levels of both 4 : 2 FTOH and its independent characteristics have been found in the Tibetan atmosphere due to the close proximity between Tibet and south Asia.
With regard to the relationships between FOSAs and FOSEs, good correlations were seen among NMeFBSA, NMeFOSA, and NEtFOSA (Table 2). Additionally, concentrations of NMeFBSE were significantly correlated with those of NMeFOSE (Table 2). This is in contrast to previous results, in which poor relationships (r=0.283) were found between short- and long-chain PFASs (Li et al., 2011). Regarding the emission patterns of FOSAs and FOSEs in India, mixed manufacturing with extensive emissions of NMeFOSA and NMeFOSE coupled with the wide discharge of NMeFBSA has been reported in the Indian environment (Li et al., 2011). This indicates that both long- and short-chain PFAS are produced in south Asia. Favoured by the transport of the Indian monsoon, the co-transport of short- and long-chain PFASs may lead to a blending of these chemicals in the Tibetan air. Meanwhile, the two short-chain PFASs, 4 : 2 FTOH and NMeFBSA, were significantly (r=0.84, p < 0.01; Table 2) correlated with each other, suggesting these precursors may be released together in the source region.
3.4 Spatial distribution of cVMSs across the TP
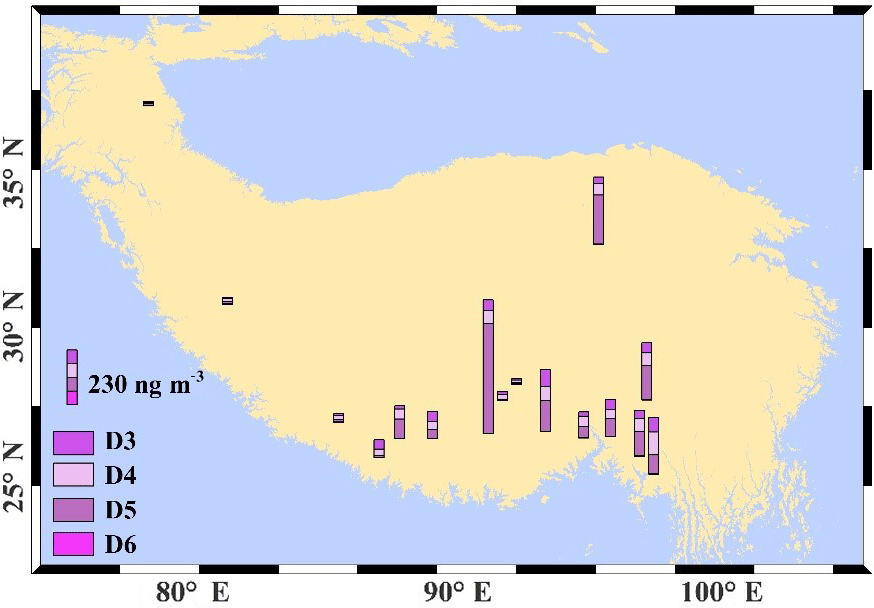
As mentioned above, greater levels of cVMSs were found in the urban areas of Lhasa and Golmud. This can also be seen in the spatial map of cVMSs (Fig. 2). However, high levels of cVMSs also occurred in the remote south-east of Tibet (Fig. 2). Unlike the spatial pattern of neutral PFASs, concentrations of cVMSs decreased from the south-east to north-west TP (Fig. 2, Table S9). Although there are no studies that report the cVMS levels and patterns in south Asian countries due to the source of cVMSs to the environment taking place via the use of personal care products, we can expect the regions of south Asia (e.g. the Indo-Gangetic Plain), with its high population density, to be important cVMS source regions. The close proximity of the south-east TP to south Asia and the fast LRAT potential of cVMSs (Xu et al., 2014; Xu and Wania, 2013) might be the reason that high concentrations of cVMSs occur in the south-east TP. On the other hand, latitude might be a factor representing the influence of the emission source on the spatial pattern.
Another factor that can also influence the atmospheric concentration of cVMSs is their atmospheric degradation by hydroxyl radicals. In the Arctic, low levels of hydroxyl radicals during the polar night promote the accumulation of cVMSs in the air, while the polar day enhances the degradation, causing the strong seasonality of cVMSs in the Arctic (Krogseth et al., 2013). The polar day usually increases hydroxyl radicals in the air and enhances the photo-degradation of contaminants (Krogseth et al., 2013). The level of hydroxyl radicals is generally proportional to the extent of solar UV radiation (Rohrer and Berresheim, 2006). Recently, Liu et al. (2017) published two UV radiation datasets that cover the whole of China, and high values were observed for the south TP, with a gradual decrease from the south to the north TP. Although the sampling sites in their study were not exactly the same as in our study, their spatial trend of UV radiation suggested that latitude might be a possible proxy to describe the variation in UV radiation over the TP. Additionally, from a global perspective, surface UV radiation increases with elevation due to the shorter distance of travel through the atmosphere (Sola et al., 2008), which may also have a negative influence on the atmospheric concentration of cVMSs. Thus, elevation and latitude can be integrated together to simulate the effects of UV radiation (representing the influence of hydroxyl radicals) on concentrations of cVMSs. On the other hand, latitude is also a factor that can represent the influence of emission sources; low-latitude regions will receive more cVMSs due to their proximity to source regions (see Fig. 2). Thus, an empirical model was derived here to estimate the combined effects of UV radiation and the distance to emission source regions on concentrations of cVMSs:
where a, b, and c are coefficients determined from statistical regression. For the multiple linear regressions, the R2 values can be used to explain the variation in the dependents. According to the correlations (the data from Lhasa and Golmud were excluded), the relationship can be described as in the following:
This means elevation and latitude can jointly explain 60 % of the atmospheric concentration of cVMSs. Other factors, such as cloud coverage and sky clarity (which influence hydroxyl radical levels in the air), may be the confounding factors that influence the correlation (Sola et al., 2008). The slope for elevation (b) is negative, suggesting that high concentrations of cVMSs will occur at sites with low elevation, where hydroxyl radiation is limited. Two competing factors influence the coefficient for latitude. The contribution from the proximity to source regions means that the low-latitude regions of the TP will have high concentrations of cVMSs (negative correlations between latitude and CcVMS) due to these sites being close to the source regions of south Asia, while the strong hydroxyl degradation caused by UV radiation at low latitudes would have the opposite effect of reducing the concentrations of cVMSs (positive correlation between latitude and CcVMS). From the above model, the slope for latitude (c) in the model is also negative (−2.35), implying that the contribution from the proximity to source regions to concentrations of cVMSs is broadly greater than that of hydroxyl degradation.
3.5 Correlations between cVMS congeners
Similar to previously published studies, good correlations were found between D3, D4, and D5 (Table S9). The correlation coefficients varied from 0.69 to 0.79 (all correlations were significant at the 95 % confidence level; the data from Lhasa and Golmud were excluded), while the correlation between D5 and D6 was not significant. The good correlation implies that either D3, D4, and D5 have common sources and transport mechanisms, or there is chemical transformation to D3 and D4 from D5 (Kierkegaard et al., 2010).
3.6 Comparison of measured and modelled D5 concentrations
The measured D5 concentrations are compared with the concentrations predicted by the Danish Eulerian Hemispheric Model (DEHM; McLachlan et al., 2010). The country-based emissions were distributed into the DEHM grid according to a dataset of the gridded population density of the world with the total emission of D5 within the DEHM domain estimated as 30 kT per year (McLachlan et al., 2010). All physical–chemical properties of D5 used in model prediction are reported in previous studies (Brooke et al., 2009; Jiménez et al., 2005). The rate constant for the reaction of D5 with OH radicals measured by Atkinson (1991) was employed. NCEP (National Centers for Environmental Prediction) global analysis meteorological data are used to drive the model. By comparing different scenarios, the DEHM found that phototransformation is the dominant elimination process between the emission of D5 and arrival at the sampling site. There is good agreement between the spatial variability in D5 concentration between the measurements of the TP and the model prediction, displaying great D5 concentrations in the south-east TP. The good tracking of the measured concentration by the DEHM shows that D5 is clearly subject to LRAT, although it is also effectively removed from the atmosphere via phototransformation. However, measured D5 concentrations are 1–3 magnitudes higher than the model prediction. Given that atmospheric emission data on D5 in the DEHM are estimated from the usage of antiperspirant and skin creams, the emission uncertainties might lead to the discrepancy between measured concentrations and model values.
3.7 Implications
To the best of our knowledge, this is the first study on atmospheric concentrations of neutral PFASs and cVMSs in the TP region. Due to the remoteness of the TP, the contamination of these emerging compounds will provide insight into how and to what extent the emissions in the source regions influence these last pieces of pristine land. Levels of neutral PFASs in the air of the TP are in the hundreds of pg m−3, and levels of cVMSs are in the ng m−3 range. These values are 2–3 times and 1–2 orders of magnitude, respectively, higher than those for legacy chemicals (such as DDT and HCHs, with maximum concentrations in the tens of pg m−3; Wang et al., 2016b). Moreover, among the various legacy and emerging POPs in wild Tibetan fishes, the average level of ΣPFASs is the third highest (just after those of ΣDDT and ΣHCHs; Shi et al., 2015; Wang et al., 2016a). All this evidence suggests that emerging POPs should be of great concern for the environmental safety of the TP, as they are large-volume-production chemicals that have not been regulated in the surrounding countries. Due to the LRAT potential of volatile PFASs and cVMSs, joint regulation of these emerging chemicals by south Asian counties (upwind of the TP) has been requested in order to protect the Tibetan environment. Taking data from this study and the pilot study for Asian countries (Li et al., 2011) into account, due to the growing population and the transfer of production factories from developed countries to Asian counties, Asian cities will increasingly be the sources of emerging POPs from a global perspective.
China has not strongly regulated the manufacture of PFASs or the use of personal care products. Over the last 10 years, extensive urbanization has occurred in China. For example, the population in Lhasa reached 90 000 in 2015, having increased by 33 % from 2014. It is estimated that the population in Lhasa will reach 110 000 in 2020. Thus, emissions of emerging compounds due to urbanization will inevitably increase. Following the population expansion, wastewater treatment plants deployed in cities will not only emit volatile PFASs and cVMSs into the air, but will also contaminate the TP water bodies (i.e. rivers, wetlands, and lakes), which are precious clean water resources. Thus, the risks posed by city expansion to the burden and transport of pollutants should be of great concern. Increasingly, concern regarding the toxicity and exposure risks of PFASs and cVMSs is growing among scientists and regulators. This work has important implications for policymakers in comprehensively protecting the Tibetan alpine environment and promoting sustainable development in Tibet (the water tower of Asia).
All data are available upon request to the corresponding author.
The supplement related to this article is available online at: https://doi.org/10.5194/acp-18-8745-2018-supplement.
The authors declare that they have no conflict of interest.
This study was supported by the National Natural Science Foundation of China
(41671480 and 41222010), the Youth Innovation Promotion Association
(CAS2011067),
and the International Partnership Program of the Chinese Academy of Sciences
(grant no. 131C11KYSB20160061).
Edited by:
Ralf Ebinghaus
Reviewed by: two anonymous referees
Ahrens, L., Shoeib, M., Vento, S. D., Codling, G., and Halsall, C.: Polyfluoroalkyl compounds in the Canadian Arctic atmosphere, Environ. Chem., 8, 399–406, 2011.
Ahrens, L., Shoeib, M., Harner, T., Lane, D. A., Guo, R., and Reiner, E. J.: Comparison of Annular Diffusion Denuder and High Volume Air Samplers for Measuring Per- and Polyfluoroalkyl Substances in the Atmosphere, Anal. Chem., 84, 1797–1797, 2012.
Ahrens, L., Harner, T., Shoeib, M., Koblizkova, M., and Reiner, E. J.: Characterization of Two Passive Air Samplers for Per- and Polyfluoroalkyl Substances, Environ. Sci. Technol., 47, 14024–14033, 2013.
Ahrens, L., Harner, T., and Shoeib, M.: Temporal Variations of Cyclic and Linear Volatile Methylsiloxanes in the Atmosphere Using Passive Samplers and High-Volume Air Samplers, Environ. Sci. Technol., 48, 9374–9381, 2014.
Atkinson, R.: Kinetics of the gas-phase reactions of a series of organosilicon compounds with OH and NO3 radicals and O3 at 297 + 2 K, Environ. Sci. Technol., 25, 863–866, 1991
Borga, K., Fjeld, E., Kierkegaard, A., and McLachlan, M. S.: Consistency in Trophic Magnification Factors of Cyclic Methyl Siloxanes in Pelagic Freshwater Food Webs Leading to Brown Trout, Environ. Sci. Technol., 47, 14394–14402, 2013.
Brooke, D. N., Crookes, M. J., Gray, D., and Robertson, S.: Environmental risk assessment report: Decamethylcyclopentasiloxane, Environment Agency of England and Wales, Bristol, 2009.
Buser, A. M., Kierkegaard, A., Bogdal, C., MacLeod, M., Scheringer, M., and Hungerbühler, K.: Concentrations in Ambient Air and Emissions of Cyclic Volatile Methylsiloxanes in Zurich, Switzerland, Environ. Sci. Technol., 47, 7045–7051, 2013.
Butt, C. M., Berger, U., Bossi, R., and Tomy, G. T.: Levels and trends of poly- and perfluorinated compounds in the arctic environment, Sci. Total Environ., 408, 2936–2965, 2010.
Cai, M., Xie, Z., Möller, A., Yin, Z., Huang, P., Cai, M., Yang, H., Sturm, R., He, J., and Ebinghaus, R.: Polyfluorinated compounds in the atmosphere along a cruise pathway from the Japan Sea to the Arctic Ocean, Chemosphere, 87, 989–997, 2012.
ECHA (European Chemical Agency): Identification of PBT and vPvB substance, Results of evaluation of PBT/vPvB properties for decamethylcyclopentasiloxane, available at: http://echa.europa.eu/documents/10162/13628/decamethyl_pbtsheet_en.pdf (last access: 13 June 2018), 2012.
Genualdi, S., Lee, S. C., Shoeib, M., Gawor, A., Ahrens, L., and Harner, T.: Global pilot study of legacy and emerging persistent organic pollutants using sorbent-impregnated polyurethane foam disk passive air samplers, Environ. Sci. Technol., 44, 5534–5539, 2010.
Genualdi, S., Harner, T., Cheng, Y., MacLeod, M., Hansen, K. M., van Egmond, R., Shoeib, M., and Lee, S. C.: Global Distribution of Linear and Cyclic Volatile Methyl Siloxanes in Air, Environ. Sci. Technol., 45, 3349–3354, 2011.
Guerranti, C., Perra, G., Corsolini, S., and Focardi, S. E.: Pilot study on levels of perfluorooctane sulfonic acid (PFOS) and perfluorooctanoic acid (PFOA) in selected foodstuffs and human milk from Italy, Food Chem., 140, 197–203, 2013.
Hogue, C.: Perfluorinated Chemical Controls, Chem. Engin. News, 90, 24–25, 2012.
Hung, H., Katsoyiannis, A. A., Brorström-Lundén, E., Olafsdottir, K., Aas, W., Breivik, K., Bohlin-Nizzetto, P., Sigurdsson, A., Hakola, H., Bossi, R., Skov, H., Sverko, E., Barresi, E., Fellin, P., and Wilson, S.: Temporal trends of Persistent Organic Pollutants (POPs) in arctic air: 20 years of monitoring under the Arctic Monitoring and Assessment Programme (AMAP), Environ. Pollut., 217, 52–61, 2016a.
Hung, H., Katsoyiannis, A. A., and Guardans, R.: Ten years of global monitoring under the Stockholm Convention on Persistent Organic Pollutants (POPs): Trends, sources and transport modelling, Environ. Pollut., 217, 1–3, 2016b.
Jiménez, E., Ballesteros, B., Martínez, E., and Albaladejo, J.: Tropospheric reaction of OH with selected linear ketones: kinetic studies between 228 and 405 K, Environ. Sci. Technol., 39, 814–820, 2005.
Kierkegaard, A., Adolfsson-Erici, M., and McLachlan, M. S.: Determination of Cyclic Volatile Methylsiloxanes in Biota with a Purge and Trap Method, Anal. Chem., 82, 9573–9578, 2010.
Krogseth, I. S., Kierkegaard, A., McLachlan, M. S., Breivik, K., Hansen, K. M., and Schlabach, M.: Occurrence and Seasonality of Cyclic Volatile Methyl Siloxanes in Arctic Air, Environ. Sci. Technol., 47, 502–509, 2013.
Li, J., Vento, S. D., Schuster, J., Zhang, G., Chakraborty, P., Kobara, Y., and Jones, K. C.: Perfluorinated Compounds in the Asian Atmosphere, Environ. Sci. Technol., 45, 7241–7246, 2011.
Liu, H., Bo, H. U., Wang, Y., Liu, G., Tang, L., Dongsheng, J. I., Bai, Y., Bao, W., Chen, X., and Chen, Y.: Two Ultraviolet Radiation Datasets that Cover China, Adv. Atmos. Sci., 34, 805–815, 2017.
Mackay, D.: Risk assessment and regulation of D5 in Canada: Lessons learned, Environ. Toxicol. Chem., 34, 2687–2688, 2015.
Mackay, D., Powell, D. E., and Woodburn, K. B.: Bioconcentration and Aquatic Toxicity of Superhydrophobic Chemicals: A Modeling Case Study of Cyclic Volatile Methyl Siloxanes, Environ. Sci. Technol., 49, 11913–11922, 2015.
Magulova, K. and Priceputu, A.: Global monitoring plan for persistent organic pollutants (POPs) under the Stockholm Convention: Triggering, streamlining and catalyzing global POPs monitoring, Environ. Pollut., 217, 82–84, 2016.
McGoldrick, D. J., Chan, C., Drouillard, K. G., Keir, M. J., Clark, M. G., and Backus, S. M.: Concentrations and trophic magnification of cyclic siloxanes in aquatic biota from the Western Basin of Lake Erie, Canada, Environ. Pollut., 186, 141–148, 2014.
McLachlan, M. S., Kierkegaard, A., Hansen, K. M., van Egmond, R., Christensen, J. H., and Skjøth, C. A.: Concentrations and Fate of Decamethylcyclopentasiloxane (D5) in the Atmosphere, Environ. Sci. Technol., 44, 5365–5370, 2010.
Navea, J. G., Young, M. A., Xu, S., Grassian, V. H., and Stanier, C. O.: The atmospheric lifetimes and concentrations of cyclic methylsiloxanes octamethylcyclotetrasiloxane (D4) and decamethylcyclopentasiloxane (D5) and the influence of heterogeneous uptake, Atmos. Environ., 45, 3181–3191, 2011.
Nguyen, M. A., Wiberg, K., Ribeli, E., Josefsson, S., Futter, M., Gustavsson, J., and Ahrens, L.: Spatial distribution and source tracing of per- and polyfluoroalkyl substances (PFASs) in surface water in Northern Europe, Environ. Pollut., 220, 1438–1446, 2016.
Paul, A. G., Jones, K. C., and Sweetman, A. J.: A first global production, emission, and environmental inventory for perfluorooctane sulfonate, Environ. Sci. Technol., 43, 386–392, 2009.
Pedersen, K. E., Letcher, R. J., Sonne, C., Dietz, R., and Styrishave, B.: Per- and polyfluoroalkyl substances (PFASs) – New endocrine disruptors in polar bears (Ursus maritimus), Environ. Int., 96, 180–189, 2016.
Piekarz, A. M., Primbs, T., Field, J. A., Barofsky, D. F., and Simonich, S.: Semivolatile Fluorinated Organic Compounds in Asian and Western U.S. Air Masses, Environ. Sci. Technol., 41, 8248–8255, 2007.
Pozo, K., Harner, T., Lee, S. C., Wania, F., Muir, D. C. G., and Jones, K. C.: Seasonally Resolved Concentrations of Persistent Organic Pollutants in the Global Atmosphere from the First Year of the GAPS Study, Environ. Sci. Technol., 43, 796–803, 2009.
Qiu, J.: China: The third pole, Nature, 454, 393–396, https://doi.org/10.1038/454393a, 2008.
Rayne, S., Forest, K., and Friesen, K. J.: Estimated congener specific gas-phase atmospheric behavior and fractionation of perfluoroalkyl compounds: rates of reaction with atmospheric oxidants, air-water partitioning, and wet/dry deposition lifetimes, J. Environ. Sci. Heal. A, 44, 936–954, 2009.
Ren, J., Wang, X., Wang, C., Gong, P., Wang, X., and Yao, T.: Biomagnification of persistent organic pollutants along a high-altitude aquatic food chain in the Tibetan Plateau: Processes and mechanisms, Environ. Pollut., 220, 636–642, 2016,
Rigét, F., Bignert, A., Braune, B., Stow, J., and Wilson, S.: Temporal trends of legacy POPs in Arctic biota, an update, Sci. Total Environ., 408, 2874–2884, 2010.
Rohrer, F. and Berresheim, H.: Strong correlation between levels of tropospheric hydroxyl radicals and solar ultraviolet radiation, Nature, 442, 184–187, https://doi.org/10.1038/nature04924, 2006.
Sanchís, J., Cabrerizo, A., Galbán-Malagón, C., Barceló, D., Farré, M., and Dachs, J.: Unexpected Occurrence of Volatile Dimethylsiloxanes in Antarctic Soils, Vegetation, Phytoplankton, and Krill, Environ. Sci. Technol., 49, 4415–4424, 2015.
Sharma, B. M., Bharat, G. K., Tayal, S., Larssen, T., Bečanová, J., Karásková, P., Whitehead, P. G., Futter, M. N., Butterfield, D., and Nizzetto, L.: Perfluoroalkyl substances (PFAS) in river and ground/drinking water of the Ganges River basin: Emissions and implications for human exposure, Environ. Pollut., 208, 704–713, 2016.
Sheng, J., Wang, X., Gong, P., Joswiak, D. R., Tian, L., Yao, T., and Jones, K. C.: Monsoon-driven transport of organochlorine pesticides and polychlorinated biphenyls to the Tibetan Plateau: three year atmospheric monitoring study, Environ. Sci. Technol., 47, 3199–3208, 2013.
Shi, Y., Xu, S., Xu, L., and Cai, Y.: Distribution, Elimination, and Rearrangement of Cyclic Volatile Methylsiloxanes in Oil-Contaminated Soil of the Shengli Oilfield, China, Environ. Sci. Technol., 49, 11527–11535, 2015.
Shoeib, M., Harner, T., and Vlahos, P.: Perfluorinated chemicals in the arctic atmosphere, Environ. Sci. Technol., 40, 7577–7583, 2006.
Shoeib, M., Harner, T., Lee, S. C., Lane, D., and Zhu, J. P.: Sorbent-impregnated polyurethane foam disk for passive air sampling of volatile fluorinated chemicals, Anal. Chem., 80, 675–682, 2008.
Sola, Y., Lorente, J., Campmany, E., De Cabo, X., Bech, J., Redaño, A., Martínez-Lozano, J. A., Utrillas, M. P., Alados-Arboledas, L., and Olmo, F. J.: Altitude effect in UV radiation during the Evaluation of the Effects of Elevation and Aerosols on the Ultraviolet Radiation 2002 (VELETA-2002) field campaign, J. Geophy. Res.-Atmos., 113, 1323–1330, 2008.
Wang, D.-G., Aggarwal, M., Tait, T., Brimble, S., Pacepavicius, G., Kinsman, L., Theocharides, M., Smyth, S. A., and Alaee, M.: Fate of anthropogenic cyclic volatile methylsiloxanes in a wastewater treatment plant, Water Res., 72, 209–217, 2015.
Wang, X., Gong, P., Yao, T., and Jones, K. C.: Passive air sampling of organochlorine pesticides, polychlorinated biphenyls, and polybrominated diphenyl ethers across the Tibetan plateau, Environ. Sci. Technol., 44, 2988–2993, 2010.
Wang, X., Halsall, C., Codling, G., Xie, Z. g., Xu, B., Zhao, Z., Xue, Y., Ebinghaus, R., and Jones, K. C.: Accumulation of perfluoroalkyl compounds in tibetan mountain snow: temporal patterns from 1980 to 2010, Environ. Sci. Technol., 48, 173–181, 2014.
Wang, X., Gong, P., Wang, C., Ren, J., and Yao, T.: A review of current knowledge and future prospects regarding persistent organic pollutants over the Tibetan Plateau, Sci. Total Environ., 573, 139–154, 2016a.
Wang, X., Ren, J., Gong, P., Wang, C., Xue, Y., Yao, T., and Lohmann, R.: Spatial distribution of the persistent organic pollutants across the Tibetan Plateau and its linkage with the climate systems: a 5-year air monitoring study, Atmos. Chem. Phys., 16, 6901–6911, https://doi.org/10.5194/acp-16-6901-2016, 2016b.
Wang, Z., Xie, Z., Mi, W., Möller, A., Wolschke, H., and Ebinghaus, R.: Neutral poly/per-fluoroalkyl substances in air from the Atlantic to the Southern Ocean and in Antarctic snow, Environ. Sci. Technol., 49, 7770–7775, 2015.
Xiao, R., Zammit, I., Wei, Z., Hu, W.-P., MacLeod, M., and Spinney, R.: Kinetics and Mechanism of the Oxidation of Cyclic Methylsiloxanes by Hydroxyl Radical in the Gas Phase: An Experimental and Theoretical Study, Environ. Sci. Technol., 49, 13322–13330, 2015.
Xu, S. and Wania, F.: Chemical fate, latitudinal distribution and long-range transport of cyclic volatile methylsiloxanes in the global environment: A modeling assessment, Chemosphere, 93, 835–843, 2013.
Xu, S., Kozerski, G., and Mackay, D.: Critical Review and Interpretation of Environmental Data for Volatile Methylsiloxanes: Partition Properties, Environ. Sci. Technol., 48, 11748–11759, 2014.
Zushi, Y., Hogarh, J. N., and Masunaga, S.: Progress and perspective of perfluorinated compound risk assessment and management in various countries and institutes, Clean Technol. Envir., 14, 9–20, 2012.
third pole. There is still a gap in knowledge regarding the distribution of emerging perfluoroalkyl substances and cyclic volatile methylsiloxanes in the Tibetan environment. By using passive air samplers, higher levels of emerging compounds were generally observed at sites close to the transport channel of the Yarlung Tsangpo Grand Canyon and cities of the TP.
third pole. There is still a gap in...