the Creative Commons Attribution 4.0 License.
the Creative Commons Attribution 4.0 License.
 | 15 Jun 2018
Dynamical response of Mediterranean precipitation to greenhouse gases and aerosols
Drew Shindell
Bjørn H. Samset
Oliviér Boucher
Piers M. Forster
Øivind Hodnebrog
Gunnar Myhre
Jana Sillmann
Apostolos Voulgarakis
Timothy Andrews
Gregory Faluvegi
Dagmar Fläschner
Trond Iversen
Matthew Kasoar
Viatcheslav Kharin
Alf Kirkevåg
Jean-Francois Lamarque
Dirk Olivié
Thomas Richardson
Camilla W. Stjern
Toshihiko Takemura
Atmospheric aerosols and greenhouse gases affect cloud properties, radiative balance and, thus, the hydrological cycle. Observations show that precipitation has decreased in the Mediterranean since the beginning of the 20th century, and many studies have investigated possible mechanisms. So far, however, the effects of aerosol forcing on Mediterranean precipitation remain largely unknown. Here we compare the modeled dynamical response of Mediterranean precipitation to individual forcing agents in a set of global climate models (GCMs). Our analyses show that both greenhouse gases and aerosols can cause drying in the Mediterranean and that precipitation is more sensitive to black carbon (BC) forcing than to well-mixed greenhouse gases (WMGHGs) or sulfate aerosol. In addition to local heating, BC appears to reduce precipitation by causing an enhanced positive sea level pressure (SLP) pattern similar to the North Atlantic Oscillation–Arctic Oscillation, characterized by higher SLP at midlatitudes and lower SLP at high latitudes. WMGHGs cause a similar SLP change, and both are associated with a northward diversion of the jet stream and storm tracks, reducing precipitation in the Mediterranean while increasing precipitation in northern Europe. Though the applied forcings were much larger, if forcings are scaled to those of the historical period of 1901–2010, roughly one-third (31±17 %) of the precipitation decrease would be attributable to global BC forcing with the remainder largely attributable to WMGHGs, whereas global scattering sulfate aerosols would have negligible impacts. Aerosol–cloud interactions appear to have minimal impacts on Mediterranean precipitation in these models, at least in part because many simulations did not fully include such processes; these merit further study. The findings from this study suggest that future BC and WMGHG emissions may significantly affect regional water resources, agricultural practices, ecosystems and the economy in the Mediterranean region.
- Article
(1029 KB) - Full-text XML
- BibTeX
- EndNote


Aerosols, fine particles in the atmosphere produced by both natural processes and anthropogenic activities, impact the Earth's climate by scattering and absorbing solar radiation (direct effect) or by modifying the properties of clouds (indirect effects) through a variety of mechanisms including atmospheric heating and changes in ice nuclei and cloud condensation nuclei, including their size, location and concentration. These changes may significantly affect solar radiation and precipitation (Ramanathan et al., 2001; Kaufman et al., 2002; Shindell et al., 2012; Bond et al., 2013; Boucher et al., 2013). The effects of aerosols on climate have been widely studied both on global and regional scales (Ramanathan and Carmichael, 2008; Shindell and Faluvegi, 2009). For example, Menon et al. (2002) reported slight cooling and drying trends in the northern part of China in the second half of the 20th century and attributed such trends to the emissions of black carbon (BC) aerosols based on model simulations. Similarly, Hodnebrog et al. (2016) reported a precipitation decrease in southern Africa due to local biomass burning aerosols based on analyses of model simulations and local energy budget. In contrast, Koren et al. (2012) argued that aerosols could intensify rainfall events in the lower and midlatitudes by analyzing satellite observations. However, Stevens and Feingold (2009) contended that the effects of aerosols on clouds and precipitation are very limited due to the buffering effects of the climate system itself. In addition to their influence on temperature and precipitation, aerosols may also affect large-scale atmospheric circulation. For example, Takahashi and Watanabe (2016) suggested that the Pacific trade winds were accelerated partially by sulfate aerosols during the past two decades. Jacobson and Kaufman (2006) suggested a surface wind reduction due to aerosol particles in California and China, which may also impact air pollution and wind energy. Dunstone et al. (2013) also reported that aerosols could modulate Atlantic tropical storm frequency due to aerosol-induced shifts in the Hadley circulation. These differing results suggest that aerosol effects on regional climate may depend on the aerosol types, seasons and regions of interest.
A decreasing precipitation trend in the Mediterranean area since the 20th century has been reported and its possible causes have been investigated in many studies (Piervitali et al., 1998; Buffoni et al., 1999; Mariotti et al., 2002; Dünkeloh and Jacobeit, 2003; Xoplaki et al., 2004). For instance, Quadrelli et al. (2001) observed a strong correlation between winter Mediterranean precipitation and the North Atlantic Oscillation (NAO) (Hurrell et al., 2001). Krichak and Alpert (2005) suggested that the East Atlantic–West Russia (EA-WR) pattern may also play an important role in modulating the precipitation in the Mediterranean. Hence, the responses of Mediterranean precipitation to these large-scale variability patterns (e.g., NAO, EA-WR), and to some extent how these patterns might be responding to external drivers, are fairly well understood (Black et al., 2010). However, prior studies included all the drivers at once and thus could not discern the relative roles of well-mixed greenhouse gases (WMGHGs) and other agents. Anthropogenic aerosols have been reported to greatly influence the temperature in the Mediterranean (Nabat et al., 2014), but the effects of aerosols on Mediterranean precipitation have not been carefully examined. Since precipitation impacts water availability for both ecosystems and human societies, it is crucial to understand the different impacts of the climate drivers that are responsible for the Mediterranean precipitation trend. To bridge this knowledge gap, here we analyze Mediterranean precipitation changes based on a group of state-of-the-art global climate models (GCMs) that examined the precipitation response to individual climate drivers, which could help inform management of water resources, regional societal activities such as agriculture, and even emissions mitigation.
2.1 Data
This study employed output from nine models participating in the Precipitation Driver and Response Model Intercomparison Project (PDRMIP), utilizing simulations examining the individual responses to CO2, sulfate and BC aerosols. In these simulations, perturbations were performed with each model at global scale: a doubling of CO2 concentration (CO2 × 2), 10 times present-day BC concentration (BC × 10) and 5 times present-day SO4 concentration (SO4 × 5). All perturbations were abrupt. CO2 × 2 perturbations were applied relative to the models' own baseline values. For aerosol perturbations, monthly present-day concentrations were derived from the AeroCom Phase II initiative (Myhre et al., 2013a). The concentrations were multiplied by the stated factors (concentration-driven). A few models instead perturbed aerosol emissions (emission-driven), in most cases again using AeroCom Phase II data. In the majority of simulations with fixed concentrations, aerosol–cloud interactions cannot be realistically represented as, for example, changes in cloud lifetimes cannot affect aerosols. Hence the concentration-driven models can fully capture only direct aerosol effects (aerosol–radiation interactions), and the PDRMIP simulations are designed to examine dynamic responses of the hydrologic cycle rather than those that take place via aerosol–cloud microphysics. Hence this study focuses on aspects of the response that appear to be less sensitive to those interactions as they are relatively robust across the models (despite some emission-driven models using interactive aerosols while others used climatological fields). Many PDRMIP studies have taken this approach (Samset et al., 2016, 2018; Myhre et al., 2017; Stjern et al., 2017; Liu et al., 2018; Richardson et al., 2018), though further work with models incorporating more realistic aerosol–cloud interactions would of course be valuable in determining the veracity of all conclusions from the project.
Each perturbation was run in two configurations, a 15-year fixed sea surface temperature (SST) simulation and a 100-year coupled simulation. Each fixed SST simulation is compared with its fixed SST control simulation to diagnose the effective radiative forcing (ERF) due to each perturbation (Myhre et al., 2013b), whereas each coupled run is compared with its coupled control run to examine climate response. Saharan dust has been suggested to have a discernible impact over the Mediterranean (Bangert et al., 2012). In the PDRMIP experiments, all models include dust among the aerosols, but again, because the PDRMIP protocol was designed to look at the dynamic climate response to prescribed aerosol and GHG changes, dust was held fixed in the concentration-driven simulations. Further work could usefully explore whether changes in dust loading might have contributed to Mediterranean precipitation changes. The nine models used in this study and their configurations, as well as the aerosol treatment, are listed in Table 1.
Table 1Descriptions of the nine PDRMIP models.

Note: GA is global atmosphere, S is sulfate, N is nitrate,
SS is sea salt, OC is organic carbon, BC is black carbon, OM is organic
mass, BB is biomass burning, SOA is secondary organic aerosol and POM is primary organic matter.
N/A indicates not available.
2.2 Method
In addition to direct analysis of meteorological fields (e.g., precipitation, sea level pressure – SLP) in the models, we also analyze the energy budget associated with the hydrological cycle. Following Hodnebrog et al. (2016) and Muller and O'Gorman (2011), the precipitation change is related to diabatic cooling and the horizontal transport of dry static energy as follows:
Here Lc is the latent heat of condensation of water vapor, which is 29 W m−2 mm−1 day−1. ΔP is the precipitation change. ΔH is the column-integrated dry static energy flux divergence and ΔQ is the column-integrated diabatic cooling, which is calculated as
where ΔLW is the change of longwave radiation in the atmospheric column and ΔSW is the change of shortwave radiation in the atmospheric column. ΔSH is the change of upward sensible heat flux.
Since most of the precipitation events occur in the wet season (October–March) in the Mediterranean, roughly 70 % of total annual precipitation (Mariotti et al., 2002; Kottek et al., 2006), the analysis was restricted to the wet season in the current study unless noted otherwise. All of the data used in this study were re-gridded into 2.5∘ × 2.5∘ horizontal resolution for analyses.
Figure 1 shows the multi-model mean (MMM) of normalized ΔP for each forcing. Both CO2 and BC caused a substantial drying over Mediterranean, with a larger magnitude from BC (Fig. 1a and b), whereas SO4 contributed very little in the Mediterranean region (Fig. 1c). Moreover, in stark contrast to the drying of the Mediterranean, northern Europe shows increasing precipitation trends for CO2 and BC (Fig. 1a and b), which will be discussed in more detail later. To compare the precipitation response quantitatively, the domain-averaged (purple rectangle in Fig. 1; 30–45∘ N, 10∘ W–40∘ E) trends are shown in Fig. 2. For CO2, all nine models show drying trends (Fig. 2a). The MMM is mm day−1 per W m−2, with individual model values ranging from −0.01 to −0.06 mm day−1 per W m−2. For BC (Fig. 2b), all nine models again show drying trends, with the MMM value mm day−1 per W m−2, which is 4 times as large as that of CO2. When it comes to SO4 (Fig. 2c), the model results even differ in the sign of change and the MMM value is small ( mm day−1 per W m−2). These analyses show that the precipitation response is more sensitive to BC forcing than to CO2 and SO4 in this region.
In order to investigate the mechanisms governing the precipitation response, we performed an energy budget analysis for this region (Fig. 3). For CO2, the drying is dominated by horizontal energy transport (gray box in the CO2 panel), albeit with some offset by diabatic cooling (pink box in the CO2 panel). For BC, the net radiation change, which is primarily SW (red box in the BC panel), has a larger impact than the horizontal energy change (gray box in the BC panel), but the latter is nonetheless a substantial fraction of the net change. When it comes to SO4, the small precipitation response results from the offsetting of net radiation change (pink box in the SO4 panel) and horizontal energy transport (gray box in the SO4 panel). The energy budget analysis implies that the dynamical responses to CO2 and BC played a crucial role in modulating the precipitation in this region.
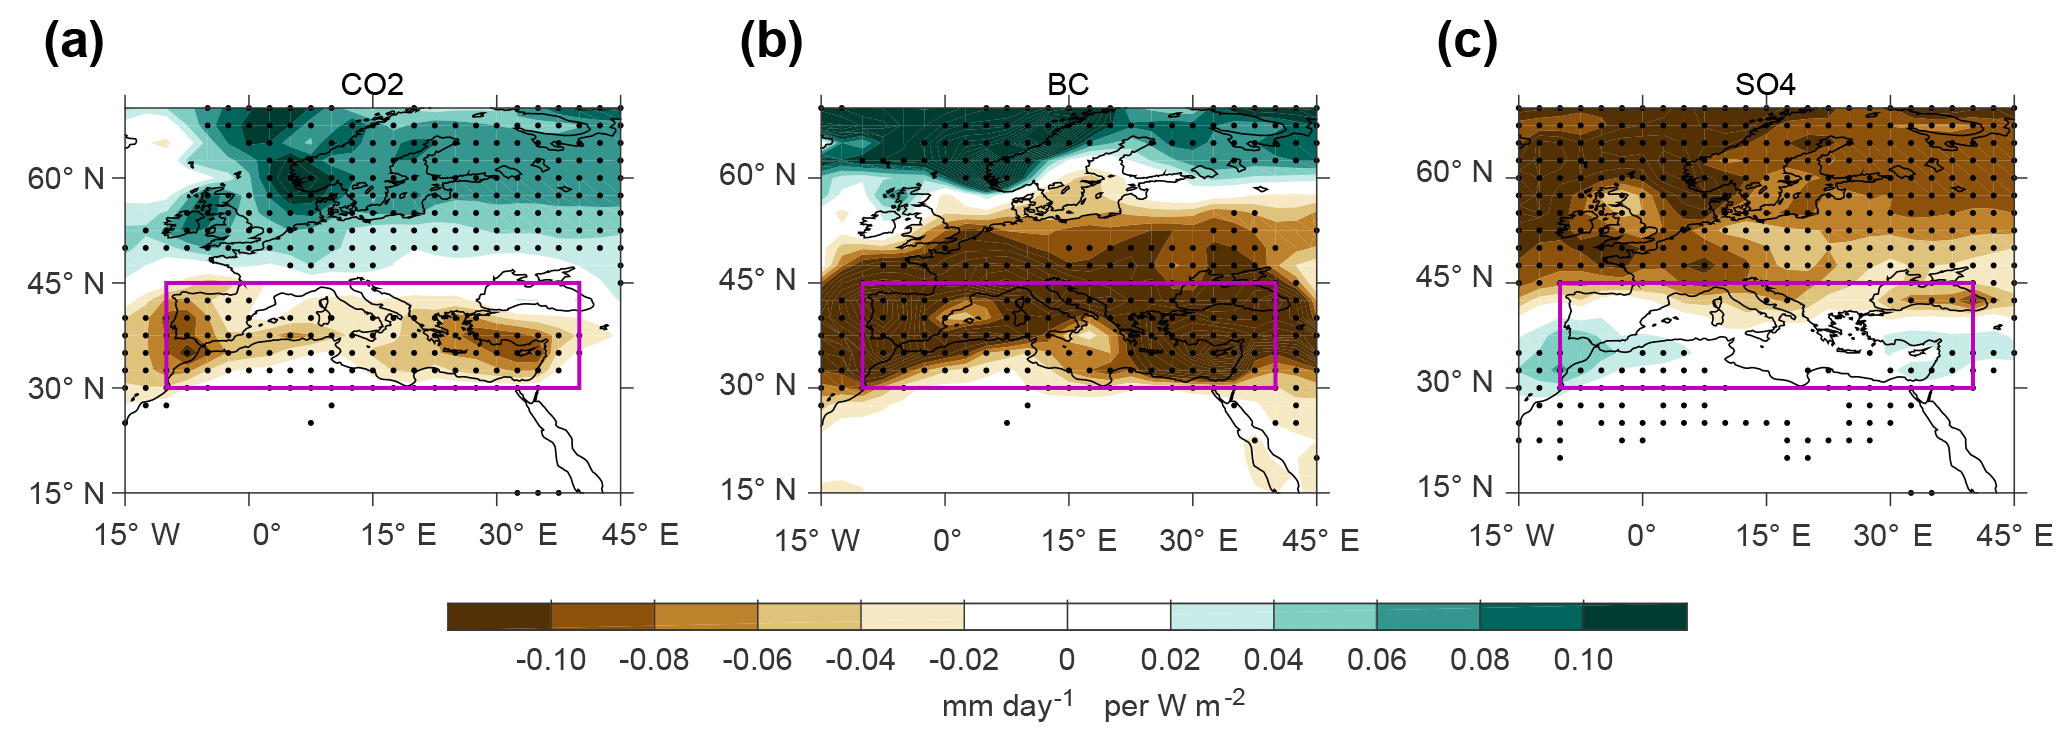
Figure 1Normalized ΔP (change per unit forcing) for (a) CO2, (b) BC and (c) SO4. Black dots indicate that the change is significant at 0.95 confidence level. Please note that the sign for SO4 is flipped due to its negative forcing. Thus, the result shown for SO4 is the precipitation change per unit negative forcing.
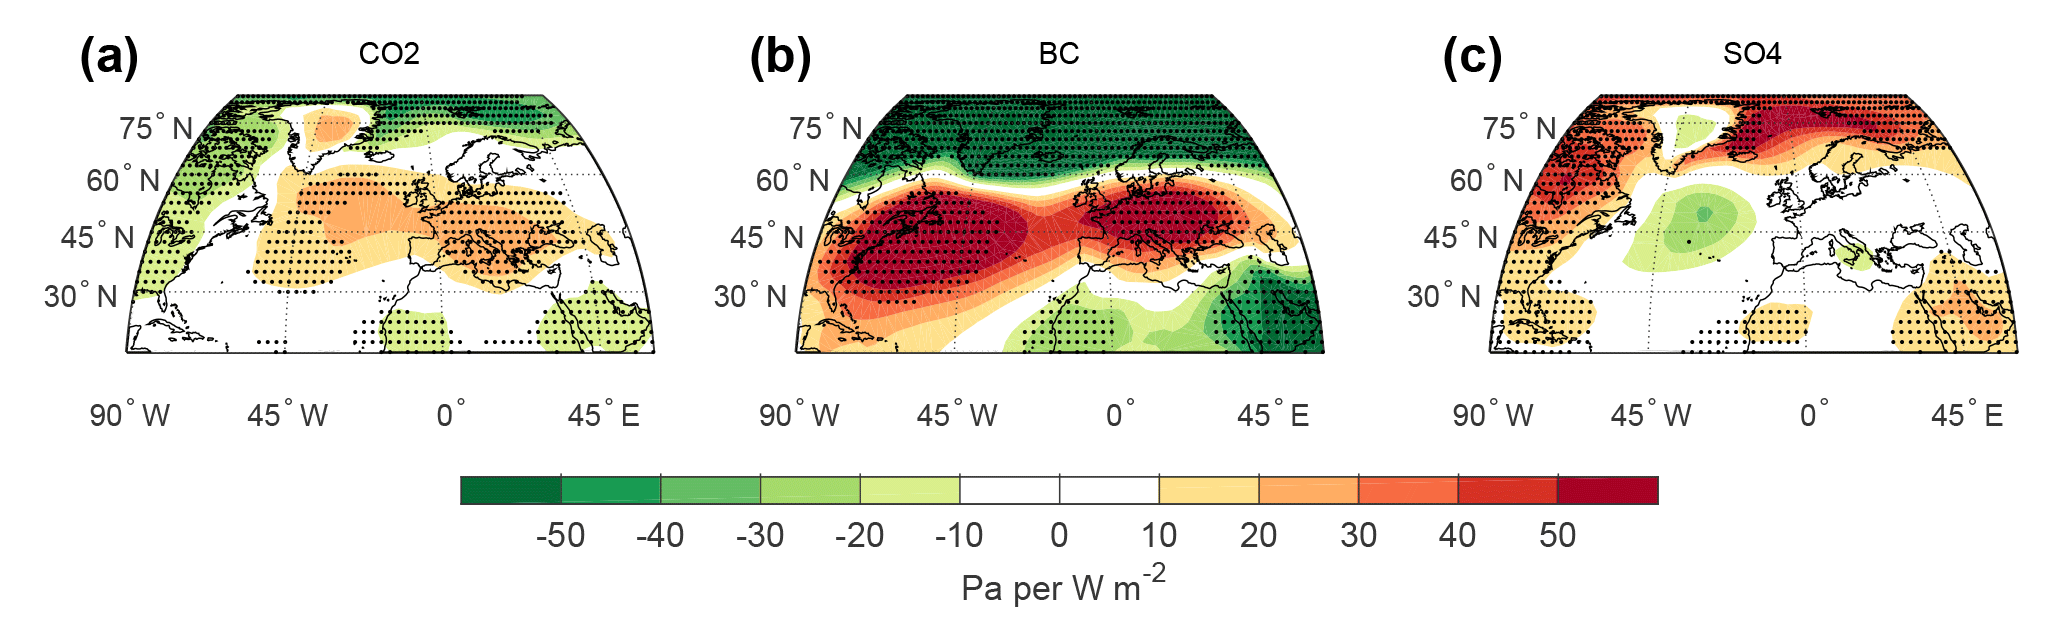
We then analyzed the ΔSLP from the model output (Fig. 4). Specifically, it is seen that CO2 induced strong SLP changes. The SLP increased at midlatitudes, with increases extending from the North Atlantic to southern Europe, and decreased at high latitudes (Fig. 4a). BC led to a similar pattern of SLP change, but with increased magnitude (Fig. 4b), characterized by two increases centered in Europe and the western North Atlantic. Compared with CO2 and BC, SO4 caused an opposite change (Fig. 4c). The CO2 and BC forcings appear to induce a pattern similar to the positive phase of the NAO–Arctic Oscillation (AO) (Lorenz, 1951), in which the jet streams and storm tracks are displaced northward, leading to a drier Mediterranean and precipitation increases in northern Europe (Fig. 1a and b). Such a shift in response to forcings is more clearly seen in the changes of zonal winds (Fig. 5). The CO2 caused a strengthening of zonal winds in the whole upper atmosphere and a strengthening around 60∘ N from the near-surface to the top of the atmosphere, as well as weakening around 30∘ N from the near-surface to the mid-troposphere (Fig. 5a), as in prior studies (Shindell et al., 2001). The strengthening around 60∘ N is more apparent for BC (Fig. 5b). Similar results were seen in response to aerosol forcing in a prior study (Allen and Sherwood, 2011). This shift is possibly due to the enhancement of the tropospheric temperature gradient between midlatitudes and high latitudes, as suggested by Allen et al. (2012).
Our analyses illustrate that BC aerosols may modulate regional precipitation in part via modifying large-scale circulation patterns. Many previous studies suggest that BC could impact regional precipitation by changing the local vertical temperature profile, in which BC aerosols absorb solar radiation and heat the atmosphere, thus suppressing convection and cloud formation (Kaufman et al., 2002; Meehl et al., 2008; Ramanathan and Carmichael, 2008; Hodnebrog et al., 2016). Our results (analyses of the energy budget, SLP and zonal winds) suggest that a portion of the drying is also associated with large-scale circulation responses. In addition, our pattern of jet stream and storm track changes (Figs. 4 and 5) is also in agreement with the projections from the latest IPCC report (Collins et al., 2013) based on a set of CMIP5 models, with increasing storm activities in northern Europe and decreasing storms in the Mediterranean. Such a shift of storm tracks may further reduce the precipitation in the Mediterranean, though reductions in WMGHG or BC emissions may help to mitigate the projected drying.
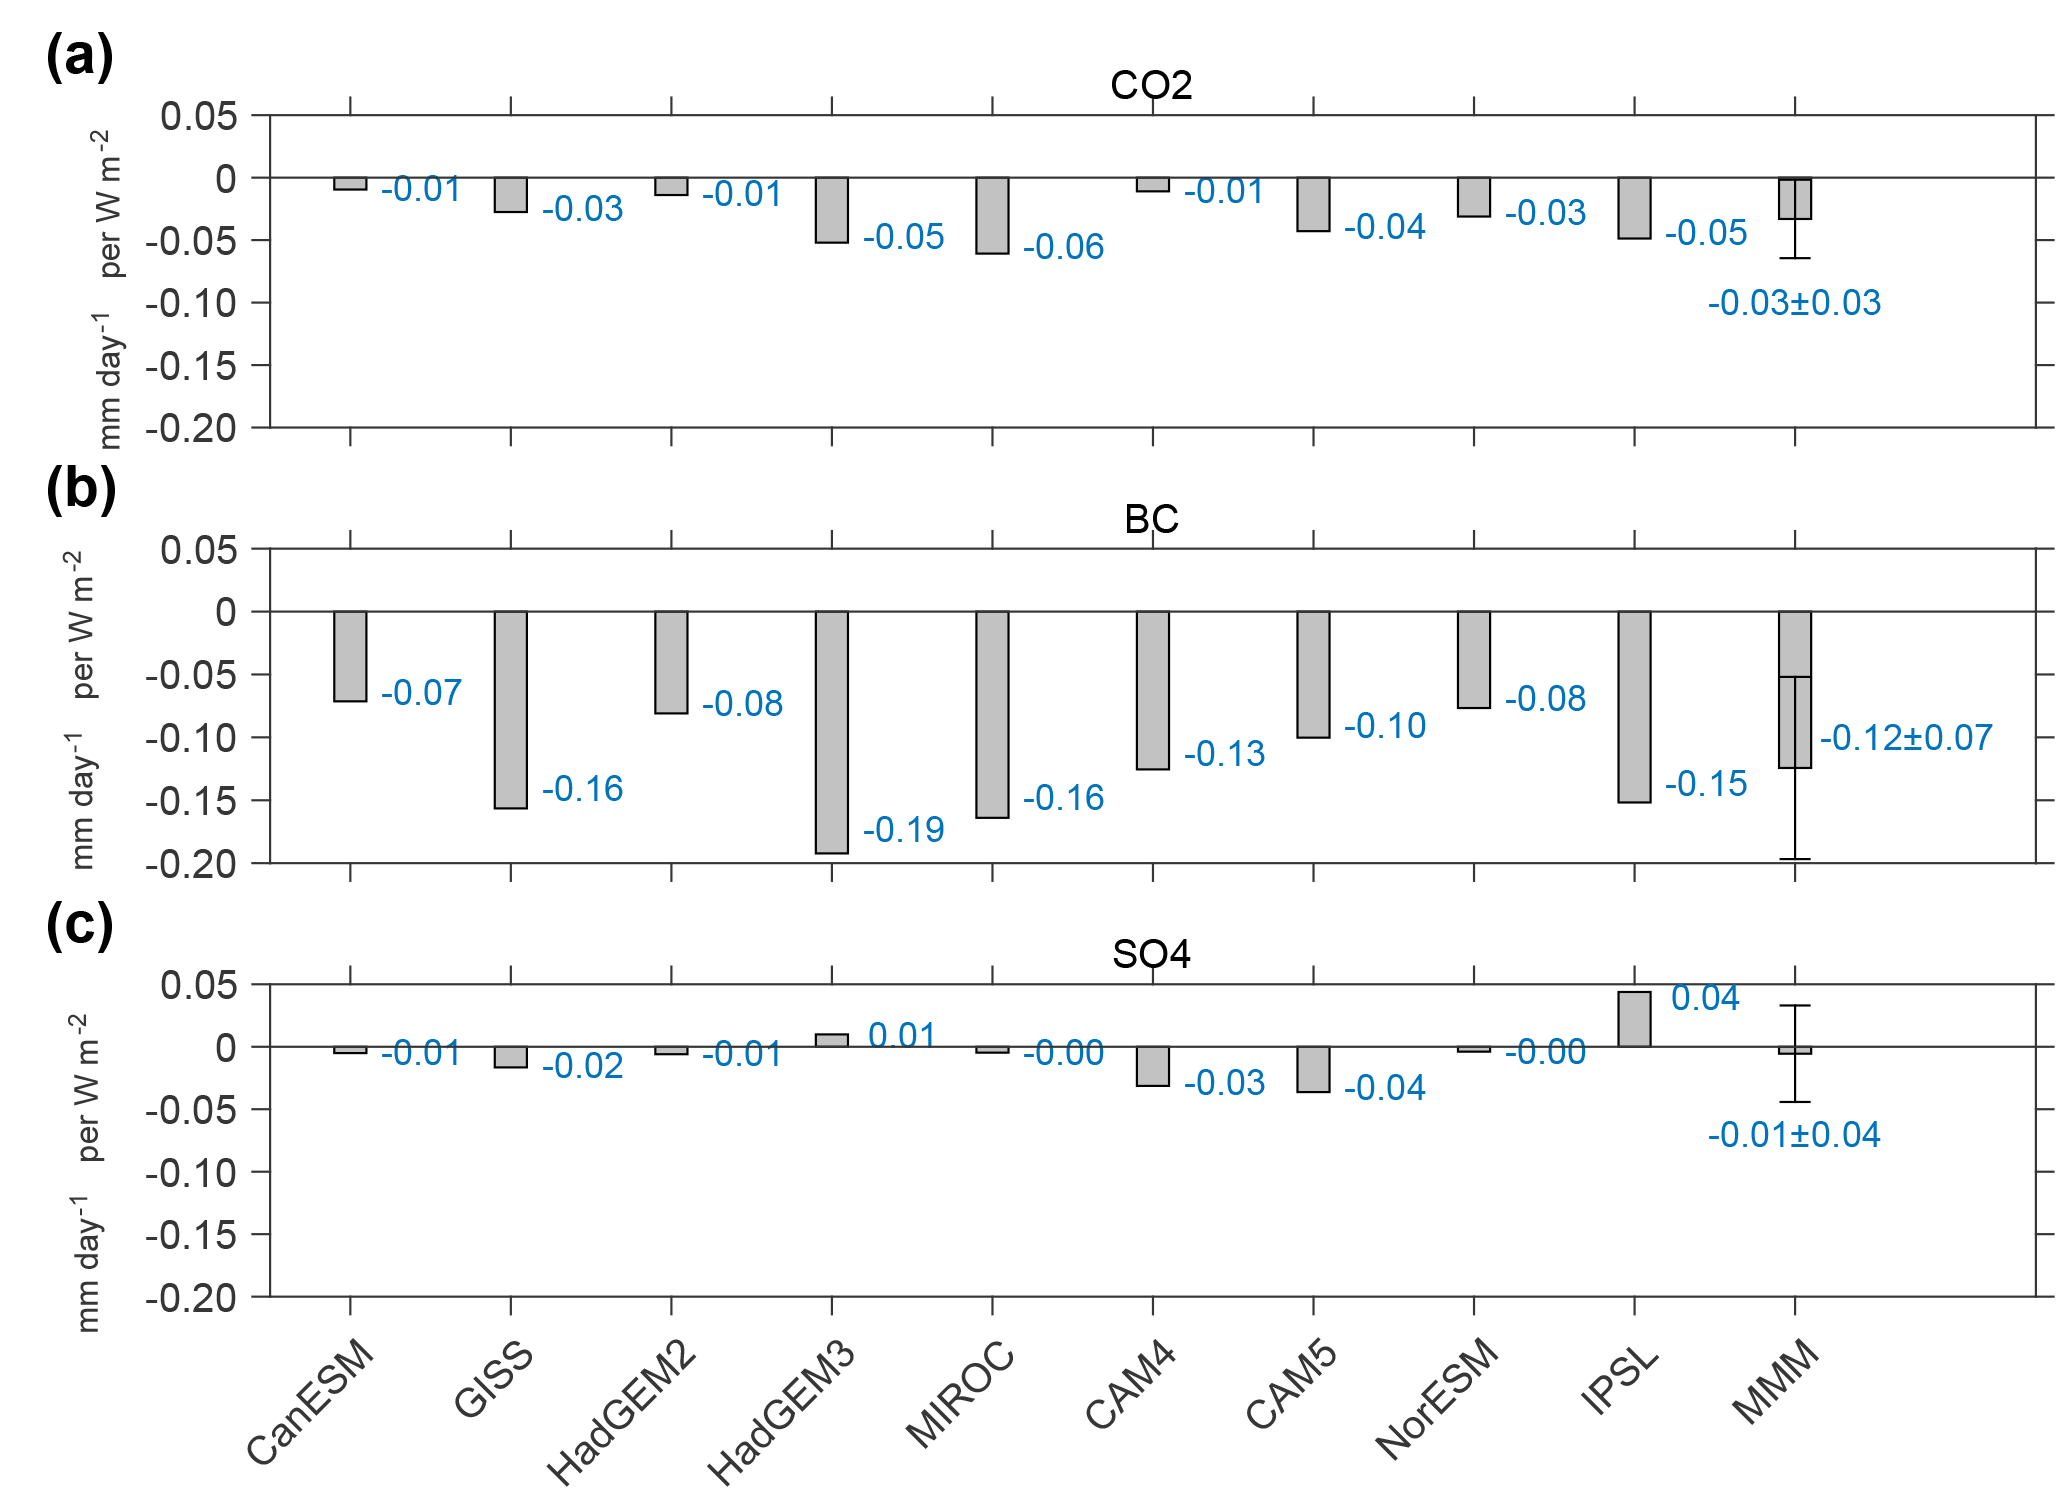
Figure 2Domain-averaged ΔP (purple rectangles in Fig. 1) for (a) CO2, (b) BC and (c) SO4. Error bars of multi-model mean (MMM) are 90 % inter-model spread.

Figure 3Domain-averaged (purple rectangles in Fig. 1) energy budget change for each forcing and energy component as shown in Eqs. (1) and (2). It holds that , where LcΔP is the change in total latent heating, is the change in diabatic cooling of the atmospheric column due to shortwave and longwave radiation, and sensible heat flux, ΔH, is the change in column-integrated dry static energy flux divergence. The error bars indicated 90 % inter-model spread.
The above analyses demonstrated how the precipitation and circulation responded to each forcing both qualitatively and quantitatively. In order to explore their potential relative contributions to the total precipitation change, here we apply linear scaling to the model output. Since PDRMIP utilized large aerosol and greenhouse gas changes in order to achieve strong signals that could be statistically significant with a relatively modest amount of computational time, the precipitation change from those model outputs needs to be scaled in order to compare with observations. Uncertainties related to this approach are discussed further in Sect. 5.
In this study, we focus on the period from 1901 to 2010. The scaled precipitation change for each individual forcing is defined as
In Eq. (3), ΔP is the precipitation change over Mediterranean in the model during the last 50 years in the coupled run, since the model has reached near-equilibrium state after 30 years. ERF1901–2010 is the historical global ERF for the period of 1901–2010. The values were obtained from the latest Intergovernmental Panel on Climate Change (IPCC) assessment report (Myhre et al., 2013b). The ERF1901–2010 value used for CO2 is 2.33 W m−2, which is larger than the CO2 value from the IPCC report because CO2 was used to represent all WMGHGs in this case study. ERF1901–2010 values for BC and SO4 are 0.28 and −0.33 W m−2, respectively. ERFmodel is the global ERF in the PDRMIP models, which was obtained by calculating the energy flux change at the top of the atmosphere from years 6 to 15 of the fixed SST simulations, since present models largely equilibrate within 5 years of fixed SST running (Kvalevåg et al., 2013). In addition to the direct effects of the aerosols, the indirect effects of aerosols were also included in most of the models and, thus, in the ERFmodel. The value of (ERF1901–2010/ERFmodel) is the scaling factor applied to model precipitation output to match historical forcing levels. They are 0.64 [0.57, 0.69], 0.33 [0.10, 0.68] and 0.11 [0.04, 0.16] for CO2, BC and SO4, respectively (where the values indicate the mean [min, max] across the nine models). An important assumption here is that the ΔP changes linearly with ERFmodel.
ΔPscaled is calculated for CO2, BC and SO4 separately. The total ΔPscaled is the combination of the three, assuming their responses to those forcings can be added linearly. It should be noted that in this analysis, we use the combined responses to WMGHGs, BC and SO4 to approximate the total historical response over 1901–2010. Several additional factors may have also played a role, including natural forcing (solar and volcanic activities), land use or land cover change, contrails, ozone (O3) (both tropospheric and stratospheric) and stratospheric water vapor, which have forcings of −0.03, −0.09, 0.05, 0.26 and 0.06 W m−2, respectively (Myhre et al., 2013b). As all these forcings are fairly small, simulations to isolate their impacts would be extremely computationally expensive and hence were not performed but to first order we expect their exclusion is unlikely to greatly affect our results. Characterization of the influence of these other drivers merits future study, particularly as some operate via different physical processes (e.g., tropospheric ozone is both a greenhouse gas and an absorber of incoming solar radiation). Similar analyses were also performed to obtain scaled SLP change (ΔSLPscaled), zonal wind change and energy budget change in the atmospheric column.
Several observational and reanalysis datasets were also employed in this part of our study. For precipitation, Global Precipitation Climatology Center (GPCC) monthly precipitation data (Schneider et al., 2011), provided by NOAA/OAR/ESRL from their website (https://www.esrl.noaa.gov/psd/data/gridded/data.gpcc.html#detail, last access: 12 June 2018), are employed. It is a high-quality gridded dataset that is mainly derived from terrestrial stations. For SLP, we use HadSLP2 data (Allan and Ansell, 2006), which are created by combining marine observations from ICOADS data (Worley et al., 2005) and land (terrestrial and island) observations (available at https://www.esrl.noaa.gov/psd/data/gridded/data.hadslp2.html, last access: 12 June 2018). We also use NCEP/NCAR reanalysis data (Kalnay et al., 1996), downloaded from https://www.esrl.noaa.gov/psd/data/gridded/data.ncep.reanalysis.derived.surface.html (last access: 12 June 2018), for the comparisons of zonal wind. All these datasets have undergone rigorous quality control and have been widely used in the climate community, including the IPCC 2013 assessment report (Hartmann et al., 2013). The trends of the observed and reanalysis data were estimated by a simple linear regression applied to the same period of the datasets.
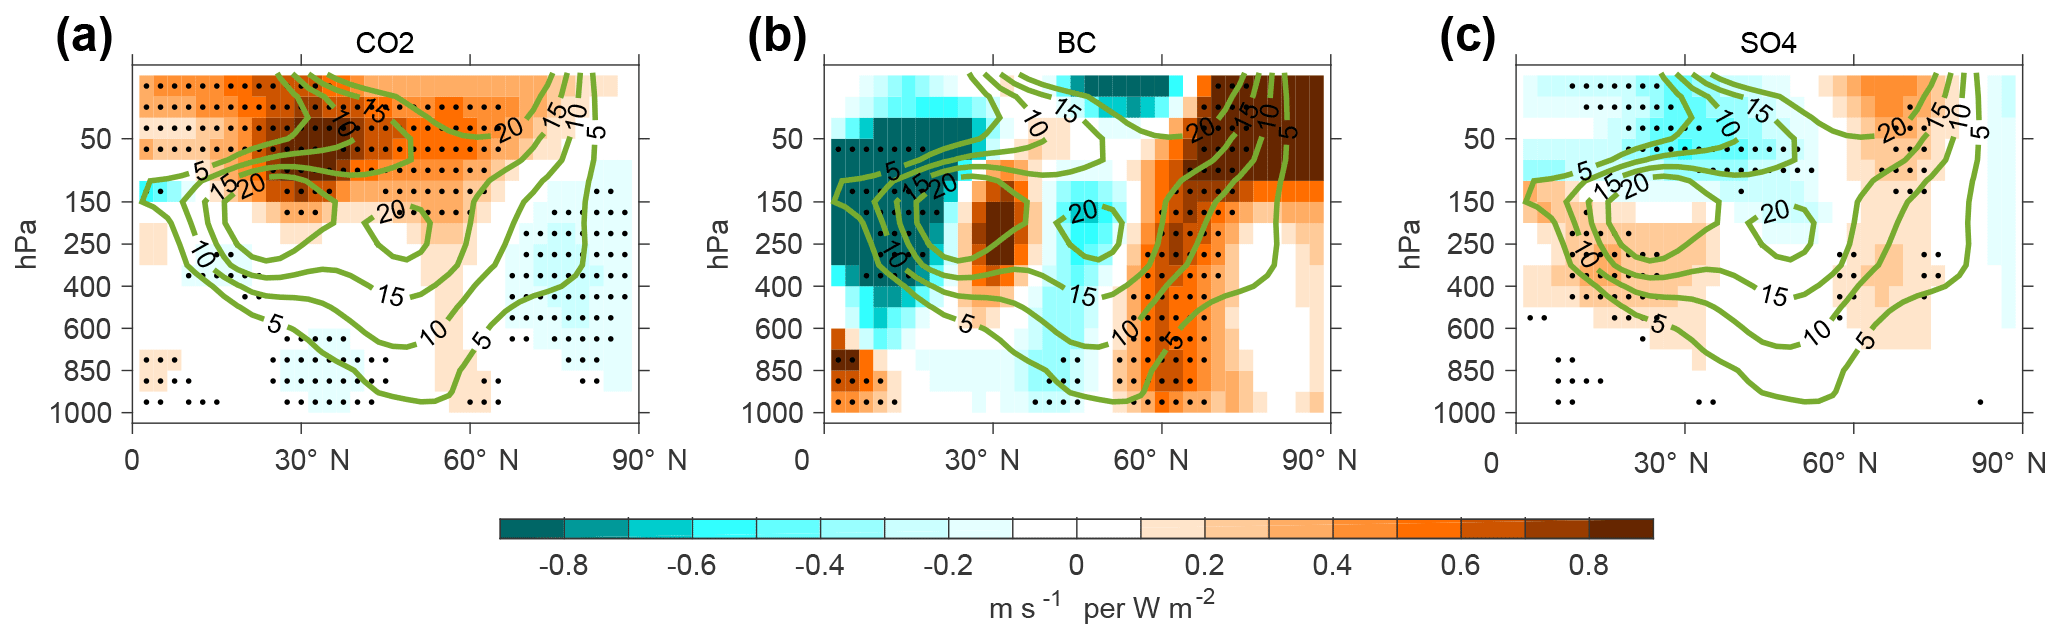
Figure 5Same as Fig. 1, but for zonal wind. The green contours represent the 50-year climatology of the zonal wind in the control simulations. The contours are at the interval of 5 m s−1, with positive values indicating eastward winds.
The combination of WMGHGs, BC and SO4 exerted a strong drying trend in the Mediterranean (Fig. 6a). The drying trends shown here are statistically significant and consistent with the observations (Fig. 6b), as well as previous studies (Buffoni et al., 1999; Mariotti et al., 2002; Dünkeloh and Jacobeit, 2003). When averaged over the whole domain, the scaled drying trends caused by WMGHGs, BC and SO4 are , and mm decade−1, respectively (not shown here). When combined (Fig. 6c), all nine models show decreased precipitation, with MMM value of mm decade−1, which is roughly a 5 % decrease relative to the climatology of the control simulations. Such a decreasing trend is indistinguishable from the observations ( mm decade−1, a 10 % decrease compared with its 110-year climatology). In spite of the dominant role of WMGHGs in the drying of the Mediterranean, BC contributed roughly one-third (31±17 %) of the total forced precipitation decrease in this region whereas the contribution of the scattering aerosol SO4 is negligible (∼1.6 %). We also examined the trend of precipitation in the control simulations and found only very weak responses (Fig. 6c), with a mean value of 0.004±0.03 mm decade−1 and maximum value of 0.03 mm decade−1 in any individual model. Since current GCMs are able to capture the broad spatial and temporal features of internal variability (Flato et al., 2013) and the forced drying signal is almost equal to the total signal (Fig. 6a–c), the consistent drying trend in the models is very unlikely to be attributable to unforced variability and appears realistic. The energy budget change (Fig. 6d) clearly shows that the net precipitation decrease is mainly due to horizontal energy transport (gray box) rather than diabatic cooling (pink box), because the absorption of SW radiation (red box) and LW radiative cooling (green box) offset one another in total.
Figure 7a shows the overall response of SLP to these forcings, with strong SLP increases at midlatitudes and strong decreases at higher latitudes. Such patterns of SLP changes are also found in the observed datasets (Fig. 7b), albeit with a larger magnitude. The combined pattern of zonal wind responses shows winds intensified at the northern edge of the jet stream and weakened at the southern edge (Fig. 7c). The NCEP dataset depicts a similar pattern of changes, with winds intensifying at 60∘ N and weakening at 30∘ N, but, as with SLP, with a stronger magnitude (Fig. 7d). Some previous studies have pointed out that current GCMs significantly underestimate the tropical expansion and jet stream shift, which could be related to the short observational record, large internal variability or model deficiencies (Johanson and Fu, 2009; Allen et al., 2012). Despite the underestimations, our analyses clearly demonstrate the shift of the jet stream in response to these forcings that appears qualitatively consistent with observations.
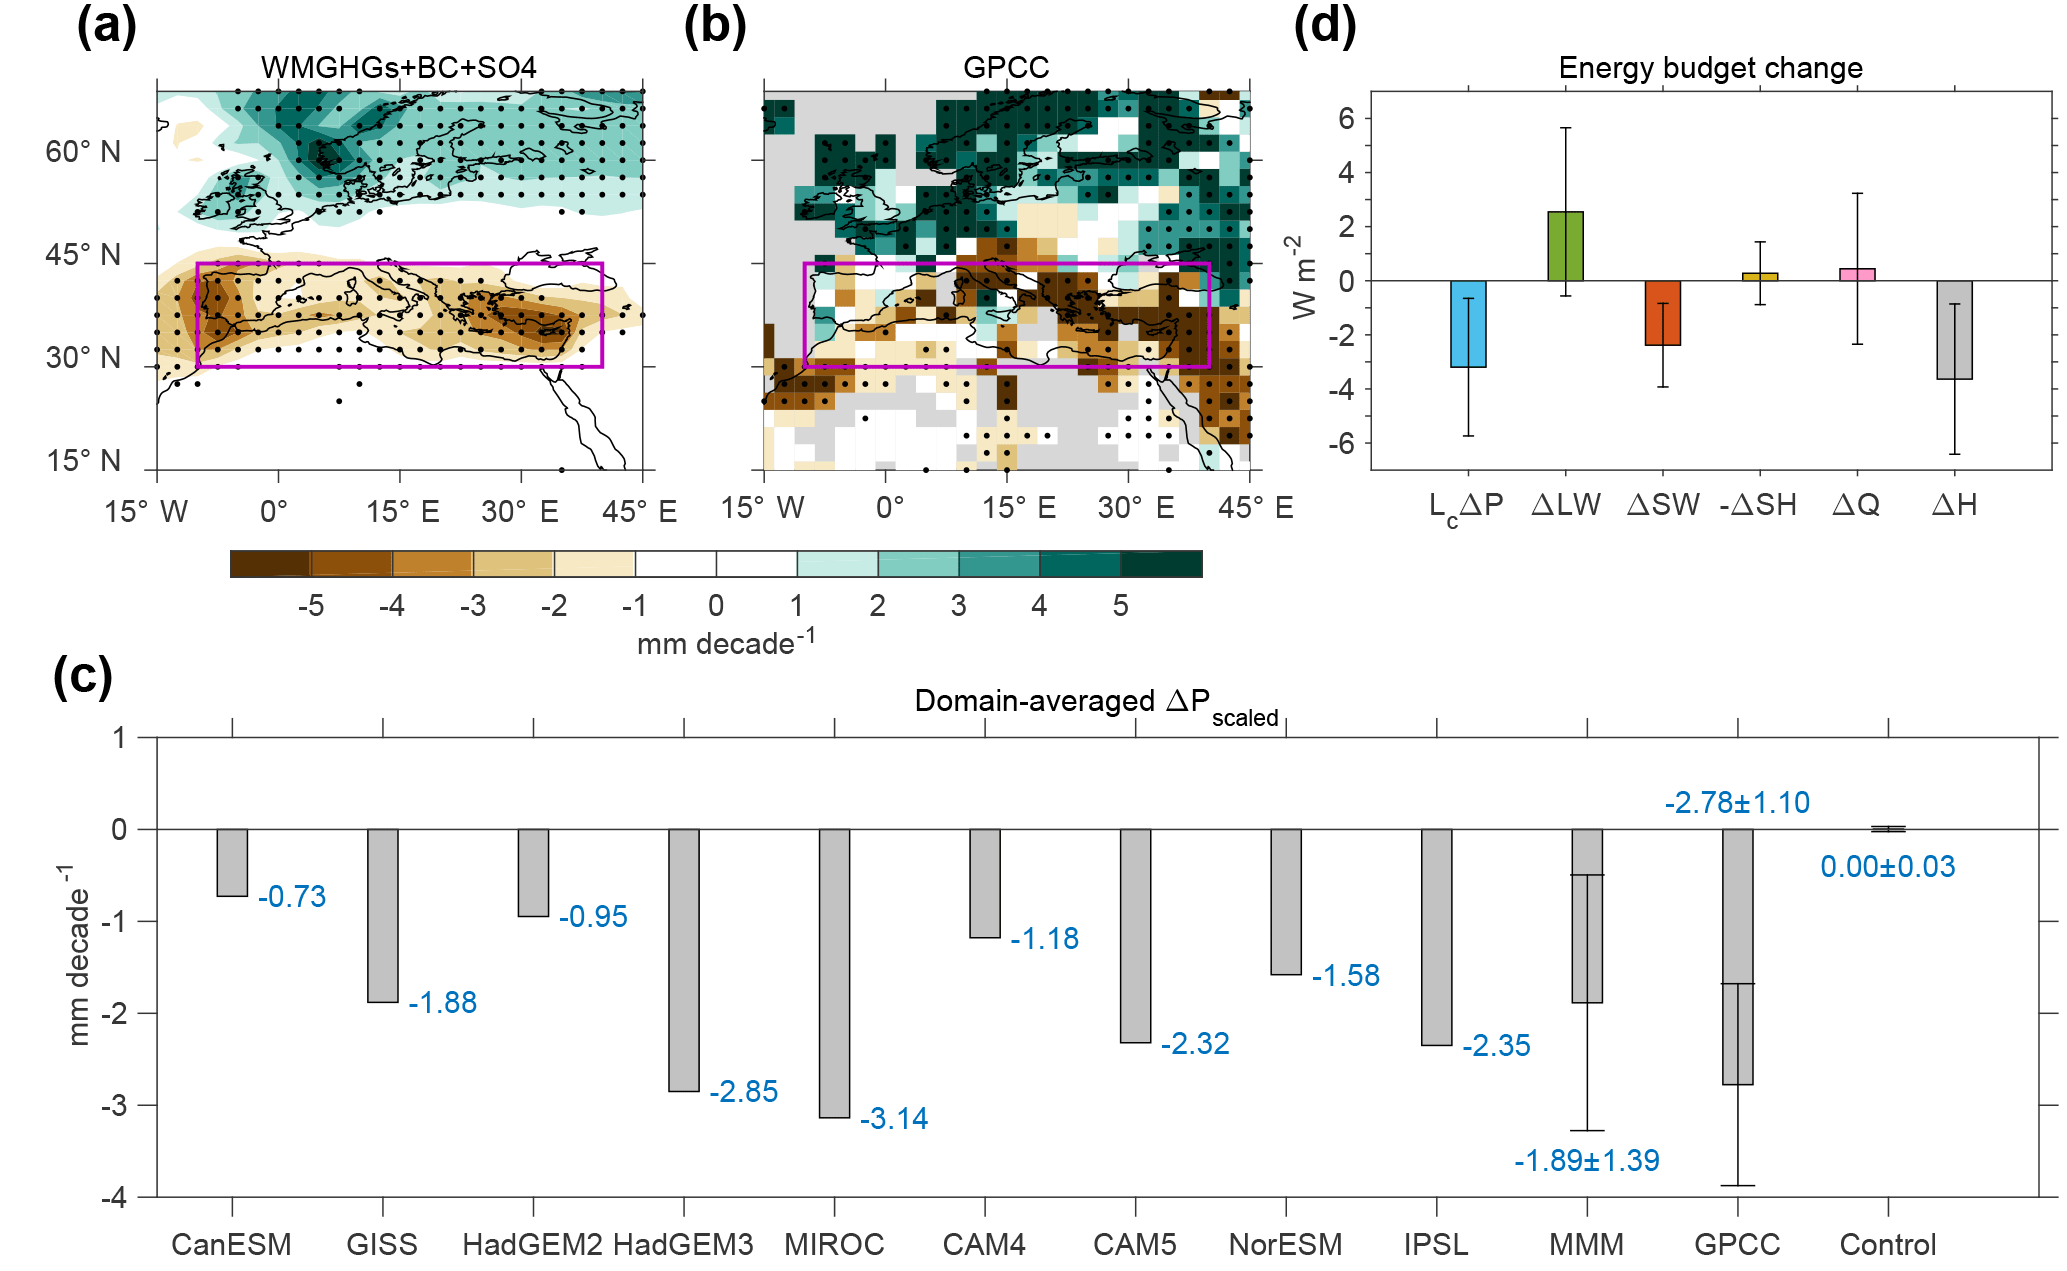
Figure 6Scaled change for the combination of WMGHGs, BC and SO4 for (a) spatial pattern of precipitation, (c) domain-averaged precipitation change and (d) energy budget change, along with 1901–2010 (b) GPCC observational data (for which gray indicates missing or incomplete data). The dots in panels (a) and (b) indicate changes are significant at 0.95 and 0.9 confidence level, respectively. Error bars in panels (c) and (d) indicate 90 % uncertainty ranges.
Based on the model simulations in the current study, the pattern of climate response to BC forcing over the past ∼ 110 years is similar to the response to WMGHGs over Europe and the North Atlantic, including precipitation, SLP and zonal winds. At the same time, our results suggest that SO4 played a very limited role in modulating Mediterranean precipitation trends and North Atlantic storm tracks. In other words, the precipitation trends during the past 110 years in the Mediterranean are likely to be only weakly sensitive to scattering aerosols that were not modeled (e.g., organic carbon, nitrate) or the uncertainties in aerosol negative forcing (probably not even for indirect forcing, as they were included in sulfate simulations for most models). The small sensitivity of SO4 is likely due to compensation between local and remote effects (Liu et al., 2018). Combined with its small ERF, the role of SO4 appears to be negligible during this period. However, the simulations examined here were not designed to determine whether the aerosol effects are due to local or remote emissions from the models. Initial analysis from PDRMIP regional experiments (in which BC over Asia only is multiplied by 10, with everything else being held at present-day levels) indicates that BC from Asia contributes as much as 60 % to the drying signal in the Mediterranean and in fact a larger average rainfall change in the Mediterranean than averaged over Asia itself. This suggests that the remote effects of BC may have dominated the Mediterranean precipitation changes. Hence the response to global BC increases may be a reasonable proxy for the 20th century changes, although it would be useful to explore the effects of local reductions from Europe itself in the late 20th century. The relative impacts of local versus remote forcing will be further explored in forthcoming PDRMIP analyses.
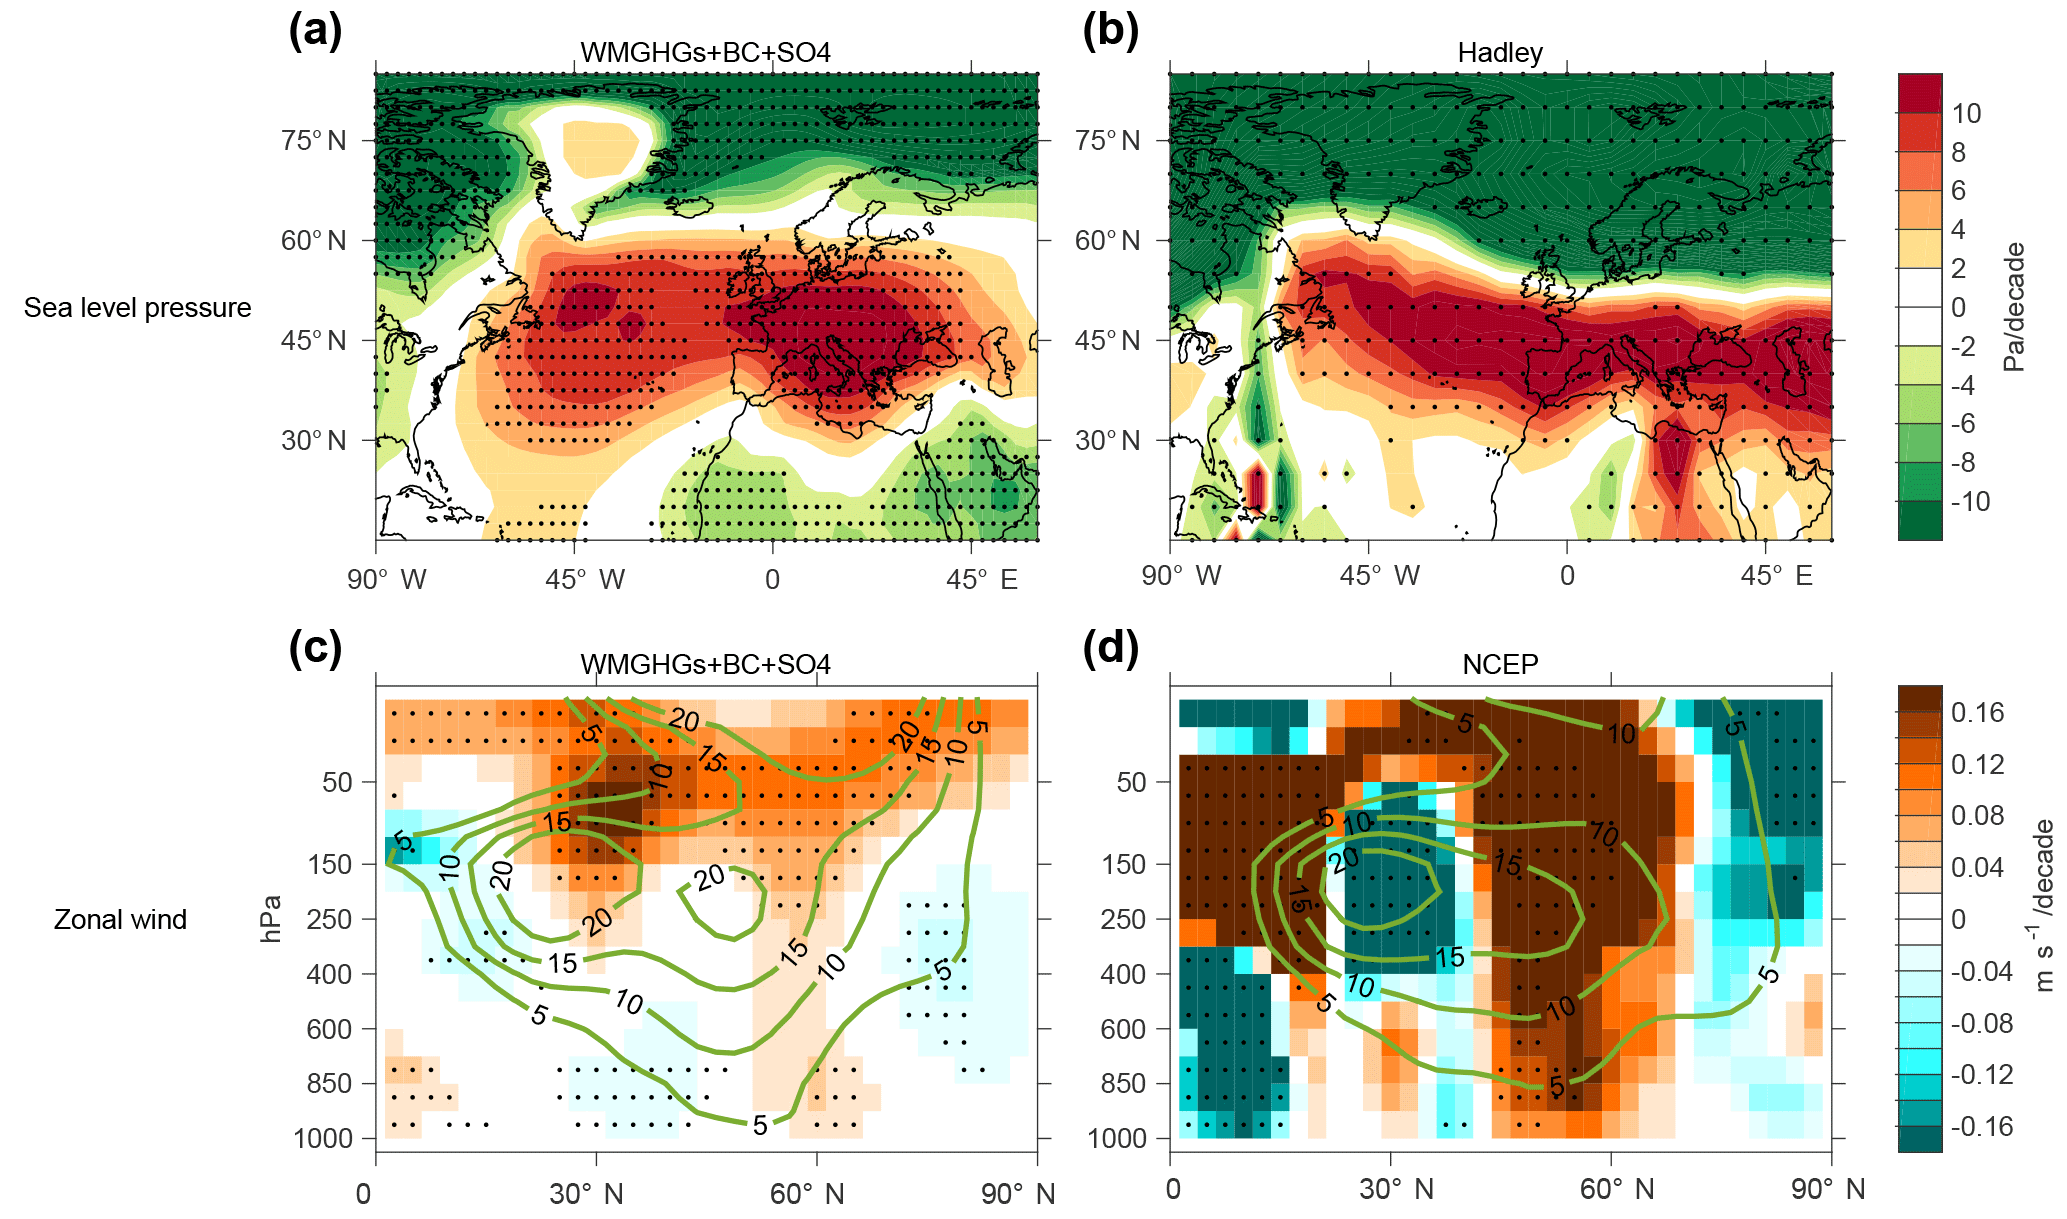
Figure 7SLP (a, b) and zonal wind change (c, d). Panels (a) and (c) are scaled change for the combination of WMGHGs, BC and SO4, while panels (b) and (d) are Hadley observational data and NCEP reanalysis data, respectively. Dots indicate the changes are significant at 0.95 confidence level. The green contours in panels (c) and (d) represent the climatology position of the zonal wind. The contours are at the interval of 5 m s−1, with positive values indicating eastward winds.
Since PDRMIP experiments are equilibrium simulations while the real world is transient, and we scaled PDRMIP forcing to match historical levels, we examined related experiments to test both these aspects of the methodology used in our comparison with historical observations. Historical GHG-only simulations using the same CMIP5 models (Taylor et al., 2012) that participated in the PDRMIP project were collected and analyzed (data available at http://strega.ldeo.columbia.edu:81/CMIP5/.monthly/.byModel/, last access: 12 June 2018). Six models are available and each model has one to five ensemble members. All six models show drying trends (Fig. 8), with a MMM value of mm decade−1 (−1.29 when weighted by ensemble size), which is quite close to the WMGHGs result of our scaled equilibrium PDRMIP output ( mm decade−1). In fact, the overlap of their probability density functions is 0.85, assuming a normal distribution. This comparison indicates that our methodology does not appear to be a large source of uncertainty in the current study, though response to other agents may not be as linear as those to WMGHGs (unfortunately, simulations are not currently available to evaluate other forcers and, given the enormous expense of running enough ensemble members to isolate the relatively small signals for individual aerosols, are unlikely to be anytime soon). Similar analyses were also performed for SLP and zonal winds, and again there is no appreciable difference between the historical transients and the scaled equilibrium responses. The consistent results suggest that the methodology works surprisingly well.
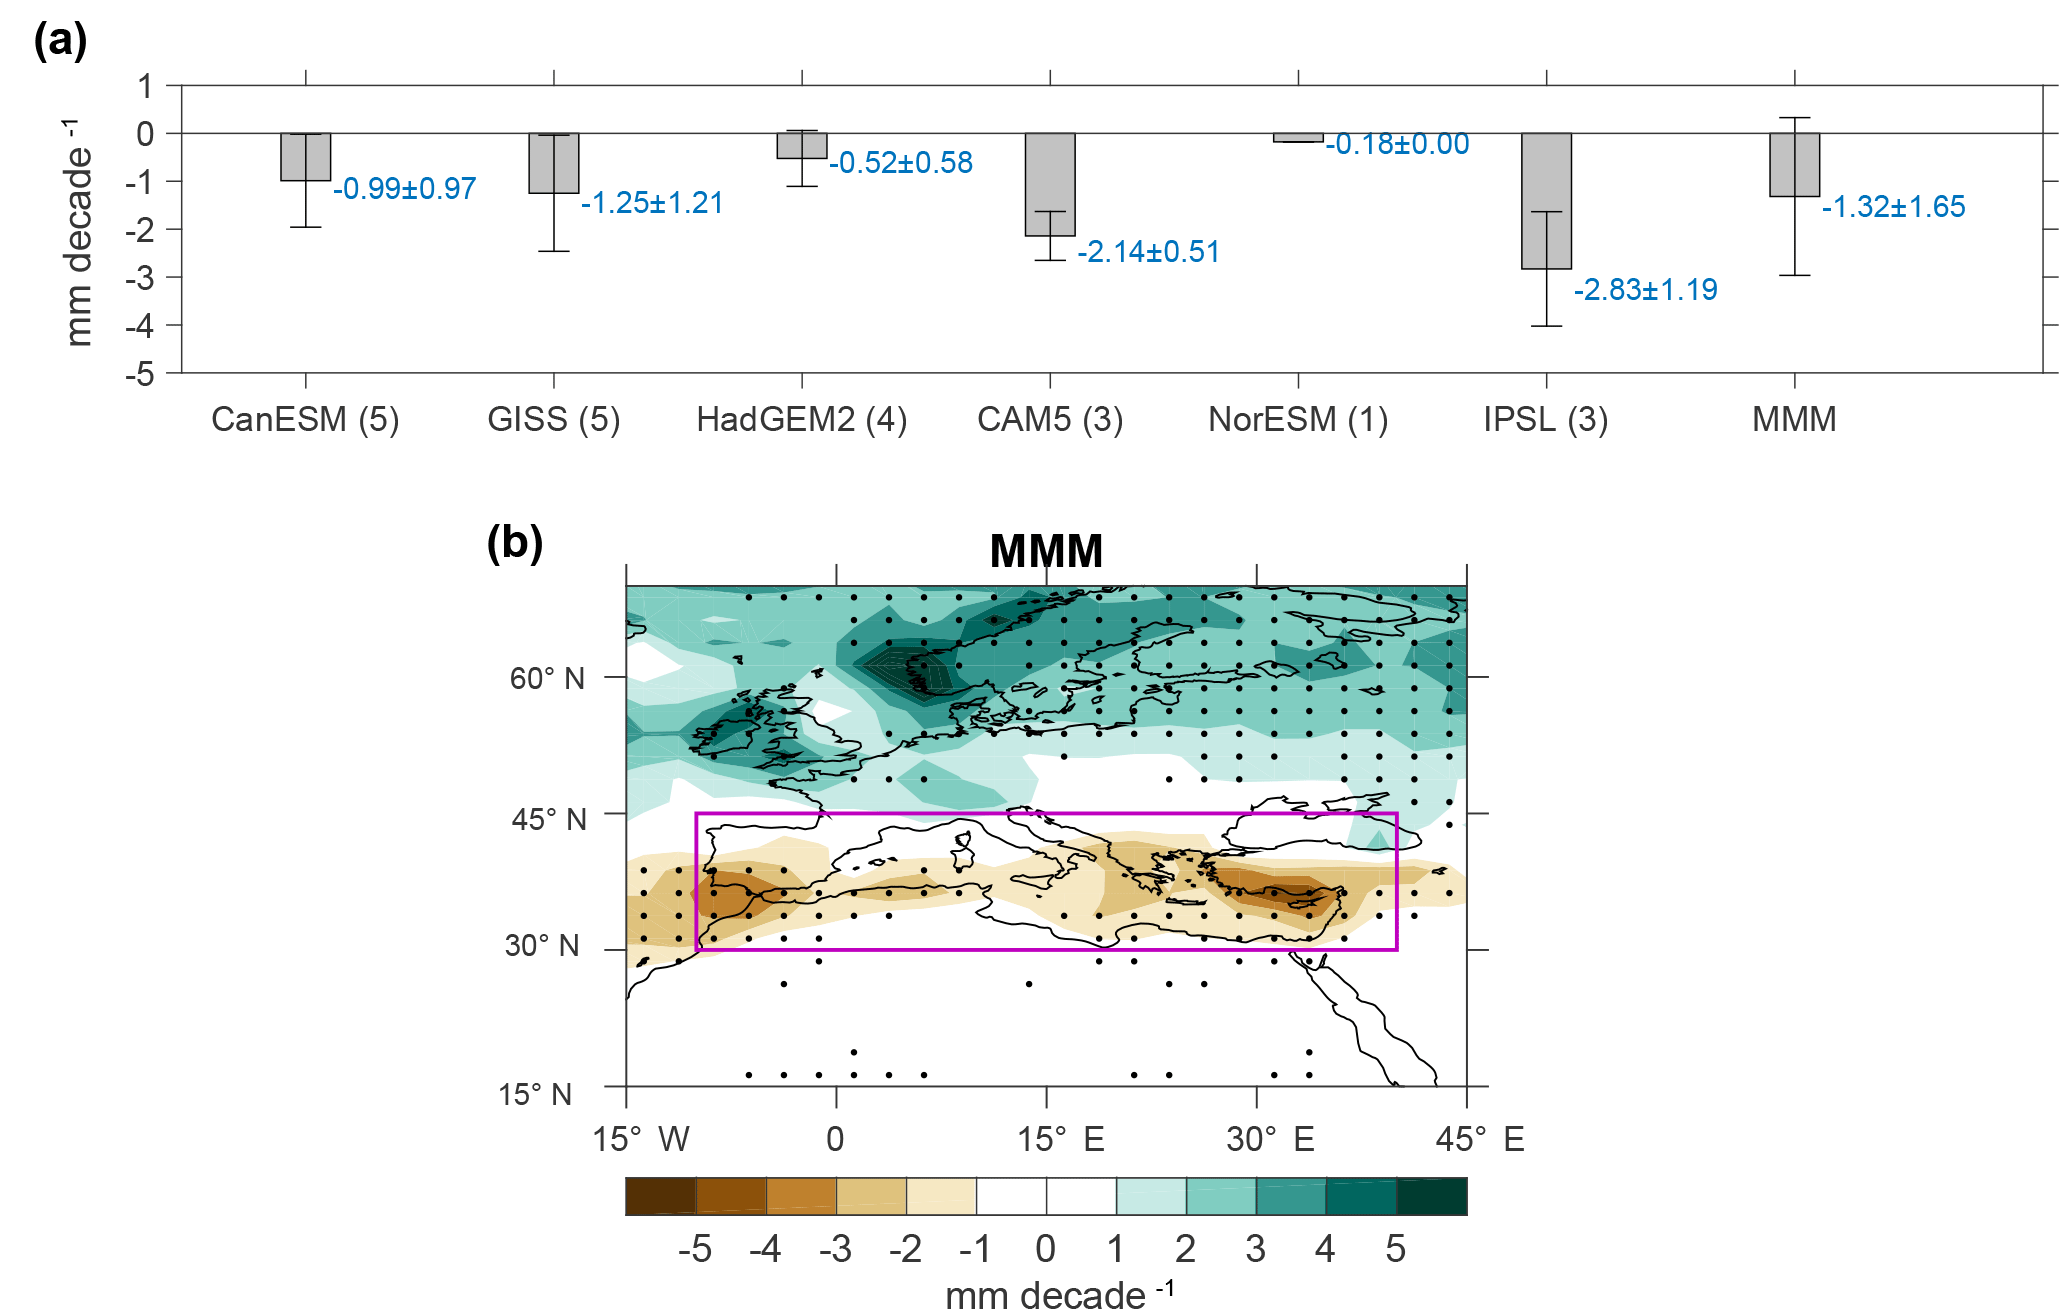
Figure 8Precipitation trends of CMIP5 “historicalGHG” simulations during 1901–2005; (a) domain-averaged (purple rectangles in Fig. 1) trends for each model. Error bars of each model indicate 90 % inter-ensemble spread and error bars of MMM indicate the 90 % inter-model spread. The numbers in parentheses indicate the ensembles collected for each model. (b) Spatial pattern of MMM value for the trends. Dots indicate that the change is significant at 0.95 confidence level.
In addition to the wet season, precipitation during the dry season (April–September) for the PDRMIP model was also analyzed. The modeled dry season precipitation trends, however, do not match the observations well (not shown). The modeled results also show a statistically strong drying trend while the observations do not show significant changes. Two possible reasons may be responsible for the apparent discrepancies. One is that only 30 % of the total precipitation occurs during the dry season (boreal summer months) and it is difficult to simulate the uneven distribution of infrequent rainfall events. The other is that there are large uncertainties in the observational data themselves. Unlike the wet season, in which nearly half of the grid boxes show statistically significant trends (Fig. 6b), almost none of the grid boxes show statistically significant trends in the dry season, undermining the robustness of the observational results.
The drying influence of WMGHGs will be more prominent in the future due to their projected continued growth. In contrast, many studies suggest that aerosol concentrations may decrease rapidly in the future due to air quality and climate policies along with their relatively short lifetime compared with WMGHGs (Andreae et al., 2005; Myhre et al., 2013b; Shindell et al., 2013). Reductions of BC could, to some extent, slow down the drying trend in the Mediterranean. Overall, a drier Mediterranean region is expected owing to increasing WMGHGs, but the pace of change in global BC emissions may substantially modify the drying rate in the short term.
Some limitations and uncertainties still exist in our current study. First, it is important to keep in mind that the case study in Sect. 4 is not a formal attribution analysis, despite the estimation of BC contribution. Our aim is to give a first grasp of the effects of aerosol on regional precipitation in the Mediterranean. Second, although our comparison of scaled equilibrium and unscaled transient simulations indicates that our methodology works well at least for WMGHGs, there is no systematic study so far exploring the linearity (or non-linearity) of the precipitation responses to BC or the linearity of responses to multiple versus individual forcings on regional scales. Third is that the ERF1901–2010 of BC represents direct effects only (Myhre et al., 2013b). Semidirect and indirect effects, however, are included in many of our PDRMIP models, and thus in ERFmodel. We did not include these effects in the scaling in this study for two reasons: first, the indirect effects of BC in the PDRMIP models do not include ice particles or internal cloud absorption (Jacobson, 2012) and are difficult to evaluate because BC concentrations were prescribed in several of the models so that they cannot interact fully with clouds, indicating that they are not fully resolved. Second, the net ERF1901–2010 of semidirect plus indirect effects is likely small (−0.1 to +0.2 W m−2) with a very large overall uncertainty range (−0.4 to +0.9 W m−2) (Bond et al., 2013). If the semidirect and indirect effects of BC (−0.1 to +0.2 W m−2) are considered in the scaling, the ΔPscaled of BC aerosol would be −0.44 to −0.87 mm decade−1 and still contribute a substantial part (25 to 40 %) to the drying. The situation is similar for sulfate aerosol, for which indirect effects are included in ERFmodel, but not in ERF1901–2010. We did not include indirect effects in our scaling as these were not attributed to individual aerosol species in the IPCC AR5 (Boucher et al., 2013). If the indirect effects are considered, the negative ERF1901–2010 could increase roughly by a factor of 2 (assuming indirect effects are largely associated with sulfate). However, the ΔPscaled of sulfate aerosol would still be very small compared with WMGHGs or BC, which would not impact our conclusions. As noted previously, the use of prescribed concentrations will also limit the ability of models to capture aerosol–cloud interactions realistically, affecting precipitation responses as well as ERF estimates. Since the responses do not obviously vary systematically between concentration-driven and emissions-driven models, such effects may be relatively small but merit future study. The final issue is related to the design of the model simulations. The perturbations are 5× or 10× present-day aerosol concentrations, which are time-invariant. The aerosols, however, have significant spatial and temporal variations. For instance, aerosol concentrations have been increasing in Asia continuously since 1950, but decreasing in Europe since the 1970s (Allen et al., 2013). As noted, further work is needed to determine how much of the Mediterranean trends result from local relative to remote forcing. To the extent that the trends are driven by remote forcing, the potential influence of such spatiotemporal variations will be small. This will be explored in future PDRMIP simulations.
Our analyses show that both WMGHGs and BC influence wet season Mediterranean rainfall by causing an enhanced positive SLP pattern similar to NAO–AO as well as by some local heating due to SW absorption. The SLP pattern is characterized by higher SLP in the North Atlantic and Mediterranean and lower SLP in the northern part of Europe, which diverts the jet stream and storm tracks further northward, reducing the precipitation in the Mediterranean and increasing precipitation in northern Europe. In contrast, global perturbations of the scattering aerosol SO4 have a negligible impact. The results from this study may have important implications on the management of regional water resources, agricultural practice, ecosystems, environment and economics, as well as social development and behavior in a warming climate. They also stress the importance of accounting for the aerosols (and generally short-lived forcers) for short-term (e.g., decadal) regional climate prediction.
All model results used for this study are available to the public through the Norwegian NORSRORE data storage facility.
The authors declare that they have no conflict of interest.
We thank the two reviewers
for their insightful comments. We also acknowledge the NASA High-End
Computing Program through the NASA Center for Climate Simulation at Goddard
Space Flight Center for computational resources to run the GISS-E2R model and
support from NASA GISS. PDRMIP is partly funded through the Norwegian
Research Council project NAPEX (project number 229778). Oliviér Boucher
acknowledges HPC resources from CCRT under the gencmip6 allocation provided
by GENCI (Grand Equipement National de Calcul Intensif). Piers M. Forster and
Thomas Richardson were supported by NERC grants NE/K007483/1 and
NE/N006038/1. Øivind Hodnebrog was partly funded through the Norwegian
Research Council project HYPRE (project no. 243942). Apostolos Voulgarakis
and Matthew Kasoar are supported by NERC under grant NE/K500872/1.
Simulations with HadGEM3-GA4 were performed using the MONSooN system supplied
under the Joint Weather and Climate Research Programme of the Met Office and
NERC. Dirk Olivié, Alf Kirkevåg and Trond Iversen were supported by
the Norwegian Research Council through the projects EVA (grant 229771),
EarthClim (207711/E10), NOTUR (nn2345k) and NorStore (ns2345k). Toshihiko
Takemura was supported by the supercomputer system of the National Institute
for Environmental Studies, Japan, the Environment Research and Technology
Development Fund (S-12-3) of the Ministry of the Environment, Japan, and JSPS
KAKENHI grant numbers 15H01728 and 15K12190. Computing resources for
CESM1-CAM5 (ark:/85065/d7wd3xhc) simulations were provided by the Climate
Simulation Laboratory at NCAR Computational and Information System
Laboratory, sponsored by the National Science Foundation and other
agencies.
Edited by: Maria Cristina Facchini
Reviewed by: two anonymous referees
Allan, R. and Ansell, T.: A new globally complete monthly historical gridded mean sea level pressure dataset (HadSLP2): 1850–2004, J. Climate, 19, 5816–5842, https://doi.org/10.1175/JCLI3937.1, 2006.
Allen, R. J. and Sherwood, S. C.: The impact of natural versus anthropogenic aerosols on atmospheric circulation in the community atmosphere model, Clim. Dynam., 36, 1959–1978, https://doi.org/10.1007/s00382-010-0898-8, 2011.
Allen, R. J., Norris, J., and Wild, M.: Evaluation of multidecadal variability in CMIP5 surface solar radiation and inferred underestimation of aerosol direct effects over Europe, China, Japan, and India, J. Geophys. Res.-Atmos., 118, 6311–6336, https://doi.org/10.1002/jgrd.50426, 2013.
Allen, R. J., Sherwood, S. C., Norris, J. R., and Zender, C. S.: Recent northern hemisphere tropical expansion primarily driven by black carbon and tropospheric ozone, Nature, 485, 350–354, https://doi.org/10.1038/nature11097, 2012.
Andreae, M. O., Jones, C. D., and Cox, P. M.: Strong present-day aerosol cooling implies a hot future, Nature, 435, 1187, https://doi.org/10.1038/nature03671, 2005.
Arora, V., Scinocca, J., Boer, G., Christian, J., Denman, K., Flato, G., Kharin, V., Lee, W., and Merryfield, W.: Carbon emission limits required to satisfy future representative concentration pathways of greenhouse gases, Geophys. Res. Lett., 38, L05805, https://doi.org/10.1029/2010GL046270, 2011.
Bangert, M., Nenes, A., Vogel, B., Vogel, H., Barahona, D., Karydis, V. A., Kumar, P., Kottmeier, C., and Blahak, U.: Saharan dust event impacts on cloud formation and radiation over Western Europe, Atmos. Chem. Phys., 12, 4045–4063, https://doi.org/10.5194/acp-12-4045-2012, 2012.
Bellouin, N., Rae, J., Jones, A., Johnson, C., Haywood, J., and Boucher, O.: Aerosol forcing in the climate model intercomparison project (CMIP5) simulations by HadGEM2-ES and the role of ammonium nitrate, J. Geophys. Res.-Atmos., 116, D20206, https://doi.org/10.1029/2011JD016074, 2011.
Bentsen, M., Bethke, I., Debernard, J. B., Iversen, T., Kirkevåg, A., Seland, Ø., Drange, H., Roelandt, C., Seierstad, I. A., Hoose, C., and Kristjánsson, J. E.: The Norwegian Earth System Model, NorESM1-M – Part 1: Description and basic evaluation of the physical climate, Geosci. Model Dev., 6, 687–720, https://doi.org/10.5194/gmd-6-687-2013, 2013.
Black, E., Brayshaw, D. J., and Rambeau, C. M.: Past, present and future precipitation in the middle east: Insights from models and observations, Philos. T. Roy. Soc. A., 368, 5173–5184, https://doi.org/10.1098/rsta.2010.0199, 2010.
Bond, T. C., Doherty, S. J., Fahey, D., Forster, P., Berntsen, T., DeAngelo, B., Flanner, M., Ghan, S., Kärcher, B., Koch, D., Kinne, S., Kondo, Y., Quinn, P. K., Sarofim, M. C., Schultz, M. G., Schulz, M., Venkataraman, C., Zhang, H., Zhang, S., Bellouin, N., Guttikunda, S. K., Hopke, P. K., Jacobson, M. Z., Kaiser, J. W., Klimont, Z., Lohmann, U., Schwarz, J. P., Shindell, D., Storelvmo, T., Warren, S. G., and Zender, C. S.: Bounding the role of black carbon in the climate system: A scientific assessment, J. Geophys. Res.-Atmos., 118, 5380–5552, 2013.
Boucher, O., Randall, D., Artaxo, P., Bretherton, C., Feingold, G., Forster, P., Kerminen, V.-M., Kondo, Y., Liao, H., Lohmann, U., Rasch, P., Satheesh, S. K., Sherwood, S., Stevens, B., and Zhang, X. Y.: Clouds and aerosols, in: Climate change 2013: the physical science basis, Contribution of Working Group I to the Fifth Assessment Report of the Intergovernmental Panel on Climate Change, edited by: Stoker, T. F., Qin, D., Plattner, G.-K., Tignor, M., Allen, S. K., Boschung, J., Nauels, A., Xia, Y., Bex, V., and Midgley, P. M., Cambridge University Press, Cambridge, UK and New York, USA, 2013.
Buffoni, L., Maugeri, M., and Nanni, T.: Precipitation in Italy from 1833 to 1996, Theor. Appl. Climatol., 63, 33–40, https://doi.org/10.1007/s007040050089, 1999.
Collins, M., Knutti, R., Arblaster, J., Dufresne, J.-L., Fichefet, T., Friedlingstein, P., Gao, X., Gutowski, W., Johns, T., Krinner, G., Shongwe, M., Tebaldi, C., Weaver, A., and Wehner, M.: Long-term climate change: Projections, commitments and irreversibility, in: Climate change 2013: The Physical Science Basis, Contribution of Working Group I to the Fifth Assessment Report of the Intergovernmental Panel on Climate Change, edited by: Stoker, T. F., Qin, D., Plattner, G.-K., Tignor, M., Allen, S. K., Boschung, J., Nauels, A., Xia, Y., Bex, V., and Midgley, P. M., Cambridge University Press, Cambridge, UK and New York, USA, 2013.
Collins, W. J., Bellouin, N., Doutriaux-Boucher, M., Gedney, N., Halloran, P., Hinton, T., Hughes, J., Jones, C. D., Joshi, M., Liddicoat, S., Martin, G., O'Connor, F., Rae, J., Senior, C., Sitch, S., Totterdell, I., Wiltshire, A., and Woodward, S.: Development and evaluation of an Earth-System model – HadGEM2, Geosci. Model Dev., 4, 1051–1075, https://doi.org/10.5194/gmd-4-1051-2011, 2011.
Dufresne, J.-L., Foujols, M.-A., Denvil, S., Caubel, A., Marti, O., Aumont, O., Balkanski, Y., Bekki, S., Bellenger, H., Benshila, R., Bony, S., Bopp, L., Braconnot, P., Brockmann, P., and Cadule, P.: Climate change projections using the IPSL-CM5 earth system model: From CMIP3 to CMIP5, Clim. Dynam., 40, 2123–2165, https://doi.org/10.1007/s00382-012-1636-1, 2013.
Dünkeloh, A. and Jacobeit, J.: Circulation dynamics of Mediterranean precipitation variability 1948–98, Int. J. Climatol., 23, 1843–1866, https://doi.org/10.1002/joc.973, 2003.
Dunstone, N., Smith, D., Booth, B., Hermanson, L., and Eade, R.: Anthropogenic aerosol forcing of atlantic tropical storms, Nat. Geosci., 6, 534–539, https://doi.org/10.1038/ngeo1854, 2013.
Flato, G., Marotzke, J., Abiodun, B., Braconnot, P., Chou, S.-C., Collins, W., Cox, P., Driouech, F., Emori, S., Eyring, V., Forest, C., Gleckler, P., Guilyardi, E., Jakob, C., Kattsov, V., Reason, C., and Rummukainen, M.: Evaluations of climate models, in: Climate change 2013: The Physical Science Basis, Contribution of Working Group I to the Fifth Assessment Report of the Intergovernmental Panel on Climate Change, edited by: Stoker, T. F., Qin, D., Plattner, G.-K., Tignor, M., Allen, S. K., Boschung, J., Nauels, A., Xia, Y., Bex, V., and Midgley, P. M., Cambridge University Press, Cambridge, UK and New York, USA, 2013.
Gent, P. R., Danabasoglu, G., Donner, L. J., Holland, M. M., Hunke, E. C., Jayne, S. R., Lawrence, D. M., Neale, R. B., Rasch, P. J., Vertenstein, M., Worley, P. H., Yang, Z., and Zhang, M.: The community climate system model version 4, J. Climate, 24, 4973–4991, https://doi.org/10.1175/2011JCLI4083.1, 2011.
Hartmann, D., Klein Tank, A., Rusticucci, M., Alexander, L., Brönnimann, S., Charabi, Y., Dentener, F., Dlugokencky, E., Easterling, D., Kaplan, A., Soden, B. J., Thorne, P. W., Wild, M., and Zhai, P. M.: Observations: Atmosphere and surface, in: Climate change 2013: The Physical Science Basis, Contribution of Working Group I to the Fifth Assessment Report of the Intergovernmental Panel on Climate Change, edited by: Stoker, T. F., Qin, D., Plattner, G.-K., Tignor, M., Allen, S. K., Boschung, J., Nauels, A., Xia, Y., Bex, V., and Midgley, P. M., Cambridge University Press, Cambridge, UK and New York, USA, 2013.
Hodnebrog, Ø., Myhre, G., Forster, P. M., Sillmann, J., and Samset, B. H.: Local biomass burning is a dominant cause of the observed precipitation reduction in southern Africa, Nat. Commun., 7, 11236, https://doi.org/10.1038/ncomms11236, 2016.
Hurrell, J. W., Kushnir, Y., and Visbeck, M.: The north Atlantic oscillation, Science, 291, 603–605, https://doi.org/10.1126/science.1058761, 2001.
Hurrell, J. W., Holland, M. M., Gent, P. R., Ghan, S., Kay, J. E., Kushner, P. J., Lamarque, J.-F., Large, W. G., Lawrence, D., Lindsay, K., Lipscomb, W., Long, M., Mahowald, N., Marsh, D., Neale, R., Rasch, P., Vavrus, S., Vertenstein, M., Bader, D., Collions, W., Hack, J., Kiehl, J., and Marshall, S.: The community earth system model: A framework for collaborative research, B. Am. Meteorol. Soc., 94, 1339–1360, https://doi.org/10.1175/BAMS-D-12-00121.1, 2013.
Iversen, T., Bentsen, M., Bethke, I., Debernard, J. B., Kirkevåg, A., Seland, Ø., Drange, H., Kristjansson, J. E., Medhaug, I., Sand, M., and Seierstad, I. A.: The Norwegian Earth System Model, NorESM1-M – Part 2: Climate response and scenario projections, Geosci. Model Dev., 6, 389–415, https://doi.org/10.5194/gmd-6-389-2013, 2013.
Jacobson, M. Z.: Investigating cloud absorption effects: Global absorption properties of black carbon, tar balls, and soil dust in clouds and aerosols, J. Geophys. Res.-Atmos., 117, D06205, https://doi.org/10.1029/2011JD017218, 2012.
Jacobson, M. Z. and Kaufman, Y. J.: Wind reduction by aerosol particles, Geophys. Res. Lett., 33, L24814, https://doi.org/10.1029/2006GL027838, 2006.
Johanson, C. M. and Fu, Q.: Hadley cell widening: Model simulations versus observations, J. Climate, 22, 2713–2725, https://doi.org/10.1175/2008JCLI2620.1, 2009.
Kalnay, E., Kanamitsu, M., Kistler, R., Collins, W., Deaven, D., Gandin, L., Iredell, M., Saha, S., White, G., Woollen, J., Zhu, Y., Chelliah, M., Ebisuzaki, W., Higgins, W., Janowiak, J., Mo, K. C., Ropelewski, C., Wang, J., Leetmaa, A., Reynolds, R., Jenne, R., and Joseph, D.: The NCEP/NCAR 40-year reanalysis project, B. Am. Meteorol. Soc., 77, 437–471, https://doi.org/10.1175/1520-0477(1996)077<0437:TNYRP>2.0.CO;2, 1996.
Kaufman, Y. J., Tanré, D., and Boucher, O.: A satellite view of aerosols in the climate system, Nature, 419, 215–223, https://doi.org/10.1038/nature01091, 2002.
Kay, J., Deser, C., Phillips, A., Mai, A., Hannay, C., Strand, G., Arblaster, J., Bates, S., Danabasoglu, G., Edwards, J., Holland, M., Kushner, P., Lamarque, J., Lawrence, D., Lindsay, K., Middleton, A., Munoz, E., Neale, R., Oleson, K., Polvani, L., and Vertenstein, M.: The community earth system model (CESM) large ensemble project: A community resource for studying climate change in the presence of internal climate variability, B. Am. Meteorol. Soc., 96, 1333–1349, https://doi.org/10.1175/BAMS-D-13-00255.1, 2015.
Kirkevåg, A., Iversen, T., Seland, Ø., Hoose, C., Kristjánsson, J. E., Struthers, H., Ekman, A. M. L., Ghan, S., Griesfeller, J., Nilsson, E. D., and Schulz, M.: Aerosol-climate interactions in the Norwegian Earth System Model – NorESM1-M, Geosci. Model Dev., 6, 207–244, https://doi.org/10.5194/gmd-6-207-2013, 2013.
Koren, I., Altaratz, O., Remer, L. A., Feingold, G., Martins, J. V., and Heiblum, R. H.: Aerosol-induced intensification of rain from the tropics to the mid-latitudes, Nat. Geosci., 5, 118–122, https://doi.org/10.1038/ngeo1364, 2012.
Kottek, M., Grieser, J., Beck, C., Rudolf, B., and Rubel, F.: World map of the Köppen-Geiger climate classification updated, Meteorol. Z., 15, 259–263, https://doi.org/10.1127/0941-2948/2006/0130, 2006.
Krichak, S. O. and Alpert, P.: Decadal trends in the east atlantic–west russia pattern and Mediterranean precipitation, Int. J. Climatol., 25, 183–192, https://doi.org/10.1002/joc.1124, 2005.
Kvalevåg, M. M., Samset, B. H., and Myhre, G.: Hydrological sensitivity to greenhouse gases and aerosols in a global climate model, Geophys. Res. Lett., 40, 1432–1438, https://doi.org/10.1002/grl.50318, 2013.
Liu, L., Shawki, D., Voulgarakis, A., Kasoar, M., Samset, B., Myhre, G., Forster, P., Hodnebrog, Ø., Sillmann, J., Aalbergsjø, S., T, A., Boucher, O., Faluvegi, G., Iversen, T., Kirkevåg, A., Lamarque, J.-F., Olivieì, D., Richardson, T., Shindell, D., Shine, K., Stjern, C., and Takemura, T.: A PDRMIP multi-model study on the impacts of regional aerosol forcings on global and regional precipitation, J. Climate, 31, 4429–4447, https://doi.org/10.1175/JCLI-D-17-0439.1, 2018.
Lorenz, E. N.: Seasonal and irregular variations of the northern hemisphere sea-level pressure profile, J. Meteorol., 8, 52–59, https://doi.org/10.1175/1520-0469(1951)008<0052:SAIVOT>2.0.CO;2, 1951.
Mariotti, A., Struglia, M. V., Zeng, N., and Lau, K.: The hydrological cycle in the Mediterranean region and implications for the water budget of the Mediterranean sea, J. Climate, 15, 1674–1690, https://doi.org/10.1175/1520-0442(2002)015<1674:THCITM>2.0.CO;2, 2002.
Meehl, G. A., Arblaster, J. M., and Collins, W. D.: Effects of black carbon aerosols on the Indian monsoon, J. Climate, 21, 2869–2882, https://doi.org/10.1175/2007JCLI1777.1, 2008.
Menon, S., Hansen, J., Nazarenko, L., and Luo, Y.: Climate effects of black carbon aerosols in China and India, Science, 297, 2250–2253, https://doi.org/10.1126/science.1075159, 2002.
Muller, C. and O'Gorman, P.: An energetic perspective on the regional response of precipitation to climate change, Nat. Clim. Change, 1, 266–271, https://doi.org/10.1038/NCLIMATE1169, 2011.
Myhre, G., Samset, B. H., Schulz, M., Balkanski, Y., Bauer, S., Berntsen, T. K., Bian, H., Bellouin, N., Chin, M., Diehl, T., Easter, R. C., Feichter, J., Ghan, S. J., Hauglustaine, D., Iversen, T., Kinne, S., Kirkevåg, A., Lamarque, J.-F., Lin, G., Liu, X., Lund, M. T., Luo, G., Ma, X., van Noije, T., Penner, J. E., Rasch, P. J., Ruiz, A., Seland, Ø., Skeie, R. B., Stier, P., Takemura, T., Tsigaridis, K., Wang, P., Wang, Z., Xu, L., Yu, H., Yu, F., Yoon, J.-H., Zhang, K., Zhang, H., and Zhou, C.: Radiative forcing of the direct aerosol effect from AeroCom Phase II simulations, Atmos. Chem. Phys., 13, 1853–1877, https://doi.org/10.5194/acp-13-1853-2013, 2013a.
Myhre, G., Shindell, D., Bréon, F.-M., Collins, W., Fuglestvedt, J., Huang, J., Koch, D., Lamarque, J.-F., Lee, D., Mendoza, B., Nakajima, T., Robock, A., Stephens, G., Takemura, T., and Zhang, H.: Anthropogenic and natural radiative forcing, in: Climate change 2013: The Physical Science Basis, Contribution of Working Group I to the Fifth Assessment Report of the Intergovernmental Panel on Climate Change, edited by: Stoker, T. F., Qin, D., Plattner, G.-K., Tignor, M., Allen, S. K., Boschung, J., Nauels, A., Xia, Y., Bex, V., and Midgley, P. M., Cambridge University Press, Cambridge, UK and New York, USA, 2013b.
Myhre, G., Forster, P., Samset, B., Hodnebrog, Ø., Sillmann, J., Aalbergsjø, S., Andrews, T., Boucher, O., Faluvegi, G., and Fläschner, D.: PDRMIP: A precipitation driver and response model intercomparison project, protocol and preliminary results, B. Am. Meteorol. Soc., 98, 1185–198, https://doi.org/10.1175/BAMS-D-16-0019.1, 2017.
Nabat, P., Somot, S., Mallet, M., Sanchez-Lorenzo, A., and Wild, M.: Contribution of anthropogenic sulfate aerosols to the changing Euro-Mediterranean climate since 1980, Geophys. Res. Lett., 41, 5605–5611. https://doi.org/10.1002/2014GL060798, 2014.
Neale, R. B., Chen, C.-C., Gettelman, A., Lauritzen, P. H., Park, S., Williamson, D. L., Conley, A. J., Garcia, R., Kinnison, D., and Lamarque, J.-F.: Description of the ncar community atmosphere model (CAM 4.0), available at: https://www.ccsm.ucar.edu/models/ccsm4.0/cam/docs/description/cam4_desc.pdf (last access: 12 June 2018), 2010.
Otto-Bliesner, B. L., Brady, E. C., Fasullo, J., Jahn, A., Landrum, L., Stevenson, S., Rosenbloom, N., Mai, A., and Strand, G.: Climate variability and change since 850 CE: An ensemble approach with the community earth system model, B. Am. Meteorol. Soc., 97, 735–754, https://doi.org/10.1175/BAMS-D-14-00233.1, 2016.
Piervitali, E., Colacino, M., and Conte, M.: Rainfall over the central-western Mediterranean basin in the period 1951–1995, Part I: Precipitation trends, Nuovo Cimento, 21, 331–344, 1998.
Quadrelli, R., Pavan, V., and Molteni, F.: Wintertime variability of Mediterranean precipitation and its links with large-scale circulation anomalies, Clim. Dynam., 17, 457–466, https://doi.org/10.1007/s003820000121, 2001.
Ramanathan, V. and Carmichael, G.: Global and regional climate changes due to black carbon, Nat. Geosci., 1, 221–227, https://doi.org/10.1038/ngeo156, 2008.
Ramanathan, V., Crutzen, P. J., Kiehl, J. T., and Rosenfeld, D.: Aerosols, climate, and the hydrological cycle, Science, 294, 2119–2124, https://doi.org/10.1126/science.1064034, 2001.
Richardson, T., Forster, P., Andrews, T., Boucher, O., Faluvegi, G., Fläschner, D., Kasoar, M., Kirkevåg, A., Lamarque, J. F., Myhre, G., Olivieì, D., Samset, B., Shawki, D., Shindell, D., Takemura, T., and Voulgarakis, A.: Carbon dioxide physiological forcing dominates projected eastern amazonian drying, Geophys. Res. Lett., 45, 2815–2825, https://doi.org/10.1002/2017GL076520, 2018.
Samset, B., Myhre, G., Forster, P., Hodnebrog, Ø., Andrews, T., Faluvegi, G., Flaeschner, D., Kasoar, M., Kharin, V., and Kirkevåg, A.: Fast and slow precipitation responses to individual climate forcers: A PDRMIP multi-model study, Geophys. Res. Lett., 43, 2782–2791, https://doi.org/10.1002/2016GL068064, 2016.
Samset, B. H., Myhre, G., Forster, P., Hodnebrog, Ø., Andrews, T., Boucher, O., Faluvegi, G., Fläschner, D., Kasoar, M., Kharin, V., Kirkevåg, A., Lamarque, J.-F., Olivieì, D., Richardson, T., Shindell, D., Takemura, T., and Voulgarakis, A.: Weak hydrological sensitivity to temperature change over land, independent of climate forcing, npj Climat. Sci., 1, 3, https://doi.org/10.1038/s41612-017-0005-5, 2018.
Schmidt, G. A., Kelley, M., Nazarenko, L., Ruedy, R., Russell, G. L., Aleinov, I., Bauer, M., Bauer, S. E., Bhat, M. K., Bleck, R., Canuto, V., Chen, Y.-H., Cheng, Y., Clune, T. L., Genio, A. D., Fainchtein, R. D., Faluvegi, G., Hansen, J. E., Healy, R. J., Kiang, N. Y., Koch, D., Lacis, A. A., Legrande, A. N., Lerner, J., Lo, K. K., Matthews, E. E., Menon, S., Miller, R. L., Oinas, V., Oloso, A. O., Perlwitz, J. P., Puma, M. J., Putman, W. M., Rind, D., Romanou, A., Sato, M., Shindell, D., Sun, S., Syed, R., Tausnev, N., Tsigaridis, K., Unger, N., Voulgarakis, A., Yao, M.-S., and Zhang, J.: Configuration and assessment of the GISS modele2 contributions to the CMIP5 archive, J. Adv. Model. Earth Sy., 6, 141–184, https://doi.org/10.1002/2013MS000265, 2014.
Schneider, U., Becker, A., Finger, P., Meyer-Christoffer, A., Rudolf, B., and Ziese, M.: GPCC full data reanalysis version 6.0 at 2.5∘: Monthly land-surface precipitation from rain-gauges built on GTS-based and historic data, https://doi.org/10.5676/DWD_GPCC/FD_M_V7_250, 2011.
Shindell, D. and Faluvegi, G.: Climate response to regional radiative forcing during the twentieth century, Nat. Geosci., 2, 294–300, https://doi.org/10.1038/ngeo473, 2009.
Shindell, D. T., Schmidt, G. A., Miller, R. L., and Rind, D.: Northern hemisphere winter climate response to greenhouse gas, ozone, solar, and volcanic forcing, J. Geophys. Res.-Atmos, 106, 7193–7210, https://doi.org/10.1029/2000JD900547, 2001.
Shindell, D. T., Voulgarakis, A., Faluvegi, G., and Milly, G.: Precipitation response to regional radiative forcing, Atmos. Chem. Phys., 12, 6969–6982, https://doi.org/10.5194/acp-12-6969-2012, 2012.
Shindell, D. T., Lamarque, J.-F., Schulz, M., Flanner, M., Jiao, C., Chin, M., Young, P. J., Lee, Y. H., Rotstayn, L., Mahowald, N., Milly, G., Faluvegi, G., Balkanski, Y., Collins, W. J., Conley, A. J., Dalsoren, S., Easter, R., Ghan, S., Horowitz, L., Liu, X., Myhre, G., Nagashima, T., Naik, V., Rumbold, S. T., Skeie, R., Sudo, K., Szopa, S., Takemura, T., Voulgarakis, A., Yoon, J.-H., and Lo, F.: Radiative forcing in the ACCMIP historical and future climate simulations, Atmos. Chem. Phys., 13, 2939–2974, https://doi.org/10.5194/acp-13-2939-2013, 2013.
Stevens, B. and Feingold, G.: Untangling aerosol effects on clouds and precipitation in a buffered system, Nature, 461, 607–613, https://doi.org/10.1038/nature08281, 2009.
Stjern, C. W., Samset, B. H., Myhre, G., Forster, P. M., Hodnebrog, Ø., Andrews, T., Boucher, O., Faluvegi, G., Iversen, T., Kasoar, M., Kharin, V., Kirkevåg, A., Lamarque, J.-F., Olivieì, D., Richardson, T., Shawki, D., Shindell, D., Smith, C., Takemura, T., and Voulgarakis, A.: Rapid adjustments cause weak surface temperature response to increased black carbon concentrations, J. Geophys. Res.-Atmos., 122, 11462–11481, https://doi.org/10.1002/2017JD027326, 2017.
Takahashi, C. and Watanabe, M.: Pacific trade winds accelerated by aerosol forcing over the past two decades, Nat. Clim. Change, 6, 768, https://doi.org/10.1038/nclimate2996, 2016.
Takemura, T., Nozawa, T., Emori, S., Nakajima, T. Y., and Nakajima, T.: Simulation of climate response to aerosol direct and indirect effects with aerosol transport-radiation model, J. Geophys. Res.-Atmos., 110, D02202, https://doi.org/10.1029/2004JD005029, 2005.
Takemura, T., Egashira, M., Matsuzawa, K., Ichijo, H., O'shi, R., and Abe-Ouchi, A.: A simulation of the global distribution and radiative forcing of soil dust aerosols at the Last Glacial Maximum, Atmos. Chem. Phys., 9, 3061–3073, https://doi.org/10.5194/acp-9-3061-2009, 2009.
Taylor, K. E., Stouffer, R. J., and Meehl, G. A.: An overview of CMIP5 and the experiment design, B. Am. Meteorol. Soc., 93, 485–498, https://doi.org/10.1175/BAMS-D-11-00094.1, 2012.
Walters, D. N., Williams, K. D., Boutle, I. A., Bushell, A. C., Edwards, J. M., Field, P. R., Lock, A. P., Morcrette, C. J., Stratton, R. A., Wilkinson, J. M., Willett, M. R., Bellouin, N., Bodas-Salcedo, A., Brooks, M. E., Copsey, D., Earnshaw, P. D., Hardiman, S. C., Harris, C. M., Levine, R. C., MacLachlan, C., Manners, J. C., Martin, G. M., Milton, S. F., Palmer, M. D., Roberts, M. J., Rodríguez, J. M., Tennant, W. J., and Vidale, P. L.: The Met Office Unified Model Global Atmosphere 4.0 and JULES Global Land 4.0 configurations, Geosci. Model Dev., 7, 361–386, https://doi.org/10.5194/gmd-7-361-2014, 2014.
Watanabe, M., Suzuki, T., O'ishi, R., Komuro, Y., Watanabe, S., Emori, S., Takemura, T., Chikira, M., Ogura, T., Sekiguchi, M., Takata, K., Yamazaki, D., Yokohata, T., Nozawa, T., Hasumi, H., Tatebe, H., and Kimoto, M.: Improved climate simulation by MIROC5: Mean states, variability, and climate sensitivity, J. Climate, 23, 6312–6335, https://doi.org/10.1175/2010JCLI3679.1, 2010.
Worley, S. J., Woodruff, S. D., Reynolds, R. W., Lubker, S. J., and Lott, N.: ICOADS release 2.1 data and products, Int. J. Climatol., 25, 823–842, https://doi.org/10.1002/joc.1166, 2005.
Xoplaki, E., Gonzalez-Rouco, J. F., Luterbacher, J., and Wanner, H.: Wet season Mediterranean precipitation variability: Influence of large-scale dynamics and trends, Clim. Dynam., 23, 63–78, https://doi.org/10.1007/s00382-004-0422-0, 2004.