the Creative Commons Attribution 3.0 License.
the Creative Commons Attribution 3.0 License.
Vertical distributions of N2O isotopocules in the equatorial stratosphere
Sakae Toyoda
Naohiro Yoshida
Shinji Morimoto
Shuji Aoki
Takakiyo Nakazawa
Satoshi Sugawara
Shigeyuki Ishidoya
Mitsuo Uematsu
Yoichi Inai
Fumio Hasebe
Chusaku Ikeda
Hideyuki Honda
Kentaro Ishijima
Vertical profiles of nitrous oxide (N2O) and its isotopocules, isotopically substituted molecules, were obtained over the Equator at altitudes of 16–30 km. Whole air samples were collected using newly developed balloon-borne compact cryogenic samplers over the eastern equatorial Pacific in 2012 and Biak Island, Indonesia, in 2015. They were examined in the laboratory using gas chromatography and mass spectrometry. The mixing ratio and isotopocule ratios of N2O in the equatorial stratosphere showed a weaker vertical gradient than the previously reported profiles in the subtropical and mid-latitude and high-latitude stratosphere. From the relation between the mixing ratio and isotopocule ratios, further distinct characteristics were found over the Equator: (1) observed isotopocule fractionations (ε values) in the middle stratosphere (25–30 km or [N2O] < ca. 260 nmol mol−1) are almost equal to ε values reported from broadband photolysis experiments conducted in the laboratory; (2) ε values in the lower stratosphere (< ca. 25 km or [N2O] > ca. 260 nmol mol−1) are about half of the experimentally obtained values, being slightly larger than those observed in the mid-latitude and high-latitude lower stratosphere ([N2O] > ca. 170 nmol mol−1). These results from the deep tropics suggest the following. (i) The timescale for quasi-horizontal mixing between tropical and mid-latitude air in the tropical middle stratosphere is sufficiently slow relative to the tropical upwelling rate that isotope fractionation approaches the Rayleigh limit for N2O photolysis. (ii) The air in the tropical lower stratosphere is exchanged with extratropical air on a timescale that is shorter than that of photochemical decomposition of N2O. Previously observed ε values, which are invariably smaller than those of photolysis, can be explained qualitatively using a three-dimensional chemical transport model and using a simple model that assumes mixing of “aged” tropical air and extratropical air during residual circulation. Results show that isotopocule ratios are useful to examine the stratospheric transport scheme deduced from tracer–tracer relations.
- Article
(6757 KB) - Full-text XML
-
Supplement
(1431 KB) - BibTeX
- EndNote


Nitrous oxide (N2O) is a potent greenhouse gas and stratospheric ozone-depleting substance emitted from various sources on the Earth surface. It is injected into the stratosphere in tropical upwelling regions. In the stratosphere, it is transported meridionally by the Brewer–Dobson circulation and is decomposed by photolysis (Eq. 1) and photooxidation (Eq. 2) with approximate shares of 90 and 10 %, respectively (Minschwaner et al., 1993).
Mixing ratios of trace gases such as N2O and their interrelationships are regarded as useful tools to establish a detailed picture of stratospheric circulation (Plumb, 2007), and previous observations showed compact tracer relationships that depend on the latitude (e.g., Michelsen et al., 1998). Natural abundance ratios of N2O isotopocules, molecular species that only differ in either the number or position of isotopic substitutions (Coplen, 2011), are useful tracers for elucidating the sources and physicochemical records of N2O because isotopocule ratios reflect the isotopic compositions of source materials; isotope effects specific to each chemical and physical process relevant to formation, transport, and decomposition of N2O; and mixing of various air and water masses (Toyoda et al., 2017). In the context of stratospheric distribution, isotopocule ratios are unique in their ability to provide the degree of photochemical decomposition and the relative importance of the above-mentioned two decomposition pathways (Toyoda et al., 2001; Röckmann et al., 2001).
Stratospheric distributions of N2O isotopocules have been studied using scientific balloons and aircraft. For balloon observations, (a) whole air samples are collected using cryogenic samplers and are evaluated using isotope ratio monitoring mass spectrometry (IRMS) (Kim and Craig, 1993; Rahn and Wahlen, 1997; Röckmann et al., 2001; Toyoda et al., 2001, 2004; Kaiser et al., 2006); alternatively, (b) remote measurements are conducted using Fourier-transform infrared spectrometry (Griffith et al., 2000). Such observations have revealed vertical profiles up to 35 km altitude. For aircraft observations, whole air samples are collected using pressurizing pumps, with subsequent evaluation by IRMS (Rahn and Wahlen, 1997; Park et al., 2004; Kaiser et al., 2006). Although these observations are limited to up to ca. 20 km altitude, mean vertical profiles can be obtained from horizontally extended areas such as Arctic polar vortexes.
Earlier studies showed that a decrease in the mixing ratio of N2O with altitude is accompanied by enrichment of isotopocules of N2O heavier than the major one (14N14N16O) (Kim and Craig, 1993; Rahn and Wahlen, 1997). The results were consistent with the expected isotopocule fractionation during photolysis (Yung and Miller, 1997), but the apparent degrees of fractionation (isotopic fractionation, ε) differed between those of the lower (< 20–25 km where N2O mixing ratio > 180–250 nmol mol−1) and middle (> 20–25 km or < 180–250 nmol mol−1) stratosphere (Toyoda et al., 2001; Röckmann et al., 2001; Kaiser et al., 2006; Park et al., 2004). They are always smaller than fractionations obtained from laboratory photolysis experiments (Röckmann et al., 2000; Turatti et al., 2000; Zhang et al., 2000; Kaiser et al., 2002b, 2003) or absorption spectra (von Hessberg et al., 2004). Moreover, the values of ε for the middle stratosphere were found to depend on the latitude and season (Toyoda et al., 2004; Kaiser et al., 2006; Park et al., 2004). Such variation has been regarded as a result of photochemical and transport processes (McLinden et al., 2003; Park et al., 2004; Kaiser et al., 2006), but it has not been fully examined because of the lack of measurements taken over the tropical upwelling regions. As noted above, the tropical stratosphere is the starting point of the meridional transport of N2O injected from the troposphere and the rates of photochemical reactions are faster than those in the extratropics because of stronger actinic flux. Although there are a few reports on vertical profiles of N2O isotopocules over India (18∘ N) (Röckmann et al., 2001; Kaiser et al., 2006), the isotopic composition of N2O in upwelling tropical air has not been characterized.
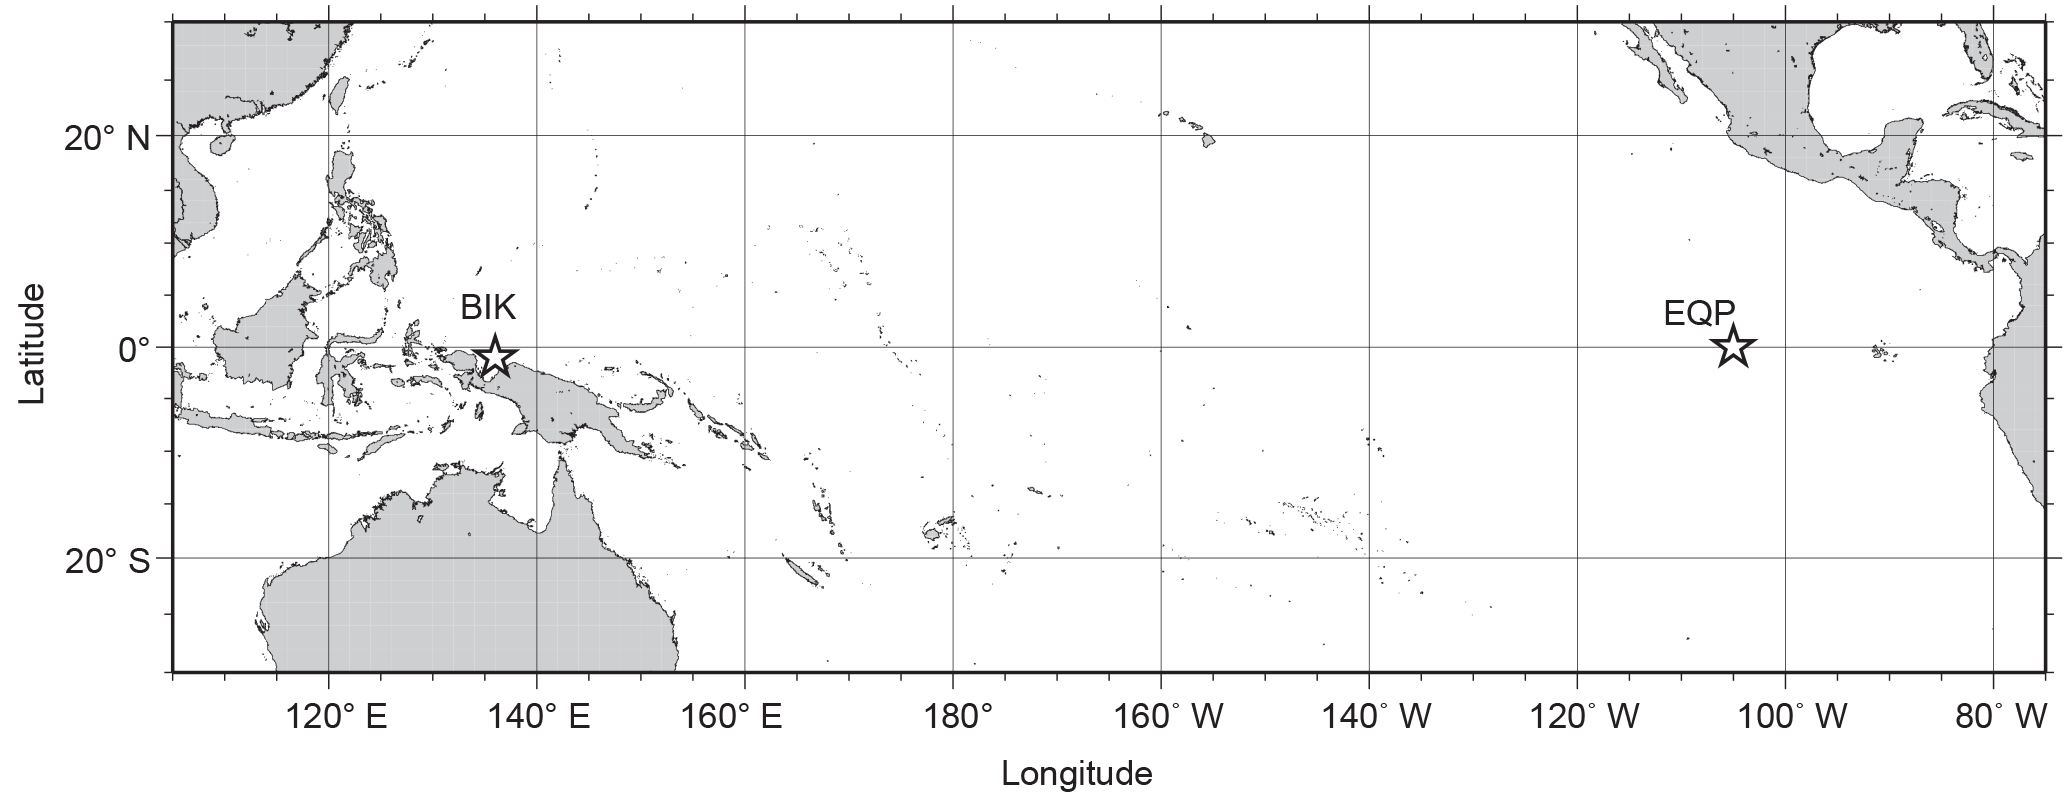
Figure 1Map showing balloon launching sites. EQP, eastern equatorial Pacific; BIK, Biak Island, Indonesia.
Another controversial problem about the stratospheric N2O is whether the photooxidation sink (Eq. 2) has a larger contribution than 10 % in the lower stratosphere. Kaiser et al. (2002a) found that the ratios of fractionations of isotopocules during photolysis and photooxidation are distinct and they estimated that a much larger fraction (up to 100 %) is removed by photooxidation at least in the lower stratosphere (N2O mixing ratios > 300 nmol mol−1) (Kaiser et al., 2006). However, similar but a little simplified analyses by Park et al. (2004) and Toyoda et al. (2004) (see Sect. 3.4) could not detect significant differences in the isotopic fractionation ratios between the lower and middle stratosphere, and Park et al. (2004) speculated that the isotopic fractionation ratios could be affected not only by the relative share of the two sink pathways but also by other factors such as transport.
This study was conducted to ascertain the vertical profiles of N2O and its isotopocules over the Equator and to examine the factors that control the apparent isotopic fractionation in the stratosphere by comparing results from earlier studies and three-dimensional chemical transport model simulation.
2.1 Whole air sampling over the Equator
Stratospheric air samples were collected using balloon-borne compact cryogenic samplers (J-T samplers) (Morimoto et al., 2009). The sampler consists of an evacuated 800 cm3 stainless steel sample flask (SUS304), a cooling device called a Joule–Thomson (J-T) mini cooler, a 2 L high-pressure neon gas cylinder, pneumatic valves, solenoid valves, a 100 cm3 high-pressure N2 gas cylinder for actuation of pneumatic valves, an electronic controller with a GPS receiver, a telemetry transmitter, and batteries. The J-T mini cooler can produce liquid neon from high-pressure neon gas that is pre-cooled by liquid nitrogen. The liquid neon is used as refrigerant to solidify or liquefy the stratospheric air. Contrasted against the larger sampling system used in our previous observations, which was about 250 kg with 12 sample flasks in a Dewar flask filled with liquid helium, the J-T sampler weighs ca. 20 kg, with operational and logistic advantages at remote sites such as remote islands or polar regions.
Sampling over the eastern equatorial Pacific (0∘ N, 105–115∘ W) was conducted on 4, 5, 7, and 8 February 2012 during the KH-12-1 cruise of R/V Hakuho-maru, JAMSTEC as a part of the Equatorial Pacific Ocean and Stratospheric/Tropospheric Atmosphere Study Program. For each balloon flight, a 5–8 L volume STP of air sample was collected by a single sampler at programmed altitude between 19 and 29 km. The sampler then descended by parachute. It was later recovered on the sea.
Another sampling campaign was conducted at Biak Island, Indonesia (1∘ S, 136∘ E), on 22, 24, 26, and 28 February 2015 as part of a small size project by ISAS/JAXA (Hasebe et al., 2018). For each balloon flight, two samplers integrated into a single gondola were launched from the observatory of the National Institute of Aeronautics and Space of the Republic of Indonesia (LAPAN). Samples were collected at two altitudes. In total, we obtained seven samples: two samples on each of four flights, with one sampling failed.
Locations of launching sites are shown in Fig. 1. Balloon trajectories are portrayed in Fig. S2 in the Supplement. Sampling was conducted while the balloon was ascending, except for the flight on 5 February 2012. Typical altitude range was about 2 km, and we took the central value of the range as sampling altitude.
2.2 Analysis of mixing ratio and isotopocule ratios
At Tohoku University, the mixing ratio of N2O was measured using gas chromatography with electron capture detection (GC-ECD) with precision of 1 nmol mol−1 (Ishijima et al., 2001). The isotopocule ratios, defined as follows, were measured at Tokyo Institute of Technology using gas chromatography – isotope ratio mass spectrometry (Toyoda et al., 2004; Toyoda and Yoshida, 2016).
Therein, X denotes 15Nα, 15Nβ, or 18O, and where R denotes 14N15N16O∕14N14N16O, 15N14N16O∕14N14N16O, or 14N14N18O∕14N14N16O of the sample and standards (Toyoda and Yoshida, 1999). The δ value is expressed as the per mill (‰) deviation relative to atmospheric N2, and Vienna Standard Mean Ocean Water (VSMOW), respectively, for nitrogen and oxygen. In addition to δ15Nα and δ15Nβ, the δ value for bulk N and 15N-site preference (SP) are often used as illustrative parameters:
Duplicate analyses were made for a set of two runs: monitoring of molecular ion for determination of δ15Nbulk and δ18O and NO+ fragment ion for determination of δ15Nα. A 300–400 cm3 STP aliquot of the sample air was introduced into the analytical system from the sample flask in a single run. Typical precisions of the isotopic analyses are < 0.1 ‰ for δ15Nbulk, < 0.2 ‰ for δ18O, and < 0.5 ‰ for δ15Nα, although they were slightly worse for samples collected at higher altitudes because of the lower N2O mixing ratio.

Figure 2Vertical profiles of mixing ratio (a), δ15Nbulk (b), SP (c), and δ18O (d), of N2O observed over the Equator (pink symbols). Previously published results obtained over Japan (black and red symbols), Sweden (blue), and Antarctica (green) (Toyoda et al., 2001, 2004), and India (orange; Kaiser et al., 2016; Röckmann et al., 2001) are also shown. In the legend, launch sites and dates are shown, respectively, by three characters and six digits in yymmdd format. SBC, Sanriku Balloon Center, Japan; ESR, Esrange, Kiruna, Sweden; SYO, Syowa station, Antarctica; HDB, Hyderabad, India; EQP, eastern equatorial Pacific; BIK, Biak Island, Indonesia. See also Table S2 for details.
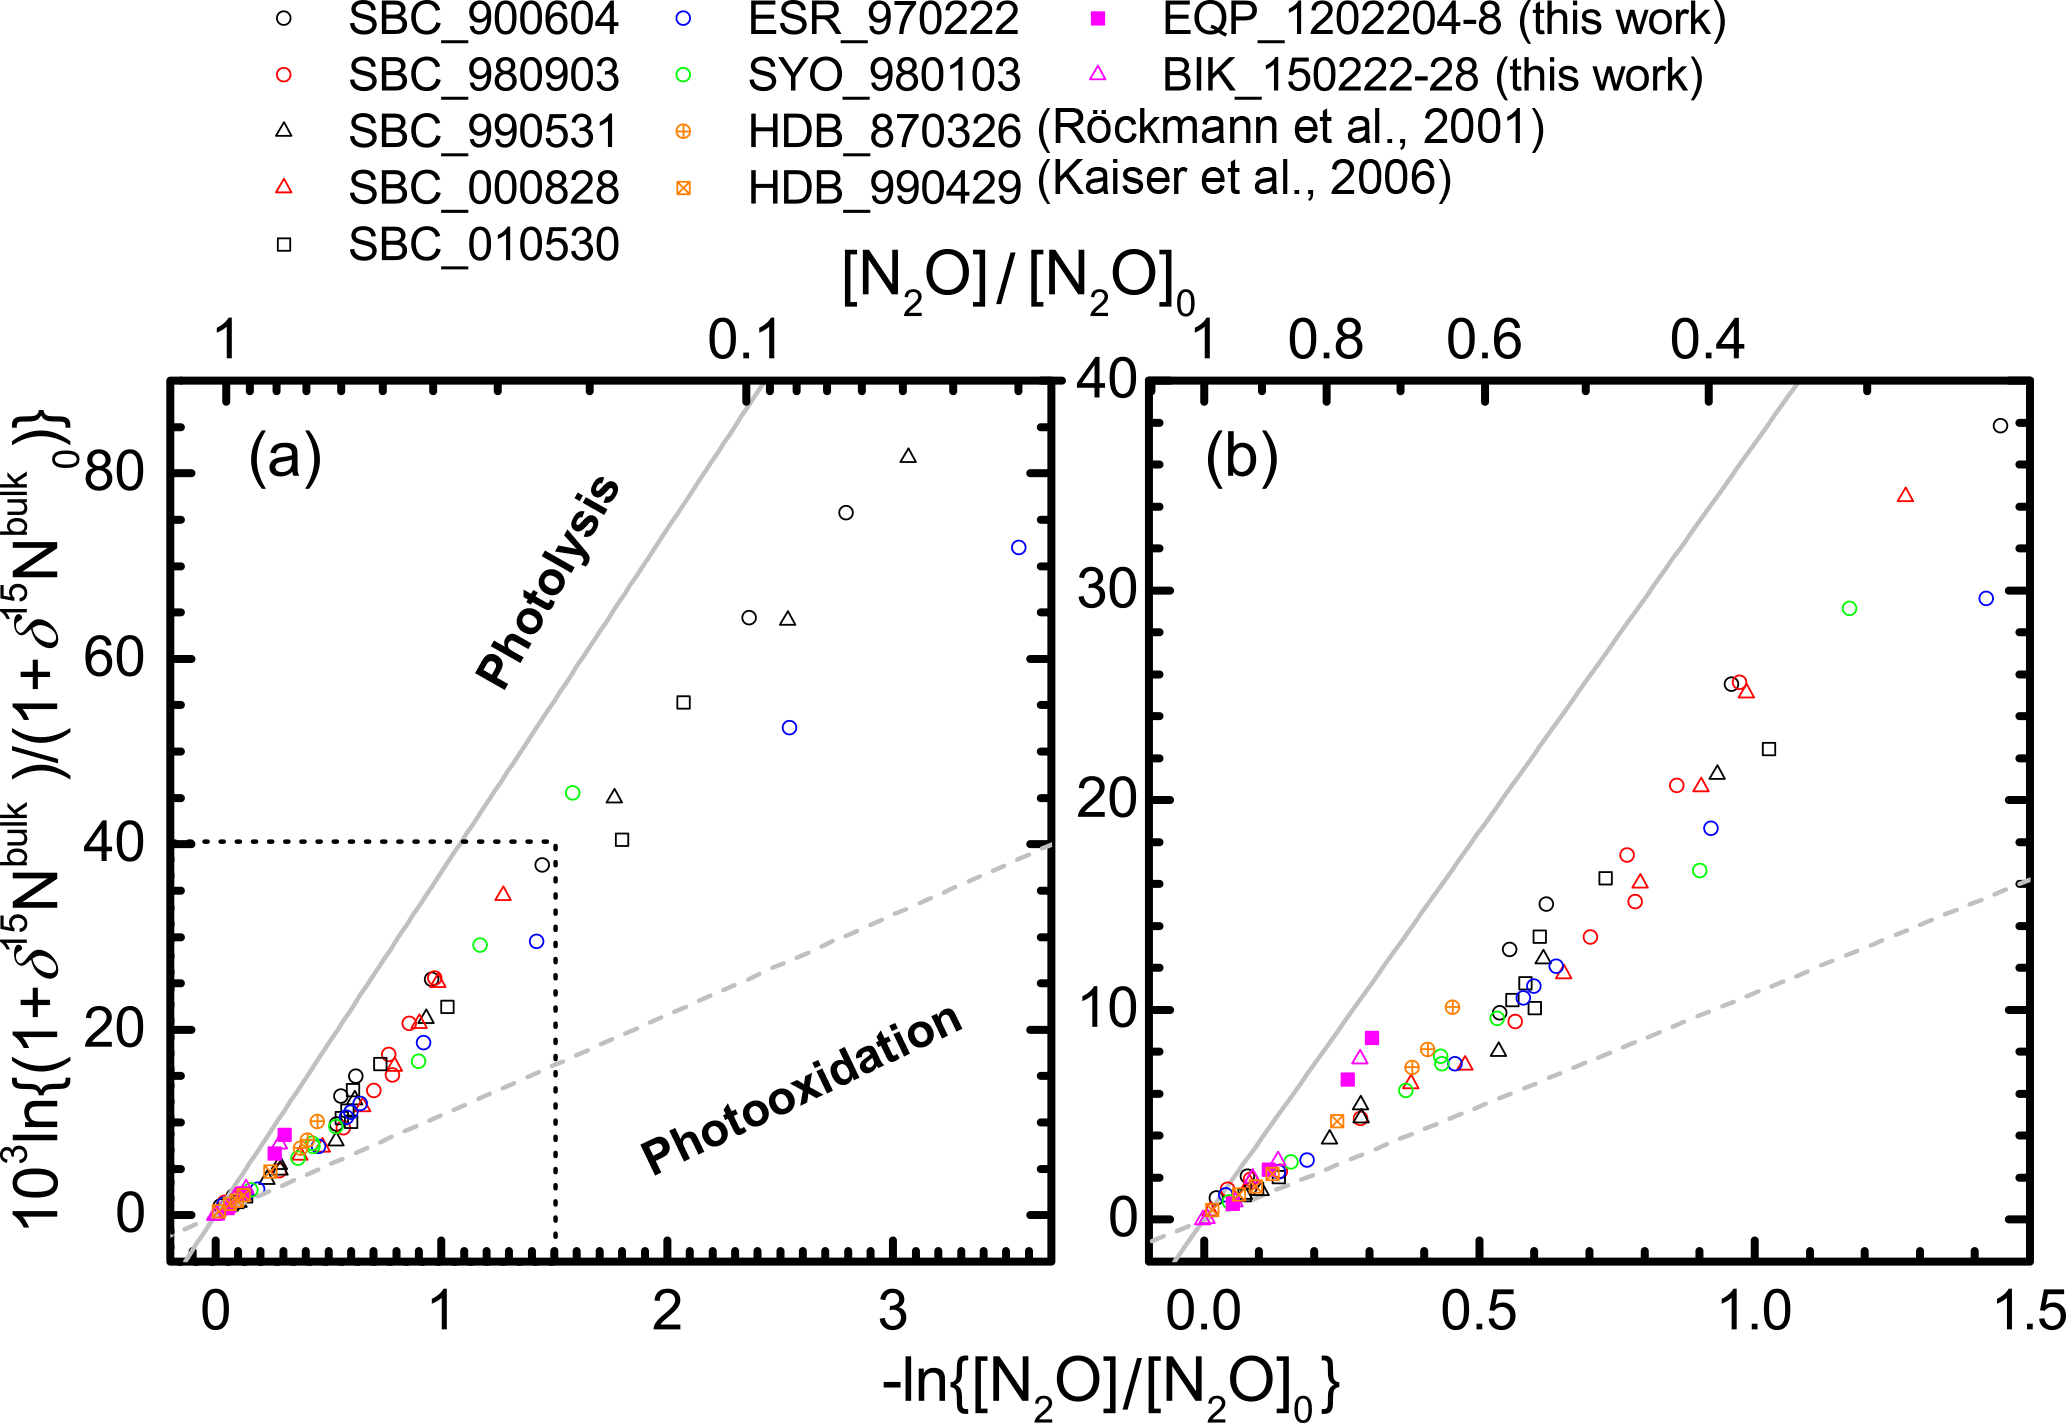
Figure 3Correlation between mixing ratio and δ15Nbulk of N2O (Rayleigh plot). The high mixing ratio range (> ca. 120 nmol mol−1) in (a) is enlarged in (b). Both parameters are normalized to their values at the time when the corresponding air mass entered the stratosphere (see Eq. 6 in the text). Grey solid and broken lines show slopes obtained respectively from laboratory broadband photolysis experiments (Kaiser et al., 2002b, 2003) and photooxidation experiments (Kaiser et al., 2002a; Toyoda et al., 2004).
To analyze the relation between the N2O mixing ratio ([N2O]) and isotopocule ratio (δ) in a Rayleigh fractionation scheme (Eq. 6), measured values must be normalized with respect to the values before the air mass enters the stratosphere.
In Eq. (6), subscript 0 signifies a tropospheric value; ε is the isotopic fractionation. Because the tropospheric mixing ratio and isotopocule ratios are known to have secular trends, [N2O]0 and δ0 were estimated as follows. First, the age of the measured air mass was estimated based on the mixing ratio of CO2 (Engel et al., 2009), which was also measured for the same air sample. Then, the N2O mixing ratio at the time when the air mass was in the troposphere was calculated using the estimated age of air and the secular trend of tropospheric mixing ratio observed by the ALE/GAGE/AGAGE project (Prinn et al., 2000). We used AGAGE data from Mace Head (Ireland) to calculate [N2O]0 for stratospheric air in the tropics (this study) and the Northern Hemisphere (in which our previous observations were conducted) and those from Cape Grim (Tasmania) for the Southern Hemisphere (our previous observation in Antarctica). For calculating δ0, the secular trends observed at Hateruma Island, Japan (Toyoda et al., 2013), and Cape Grim (Park et al., 2012) were used, respectively, for the tropics/Northern Hemisphere and the Southern Hemisphere. In Table S3 in the Supplement we compare how much this correction regarding the age of air changed the position of each data point in Figs. 3 and 5. Typically, the term related to mixing ratio (−ln{[N2O] ∕ [N2O]trp}) is decreased by 0.2–3 % when we use [N2O]0, the value when the air mass actually entered into the stratosphere, instead of the value at the same time of the observation, [N2O]trp. The isotopic terms () are either increased or decreased depending on their secular trends, and they are changed by 0.2–3 %.
2.3 Simulation using a three-dimensional chemical transport model
To examine the factors controlling the stratospheric distributions of N2O isotopocules, a numerical simulation was conducted using the Center for Climate System Research/National Institute for Environmental Studies/Frontier Research Center for Global Change atmospheric general circulation model with chemical reactions (CCSR/NIES/FRCGC ACTM) (Ishijima et al., 2010, 2015). Because Ishijima et al. (2015) have already given a detailed description of the N2O isotopocule model, we briefly explain it here.
The N2O photolysis rate was calculated for 15 bins from 178 to 200 nm and for three bins from 200 to 278 nm using a scheme incorporating the parameterization of Minschwaner et al. (1993) (Akiyoshi et al., 2009) and by a main radiation – photolysis scheme of the ACTM (Sekiguchi and Nakajima, 2008). Fractionation of N2O isotopocules was simulated using wavelength-dependent and temperature-dependent isotopic fractionations (ε) for 14N15N16O and 15N14N16O reported by von Hessberg et al. (2004) although the ε for 14N14N18O was estimated from the relation between apparent ε for each isotopocule observed in the stratosphere due to the lack of suitable experimental reports. The model transport was nudged to ERA-Interim reanalysis (Dee et al., 2011) for horizontal winds and temperature at 6-hourly time intervals. Regarding the photooxidation sink of N2O, the concentration of O(1D) was calculated online in the ACTM; ε values were calculated as described by Kaiser et al. (2002a).
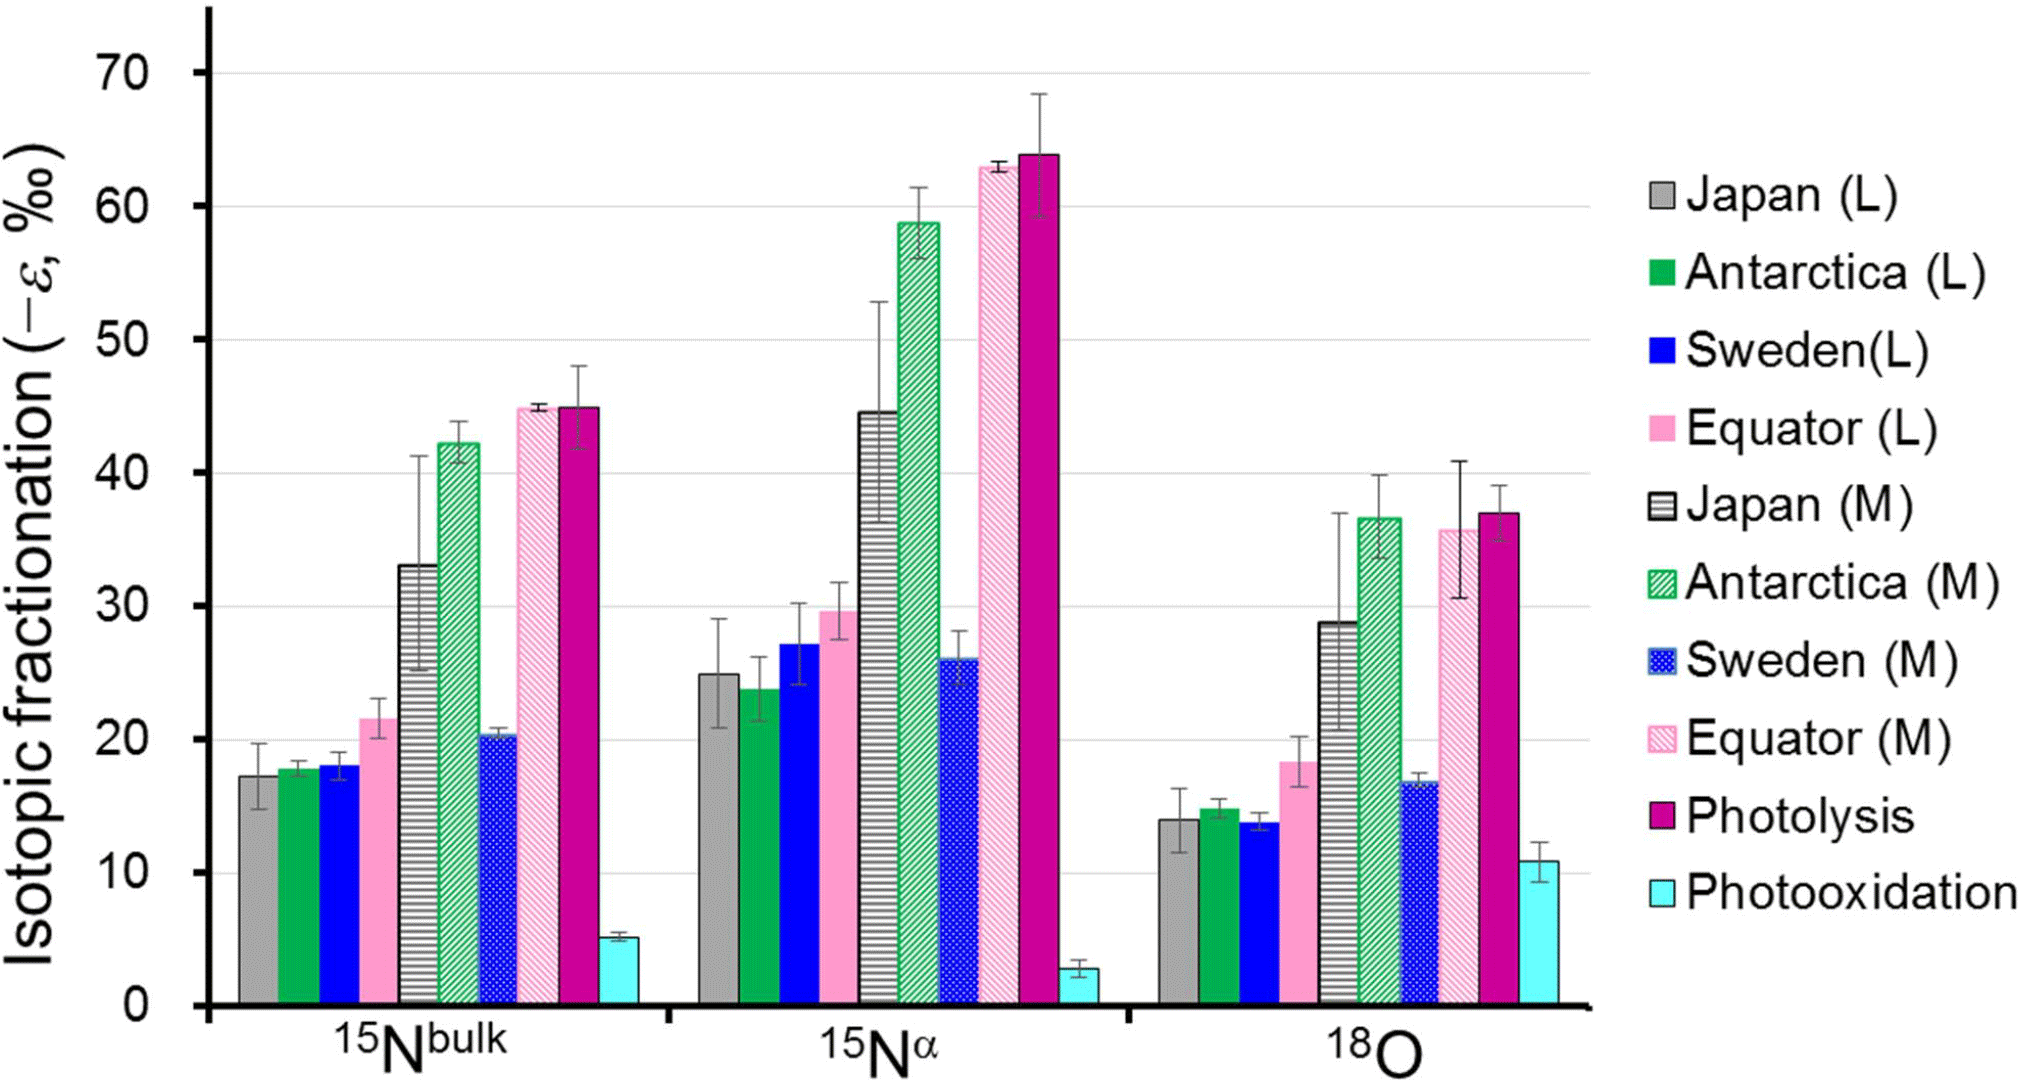
Figure 4Comparison of absolute values of the isotopocule fractionation () for 15Nbulk, 15Nα, and 18O of N2O between observations and laboratory experiments. L and M respectively refer to the lower and middle stratosphere with boundary mixing ratio of about 170 nmol mol−1 (−ln {[N2O]∕[N2O]0}=0.6) and 260 nmol mol−1 (−ln {[N2O]∕[N2O]0}=0.2) for extratropics and tropics, respectively, based on the Rayleigh plot shape (Fig. 3). The respective for Japan, Sweden, and Antarctica are from Toyoda et al. (2004). Those for photolysis and photooxidation experiments are referred from reports by Kaiser et al. (2002a, b, 2003) and Toyoda et al. (2004). Error bars show either the standard deviation for the mean value (observation over Japan and photooxidation experiments), standard error associated with linear regression in Rayleigh plot (observations except Japan), or the possible range for stratospheric conditions (photolysis experiments).
While both the surface emissions and the photolytic isotopocule fractionations were optimized in the earlier work by Ishijima et al. (2015), only the former was optimized in the present study. This is because we considered that it would be better to keep the experimentally determined original isotopocule fractionations for the purpose of comparison between the model and the observations in the stratosphere. Moreover, we found that apparent isotopocule fractionations obtained by the model simulation become much closer to those by the balloon observations by replacing the meteorological data from JRA-25 (Onogi et al., 2007) with those from ERA-interim. This is probably because dynamics and chemical reactions in the model were improved by the replacement of the meteorological reanalysis data for nudging. Surface emissions of the four N2O isotopocules were optimized in the manner described in an earlier report (Ishijima et al., 2015), with emissions modified to reproduce observed trends (Röckmann and Levin, 2005) and interhemispheric differences (Ishijima et al., 2007) of atmospheric N2O isotopocule mixing ratios. Consequently, the estimated emissions were used for a forward simulation of four N2O isotopocules in the atmosphere from the surface to the stratosphere in this study. The emissions and tropospheric values are reasonable (see Supplement) compared to those of past studies (e.g., Toyoda et al., 2013, 2017) in terms of the necessary order of precision for analysis of the large vertical profiles in the stratosphere in this study.
3.1 Vertical profiles of the N2O mixing ratio and isotopocule ratios over the Equator
In all, 11 samples (4 from the eastern Pacific, 7 at Biak Island) were collected at target altitudes; of them, 10 were measured for N2O isotopocules. Figure 2 presents vertical profiles of the N2O mixing ratio, δ15Nbulk, SP, and δ18O observed over the Equator. Data from our previous observations over Japan, Sweden, and Antarctica and those from observations by Röckmann et al. (2000) and Kaiser et al. (2006) conducted over India are also shown. The height of the tropical tropopause layer (TTL) is typically 14–18.5 km (e.g., Fueglistaler et al., 2009), whereas the tropopause height was 12–16 km over Japan and 9 or 10 km over Sweden and Antarctica (Table S2). As observed at mid-latitudes and high latitudes, the mixing ratio decreases with height; isotopocule ratios increase with height over the Equator. However, the vertical gradient is weaker at lower latitudes. Our observation over the Equator shows the weakest gradient. Although a slight difference in mixing ratio was observed for 20–25 km, the two equatorial profiles obtained at different longitudes over the Equator agreed quite well. We combined the two datasets as a single one for further examinations.

Figure 5Correlations between δ15Nβ and δ15Nα of N2O (a) and between δ18O and δ15Nbulk of N2O (b). The δ values are normalized as noted in the text. Grey solid and broken lines show slopes obtained respectively from laboratory broadband photolysis experiments (Kaiser et al., 2002b, 2003) and photooxidation experiments (Kaiser et al., 2002a; Toyoda et al., 2004).
3.2 Correlation between mixing ratio and isotopocule ratios: apparent isotopocule fractionations
In Figs. 3 and S3–S5, the isotopocule ratios are shown against the N2O mixing ratio after the normalization described in Eq. (6) (Rayleigh plot). The equatorial data for lower altitudes (−ln {[N2O] ∕ [N2O]0}< 0.2 or [N2O] > ca. 260 nmol mol−1) are on the line defined by the data for lower altitudes (−ln {[N2O] ∕ [N2O]0}< 0.6 or [N2O] > 170 nmol mol−1) over middle latitudes and high latitudes. The linear relation is consistent with isotopocule fractionation during the decomposition of N2O in a closed system, although the slope of the line, which corresponds to isotopic fractionation (ε), is markedly lower than that obtained by laboratory photolysis experiments (see below). However, the three data points obtained at altitudes corresponding to −ln {[N2O] ∕ [N2O]0}> 0.2 ([N2O] < ca. 260 nmol mol−1) show systematic deviation from the line and seem to define another line (Fig. 3b). A similar deviation or bending structure of the Rayleigh plot has also been observed at middle to high latitudes (Fig. 3a, from the points where the x axis value is ca. 0.5) (Toyoda et al., 2004). We therefore compare the slope of the lines obtained for observations at various latitudes and for laboratory simulation experiments.
As portrayed in Fig. 4, absolute values of ) for 15Nbulk, 15Nα, and 18O in the equatorial lower stratosphere are slightly higher than those of middle latitude and high latitude lower stratosphere, but they are still only about half of the ε obtained by broadband photolysis experiments (Kaiser et al., 2002b, 2003). In contrast, in the higher region (or middle stratosphere) show larger values. They are the largest over the Equator except for ε(18O). The equatorial values of ε almost as large as those of photolysis. It is also noteworthy that in the middle stratosphere in the arctic polar vortex (Sweden) is as small as that in the lower stratosphere and that latitudinal and year-to-year or seasonal variation are small in the lower stratosphere compared to variations in the middle stratosphere. Although the similar latitudinal and altitudinal dependence of ε has been reported previously for latitudes ranging from 18 to 89∘ N (Park et al., 2004; Kaiser et al., 2006), our equatorial data show that the change in ε occurs at altitude corresponding to higher N2O mixing ratio. The ε value is exactly what would be expected during the N2O photolysis as discussed below.
3.3 Cause of the variation of stratospheric ε
We now discuss causes of (1) lower value in the lower stratosphere, (2) increase in in the middle stratosphere, and (3) the largest in the equatorial middle stratosphere based on two factors: photochemical and transport processes.
3.3.1 Photochemical processes
During photochemical decomposition of N2O, ε reportedly depends on the wavelength that photolyzes N2O, the relative share of photolysis and photooxidation pathways (Eqs. 1 and 2), and temperature (Toyoda et al., 2004; Kaiser et al., 2006). Moreover, because of transport processes the stratosphere cannot be always treated as an isolated system which is a prerequisite for Rayleigh fractionation model. The ratio of ε values for independent isotopocules (e.g., ε(15Nbulk)∕ε(18O)), however, has been identified as a useful parameter to distinguish photolysis and photooxidation (Kaiser et al., 2002a) because its sensitivity to wavelength and temperature is small and it is not affected by mixing process. Figure 5 shows the data obtained in this study and some previous ones in δ–δ space after the normalization described in Eq. (6). Especially in Fig. 5b, almost all data show a compact linear relation without bending or curved structure apparent in the Rayleigh diagram. The slope, which corresponds to the ratio of ε values, is very close to the one expected for photolysis. This agrees with the fact that photochemical decomposition of N2O is mainly caused by photolysis (Minshwaner et al., 1993), although the small fluctuation in the lower left region in Fig. 5a will be discussed later.
3.3.2 Transport processes
Transport processes accompanied by mixing of variously aged stratospheric air has been considered as the major cause of lower value in the stratosphere than in the laboratory photochemical decomposition (Park et al., 2004; Kaiser et al., 2006). Our new observation revealed that all the N2O isotopocules are fractionated by the almost ideal Rayleigh process in the middle stratosphere over the deep tropics, where the stratosphere is effectively the most isolated relative to all other regions. This underlines how much transport and mixing affect the apparent ε value.
We then consider the effect of transport on the apparent ε at different latitudes with a conceptual two-dimensional circulation model in the tropical and extratropical stratosphere that was proposed to explain tracer–tracer correlation (Plumb, 2002). In the tropics, N2O is decomposed gradually during upwelling of the air mass injected from the troposphere. The uppermost tropical air mass X0 is then transported to middle latitudes and higher latitudes, where it begins downwelling. Because the vertical ascent rate in the tropics is faster than quasi-horizontal transport out to the extratropics and much faster than the quasi-horizontal transport of extratropical air into the tropics, there is an apparent transport barrier between the tropics and extratropics (Plumb, 2007). Nevertheless, entrainment of air mass Yi across the subtropical edge separating the two regions must occur to compensate for mass flux in the lower region (Fig. 6).

Figure 6Conceptual two-dimensional circulation model to analyze mixing processes between tropics and extratropics (from Plumb, 2002). The X0 is the uppermost tropical stratospheric air mass; Xi (i=1–8) are air masses formed by mixing of Xi−1 and Yi.
If we assume tropical profiles of N2O and its isotopocule ratios (e.g., δ15Nbulk) are determined purely by photochemistry with initial mixing ratio of 320 ppb, a delta value of 0 ‰ and a εsink of −50 ‰, then tropical air masses vertically divided from Y8 through Y1 and X0 are expected to line up on a solid line as portrayed in Fig. 7. Next, let us consider that air mass X0 is mixed with Y1 to form X1. Based on the mass balance of isotopocules before and after mixing, the resulting composition of X1 is obtained as a curve, as shown in red in Fig. 7. Assuming arbitrarily that the mixing ratio of Y1 to X1 is 0.1, and repeating such mixing stepwise, then we obtain mixing ratio and isotope ratios of N2O in X1 through X8 as black stars in Fig. 6. This hypothetical, continuous mixing produces a curve that is qualitatively consistent with observations made over the mid-latitudes or high latitudes.
The mixing effect must also be the cause of smaller ε in the equatorial lower stratosphere (Fig. 4). The mean age of air deduced from CO2 mixing ratio is known to be significantly larger than the phase lag of the water vapor mixing ratio, a so-called tape recorder signal, in the tropical stratosphere, which is explainable by mixing of old air from the extratropics into the tropics (Waugh and Hall, 2002). In addition, the difference in age between the Equator and mid-latitude (over Japan) decreases concomitantly with decreasing altitude (Sugawara et al., unpublished data), suggesting that the timescale of meridional mixing or transport is smaller in the lower stratosphere than in the middle stratosphere, as suggested by results of an earlier study (Boering et al., 1996).
3.3.3 Comparison with chemical transport model (ACTM) simulation
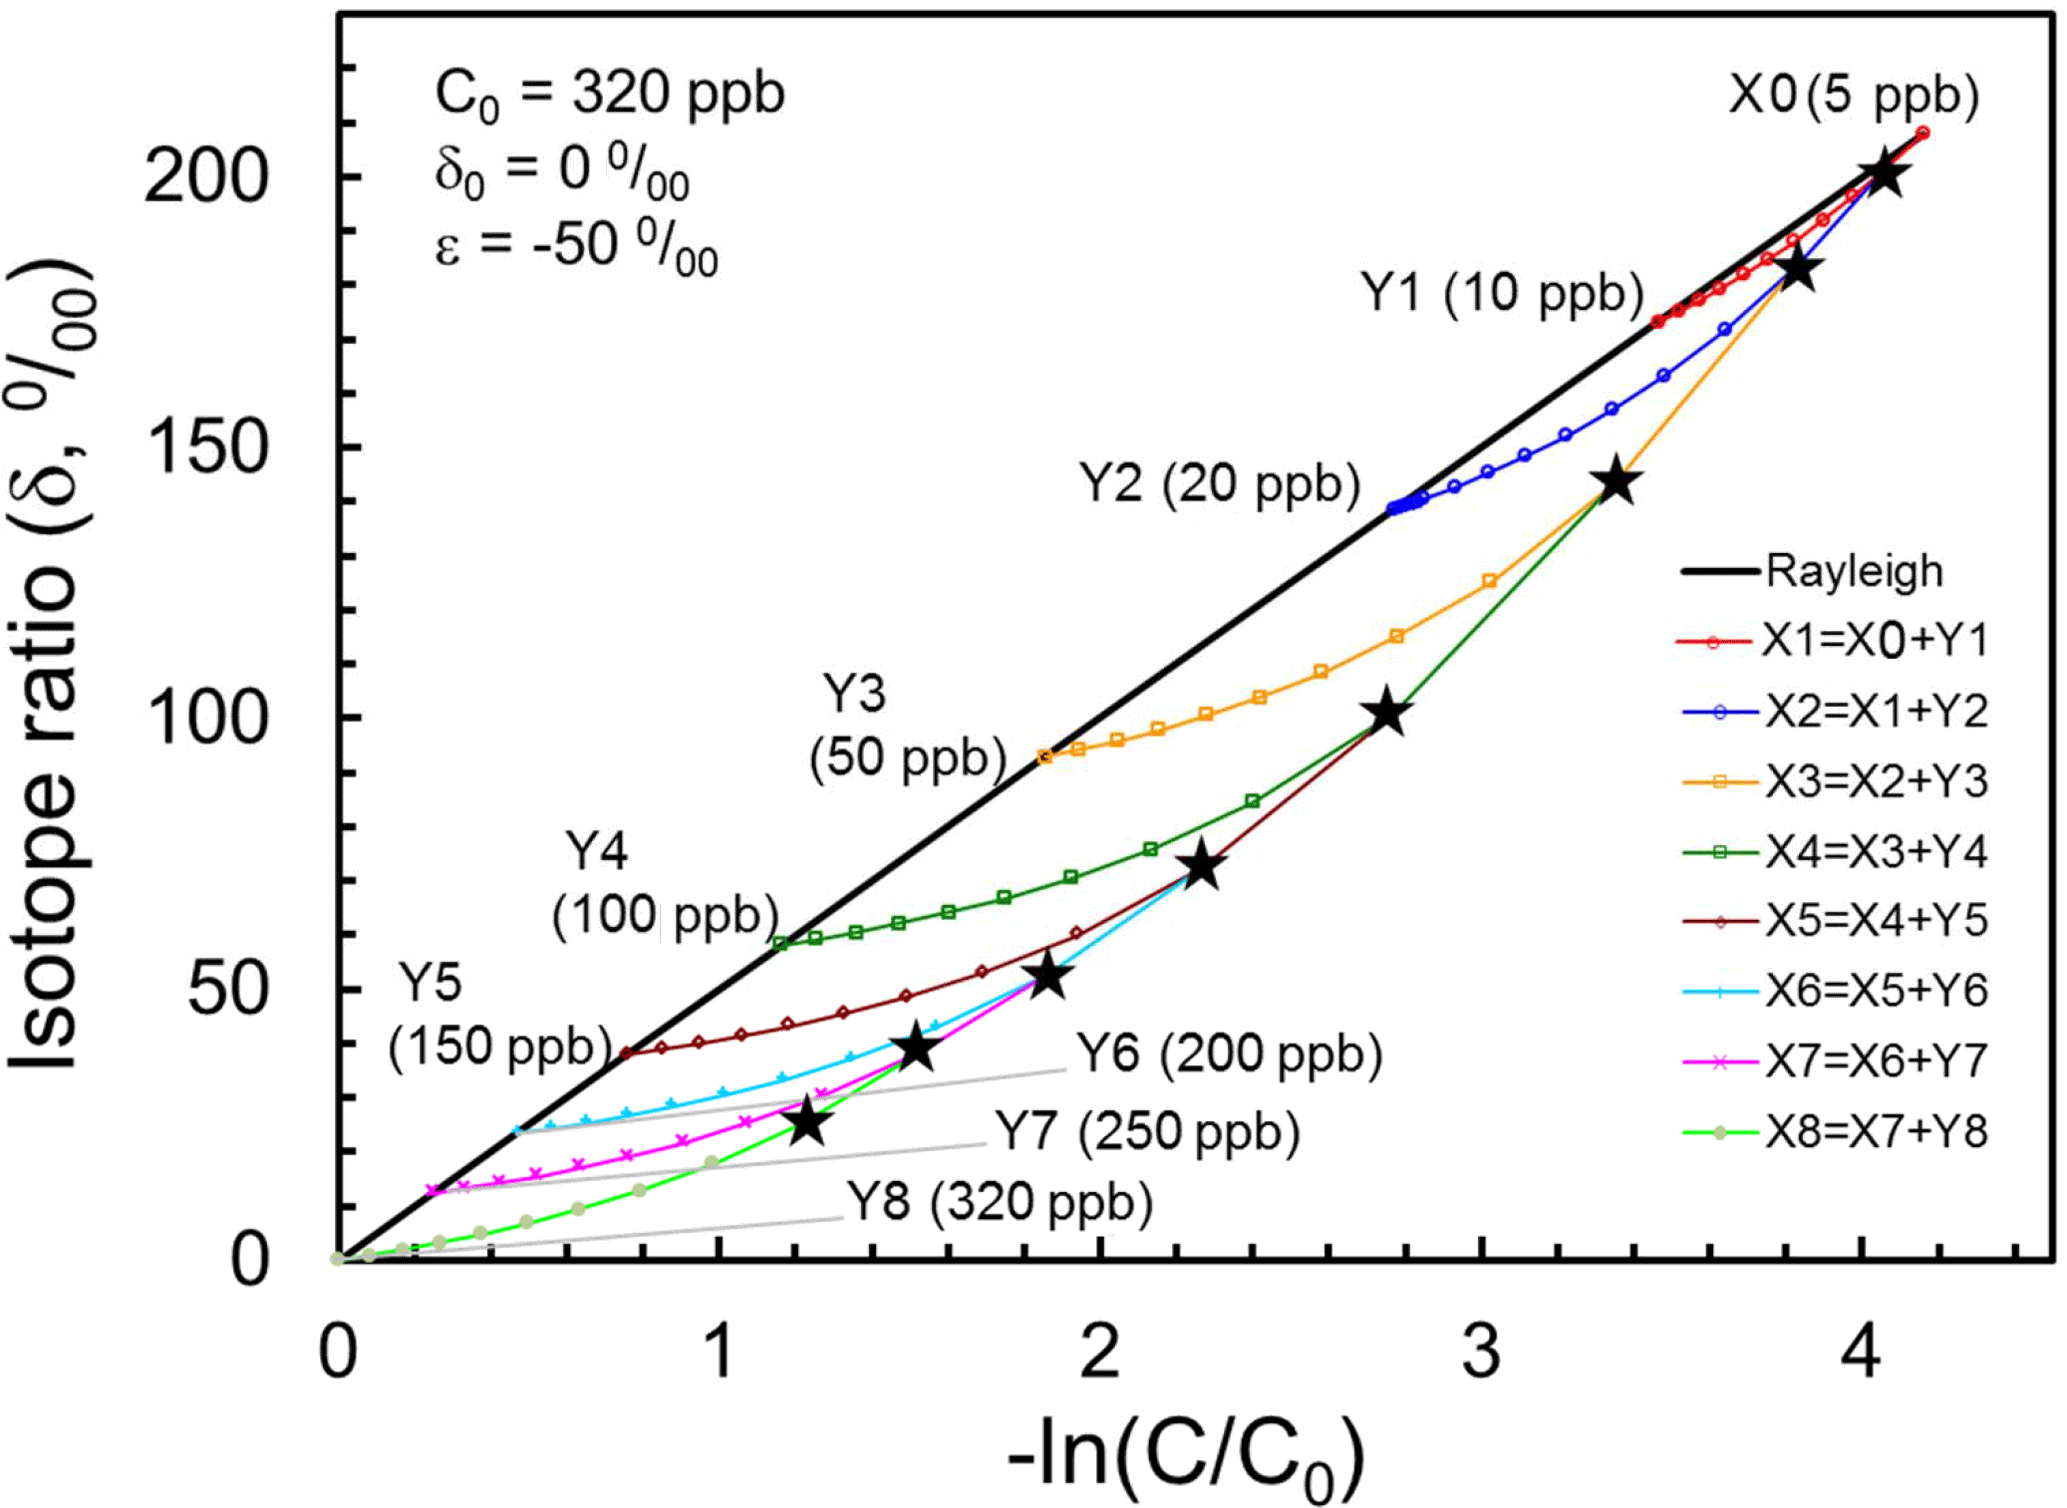
Figure 7Presentation of Xi (black stars) obtained using the mixing model with assumed Yi in the Rayleigh plot. The straight line shows tropical vertical isotopocule fractionation without transport/mixing effect. Curves show mixing between Xi−1 and Yi, where mixing ratio Yi∕Xi is assumed to be 0.1.
We further examined the importance of transport using an ACTM. Figure 8 presents results of the ACTM simulation with observational data. Although the model approximates the photolysis of N2O in the longer wavelength region (λ > 200 nm) with lower spectral resolution, profiles of the N2O mixing ratio and isotopocule ratios were reproduced well, except in the winter polar stratosphere, where dynamic processes specific to the polar vortex might not be simulated appropriately in the model. In Fig. 9, the model simulation and observations are compared on a Rayleigh plot. Again, the model reproduced the difference between tropical and mid-latitudes or high latitudes. Because in situ εphotolysis used in the model calculation is nearly the same between low and high latitudes (Fig. S6c), this agreement supports the inference that the major causes of the difference are transport and mixing, which was previously suggested by observations in the high latitudes (Park et al., 2004) and by 1-D or 3-D model studies (McLinden et al., 2003; Morgan et al., 2004).
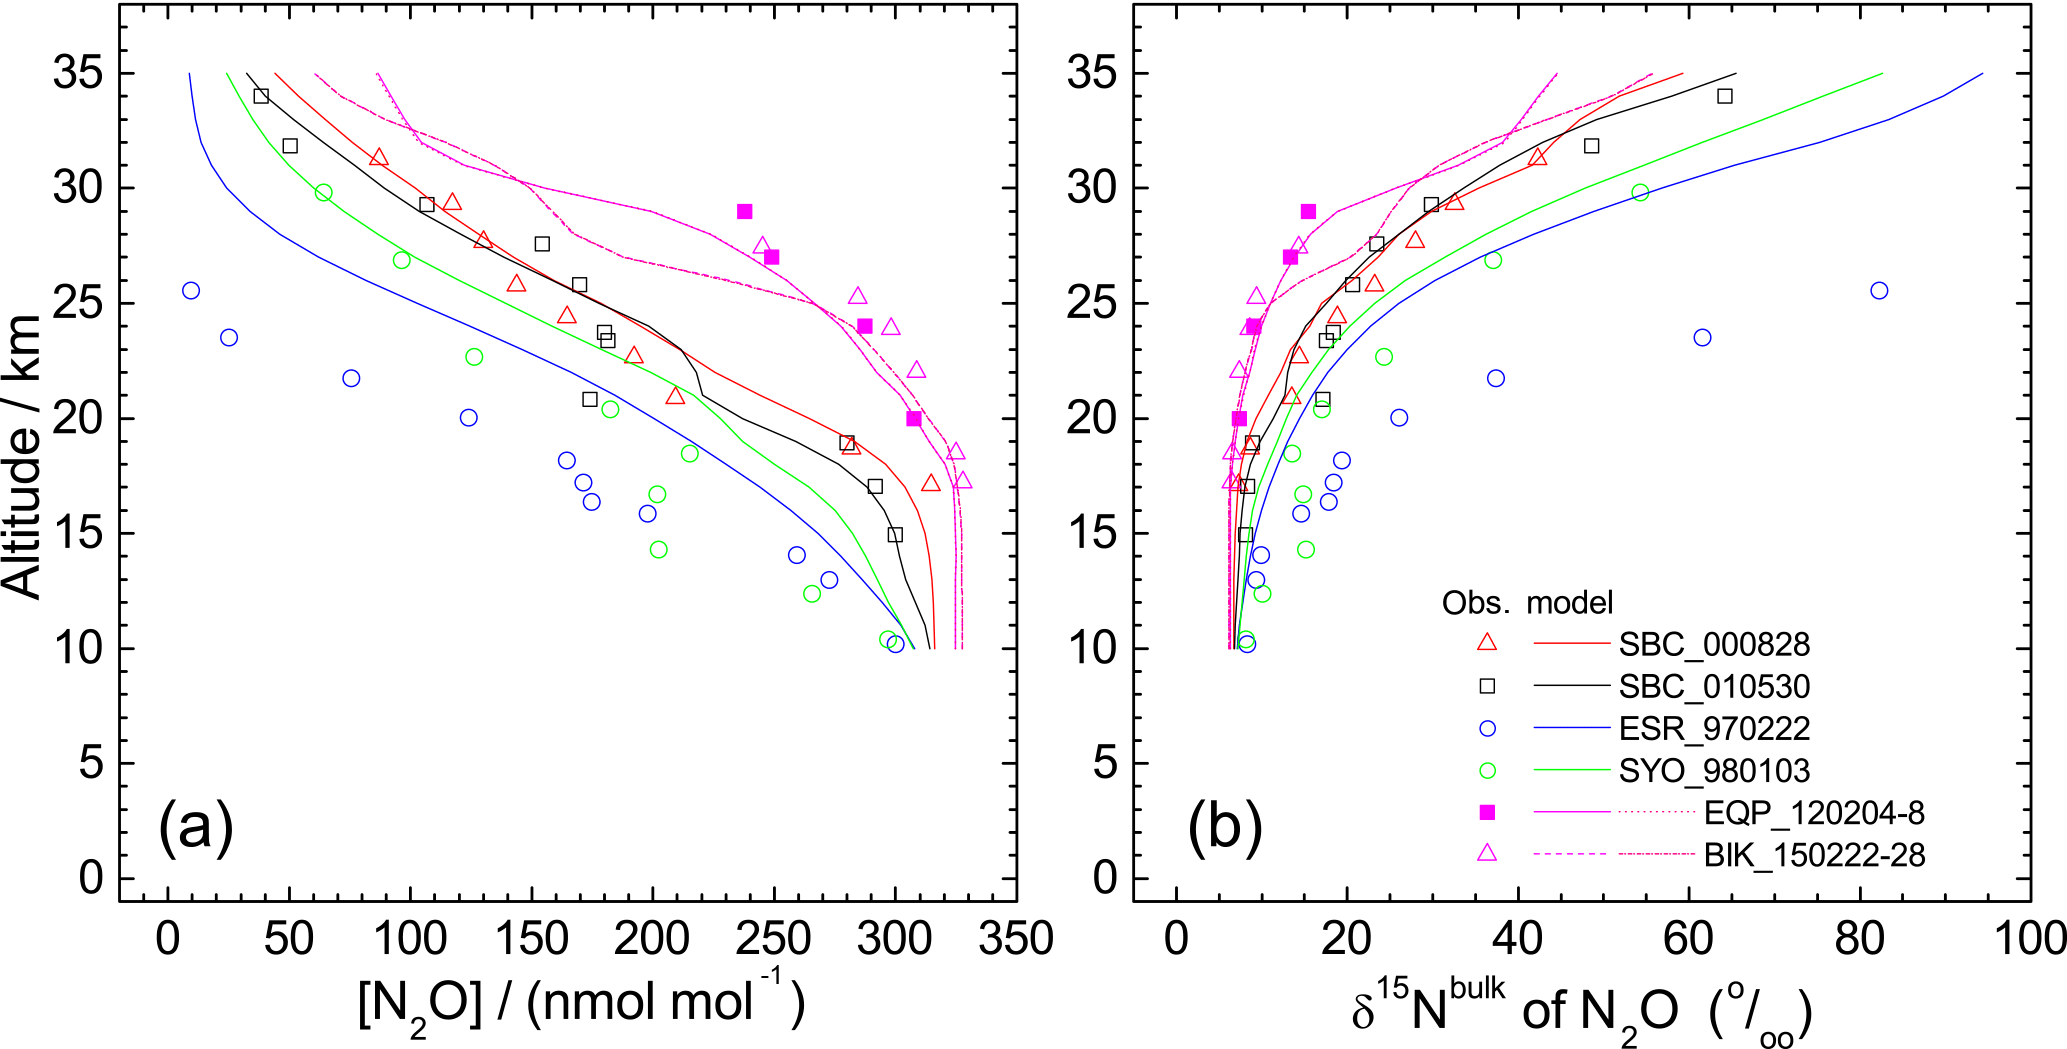
Figure 8Comparison of vertical profiles of mixing ratio (a) and δ15Nbulk (b) of N2O between observations and simulation by the ACTM. Model simulations for equatorial profiles were conducted for two dates because the observations were conducted during a 5- or 7-day period.
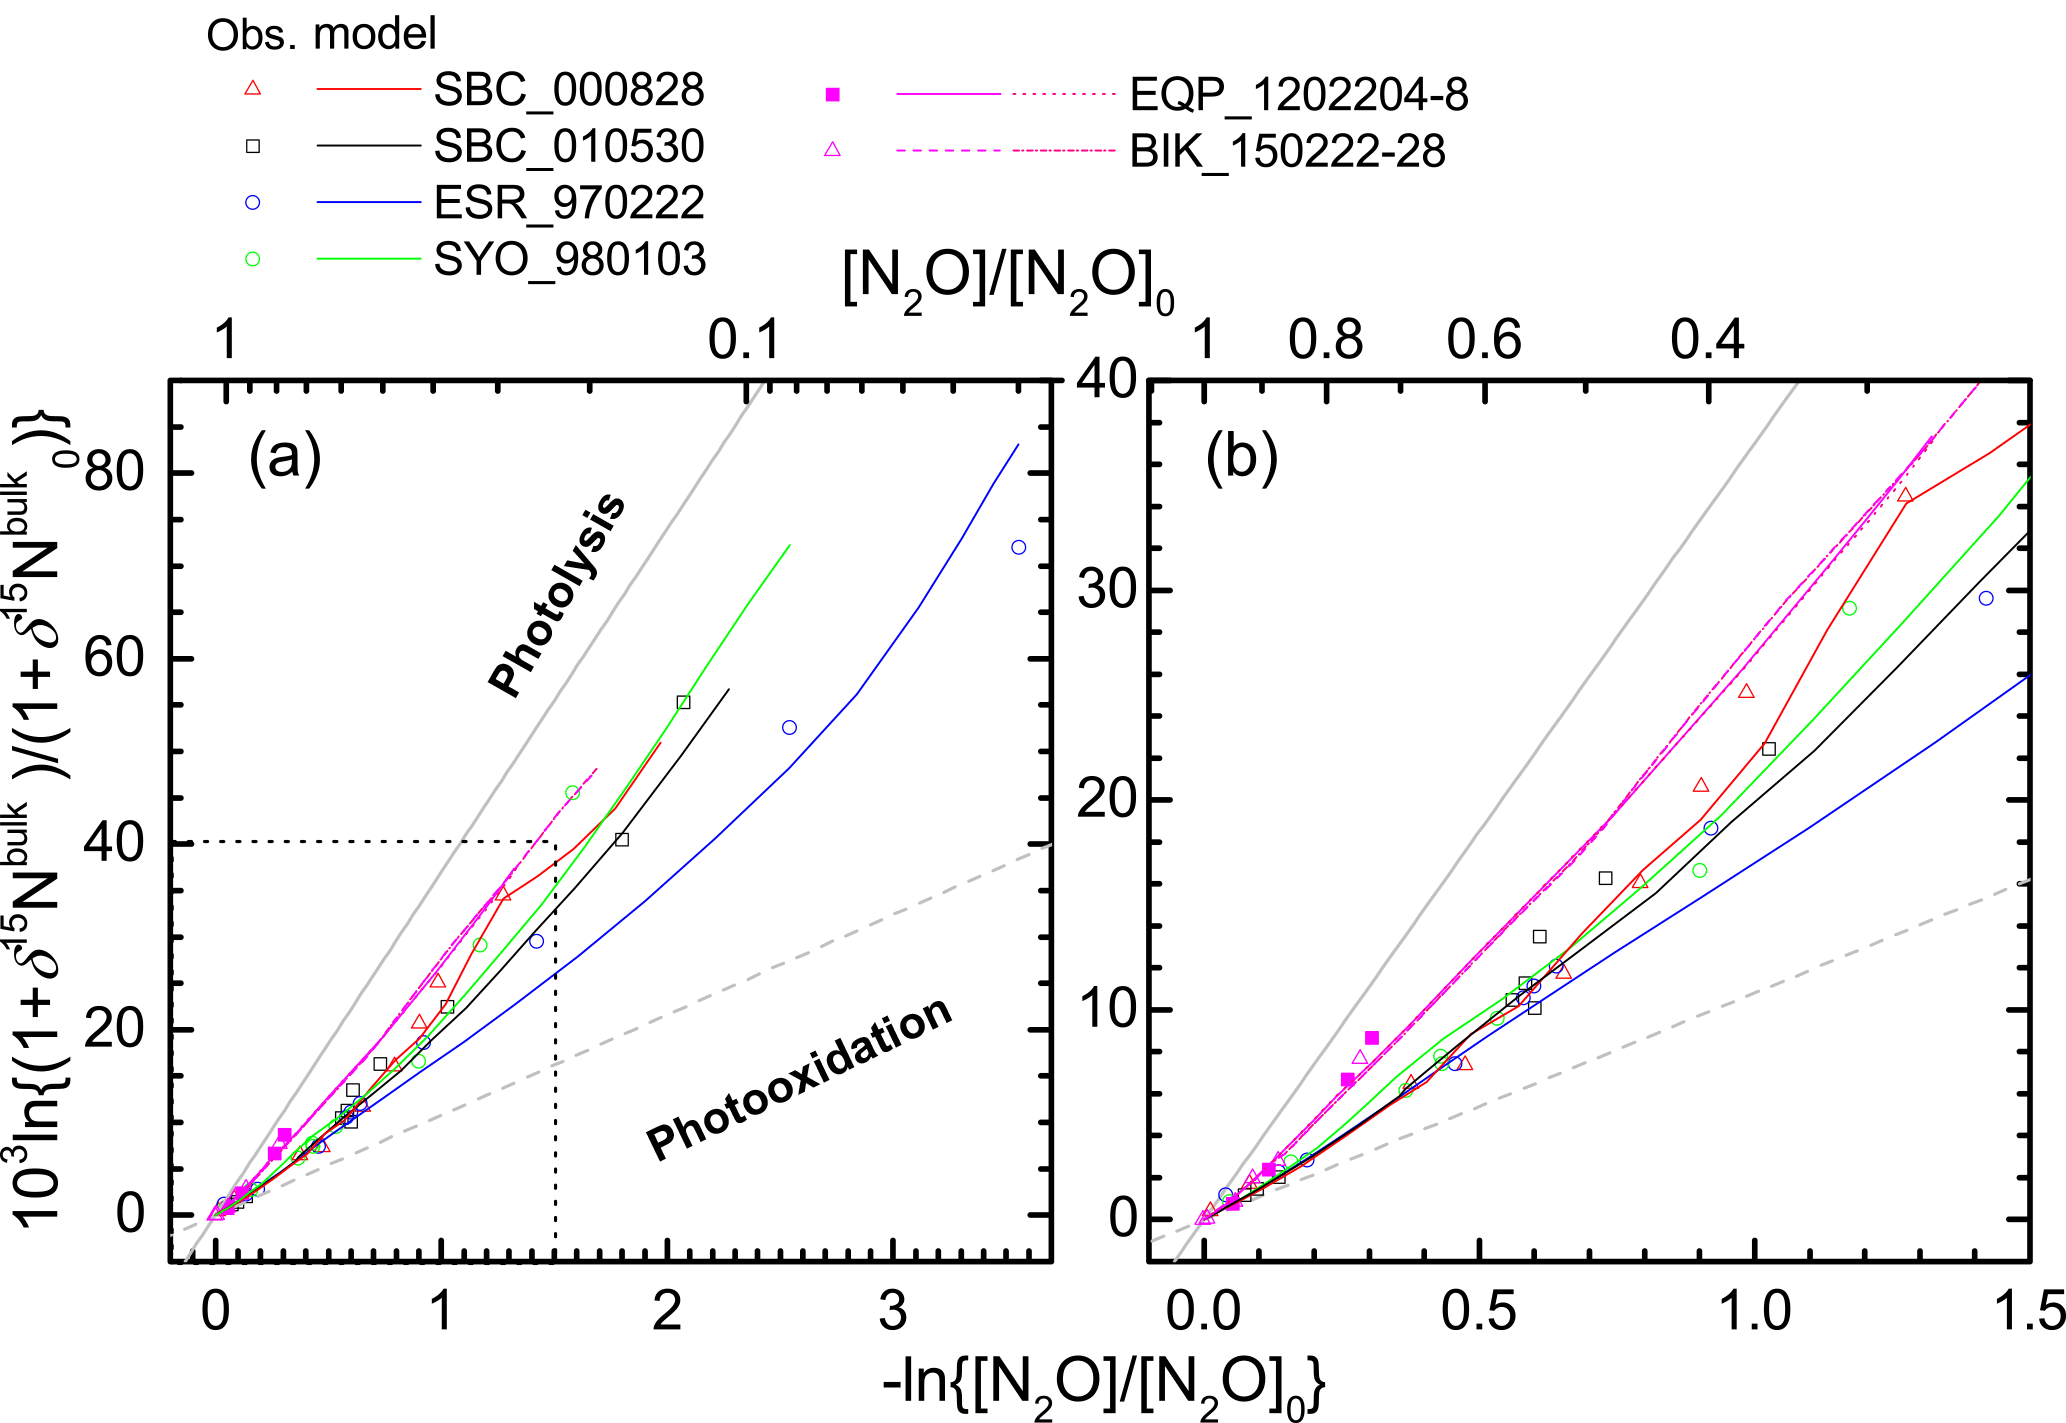
Figure 9Comparison of results of ACTM simulation and stratospheric observation in Rayleigh plot. The square region shown by broken lines in panel (a) is enlarged in panel (b).
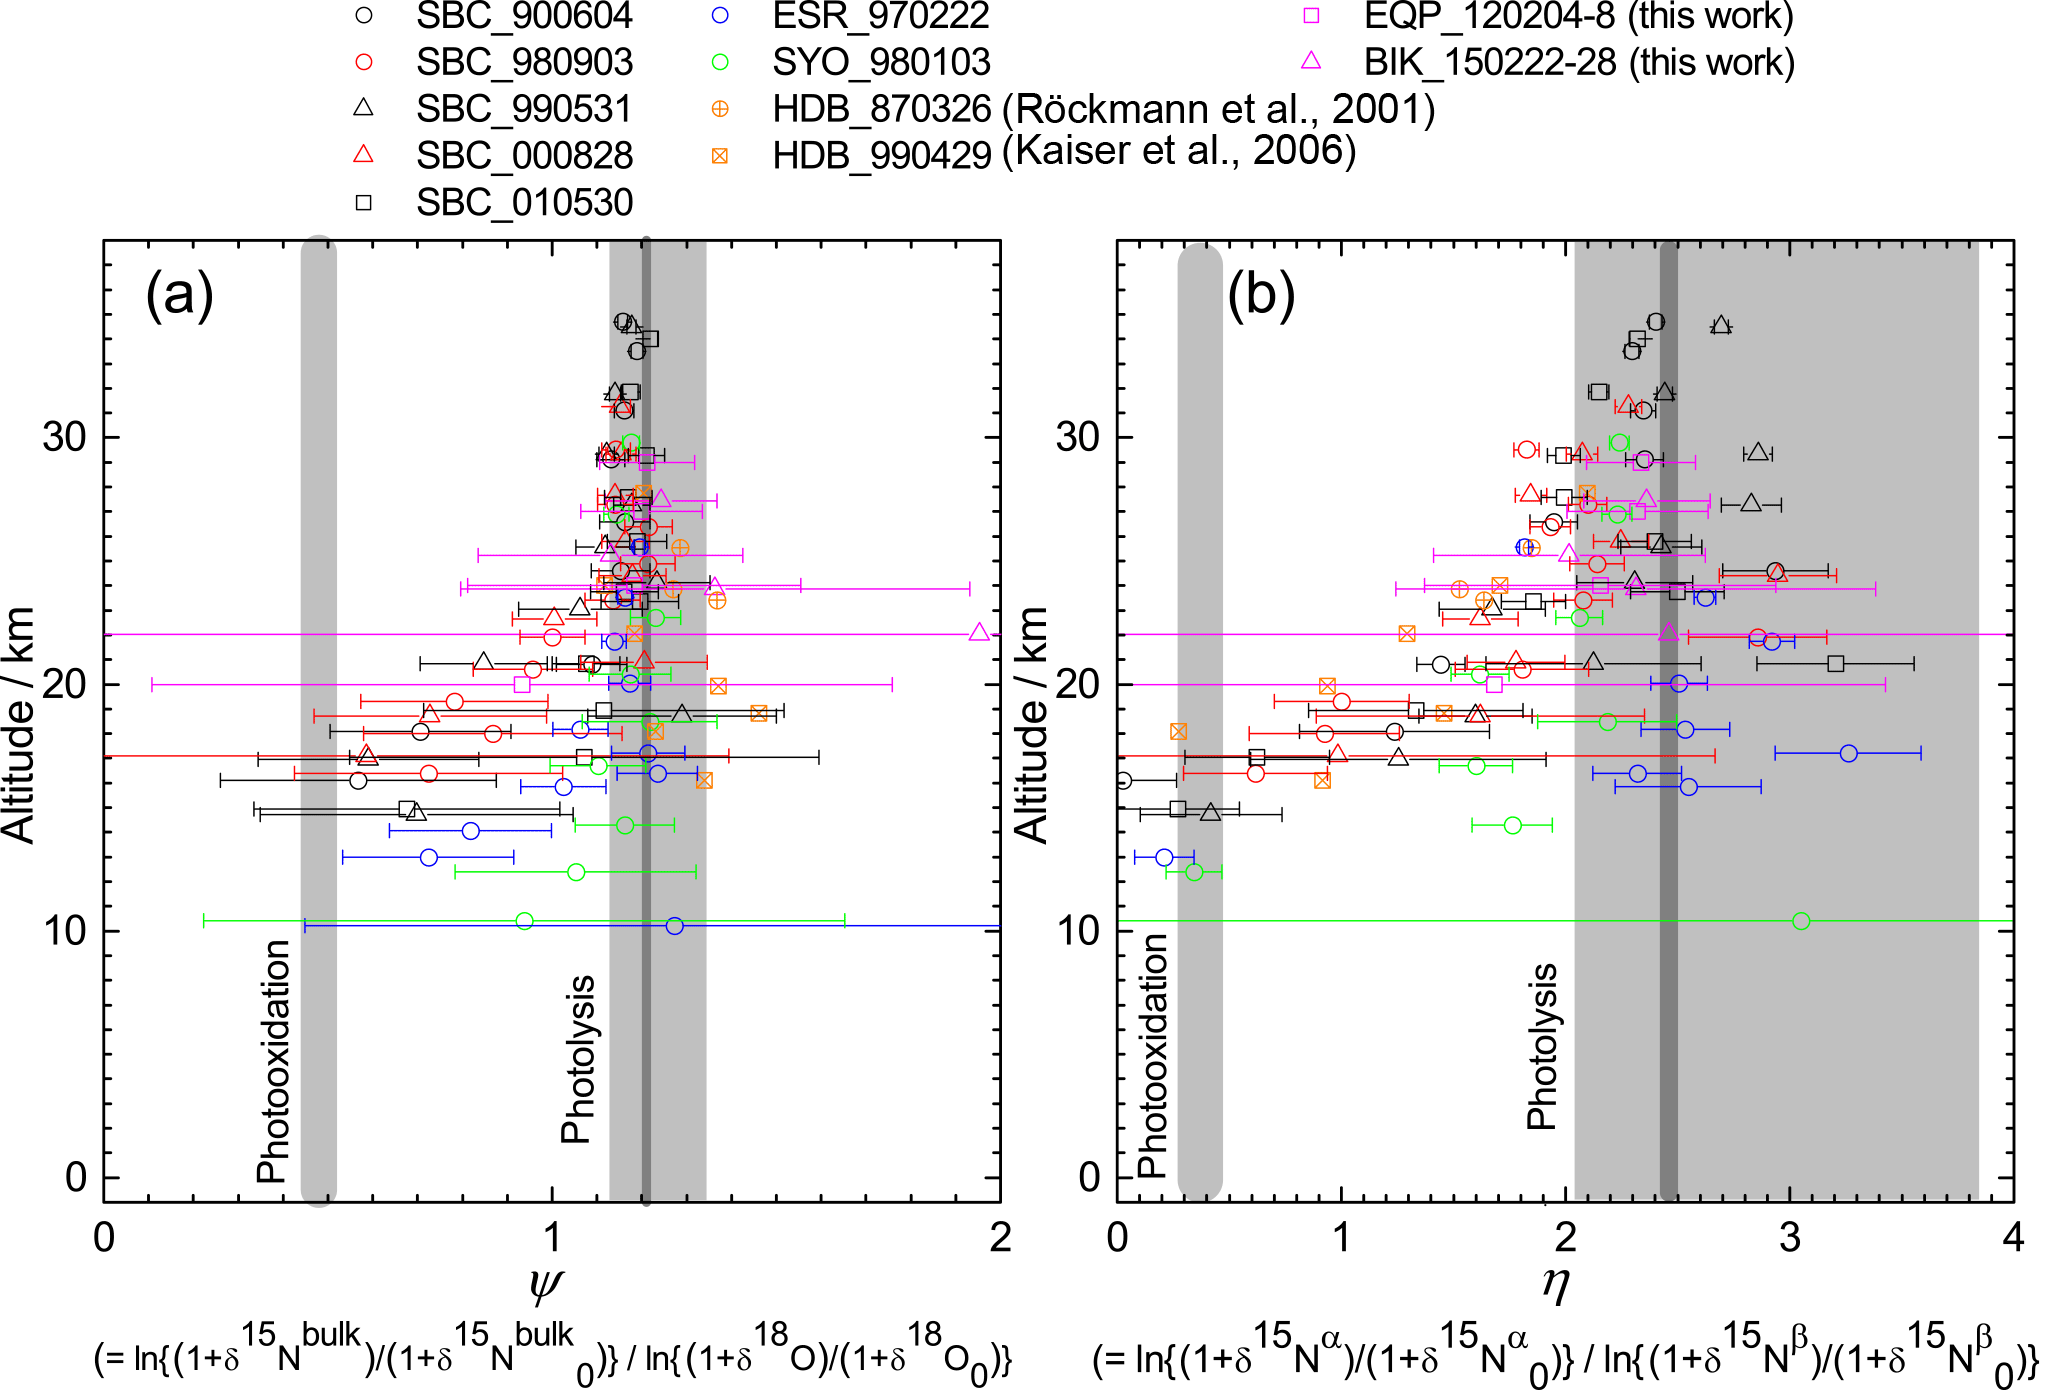
Figure 10Vertical profiles of ratio of ε values for 15Nbulk and 18O (ψ) and the ratio of ε values for 15Nα and 15Nβ (η) calculated in the manner similar to that of Kaiser et al. (2006). Grey bands show values obtained by laboratory broadband photolysis experiments (Kaiser et al., 2002b, 2003) and photooxidation experiments (Kaiser et al., 2002a; Toyoda et al., 2004) with widths representing their uncertainty. For photolysis, uncertainties associated with temperature (190–240 K) and wavelength (190–220 nm) dependency are shown with dark and light grey, respectively.
3.4 Share of photolysis and photooxidation
Kaiser et al. (2006) used the ratio of ε values for 15Nbulk and 18O (ψ) and the ratio of ε values for 15Nα and 15Nβ (η) to estimate the relative share of photolysis and photooxidation based on the fact that ψ and η are almost independent of transport processes and are significantly different between the two decomposition processes. They computed ψ and η values directly for each individual sample in order to avoid statistical errors associated with linear regression to the δ–δ plot which was adopted by Toyoda et al. (2004) and Park et al. (2004). In Fig. 10, we show ψ and η values calculated using the data presented in Fig. 2 in the manner similar to that of Kaiser et al. (2006) except that we used the individual date of stratospheric entry for each data point to normalize the δ values instead of using a single tropopause date. Although it is noteworthy that errors in ψ and η values increase concomitantly with decreasing altitude because of the decrease in the δ values, low values are obtained just above the TTL over the Equator (EQP, z=20 km) just as they are at other latitudes. This result is in accordance with the indication by Kaiser et al. (2006) that the photooxidation sink has a much larger fraction than 10 % in the lower stratosphere. Although the loss rate of N2O in the lower stratosphere is very slow and the majority of N2O injected into the stratosphere is photolyzed in the middle stratosphere as noted by Park et al. (2004), the share of photooxidation in in situ total loss increases in the lower stratosphere (Fig. S6b). Therefore, there is a possibility of additional decomposition of remaining N2O during the transport from the tropics to the extratropics. In the transport which must be slower than the rate of tropical upwelling, the isotopic signature of O(1D) pathway could be imprinted, and the photochemically aged air mass could be transported into the lower stratosphere of the tropics and extratropics. However, Morgan et al. (2003) reported that inclusion of isotope fractionation for photooxidation into their 2-D model does not make a significant contribution to overall fractionation in the stratosphere, and Park et al. (2004) discussed an alternative modeling approach with and without O(1D) sink to test the importance of O(1D) reaction. Further studies using 3-D model would be necessary to solve this controversial problem.
Vertical profiles of isotopocule ratios of N2O in the equatorial stratosphere are found using balloon-borne compact cryogenic samplers and mass spectrometry in the laboratory. This report of the relevant literature is the first describing observations of them over the Equator. Unlike other regions of the stratosphere, fractionations for isotopocules in the middle equatorial stratosphere (25–30 km, or [N2O] < 260 nmol mol−1) agreed with those obtained in laboratory photolysis experiments because the middle tropical stratosphere is relatively more isolated than the rest of the stratosphere. In the lower equatorial stratosphere (< ca. 25 km or [N2O] > 260 nmol mol−1), isotopocule ratios suggest that differently aged air masses are mixed because of meridional transport and that decomposition by photooxidation might also play a significant role. Vertical and latitudinal distributions of N2O and its isotopocules are found to be a unique tool to diagnose the relationship between photochemistry and transport in the stratosphere. Further observations of temporal variations and comparison with ACTM simulation will be needed to estimate quantitatively the importance of photooxidation pathway and to examine the possible change in the meridional circulation predicted by model simulations (Li et al., 2008; McLandress and Shepherd, 2009) because such a change might affect ε values of stratospheric N2O by perturbing mixing of air with different transport time histories.
The data of this paper are available in the Supplement.
The supplement related to this article is available online at: https://doi.org/10.5194/acp-18-833-2018-supplement.
The authors declare that they have no conflict of interest.
We thank the researchers and crew of the R/V Hakuho-maru KH-12-1 cruise for
sampling over the eastern equatorial Pacific, and the researchers and technical
staff of LAPAN for the sampling over Biak. This work was supported by JSPS
KAKENHI grant numbers 23224013 and 26220101 and also by JAXA as its
Small-Size Project.
Edited by: Thomas Röckmann
Reviewed by: two anonymous referees
Akiyoshi, H., Zhou, L. B., Yamashita, Y., Sakamoto, K., Yoshiki, M., Nagashima, T., Takahashi, M., Kurokawa, J., Takigawa, M., and Imamura, T.: A CCM simulation of the breakup of the Antarctic polar vortex in the years 1980–2004 under the CCMVal scenarios, J. Geophys. Res., 114, D03103, https://doi.org/10.1029/2007JD009261, 2009.
Boering, K. A., Wofsy, S. C., Daube, B. C., Schneider, H. R., Loewenstein, M., Podolske, J. R., and Conway, T. J.: Stratospheric mean ages and transport rates from observations of carbon dioxide and nitrous oxide, Science, 274, 1340–1343, 1996.
Coplen, T. B.: Guidelines and recommended terms for expression of stable-isotope-ratio and gas-ratio measurement results, Rapid Commun. Mass Sp., 25, 2538–2560, https://doi.org/10.1002/rcm.5129, 2011.
Dee, D. P., Uppala, S. M., Simmons, A. J., Berrisford, P., Poli, P., Kobayashi, S., Andrae, U., Balmaseda, M. A., Balsamo, G., Bauer, P., Bechtold, P., Beljaars, A. C. M., van de Berg, L., Bid-lot, J., Bormann, N., Delsol, C., Dragani, R., Fuentes, M., Geer, A. J., Haimberger, L., Healy, S. B., Hersbach, H., Holm, E. V., Isaksen, L., Kallberg, P., Kohler, M., Matricardi, M., McNally, A. P., Monge-Sanz, B. M., Morcrette, J.-J., Park, B.-K., Peubey, C., de Rosnay, P., Tavolato, C., Thepaut, J.-N., and Vitart, F.: The ERA-Interim reanalysis: Configuration and performance of the data assimilation system, Q. J. Roy. Meteor. Soc., 137, 553–597, https://doi.org/10.1002/qj.828, 2011.
Engel, A., Möbius, T., Bönisch, H., Schmidt, U., Heinz, R., Levin, I., Atlas, E., Aoki, S., Nakazawa, T., Sugawara, S., Moore, F., Hurst, D., Elkins, J., Schauffler, S., Andrews, A., and Boering, K.: Age of stratospheric air unchanged within uncertainties over the past 30 years, Nat. Geosci., 2, 28–31, https://doi.org/10.1038/ngeo388, 2009.
Fueglistaler, S., Dessler, A. E., Dunkerton, T. J., Folkins, I., Fu, Q., and Mote, P. W.: Tropical tropopause layer, Rev. Geophys., 47, RG1004, https://doi.org/10.1029/2008RG000267, 2009.
Griffith, D. W. T., Toon, G. C., Sen, B., Blavier, J.-F., and Toth, R. A.: Vertical profiles of nitrous oxide isotopomer fractionation measured in the stratosphere, Geophys. Res. Lett., 27, 2485–2488, 2000.
Hasebe, F., Aoki, S., Morimoto, S., Inai, Y., Nakazawa, T., Sugawara, S., Ikeda, C., Honda, H., Yamazaki, H., Halimurrahman, Komala, N., Putri, F. A., Budiyono, A., Soedjarwo, M., Ishidoya, S., Toyoda, S., Shibata, T., Hayashi, M., Eguchi, N., Nishi, N., Fujiwara, M., Ogino, S.-Y., Shiotani, M., and Sugidachi, T.: Coordinated Upper-troposphere-to-stratosphere Balloon Experiment in Biak (CUBE/Biak), B. Am. Meteorol. Soc., https://doi.org/10.1175/BAMS-D-16-0289.1, in press, 2018.
Ishijima, K., Nakazawa, T., Sugawara, S., Aoki, S., and Saeki, T.: Concentration variations of tropospheric nitrous oxide over Japan, Geophys. Res. Lett., 28, 171–174, 2001.
Ishijima, K., Sugawara, S., Kawamura, K., Hashida, G., Morimoto, S., Murayama, S., Aoki, S., and Nakazawa, T.: Temporal variations of the atmospheric nitrous oxide concentration and its δ15N and δ18O for the latter half of the 20th century reconstructed from firn air analyses, J. Geophys. Res.-Atmos., 112, D03305, https://doi.org/10.1029/2006JD007208, 2007.
Ishijima, K., Patra, P. K., Takigawa, M., Machida, T., Matsueda, H., Sawa, Y., Steele, L. P., Krummel, P. B., Langenfelds, R. L., Aoki, S., and Nakazawa, T.: Stratospheric influence on the seasonal cycle of nitrous oxide in the troposphere as deduced from aircraft observations and model simulations, J. Geophys. Res., 115, D20308, https://doi.org/10.1029/2009JD013322, 2010.
Ishijima, K., Takigawa, M., Sudo, K., Toyoda, S., Yoshida, N., Röckmann, T., Kaiser, J., Aoki, S., Morimoto, S., Sugawara, S., and Nakazawa, T.: Development of an atmospheric N2O isotopocule model and optimization procedure, and application to source estimation, Atmos. Chem. Phys. Discuss., https://doi.org/10.5194/acpd-15-19947-2015, 2015.
Kaiser, J., Brenninkmeijer, C. A. M., and Röckmann, T.: Intramolecular 15N and 18O fractionation in the reaction of N2O with O(1D) and its implications for the stratospheric N2O isotope signature, J. Geophys. Res., 107, ACH 16-11–ACH 16-14, https://doi.org/10.1029/2001JD001506, 2002a.
Kaiser, J., Röckmann, T., and Brenninkmeijer, C. A. M.: Temperature dependence of isotope fractionation in N2O photolysis, Phys. Chem. Chem. Phys., 4, 4420–4430, 2002b.
Kaiser, J., Röckmann, T., Brenninkmeijer, C. A. M., and Crutzen, P. J.: Wavelength dependence of isotope fractionation in N2O photolysis, Atmos. Chem. Phys., 3, 303–313, https://doi.org/10.5194/acp-3-303-2003, 2003.
Kaiser, J., Engel, A., Borchers, R., and Röckmann, T.: Probing stratospheric transport and chemistry with new balloon and aircraft observations of the meridional and vertical N2O isotope distribution, Atmos. Chem. Phys., 6, 3535–3556, https://doi.org/10.5194/acp-6-3535-2006, 2006.
Kim, K.-R. and Craig, H.: Nitrogen-15 and oxygen-18 characteristics of nitrous oxide: A global perspective, Science, 262, 1855–1857, 1993.
Li, F., Austin, J., and Wilson, J.: The strength of the Brewer-Dobson circulation in a changing climate: Coupled chemistry-climate model simulations, J. Climate, 21, 40–57, https://doi.org/10.1175/2007JCLI1663.1, 2008.
McLandress, C. and Shepherd, T. G.: Simulated anthropogenic changes in the Brewer-Dobson circulation, including its extension to high latitudes, J. Climate, 22, 1516–1540, https://doi.org/10.1175/2008JCLI2679.1, 2009.
McLinden, C. A., Prather, M. J., and Johnson, M. S.: Global modeling of the isotopic analogues of N2O: Stratospheric distributions, budgets, and the 17O - 18O mass-independent anomaly, J. Geophys. Res., 108, 4233–4247, https://doi.org/10.1029/2002JD002560, 2003.
Michelsen, H. A., Manney, G. L., Gunson, M. R., and Zander, R.: Correlations of stratospheric abundances of NOy, O3, N2O, and CH4 derived from ATMOS measurements, J. Geophys. Res., 103, 28347–28359, 1998.
Minschwaner, K., Salawitch, R. J., and McElroy, M. B.: Absorption of solar radiation by O2: implications for O3 and lifetimes of N2O, CFCl3, and CF2Cl2, J. Geophys. Res., 98, 10543–10561, 1993.
Morgan, C. G., Allen, M., Liang, M. C., Shia, R. L., Blake, G. A., and Yung, Y. L.: Isotopic fractionation of nitrous oxide in the stratosphere: Comparison between model and observations, J. Geophys. Res.-Atmos., 109, D04305, https://doi.org/10.1029/2003JD003402, 2004.
Morimoto, S., Yamanouchi, T., Honda, H., Aoki, S., Nakazawa, T., Sugawara, S., Ishidoya, S., Iijima, I., and Yoshida, T.: A new compact cryogenic air sampler and its application in stratospheric greenhouse gas observation at Syowa Station, Antarctica, J. Atmos. Ocean. Tech., 26, 2182–2191, 2009.
Onogi, K., Tsutsui, J., Koide, H., Sakamoto, M., Kobayashi, S., Hatsushika, H. Matsumoto, T., Yamazaki, N., Kamahori, H., Takahashi, K., Kadokura, S., Wada, K., Kato, K., Oyama, R.,Ose, T., Mannoji, N., and Taira, R.: The JRA-25 reanalysis, J. Meteorol. Soc. Jpn., 85, 369–432, 2007.
Park, S., Atlas, E. L., and Boering, K. A.: Measurements of N2O isotopologues in the stratosphere: Influence of transport on the apparent enrichment factors and the isotopologue fluxes to the troposphere, J. Geophys. Res., 109, D01305, https://doi.org/10.1029/2003JD003731, 2004.
Park, S., Croteau, P., Boering, K., Etheridge, D. M., Ferretti, D. F., Fraser, P. J., Kim, K.-R., Krummel, P. B., Langenfelds, R. L., Van Ommen, T. D., Steele, L. P., and Trudinger, C. M.: Trends and seasonal cycles in the isotopic composition of nitrous oxide since 1940, Nat. Geosci., 5, 261–265, https://doi.org/10.1038/ngeo1421, 2012.
Plumb, R. A.: Stratospheric Transport, J. Meteorol. Soc. Jpn., 80, 793–809, 2002.
Plumb, R. A.: Tracer interrelationships in the troposphere, Rev. Geophys., 45, RG4005, https://doi.org/10.1029/2005RG000179, 2007.
Prinn, R. G., Weiss, R. F., Fraser, P. J., Simmonds, P. G., Cunnold, D. M., Alyea, F. N., O'Doherty, S., Salameh, P., Miller, B. R., Huang, J., Wang, R. H. J., Hartley, D. E., Harth, C., Steele, L. P., Sturrock, G., Midgley, P. M., and McCulloch, A.: A History of Chemically and Radiatively Important Gases in Air deduced from ALE/GAGE/AGAGE, J. Geophys. Res., 105, 17751–717792, 2000.
Rahn, T. and Wahlen, M.: Stable Isotope Enrichment in Stratospheric Nitrous Oxide, Science, 278, 1776–1778, 1997.
Röckmann, T. and Levin, I.: High-precision determination of the changing isotopic composition of atmospheric N2O from 1990 to 2002, J. Geophys. Res., 110, D21304, https://doi.org/10.1029/2005JD006066, 2005.
Röckmann, T., Brenninkmeijer, C. A. M., Wollenhaupt, M., Crowley, J. N., and Crutzen, P. J.: Measurement of the isotope fractionation of 15N14N16O, 14N15N16O and 14N14N18O in the UV photolysis of nitrous oxide, Geophys. Res. Lett., 27, 1399–1402, 2000.
Röckmann, T., Kaiser, J., Brenninkmeijer, C. A. M., Crowley, J. N., R, Borchers, Brand, W. A., and Crutzen, P. J.: Isotopic enrichment of nitrous oxide (15N14NO, 14N15NO, 14N14N18O) in the stratosphere and in the laboratory, J. Geophys. Res., 106, 10403–10410, 2001.
Sekiguchi, M. and Nakajima, T.: A k-distribution-based radiation code and its computational optimization for an atmospheric general circulation model, J. Quant. Spectrosc. Ra., 109, 2779–2793, 2008.
Toyoda, S. and Yoshida, N.: Determination of nitrogen isotopomers of nitrous oxide on a modified isotope ratio mass spectrometer, Anal. Chem., 71, 4711–4718, 1999.
Toyoda, S. and Yoshida, N.: Development of automated preparation system for isotopocule analysis of N2O in various air samples, Atmos. Meas. Tech., 9, 2093–2101, https://doi.org/10.5194/amt-9-2093-2016, 2016.
Toyoda, S., Yoshida, N., Urabe, T., Aoki, S., Nakazawa, T., Sugawara, S., and Honda, H.: Fractionation of N2O isotopomers in the stratosphere, J. Geophys. Res., 106, 7515–7522, 2001.
Toyoda, S., Yoshida, N., Urabe, T., Nakayama, Y., Suzuki, T., Tsuji, K., Shibuya, K., Aoki, S., Nakazawa, T., Ishidoya, S., Ishijima, K., Sugawara, S., Machida, T., Hashida, G., Morimoto, S., and Honda, H.: Temporal and latitudinal distributions of stratospheric N2O isotopomers, J. Geophys. Res., 109, D08308, https://doi.org/10.1029/2003JD004316, 2004.
Toyoda, S., Kuroki, N., Yoshida, N., Ishijima, K., Tohjima, Y., and Machida, T.: Decadal time series of tropospheric abundance of N2O isotopomers and isotopologues in the Northern Hemisphere obtained by using the long-term observation at Hateruma Island, Japan, J. Geophys. Res., 118, 3369–3381, https://doi.org/10.1002/jgrd.50221, 2013.
Toyoda, S., Yoshida, N., and Koba, K.: Isotopocule analysis of biologically produced nitrous oxide in various environments, Mass Spectrom. Rev., 36, 135–160, https://doi.org/10.1002/mas.21459, 2017.
Turatti, F., Griffith, D. W. T., Wilson, S. R., Esler, M. B., Rahn, T., Zhang, H., and Blake, G. A.: Positionally dependent 15N fractionation factors in the UV photolysis of N2O determined by high resolution FTIR spectroscopy, Geophys. Res. Lett., 27, 2489–2492, 2000.
von Hessberg, P., Kaiser, J., Enghoff, M. B., McLinden, C. A., Sorensen, S. L., Röckmann, T., and Johnson, M. S.: Ultra-violet absorption cross sections of isotopically substituted nitrous oxide species: 14N14NO, 15N14NO, 14N15NO and 15N15NO, Atmos. Chem. Phys., 4, 1237–1253, https://doi.org/10.5194/acp-4-1237-2004, 2004.
Waugh, D. W. and Hall, T. M.: Age of stratospheric air: Theory, observations, and models, Rev. Geophys., 40, 1010, https://doi.org/10.1029/2000RG000101, 2002.
Yung, Y. L. and Miller, C. E.: Isotopic fractionation of stratospheric nitrous oxide, Science, 278, 1778–1780, 1997.
Zhang, H., Wennberg, P. O., Wu, V. H., and Blake, G. A.: Fractionation of 14N15N16O and 15N14N16O during photolysis at 213 nm, Geophys. Res. Lett., 27, 2481–2484, 2000.