the Creative Commons Attribution 4.0 License.
the Creative Commons Attribution 4.0 License.
 | 07 Jun 2018
A long-term time series of global and diffuse photosynthetically active radiation in the Mediterranean: interannual variability and cloud effects
Pamela Trisolino
Alcide di Sarra
Fabrizio Anello
Carlo Bommarito
Tatiana Di Iorio
Daniela Meloni
Francesco Monteleone
Giandomenico Pace
Salvatore Piacentino
Damiano Sferlazzo
Measurements of global and diffuse photosynthetically active radiation (PAR) have been carried out on the island of Lampedusa, in the central Mediterranean Sea, since 2002. PAR is derived from observations made with multi-filter rotating shadowband radiometers (MFRSRs) by comparison with a freshly calibrated PAR sensor and by relying on the on-site Langley plots. In this way, a long-term calibrated record covering the period 2002–2016 is obtained and is presented in this work.
The monthly mean global PAR peaks in June, with about 160 W m−2, while the diffuse PAR reaches 60 W m−2 in spring or summer. The global PAR displays a clear annual cycle with a semi amplitude of about 52 W m−2. The diffuse PAR annual cycle has a semi amplitude of about 12 W m−2.
A simple method to retrieve the cloud-free PAR global and diffuse irradiances in days characterized by partly cloudy conditions has been implemented and applied to the dataset. This method allows retrieval of the cloud-free evolution of PAR and calculation of the cloud radiative effect, CRE, for downwelling PAR. The cloud-free monthly mean global PAR reaches 175 W m−2 in summer, while the diffuse PAR peaks at about 40 W m−2.
The cloud radiative effect, CRE, on global and diffuse PAR is calculated as the difference between all-sky and cloud-free measurements. The annual average CRE is about −14.7 W m−2 for the global PAR and +8.1 W m−2 for the diffuse PAR. The smallest CRE is observed in July, due to the high cloud-free condition frequency. Maxima (negative for the global, and positive for the diffuse component) occur in March–April and in October, due to the combination of elevated PAR irradiances and high occurrence of cloudy conditions. Summer clouds appear to be characterized by a low frequency of occurrence, low altitude, and low optical thickness, possibly linked to the peculiar marine boundary layer structure. These properties also contribute to produce small radiative effects on PAR in summer.
The cloud radiative effect has been deseasonalized to remove the influence of annual irradiance variations. The monthly mean normalized CRE for global PAR can be well represented by a multi-linear regression with respect to monthly cloud fraction, cloud top pressure, and cloud optical thickness, as determined from satellite MODIS observations. The behaviour of the normalized CRE for diffuse PAR can not be satisfactorily described by a simple multi-linear model with respect to the cloud properties, due to its non-linear dependency, in particular on the cloud optical depth. The analysis suggests that about 77 % of the global PAR interannual variability may be ascribed to cloud variability in winter.
- Article
(1735 KB) - Full-text XML
- BibTeX
- EndNote


The solar radiation between 400 and 700 nm is defined as photosynthetically active radiation (PAR; McCree, 1972) because it is involved in primary production and photosynthetic processes. Knowledge of PAR reaching the Earth's surface is essential for the determination of biomass production and for the understanding of terrestrial and marine vegetation physiology (Monteith, 1994; Field et al., 1998).
The spectral distribution of solar radiation and PAR, as well as the fraction that reaches the surface, is modified by the atmospheric components through absorption and scattering by clouds and aerosols, and through absorption by ozone and other minor gases, as a function of the solar zenith angle, and surface albedo. Besides solar zenith angle, clouds are the main modulators of PAR (e.g. Alados et al., 1996).
Terrestrial and marine vegetation may respond in complex ways to PAR, due to combination of photosynthesis, photo-inhibition, and photo-damage (e.g. Dimier et al., 2009). The repartition between direct and diffuse PAR, which depends on the solar zenith angle, atmospheric properties, and albedo, also affects primary production (e.g. Gu et al., 2002; Mercado et al., 2009; Min, 2005). The determination of these two components is very important for the understanding and description of photosynthetic processes.
Despite its importance, few direct measurements of PAR are carried out routinely, especially for the diffuse component. These measurements are particularly lacking over the sea, where very few measurements are available. This applies also to the Mediterranean, which is characterized by high levels of solar (e.g. Hatzianastassiou et al., 2005) and photosynthetically active radiation (e.g. Hader et al., 2008). Due to the complexity of the basin and of the occurring interactions, and the high anthropogenic pressure, long-term measurement programmes have been started in the Mediterranean with the aim of understanding the regional climate, underlying mechanisms, and impacts. Basin-wide experiments like the Chemistry and Aerosol Mediterranean Experiment (dedicated to chemistry–climate interactions; Mallet et al., 2016), the Marine Ecosystem Response in the Mediterranean Experiment (addressing the marine ecosystem; Mermex group, 2011), and the Hydrology Cycle in Mediterranean Experiment (dedicated to the water cycle; Drobinski et al., 2014), were started. Long-term observations play an important role within these experiments, for the understanding of variability and of the definition of conditions occurring during intensive measurement campaigns. This study is dedicated to discussing the long-term behaviour of PAR in the central Mediterranean based on observations made at the Atmospheric Observatory on the island of Lampedusa, in the central Mediterranean. Lampedusa is one of the long-term supersites of ChArMEx (Mallet et al., 2016) and an atmospheric site of HYMEX. Moreover, the determination of PAR in the marine environment is crucial for the quantification of the biomass production and the understanding of ecosystem processes. Thus, this study provides basic information related to different aspects of the regional Mediterranean climate.
Different approaches have been used to derive PAR: measurements with dedicated sensors (e.g. Alados and Alados-Arboledas, 1999), estimates from satellite observations (e.g. Frouin and Pinker, 1995), as a fraction of the broadband solar irradiance (e.g. Meek et al., 1984; Alados et al., 1996), or using empirical expressions (Udo and Aro, 2000). In a previous work (Trisolino et al., 2016), we developed a simple method to obtain calibrated global and diffuse PAR irradiances from measurements made with a multi-filter rotating shadowband radiometer, MFRSR. The method relies on narrowband measurements of global and diffuse irradiance in four bands within the PAR spectral interval, and on the possibility to frequently obtain on-site calibrations with the Langley plot method, without interruptions of the routine measurements.
In this work, we apply the method by Trisolino et al. (2016) to MFRSR measurements made at Lampedusa and derive a long-term series of global and diffuse PAR. The dataset covers the period January 2002–December 2016 and is used to investigate the behaviour and variability of global and diffuse PAR, and to quantify the influence of clouds on these components. The role of aerosols, which also play a large role in modulating PAR in the Mediterranean, will be discussed in a follow-up paper. Section 2 describes the site and the instruments used in this study. The long-term time series of global and diffuse PAR is presented in Sect. 3 for all-sky and cloud-free conditions. Cloud effects are discussed in Sect. 4.
The instruments used for this study are Li-190 PAR sensors and MFRSR radiometers installed at the ENEA (Italian National Agency for New Technologies, Energy, and Sustainable Economic Development) Atmospheric Observatory on the island of Lampedusa (35.5∘ N, 12.6∘ E; http://www.lampedusa.enea.it/), in the central Mediterranean Sea. The observatory is located along the north-eastern promontory of Lampedusa, at about 45 m above mean sea level. The instruments are installed on the roof of the main Observatory building, at about 15 m from the northern cliff of the island; the instruments' field of view is almost totally devoid of obstacles. Lampedusa is a small island (about 20 km2 surface area) relatively far (> 100 km) from continental regions and with a very limited impact from local sources. A large set of instruments for the characterization of regional climate and relevant parameters (radiation, greenhouse gases, aerosol, water vapour, clouds, ozone, etc.; see, e.g., Ciardini et al., 2016) is operational at the Lampedusa Atmospheric Observatory, which contributes to the World Meteorological Organization Regional Global Atmosphere Watch Network.
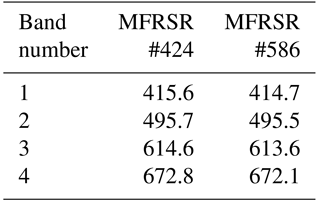
Table 1Nominal central wavelengths (in nm) of the four bands used in the PAR estimate for the two MFRSR radiometers. The FWHM bandwidth is about 10 nm for all channels.
Measurements of PAR global irradiance were started in Lampedusa with a Li-Cor 190 radiometer in June 2004. The PAR sensor consists of a diffuser, a visible bandpass interference filter, and a Si photodiode and measures the down-welling PAR irradiance. According to Ross and Sulev (2000) the systematic spectral errors of the Li-190 do not exceed 1 %; this sensor also display a good angular response, with a maximum deviation from the ideal cosine response of 7 % at 80∘, and larger deviations for larger angles (Akitsu et al., 2017). Different Li-190 PAR sensors have been operational at Lampedusa; only data from two freshly calibrated instruments in two periods are used in this study, essentially to derive regression parameters which allow obtaining PAR irradiances from MFRSR signals, as in Trisolino et al. (2016). Two-hundred-watt quartz tungsten halogen lamps traceable to the US National Institute of Standards and Technology (NIST) have been used during the calibration by the manufacturer. The estimated uncertainty is less than ±5 % (typically ±3 %). The PAR irradiance measured with a Li-190, PARL, is used as reference determination during a period of 6–7 months following the factory calibration.
The multi-filter rotating shadowband radiometer uses six narrow-band and one broadband channel with a single input diffuser and different interference filter and photodiode detectors to measure global and diffuse components of the solar irradiance. The six narrow bands have a bandwidth (FWHM) of about 10 nm and are centred at the wavelengths of about 415, 500, 615, 673, 879, and 940 nm. With an automatic rotating shadowband, the instruments measures the diffuse component of the irradiance. This allows deriving the irradiance direct component as the difference between global and diffuse measurements (Harrison, 1994). MFRSR measurements at Lampedusa were started in 2001, and different instruments have been used in different periods. The data used in this study are from MFRSR #424, operational from 2001 to 2011, and from MFRSR #586, which was installed in 2011 and has been operational since then. The central wavelengths of the 4 bands within the PAR spectral range for the two MFRSR radiometers are reported in Table 1. MFRSR data are calibrated on site with the Langley plot method, and the aerosol optical depth is derived routinely at several wavelengths. The Langley plot methods allows deriving estimates of the signal that would be measured by the instrument at zero air mass. This signal is derived by extrapolating the curve of the logarithm of the signal when plotted versus the air mass, and good estimates are obtained in days with stable atmospheric optical depths. Thus, the zero air mass signal may be derived from ordinary measurements by selecting days characterized by cloud-free and low aerosol variability conditions. Further details on the MFRSR radiometers operating at Lampedusa and on the applied calibration method are given by di Sarra et al. (2015). In addition to MFRSR, a Cimel sun photometer which is part of the Aerosol Robotic Network (AERONET; Holben et al., 1998) is operational at Lampedusa. The MFRSR data are corrected for the aerosol forward scattering for cases of large particles, and an aerosol optical depth record constituted by the integrated dataset of MFRSR and AERONET data is obtained (di Sarra et al., 2015).
A calibration of the PAR sensors at least every 2 years is recommended by the manufacturer. Using the method by Trisolino et al. (2016) it is possible derive global and diffuse PAR irradiances with a good accuracy, using MFRSR measurements and taking advantage of the MFRSR in situ calibration with the Langley plot method. Two sets of regression coefficients needed to derive PAR from MFRSR measurements in the four bands falling in the PAR range were derived. The first set was derived as in Trisolino et al. (2016), in the period 2 March–30 May 2007 by comparing MFRSR #424 signals with the irradiance measured with a freshly calibrated PAR, # Q36970. The second sets was derived for MFRSR #586 by comparing its signals with PAR # Q100313 measurements in the period 19 September–21 December 2015. It must be noted that two different sets of coefficients are needed, due to the somewhat different central wavelengths of the filters of the two instruments. Li-190 # Q36970 was calibrated at the factory in November 2006, and Li-190 # Q100313 in May 2015.
Following Trisolino et al. (2016), the PAR irradiance was derived by linearly combining the calibrated MFRSR signals in the four channels falling in the PAR spectral range. The following relationship is used to infer calibrated PAR measurements:
in which S1, S2, S3, and S4 are the signals at channels centred at about 415, 500, 615, and 675 nm, and c1, c2, c3, and c4 are coefficients. The coefficients are obtained by minimizing the difference between PAR and PARL. The two sets of coefficients for the two MFRSR radiometers used in this study are reported in Table 2.
As discussed in Trisolino et al. (2016), the estimated uncertainty on the MFRSR-derived PAR is about 5 % for the global, and 9 % for the diffuse irradiance.
MFRSR-derived diffuse PAR irradiances were compared with radiative transfer model (MODTRAN 5.3) calculations in Trisolino et al. (2016) because direct measurements of diffuse PAR were not available. A Li-190 sensor, #101552, was installed on a sun tracker for diffuse PAR measurements at Lampedusa on 18 February 2016, and has been operational since then. PAR #101552 was calibrated at the factory in December 2015. Thus, we have the opportunity to verify the estimated values of diffuse PAR against diffuse PARL. Overlapping data between 19 February and 25 May 2016 are used in the comparison. The scatterplot and the fit between 5 min averages of diffuse PAR derived from MFRSR and diffuse PARL are shown in Fig. 1 for all atmospheric conditions.
The root-mean-squared difference between the two datasets is around 9 %. If we quadratically sum the absolute uncertainty on PAR measurement (3–5 %), we have a total estimated uncertainty of about 10 %. This value is in agreement with the uncertainty estimate based on the comparison with the radiative transfer model reported by Trisolino et al. (2016).
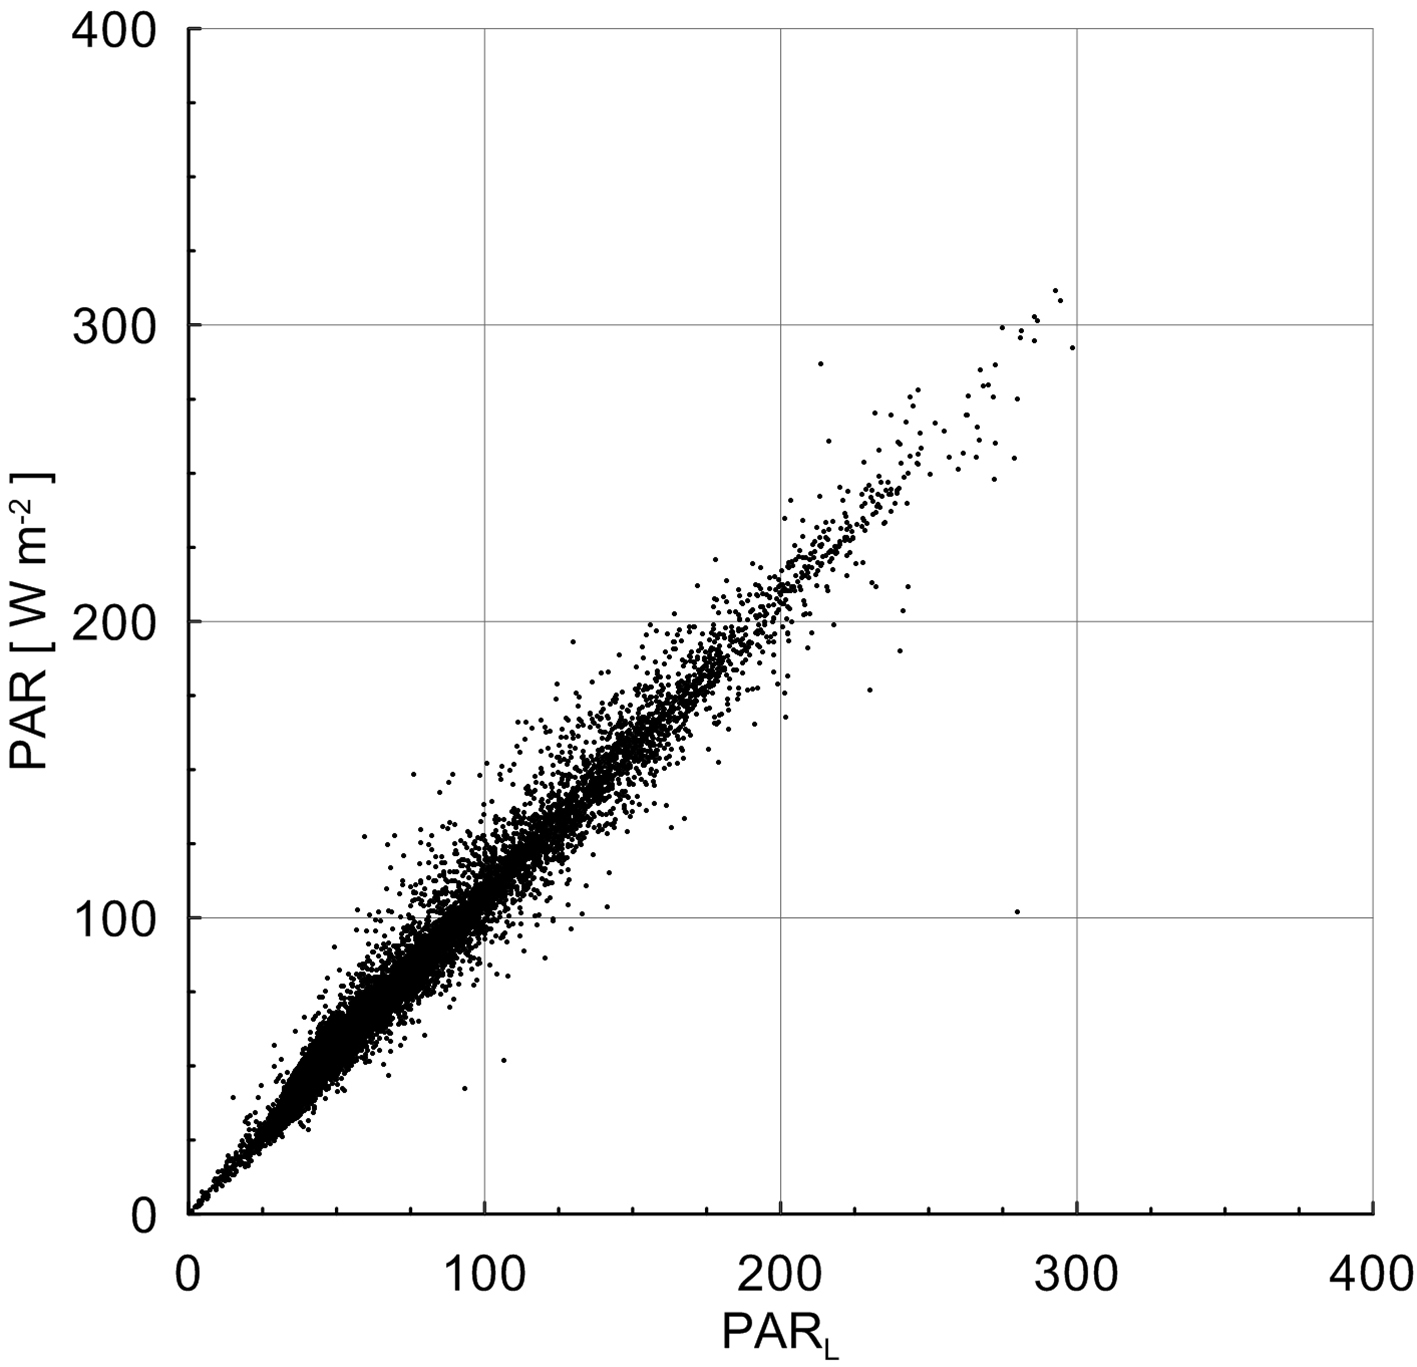
Figure 1Scatterplot between 5 min averages of PAR and PARL for the period 19 February–25 May 2016 at Lampedusa. The linear fit is also shown.
By comparing PARL from different Li-190 sensors obtained with the original factory calibration with PAR inferred from MFRSR measurements, it is possible to determine the long-term variation of the Li-190 sensitivity. All different PAR sensors display a long-term decrease in the instrumental sensitivity. This decrease, calculated over at least 2 years, is between 0.6 and 2.3 % yr−1. This is consistent with the results by Mizoguchi et al. (2010), who found a degradation by 1–3 % after 1 year of field operation for different PAR sensors. Our data show in some cases a faster decline, up to 15 % yr−1, for specific sensors over shorter periods (a few months), which appears to generally take place during the first months of use. Similar reductions were observed by Blum and Schwank (1985) and, more recently, by Akitsu et al. (2017). This behaviour suggests that a frequent calibration and redundancy in the measurements may be required to obtain accurate PAR observations. The possibility to rely on on-site routine calibrations, as is the case for the method used in this study, guarantees a better long-term accuracy than obtainable from standard PAR observations.
Table 2Coefficients, in W m−2, of the linear fit between PAR and MFRSR calibrated signals for the four-band linear model.
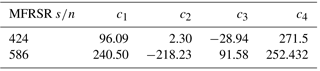
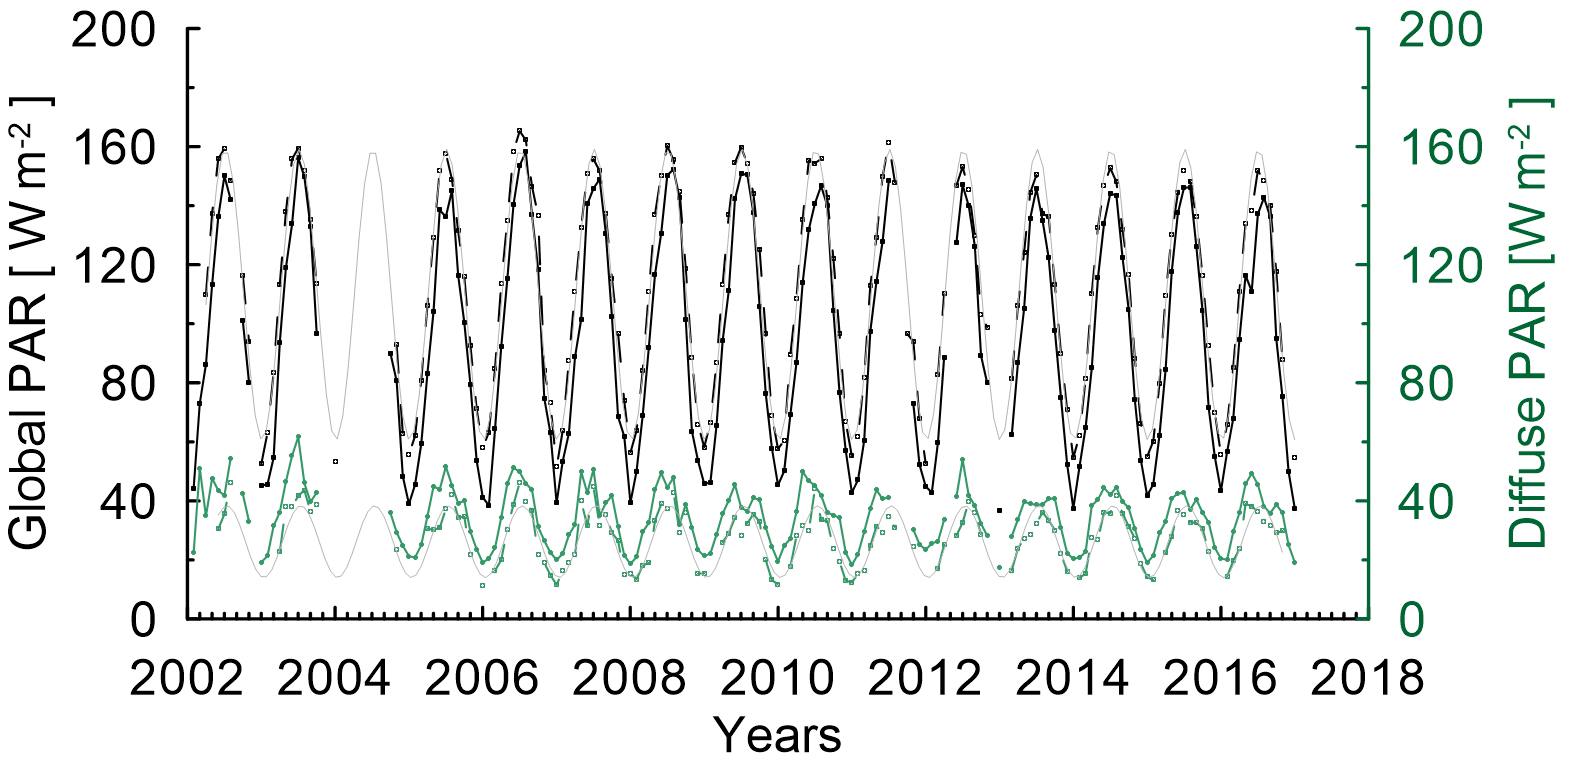
Figure 2Time series of monthly mean global (black lines) and diffuse (green lines) PAR for cloud-free (dashed lines) and all-sky conditions (continuous lines). Fitting curves (see text) are shown by thin lines for the cloud-free time series.
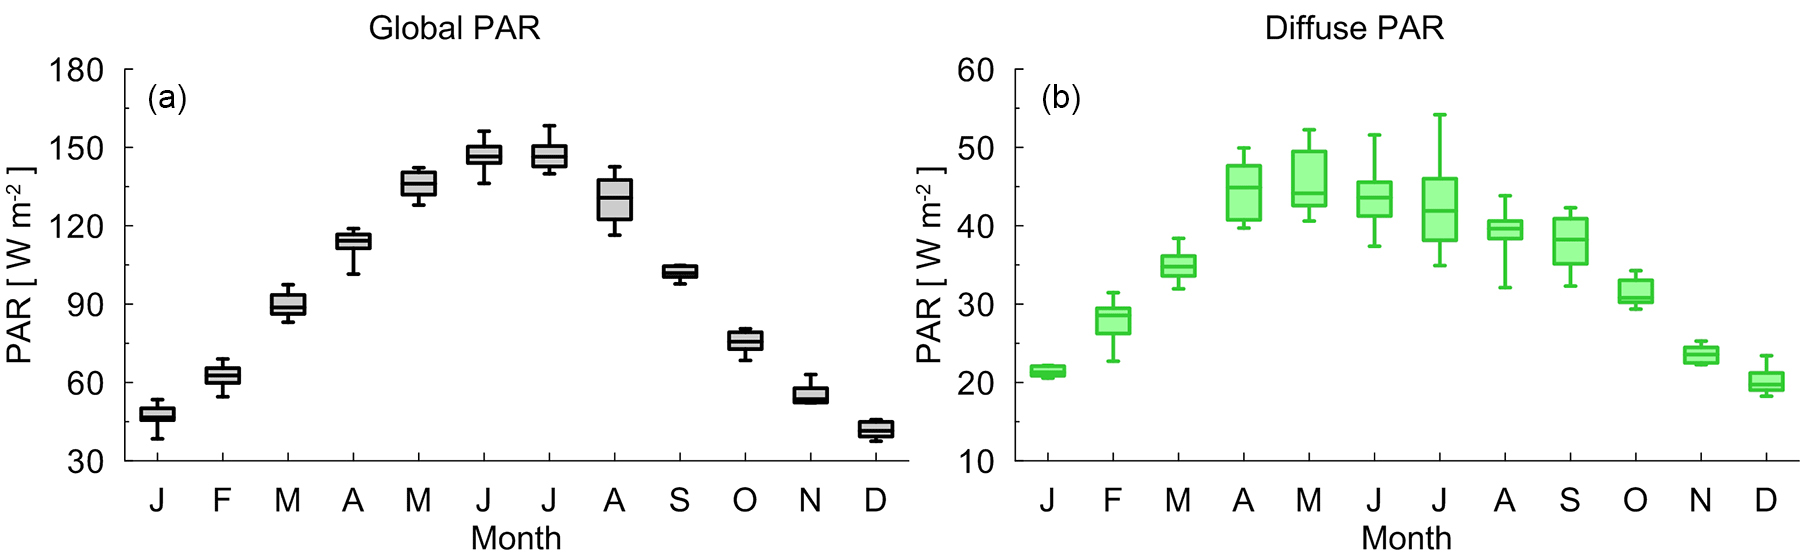
Figure 3Annual evolution of median, lower and upper quartiles, maxima, and minima of global (a) and diffuse (b) monthly average PAR.
3.1 All-sky conditions
The time series of monthly mean global and diffuse component of photosynthetically active radiation from MFRSR measurements over the period 2002–2016 is shown in Fig. 2. The MFRSR data are acquired every 15 s; hourly and then daily averages are calculated from the 15 s measurements. Monthly means are calculated from daily values for those months with at least 27 daily average values. Data acquired at solar zenith angles larger than 80∘, affected by a significant cosine response error (e.g. Mizoguchi et al., 2010; Akitsu et al., 2017), are excluded. This limitation on the solar zenith angle produces an underestimate of the daily PAR by about 1.4 ± 0.5 Wm−2 for the global component, and 1.1 ± 0.3 Wm−2 for the diffuse component.
Figure 2 shows the monthly mean global and diffuse PAR as derived from MFRSR observations. The two data series display a typical annual cycle with a summer maximum, driven by the annual course of the solar zenith angle, with significant interannual variability. The year-to-year changes of the annual mean values are of about 4 W m−2 for both global and diffuse PAR; the relative interannual changes are thus much larger for diffuse than for global PAR.
Mean annual cycles
Figure 3 shows the annual evolution of monthly median, percentiles, maxima and minima of global and diffuse PAR. Global PAR shows an evident annual cycle with a single summer maximum, while diffuse PAR displays a more complex seasonal evolution, with a first maximum in April and a secondary in June. This behaviour of diffuse PAR is primarily due to the large role played by atmospheric aerosols, mainly during the summer months, when cloud-free conditions are frequent. The role of the aerosol will be discussed in a separate study.
Alados et al. (1996) show the annual evolution of global PAR in Almeria (36.83∘ N, 2.41∘ W), at a latitude close to that of Lampedusa, but on land. The differences between the monthly median values of the two datasets are generally within 10 %. Largest differences are found in March.
Yu et al. (2015) show ground-based measurements of daily global PAR at several sites of the Surface Radiation, SURFRAD, network in the United States for the year 2011. Goodwin Creek (34.3∘ N, 89.9∘ W; 98 m a.m.s.l.) and Desert Rock (36.6∘ N, 116.0∘ W; 1007 m a.m.s.l.) are located in the same latitude band as Lampedusa. Despite representing very different environments, PAR measurements are in reasonable agreement with those of Lampedusa: differences with respect to Lampedusa are about 3 % in summer and 4 % in winter for Desert Rock, and 12 % in summer and 3 % in winter for Goodwin Creek.
Jacovides et al. (2004) report global PAR observations made over 3 years (September 1997–May 2000) in Athalassa, Cyprus, in the eastern Mediterranean. The daily values of PAR in Cyprus are in good agreement with those at Lampedusa, with differences between maximum mean values of about 4 % in summer and 8 % in winter.
Very few studies are dedicated to the annual evolution of the diffuse PAR and, to our knowledge, no direct measurements over the sea or on small islands are available.
Measurements of diffuse PAR at latitudes similar to that of Lampedusa were reported by Dye (2004) and Wang et al. (2017). Dye et al. (2004) show measurements of diffuse PAR at the Southern Great Plains Atmospheric Radiation Measurement, ARM, programme site (36.6∘ N, 97.5∘ W; 314 m) between 1 March and 31 July 2000. Differences between the monthly mean diffuse PAR at Southern Great Plains and Lampedusa are between 7 % in July and 19 % in June.
Wang et al. (2017) applied various methods to estimate the diffuse PAR to observations made in Canada and in USA with Delta-T BF3 sensors. Two of the sites used in this study are located at the same latitude as Lampedusa (US-fuf: 35.09∘ N, 111.76∘ W; US-fwf: 35.45∘ N, 111.77∘ W) but are at about 2200 m above mean sea level (2180 and 2270 m, respectively) and in different terrestrial environments (woody savannas and grassland, respectively). The monthly diffuse PAR at Lampedusa is 25–54 % of that at US-fwf, and 17–52 % of that at US-fuf. This large difference is primarily due to altitude and albedo, and possibly clouds.
Differences in altitude, surface properties and albedo, aerosol, and clouds are expected to play a large role in the diffuse PAR modulation, and the agreement found between sites at similar latitude may be somewhat incidental.

Figure 4Monthly statistics of the fraction of cloud-free sky between 09:00 and 14:00 UTC. Only months with at least 27 days with measurements in the period 2002–2016 are considered. Minimum, lower quartile, median, upper quartile, and maximum are indicated (from the bottom to the top) for each month. The number of monthly mean values used for each month is displayed above the top axis.
After solar zenith angle, clouds are the main modulation factor, which are expected to act differently on the global and diffuse PAR components.
In general, if we exclude global irradiance enhancements which may occur with scattered cloud conditions, the global irradiance for cloudy conditions is expected to be always lower than for cloud-free sky. Conversely, the diffuse irradiance is larger than in cloud-free conditions for thin and moderate clouds and is smaller for thick clouds. Thus, the relationship between cloudiness and diffuse PAR is expected to be more complex than for the global component.
Figure 4 shows the monthly mean occurrence of cloud-free conditions (cloud cover approximately lower than 1 okta and direct radiation unobstructed; see Sect. 4.1 for more details on the cloud-free identification scheme) between 09:00 and 14:00 UTC. The monthly median and quartiles are calculated over the 2002–2016 time interval, considering only months with at least 27 days with measurements.
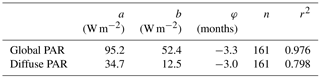
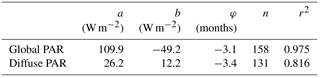
Table 3Coefficients of the fit, number of data, and correlation coefficient for the global and diffuse monthly PAR time series.
The largest interquartile range of the global PAR irradiance is observed to occur in April and August. This is due to the combination of elevated PAR levels and a higher cloud occurrence than in June and July.
Largest median values of diffuse PAR are found in April. The monthly diffuse PAR median is lower in summer than in April, although the solar zenith angle is higher, due to the higher rate of occurrence of cloud-free conditions. In addition to the cloud occurrence, cloud properties are expected to play a significant role in determining the amount of global and diffuse PAR reaching the surface.
The average diffuse-to-global PAR ratio is 0.39 ± 0.08 and displays a marked seasonal variation, with maxima around 0.5 in winter and minima at about 0.25–0.3 in summer.
The monthly time series shown in Fig. 2 was fitted with the following simple oscillatory function,
with the aim of quantitatively determining the main parameters of the PAR evolution. The coefficients a, b, and φ, retrieved for the global and diffuse PAR, are reported in Table 3, while the fitting curve is also included in Fig. 2. The variable ω is 2π∕12 and t is in months.
As discussed in Sect. 2, our time series is based on the determination of weighting coefficients for the signals of two MFRSR instruments against two freshly calibrated PAR sensors. The two determinations took place in 2007 and 2015. Unfortunately, we do not have overlapping reliable PAR observations in 2011, when MFRSR #424 stopped working and was replaced by MFRSR #586. Thus, the series relies on two independent calibrations of PAR sensors, whose nominal accuracy is between 3 and 5 %. Thus, we can not exclude that a step change in calibration, within the nominal accuracy of the used sensors, took place in 2011. Since there is no independent verification with a higher degree of accuracy, we have preferred to avoid calculating trends on the time series. Thus, we did not include a term describing the trend in f(t).
As expected, the correlation coefficient between data and the fitting function is higher for global than for diffuse PAR. The ratio between the annual semi amplitude, b, and the long-term average is larger for the global than for the diffuse PAR (0.55 vs. 0.36).
3.2 Cloud-free conditions
As discussed above, clouds play a large role in modulating the PAR evolution and variability. The determination of PAR in cloud-free conditions is necessary to quantitatively assess the role played by clouds. Thus, we have developed a method to infer monthly mean cloud-free global and diffuse irradiances, which may be used to determine the cloud radiative effect in the PAR spectral range.
3.2.1 Determination of cloud-free PAR
The determination of cloud-free PAR irradiances is based on the identification of cloud-free conditions. Measurements of MFRSR radiometers are used to select cloud-free periods. The algorithm developed by Biavati and di Sarra (2004) is an adaptation of the method by Long and Ackerman (2000) to the characteristic conditions and properties of the aerosol observed at Lampedusa. This algorithm, briefly described by Meloni et al. (2007), allows determining periods with no clouds, also with high values of aerosol optical depth. The method is very selective and allows identifying sky conditions virtually devoid of clouds. A comparison with sky imager pictures shows that the algorithm selects cases with cloud cover ≤ 1 okta and sun unobstructed by clouds. This method has been used to select conditions suitable for the determination of aerosol radiative effects, for which the cloud radiative influence needs to be negligible (see, e.g., di Sarra et al., 2008; Di Biagio et al., 2010).
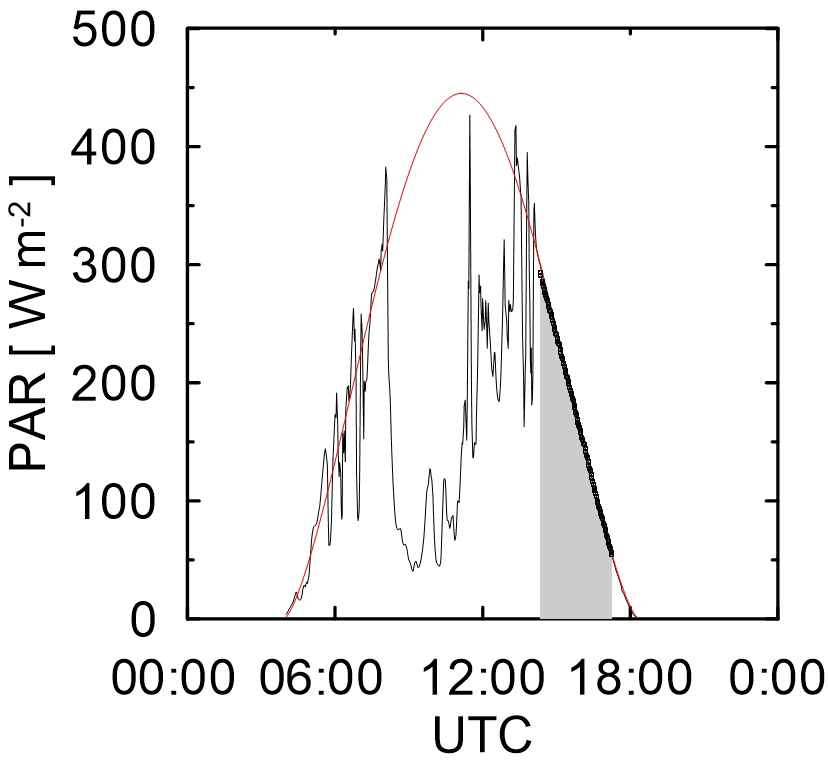
Figure 5PAR measured during 4 June 2016, a partially cloudy day (black line). The cloud-screened data are shown as black dots, and the cloud-free fitting function is shown in red.
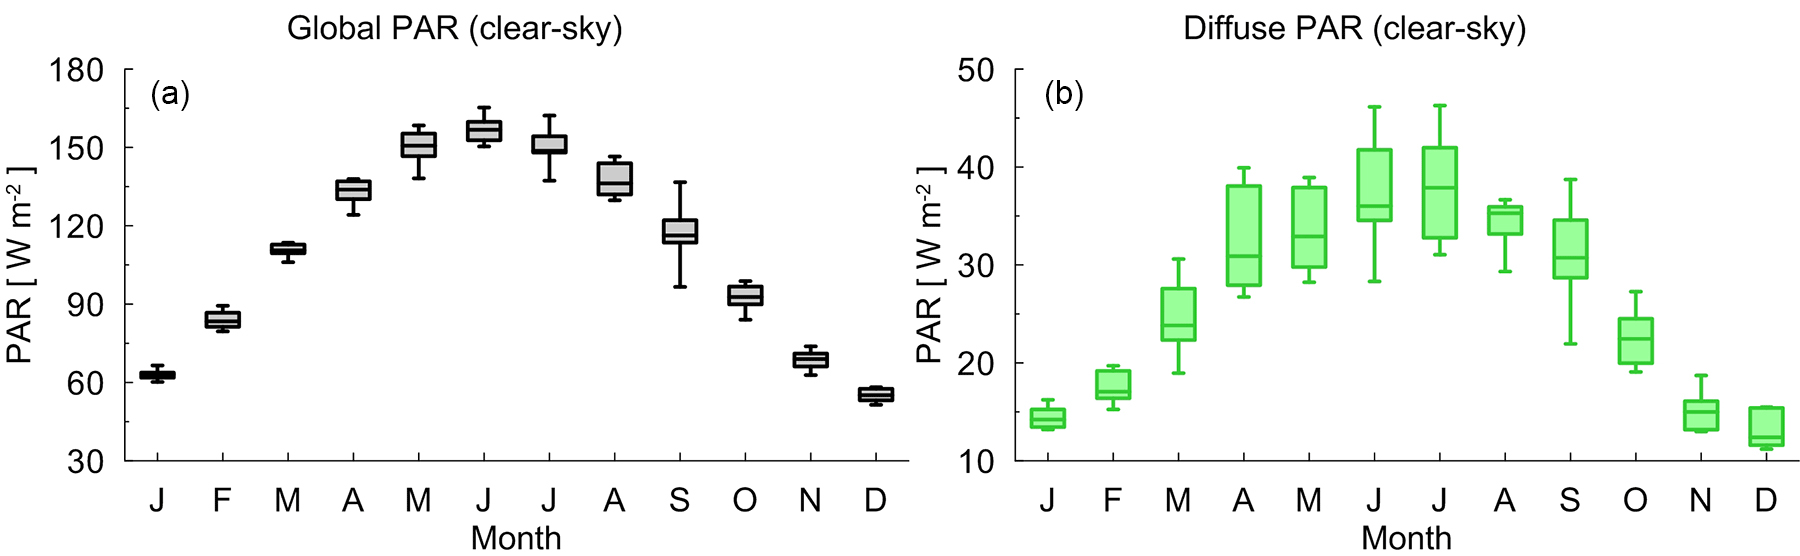
Figure 6Annual evolution of global (a) and diffuse (b) cloud-free PAR; maxima, upper quartile, median, lower quartile, and minima of the monthly mean are displayed.
With the aim of estimating the cloud-free irradiance during partly cloudy days we applied to PAR the method proposed by Long and Ackerman (2000) for the shortwave radiation. The following function,
is fit to the PAR data in cloud-free intervals, and is used to estimate the cloud-free expected irradiance during cloudy intervals. The variable θ is the solar zenith angle and A is the cloud-free irradiance for a solar zenith angle of 0∘; the fitting curve includes the effects of the atmosphere constituents (changes in atmospheric pressure, aerosol, and absorbing gases) which affect PAR and are assumed to vary slowly, and possible residual instrumental calibration inaccuracies. The B coefficient includes possible effects of the cosine response of the instrument. The contribution of water vapour to the modulation of PAR is negligible; this is an advantage in applying this fitting procedure to PAR data with respect to the whole shortwave range.
Figure 5 shows the measured PAR and the derived fit for a day with only a portion with cloud-free conditions.
The coefficients are determined for every partly cloudy day. The Long and Ackerman method requires some minimum number of cloud-free measurements over a significant range of solar zenith angle. The method is not applicable to days with persistent overcast conditions, or when few short cloud-free intervals are present. Thus, only a selection of cases is retained in the cloud-free dataset. These are selected by visually looking at the fitting curve and eliminating the days with incomplete or inadequate fits.
Table 4Coefficients of the fit, number of data and correlation coefficient for the cloud-free global and diffuse monthly PAR time series.
3.2.2 Long-term cloud-free PAR irradiances
We obtain a long-term time series of cloud-free PAR estimates using the method described in Sect. 4.1. The monthly mean values for cloud-free conditions are calculated from daily means with at least 11 daily values. During the winter months, averages calculated with at least 5 values are also accepted for diffuse PAR, due to the low number of available days for which it is possible to estimate the cloud-free irradiance. The monthly mean time series of global and diffuse irradiance is shown in Fig. 2 together with those obtained in all-sky conditions.
As expected, the global irradiance is always larger than for all-sky conditions, while the opposite occurs for the diffuse PAR. The average diffuse-to-global PAR ratio is 0.237 ± 0.035; the seasonal variation is much smaller than for all-sky conditions.
As for the PAR measurements in all-sky conditions, the time series was fit with expression (1). The fitting coefficients for cloud-free series are reported in Table 4.
The values of the annual semi-amplitudes are very close for all-sky and cloud-free conditions, while the long-term average is larger for cloud-free conditions for global PAR as well as for all-sky conditions for diffuse PAR. The ratio between the annual cycle semi-amplitude and the long-term average is about 0.45 for both the global and the diffuse components for cloud-free conditions. The ratio between the diffuse and the global PAR long-term averages is 0.24; this is significantly smaller than for all-sky conditions.
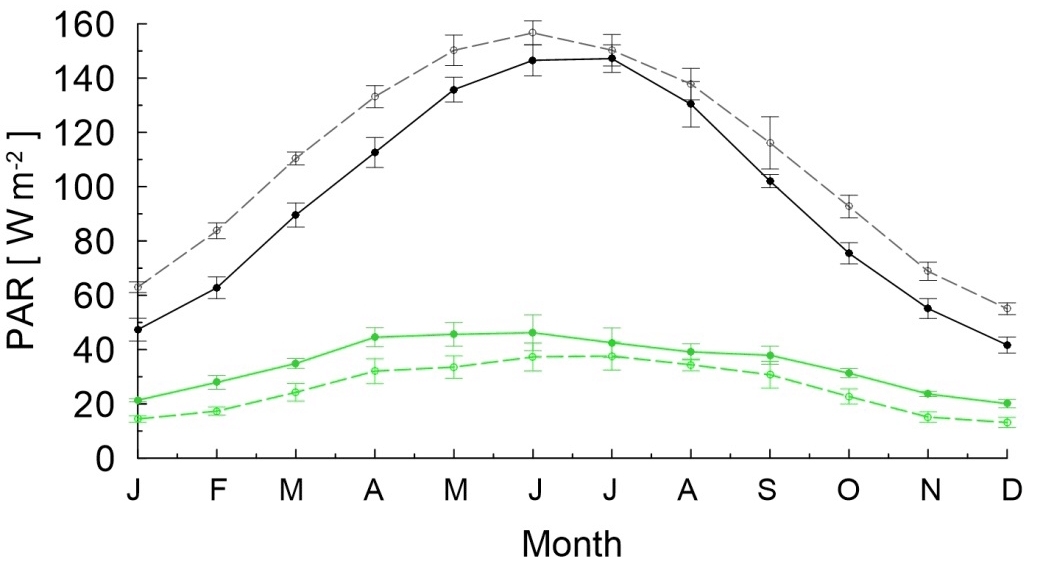
Figure 7Global (black) and diffuse (green) monthly average PAR in all-sky (solid lines) and in cloud-free (dashed lines) conditions.
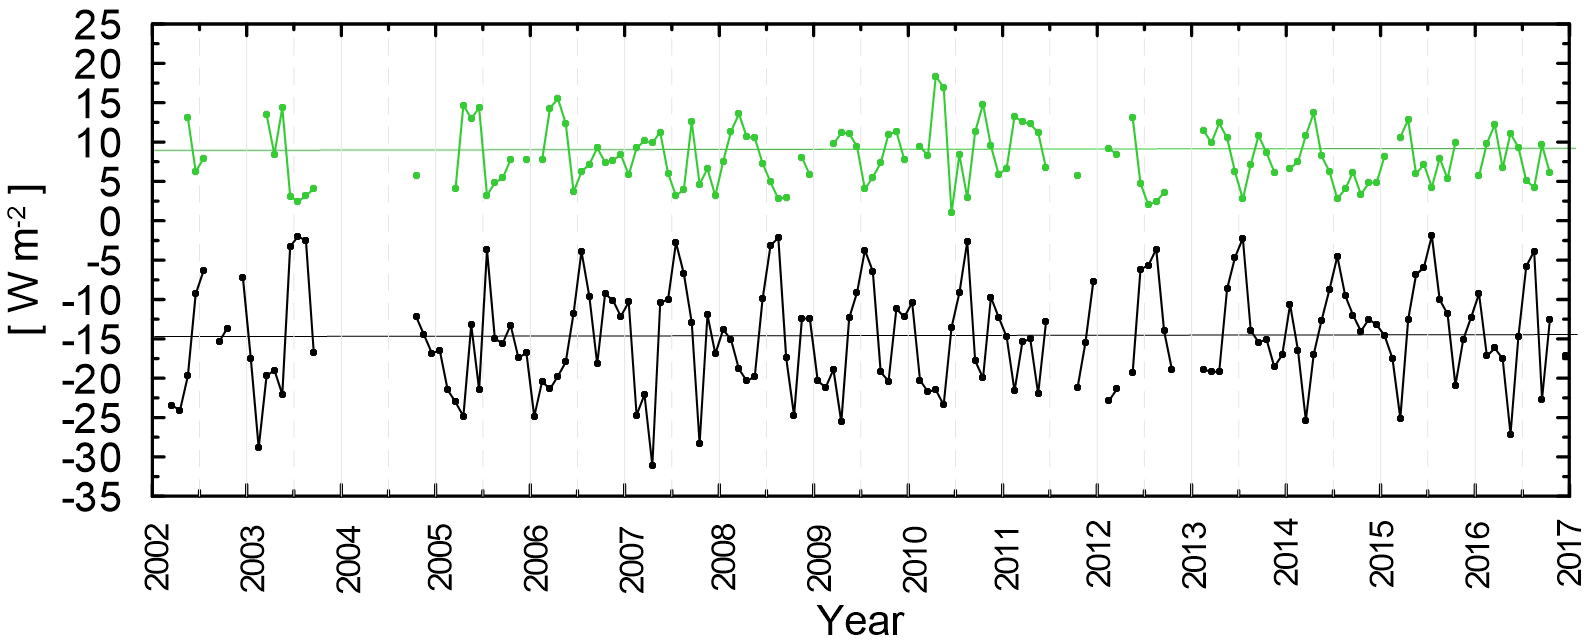
Figure 8Time series of monthly mean cloud radiative effect for global (black) and diffuse (green) PAR, calculated as the difference between all-sky condition and cloud-free monthly mean PAR (see text). Horizontal lines are mean values of global and diffuse PAR, respectively.
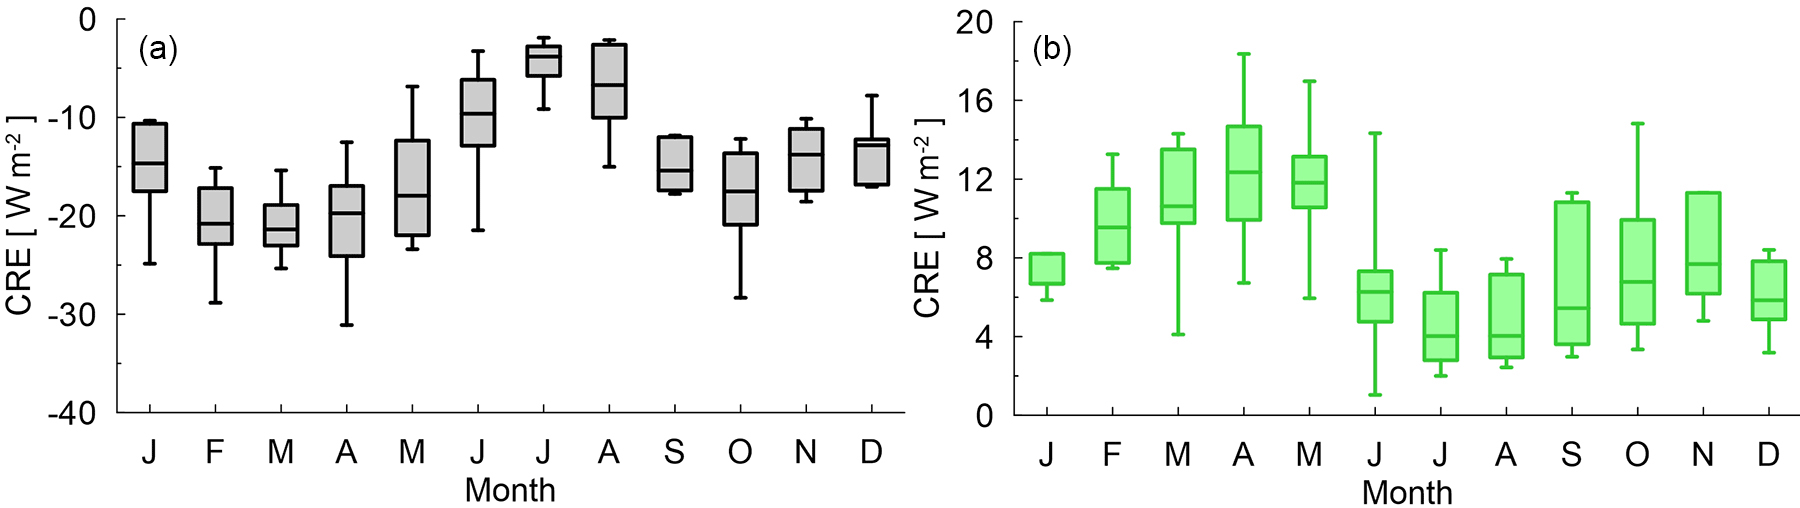
Figure 9Annual evolution of global (a) and diffuse (b) PAR CRE. Maxima, upper quartile, median, lower quartile, and minima of the monthly values are displayed.
3.2.3 Mean annual cycles
The average annual evolution of global and diffuse cloud-free PAR is shown in Fig. 6. The PAR interannual variability in this case is primarily attributable to aerosol. As discussed by di Sarra et al. (2015) and by Di Iorio et al. (2009), the aerosol distribution at Lampedusa is characterized by a significant annual cycle, essentially modulated by the occurrence of desert dust events, which generally occur in spring and summer (Meloni et al., 2007). The day-to-day variability is largest in spring and summer, and smallest in winter. This behaviour is evident in the variability of both global and diffuse PAR. Previous studies carried out at Lampedusa have shown that this aerosol variability largely affects UV (di Sarra et al., 2002; Meloni et al., 2005; Casasanta et al., 2011), solar radiation (di Sarra et al., 2008; Di Biagio et al., 2010) and, for desert dust particles, infrared radiation (di Sarra et al., 2011; Meloni et al., 2015).
Figure 7 shows the comparison between the monthly average for all-sky and for cloud-free conditions. The difference between the two curves is the monthly mean cloud radiative effect, CRE, which is produced by clouds on downwelling global and diffuse PAR at Lampedusa. The reader is reminded that this analysis is based on a selective cloud screening, and partially cloudy or short cloud-free intervals are classified as cloudy by our algorithm.
The differences between all-sky and cloud-free global and diffuse downwelling irradiances are shown in Fig. 8. As expected, CRE is negative (a reduction of down-welling PAR) for global, and positive (an increase) for diffuse PAR. The long-term average cloud radiative effect is about −14.7 W m−2 for the global component, and +8.1 W m−2 for the diffuse PAR. The interannual variability is significant.
Extended summer periods with small values of CRE (> −7 W m−2 for the global component) occur in 2003, 2008, 2009, 2012, 2013, and 2015. It is interesting to note that elevated summer temperatures were recorded at Lampedusa during the summer seasons of 2003, 2009, 2012, and 2015 (Ciardini et al., 2016). Some of these events (e.g. 2003, 2015) were recorded at the regional level.
Extended time intervals with large cloud effects occurred in several periods (early 2003, 2005, 2006, 2010), while cases with large cloud effects over limited periods are also present (late 2007, early 2013 and 2014, mid-2016). Some of these negative peaks appear to correspond with cold winters at Lampedusa (e.g. in 2003, 2005, 2006, 2009, 2012, 2013, and 2015; Ciardini et al., 2016).
Figure 9 shows the annual evolution of the monthly median CRE and its variability, for the global and diffuse component. The absolute value of the diffuse CRE displays an annual evolution similar, but opposite in sign, to the global. The absolute value of CRE is smallest during months characterized by dominant cloud-free conditions, generally in late summer, and shows a maximum generally between March and April, and sometimes a secondary maximum in October. For the diffuse CRE the maximum variability takes place in September, and the largest CRE median in April.
Pyrina et al. (2015) investigated the effect of clouds on the shortwave radiation in the Mediterranean basin in the period 1984–2007 based on satellite observations and radiative transfer model calculations. The seasonal patterns of the surface CRE in the shortwave, CRESW, is similar to that for CRE of global PAR in Fig. 10, with maximum values in April–May and a secondary maximum in October. The secondary maximum in October is less pronounced in the analysis by Pyrina et al. than at Lampedusa. Data by Pyrina et al. show a significant variability of CRESW throughout the basin, and particularly in the north–south direction, except in October.
Pyrina et al. (2015) also show that the radiative effects depend on the cloud type.
We have investigated this aspect by extracting monthly average cloud properties retrieved by the Moderate Resolution Imaging Spectroradiometer, MODIS, on board Aqua over a region 2∘ × 2∘ around Lampedusa. Level 3 monthly mean cloud optical thickness (COT), cloud fraction (CF), and cloud top pressure (CTP) determined from July 2002 to December 2016 are used (MOD08_M3_6). Monthly averages from daytime observations from MODIS Aqua, whose daytime passage over Lampedusa is close to solar noon, have been selected.
Level 3 MODIS products are based on a cloud mask for the identification of cloudy pixels, with a resolution of 5 km.
Cloud optical thickness is derived from multispectral reflectance measurements compared with parametrizations obtained from a theoretical model, simulated as a function of three different geometrical angles. The look-up table of the theoretical model results contains reflectance values, effective radii, and surface albedo (King et al., 1997).
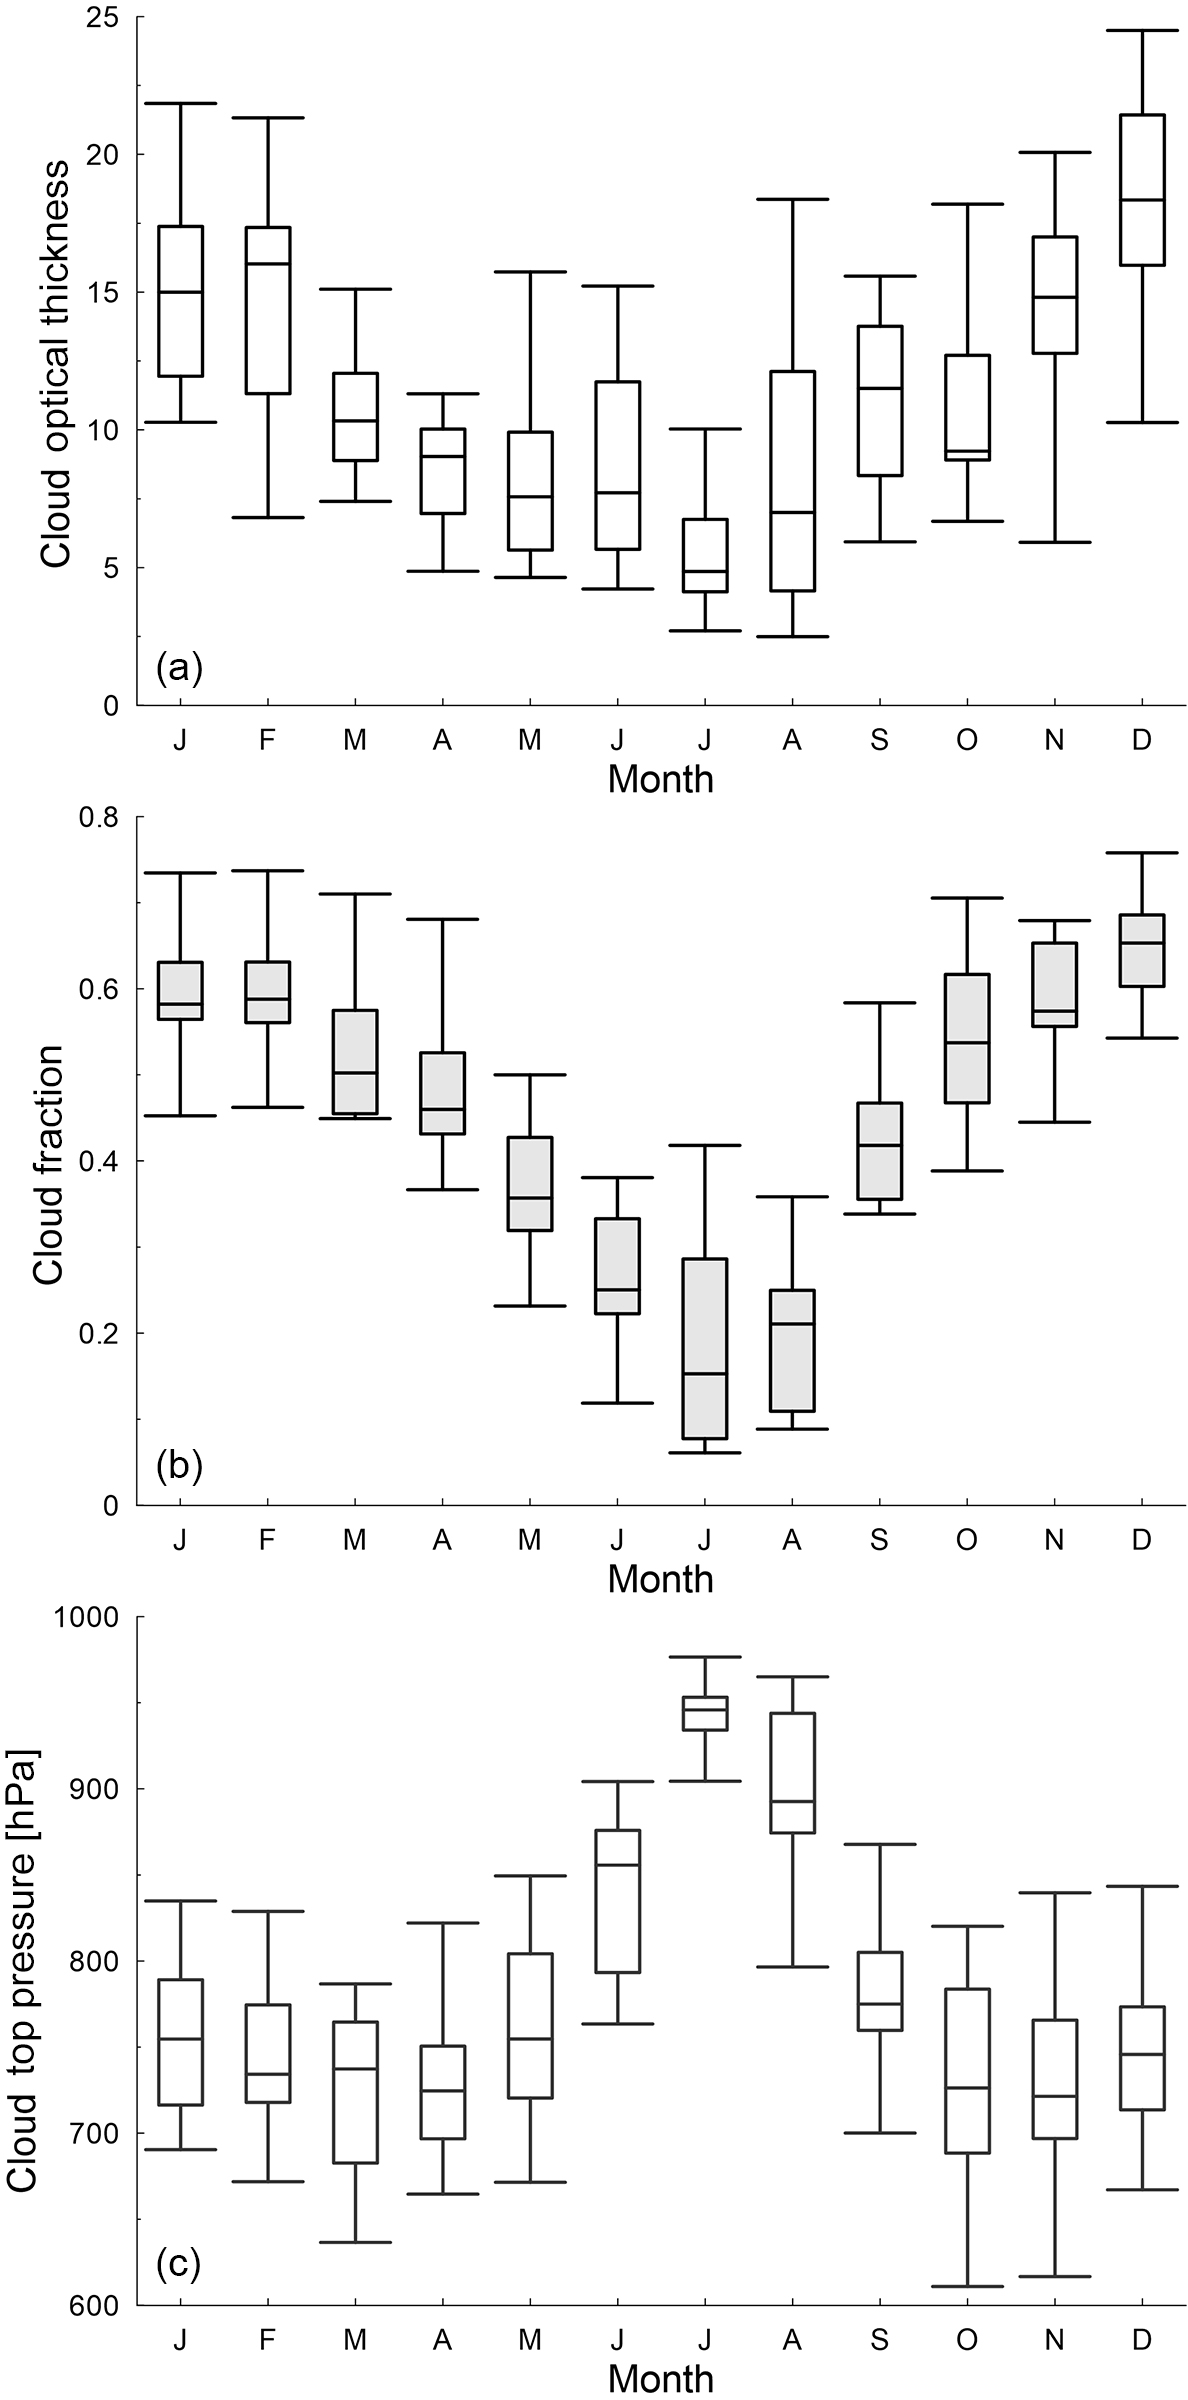
Figure 10Annual evolution of monthly averages of cloud optical thickness (a), cloud fraction (b), and cloud top pressure as derived from MODIS Aqua between July 2002 and December 2016. Maximum, upper quartile, median, lower quartile, and minimum are displayed for each month.
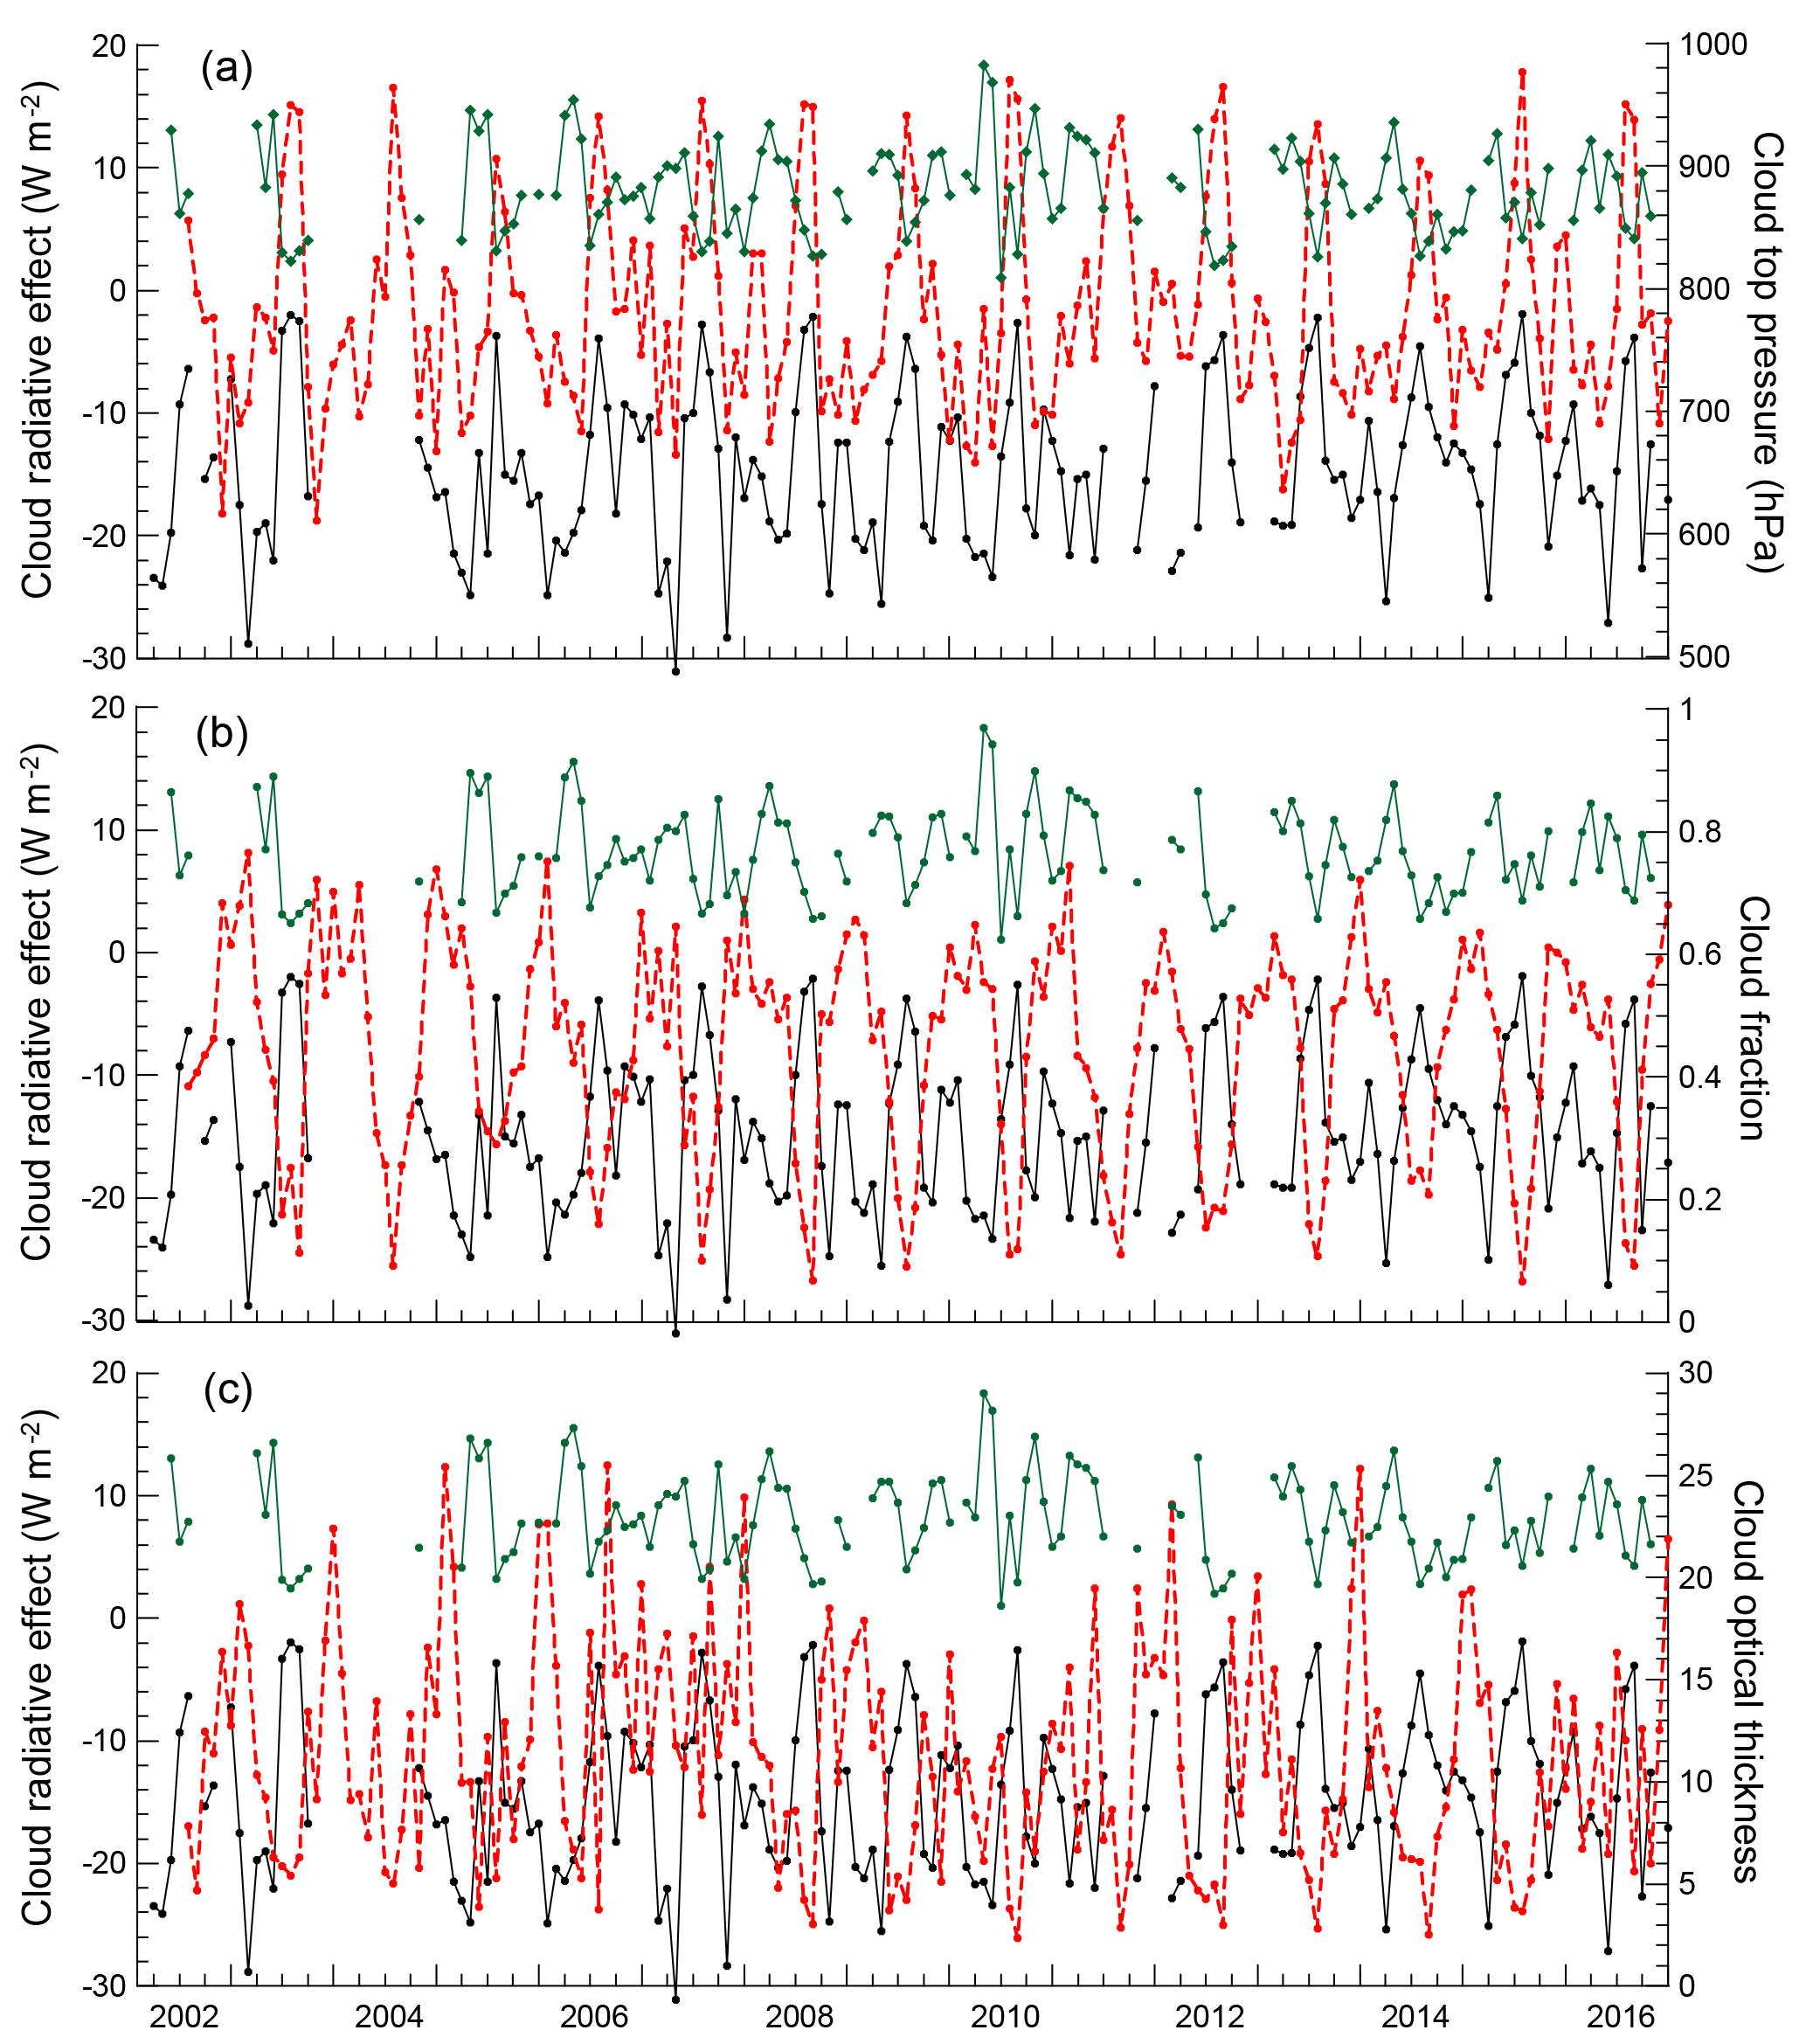
Figure 11Time series of monthly normalized cloud radiative effects for global (black) and diffuse (green) PAR, and cloud top pressure (a, red dashed line), cloud fraction (b, red dashed line) and cloud optical thickness (c, red dashed line). Cloud properties are derived from MODIS Aqua observations.
The cloud fraction is calculated as the ratio between the number of cloudy pixels and the total number of pixels in the image.
CTP is determined using the radiance measurements in the CO2 absorbing region from 13.3 to 14.2 µm using a CO2-slicing technique. An infrared channel at 11 µm is also used for optically thick and lower-level clouds (Platnick et al., 2015).
Figure 10 shows the annual evolution and variability of monthly values of COT, CF, and CTP. A significant co-variance, in particular of CF and CTP, is apparent, with lowest clouds and smallest CF in July, when a minimum of COT is also observed. Thus, cloud properties vary seasonally, with lower, although less frequent and thinner, clouds occurring in summer. The annual evolution of CF and of the fraction of cloud-free conditions of Fig. 4 are also highly consistent. Counter to expectations, low-level clouds are associated, especially in July, with low values of COT. This may be related, in addition to prevailing synoptic conditions, to the seasonal evolution of the planetary boundary layer at Lampedusa, which is dominated by the thermal difference between the sea surface temperature and the atmosphere. This produces strongest temperature inversions during summer (see, e.g., Pace et al., 2012), with the possible formation of thin low-level clouds at the top of the inversion layer, which is usually located within 200 m of the sea surface. The frequency of occurrence and properties of clouds in summer favour a high level of PAR and, similarly, UV radiation (e.g. Meloni et al., 2005). As discussed by Becagli et al. (2013), these elevated radiation levels, together with a shallow marine mixed layer, stress the marine biological cells; these mechanisms lead to increased dimethyl sulfide emissions and high values of he phytoplankton productivity index (rate of photosynthetic carbon assimilation per weight of chlorophyll a) in summer, while the chlorophyll amount displays a maximum in winter.
The largest cloud radiative effects occurring in the transition seasons appear to be associated with moderate values of COT (except in November, when the median is higher and the minimum-to-maximum COT excursion is largest) and relatively high clouds.
CRE is modulated, in addition to clouds, by the annual evolution of the photosynthetic irradiance. To reduce the effect of the seasonal changes in irradiation we have defined as normalized cloud radiative effect, NCRE, the ratio between CRE and the cloud-free PAR irradiance of the corresponding month. NCRE is between about −0.5 and 0 for the global PAR, and between 0 and +0.8 for the diffuse PAR, with larger relative variations for diffuse than for global PAR.
Figure 11 shows the time series of global and diffuse NCRE together with cloud fraction, cloud optical thickness, and cloud top pressure determined by MODIS. The variability of cloud properties helps explaining the interannual variability of NCRE, in particular for global PAR.
Winters 2009–2010 and 2015–2016 are characterized by a less pronounced seasonal minimum of global NCRE, which is associated with low values of COT in these seasons compared to the other years. The winter 2009–2010 clouds also produce the largest effect on the diffuse NCRE. The COT seasonal cycle appears to be attenuated in 2007, with an anticipation of the winter maximum already in 2006 and a lack of a summer minimum. This seems to produce a smaller winter negative peak of NCRE but does not seem to affect the summer maximum, probably because of the annual evolution of CF and the prevailing role of cloud-free conditions. The largest NCRE for the month of April is also found in 2007. This is also the largest CRE of the whole record and appears to be due to elevated values of COT in this season compared with the other years; CTP and CF do not show significant anomalies in this season.
Several winter seasons display minima of the global NCRE less than −0.3. Two of the three largest NCRE negative peaks, in early 2006 and 2014, coincide with maxima of both COT and CF. The other peaks, in early 2003, December 2004, early 2008, and 2012, coincide with maxima of one between COT and CF.
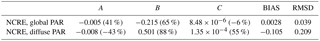
Table 5Coefficients of the multilinear regression and statistics between NCRE and clouds properties (cloud optical thickness, cloud fraction, and cloud top height). Percentages in brackets represent the contribution of each term of the multilinear regression to the NCRE variability.
A multi-linear regression of the form
has been applied to the data. NCREc is the NCRE value estimated by the regression model. The A, B, and C coefficients have been derived by least square minimization of the differences between NCREc and NCRE. Table 5 reports the coefficients obtained for the global and diffuse PAR NCRE, and the average percent weight of each term in expression 4) with respect to NCREc. Figure 12 shows the scatterplots between NCREc and NCRE for the global and diffuse PAR. The mean bias, correlation coefficient, and root-mean-squared deviation (RMSD) between NCREc and NCRE are indicated in the graphs. The multi-linear model performs well for global NCRE, while it is not capable of describing the behaviour of the diffuse NCRE. This is expected due to the non-linear dependency between diffuse PAR irradiance and COT discussed in Sect. 3.1.1.
The coefficients in Table 5 show that the correlation between global NCRE and both CF and COT is negative, while it is positive between global NCRE and CTP.
Cloud fraction is the property which most largely affects global NCRE and explains about 65 % of its variability. COT also plays an important role (41 %), while the contribution by CTP is minor. This simple model suggests that cloud properties might be used as predictors for the global NCRE. Conversely, this is not the case for the diffuse NCRE. This confirms that direct measurements of diffuse PAR are very critical for the understanding of photosynthetic and climate-related effects.
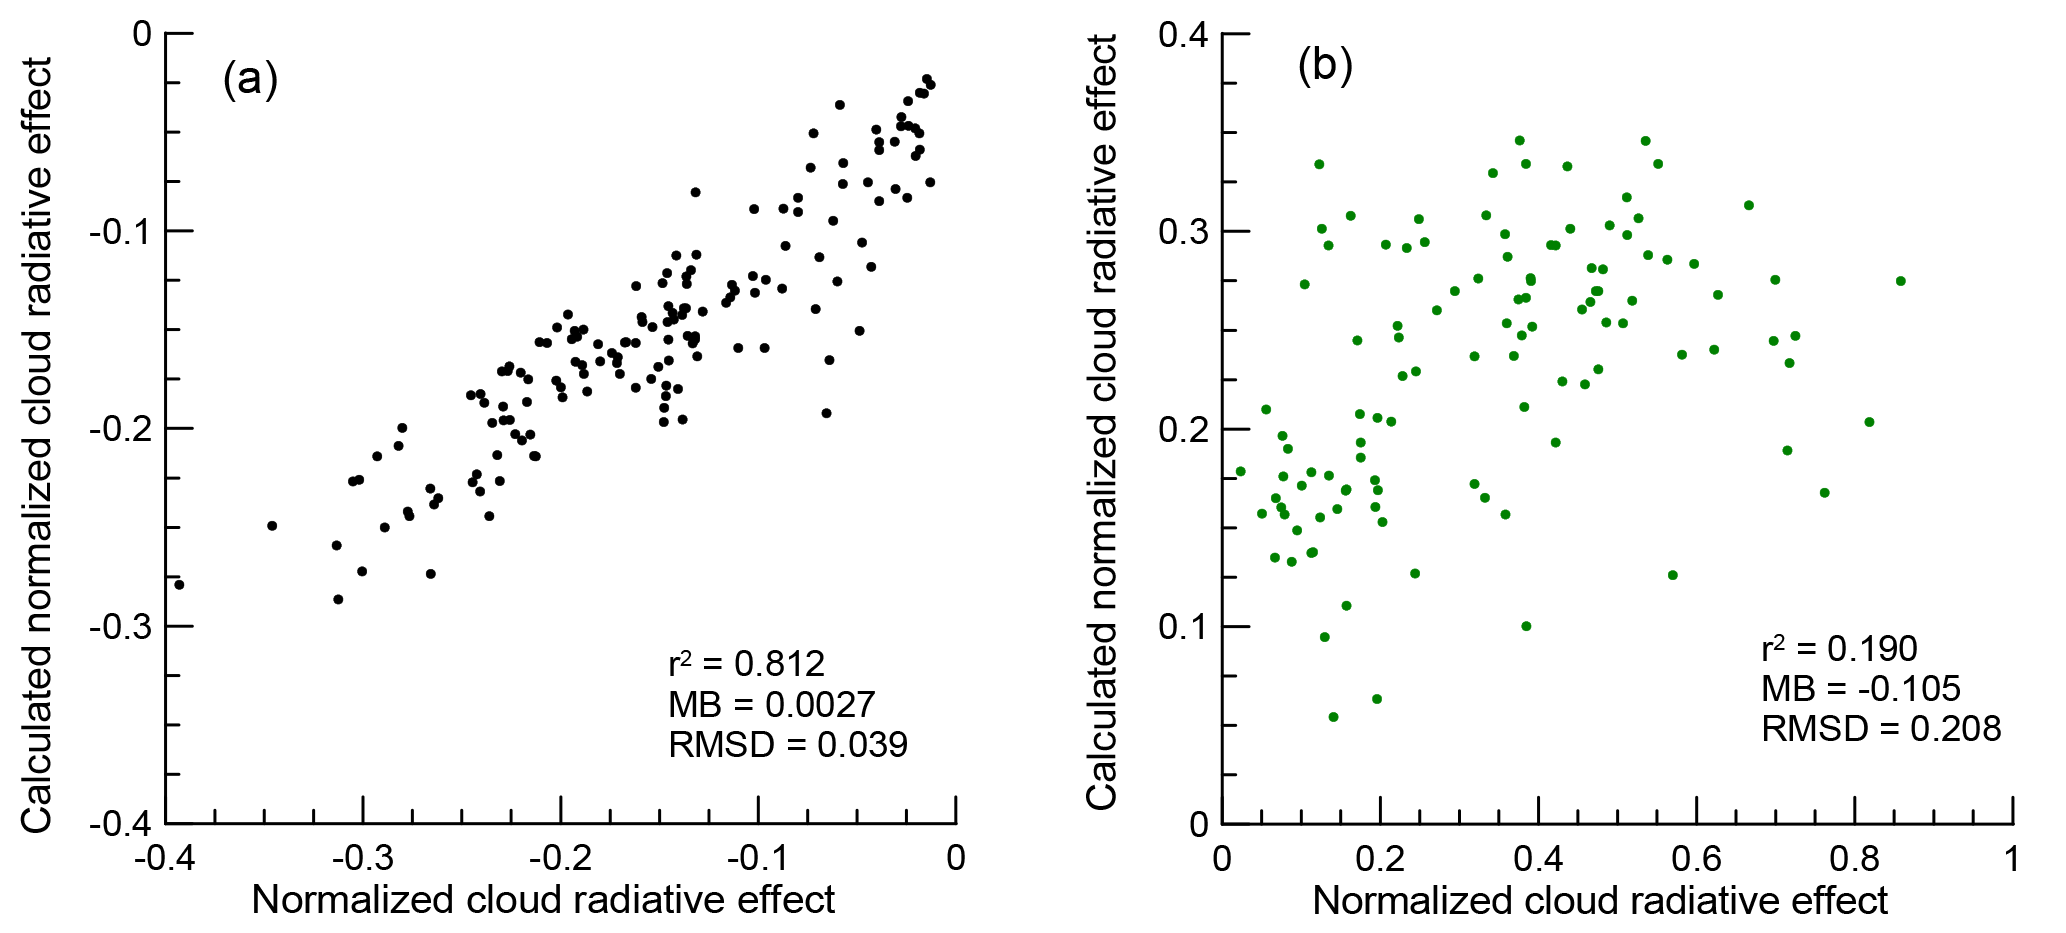
Figure 12Scatterplot between the normalized cloud radiative effect (NCREc) calculated from the multilinear regression and the normalized cloud radiative effect (NCRE). Graphs for global (a; 151 data points) and diffuse (b; 104 data points) PAR are shown.
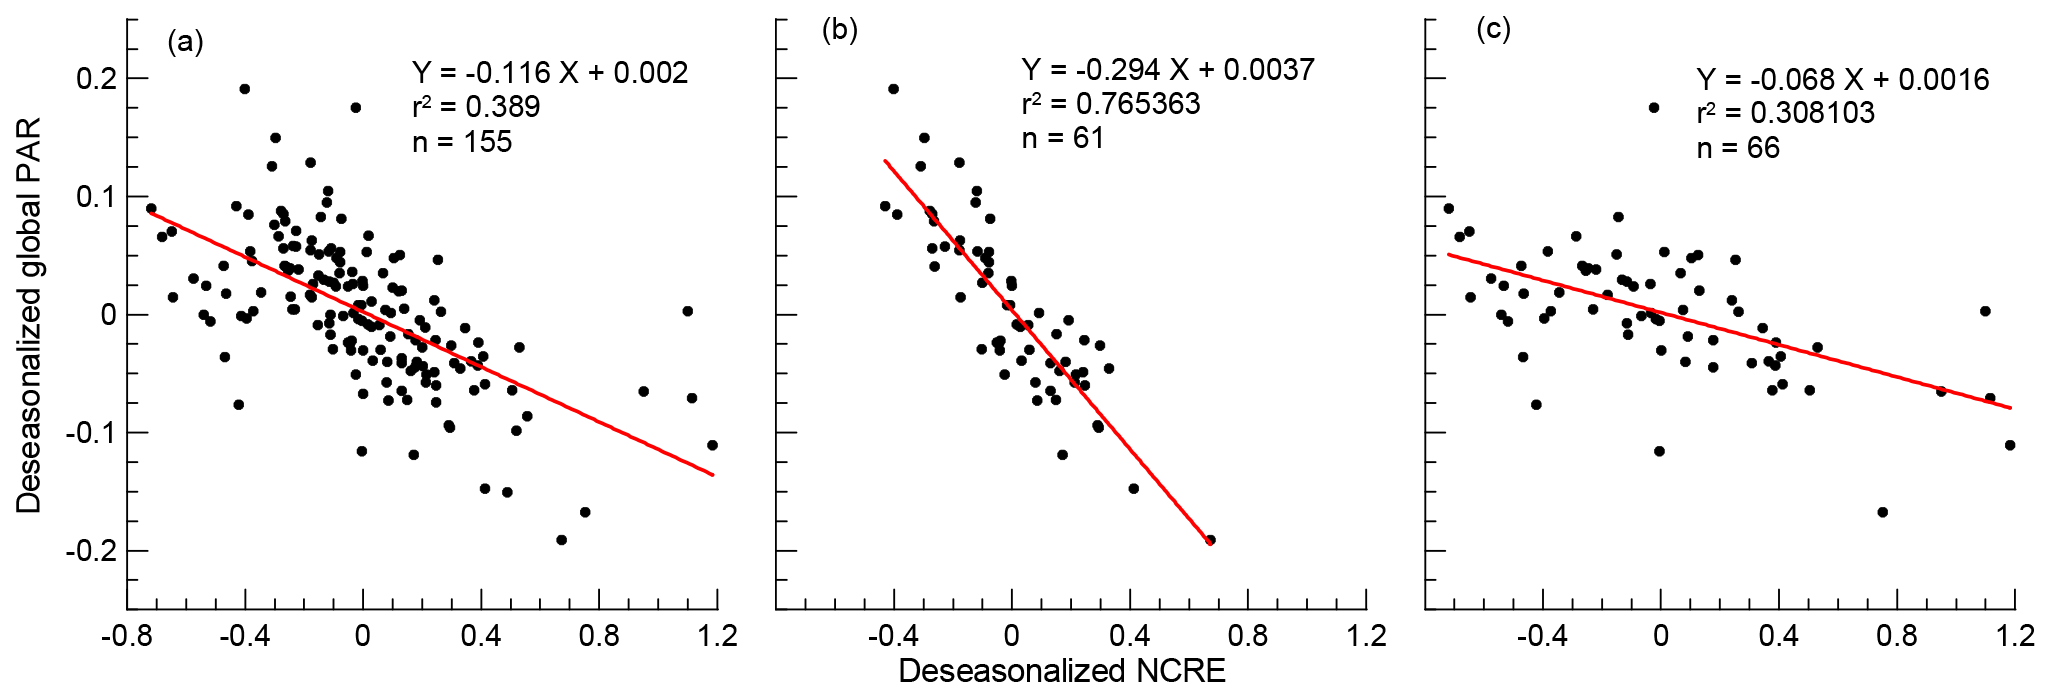
Figure 13Scatterplot between deseasonalized global PAR and deseasonalized NCRE for all data (a), for the months November–March (b), and for the months May–September (c). Least squares fitting lines are plotted in red; the best fit equation, squared correlation coefficients, and number of data points are shown in each graph.
Given the low correlation coefficient and large RMSD between diffuse NCREc and NCRE, the coefficients and contributions for the diffuse component reported in Table 5 must be treated with caution. The correlation, although low, between diffuse NCRE and CF and CTP is positive, while it is negative between NCRE and COT.
The monthly mean time series was rearranged in order to remove the seasonality and better investigate the interannual variability. The long-term monthly mean annual cycle was calculated from the datasets, as the average of all values for each month (all values for January, then for February and so on) of the record. The deseasonalized time series is thus calculated as
where PARi is the long-term monthly mean for month i (i=1, …, 12), and PARij is the monthly mean value for month i and year j. Pij is thus the fractional change in global PAR with respect to its long-term monthly mean. Similarly, a deseasonalized value of NCRE, Nij, was calculated.
Figure 13 shows the scatterplot between deseasonalized PAR and NCRE. The variations of Pij are within ±20 %, while Nij varies within about ±80 %. The best linear fit is also shown in Fig. 13. The correlation coefficient is relatively low when all data are included in the scatterplot. Data were also sorted according to the season, over an extended winter (months of November, December, January, February, and March) and an extended summer (months of May, June, July, August, and September) period, and the corresponding scatter plots are included in Fig. 13. A much stronger correlation is found for the winter months, when NCRE is largest and appears to explain about 77 % of the PAR interannual variability. The slope of the Pij versus Nij fitting line in summer is 4 times smaller than in winter; the range of Pij values is within ±0.2 in winter and ±0.1 in summer. The correlation is much weaker in summer, with clouds explaining only 31 % of the PAR interannual variability. This is attributed to the high occurrence of cloud-free conditions, and the larger role of atmospheric aerosols, which typically display a maximum in summer.
This analysis is based on a new method to estimate global and diffuse component of PAR from calibrated MFRSR measurements (Trisolino et al., 2016). The method is applied to the long-term MFRSR record at the ENEA Atmospheric Observatory on the island of Lampedusa. As a complement to the previous study, direct measurements of diffuse PAR with a Li-190 sensor on a solar tracker were used to verify the reliability of MFRSR diffuse PAR estimates. The estimated uncertainty is in agreement with previous results obtained from the comparison with radiative transfer model calculations.
The main results of this study may be summarized as follows:
-
The long-term global and diffuse PAR record in the central Mediterranean covers the period 2002–2016. Measurements are being continued, and the record will be expanded in the future. The long-term mean is 95 and 35 W m−2 for global and diffuse PAR, respectively. The mean annual cycle semi-amplitude is about 55 and 36 % of the long-term mean for the global and diffuse PAR, respectively. Interannual variations of global and diffuse PAR appear to be essentially related to the clouds' frequency of occurrence. The cloud occurrence is very low in summer, especially in July.
-
The daily PAR irradiance for cloud-free conditions was also estimated during partially cloudy days by fitting the cloud-free data with an analytical function which depends on the solar zenith angle. In this way, cloud-free global and diffuse PAR time series were derived. The cloud-free long-term mean global PAR is 110 W m−2, about 16 % more than in all-sky conditions. Conversely, the cloud-free diffuse PAR long-term mean PAR is 26 W m−2, about 24 % less than in all-sky conditions. The cloud-free annual cycle semi-amplitude is 45 % for global PAR, and 47 % for diffuse PAR. The differences in the annual ratio of semi-amplitude to long-term mean with respect to the all-sky conditions are essentially driven by changes in the long-term mean values.
-
By using all-sky and cloud-free PAR data we have calculated the cloud radiative effect, CRE, for global and diffuse PAR. Global and diffuse CRE display a similar annual evolution, but opposite in sign, i.e. positive for diffuse and negative for global PAR. The long-term mean CRE is −14.7 W m−2 for global PAR and +8.1 W m−2 for diffuse PAR. The CRE seasonal evolution is characterized by a primary maximum in late winter/early spring, and a secondary maximum in autumn. The largest global PAR monthly CRE is −31 W m−2 in April 2007, while the smallest is generally observed in July, in correspondence with the lowest occurrence of clouds. The largest diffuse PAR CRE is recorded in April 2010, with +18 W m−2.
-
The CRE has been scaled by taking into account the monthly cloud-free estimated PAR to remove the influence of the solar zenith angle annual course. The normalized CRE has been associated with cloud properties (fraction, optical thickness, and top pressure) as derived from space with MODIS. A simple multi-linear model has been applied to relate the deseasonalized NCRE and cloud properties. For global PAR, NCRE is correlated positively with respect to cloud top pressure, and negatively with cloud fraction and optical thickness. Cloud fraction appears as the most relevant parameter influencing NCRE. The multi-linear model is conversely not appropriate to describe the relationship linking diffuse PAR NCRE with cloud properties. The cloud influence on diffuse PAR is more difficult to disentangle, due to the stronger dependency on cloud properties. Clouds are expected to produce an increase or a decrease in diffuse PAR depending on their optical thickness.
-
Deseasonalized global PAR data were related to deseasonalized NCRE. The correlation analysis between these two parameters suggests that cloud properties explain about 77 % of the interannual global PAR variability in winter, and about 31 % in summer.
-
The large values of global PAR found in summer appear to be due to the combination of low cloud frequency of occurrence and low cloud optical thickness. The summer clouds are also characterized by a high top pressure, suggesting that low-level thin clouds, possibly forming at the top of the summer temperature inversion, play a large role. Also, due to these cloud properties, high PAR levels are reached in summer. The high PAR and UV radiation has been observed to stress marine phytoplankton in this region of the Mediterranean (Becagli et al., 2013).
This study contributes to provide new information about the behaviour of global and diffuse PAR in the Mediterranean, and in the marine environment. These data, as well the methodology, may be also relevant for agriculture-related applications, and for estimates of ocean primary production. Information on diffuse PAR is particularly relevant and difficult to find in the literature.
As a consequence of this study, we plan to better investigate the variability of cloud-free PAR, in particular with respect to the role of atmospheric aerosol, which play an important role in the Mediterranean radiative processes.
Data used in this study can be obtained by one of the authros (alcide.disarra@enea.it).
The authors declare that they have no conflict of interest.
This article is part of the special issue “CHemistry and AeRosols Mediterranean EXperiments (ChArMEx) (ACP/AMT inter-journal SI)”. It is not associated with a conference.
This study has been partly supported by the Italian Ministry for University
and Research through the NextData and RITMARE projects. We acknowledge the
MODIS mission scientists and associated National Aeronautics and Space
Administration personnel for the production of the data used in this
research effort. MODIS data were downloaded from the Giovanni online data
system, developed and maintained by the NASA Goddard Earth Sciences Data and
Information Services Center. This study contributes to ChArMEx WP-4 on
Aerosol-Cloud-Radiation-Climate and WP-6 on Variability and Trends.
Edited by: Nikolaos Mihalopoulos
Reviewed by: two anonymous referees
Akitsu, T., Nishida Nasahara, K., Hirose, Y., Ijima, O., and Kume, A.: Quantum sensors for accurate and stable long-term photosynthetically active radiation observations, Agr. Forest Meteorol., 237, 171–183, 2017.
Alados, I. and Alados-Arboledas, L.: Validation of an empirical model for photosynthetically active radiation, Int. J. Climatol., 19, 1145–1152, 1999.
Alados, I., Foyo-Moreno, I., and Alados-Arboledas, L.: Photosynthetically Active Radiation: measurements and modelling, Agr. Forest Meteorol., 78, 121–131, 1996.
Becagli, S., Lazzara, L., Fani, F., Marchese, C., Traversi, R., Severi, M., di Sarra, A., Sferlazzo, D., Piacentino, S., Bommarito, C., Dayan, U., and Udisti, R.: Relationship between methanesulfonate MS-) in atmospheric particulate and remotely sensed phytoplankton activity in oligo-mesotrophic central Mediterranean Sea, Atmos. Environ., 79, 681–688, 2013.
Biavati, G. and di Sarra, A.: Individuazione dei periodi di cielo sereno da misure di radiazione solare globale e diffusa, Technical report ENEA, RT/2004/66/CLIM., 2004.
Blum, H. and Schwank, O.: The stability of calibration factors of sensors for photosynthetically active radiation used in wet conditions, Agr. Forest Meteorol., 34, 77–82, 1985.
Casasanta, G., di Sarra, A., Meloni, D., Monteleone, F., Pace, G., Piacentino, S., and Sferlazzo, D.: Large aerosol effects on ozone photolysis in the Mediterranean, Atmos. Environ., 45, 3937–3943, 2011.
Ciardini, V., Contessa, G. M., Falsaperla, R., Gómez-Amo, J. L., Meloni, D., Monteleone, F., Pace, G., Piacentino, S., Sferlazzo, D., and di Sarra, A.: Global and Mediterranean climate change: a short summary, Ann. Ist. Super. Sanità, 52, 325–337, https://doi.org/10.4415/ANN_16_03_04, 2016.
Di Biagio, C., di Sarra, A., and Meloni, D.: Large atmospheric shortwave radiative forcing by Mediterranean aerosol derived from simultaneous ground-based and spaceborne observations, and dependence on the aerosol type and single scattering albedo, J. Geophys. Res., 115, D10209, https://doi.org/10.1029/2009JD012697, 2010.
Di Iorio, T., di Sarra, A., Sferlazzo, D. M., Cacciani, M., Meloni, D., Monteleone, F., Fuà, D., and Fiocco, G.: Seasonal evolution of the tropospheric aerosol vertical profile in the central Mediterranean and role of desert dust, J. Geophys. Res., 114, D02201, https://doi.org/10.1029/2008JD010593, 2009.
Dimier, C., Saviello, G., Tramontano, F., and Brunet, C.: Comparative ecophysiology of the xanthophyll cycle in six marine phytoplanktonic species, Protist, 160, 397–411, 2009.
di Sarra, A., Cacciani, M., Chamard, P., Cornwall, C., DeLuisi, J. J., Di Iorio, T., Disterhoft, P., Fiocco, G., Fuà, D., and Monteleone, F.: Effects of desert dust and ozone on the ultraviolet irradiance at the Mediterranean island of Lampedusa during PAUR II, J. Geophys. Res.-Atmos., 107, 1–14, 2002.
di Sarra, A., Pace, G., Meloni, D., De Silvestri, L., Piacentino, S., and Monteleone, F.: Surface shortwave radiative forcing of different aerosol types in the central Mediterranean, Geophys. Res. Lett., 35, L02714, https://doi.org/10.1029/2007GL032395, 2008.
di Sarra, A., Di Biagio, C., Meloni, D., Monteleone, F., Pace, G., Pugnaghi, S., and Sferlazzo M. D.: Shortwave and longwave radiative effects of the intense Saharan dust event of 25–26 March 2010 at Lampedusa (Mediterranean Sea), J. Geophys. Res.-Atmos., 116, D23209, https://doi.org/10.1029/2011JD016238, 2011.
di Sarra, A., Sferlazzo, D., Meloni, D., Anello, F., Bommarito, C., Corradini, S., De Silvestri, L., Di Iorio, T., Monteleone, F., Pace, G., Piacentino, S., and Pugnaghi, S.: Empirical correction of multifilter rotating shadowband radiometer (MFRSR) aerosol optical depths for the aerosol forward scattering and development of a long-term integrated MFRSR-Cimel dataset at Lampedusa, Appl. Optics, 54, 2725–2737, 2015.
Drobinski, P., Ducrocq, V., Alpert, P., Anagnostou, E., Béranger, K., Borga, M., Braud, I., Chanzy, A., Davolio, S., Delrieu, G., Estournel, C., Filali Boubrahmi, N., Font, J., Grubisic, V., Gualdi, S., Homar, V., Ivančan-Picek, B., Kottmeier, C., Kotroni, V., Lagouvardos, K., Lionello, P., Llasat, M. C., Ludwig, W., Lutoff, C., Mariotti, A., Richard, E., Romero, R., Rotunno, R., Roussot, O., Ruin, I., Somot, S., Taupier-Letage, I., Tintoré, J., Uijlenhoet, R., and Wernli, H: HyMeX: a 10-year multidisciplinary program on the Mediterranean water cycle, B. Am. Meteorol. Soc., 95, 1063–1082, 2014.
Dye, D. G.: Spectral composition and quanta-to-energy ratio of diffuse photosynthetically active radiation under diverse cloud conditions, J. Geophys. Res., 109, D10203, https://doi.org/10.1029/2003JD004251, 2004.
Field, C. B., Behrenfeld, M. J., Randerson, J. T., and Falkowski, P.: Primary production of the biosphere: Integrating terrestrial and oceanic components, Science, 281, 237–240, 1998.
Frouin, R. and Pinker, R. T.: Estimating Photosynthetically Active Radiation (PAR) at the Earth's surface from satellite observations, Remote Sens. Environ., 51, 98–107, 1995.
Gu, L., Baldocchi, D., Verma, S. B., Black, T. A., Vesala, T., Falge, E. M., and Dowty, P. R.: Advantages of diffuse radiation for terrestrial ecosystem productivity, J. Geophys. Res-Atmos., 107, D64050, https://doi.org/10.1029/2001JD001242, 2002.
Hader, D. P., Lebert, M., Schuster, M., del Ciampo, L., Helbling, E. W., and McKenzie, R.: ELDONET – A decade of monitoring solar radiation on five continents, Photochem. Photobiol., 83, 1348–1357, 2007.
Harrison, L., Michalsky, J., and Berndt, J.: Automated multifilter rotating shadow-band radiometer: an instrument for optical depth and radiation measurements, Appl. Optics, 33, 5118–5125, 1994.
Hatzianastassiou, N., Matsoukas, C., Fotiadi, A., Pavlakis, K. G., Drakakis, E., Hatzidimitriou, D., and Vardavas, I.: Global distribution of Earth's surface shortwave radiation budget, Atmos. Chem. Phys., 5, 2847–2867, https://doi.org/10.5194/acp-5-2847-2005, 2005.
Holben, B. N., Eck, T. F., Slutsker, I., Tanré, D., Buis, J. P., Setzer, A., Vermote, E., Reagan, J. A., Kaufman, Y. J., Nakajima, T., Lavenu, F., Jankowiak, I., and Smirnov, A.: AERONET – A Federated Instrument Network and Data Archive for Aerosol Characterization, Remote Sens. Environ., 66, 1–16, 1998.
Jacovides, C. P., Timvios, F. S., Papaioannou, G., Asimakopoulos, D. N., and Theofilou, C. M.: Ratio of PAR to broadband solar radiation measured in Cyprus, Agr. Forest Meteorol., 121, 135–140, 2004.
King, M. D., Tsay, S. C., Platnick, S. E., Wang, M., and Liou, K. N.: Cloud retrieval algorithms for MODIS: Optical thickness, effective particle radius, and thermodynamic phase, MOD Theoretical Basis Document No. ATBD-MOD-05, MOD06-Cloud Product, Goddard Space Flight Center, 1997.
Long, C. N. and Ackerman, T. P.: Identification of clear skies from broadband pyranometer measurements and calculation of downwelling shortwave cloud effects, J. Geophys. Res., 105, 15609–15626, 2000.
Mallet, M., Dulac, F., Formenti, P., Nabat, P., Sciare, J., Roberts, G., Pelon, J., Ancellet, G., Tanreì, D., Parol, F., Denjean, C., Brogniez, G., di Sarra, A., Alados-Arboledas, L., Arndt, J., Auriol, F., Blarel, L., Bourrianne, T., Chazette, P., Chevaillier, S., Claeys, M., D'Anna, B., Derimian, Y., Desboeufs, K., Di Iorio, T., Doussin, J.-F., Durand, P., Feìron, A., Freney, E., Gaimoz, C., Goloub, P., Goìmez-Amo, J. L., Granados-Muñoz, M. J., Grand, N., Hamonou, E., Jankowiak, I., Jeannot, M., Leìon, J.-F., Mailleì, M., Mailler, S., Meloni, D., Menut, L., Momboisse, G., Nicolas, J., Podvin, T., Pont, V., Rea, G., Renard, J.-B., Roblou, L., Schepanski, K., Schwarzenboeck, A., Sellegri, K., Sicard, M., Solmon, F., Somot, S., Torres, B., Totems, J., Triquet, S., Verdier, N., Verwaerde, C., Waquet, F., Wenger, J., and Zapf, P.: Overview of the Chemistry-Aerosol Mediterranean Experiment/Aerosol Direct Radiative Forcing on the Mediterranean Climate (ChArMEx/ADRIMED) summer 2013 campaign, Atmos. Chem. Phys., 16, 455–504, https://doi.org/10.5194/acp-16-455-2016, 2016.
McCree, K. J.: Test of current definitions of Photosynthetically Active Radiation against leaf photosynthesis data, Agr. Meteorol., 10, 443–453, https://doi.org/10.1016/0002-1571(72)90045-3, 1972.
Meek, D. W., Hatfield, J. L., Howell, T. A., Idso, S. B., and Reginato, R. J.: A generalized relationship between photosynthetically active radiation and solar radiation, Agron. J., 76, 939–945, https://doi.org/10.2134/agronj1984.00021962007600060018x, 1984.
Meloni, D., di Sarra, A., Di Iorio, T., and Fiocco, G.: Influence of the vertical profile of Saharan dust on the visible direct radiative forcing, J. Quant. Spectrosc. Ra., 93, 397–413, 2005.
Meloni, D., di Sarra, A., Biavati, G., DeLuisi, J. J., Monteleone, F., Pace, G., Piacentino, S., and Sferlazzo, D. M.: Seasonal behavior of Saharan dust events at the Mediterranean island of Lampedusa in the period 1999–2005, Atmos. Environ., 41, 3041–3056, https://doi.org/10.1016/j.atmosenv.2006.12.001, 2007.
Meloni, D., Junkermann, W., di Sarra, A., Cacciani, M., De Silvestri, L., Di Iorio, T., Estellés, V., Gómez-Amo, J. L., Pace, G., and Sferlazzo, D. M.: Altitude-resolved shortwave and longwave radiative effects of desert dust in the Mediterranean during the GAMARF campaign: Indications of a net daily cooling in the dust layer, J. Geophys. Res., 120, 3386–3407, 2015.
Mercado, L. M., Lloyd, J., Dolman, A. J., Sitch, S., and Patiño, S.: Modelling basin-wide variations in Amazon forest productivity – Part 1: Model calibration, evaluation and upscaling functions for canopy photosynthesis, Biogeosciences, 6, 1247–1272, https://doi.org/10.5194/bg-6-1247-2009, 2009
Mermex group: Marine ecosystems' responses to climatic and anthropogenic forcings in the Mediterranean, Prog. Oceanogr., 91, 97–166, 2011
Min, Q.: Impacts of aerosols and clouds on forest-atmosphere carbon exchange, J. Geophys. Res.-Atmos., 110, D06203, https://doi.org/10.1029/2004JD004858, 2005.
Mizoguchi, Y., Ohtani, Y., Aoshima, T., Hirakata, A., Yuta, S., Takanashi, S., Iwata, H., and Nakai, Y.: Comparison of the characteristics of five quantum sensors, Bulletin of FFPRI, 9, 113–120, 2010.
Monteith, J. L.: Validity of the correlation between intercepted radiation and biomass, Agr. Forest Meteorol., 68, 213–220, 1994.
Pace, G., Cremona, G., di Sarra, A., Meloni, D., Monteleone, F., Sferlazzo, D., and Zanini, G.: Continuous vertical profiles of temperature and humidity at Lampedusa island, Proceed. of the 9th Intern. Symp. on Tropospheric Profiling, edited by: Cimini, D., Di Girolamo, P., Marzano, F. S., and Rizi, V., https://doi.org/10.12898/ISTP9prc, L'Aquila, Italy, September 2012.
Platnick, S., King, M. D., Meyer, K. G., Wind, G., Amarasinghe, N., Marchant, B., Arnold, G. T., Zhang, Z., Hubanks, P. A., Ridgway, B., and Riedi, J.: MODIS Cloud Optical Properties: User Guide for the Collection 6 Level-2 MOD06/MYD06 Product and Associated Level-3 Datasets, NASA Goddard, Greenbelt, MD, USA, 141 pp., 2015.
Pyrina, M., Hatzianastassiou, N., Matsoukas, C., Fotiadi, A., Papadimas, C. D., Pavlakis, K. G., and Vardavas, I.: Cloud effects on the solar and thermal radiation budgets of the Mediterranean basin, Atmos. Res., 152, 14–28, 2015.
Ross, J. and Sulev, M.: Sources of errors in measurements of PAR, Agr. Forest Meteorol., 100, 103–125, 2000.
Trisolino, P., di Sarra, A., Meloni, D., and Pace, G.: Determination of global and diffuse photosynthetically active radiation from a multifilter shadowband radiometer, Appl. Optics, 55, 8280–8286, 2016.
Udo, S. O. and Aro, T. O.: New empirical relationships for determining global PAR from measurements of global solar radiation, infrared radiation or sunshine duration, Int. J. Climatol., 20, 1265–1274, 2000.
Wang, L., Hu, B., Kisi, O., Zounemat-Kermani, M., and Gong, W.: Prediction of diffuse photosynthetically active radiation using different soft computing techniques, Q. J. Roy. Meteor. Soc., 143, 2235–2244, https://doi.org/10.1002/qj.3081, 2017.
Yu, X., Wu, Z., Jianng, W., and Guo, X.: Predicting daily photosynthetically active radiation from global solar radiation in the Contiguous United States, Energ. Convers. Manage., 89, 71–82, 2015.