the Creative Commons Attribution 4.0 License.
the Creative Commons Attribution 4.0 License.
A comparison of the momentum budget in reanalysis datasets during sudden stratospheric warming events
Patrick Martineau
Seok-Woo Son
Masakazu Taguchi
Amy H. Butler
The agreement between reanalysis datasets, in terms of the zonal-mean momentum budget, is evaluated during sudden stratospheric warming (SSW) events. It is revealed that there is a good agreement among datasets in the lower stratosphere and troposphere concerning zonal-mean zonal wind, but less so in the upper stratosphere. Forcing terms of the momentum equation are also relatively similar in the lower atmosphere, but their uncertainties are typically larger than uncertainties of the zonal-wind tendency. Similar to zonal-wind tendency, the agreement among forcing terms is degraded in the upper stratosphere. Discrepancies among reanalyses increase during the onset of SSW events, a period characterized by unusually large fluxes of planetary-scale waves from the troposphere to the stratosphere, and decrease substantially after the onset. While the largest uncertainties in the resolved terms of the momentum budget are found in the Coriolis torque, momentum flux convergence also presents a non-negligible spread among the reanalyses. Such a spread is reduced in the latest reanalysis products, decreasing the uncertainty of the momentum budget. It is also found that the uncertainties in the Coriolis torque depend on the strength of SSW events: the SSW events that exhibit the most intense deceleration of zonal-mean zonal wind are subject to larger discrepancies among reanalyses. These uncertainties in stratospheric circulation, however, are not communicated to the troposphere.
- Article
(4433 KB) - Full-text XML
- BibTeX
- EndNote
Sudden stratospheric warming (SSW) events are prime manifestations of coupling between the tropospheric and stratospheric circulations (Baldwin, 2001). They are characterized by a rapid deceleration and reversal of the stratospheric zonal wind resulting from an enhanced injection of planetary-scale wave activity from the troposphere to the stratosphere (Limpasuvan et al., 2004; Martineau and Son, 2015; Polvani and Waugh, 2004). The changes in stratospheric circulation can then, in return, influence tropospheric weather (Kidston et al., 2015). Motivated by their role in tropospheric predictability (Sigmond et al., 2013; Taguchi, 2015; Tripathi et al., 2015), SSW events have been the object of many observational and modeling studies.
Recent studies have highlighted a sensitivity to the choice of reanalysis dataset for the detection of SSW events. For instance, Charlton and Polvani (2007) noted discrepancies in the central date of SSW events between ERA-40 and NCEP-NCAR. They also found discrepancies in the classification of those events per the geometry of the distorted stratospheric polar vortex, whether it is displaced off the pole or split into two vortices. Other definitions of SSW events also show discrepancies among reanalyses (Butler et al., 2015). Since SSW events are often defined using a threshold value, requiring a reversal of zonal-mean zonal wind () at 10 hPa and 60∘ N (Charlton and Polvani, 2007), their detection can be sensitive to small differences in the zonal wind between reanalyses. Despite those discrepancies, Palmeiro et al. (2015) have noted that the main features of SSW events, such as the deceleration of zonal-mean zonal wind and warming of the polar cap, are not sensitive to the choice of reanalysis. Furthermore, composites of the Northern Annular Mode (NAM) index for a common set of SSW event dates were shown to be similar (Martineau and Son, 2010).
Despite the seemingly good agreement of zonal-mean zonal wind, temperature, and geopotential height between datasets during SSW events, inter-dataset variability merits further investigation. Lu et al. (2015) recently highlighted non-negligible differences in the wave drag and the residual circulation between ERA-40 and ERA-Interim. A comprehensive comparison of momentum diagnostics in the stratosphere among reanalyses further revealed non-negligible inconsistencies in the zonal-mean momentum equation, resulting primarily from inter-data variability in the residual circulation in the mid-stratosphere (Martineau et al., 2016). Such variability of the Brewer–Dobson circulation among reanalysis datasets is well documented in the literature (Abalos et al., 2015; Iwasaki et al., 2009; Monge-Sanz et al., 2013).
Martineau et al. (2016) have also shown that the ability to explain the stratospheric zonal-mean zonal-wind tendencies using the forcing terms of the zonal-mean momentum equation has improved in the latest reanalysis products and that momentum diagnostics tend to agree better among the latest reanalyses. This improvement was demonstrated in the context of the wintertime climatology and different regimes of vortex variability (strong or weak, accelerating or decelerating) with an emphasis on the mid-stratosphere. In this work, we focus on the most extreme events of stratospheric variability, the SSW events, and extend the comparison of the momentum budget to the upper stratosphere and troposphere.
Table 1Summary of reanalysis datasets included in the comparison.

a The original resolution is not necessarily the highest resolution provided by each reanalysis center. b Included in the Latest Reanalysis Ensemble (LRE). c Vertical velocity is not provided above 100 hPa. d Transition from version 1 to version 2 on 1 January 2011.
The reanalysis datasets evaluated in this work are first presented in Sect. 2.1, followed by a description of the momentum diagnostics used throughout this study in Sect. 2.2. The SSW events used for the comparison of reanalyses are then presented in Sect. 2.3. The uncertainty of stratospheric vortex structures among reanalysis datasets is first evaluated in Sect. 3 using as a case study the January 2009 SSW event. Then, zonal-mean quantities and diagnostics using the zonal-mean momentum equation are shown in Sect. 4. Conclusions are finally presented in Sect. 5.
2.1 Data
The eight reanalysis datasets compared in this study are listed in Table 1. ERA-40 from the European Centre for Medium-Range Weather Forecasts (ECMWF) is excluded as it is not provided for recent years, thus limiting the sample size of SSW events since 1980. The NOAA Twentieth Century Reanalysis (20CR) and the ECMWF Twentieth Century Reanalysis (ERA-20C) are also left out as they are known to have unrealistic stratospheric variability in comparison to reanalyses that fully assimilate upper atmospheric observations (Compo et al., 2011; Poli et al., 2013). Temperature and the three-dimensional wind field are used on pressure levels for each reanalysis. To prevent our diagnostics from being affected by the vertical resolution, which gives an unfair advantage to the latest reanalyses, only 22 common vertical levels are kept (i.e., 1000, 925, 850, 700, 600, 500, 400, 300, 250, 200, 150, 100, 70, 50, 30, 20, 10, 7, 5, 3, 2, and 1 hPa) except for NCEP-NCAR and NCEP-DOE, which are available only up to 10 hPa. Similarly, to ensure that the diagnostics are not affected by differences in horizontal resolution, each dataset is interpolated onto a standardized 2.5∘ by 2.5∘ grid, which is the coarsest grid provided among all the reanalyses considered in this study. This reduction of the resolution in some reanalyses is not expected to have a large impact on our comparison. In fact, in the extratropics, horizontal and vertical resolutions were previously shown not to have a substantial effect on momentum diagnostics except near the tropopause and in the upper stratosphere where higher vertical and horizontal resolutions improved slightly the dynamical consistency (Martineau et al., 2016). The reanalysis datasets are compared for a common period ranging from 1980 to 2012, 1980 being the first year for which MERRA2 data are provided. A comprehensive description of the reanalyses compared in this study is provided in Fujiwara et al. (2017).
Whenever the average or standard deviation (SD) of multiple reanalyses is taken as a reference, it is performed on a subset including the latest reanalysis products from each center (ERA-Interim, NCEP-CFSR, JRA-55, and MERRA2). This composite is referred to as the Latest Reanalysis Ensemble (LRE). In some figures, the LRE is contrasted with a composite of all reanalyses, which we denote as the all reanalysis ensemble. The LRE subset emphasizes the discrepancies affecting the reanalysis datasets that are nowadays most commonly used in research while excluding older reanalyses whose deficiencies are well documented in the literature.
2.2 Momentum diagnostics
The zonal-mean momentum equation, derived from the primitive version of the equation in pressure coordinate, is expressed as
where f is the Coriolis parameter; u, v, and ω are the zonal, meridional, and vertical components of wind; ϕ is the latitude; and p is the pressure. Overbars and primes denote zonal mean and anomalies with respect to the zonal mean, respectively. While the left-hand side term expresses the zonal-mean zonal-wind tendency, terms of the right-hand side represent forcing terms. They are, in order, the acceleration due to the Coriolis torque, the meridional convergence of momentum fluxes, the advection of zonal momentum by the meridional wind, the vertical advection of zonal momentum by the vertical wind, and the vertical convergence of vertical momentum fluxes. The last term, R, is referred to as the residual and represents sub-grid-scale processes such as gravity wave drag and numerical diffusion. It also includes imbalances in the momentum equation introduced by the data assimilation process (analysis increment), errors due to the interpolation from model levels to pressure levels, and errors related to the numerical methods employed to evaluate each term of the equation. R can be used to quantify and compare the consistency of the momentum budget among reanalysis datasets (Lu et al., 2015; Martineau et al., 2016; Smith and Lyjak, 1985). The quasi-geostrophic (QG) version of the momentum equation is often applied in the extratropics. Under this approximation, only the first two terms on the right-hand side of Eq. (1) are retained. The validity of this approximation can be assessed by comparing the magnitude of non-QG terms (third to fifth right-hand side terms of Eq. 1) to the QG terms. The numerical methods employed to evaluate Eq. (1) are described in further details in Martineau et al. (2016). Abbreviations of the various terms of Eq. (1) used in figures throughout this paper are indicated with braces in Eq. (1). In this work, the Eulerian mean form of the momentum equation is preferred over the transformed Eulerian mean since additional vertical derivatives are needed in the latter, which can introduce numerical errors. The dynamical processes responsible for the eddy fluxes and the dominant terms of the momentum budget during SSW events are illustrated schematically in Fig. 1.
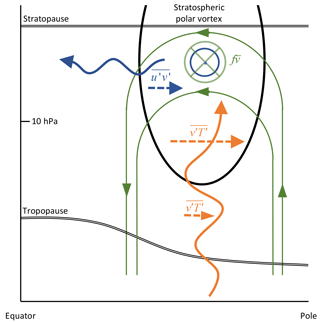
Figure 1Schematic illustration of the dominant forcing terms of the momentum budget in the Eulerian framework during SSW events and their underlying dynamical processes. Planetary-scale waves propagate upward (orange) from the troposphere to the stratospheric polar vortex (thick black line) and are accompanied with poleward heat fluxes () amplifying with height. In agreement with the Matsuno (1971) model, the poleward heat fluxes generate a thermally direct circulation (green) with air rising at the pole and sinking in the mid-latitudes. To close this circulation, equatorward motion is generated in the stratosphere. The Coriolis torque resulting from this circulation decelerates the wind (into the page symbol). Equatorward wave propagation is also observed (blue), accompanied with poleward fluxes of westerly momentum (). The resulting convergence of momentum fluxes in the polar stratosphere acts to accelerate the zonal-mean zonal wind (out of the page symbol), counteracting partly the deceleration by the Coriolis torque. Note that in the transformed Eulerian mean the residual circulation is opposite, i.e., poleward in the stratosphere and downward at the pole. The residual circulation approximates Lagrangian-mean motion.
2.3 Definition of SSW events
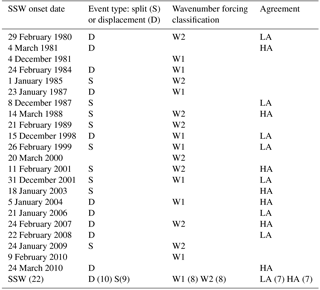
SSW events are defined following Charlton and Polvani (2007). Their central dates are set as the dates when the zonal wind reverses direction () in winter at 10 hPa and 60∘ N. Contrary to the original WMO definition, we do not verify if a reversal of the zonal-mean temperature gradient occurs at the same time as wind reversal. This additional criterion affects minimally the outcome of the detection (Charlton and Polvani, 2007). As mentioned earlier, since the definition of SSW events is based on a threshold value, the detection of a SSW can be sensitive to small variations in the wind field. Because of large variations in the characteristics of individual SSW events (e.g., Ayarzaguena et al., 2011; Martineau and Son, 2013), the comparison of reanalysis datasets could be negatively affected by using a different set of events for each reanalysis. To ensure a fair comparison, SSW events are first detected in each reanalysis independently. If at least four reanalyses detect the SSW event, the onset date is set by averaging across the dates given by each reanalysis. On a total of 25 events, 3 are detected in less than four reanalyses and are thus rejected. Detected event dates generally do not vary by more than 1–2 days between reanalyses. The common dates used for this comparison are listed in Table 2.
SSW events are also known to present a large diversity in terms of how the stratospheric polar vortex is distorted in the course of the events. While some events occur due to a displacement of the vortex, others occur from a splitting (Charlton and Polvani, 2007). These two types of SSW events result from different planetary-scale wave forcing in the stratosphere and can affect the tropospheric flow in different ways (Bancalá et al., 2012; Lehtonen and Karpechko, 2016; Martineau and Son, 2015; Mitchell et al., 2013; Smith and Kushner, 2012). It is thus possible that one type or the other is subject to larger uncertainties in reanalysis datasets. To test whether this is the case, the two types of SSW event, i.e., split SSW (SSWS) and displacement SSW (SSWD), are classified using vortex moment diagnostics described in Seviour et al. (2013) (see Table 2). Bancalá et al. (2012), however, pointed out that some wavenumber-2 SSW events were not purely forced by fluxes of wavenumber-2 wave activity but that wavenumber-1 fluxes also contributed to the preconditioning of these events. We therefore also classify events according to the dominant forcing prior to the onset date. To this end, we compute the ratio of wavenumber-1 to wavenumber-2 vertical EP flux at 100 hPa over 14 days preceding the onset date. The eight events that have the largest ratio are classified as W1-dominant events and the eight events with the smallest ratio are classified as W2-dominant events. The outcome of this classification is indicated in Table 2.
SSW events are further classified based on whether the reanalysis datasets included in the LRE agree or disagree for a specific diagnostic. Since the Coriolis torque is the forcing term that shows the largest discrepancies among reanalysis datasets in the stratosphere (Martineau et al., 2016), it is used here to quantify the level of agreement. The standard deviation of the Coriolis torque averaged from 45 to 85∘ N among the LRE is considered each day from 10 days before the central date to 5 days after the central date, which is shown later to be the period when the Coriolis force is largest during SSW events. The agreement is then defined for each event as the maximum standard deviation observed during the period considered. Events are finally classified into two categories: high-agreement SSW events (HASSWs) or low-agreement SSW events (LASSWs), depending on whether they are in the lower 33.3 % or upper 33.3 % of the agreement index of all SSW events. The type of each event is indicated in Table 2.
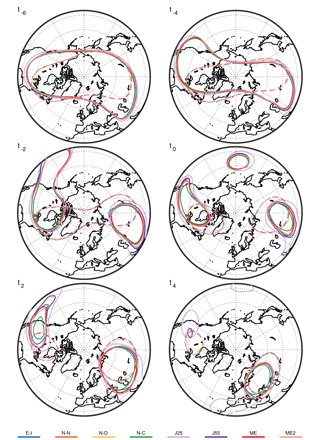
Since the geometry of the stratospheric vortex may vary widely from one event to another, the structure of any particular event can be heavily obscured when performing composite means. We therefore first proceed to illustrate and compare the morphology of the stratospheric vortex among reanalysis datasets for a representative SSW event that is well documented in the literature. We choose the January 2009 SSW, an event characterized by a vortex splitting that resulted from an unusually large amount of upward EP flux by wavenumber 2 (Harada et al., 2010; Manney et al., 2009). Reanalysis datasets show qualitatively similar downward coupling during this event (Martineau and Son, 2010). Figure 2 illustrates the evolution of the 30 and 38.5 km geopotential height contours at 10 and 3 hPa, respectively. These contours are chosen because they clearly illustrate the distortion of the stratospheric polar vortex during the life cycle of the 2009 SSW. In the course of this event, the polar vortex is progressively elongated to finally split into two individual vortices over northeastern Canada and Russia. The vortex structure features a westward tilt before the onset date (compare geopotential height contours at 10 and 3 hPa), which is consistent with the upward EP fluxes seen during the event (Harada et al., 2010).
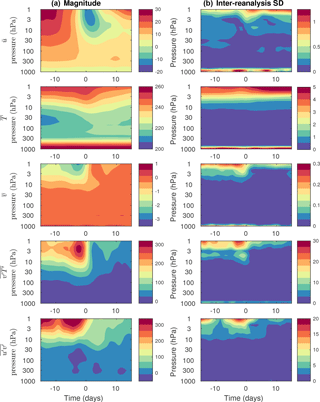
Figure 3Evolution of zonal-mean variables and eddy fluxes during SSW events (rows) in function of pressure and time. All quantities are averaged from 45 to 85∘ N. The LRE mean is shown to the left and the LRE standard deviation is shown to the right. Zonal wind () and meridional wind () have units of ms−1. Temperature () has unit of K. Heat flux () has unit of mK s−1. Momentum flux () has units of m2 s−2.
The structure of the vortex is generally quite similar among reanalyses at 10 hPa, although some small discrepancies are observed in NCEP-NCAR and NCEP-DOE. Larger differences are found at 3 hPa. Notably, NCEP-CFSR exhibits contours enclosing a smaller area from 2 days before the onset (t−2) and onward. In contrast, JRA-25 exhibits contours enclosing a larger area, especially from t−2 to t2. From inspecting the 2009 SSW event, it is clear that uncertainties in vortex geometry are larger in the upper stratosphere. These differences in geopotential height field are likely accompanied with differences in circulation and, thus, with differences in eddy activity and fluxes among the reanalyses. Although it is not an easy task to summarize differences in vortex geometry for all SSW events, it is possible to evaluate them indirectly through eddy fluxes, which are examined in the following section.
A composite analysis of the evolution of SSW events is first performed in Fig. 3 by showing the mean and standard deviation of various quantities averaged between 45 and 85∘ N. Only the LRE members are considered for this analysis. The evolution of zonal-mean wind highlights the rapid deceleration of the stratospheric polar vortex characterizing SSW events. At the same time, a warming of the stratosphere is observed. The agreement between reanalyses is generally good for both wind and temperature in the lower atmosphere. However, reanalyses show a large spread in (∼ 1 ms−1) in the upper stratosphere, especially when winds are at their weakest. The spread in also increases towards the upper stratosphere and tends to be larger (∼ 5 K) after the occurrence of SSW events. The zonal-mean meridional circulation () becomes increasingly southward in the upper stratosphere before the events, peaking a few days before the reversal of zonal-mean zonal wind. The Coriolis torque resulting from this circulation explains the deceleration of the vortex in the Eulerian framework (Matsuno, 1971). This is in contrast to the transformed Eulerian mean (TEM) framework where the residual circulation is poleward and downward during SSW events (Limpasuvan et al., 2004). Whereas the agreement is good among reanalyses in the troposphere, larger spread is again observed in the upper stratosphere, coinciding with the minimum of .
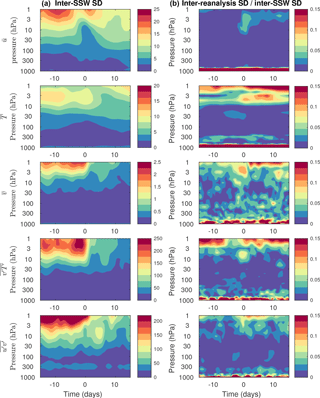
Figure 4Similar to Fig. 3 except showing (a) the standard deviation (SD) among SSW events and (b) the standard deviation among reanalysis datasets divided by the standard deviation among SSW events.
The remainder of Fig. 3 illustrates the evolution of zonal-mean eddy heat () and momentum () fluxes, which are indicative of Rossby wave propagation. Here, both heat fluxes and momentum fluxes are clearly enhanced in the upper stratosphere before the central date, which corresponds to upward and equatorward wave propagation. Again, there is good agreement between reanalyses in the troposphere and lower stratosphere, whereas it is severely degraded in the upper stratosphere. The largest spread occurs coincidentally with the peaks in eddy fluxes and thus with the period when the most intense Rossby wave propagation occurs.
Composites of SSW events are not only subject to uncertainties related to the choice of dataset as shown in Fig. 3, but also to uncertainties related to the large diversity of events included in composites. Figure 4 first shows the standard deviation among SSW events for the same quantities shown in Fig. 3. Uncertainties related to the composite methodology are increasing in the upper stratosphere for all quantities, and they also increase before the onset of SSW events (lag 0), which is the period when these terms have large magnitudes (compare with Fig. 3a). Zonal wind shows the largest uncertainty around lag 0 with a minimum at lag 0. This minimum results from the fact that SSW events were defined as a reversal of zonal-mean zonal wind at lag 0, which by construction forces all events to have similar zonal-mean zonal winds at 10 hPa.
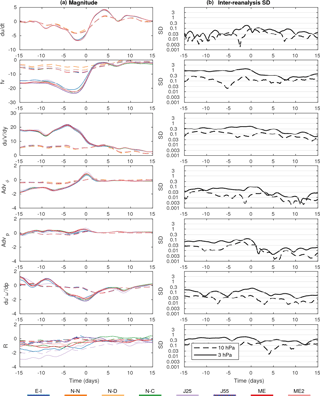
Figure 5(a) Evolution of forcing terms of the zonal-mean momentum equation at 10 hPa (dashed lines) and 3 hPa (solid lines) in the course of SSW events. All variables are averaged from 45 to 85∘ N. Note that the range of y axis in each panel is different. (b) The inter-reanalysis spread (standard deviation) of the corresponding terms are shown for the LRE members. The standard deviation is shown on a logarithmic scale: the spacing between tick marks represents a decrease or increase of the standard deviation by a factor of about 3. All quantities are expressed in ms−1 day−1.
The ratio between the standard deviation among datasets (Fig. 3a) and the standard deviation among SSW events (Fig. 4a) is then shown in Fig. 4b. This ratio is typically small in the upper troposphere and lower stratosphere, indicating that uncertainty is dominated by the large diversity of SSW events. Except zonal-mean zonal wind, most quantities show enhanced ratios in the upper stratosphere with values of about 0.15. Near the surface, many quantities also show large ratios. This suggests that the uncertainties related to the inter-reanalysis spread have a larger impact on our understanding of the evolution of SSW events at the lower boundary and in the upper stratosphere.
The complete budget of zonal-mean momentum is then investigated in Fig. 5. The evolution of each term of Eq. (1) is illustrated at two representative levels in the stratosphere: 3 and 10 hPa. The corresponding spread among reanalyses is shown using a logarithmic scale to allow the comparison of uncertainties over a wide range. Most SSW events are characterized by an intense deceleration of the zonal-mean zonal wind for a few days until the central date and immediately followed by a subsequent acceleration. Note the latter acceleration is weaker than the maximum deceleration during the onset, not reverting the zonal wind back to its original strength. The deceleration is most intense at 3 hPa but is also well observed in the mid-stratosphere at 10 hPa. Upper-tropospheric zonal-wind tendencies (not shown) are very weak in comparison to the stratosphere and therefore almost undetectable if plotted on the same scale. The inter-reanalysis SD increases towards the central date, where it peaks at about 0.3 ms−1 day−1 at 3 hPa. The spread at 10 hPa is typically smaller and peaks around the onset date.
Moving on to the forcing terms of the momentum equation, the Coriolis torque (), a term included in the QG scaling of the momentum equation, shows the largest forcing of all. This term is responsible for a large deceleration of the stratospheric vortex in the upper stratosphere. It peaks at about 2 to 3 days before the onset date and is markedly more intense in the upper stratosphere. Of all the resolved forcing terms, it also shows the largest spread among reanalyses, peaking slightly above 1 ms−1 day−1 at 1 to 2 days before the onset date. The uncertainty then decreases at the same time as the forcing itself becomes weaker in the upper stratosphere. In comparison to the upper stratosphere, the inter-reanalysis SD in the mid-stratosphere is smaller and more constant over time.
The momentum flux convergence, another term included in the QG scaling of the momentum equation, also shows large forcing in the upper stratosphere. It is largely opposed, but not completely, to the Coriolis torque. Similar to the Coriolis torque, inter-reanalysis SD peaks near the onset date (between 0.3 and 1 ms−1 day−1) and is reduced afterwards, especially in the upper stratosphere.
Terms that are left out of the QG form of the momentum equation (Fig. 5, rows 4 to 6) provide smaller forcing for zonal-wind tendency during SSW events in comparison to the convergence of horizontal momentum fluxes and the Coriolis torque. Their differences from one reanalysis to the other are also generally smaller than those of QG terms. These terms are therefore not a large source of uncertainty in the momentum budget. It is nonetheless worth noting that the convergence of vertical fluxes of momentum is not negligible near the onset date of the event. Forcing magnitudes can reach up to about −2 ms−1 day−1. Its inter-reanalysis SD can also be relatively large (up to 0.3 ms−1 day−1) in the upper stratosphere, but is still small in comparison to the other dominant terms of the momentum equation.
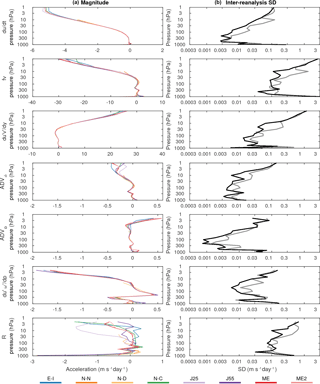
Figure 6Vertical profiles of each term in the momentum equation averaged from lags −5 to 0 days during SSW events. All variables are averaged between 45 and 85∘ N. Individual reanalyses are shown to the left and the inter-reanalysis standard deviation is shown to the right on a logarithmic scale. The latter is shown for all reanalyses (grey) and the LRE members (black). All quantities are expressed in units of ms−1 day−1.
The residual, which quantifies the consistency of the momentum diagnostics, is typically negative before the onset. This likely reflects the exclusion of gravity wave drag from the momentum budget (Martineau et al., 2016). Interestingly, its magnitude decreases in the upper stratosphere after SSW events (especially clear in JRA-25). This could be explained by the relatively quiet period following SSW events, when incoming fluxes of planetary-scale waves and gravity waves are suppressed (Hitchcock and Shepherd, 2013). Similarly, the residual in the upper stratosphere exhibits a larger spread among reanalyses before the onset date in comparison to after.
The vertical dependence of the forcing terms and their inter-data spread are further investigated using vertical profiles averaged over 5 days before the onset date (Fig. 6). This period encompasses the period of large inter-reanalysis SD seen in the Coriolis force and momentum flux convergence (Fig. 5). All terms of the momentum equation, wind tendency, and forcing terms show increasingly large magnitudes in the upper stratosphere. Similarly, the inter-data SD is typically small in the troposphere but increases sharply in the stratosphere. Consistent with Fig. 5, terms with the largest inter-reanalysis SD include the Coriolis torque and the momentum flux convergence. Both show a noticeably improved agreement in the stratosphere by considering only the LRE members instead of all reanalyses. We note that the inter-reanalysis SD becomes more similar between LRE and all datasets above 10 hPa where NCEP-NCAR and NCEP-DOE are left out in the all reanalysis ensemble due to the unavailability of data. This suggests that a substantial fraction of the inter-data SD below 10 hPa is attributable to these two reanalyses.
Compared to QG terms, non-QG terms are smaller in magnitude and agree better. Interestingly, the vertical convergence of momentum fluxes presents a sharp dipole in the vertical near the tropopause. This term, which involves a vertical derivative, may not be adequately resolved when computed with a coarse vertical resolution. In fact, Martineau et al. (2016) have shown that using more vertical levels reduces the residual in the upper troposphere and lower stratosphere (see their Fig. A1b). In Fig. 6, the residual, R, becomes increasingly negative in the upper stratosphere. Again, this is largely a consequence of the exclusion of parameterized gravity wave drag from the momentum budget (Martineau et al., 2016).
Each term of the momentum equation and the spread between reanalysis datasets are further evaluated as a function of latitude and pressure in Fig. 7 for the same period shown in Fig. 6 (days −5 to 0). The zonal-wind deceleration during this period is characterized by a strong deceleration maximized at about 70∘ N. A weak acceleration is also present around 30∘ N in the upper stratosphere, resulting primarily from the Coriolis torque (Martineau and Son, 2015). Zonal-wind tendency is fainter in the troposphere. As mentioned earlier, the agreement between datasets is much better in the lower atmosphere than the middle atmosphere. Large discrepancies are limited to the upper stratosphere and peak where the deceleration of the vortex is strongest.
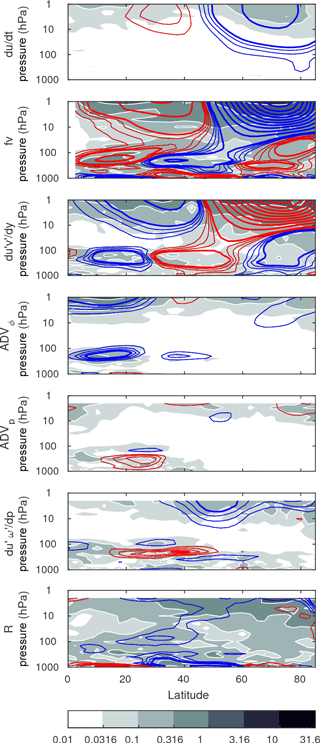
Figure 7Pressure–latitude cross section of inter-reanalysis mean terms of the momentum equation averaged from lags −5 to 0 days during SSW events. Composite mean is shown with red or blue for positive or negative values, with a contour interval of 0.25 for values ranging from 0.5 to 1.5 with thin contours and intervals of 2.5 ranging from 2.5 and larger with thick contours. The inter-reanalysis standard deviation is shaded per the color bar. All quantities are shown for the LRE members and are expressed in units of ms−1 day−1.
The QG terms, as expected, are strongly opposed to each other in both the troposphere and the stratosphere. The Coriolis torque is responsible for most of the deceleration of the stratospheric vortex. As mentioned above, it is also responsible for zonal-wind acceleration in the mid-latitudes and subtropics. The efficiency of this forcing depends on the extent to which it is opposed by the convergence of fluxes of momentum. While they are strongly opposed in the upper troposphere, they are not perfectly balanced in the stratosphere, which results in the observed zonal-wind tendencies. While the deceleration of the stratospheric vortex and its forcing is observed poleward of 50∘ N and thus well captured by averaging poleward of 45∘ N, QG forcing terms show a strong tripole in the troposphere, associated with the Hadley, Ferrel, and polar cells, which results in some unavoidable cancellation of the forcing when averaging from 45 to 85∘ N, explaining why we do not observe large QG terms in the troposphere in Fig. 6. The spread in the QG terms is maximized in the high-latitude stratosphere and a substantial reduction of the spread between datasets is evident in the lower stratosphere.
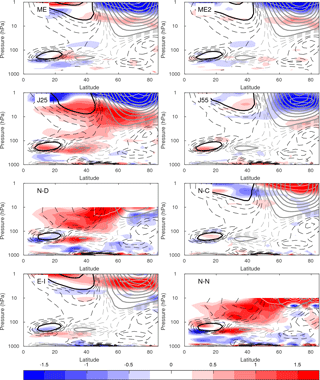
Figure 8Latitude–pressure cross section of the Coriolis torque averaged from lag −5 to 0 days during SSW events for different reanalysis datasets. The positive and negative values are contoured in black and grey, respectively. Dashed contours range from −4 to 4 ms−1 day−1 in steps of 1 ms−1 day−1 and solid contours are used from 5 ms−1 day−1 and larger in steps of 5 ms−1day−1. Biases with respect to the mean of LRE members are illustrated with red and blue shading for positive and negative values, respectively. The color interval is 0.25 ms−1 day−1 from −1.75 to 1.75. Values larger (smaller) than 2 (−2) are contoured every 2 ms−1 day−1 in white.
As expected, non-QG terms show smaller forcing and inter-data spread in the high latitudes. Interestingly, advection terms are maximized in the subtropical upper stratosphere and tropopause. Among the non-QG terms, only the vertical convergence of momentum fluxes shows substantial forcing for deceleration in the upper stratosphere in the mid-latitudes. It also displays large and sharp forcing at the tropopause, a feature observed clearly in averages over the high latitudes (Fig. 6). The resulting residual is typically negative and is also maximized in the high latitudes. However, it is larger in the jet's vicinity in the troposphere. The largest inter-data SD of the residual is in the polar region in the upper stratosphere.
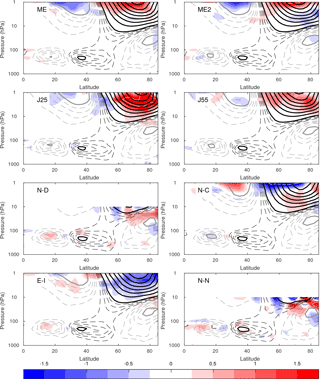
The inter-dataset spread is further highlighted for QG terms in Figs. 8 and 9. The two figures show the difference between each reanalysis and the mean of the LRE members. The large-scale structure of the Coriolis torque (Fig. 8) is generally similar among reanalyses but notable differences are observed in the upper stratosphere. Particularly, both ERA-Interim and NCEP-CFSR show weaker forcing for deceleration (positive bias) in the high-latitude upper stratosphere in comparison to others. Looking at the same cross section for the momentum flux convergence (Fig. 9) it is noticeable that there is generally a better agreement with the mean of the LRE members in the lower stratosphere and troposphere. However, differences are still large in the upper stratosphere. Interestingly, the spatial distribution of biases in the Coriolis torque and the momentum flux convergence are somewhat opposed in the upper stratosphere in some reanalyses, which may be indicative of a compensation between biases of the two leading terms of the momentum equation.
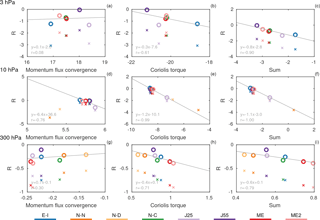
Figure 10Scatterplot comparing the residual (R) with respect to (a, d, g) momentum flux convergence, (b, e, h) Coriolis torque, and (c, f, i) their sum. While R is shown with circles, RQG is shown using crosses. All variables are averaged between 45 and 85∘ N and from lag −5 to 0 during SSW events. The (a–c) 3 hPa, (d–f) 10 hPa, and (g–i) 300 hPa levels are shown. All variables are expressed in units of ms−1 day−1. Linear regression of R with respect to each forcing term is displayed in each panel.
In order to identify possible sources of inconsistency in the momentum equation, the relationship between the residual and the dominant forcing terms is explored in Fig. 10 at three representative levels (3, 10, and 300 hPa). This analysis relies on the assumption that the inter-reanalysis variability of R is due to differences in the forcing terms and not to differences of zonal-wind tendency. This assumption is approximately valid since discrepancies in zonal-wind tendencies are generally much smaller than discrepancies in the dominant terms of the momentum equation (see Figs. 5, 6, and 7). Similar to Martineau et al. (2016), a large fraction of the variability in the residual among reanalyses in the mid-stratosphere (10 hPa) can be attributed to the Coriolis torque (r = −0.99). A relationship, although less significant, is also seen between the residual and the momentum flux convergence at 10 hPa (r = −0.76). Added together, the QG terms can explain all of the variability of the residual (r = −1). While this high correlation owes partly to the fact that JRA-25 is an outlier, NCEP-NCAR and NCEP-DOE also hint to a strong relationship between QG terms and the residual by inspecting the QG residual (RQG), which is computed by excluding non-QG terms from Eq. (1). The dominant role of the Coriolis torque is not as evident in the upper stratosphere (3 hPa) and the upper troposphere (300 hPa) but still plays an important role (r = −0.61 and r = −0.71, respectively).
The scatterplots highlight a convergence of newer reanalyses datasets in some circumstances. This is mostly apparent at 10 hPa where ERA-Interim, NCEP-CFSR, JRA-55, MERRA, and MERRA2 are strongly clustered together. At 300 hPa, however, MERRA and MERRA2 tend to be apart from other reanalyses, and at 3 hPa JRA-55 and ERA-Interim tend to differ from the others. One should therefore not assume that there is always convergence when considering the latest datasets.
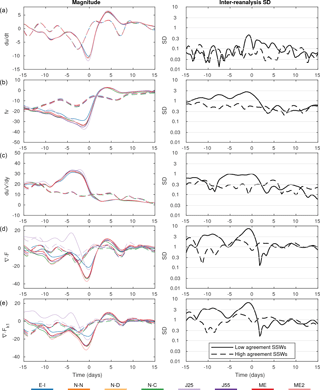
Figure 11Similar to Fig. 5 but for comparing SSW events with small (HASSWs – dashed lines) and large uncertainties (LASSWs – solid lines). EP flux divergence is shown for all wavenumbers (d) as well as wavenumber 1 (e). All diagnostics are shown at 10 hPa and are in units of ms−1 day−1.
To further explore a cancellation between the dominant terms of the momentum equation, the linear relationship between the Coriolis torque and the momentum flux convergence among reanalyses is also evaluated at the same three representative pressure levels (300, 10, and 3 hPa, not shown). While they are weakly opposed at 10 and 300 hPa, there is a clear and strong anticorrelation between the two forcing terms at 3 hPa (r = −0.82). Reanalyses that show an enhanced deceleration by the Coriolis torque typically exhibit an enhanced forcing for acceleration by momentum flux divergence. Although the compensation is not perfect (slope of −1.3 when regressing Coriolis torque on momentum flux convergence), this compensation helps nonetheless to reduce the residual of the momentum equation, but does so at the expense of the accuracy of the forcing terms of the momentum equation.
To further identify causes of inter-reanalysis discrepancies, we now proceed to compare SSW events with high agreement between reanalyses (HASSWs) and those with low agreement (LASSWs). The classification of these events was described in Sect. 2.3. Figure 11 shows several momentum budget terms at 10 hPa during both event types. It is found that LASSWs are markedly more intense than HASSWs, as seen by the peak deceleration of zonal wind that is stronger around the onset of the SSW. The forcing terms are also markedly larger during LASSWs. Despite the larger forcing terms, a strong cancellation is observed between the Coriolis torque and momentum flux convergence. In contrast, HASSWs show only steady and moderate forcing. To investigate the role played by wave drag in both types of event, we illustrate EP flux convergence and the contribution of zonal wavenumber-1 planetary waves (see Appendix B of Martineau et al., 2016, for a formulation of EP flux and TEM momentum equation in pressure coordinates). We find that LASSWs present substantially larger convergence of wave activity fluxes in the stratosphere in comparison to HASSWs. Most of the difference in wave drag can be attributed to wavenumber-1 EP flux divergence.
Among the reanalyses, JRA-25 seems to stand out from the others in terms of EP flux divergence by wavenumber-1 during LASSWs. Wave drag is especially affected by a positive bias at the early stage of these events. This difference could be due to a bias in stratospheric temperatures affecting the computation of heat fluxes and static stability, terms included in the computation of the vertical component of EP flux. This bias is subsequently corrected in JRA-55 (Kobayashi et al., 2015), which could explain the better agreement between JRA-55 and other members of the LRE. Another visible outlier, ERA-Interim, underestimates wave drag during LASSW events. These discrepancies are observed in many events included in the composite (not shown).
Next, the difference in the propagation of planetary-scale waves between HASSWs and LASSWs is illustrated in Fig. 12. LASSWs present markedly stronger forcing for deceleration (EP flux convergence) in the upper stratosphere in comparison to HASSW events and overall stronger inter-reanalysis uncertainty. Although LASSW events show both stronger upward and equatorward EP flux, most of the uncertainty is related to the vertical propagation alone. It is possible that these differences in wave drag among reanalyses be a source of large discrepancies in Coriolis torque through the generation of a compensating residual circulation. However, as discussed earlier, the inter-reanalysis variability in momentum fluxes does not fully account for the variability in Coriolis torque (Fig. 11) in LASSWs. This suggests that other factors, such as gravity wave drag, data assimilation, and radiative transfer, could also play a role. Despite the larger discrepancies in stratospheric circulation arising during LASSW events, there is no evidence of increased uncertainty of the tropospheric circulation in these events (not shown), indicating that either these differences have negligible impact on stratosphere–troposphere coupling or that any differences in downward coupling are prevented by data assimilation in the troposphere.
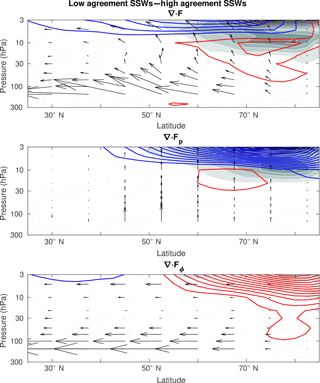
Figure 12Difference in EP flux (arrows) and its divergence (contours) between HASSWs and LASSWs. All quantities are averaged over lags −7 to 2 days. EP flux convergence and divergence are contoured in red and blue, respectively, with an interval of 2.5 ms−1 day−1. Differences in inter-reanalysis spread are shown in grey with a shading interval of 1 ms−1 day−1. Only LRE members are considered in this figure.
Since the previous analysis hinted that wavenumber-1 fluxes of wave activity are an important source of uncertainty among reanalyses, we also compared displacement (SSWD) and split (SSWS) events to evaluate whether vortex geometry could be a source of uncertainty (not shown). The two types of SSW show quite similar uncertainties among the various forcing terms. In fact, there is no clear separation between SSWD and SSWS; although SSWD events show more intense EP flux divergence by wavenumber 1, both types are forced by wavenumber 1 (Bancalá et al., 2012). Wavenumber 2 could simply show less uncertainty because it plays a lesser role in the composites shown. Among a total of seven LASSWs, four events are classified as SSWD events whereas three events are SSWS events and out of seven HASSWs four and two events are SSWDs and SSWSs, respectively. The remaining events are not clearly classified in either category. These statistics suffer however from the small sample sizes and there is no clear preference for split or displacement SSW events to be better represented in reanalysis datasets, as far as the inter-dataset agreement is concerned. In contrast, when considering the dominant fluxes of wave activity producing SSW evens, we find that out of seven LASSWs, four are W1-dominant and one is W2 dominant and out of seven HASSWs, one is W1-dominant and three are W2-dominant. This seems to indicate that wavenumber-1 wave drag is responsible for larger uncertainties in reanalysis datasets but a detailed analysis reveals that inter-reanalysis spread is not markedly different between W1-dominant and W2-dominant events (not shown), suggesting that it is the intensity of wave drag rather than the longitudinal scale of wave activity that is linked to uncertainties among reanalyses.
To assess uncertainties in the dynamical variability of the stratosphere and troposphere and their coupling in reanalysis datasets, a detailed comparison of zonal-mean momentum diagnostics is carried out for eight reanalysis datasets during sudden stratospheric warming events. Emphasis is placed on the vertical and temporal dependence of the uncertainties during the events as well as on the factors that lead to the uncertainties.
From the troposphere to the mid-stratosphere, all quantities of the momentum equation are remarkably similar among the datasets. Although inter-data discrepancies increase substantially towards the upper stratosphere, zonal-mean zonal wind and temperature, often used to illustrate the vertical coupling during SSW events, agree quite well up to the mid-stratosphere. As such, the temporal–spatial evolution of composite SSW events is nearly identical in the different datasets (Martineau and Son, 2010; Palmeiro et al., 2015).
Non-negligible uncertainties are observed mainly in the upper stratosphere. They are particularly large during the most intense SSW events, indicating that uncertainties in the momentum tendency and the related eddy fluxes are related to the strength of the episodes of planetary-scale wave propagation from the troposphere to the stratosphere. No significant difference among reanalyses, however, is found when comparing splitting and displacement events.
Among all resolved forcing terms of the zonal-mean momentum equation, the Coriolis torque and the meridional convergence of momentum fluxes show the largest magnitudes and largest disagreement among reanalyses several days before the reversal of zonal wind in the stratosphere. Such uncertainties decrease dramatically after the zonal-mean winds change direction during SSW events. This could be explained by the fact that a dynamically quiet period generally follows SSW events (Hitchcock and Shepherd, 2013). Other forcing terms, i.e., non-QG terms, show smaller magnitude and smaller inter-dataset uncertainty in comparison to the Coriolis torque and the convergence of momentum fluxes.
The large variability of forcing terms in the upper stratosphere among reanalyses exceeds many times the uncertainties in zonal wind. Thus, some reanalysis datasets exhibit large residuals in the momentum equation. Interestingly, the residuals are large and vary substantially among datasets prior to the reversal of zonal wind. This is consistent with the enhanced residual observed in periods of vortex transience in the analysis of Martineau et al. (2016). A marked reduction of the magnitude of the residual after the reversal of the zonal-mean circulation again suggests a less dynamically active period where the residual may be decreased in part because of a reduction of gravity wave drag in the upper stratosphere (Hitchcock and Shepherd, 2013), which is not considered in our budget of momentum and thus included in the residual. Most of the residual in the stratosphere is correlated to uncertainties in the Coriolis torque which may indicate that the meridional circulation responds in such a way as to balance missing forcing, likely by unresolved wave drag, in the momentum equation. The same also holds in the troposphere. Unlike the mid-stratosphere and troposphere, however, the residual of the zonal-mean momentum equation in the upper stratosphere benefits from a cancellation between biases in the Coriolis torque and eddy momentum flux convergence. Although this phenomenon contributes to a seemingly improved momentum budget, it does not help to reduce the uncertainties in the dynamical evolution of the events. This uncertainty does not, however, overly alter our interpretation of the dynamics regulating SSW events and should therefore not be a concern when studying SSW events in the troposphere and stratosphere. This relationship also indicates that a fraction of the variability of the meridional circulation among reanalyses is driven by inter-dataset differences of eddy fluxes. Wave drag is, however, not the sole contributor to inter-reanalysis discrepancies. Biases in the mean state combined with data assimilation may lead to discrepancies in meridional circulation in the stratosphere (Kobayashi and Iwasaki, 2016; Uppala et al., 2005).
A reduction of the inter-reanalysis spread during SSW events is generally observed in newer reanalyses for most terms of the momentum equation, especially in the stratosphere. Inspection of individual reanalyses, however, reveals that newer reanalyses are not always clustered together and that outliers vary depending on the pressure level and the variables.
Since this analysis compares the momentum diagnostics among reanalysis datasets, the uncertainties discussed here result from both the evolution of the different atmospheric fields by the forecast process and their subsequent adjustment by the data assimilation process. Discrepancies among reanalyses may thus originate from differences in the models, observations being assimilated, and assimilation techniques. Sources of error also include processes that are not well captured or parameterized, the latter not being considered in the momentum budget of this study. As discussed in Martineau et al. (2016), some fields may be easier to constrain than others, and thus more representative of the true evolution of the atmosphere. For instance, the zonal-mean zonal wind may be better constrained by temperature observations by assumptions of balance, like thermal wind balance. In contrast, ageostrophic flows such as the meridional circulation, may be harder to constrain by data assimilation. It is possible that this loosely constrained circulation may act to oppose biases in other forcings. A better understanding of the distinct contributions of the modeling and data assimilations steps to the observed uncertainties would require studying the forecasts and analysis increments separately.
The ERA-Interim dataset is provided by the European Centre for Medium-Range Weather Forecasts (ECMWF, 2009). NCEP-NCAR (National Centers for Environmental Prediction, 1994), NCEP-DOE (National Centers for Environmental Prediction, 2000), NCEP Climate Forecast System Reanalysis (Saha et al., 2010b), JRA-25 (Central Research Institute of Electric Power Industry and Japan Meteorological Agency, 2007), and JRA-55 (Japan Meteorological Agency, 2013) were obtained from the NCAR/UCAR Research Data Archive (RDA). MERRA (GMAO, 2008) and MERRA-2 (GMAO, 2015) are provided by the Modeling and Assimilation Data and Information Services Center (MDISC).
The authors declare that they have no conflict of interest.
This article is part of the special issue “The SPARC Reanalysis Intercomparison Project (S-RIP) (ACP/ESSD inter-journal SI)”. It is not associated with a conference.
The authors are grateful to three anonymous reviewers for their insightful comments
and suggestions. Patrick Martineau is supported by a JSPS Postdoctoral Fellowship for Research in Japan.
Edited by: Mathias Palm
Reviewed by: three anonymous referees
Abalos, M., Legras, B., Ploeger, F., and Randel, W. J.: Evaluating the advective Brewer-Dobson circulation in three reanalyses for the period 1979–2012, J. Geophys. Res.-Atmos., 120, 7534–7554, https://doi.org/10.1002/2015JD023182, 2015.
Ayarzaguena, B., Langematz, U., and Serrano, E.: Tropospheric forcing of the stratosphere: A comparative study of the two different major stratospheric warmings in 2009 and 2010, J. Geophys. Res.-Atmos., 116, 1–15, https://doi.org/10.1029/2010JD015023, 2011.
Baldwin, M. P.: Stratospheric Harbingers of Anomalous Weather Regimes, Science, 294, 581–584, https://doi.org/10.1126/science.1063315, 2001.
Bancalá, S., Krüger, K., and Giorgetta, M.: The preconditioning of major sudden stratospheric warmings, J. Geophys. Res.-Atmos., 117, 1–12, https://doi.org/10.1029/2011JD016769, 2012.
Butler, A. H., Seidel, D. J., Hardiman, S. C., Butchart, N., Birner, T., and Match, A.: Defining Sudden Stratospheric Warmings, B. Am. Meteorol. Soc., 96, 1913–1928, https://doi.org/10.1175/BAMS-D-13-00173.1, 2015.
Central Research Institute of Electric Power Industry and Japan Meteorological Agency: Japanese 25-year Reanalysis Project. Research Data Archive at the National Center for Atmospheric Research, Computational and Information Systems Laboratory, available at: http://rda.ucar.edu/datasets/ds625.0/ (last access: 6 October 2015), 2007.
Charlton, A. J. and Polvani, L. M.: A New Look at Stratospheric Sudden Warmings. Part I: Climatology and Modeling Benchmarks, J. Climate, 20, 449–469, https://doi.org/10.1175/JCLI3996.1, 2007.
Compo, G. P., Whitaker, J. S., Sardeshmukh, P. D., Matsui, N., Allan, R. J., Yin, X., Gleason Jr., E., Vose, R. S., Rutledge, G., Bessemoulin, P., Brönnimann, S., Brunet, M., Crouthamel, R. I., Grant, A. N., Groisman, P. Y., Jones, P. D., Kruk, M. C., Kruger, A. C., Marshall, G. J., Maugeri, M., Mok, H. Y., Ross, T. F., Nordli, Ø., Trigo, R. M., Wang, X. L., Woodruff, S. D., and Worleyu, S. J.: The Twentieth Century Reanalysis Project, Q. J. Roy. Meteor. Soc., 137, 1–28, https://doi.org/10.1002/qj.776, 2011.
Dee, D. P., Uppala, S. M., Simmons, A. J., Berrisford, P., Poli, P., Kobayashi, S., Andrae, U., Balmaseda, M. A., Balsamo, G., and Bauer, P.: The ERA-Interim reanalysis: configuration and performance of the data assimilation system, Q. J. Roy. Meteor. Soc., 137, 553–597, https://doi.org/10.1002/qj.828, 2011.
ECMWF: ERA Interim, daily, pressure levels. ECMWF, available at: http://apps.ecmwf.int/datasets/data/interim-full-daily/levtype=pl/ (last access: 7 April 2014), 2009.
Fujiwara, M., Wright, J. S., Manney, G. L., Gray, L. J., Anstey, J., Birner, T., Davis, S., Gerber, E. P., Harvey, V. L., Hegglin, M. I., Homeyer, C. R., Knox, J. A., Krüger, K., Lambert, A., Long, C. S., Martineau, P., Molod, A., Monge-Sanz, B. M., Santee, M. L., Tegtmeier, S., Chabrillat, S., Tan, D. G. H., Jackson, D. R., Polavarapu, S., Compo, G. P., Dragani, R., Ebisuzaki, W., Harada, Y., Kobayashi, C., McCarty, W., Onogi, K., Pawson, S., Simmons, A., Wargan, K., Whitaker, J. S., and Zou, C.-Z.: Introduction to the SPARC Reanalysis Intercomparison Project (S-RIP) and overview of the reanalysis systems, Atmos. Chem. Phys., 17, 1417–1452, https://doi.org/10.5194/acp-17-1417-2017, 2017.
Gelaro, R., McCarty, W., Suárez, M. J., Todling, R., Molod, A., Takacs, L., Randles, C., Darmenov, A., Bosilovich, M. G., Reichle, R., Wargan, K., Coy, L., Cullather, R., Draper, C., Akella, S., Buchard, V., Conaty, A., da Silva, A., Gu, W., Kim, G.-K., Koster, R., Lucchesi, R., Merkova, D., Nielsen, J. E., Partyka, G., Pawson, S., Putman, W., Rienecker, M., Schubert, S. D., Sienkiewicz, M., and Zhao, B.: The Modern-Era Retrospective Analysis for Research and Applications, Version 2 (MERRA-2), J. Climate, 30, 5419–5454, https://doi.org/10.1175/JCLI-D-16-0758.1, 2017.
Global Modeling and Assimilation Office (GMAO): inst3_3d_asm_Cp: MERRA 3D IAU State, Meteorology Instantaneous 3-hourly V5.2.0, Greenbelt, MD, USA, Goddard Earth Sciences Data and Information Services Center, GES DISC, https://doi.org/10.5067/8D4LU4390C4S (last access: 4 October 2017), 2008.
Global Modeling and Assimilation Office (GMAO): MERRA-2 inst3_3d_asm_Np: 3d,3-Hourly, Instantaneous, Pressure-Level, Assimilation, Assimilated Meteorological Fields V5.12.4, Greenbelt, MD, USA, Goddard Earth Sciences Data and Information Services Center (GES DISC), https://doi.org/10.5067/QBZ6MG944HW0 (last access: 5 July 2017), 2015.
Harada, Y., Goto, A., Hasegawa, H., Fujikawa, N., Naoe, H., and Hirooka, T.: A Major Stratospheric Sudden Warming Event in January 2009, J. Atmos. Sci., 67, 2052–2069, https://doi.org/10.1175/2009JAS3320.1, 2010.
Hitchcock, P. and Shepherd, T. G.: Zonal-Mean Dynamics of Extended Recoveries from Stratospheric Sudden Warmings, J. Atmos. Sci., 70, 688–707, https://doi.org/10.1175/JAS-D-12-0111.1, 2013.
Iwasaki, T., Hamada, H., and Miyazaki, K.: Comparisons of Brewer-Dobson Circulations Diagnosed from Reanalyses, J. Meteorol. Soc. Jpn., 87, 997–1006, https://doi.org/10.2151/jmsj.87.997, 2009.
Japan Meteorological Agency: JRA-55: Japanese 55-year Reanalysis, Daily 3-Hourly and 6-Hourly Data. Research Data Archive at the National Center for Atmospheric Research, Computational and Information Systems Laboratory, updated monthly, availabe at: https://doi.org/10.5065/D6HH6H41 (last access: 4 October 2017), 2013.
Kalnay, E., Kanamitsu, M., Kistler, R., Collins, W., Deaven, D., Gandin, L., Iredell, M., Saha, S., White, G., Woollen, J., Zhu, Y., Chelliah, M., Ebisuzaki, W., Higgins, W., Janowiak, J., Mo, K. C., Ropelewski, C., Wang, J., Leetmaa, A., Reynolds, R., Jenne, R., and Joseph, D.: The NCEP/NCAR 40-Year Reanalysis Project, B. Am. Meteorol. Soc., 77, 437–471, 1996.
Kanamitsu, M., Ebisuzaki, W., Woollen, J., Yang, S.-K., Hnilo, J. J., Fiorino, M., and Potter, G. L.: NCEP-DOE AMIP-II REANALYSIS (R-2), B. Am. Meteorol. Soc., 83, 1631–1644, 2002.
Kidston, J., Scaife, A. A., Hardiman, S. C., Mitchell, D. M., Butchart, N., Baldwin, M. P., and Gray, L. J.: Stratospheric influence on tropospheric jet streams, storm tracks and surface weather, Nat. Geosci., 8, 433–440, https://doi.org/10.1038/ngeo2424, 2015.
Kobayashi, C. and Iwasaki, T.: Brewer-Dobson circulation diagnosed from JRA-55, J. Geophys. Res.-Atmos., 121, 1493–1510, https://doi.org/10.1002/2015JD023476, 2016.
Kobayashi, S., Ota, Y., Harada, Y., Ebita, A., Moriya, M., Onoda, H., Onogi, K., Kamahori, H., Kobayashi, C., Endo, H., Miyaoka, K., and Takahashi, K.: The JRA-55 Reanalysis: General Specifications and Basic Characteristics, J. Meteorol. Soc. Jpn. Ser. II, 93, 5–48, https://doi.org/10.2151/jmsj.2015-001, 2015.
Lehtonen, I. and Karpechko, A. Y.: Observed and modeled tropospheric cold anomalies associated with sudden stratospheric warmings, J. Geophys. Res.-Atmos., 121, 1591–1610, https://doi.org/10.1002/2015JD023860, 2016.
Limpasuvan, V., Thompson, D. W. J., and Hartmann, D. L.: The Life Cycle of the Northern Hemisphere Sudden Stratospheric Warmings, J. Climate, 17, 2584–2596, https://doi.org/10.1175/1520-0442(2004)017<2584:TLCOTN>2.0.CO;2, 2004.
Lu, H., Bracegirdle, T. J., Phillips, T., and Turner, J.: A Comparative Study of Wave Forcing Derived from the ERA-40 and ERA-Interim Reanalysis Datasets, J. Climate, 28, 2291–2311, 2015.
Manney, G. L., Schwartz, M. J., Kruger, K., Santee, M. L., Pawson, S., Lee, J. N., Daffer, W. H., and Fuller, R. A.: Aura Microwave Limb Sounder observations of dynamics and transport during the record-breaking 2009 Arctic stratospheric major warming, Geophys. Res. Lett., 36, L12815, https://doi.org/10.1029/2009GL038586, 2009.
Martineau, P. and Son, S.-W.: Quality of reanalysis data during stratospheric vortex weakening and intensification events, Geophys. Res. Lett., 37, L22801, https://doi.org/10.1029/2010GL045237, 2010.
Martineau, P. and Son, S.-W.: Planetary-scale wave activity as a source of varying tropospheric response to stratospheric sudden warming events: A case study, J. Geophys. Res.-Atmos., 118, 1–13, https://doi.org/10.1002/jgrd.50871, 2013.
Martineau, P. and Son, S.-W.: Onset of Circulation Anomalies during Stratospheric Vortex Weakening Events: The Role of Planetary-Scale Waves, J. Climate, 28, 7347–7370, https://doi.org/10.1175/JCLI-D-14-00478.1, 2015.
Martineau, P., Son, S.-W., and Taguchi, M.: Dynamical Consistency of Reanalysis Datasets in the Extratropical Stratosphere, J. Climate, 29, 3057–3074, https://doi.org/10.1175/JCLI-D-15-0469.1, 2016.
Matsuno, T.: A Dynamical Model of the Stratospheric Sudden Warming, J. Atmos. Sci., 28, 1479–1494, 1971.
Mitchell, D. M., Gray, L. J., Anstey, J., Baldwin, M. P., and Charlton-Perez, A. J.: The Influence of Stratospheric Vortex Displacements and Splits on Surface Climate, J. Climate, 26, 2668–2682, https://doi.org/10.1175/JCLI-D-12-00030.1, 2013.
Monge-Sanz, B. M., Chipperfield, M. P., Dee, D. P., Simmons, A. J., and Uppala, S. M.: Improvements in the stratospheric transport achieved by a chemistry transport model with ECMWF (re)analyses: identifying effects and remaining challenges, Q. J. Roy. Meteor. Soc., 139, 654–673, https://doi.org/10.1002/qj.1996, 2013.
National Centers for Environmental Prediction: NCEP/NCAR Global Reanalysis Products, 1948–continuing, Research Data Archive at the National Center for Atmospheric Research, National Weather Service/NOAA/U.S. Department of Commerce, Computational and Information Systems Laboratory, updated monthly, available at: http://rda.ucar.edu/datasets/ds090.0/ (last access: 12 September 2015), 1994.
National Centers for Environmental Prediction: NCEP/DOE Reanalysis 2 (R2), Research Data Archive at the National Center for Atmospheric Research, National Weather Service/NOAA/U.S. Department of Commerce, Computational and Information Systems Laboratory, available at: http://rda.ucar.edu/datasets/ds091.0/ (last access: 12 September 2015), 2000.
Onogi, K., Tsutsui, J., Koide, H., Sakamoto, M., Kobayashi, S., Hatsushika, H., Matsumoto, T., Yamazaki, N., Kamahori, H., Takahashi, K., Kadokura, S., Wada, K., Kato, K., Oyama, R., Ose, T., Mannoji, N., and Taira, R.: The JRA-25 Reanalysis, J. Meteor. Soc. Jpn., 85, 369–432, 2007.
Palmeiro, F. M., Barriopedro, D., García-Herrera, R., and Calvo, N.: Comparing Sudden Stratospheric Warming Definitions in Reanalysis Data, J. Climate, 28, 6823–6840, https://doi.org/10.1175/JCLI-D-15-0004.1, 2015.
Poli, P., Hersbach, H., Tan, D., Dee, D., Thépaut, J., Simmons, A., Peubey, C., Laloyaux, P., Komori, T., Berrisford, P., and Dragani, R.: The data assimilation system and initial performance evaluation of the ECMWF pilot reanalysis of the 20th-century assimilating surface observations only (ERA-20C), ERA Rep. Ser., European Centre for Medium-Range Weather Forecasts, Reading, UK, 59 pp., 2013.
Polvani, L. M. and Waugh, D. W.: Upward Wave Activity Flux as a Precursor to Extreme Stratospheric Events and Subsequent Anomalous Surface Weather Regimes, J. Climate, 17, 3548–3554, https://doi.org/10.1175/1520-0442(2004)017<3548:UWAFAA>2.0.CO;2, 2004.
Rienecker, M. M., Suarez, M. J., Gelaro, R., Todling, R., Bacmeister, J., Liu, E., Bosilovich, M. G., Schubert, S. D., Takacs, L., Kim, G. K., Bloom, S., Chen, J., Collins, D., Conaty, A., Da Silva, A., Gu, W., Joiner, J., Koster, R. D., Lucchesi, R., Molod, A., Owens, T., Pawson, S., Pegion, P., Redder, C. R., Reichle, R., Robertson, F. R., Ruddick, A. G., Sienkiewicz, M., and Woollen, J.: MERRA: NASA's modern-era retrospective analysis for research and applications, J. Climate, 24, 3624–3648, 2011.
Saha, S., Moorthi, S., Pan, H.-L., Wu, X., Wang, J., Nadiga, S., Tripp, P., Kistler, R., Woollen, J., Behringer, D., Liu, H., Stokes, D., Grumbine, R., Gayno, G., Wang, J., Hou, Y.-T., Chuang, H.-Y., Juang, H.-M. H., Sela, J., Iredell, M., Treadon, R., Kleist, D., Van Delst, P., Keyser, D., Derber, J., Ek, M., Meng, J., Wei, H., Yang, R., Lord, S., Van Den Dool, H., Kumar, A., Wang, W., Long, C., Chelliah, M., Xue, Y., Huang, B., Schemm, J.-K., Ebisuzaki, W., Lin, R., Xie, P., Chen, M., Zhou, S., Higgins, W., Zou, C.-Z., Liu, Q., Chen, Y., Han, Y., Cucurull, L., Reynolds, R. W., Rutledge, G., and Goldberg, M.: The NCEP Climate Forecast System Reanalysis, B. Am. Meteorol. Soc., 91, 1015–1057, https://doi.org/10.1175/2010BAMS3001.1, 2010a.
Saha, S., Moorthi, S., Pan, H., Wu, X., Wang, J., Nadiga, S., Tripp, P., Kistler, R., Woollen, J., Behringer, D., Liu, H., Stokes, D., Grumbine, R., Gayno, G., Wang, J., Hou, Y., Chuang, H., Juang, H. H., Sela, J., Iredell, M., Treadon, R., Kleist, D., Van Delst, P., Keyser, D., Derber, J., Ek, M., Meng, J., Wei, H., Yang, R., Lord, S., van den Dool, H., Kumar, A., Wang, W., Long, C., Chelliah, M., Xue, Y., Huang, B., Schemm, J., Ebisuzaki, W., Lin, R., Xie, P., Chen, M., Zhou, S., Higgins, W., Zou, C., Liu, Q., Chen, Y., Han, Y., Cucurull, L., Reynolds, R. W., Rutledge, G., and Goldberg, M.: NCEP Climate Forecast System Reanalysis (CFSR) 6-hourly Products, January 1979 to December 2010. Research Data Archive at the National Center for Atmospheric Research, Computational and Information Systems Laboratory, available at: https://doi.org/10.5065/D69K487J (last access: 25 September 2014), 2010b.
Saha, S., Moorthi, S., Wu, X., Wang, J., Nadiga, S., Tripp, P., Behringer, D., Hou, Y. T., Chuang, H. Y., Iredell, M., Ek, M., Meng, J., Yang, R., Mendez, M. P., Van Den Dool, H., Zhang, Q., Wang, W., Chen, M., and Becker, E.: The NCEP climate forecast system version 2, J. Climate, 27, 2185–2208, https://doi.org/10.1175/JCLI-D-12-00823.1, 2014.
Seviour, W. J. M., Mitchell, D. M., and Gray, L. J.: A practical method to identify displaced and split stratospheric polar vortex events, Geophys. Res. Lett., 40, 5268–5273, https://doi.org/10.1002/grl.50927, 2013.
Sigmond, M., Scinocca, J. F., Kharin, V. V., and Shepherd, T. G.: Enhanced seasonal forecast skill following stratospheric sudden warmings, Nat. Geosci., 6, 1–5, https://doi.org/10.1038/ngeo1698, 2013.
Smith, A. K. and Lyjak, L. V.: An Observational Estimate of Gravity Wave Drag From the Momentum Balance in the Middle Atmosphere, J. Geophys. Res., 90, 2233–2241, 1985.
Smith, K. L. and Kushner, P. J.: Linear interference and the initiation of extratropical stratosphere-troposphere interactions, J. Geophys. Res., 117, D13107, https://doi.org/10.1029/2012JD017587, 2012.
Taguchi, M.: On the Asymmetry of Forecast Errors in the Northern Winter Stratosphere between Vortex Weakening and Strengthening Conditions, J. Meteorol. Soc. Jpn. Ser. II, 93, 443–457, https://doi.org/10.2151/jmsj.2015-029, 2015.
Tripathi, O. P., Baldwin, M., Charlton-Perez, A., Charron, M., Eckermann, S. D., Gerber, E., Harrison, R. G., Jackson, D. R., Kim, B.-M., Kuroda, Y., Lang, A., Mahmood, S., Mizuta, R., Roff, G., Sigmond, M., and Son, S.-W.: The predictability of the extratropical stratosphere on monthly time-scales and its impact on the skill of tropospheric forecasts, Q. J. Roy. Meteor. Soc., 141, 987–1003, https://doi.org/10.1002/qj.2432, 2015.
Uppala, S. M., Kallberg, P. W., Simmons, A. J., Andrae, U., Bechtold, V. D. C., Fiorino, M., Gibson, J. K., Haseler, J., Hernandez, A., Kelly, G. A., Li, X., Onogi, K., Saarinen, S., Sokka, N., Allan, R. P., Andersson, E., Arpe, K., Balmaseda, M. A., Beljaars, A. C. M., Berg, L. Van De, Bidlot, J., Bormann, N., Caires, S., Chevallier, F., Dethof, A., Dragosavac, M., Fisher, M., Fuentes, M., Hagemann, S., Holm, E., Hoskins, B. J., Isaken, L., Janssen, P. A. E. M., Jenne, R., McNally, A. P., Mahfouf, J.-F., Morcrette, J.-J., Rayner, N. A., Saunders, R. W., Simon, P., Sterl, A., Trenberth, K. E., Untch, A., Vasiljevic, D., Viterbo, P., and Woollen, J.: The ERA-40 re-analysis, Q. J. Roy. Meteor. Soc., 131, 2961–3012, 2005.


