the Creative Commons Attribution 4.0 License.
the Creative Commons Attribution 4.0 License.
 | 08 May 2018
Phenomenology of summer ozone episodes over the Madrid Metropolitan Area, central Spain
Xavier Querol
Andrés Alastuey
Gotzon Gangoiti
Noemí Perez
Hong K. Lee
Heeram R. Eun
Yonghee Park
Enrique Mantilla
Miguel Escudero
Gloria Titos
Lucio Alonso
Brice Temime-Roussel
Nicolas Marchand
Juan R. Moreta
M. Arantxa Revuelta
Pedro Salvador
Begoña Artíñano
Saúl García dos Santos
Mónica Anguas
Alberto Notario
Alfonso Saiz-Lopez
Roy M. Harrison
Millán Millán
Kang-Ho Ahn
Various studies have reported that the photochemical nucleation of new ultrafine particles (UFPs) in urban environments within high insolation regions occurs simultaneously with high ground ozone (O3) levels. In this work, we evaluate the atmospheric dynamics leading to summer O3 episodes in the Madrid air basin (central Iberia) by means of measuring a 3-D distribution of concentrations for both pollutants. To this end, we obtained vertical profiles (up to 1200 m above ground level) using tethered balloons and miniaturised instrumentation at a suburban site located to the SW of the Madrid Metropolitan Area (MMA), the Majadahonda site (MJDH), in July 2016. Simultaneously, measurements of an extensive number of air quality and meteorological parameters were carried out at three supersites across the MMA. Furthermore, data from O3 soundings and daily radio soundings were also used to interpret atmospheric dynamics.
The results demonstrate the concatenation of venting and accumulation episodes, with relative lows (venting) and peaks (accumulation) in O3 surface levels. Regardless of the episode type, the fumigation of high-altitude O3 (arising from a variety of origins) contributes the major proportion of surface O3 concentrations. Accumulation episodes are characterised by a relatively thinner planetary boundary layer (< 1500 m at midday, lower in altitude than the orographic features), light synoptic winds, and the development of mountain breezes along the slopes of the Guadarrama Mountain Range (located W and NW of the MMA, with a maximum elevation of > 2400 m a.s.l.). This orographic–meteorological setting causes the vertical recirculation of air masses and enrichment of O3 in the lower tropospheric layers. When the highly polluted urban plume from Madrid is affected by these dynamics, the highest Ox (O3+ NO2) concentrations are recorded in the MMA.
Vertical O3 profiles during venting episodes, with strong synoptic winds and a deepening of the planetary boundary layer reaching > 2000 m a.s.l., were characterised by an upward gradient in O3 levels, whereas a reverse situation with O3 concentration maxima at lower levels was found during the accumulation episodes due to local and/or regional production. The two contributions to O3 surface levels (fumigation from high-altitude strata, a high O3 background, and/or regional production) require very different approaches for policy actions. In contrast to O3 vertical top-down transfer, UFPs are formed in the planetary boundary layer (PBL) and are transferred upwards progressively with the increase in PBL growth.
- Article
(13888 KB) - Full-text XML
-
Supplement
(1635 KB) - BibTeX
- EndNote


The EU Directive 2008/50/EC (2008) on ambient air quality, amended by Directive 2015/1480/EC (2015), establishes the need to comply with air quality standards to protect citizens and ecosystems. If these are not met, plans to improve air quality must be implemented by national, regional, and local administrations. Despite the considerable improvements in air quality during the last decade, non-compliance with European air quality standards is still reported in most of Europe. In particular, the limit values for nitrogen dioxide (NO2), particulate matter (PM10 and PM2.5), and the tropospheric ozone (O3) target value are frequently exceeded (EEA, 2017). Therefore, in 2013, the National Plan for Air Quality and Protection of the Atmosphere (Plan AIRE) 2013–2016 was drawn up and approved by the Spanish Council of Ministers' Agreement of 12 April 2013.
The EEA (2017) recently reported that in 2015, 80 % of the urban EU-28 population was exposed to PM2.5 levels exceeding the WHO guideline and 90 % to that of O3.
Measures to effectively reduce NO2 and primary PM pollution are relatively easy to identify (such as abating industrial, shipping, and traffic emissions with catalytic converters for NOX and particulate controls for PM). However, defining policies for abating O3, other photochemical pollutants, and the secondary components of PM is much more complex.
Photochemical pollution is a subject of great environmental importance in southern Europe due to its climatic and geographical characteristics (Ochoa-Hueso, 2017). Products of this type of pollution are many, the most noteworthy being tropospheric O3, secondary PM (nitrate, sulfate, and secondary organic compounds), and the generation of new ultrafine particles (UFPs) by nucleation (Gomez-Moreno et al., 2011; Brines et al., 2015).
In summer, the Western Mediterranean Basin (WMB), surrounded by high mountains, falls under the influence of the semi-permanent Azores anticyclone. Clear skies prevail under a generalised level of subsidence aloft, and meso-meteorological processes with marked diurnal cycles dominate. Recirculation, strong insolation, and stability in the upper layers favour the production and accumulation of O3 (Millán et al., 1997, 2000, 2002; Kalabokas et al., 2008; Giannakopoulos et al., 2009; Velchev et al., 2011; Sicard et al., 2013) and the emissions of biogenic volatile organic compounds (BVOCs; Giannakopoulos et al., 2009).
The abatement of tropospheric O3 levels in this region is a difficult challenge due to its origin, which may be local, regional, and/or transboundary (Millán et al., 2000; Millán, 2014; Lelieveld et al., 2002; Kalabokas et al., 2008, 2013, 2015, 2017; Velchev et al., 2011; Sicard et al., 2013; Zanis et al., 2014), the complexity of the meteorological scenarios leading to severe episodes (Millán et al., 1997; Gangoiti et al., 2001; Dieguez et al., 2009, 2014; Kalabokas et al., 2017), and the complexity of the non-linear chemical processes that drive its formation and sinks (Monks et al., 2015, and references therein).
This complex context has led to a lack of “sufficient” O3 abatement in Spain (and Europe), while for primary pollutants, such as SO2 and CO, and the primary fractions of PM10 and PM2.5 improvement has been very evident (EEA, 2017). Thus, the latest air quality assessment for Europe (EEA, 2017) shows the following: (i) there has been a tendency for the peak O3 concentration values (those exceeding the hourly information threshold of 180 µg m−3) to decrease in recent years, although not enough to meet the WHO guidelines and EC standards; and (ii) the problem of O3 episodes is more pronounced in the south than in northern and central Europe. Likewise, O3 levels are higher in rural than in urban areas, both due to (i) the generation process, which requires time since the emissions of urban, industrial, and biogenic precursors to the production of O3, and (ii) the consumption (NO titration) of O3 that takes place in urban areas.
Other studies, such as Sicard et al. (2013), Paoletti et al. (2014), Escudero et al. (2014), García et al. (2014), Querol et al. (2014, 2016), and EMEP (2016), also provided evidence that there is a general tendency for O3 to increase in urban areas, including at traffic sites, probably due to the greater reduction of NO emissions relative to NO2 and therefore a lower NO titration effect. This trend in decreasing NO ∕ NO2 ratios from diesel vehicle emissions (the main source of NOX in urban Europe) has been widely reported (i.e. Carslaw et al., 2016). It has also been found that regional background O3 levels have remained constant over the last 15 years, while acute episodes have been drastically reduced compared to the late 1990s, although these markedly increase during heat waves, such as those in the summers of 2003 and 2015 (EEA, 2017; Diéguez et al., 2009, 2014; Querol et al., 2016).
A recent study (Saiz-Lopez et al., 2017) reported an increase of 30–40 % in ambient air O3 levels, along with a decrease of 20–40 % in NO2, from 2007 to 2014 in Madrid, which may have led to large concentration increases of up to 70 and 90 % in OH and NO3, respectively, thereby changing the oxidative capacity of this urban atmosphere. We still do not know if this increase is due to a decrease in the NO titration effect or to the fact that O3 formation is dominated by VOCs since urban areas are characterised by “VOC-limited” conditions, and a reduction in NOx emissions might yield an increase in O3 formation.
Intensive research on O3 pollution has been carried out in the Mediterranean since the late 1980s and has been key in understanding the behaviour of this pollutant in Europe. It has also been used to establish current European air quality standards (Millán et al., 1991, 1996a, b, c, 2000, 2002; Millán, 2002; Lelieveld 2002; EC, 2002, 2004; Millán and Sanz, 1999; Mantilla et al., 1997; Salvador et al., 1997, 1999; Gangoiti et al., 2001; Stein et al., 2004, 2005; Chevalier et al., 2007; Kalabokas et al., 2008, 2015, 2017; Castell et al., 2008a, b, 2012; Kulkarni et al., 2011; Velchev et al., 2011; Doval et al., 2012; Sicard et al., 2013; Millán, 2014; Escudero et al., 2014; Zanis et al., 2014; Sicard et al., 2017, among others). The EEA (2017) reports a clear increase in exceedances of the human protection 8 h O3 target values in southern and central Europe, which are higher in the Italian Po Valley and Spain and relatively lower in Portugal and the Eastern Mediterranean.
Focusing on the study area, Diéguez et al. (2009, 2014) describe in detail the temporal and spatial variation in O3 levels in Spain. These studies highlight the low inter-annual variability in regional background stations and the existence of specific areas, such as the Madrid air basin (MAB), northern valleys influenced by the Barcelona urban plume, Puertollano basin, and the interior of the Valencian region where very high O3 episodes are relatively frequent, and point to urban and industrial hot spots as relevant sources of precursors. Recently, Querol et al. (2016) provided evidence that the highest O3 episodes, with hourly exceedances of the information threshold for informing the population (180 µg m−3) during 2000–2015, occurred mostly around these densely populated or industrialised areas.
Querol et al. (2017) report that the high-O3 plume transported from the metropolitan area of Barcelona contributed decisively to the frequent exceedances of the information threshold in the northern areas of Barcelona during the acute O3 episodes in July 2015. They also demonstrate that the associated meteorology was very complex, similar to the scenarios involving the vertical recirculation of air masses reported by Gangoiti et al. (2001), Millán (2014), and Diéguez et al. (2014) for other regions of the Western Mediterranean. The regional transport of O3 is also very relevant for the occurrence of acute O3 episodes causing exceedances of the information threshold. It is also shown that the vast majority of these exceedances are recorded in July.
In the Eastern Mediterranean, the regional background O3 levels in the free troposphere and the upper boundary layer during summer might regularly exceed 60 ppb, and the fumigation of these upper air masses contributes on average to the greatest part of the surface O3 levels measured in Greece (Kalabokas et al., 2000; Kourtidis et al., 2002; Kouvarakis et al., 2002; Lelieveld et al., 2002; Kalabokas and Repapis, 2004; Gerasopoulos et al., 2005). Furthermore, a number of studies report contributions from the stratosphere to the surface O3 concentrations during specific meteorological scenarios in the same region (Kalabokas et al., 2013, 2015; Zanis et al., 2014; Parrish et al., 2012; Lefohn et al., 2012; Akritidis et al., 2016, among others). In addition, recent research shows that during springtime O3 episodes (April–May) over the WMB, similar synoptic meteorological patterns might also occur, and that these are linked with regional episodes, mainly induced by large-scale tropospheric O3 subsidence influencing the boundary layer and the ground surface O3 concentrations (Kalabokas et al., 2017). However, the most intense episodes in the WMB occur in June–July according to the statistics for the 2000–2015 period in Spain presented by Querol et al. (2016).
In addition to primary emissions, nucleation or new particle formation (NPF) processes give rise to relevant contributions to the urban ambient air UFP concentrations, mostly during photochemical pollution episodes in spring and summer (Brines et al., 2015, and references therein). Ambient conditions favouring urban NPF are high insolation, low relative humidity, available SO2 and VOCs, and a low condensation sink potential (i.e. a relatively clean atmosphere with low surface aerosol concentrations; Kulmala et al., 2000, 2004; Kulmala and Kerminen, 2008; Sipilä, et al., 2010; Salma et al., 2016).
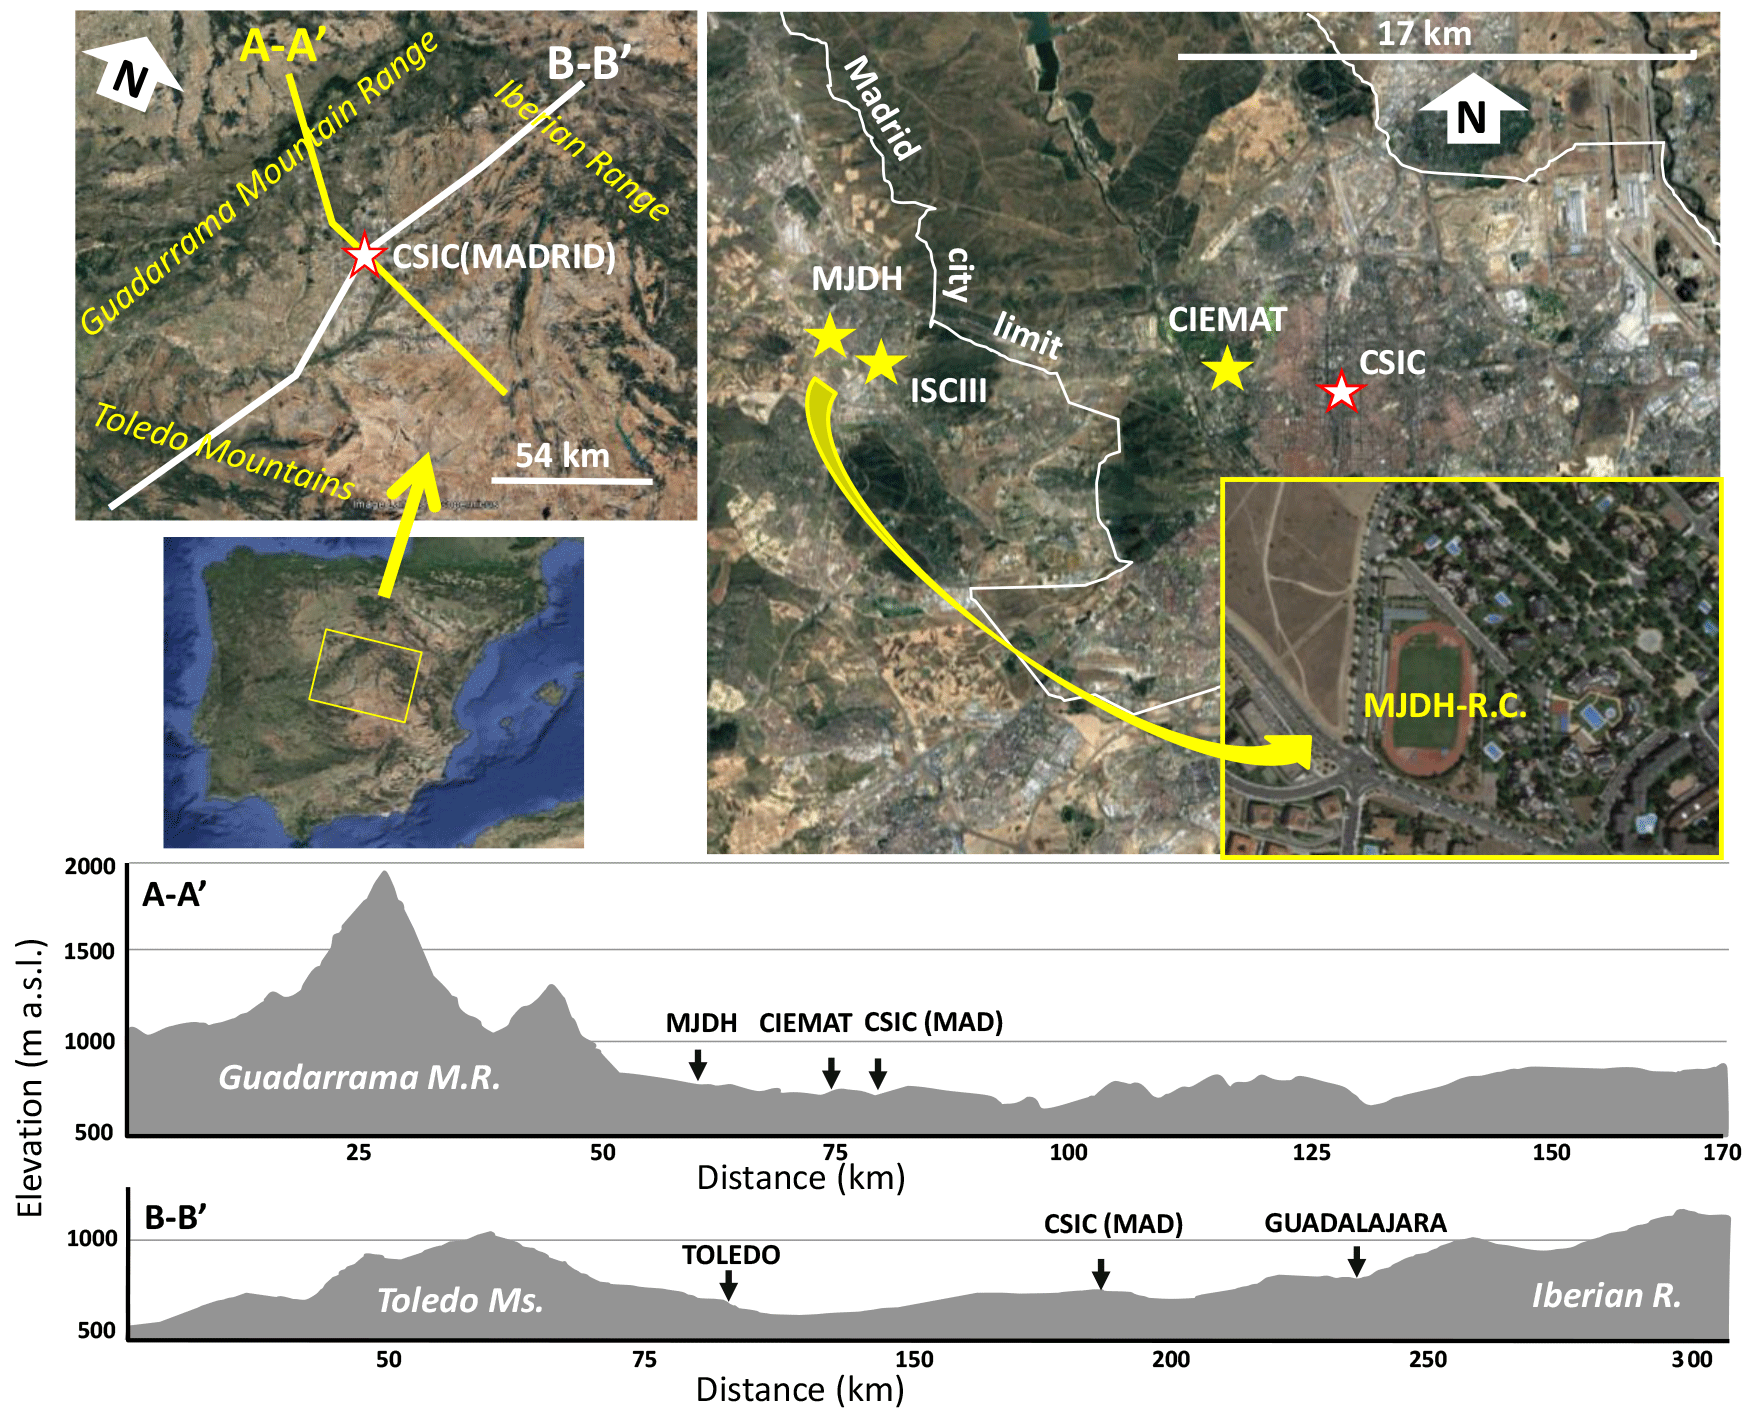
Figure 1Location of the study area, profiles showing the major orographic patterns, location of three supersites (CSIC, CIEMAT, ISCIII), and the site where vertical profile measurements were carried out (MJDH).
In this study, we evaluate the temporal and spatial variability of O3 and UFPs in the MAB (4–20 July 2016) to investigate the causes of acute summer episodes of both pollutants and possible inter-relationships. In a subsequent companion paper (Carnerero et al., 2018), we will focus on the phenomenology of UFP nucleation episodes linked with these photochemical events. Data on UFPs are included in this paper only where they assist in interpreting the behaviour of O3.
2.1 The study area
The MAB and the Madrid Metropolitan Area (MMA) are located in the central plain, or Meseta, of the Iberian Peninsula at around 700 m a.s.l. Regarding the topographic features, the Guadarrama range, which runs in the NE–SW direction, reaches heights of up to 2400 m a.s.l. and is located 40 km north from the MMA. To the S, are the Toledo Mountains, which run from E to W (Fig. 1). Lower mountains, located to the NE and E, are part of the Iberian range. Consequently, the Madrid plain shows a NE–SW channelling of winds forced by the main mountain ranges and following the basin of the Tagus River and its tributaries. In particular, the MMA is located to the NE of the river basin and on its E side.
Climatologically, the area is characterised by continental conditions with hot summers and cold winters, with both seasons typically being dry. Mean annual precipitation of approximately 400 mm is mainly concentrated in the autumn and spring. The MMA is one of the most densely populated regions in Spain, with more than 5 million inhabitants, including Madrid and the surrounding towns. According to Salvador et al. (2015), anthropogenic emissions are dominated by road traffic and residential heating (in winter), with minor contributions from industry and a large airport.
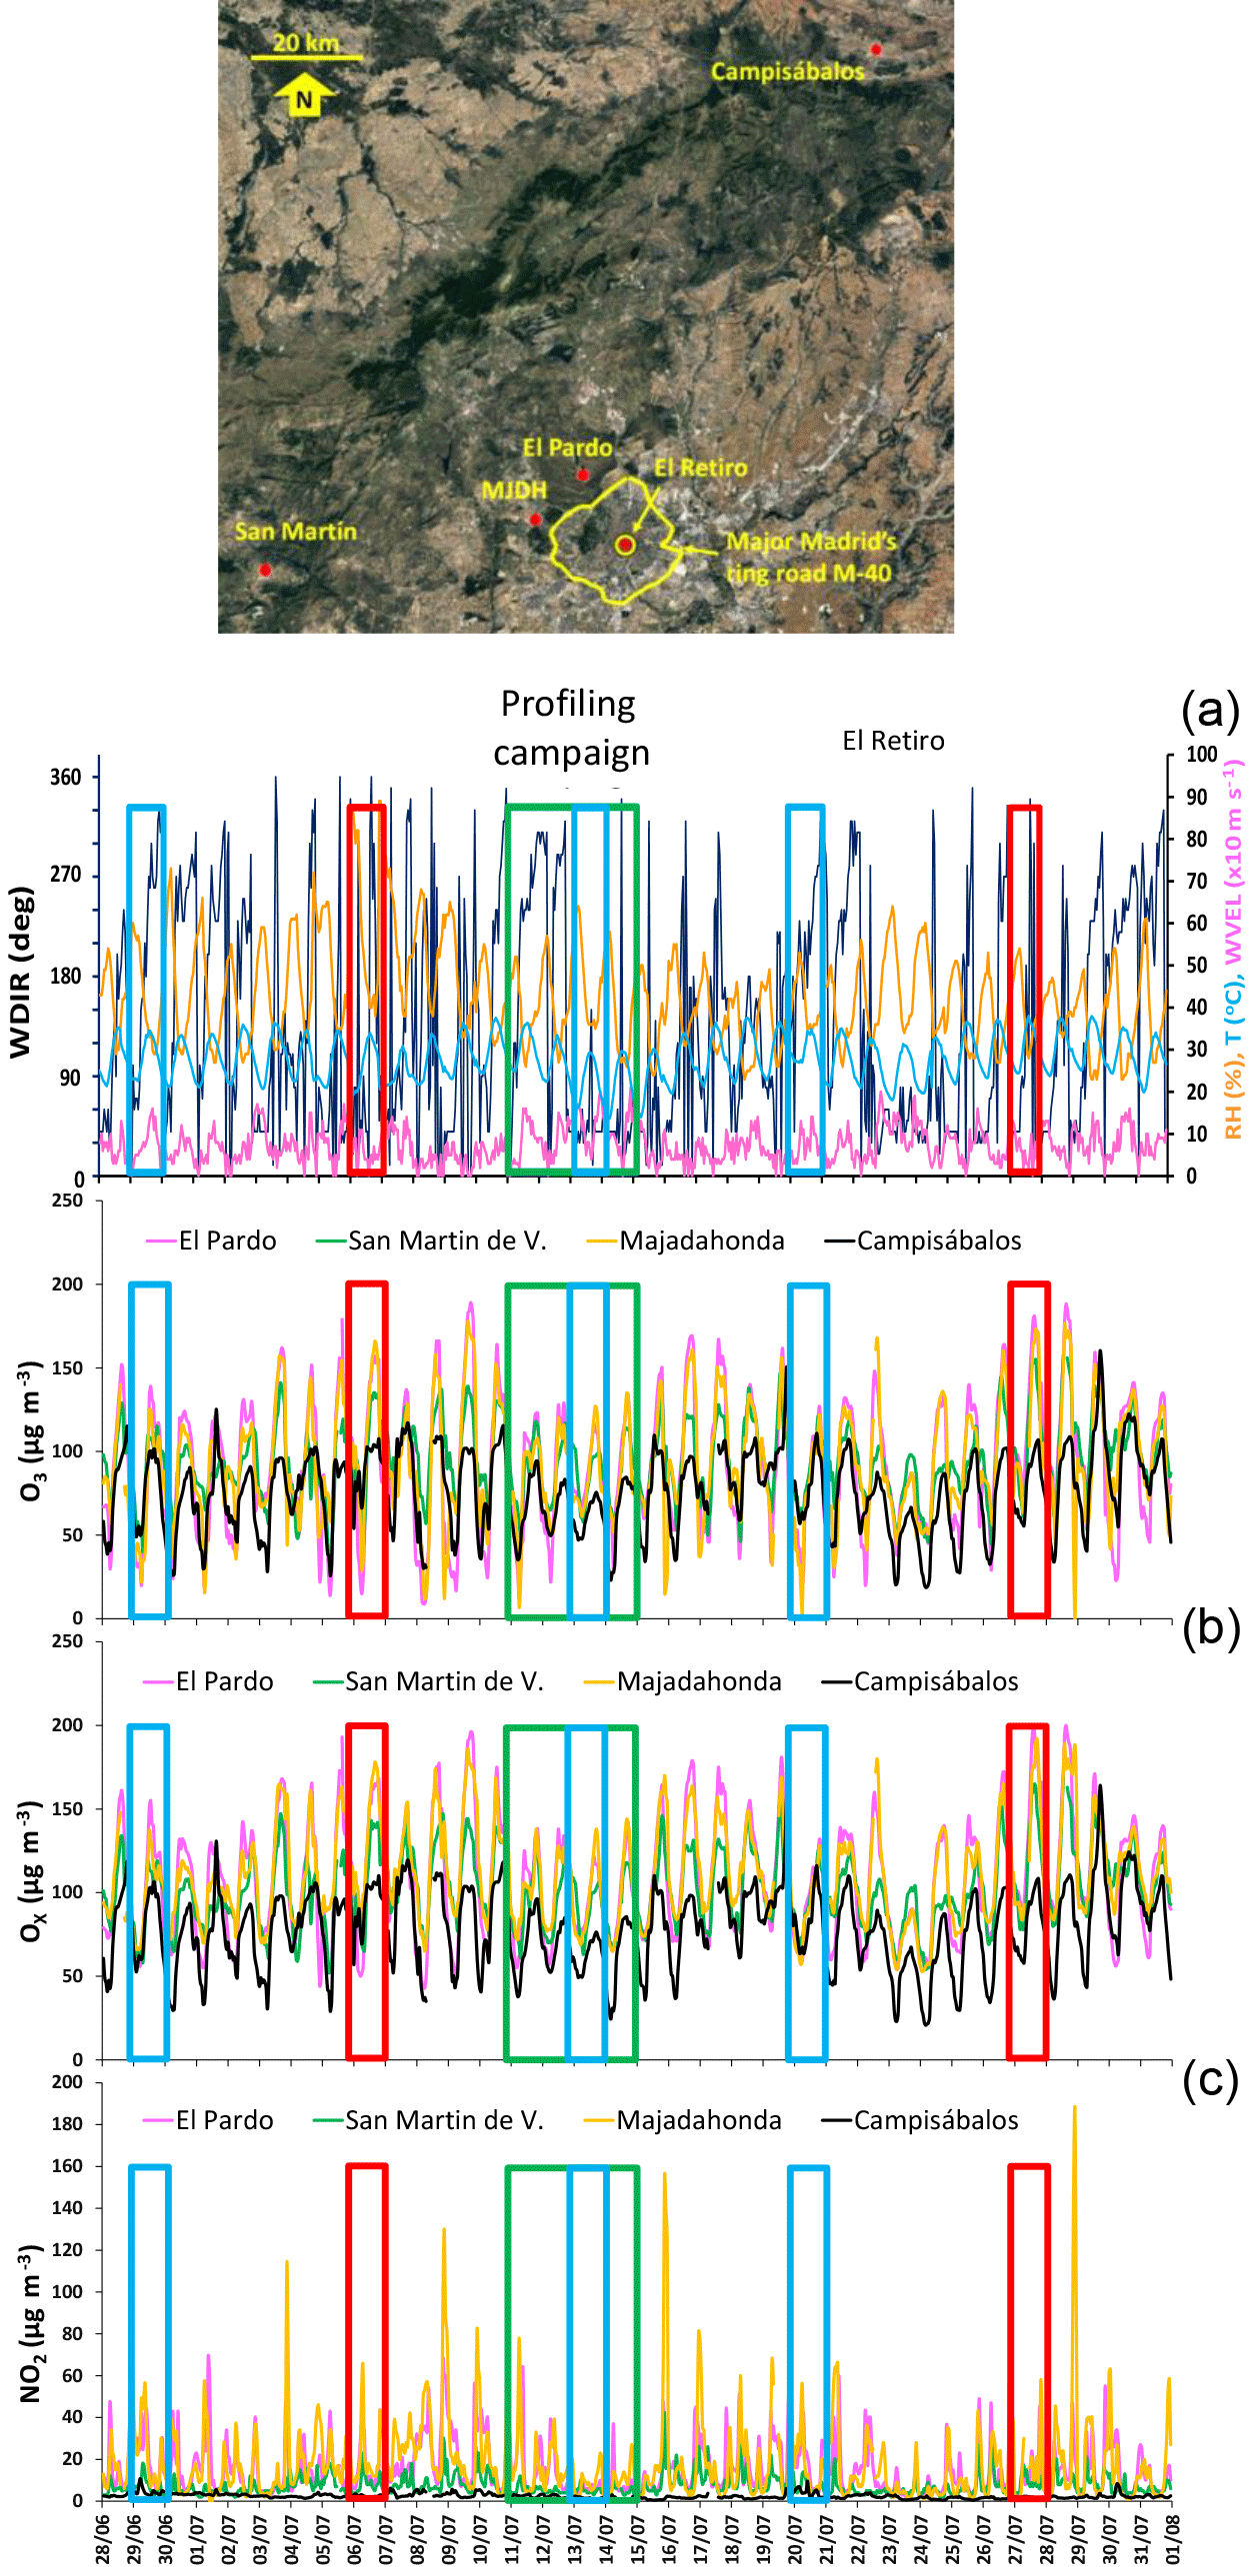
Figure 2(a) Hourly meteorological parameters recorded at El Retiro air quality monitoring station in central Madrid (from 28 June 2016 to 1 August 2016). (b) Hourly concentrations of O3 and OX (O3+ NO2) recorded at a selection of air quality monitoring stations representing the greater Madrid area, together with those from the remote background station of Campisábalos. (c) Hourly NO2 concentrations recorded at the same sites for the same period. Periods with available AEMET free soundings of O3 are bracketed with red (accumulation) or blue (venting) squares. The vertical O3 and UFP profiling campaign is marked with a green square.
Figure 2 shows the time series of the recorded meteorology measured at a surface station representative of the conditions in the MMA during the field campaign of July 2016 (El Retiro in central Madrid). In order to put the field campaign into the context of the more general meteorological situation, the time series is extended backwards to the end of June and forward to the end of July 2016. Figure 2 also shows the corresponding time series for O3, NO2, and OX concentrations in the MMA, demonstrating the occurrence of well-marked peaks alternating with relatively low O3 and Ox concentrations periods. The intensive field campaign (11–14 July 2016, marked with a green frame) coincides with a low O3 interval preceding a higher O3 period in the last 2 days. Red and blue frames in Fig. 2 show days on which high-resolution O3 free soundings were performed (red and blue indicating intervals within high and low O3, respectively).
2.2 Monitoring sites and instrumentation
To characterise acute summer episodes of O3 and UFPs and to investigate their possible relationships, we devised an intensive field campaign in the MMA. Three measurement supersites in and around Madrid, following a W-NW direction according the previously described dynamics, were deployed in an area where the highest levels of O3 (with hourly maxima sporadically exceeding 180 µg m−3) are usually recorded (Reche et al., 2018) inside the MAB (Fig. 1). Table 1 shows the equipment available at the following three supersites:
-
Madrid-CSIC, located at the Spanish National Research Council headquarters (this site is located in central Madrid on the sixth floor of the building of the Instituto de Ciencias Agrarias);
-
CIEMAT, located at the Centro de Investigaciones Energéticas Medioambientales y Tecnológicas headquarters, 4 km in the W-NW direction from the CSIC site in a suburban area; and
-
MJDH-ISCIII, located in the Instituto de Salud Carlos III in Majadahonda, 15 km in the NW direction from the CSIC site.
At MJDH-ISCIII, a PTR-ToF-MS (proton-transfer reaction time-of-flight mass spectrometer) was deployed from 4 to 19 July 2016 and provides insights into the O3 formation potential (OFP) of the VOC mixture over the MMA. The operation procedure of the PTR-ToF-MS and OFP calculation are detailed in Table S1 and Fig. S1 in the Supplement.
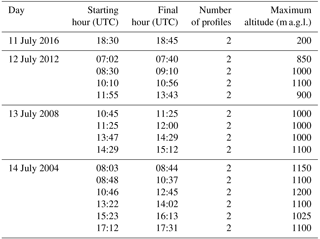
Furthermore, from 11 to 14 July 2016, 28 profiles of pollutant and meteorological parameters up to 1200 m above ground level (m a.g.l.) were obtained using tethered balloons and a fast winch system (Fig. S2, Table 2). The instrumentation attached to the balloons is summarised in Table 1. The profiles were performed at the Majadahonda rugby course (MJDH-RC Fig. 1). The balloons were equipped with a global positioning system (GPS) and a set of instruments (Fig. S3), including the following.
-
A miniaturised CPC (condensation particle counter built by Hanyang University, Hy-CPC) was used to measure the number concentration of particles larger than 3 nm (PN3) with a time resolution of 1 s and a flow rate of 0.125 L min−1 using butanol as a working fluid (Lee et al., 2014). Previous inter-comparison studies with conventional CPCs have yielded very good results (with r2 reaching 0.65–0.98 and slopes 0.87–1.23; Minguillón et al., 2015; reference and Hy-CPCs had different size detection limits.). In this work, we will use the terms UFP and PN3 as equivalents, but we measure concentrations between 3 and 1000 nm strictly, while UFP is < 100 nm. However, 80 % of the total particle concentration falls in the range of UFPs.
-
An O3 monitor (PO3M, 2B Technologies) was used to determine O3 concentrations. It was calibrated against an ultraviolet spectrometry reference analyser (RefO3) showing good agreement (n= 34; PO3MO3= 1.1058 × RefO3+ 4.41, R2= 0.93). Concentrations (on 10 s basis) are reported in standard conditions (20 ∘C and 101.3 kPa) and corrected for the reference method.
Table 1Details of the instrumentation used at the three supersites and the platform mounted on tethered balloons. BC, black carbon; UFPs, ultrafine particles; CPC, condensation particle counter; OPC optical particle counter; MAAP, multi-angle absorption photometer; PTR-ToF-MS, proton-transfer reaction time-of-flight mass spectrometer.
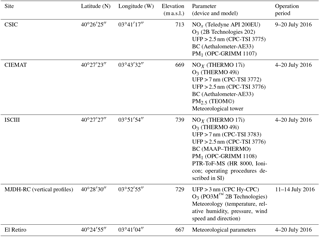
Table 2Vertical measurement profiles obtained during 11–14 July 2016 at Majadahonda (MJDH-RC).
In addition to the above instrumentation, we obtained the following additional meteorological and air quality data.
-
Meteorological data from the CIEMAT meteorological tower (four instrumented levels between the surface and 54 m a.g.l.) and from several AEMET (Spanish Met Office) standard meteorological stations spread out across the basin were collected: Madrid airport (40.46∘ N, 3.56∘ W; 609 m a.s.l.), Colmenar Viejo (40.69∘ N, 3.76∘ W; 994 m a.s.l.), and El Retiro (in Madrid, 40.40∘ N, 3.67∘ W; 667 m a.s.l.).
-
Hourly data for air pollutants (NO, NO2, SO2, O3, PM10, and PM2.5) were supplied by the air quality networks of the city of Madrid, the regional governments of Madrid, Castilla La Mancha, Castilla y León, and the European Monitoring and Evaluation Programme (EMEP) monitoring network, all of them collected by the National Air Quality Database of the Ministry of the Environment of Spain (MAPAMA).
-
High-resolution O3 sounding data were gathered by AEMET at midday each Wednesday at the Madrid airport.
-
High-resolution meteorological sounding data were obtained each day at 00:00 and 12:00 local time by AEMET, also at the Madrid airport. They were used to estimate the height of the planetary boundary layer (PBL) at 12:00 UTC by means of the simple parcel method (Pandolfi et al., 2014).
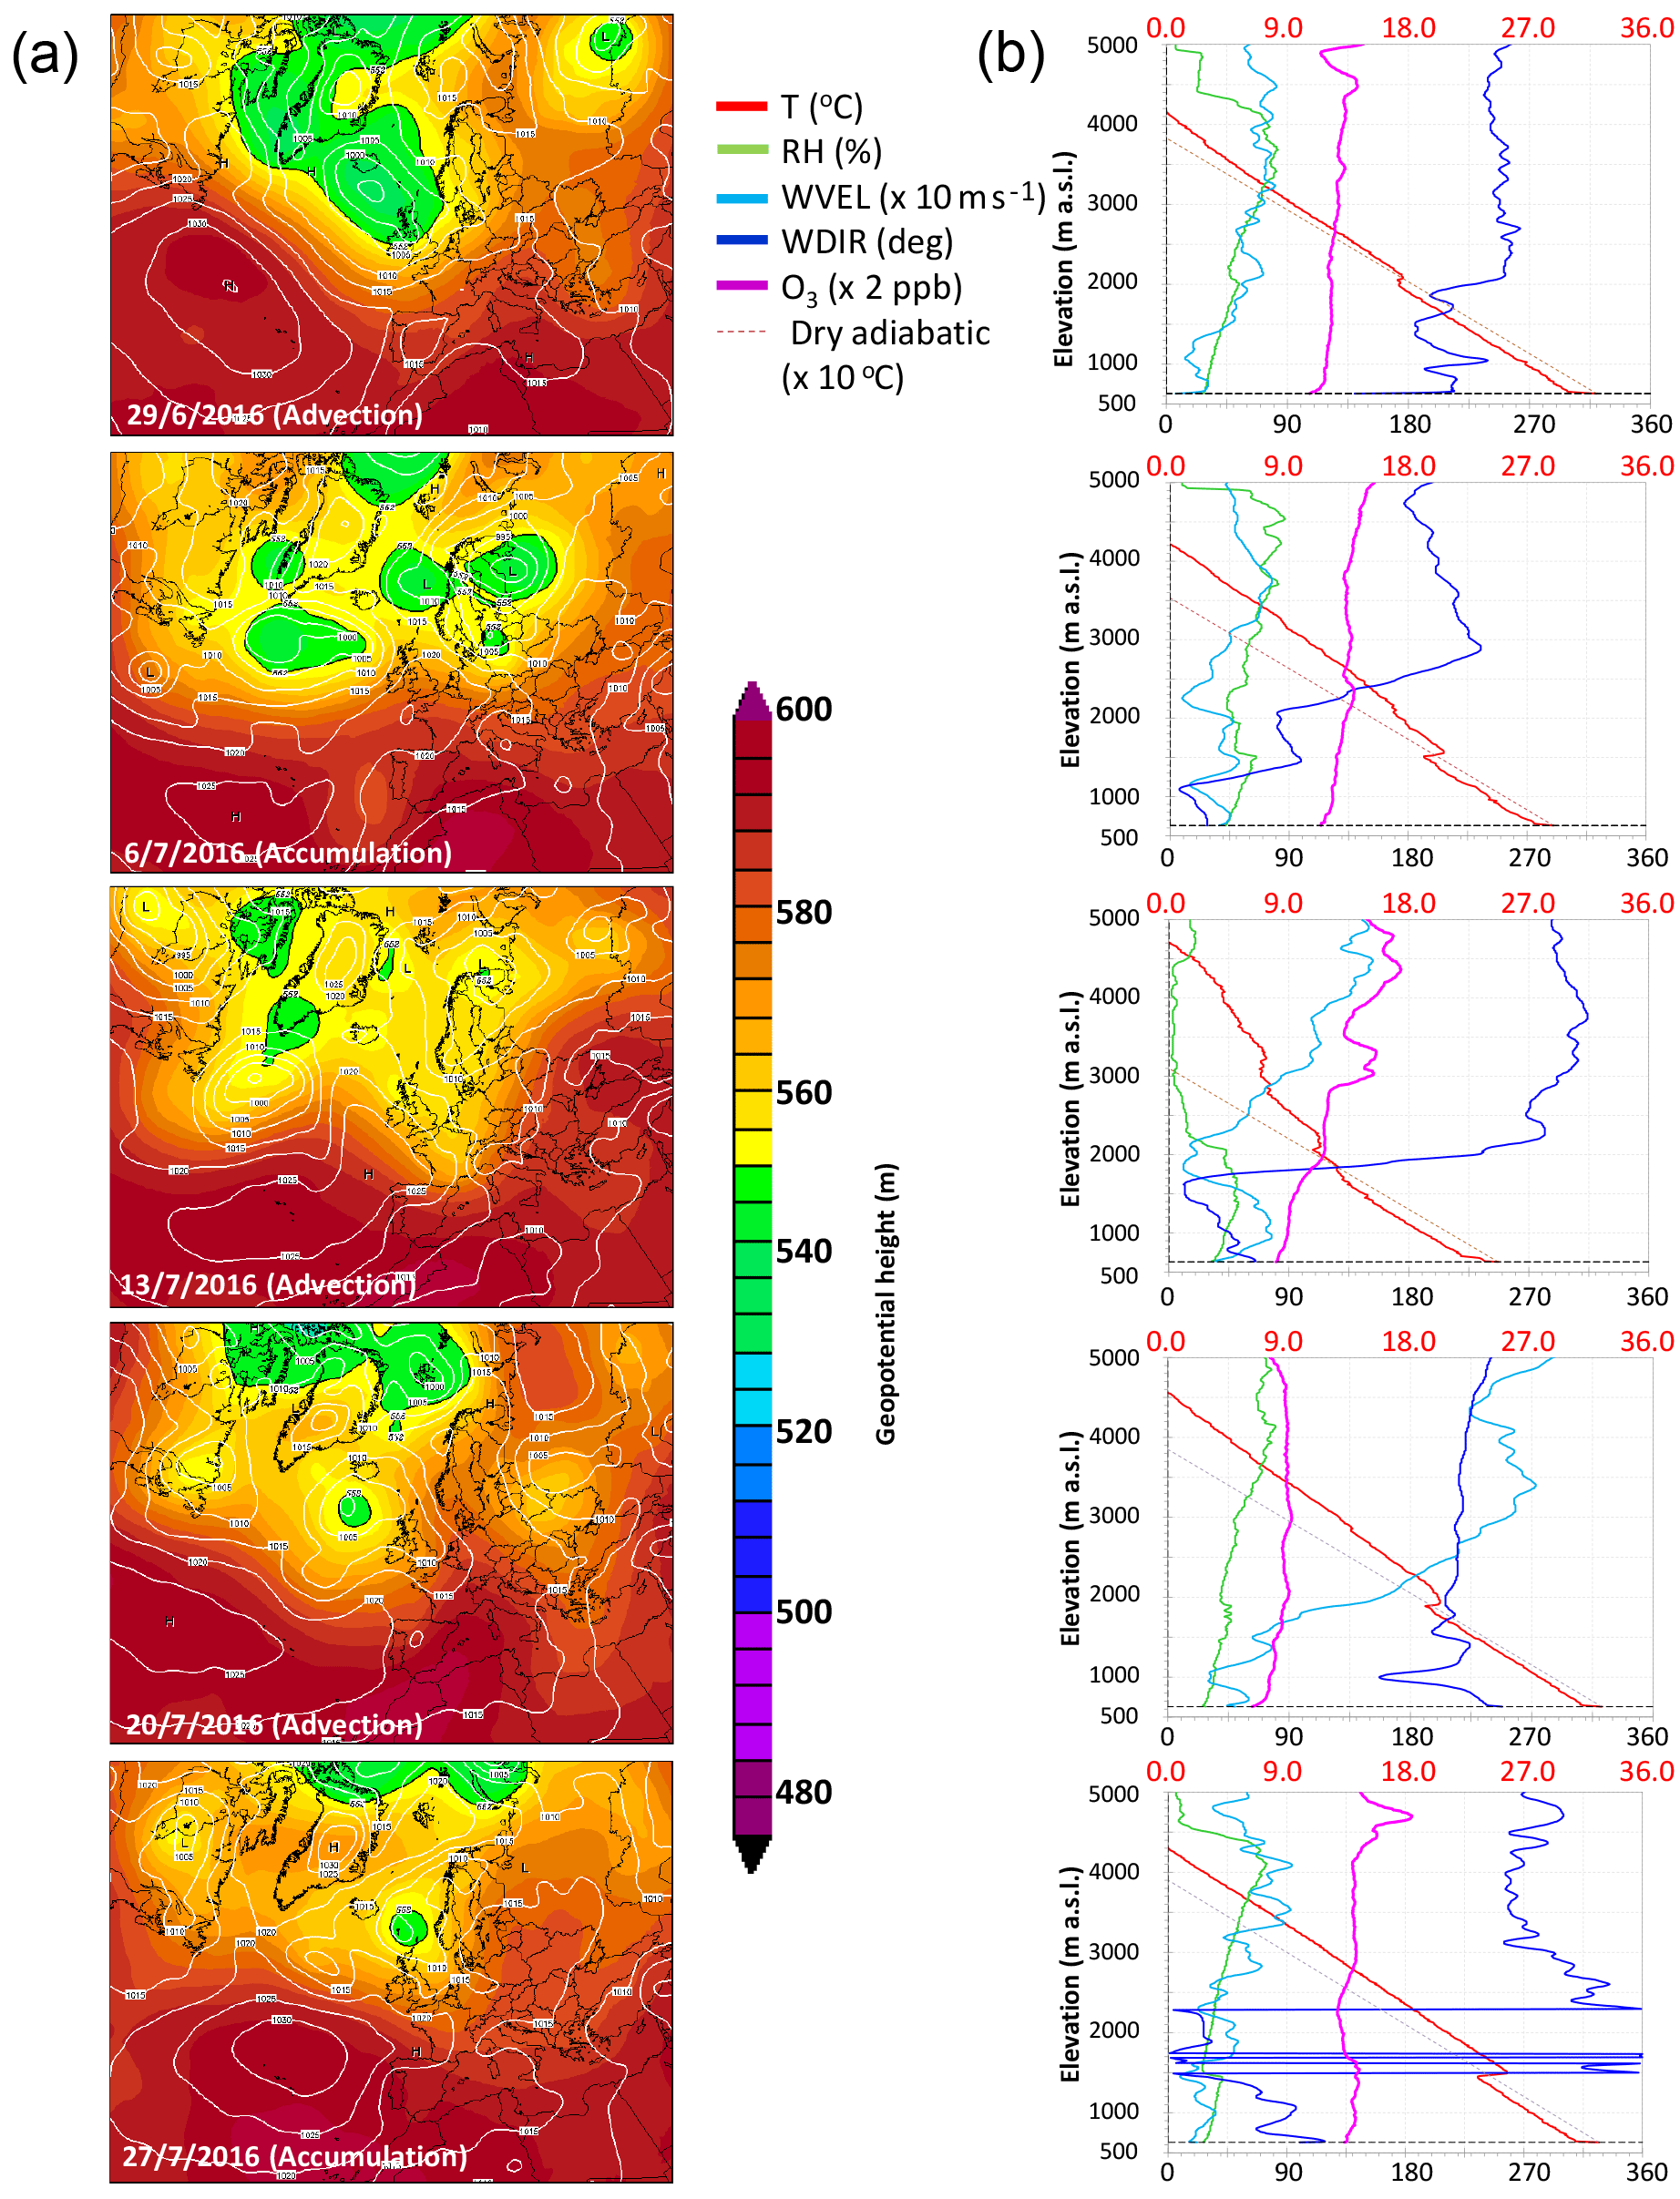
Figure 3(a) Climate Forecast System Reanalysis (CFSR) for the 500 hPa geopotential heights (gpdams) and mean sea level pressure (MSLP) contours (hPa) at 12:00 UTC (obtained from the Climate Forecast System reanalysis; Saha et al., 2014) in July 2016 (Wetterzentrale, http://www.wetterzentrale.de/; last access: 2 November 2017) shown simultaneously with (b) AEMET O3 free soundings at the Madrid airport.
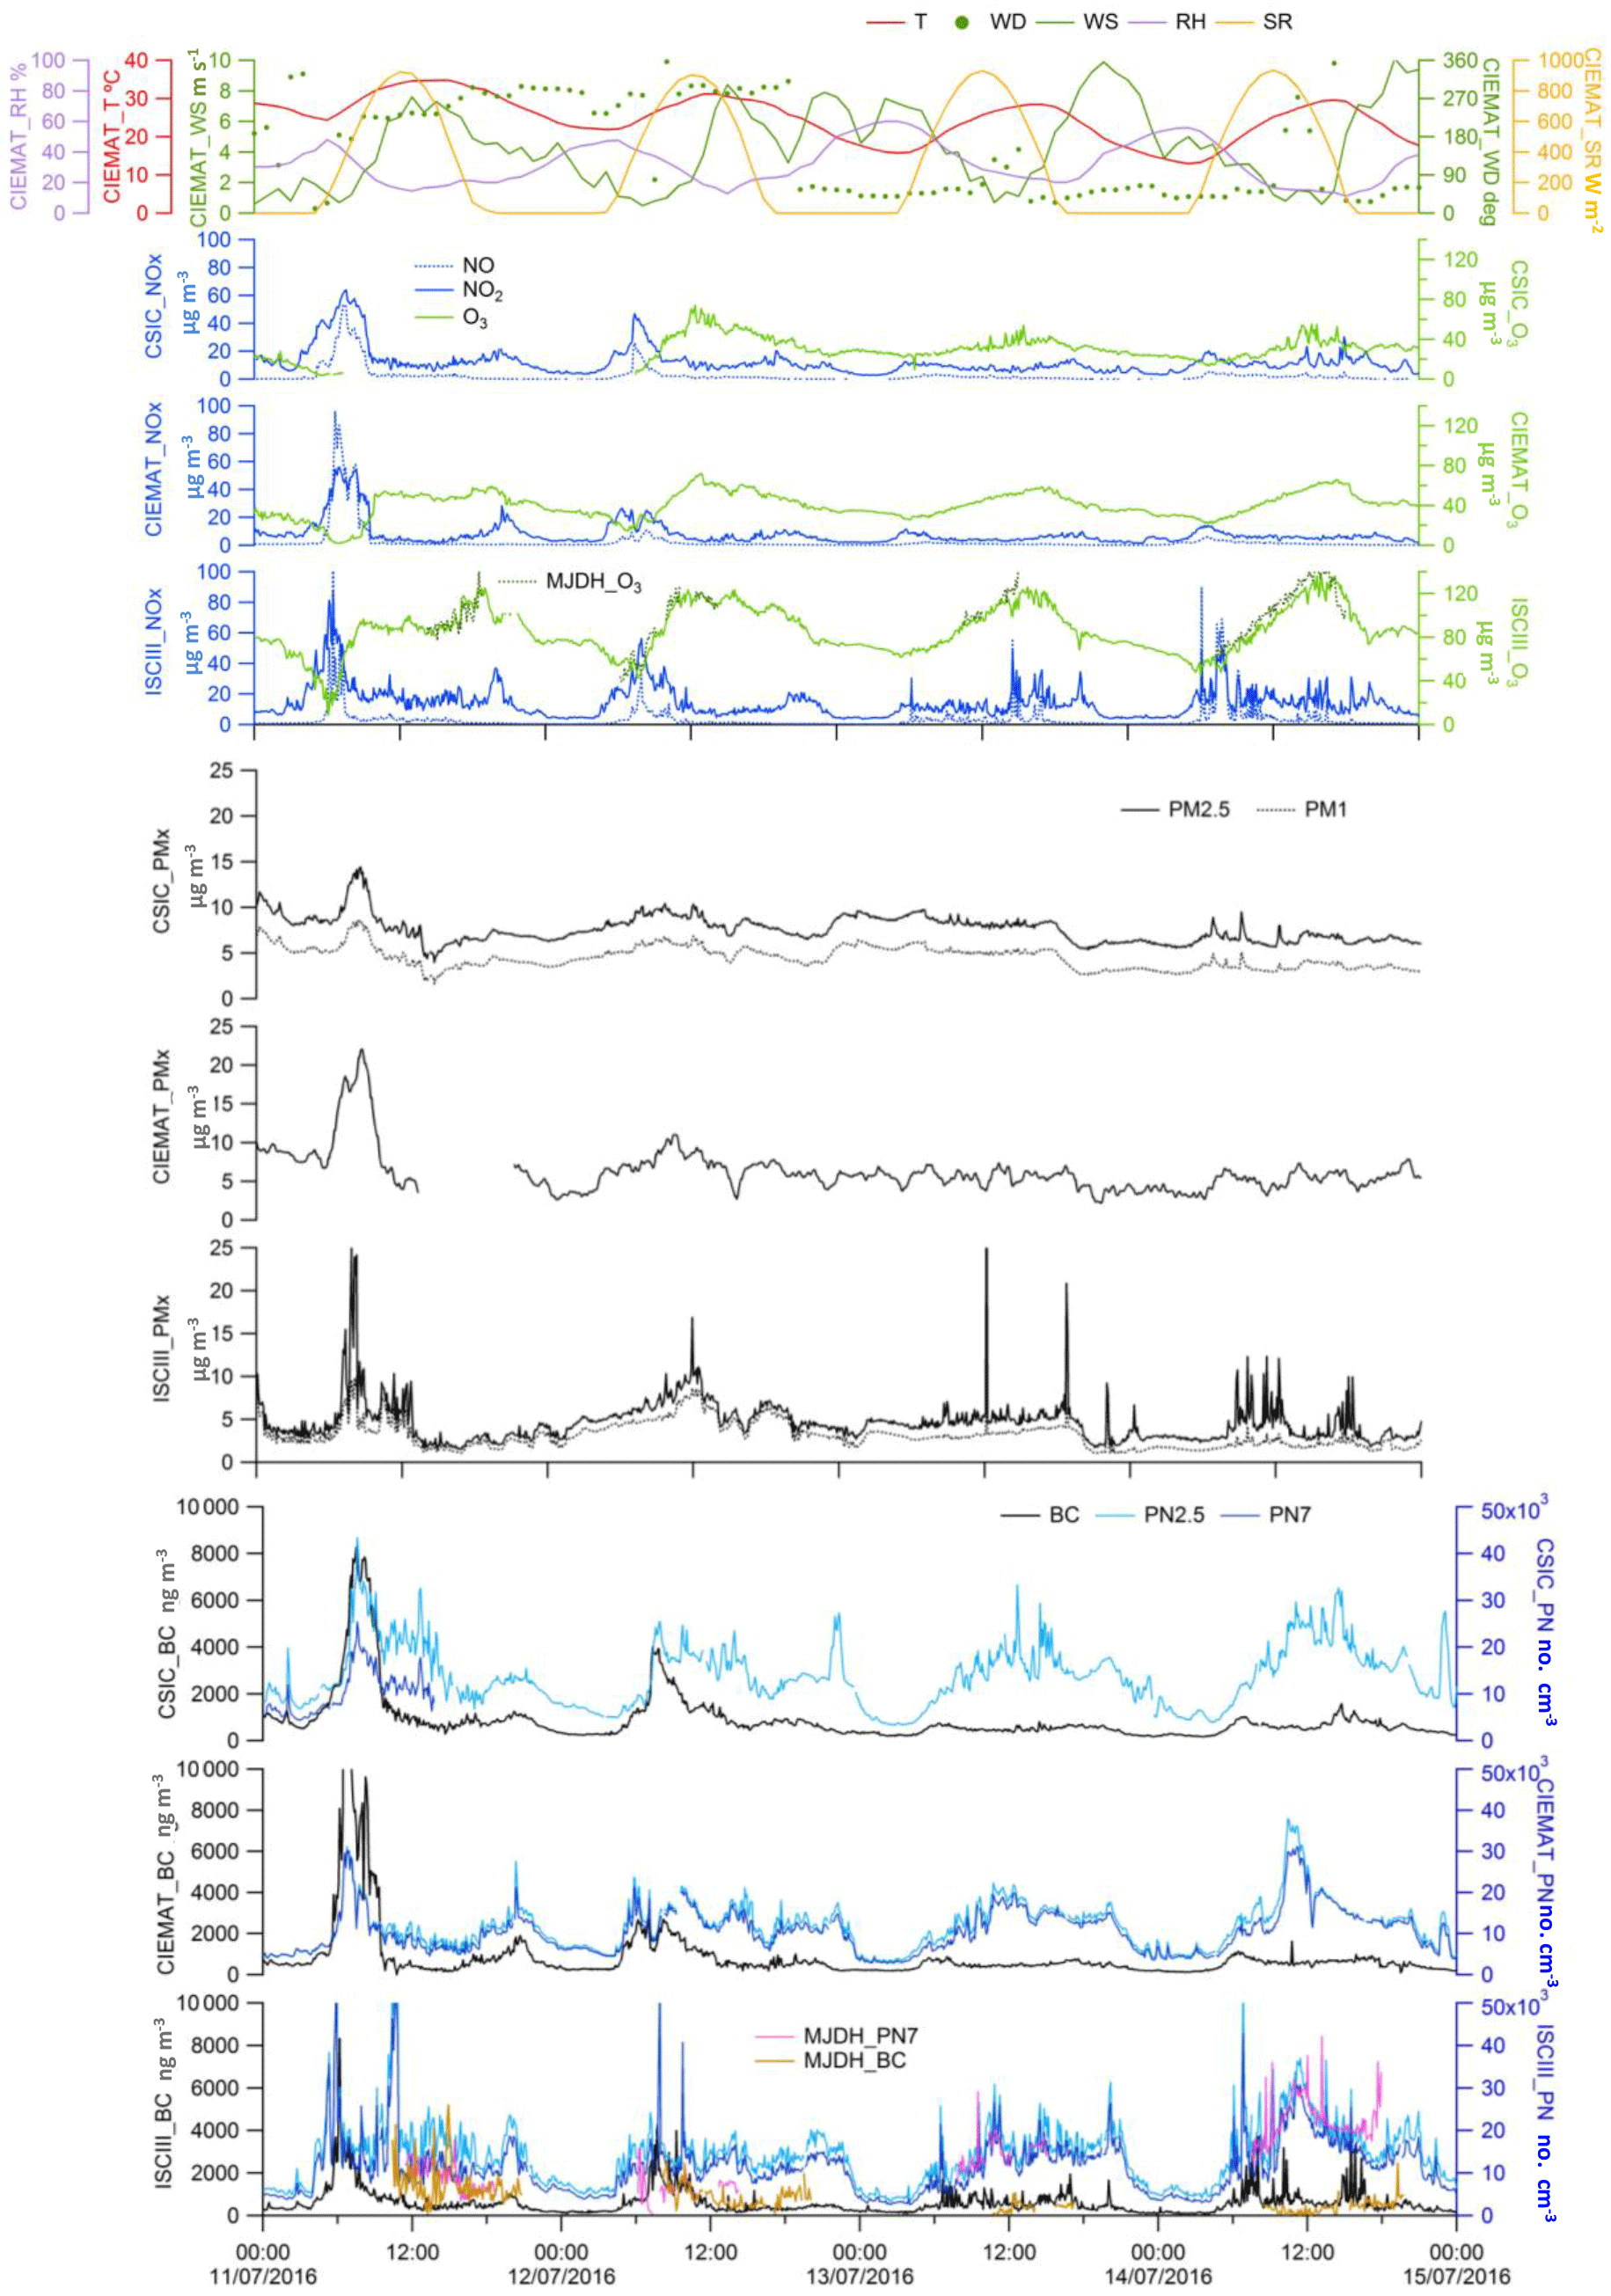
Figure 4Variation in meteorological parameters (temperature, relative humidity, solar radiation, and wind speed and direction) and levels of NO2, NO, O3, PM2.5, PM1, BC, and UFPs (with lower detection limits of 1, 3, and 7 nm for PN1, PN3, and PN7) measured at Madrid-CSIC, Madrid-CIEMAT, and ISCIII, as well as in MJDH-RC from 11 to 14 July 2016.
Hourly averaged wind components were calculated and used in polar plots with hourly PM1, PM2.5, NO2, O3, Ox (O3+NO2), BC, and UFP concentrations by means of the OpenAir R package (Carslaw and Ropkins, 2012).
3.1 Meteorological context
The AEMET O3 soundings are represented in Fig. 3, from which it is evident that the low and high O3 periods coincide with the 500 hPa gph passage of, respectively, upper-level troughs and ridges over the area associated with the cold or warm deep advection of air masses. Cold advections usually have an Atlantic origin.
The local meteorology during the field campaign was characterised by a progressive drop in temperature (T; −4 ∘C in the maximal daily T) and an increase in the early morning relative humidity (RH; +20 %), with insolation remaining constant (maxima of 900–950 W m−2; Fig. 4). During the nocturnal and early morning conditions of the first half of the field campaign (11–12 July 2016), relatively weak northerly winds prevailed at the main meteorological surface stations inside the basin, including CIEMAT in Fig. 4 and Retiro and Colmenar in Fig. S4. This is probably related to drainage (katabatic) conditions inside the MAB, with a progressive turn to a more synoptic westerly component in the central period of the day, consistent with a convective coupling with the more intense upper-level wind. This coupling is also accompanied by an important increase in the wind speed at midday, up to 8 m s−1 (venting stage), that renewed air masses in the whole basin.
During the second half of the campaign, intense and persistent north-easterly winds replaced the westerlies from the evening of 12 July 2016 on, after the evolution of the upper-level trough. In contrast to the previous period, during 13–14 July 2016, night-time and early morning conditions registered more intense NE winds (up to 10 m s−1) than at midday, after a decrease in intensity down to calm conditions (1 m s−1) during the morning of 12 July, facilitating both fumigation from upper levels and local O3 photochemical production. A weak wind veering to the south was also registered at the mentioned surface stations during the afternoon of 13 July, which lasted for only 3 h and which is more characteristic of an O3 enrichment episode, when the veering lasted longer (Plaza et al., 1997). A progressive decrease in the PBL height (−600 m difference) is observed in the AEMET daily radio soundings, in particular gradual decreases in the midday PBL height of 3400, 2200, 1900, and 1600 m a.s.l. from 11 to 14 July 2016 (Fig. S5) were observed. This decrease is also observed in the 12 and 14 July 2017 UFP profiles (Figs. 5 and 6 and S6–S8). As will be detailed later, these meteorological patterns allowed O3 and UFPs to smoothly and progressively accumulate in the basin (Fig. 4) during the campaign.
In the vertical dimension during both the high and low O3 periods analysed here, all the soundings show at midday two well-defined layers separated by a temperature inversion marking the limit of the growing convection inside the PBL (Fig. 3).
In high O3 periods (6 and 27 July 2016), we found lower PBL heights (approximately 1300–1500 m a.s.l.), with weak winds from the E or NE (less than 4–5 m s−1) or calm conditions. This is consistent with the scheme proposed by Plaza et al. (1997), who also describe a rapid evolution of the PBL height up to 2500–3000 m a.s.l. at 15:00 UTC during their field campaigns in the area under “summer anticyclonic conditions.” They also describe a morning radiative surface inversion at around 1000 m a.s.l., which was usually “destroyed 1 h after dawn,” containing NE winds associated with nocturnal drainage flows at lower levels (following the slope of the MAB). In this context, residual layers containing pollutants processed during the previous day(s) can develop above the stably stratified surface layer during night-time conditions. These pollutants can be transported towards the S by weak north-easterly winds or remain stagnant under calm conditions, which leads to fumigation and mixing with fresh pollutants emitted at the surface after the destabilisation of the surface layer, as evidenced in our profiles. These residual layers are topped by the subsidence anticyclonic inversion (1000–1500 m a.s.l.) according to Plaza et al. (1997).
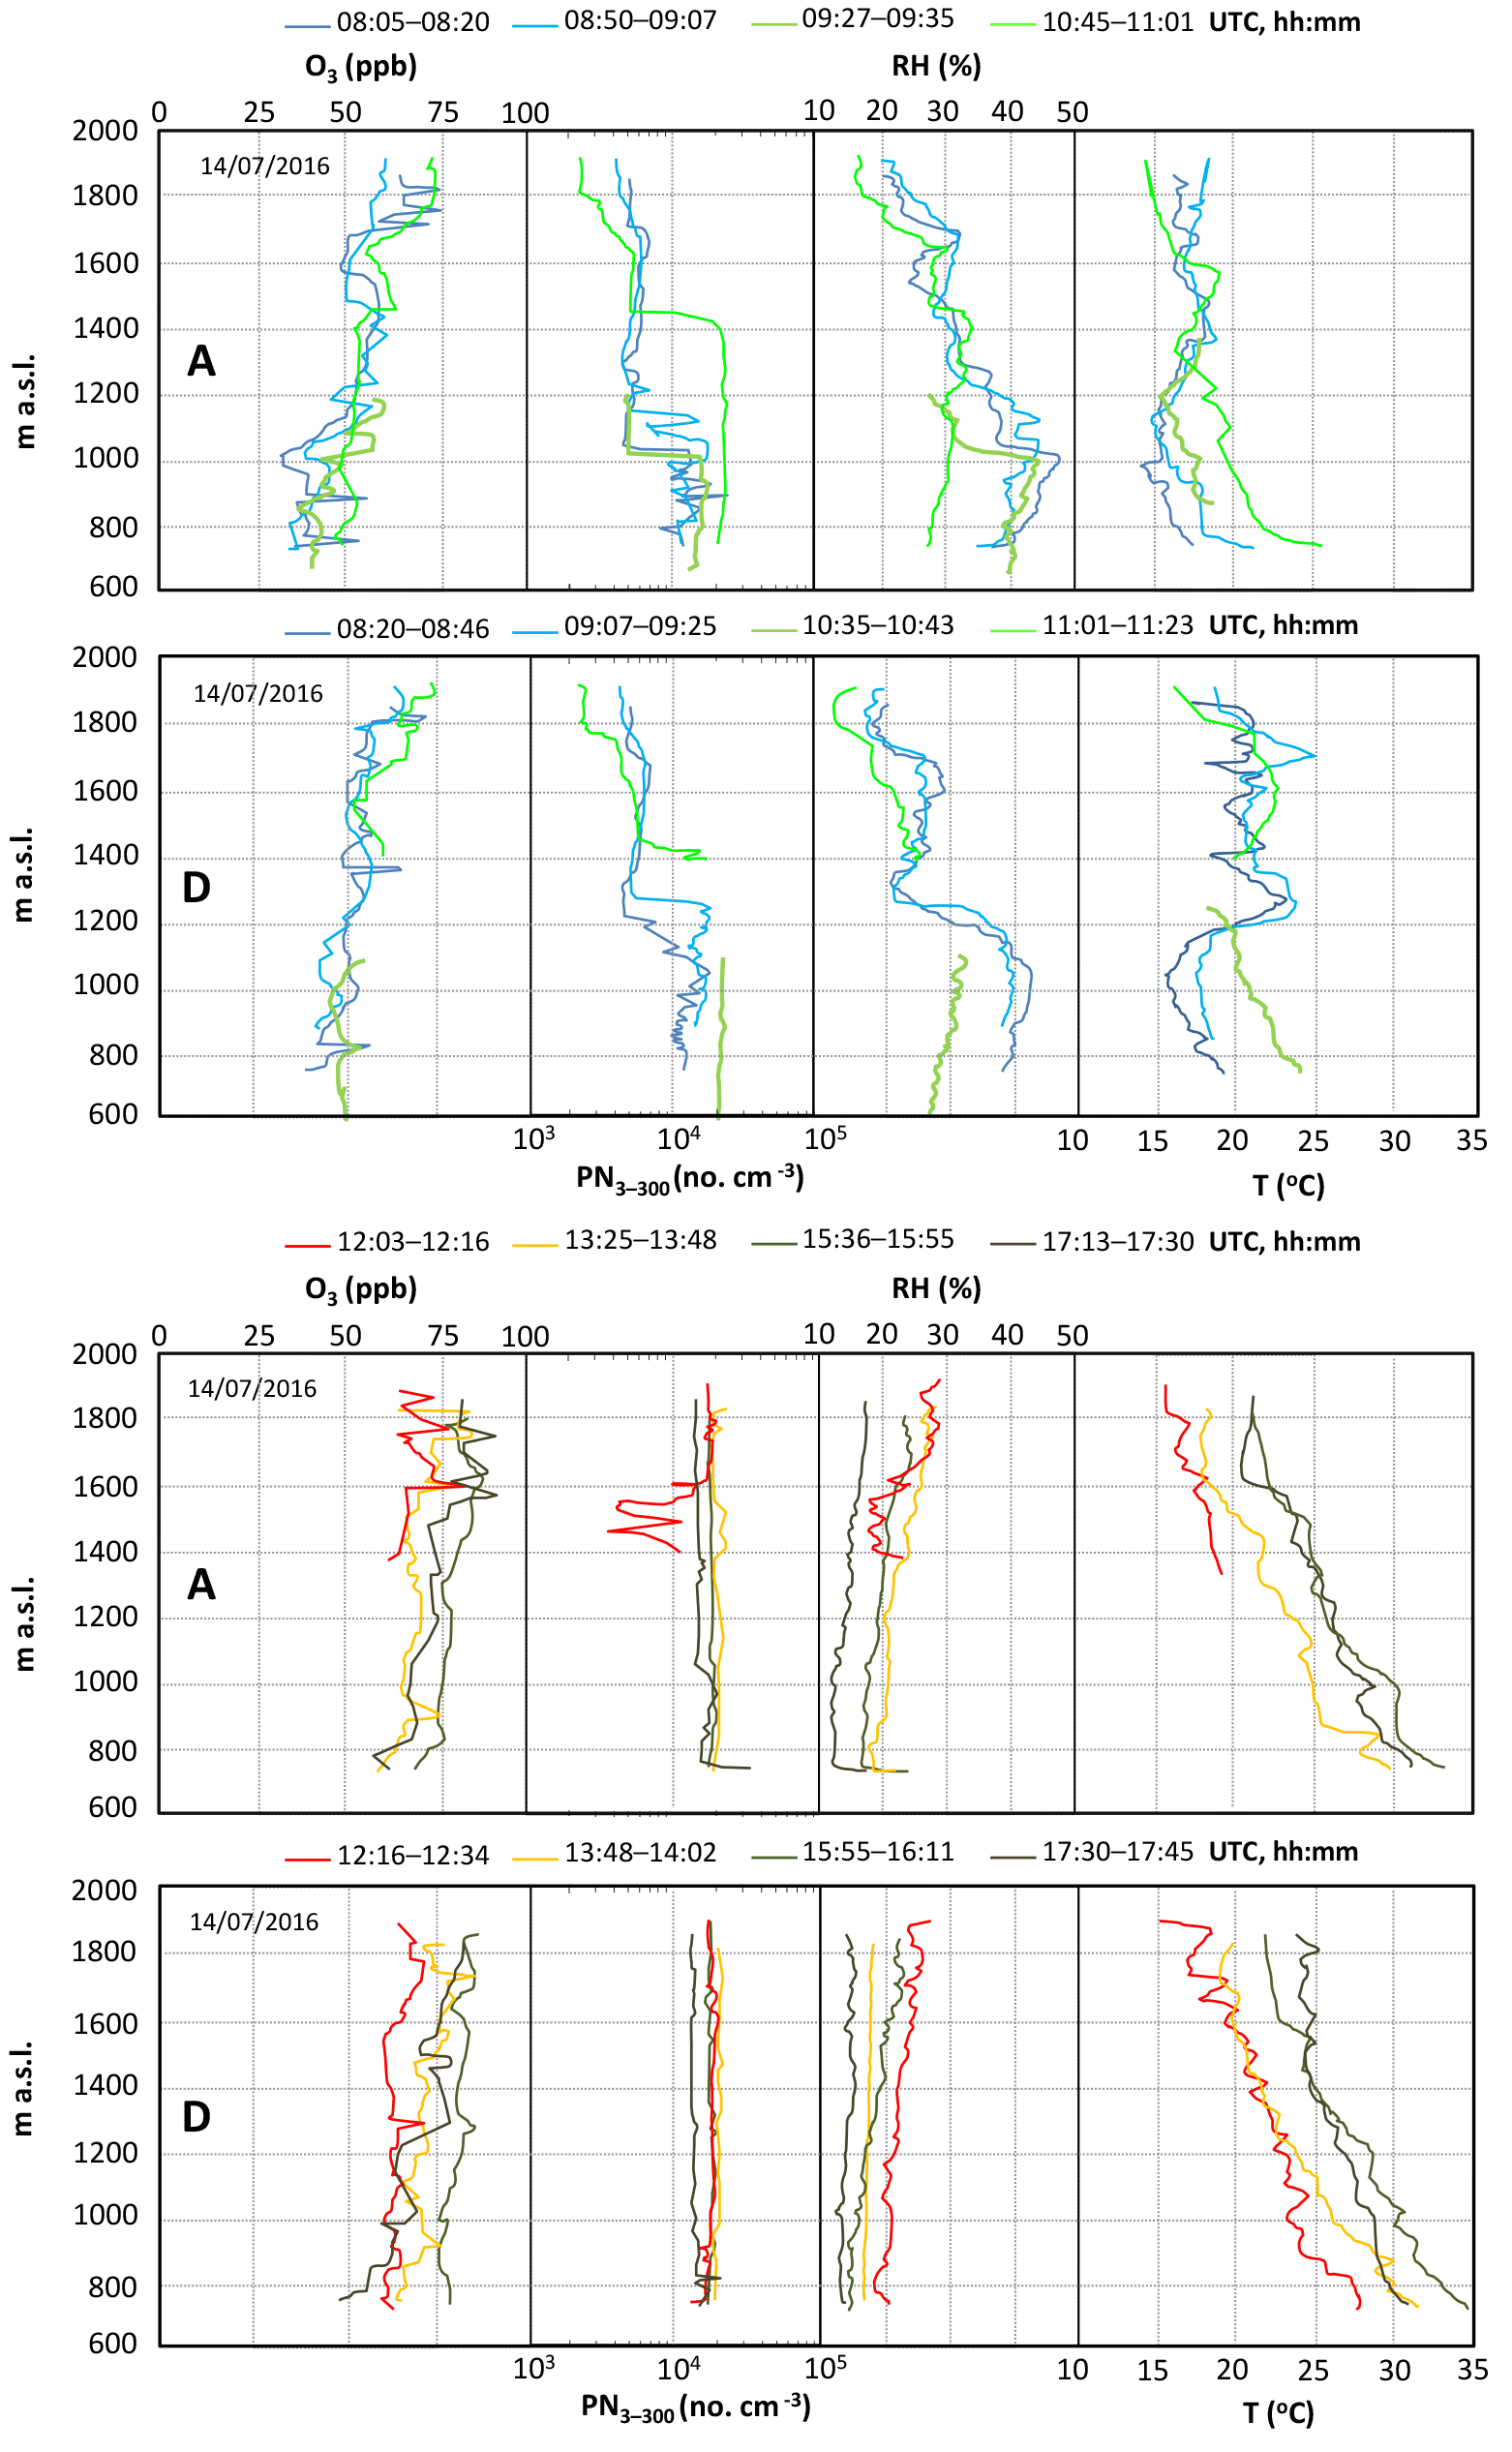
Figure 5Vertical profiles of levels of O3, UFP (PN3), temperature, and relative humidity obtained on 14 July 2016 (08:05 to 17:45 UTC). A: ascending; D: descending.
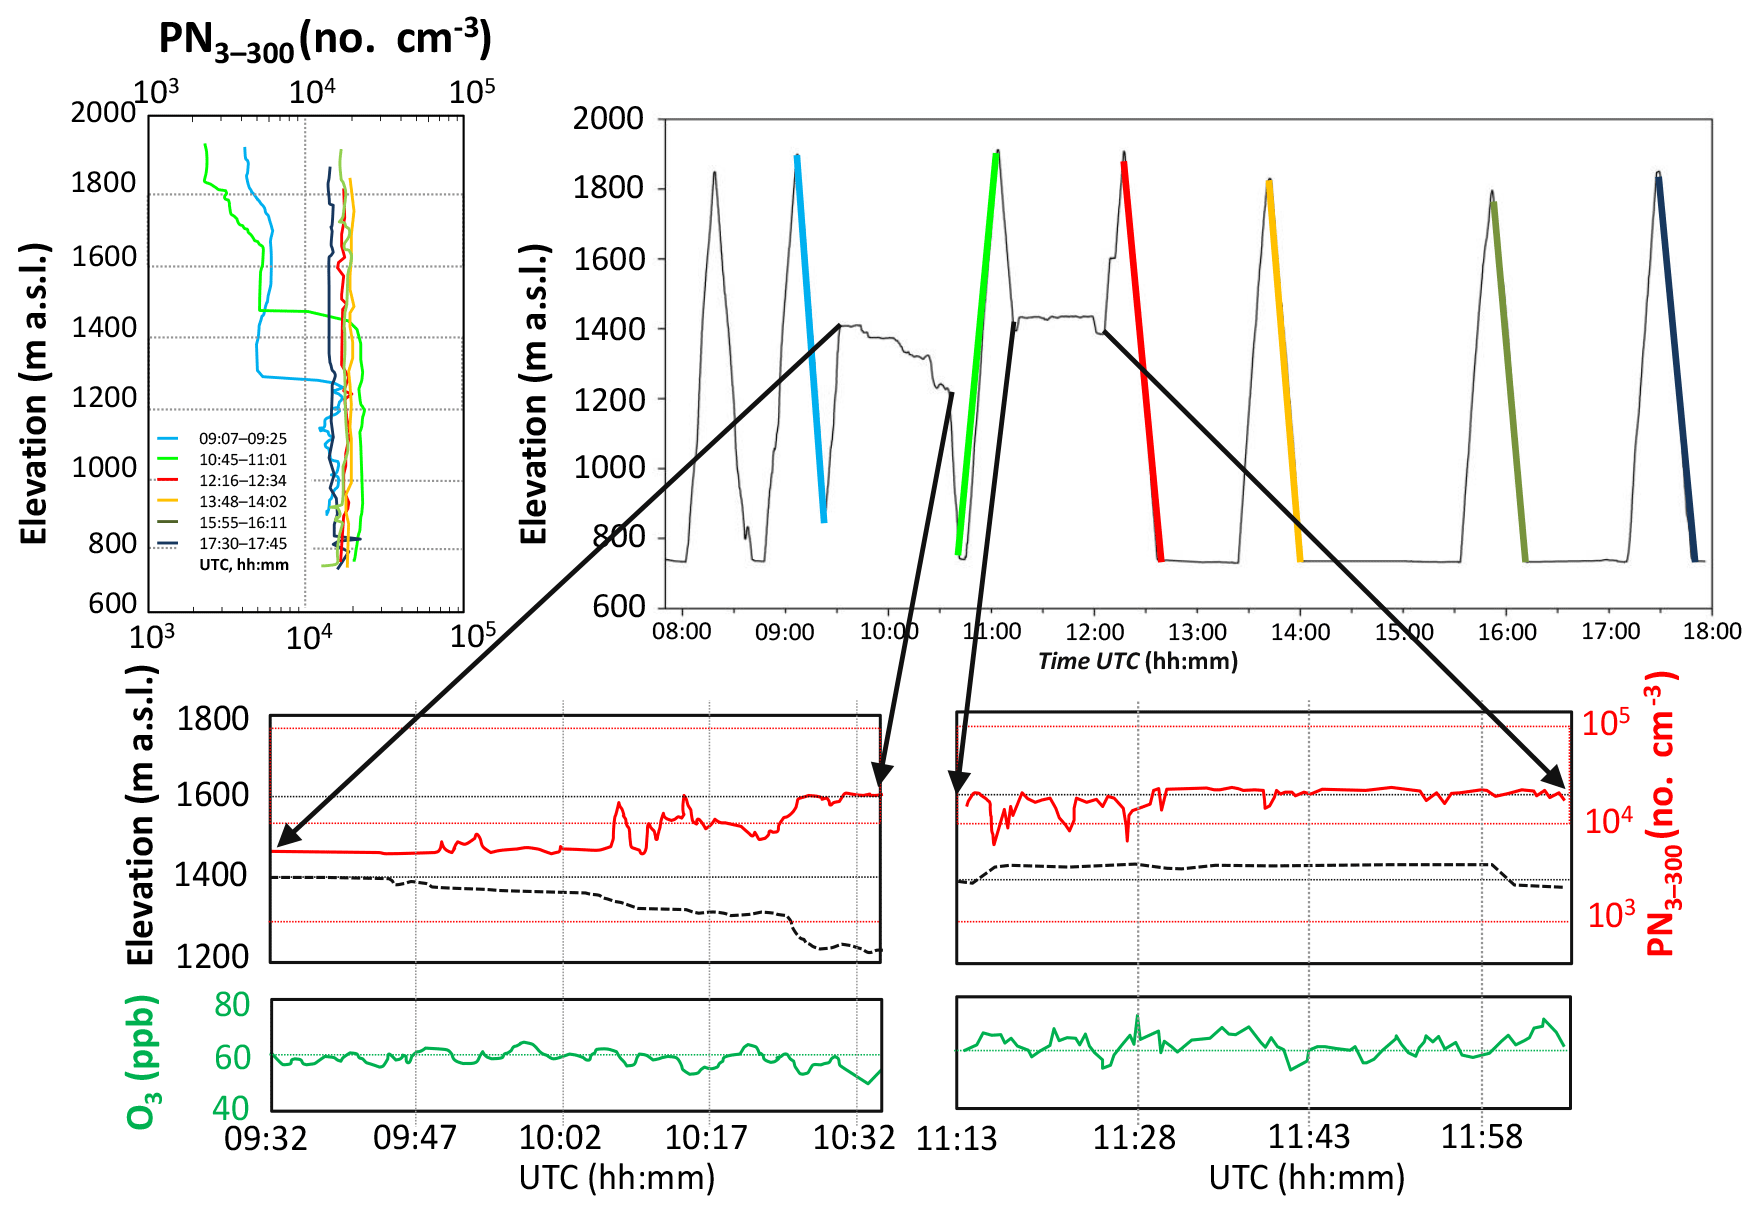
Figure 6UFP (PN3) concentrations for different vertical profiles obtained on 14 July 2016, as well as O3 and UFPs during two periods focusing on the evaluation of changes produced at a fixed height when reached by the growth of the PBL.
Conversely, the soundings corresponding to low O3 periods have in common more elevated PBL heights (2000-2500 m a.s.l.), with more intense winds (above 6–7 m s−1) that can blow from different sectors: from the NE on 13 July 2016 (with intense north-westerlies blowing in the free troposphere) or the S-SW as observed on 29 June 2016 and 20 July 2016. The O3 sounding on 13 July 2016, a unique day within the field campaign, presents the final stage of a low O3 period, with winds in the free troposphere having a clear NW component, while channelled north-easterly winds dominate below 2000 m a.s.l. The AEMET free sounding shows low O3 surface concentrations (< 45 ppb) and high levels (> 70 ppb) in the middle troposphere (3000–5000 m a.s.l.) associated with very low relative humidity and intense W to NW winds blowing at that height, which will be discussed in Sect. 4. The decrease in surface temperature observed in Fig. 2 during the field campaign is also consistent with the cold advection associated with the troughing in the 500 hPa heights (13 July 2016 in Fig. 3).
3.2 Surface O3, OX, and UFP during the field campaign
As previously stated, the field campaign was characterised by atmospheric venting conditions with the two last days marking a transitional period to a more stable anticyclonic episode of increasing O3. The lowering of the wind speed during diurnal periods and other meteorological features mentioned above favoured the gradual accumulation of pollutants, as indicated by the progressive increase in the O3 maxima at MJDH-ISCIII, where the O3 maximum was reached at 15:00 UTC on 13 July 2016 and at 17:00 UTC on 14 July 2016 (Fig. 4). The typical accumulation O3 cycle for the zone was found only on 13 and 14 July 2016, with a maximum at 14:00 UTC on 13 July 2016 and at 16:00 UTC on 14 July 2016. The two previous days presented a more irregular daily pattern, indicating unstable and atypical situations for July (perturbed conditions with the prevalence of synoptic winds). Furthermore, these meteorological conditions and the high insolation induced the concatenation of NPF episodes in the basin (with low BC and very high UFP levels at the central hours of the day), such as the one on 13 July 2016 (Fig. S9). Morning to midday UFP bursts were caused by nucleation and growth episodes (we will focus on the phenomenology and the vertical occurrence of these nucleation–growth events in the companion paper).
From 11 to 12 July 2016 the highest concentrations of O3 were recorded for W-SW and W winds, and peak UFP (PN3) concentrations were observed with W, SW, W-NW, and NE winds. However, on 13–14 July 2016, both O3 and UFP concentrations maximised during calm and NE winds (see polar plots from Fig. S10). PM2.5 levels were independent of the UFP and O3 variation, with concentrations increasing in calm situations in the first 2 days and with less pronounced variations as a function of the with direction, but somewhat higher concentrations with NE winds in the last 2 days (Fig. S10).
3.3 Vertical O3 and UFP profiles during the field campaign
As shown in Fig. S2 and Table 2, the vertical profiles for 14 July 2016 were the most complete of the campaign (wind speed was relatively low and this allowed for extended measurements throughout the day), and for that reason we begin with the description of this day.
Figure 5 shows that there is a rapid growth of the PBL between 08:05 and 11:01 UTC, as deduced from the vertical profile of UFP (PN3−300) concentrations. At the beginning of the measurements, the upper limit of the PBL was above 1030 m a.s.l., and in 2 h 40 min it lifted 400 m (around 2.5 m min−1). In this initial period, the vertical profile of O3 was characterised by a succession of strata of different concentrations, but a clear tendency to increase with height (around 20 ppb of difference between surface level and 1950 m a.s.l. was observed). The discontinuity of the PBL ceiling reflected in the UFP, T, and RH profiles did not seem to affect the O3 profile at all. In other words, we did not notice accumulation of O3 layers in the top of the PBL, but instead a general increasing trend towards the highest altitudes reached with the tethered balloons.
Through the course of the day, the profile of concentrations of UFPs and O3 became homogenous in the lowest 1200 m a.g.l. (this being the maximum height reached), and a growth of O3 concentrations at all altitudes was observed until 16:11 UTC. This homogenisation and growth of O3 concentrations in the PBL, caused by intense mixing by convection, resulted in an uneven increase through the day with an increase of 43 ppb at the surface and only 10 ppb at 1900 m a.s.l. (Figs. 5 and S6).
Figure 6 shows the results from measurements taken at a fixed height (1400–1200 m a.s.l.) to capture the effect of the growth of the PBL on O3 and UFP levels. We started at approximately 700 m a.g.l. at 09:32 UTC with 60 ppb of O3 and approximately 6000 no. cm−3. At 10:25 UTC, the top of the PBL reached the balloon, as deduced from the sharp increase in UFP concentrations (up to 20 000 no. cm−3). Meanwhile, O3 concentrations experienced only a slight decrease, suggesting that O3 fluxes are top-down and not bottom-up, as recorded for UFPs. From 16:11 UTC onwards, a reduction of O3 levels at lower heights was observed (−50 ppb at surface levels from 15:55 to 17:45 UTC, while at 1900 m a.s.l. levels remained stable; Figs 5 and S6).
The soundings from 11 to 13 July 2016 again showed a vertical trend characterised by (i) higher O3 concentrations at the highest sounding altitude in the early morning, (ii) an increase in O3 concentrations as the morning progressed (more pronounced at low altitudes), and (iii) homogenous O3 concentration along the entire vertical profile, except in the surface layers where the deposition and titration markedly decreased O3 levels reached at midday. Detailed descriptions of these soundings (Figs. S7 and S8) can be found in the Supplement.
Plaza et al. (1997) show, for the summer period in the study area, that the development of strong thermal convective activity and the influence of the mountain ranges produce characteristic mesoscale recirculations. On the other hand Crespí et al. (1995) report, also for summer and the study area, the development of a very deep mixing layer. These authors report that the recirculations contribute markedly to the high O3 episodes recorded in the region. The arrangement of the Guadarrama range favours the early heating of its S slopes, which causes a clockwise turning of wind direction, with a NE component during the night, E and S during the early morning and midday, respectively, and SW during the late afternoon, thus defining the north-western sector downwind of the city as the prone area for O3 transport. Night-time downslope winds inside the basin induce the observed north-easterlies at lower levels. Influenced by these contributions, the barrier effect of the Guadarrama range against the N and NW (Atlantic) winds, as well as the repeated clockwise circulation described above, cause the sloshing of the urban plume of Madrid across the basin. Regarding the vertical scale, Plaza et al. (1997) also show that fumigation from high O3-rich layers (injected by upslope winds the previous day(s) or transported from other areas outside the MAB) could also contribute to the enhancement of the surface O3 concentrations across the basin. This is attributed to the upward gradient in concentrations in the lower 1 km of the atmosphere measured in the early morning and the subsequent mixing across the PBL at midday. On the other hand, Gómez-Moreno et al. (2011) and Brines et al. (2015) report both intensive summer and winter NPF episodes in the western border of Madrid, often simultaneously with the highest O3 episodes.
Considering the free sounding O3 profiles in Fig. 3, high O3 concentrations (> 70 ppb) can be observed above the PBL between 3000 and 5000 m a.s.l., which may be related to the larger-scale transport of pollutants previously uplifted to the mid-troposphere or originated after a stratospheric intrusion and a subsequent deep subsidence into the middle troposphere, as is probably the case based on the ECMWF ERA-Interim reanalysis data. The transport of high O3 air masses in the middle troposphere, as for 13 July 2016 in Fig. 3, was also documented by Plaza et al. (1997) over this area in July 1994 during the final phase of a high O3 period. More recently, Kalabokas et al. (2013, 2015, 2017), Zanis et al. (2014), and Akritidis et al. (2016), among others, have shown that similar transport processes of enriched O3 layers at high altitude can contribute to increased surface O3 concentrations during the summer in the Eastern Mediterranean. This transport has been associated with large-scale subsidence within strong northerly winds in the Eastern Mediterranean (Etesian winds), and the affected layers are drier than average and show negative temperature anomalies. Figure S11 shows the ECMWF ERA-Interim reanalysis together with the AEMET O3 free soundings at the Madrid airport for 13 July 2016. The ridging at the lower troposphere over the Bay of Biscay at the rear of an upper-level trough (left panels) is accompanied by intense NW winds blowing in the middle and upper troposphere and NE winds at ground level and up to 2000 m (see the radiosonde profile in the same figure). The stratospheric O3 intrusion is associated with the upper-level trough (Sections A-A and B-B in the figure) and a large area of deep subsidence and extremely low relative humidity observed within the NW flows over Madrid and to the north of the Iberian Peninsula and the Bay of Biscay. The high O3 concentrations and low relative humidity of the ERA-Interim profiles over the airport in Madrid (green and red dotted lines in panel g of Fig. S11) are in agreement with the radiosonde observations in the same panel.
The question now is how much of this O3 could fumigate at ground level. According to the radiosonde data, the mixing height top was about 2000 m a.s.l. at midday, but could increase to about 3100 m a.s.l. after the projection of the surface temperature increase observed during the afternoon at nearby stations. This height reaches the lower part of the O3-enriched layer originated in the tropopause folding. Thus, a certain impact seems likely. However, the O3 concentrations were relatively low at all surface stations during that day, as it corresponds to a vented, low O3 period.
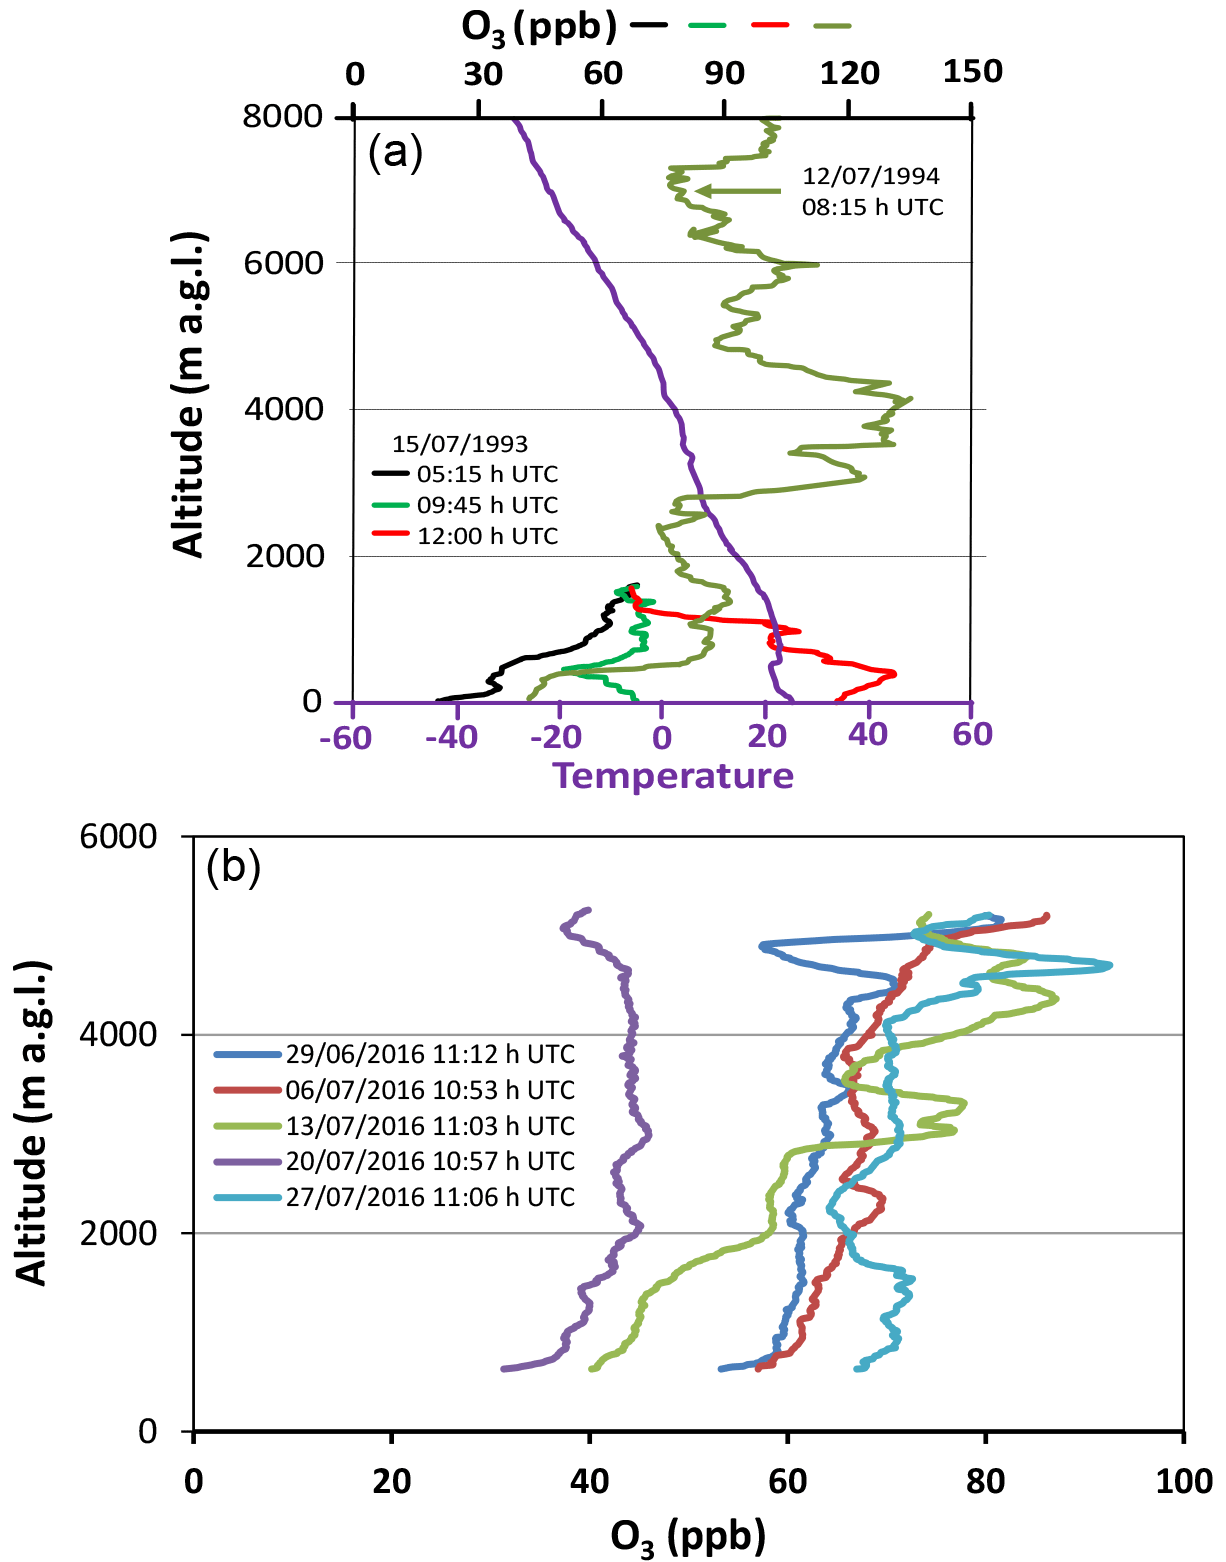
Figure 7(a) Vertical profiles of O3 levels and temperature obtained on 12 July 1994 (with free sounding) and 15 July 1993 (with tethered balloons). Data obtained from Plaza et al. (1997). (b) Vertical profiles of O3 levels of the free soundings by AEMET at the Madrid airport (26.6 km east of MJDH-RC) in June–July 2016.
Thus, according to the O3 soundings and radio soundings analysed above, previous evidence described by Plaza et al. (1997), and the surface air quality measurements presented here, surface O3 formation from precursor emissions within the MMA seems to develop in the core of regional processes and is modulated by large-scale meteorological conditions, distinguishing two types of episodes.
-
Accumulation. This occurs in stable, stagnant conditions and the regional accumulation of pollutants (in the sense of Millan et al., 1997, 2000; Gangoiti et al., 2001; Millán, 2014), with high O3 reserve strata accumulated during the previous day(s) in residual layer(s), high O3 background in the free troposphere due to hemispheric transport and/or stratospheric intrusions, and associated with fumigation around midday of the following day. The O3 concentrations are high along the whole atmospheric column, but enriched in the lower section by the additional local formation of O3 within the PBL and transport–recirculation of the urban plume of Madrid around the area. This transport–recirculation is characterised by a net transport to the NW-N during daytime after vertical mixing and to the S and SW during night-time inside the residual layer and decoupled from a more stable nocturnal surface layer. Typically, pollutants accumulate during periods of 2–6 days, resulting in well-marked peak and valley concentration periods that affect background, peri-urban, and in-city stations. This is the case for the O3 soundings from 29 June 2016 (not shown) and, particularly, 27 July 2016 (Fig. 7) or the measurements with captive and free balloons by Plaza et al. (1997) in 1993 and 1994, with very high concentrations of O3 in the lower atmospheric layers, usually forming a bump in the vertical profile of O3 below a height of 2000 m a.s.l., easily reachable after daytime convection (Fig. 7). As illustrated for 6 July 2016, OFP (Table S1 and Fig. S1) may be largely dominated by the carbonyls (mostly formaldehyde and acetaldehyde), followed by aromatic compounds (benzene, toluene, and C8, C9, and C10 aromatics) when considering the VOC pool during the morning traffic peaks. The influence of aromatic VOCs on OFP rapidly decreases, while the influence of biogenic VOCs (mostly isoprene followed by monoterpenes as primary species and methacrolein, methyl-vinyl-ketone, isoprene-derived isomers of unsaturated hydroxy hydroperoxides (ISOPOOH), and methylglyoxal as the main secondary species) increases through the day, resulting in a similar potential influence of biogenic and aromatic VOCs on O3 formation during accumulation periods, but with an OFP still dominated by carbonyls.
-
Venting. This occurs in advective atmospheric conditions (in the sense of Millan et al., 1997, 2000; Gangoiti et al., 2001; Millán, 2014), with O3 soundings characterised by (probably external) contributions from high-altitude O3 strata and background and their fumigation on the surface (episodes 11–14 July 2016). There is no accumulation of pollutants above the stable nocturnal boundary layer because more intense and steady winds swept out the local production during the preceding day. OFP contributions of carbonyls (dominating OFP) and aromatic and biogenic VOCs did not significantly vary for 13 and 14 July 2016 from what is described above for 6 July 2016.
As detailed in Sect. 3.1 and 3.2, with the weakening of general atmospheric circulation by the end of the campaign period, O3 and UFPs smoothly and progressively accumulated in the basin (Fig. 5). An observed decrease in the PBL depth (up to −1800 m at midday according to the AEMET radio soundings during the campaign; see Fig. S5) probably also contributed to the progressive increase in pollutant concentrations through the campaign.
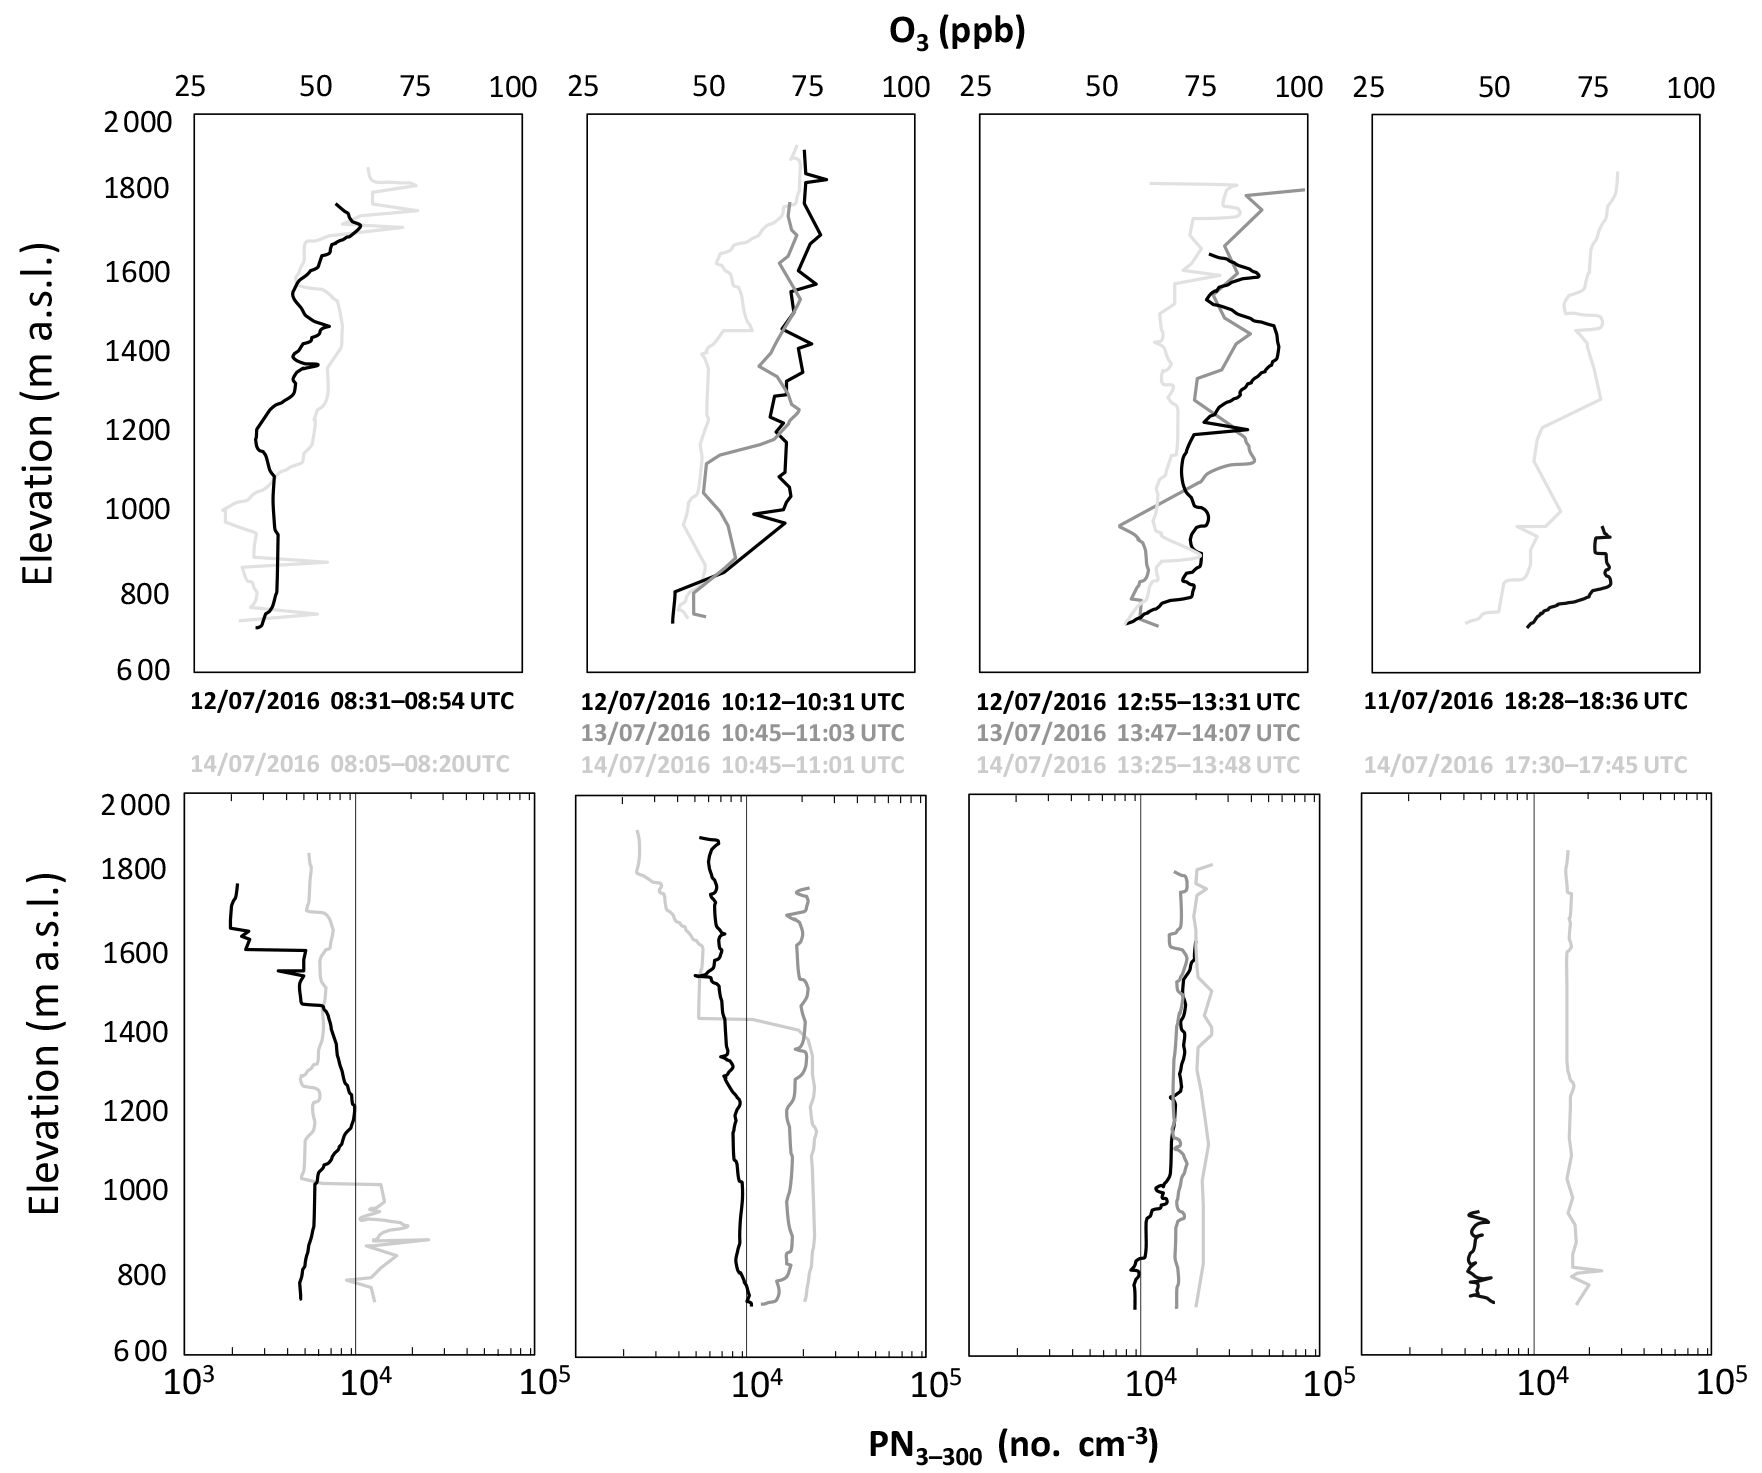
Figure 8Profiles of O3 and UFPs (PN3) from 11–14 July 2016 grouped by hourly stretches from morning to afternoon.
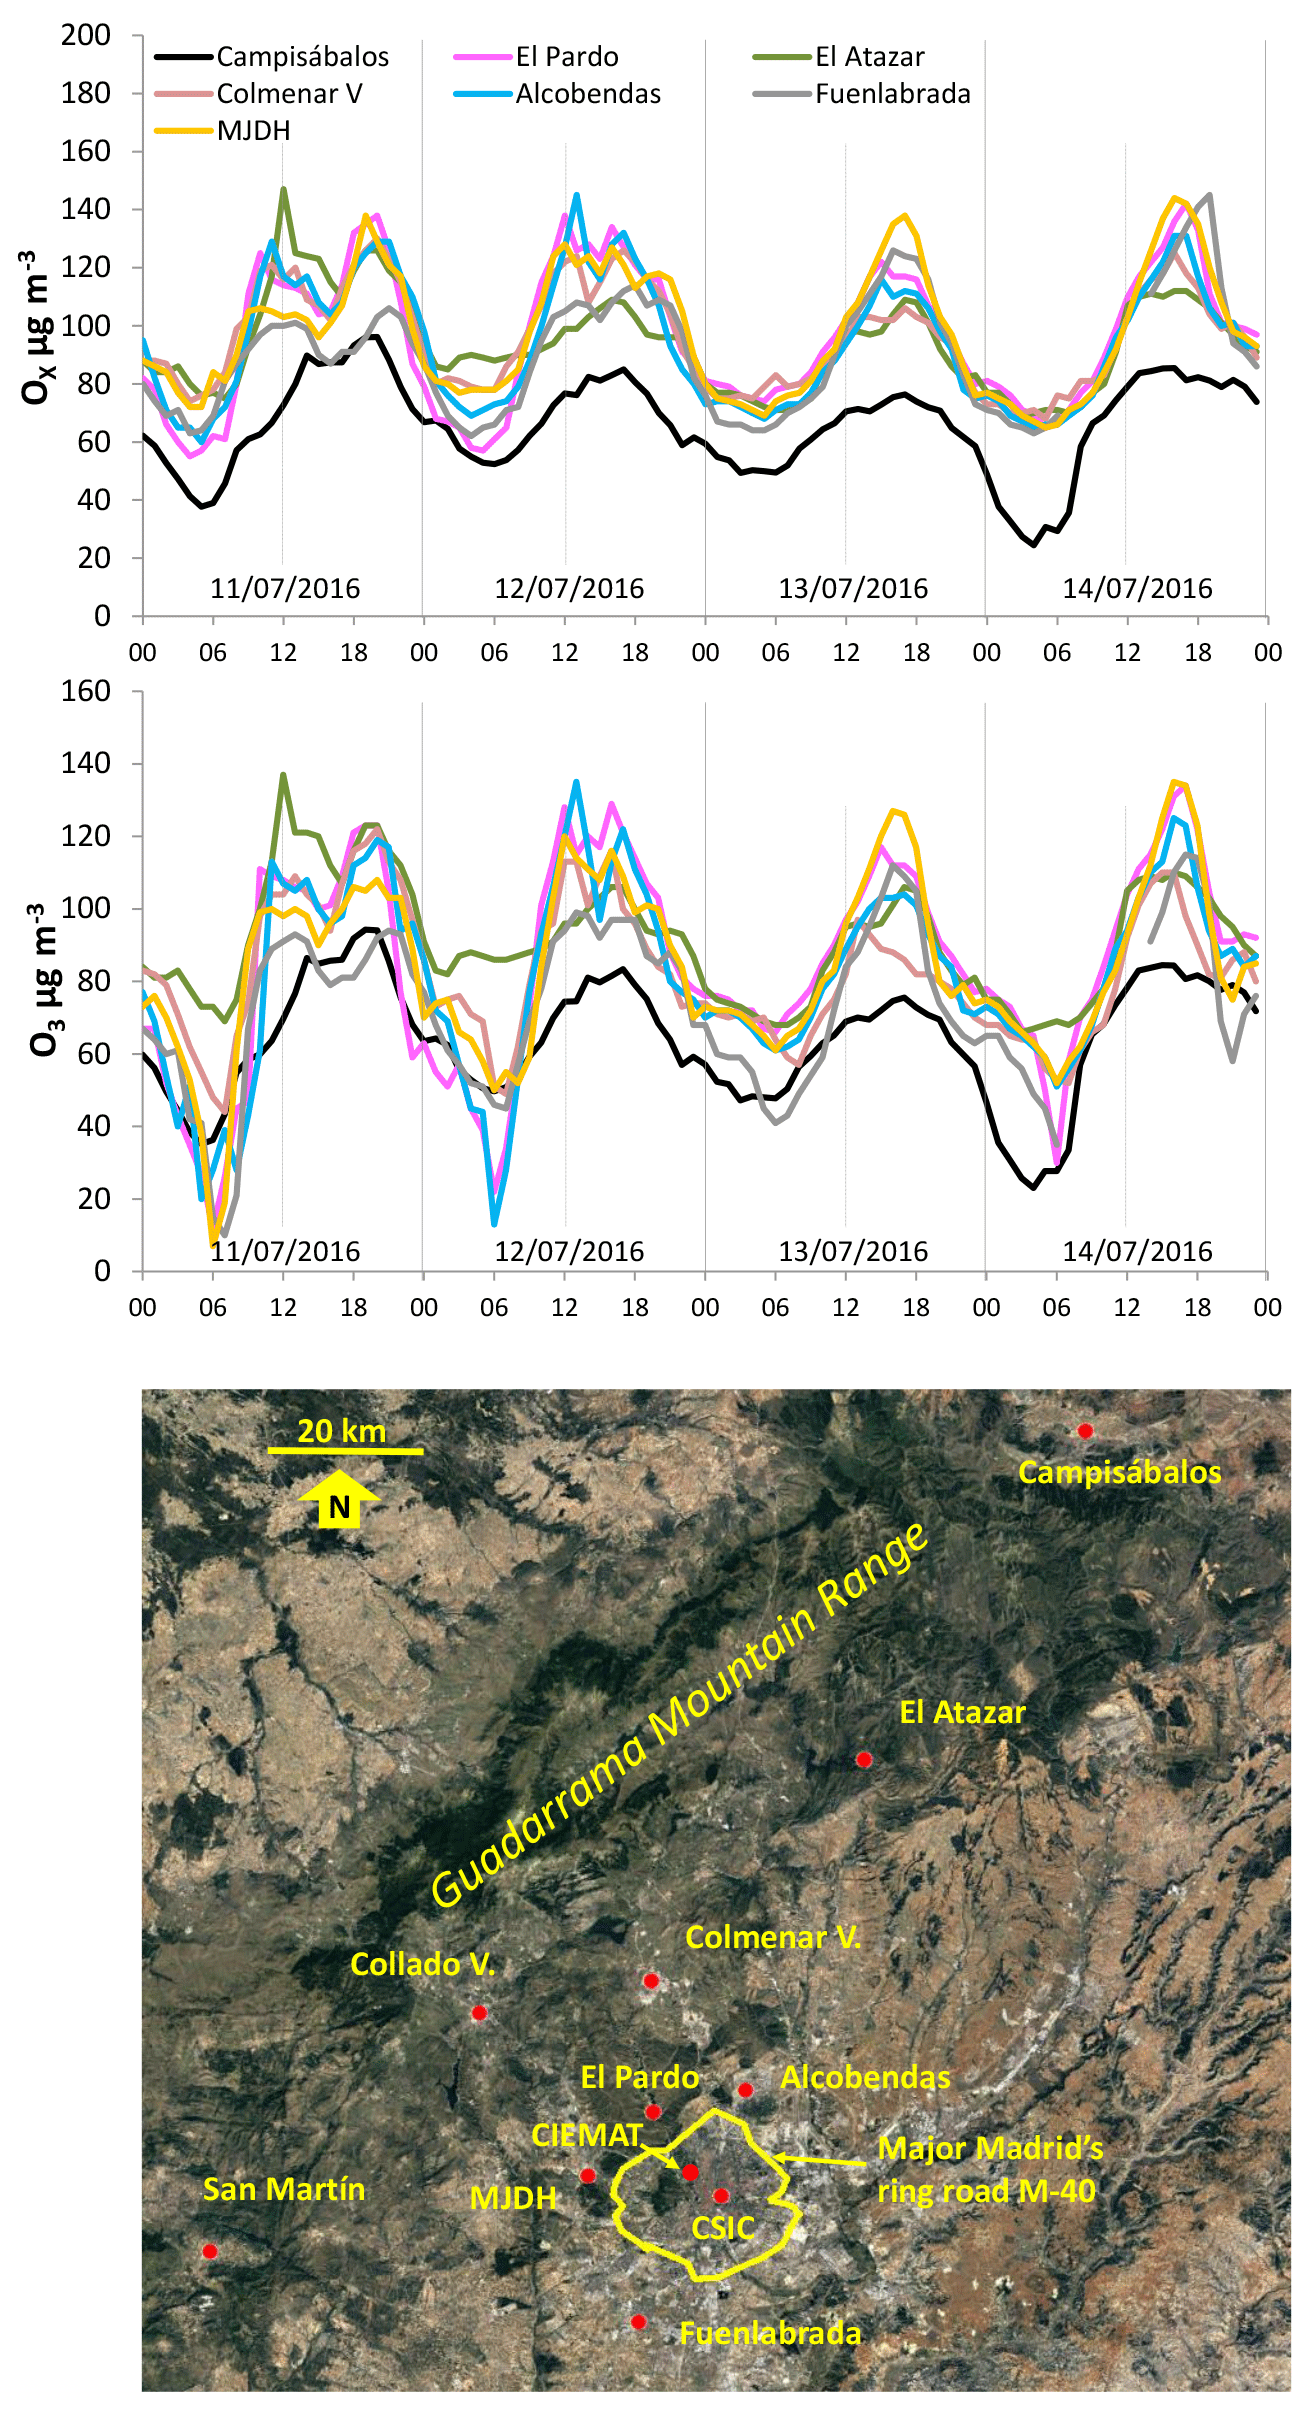
Figure 9Time evolution of hourly OX (O3+ NO2) and O3 concentrations from 11 to 14 July 2016 at selected air quality monitoring sites in the Madrid basin and an external reference site (Campisábalos), as well as the locations of these monitoring sites.
With respect to the vertical variability, the general pattern for UFPs (N3) clearly showed a rapid and marked growth of the PBL in the first hours of daylight (Fig. 8). In these early stages of the day, O3 profiles were characterised by a succession of strata of different concentrations, but a clear increasing trend towards the higher levels (Fig. 8). The discontinuity of the PBL ceiling, reflected in the UFP, temperature, and humidity profiles, was not identified as such in the O3 profiles (Figs. 5, 6, and S6 to S8). As the day progresses, the UFP and O3 concentration profiles are homogenised and a progressive diurnal growth of O3 concentrations occurs until 16:00 or 17:00 UTC (Fig. 8), most clearly observed at the surface. This vertical variability points to different aspects, such as (i) the relevance of fumigation from high-altitude O3-rich strata; (ii) surface titration by NO and deposition of O3; (iii) surface photochemical generation of O3 from precursors (with higher concentrations close to the surface); and (iv) horizontal O3 and precursor surface transport from the urban plume of Madrid towards MJDH-RC. The upper O3-rich strata might have an external (to the Madrid basin or the Iberian peninsula) origin or might have been injected regionally at high altitudes on the previous day(s) by the complex recirculations of air masses already reported by Millán et al. (1997, 2000, 2002), EC (2002, 2004), Gangoiti et al. (2001), Mantilla et al. (1997), Castell et al. (2008a, b), and Millán (2014) for the WMB, by McKendry and Lundgren (2000) for other parts of the world, and by Plaza et al. (1997) and Diéguez et al. (2007, 2014) for the Madrid area.
According to the last referenced authors, due to the orientation of the Sierra de Guadarrama (Fig. 1), the heating of its S slopes throughout the day forces the wind direction to veer, describing an arc that sweeps the zones to the N of Madrid clockwise from the W to the NE. Dieguéz et al. (2014) show that the O3 maxima are recorded at an intermediate point on this route (El Pardo, Colmenar V.; see location in Figs. 9 and S12), which is determined by the wind speed, initial composition of the urban plume, and results of photochemical processes on its route from the metropolitan area to tens of kilometres away. In addition, our results and those of Plaza et al. (1997) show that O3 fumigation from high atmospheric layers decisively contributes to the increases in the surface levels, since surface concentrations during our measurements never exceeded those recorded at the highest altitude reached, and at midday homogeneous O3 levels are measured across the lower 1.2 km of the PBL.
During the whole month of July 2016, there was a clear veering of the urban plume from Madrid, with night plume transport towards the SW (MJDH-San Martin de V., Figs. 9 and S12) and towards the NW, N-NE, and, in some cases, E-SE during the morning and midday, followed by the decoupling and onset of the evening and nocturnal flow towards the SW. This veering seems to be causally associated with the high O3 levels recorded in the W to E areas surrounding northern Madrid, since the peak concentrations recorded by the official air quality network follow this spatial and temporal evolution (Fig. S12) for the exceedances of the O3 information threshold. These plume impacts occur in periods when the O3 concentration is already high because of accumulation from one day to the next in the (same) air mass, which is not completely renewed due to general circulation conditions. The relevance of the latter has been recently demonstrated by Otero et al. (2016), who report maximum temperature as the parameter more directly related to high O3 concentrations in central Europe, whereas in the WMB region, the O3 concentrations were more related to the concentrations recorded the day before.
On the other hand, the differential afternoon–evening decrease in O3 surface concentrations, compared with those found at the top of the soundings, again demonstrates the relevance of high-altitude layers, high O3 tropospheric background, and their fumigation to the surface in the hours of maximum convection.
Regarding the concentrations of UFPs, they were very homogeneous throughout the PBL during the vertical profiles, especially in the hours of maximum convection, showing a marked increase from 11 to 14 July 2016 for the whole depth for all profiles (Fig. 8). Thus, on 12 July 2016, the upper limit of the PBL (marked by a sharp reduction in UFP levels) reached 900 and 1200 m a.g.l., respectively, in the soundings conducted at 08:05 and 10:12 UTC (Fig. 8). In turn, on 14 July 2016, the top of the PBL exceeded 1200 m a.g.l. only in the afternoon, being constrained to 300 to 700 m a.g.l. from 08:05 and 10:45 UTC (also shown in the progressive loss of −1800 m in the midday PBL height from 11 to 14 July 2016, as revealed by AEMET radio soundings).
The enhanced convection on 12 July 2016 probably favoured the dilution of UFP concentrations and reinforced the fumigation of O3 from the upper levels. Conversely, the lower development of the PBL on 14 July 2016, causing less surface UPF dilution and lower top-down contributions to O3 surface concentrations, accounted for the opposite O3 and UFP profiles. Thus, a weaker development of the PBL might result in the increase in UFP concentrations, even if UFP emission–formation rates did not vary significantly. However, we cannot discard the possibility that this UFP increase on the last day was the result of a higher intensity and duration of the nucleation episodes.
Consideration of the evolution of surface O3 concentrations on 11 and 12 July 2016 (as shown in Fig. 9) depicts a double wave: the first peak around midday (11:00–14:00 UTC on the first day and 12:00–13:00 on the second) and the second peak in the afternoon–evening (19:00–22:00 and 16:00–20:00 UTC, respectively), showing relative peaks (sometimes just a plateau). We interpret the morning increase in O3 concentrations to be dominated by both local production and anthropogenic VOCs (Fig. S1), as well as the fumigation of upper levels, with an early maximum when layers above are rich in O3 that progressively decreases with dilution with surface concentrations. The secondary evening concentration peak corresponds to the advection of a locally enriched O3 air mass (titration always causes O3 depletion towards nocturnal values). When both processes (morning fumigation and evening advection) are not so strong, O3 local production results in a more “typical” diurnal time evolution, with a single maximum at 15:00-16:00 UTC, as seen on 13–14 July 2016 (Fig. 9).
The relative importance of the local contribution of the MMA to the Ox concentrations registered in the monitoring stations has also been evaluated by comparing the observations at upwind and downwind locations relative to the city. In this respect, Atazar and Alcobendas (Fig. 9) are located downwind for 11 and 12 July 2016, and MJDH and Fuenlabrada are upwind, while the opposite occurs for 13 and 14 July 2016. As the urban air mass is transported towards the E and NE during the first 2 days, a local Ox contribution is superimposed on the background at Atazar and Alcobendas, where recorded Ox was the highest in the basin (Fig. 9). The contrary holds during the next 2 days, when these sites show lower concentrations than the rest. MJDH and Fuenlabrada show a reversed behaviour, with lower concentrations during the first 2 days and higher for the last days.
In addition of the local O3, the background contribution can also be very relevant. At high elevation, changes in the background tropospheric O3 can be attributed to (i) hemispheric background concentrations, (ii) exchange between the free troposphere and boundary layer, and (iii) stratospheric inputs (Chevalier et al., 2007; Kulkarni et al., 2011; Parrish et al., 2012; Lefohn et al., 2012, 2014; Kalabokas et al., 2013, 2015, 2017; Zanis et al., 2014; Akritidis et al., 2016; Sicard et al., 2017).
The phenomenology of O3 episodes in the Madrid Metropolitan Area (MMA, central Iberia) has been characterised. We found that O3 episodes linked with precursors emitted in the Madrid conurbation are modulated by the complex regional atmospheric dynamics.
Vertical profiles (up to 1200 m a.g.l.) obtained using tethered balloons and miniaturised instrumentation at Majadahonda (MJDH), a suburban site located on the south-western flank of the Madrid Metropolitan Area (MMA) during 11–14 July 2016, showed how complex O3 is with altitude and time. Simultaneously, measurements of air quality and meteorological parameters were carried out at three supersites within the MMA, where spatial differences highlight the influence of atmospheric dynamics on different scales.
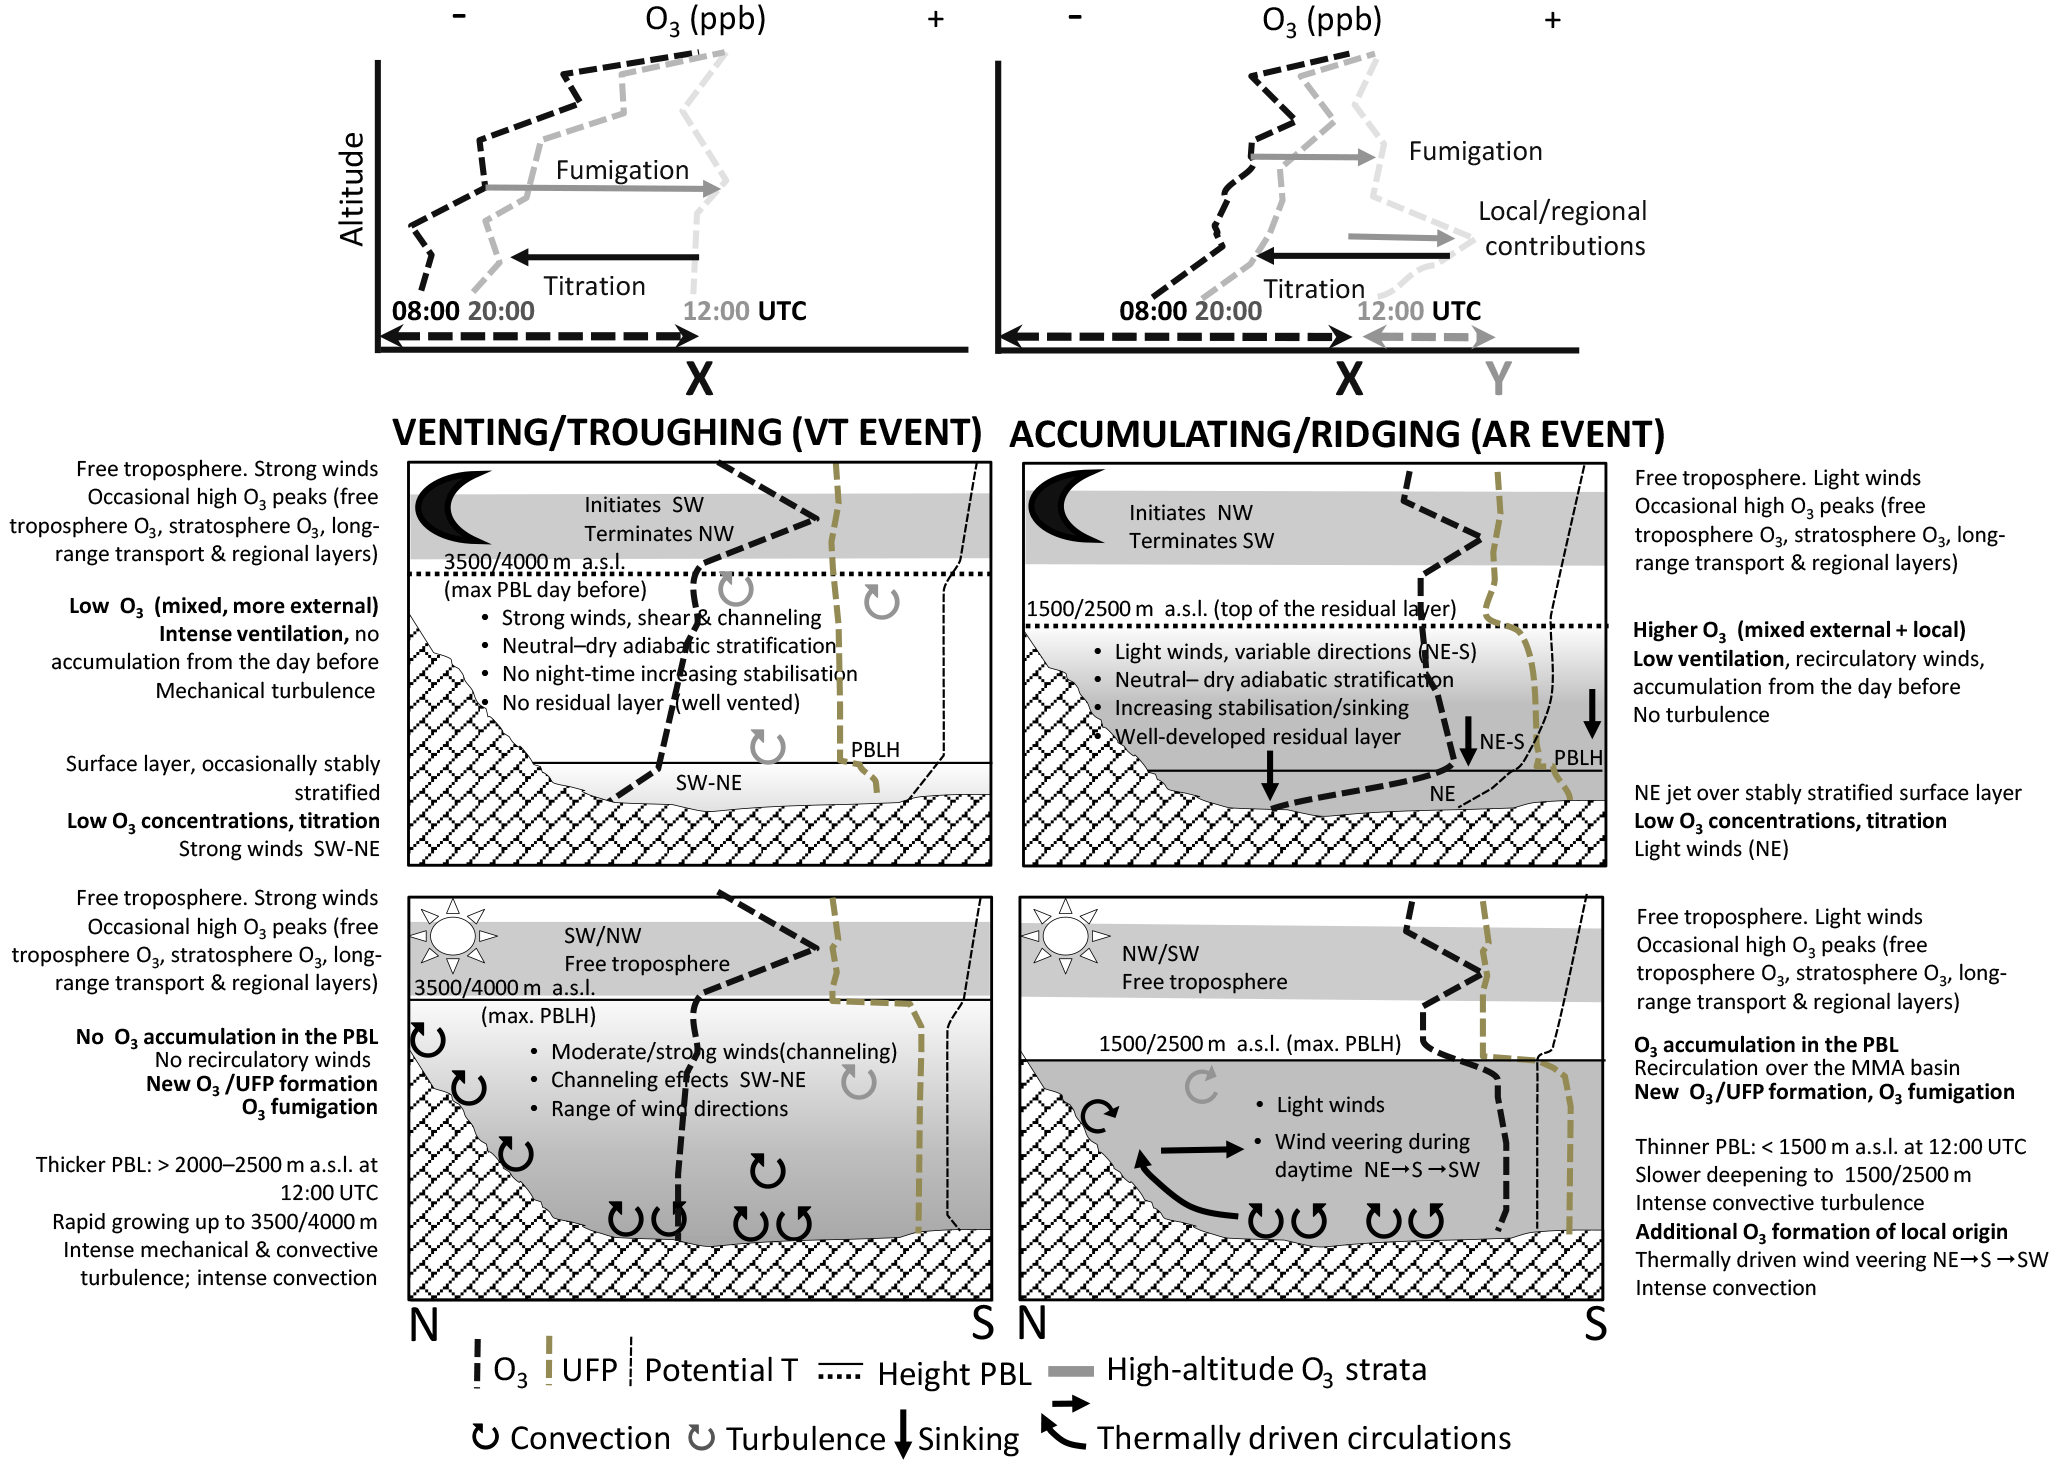
Figure 10Conceptual model of the venting and accumulation O3 episodes in the Madrid air basin, their associated vertical O3 profiles, and the X (fumigation from upper layers and flows from free troposphere and stratosphere) and Y (local and/or regional) contributions to surface O3 concentrations in the accumulation episodes.
The results presented here confirm prior findings regarding the concatenation of relatively low (venting) and high (accumulation) O3 episodes in summer. In the Madrid air basin (MAB) during both types of episodes, the fumigation of high-altitude O3-rich layers (from a remote or regional origin) contributes a relevant fraction to surface O3 concentrations. Moreover, we propose here a conceptual model (shown in Fig. 10). The following is a more specific description.
-
Accumulation episodes are activated by a relatively thinner PBL (< 1500 m a.g.l. at midday), light synoptic winds, and the development of anabatic winds along the slope of the Sierra de Guadarrama (W and NW of the MAB, with > 2400 m a.g.l. peaks). This PBL height, lower than the mountain range, and the development of the mountain breezes cause the vertical recirculation of air masses, the enrichment of O3 in the lower troposphere, and the formation of reservoir layers that fumigate to the surface as the diurnal convective circulation develops. This dynamic accounts for the occurrence of the high Ox (O3+ NO2) surface concentrations.
-
During venting episodes with more intense synoptic winds and the top of the PBL usually reaching > 2000 m a.g.l., vertical O3 profiles were characterised by an upward increase in concentrations (whereas lower-altitude O3 maxima were observed in the accumulation periods). Interestingly, vertical profiles demonstrated that, during the study period, O3 fumigation (top-down) from upper layers prevailed as a contribution to surface O3 concentrations, whereas the increase in UFPs takes place bottom-up, progressing with the development of the PBL and the occurrence of nucleation and growth episodes occurring within the PBL. Thus, crossing the PBL from the free troposphere, increases in UFP concentrations by an order of magnitude and slight decreases in O3 levels were registered. This O3 and UFP vertical distribution through the day is consistent with the existence of an efficient venting mechanism which is able to sweep out the local production of the day. Thus, there is no accumulation of pollutants above the observed stable nocturnal boundary layer from one day to the next, and new UFP production is added from below the following day. The presence of O3-enriched layers well above the stable nocturnal boundary layer, transported by sustained intense westerly winds, suggests a remote origin of this pollutant, after photochemical reactions and uplift processes developed at least the day before away from the MAB, or stratospheric intrusions, such as the one documented on 13 July 2016 during the field campaign. However, surface O3 concentrations at all stations in the MAB were low during this day; consequently, even when fumigation from this intrusion was very likely, its air quality effect was irrelevant for the same days, but the effect in the forthcoming days of subsided O3 cannot be evaluated with our tools. The high O3 period in the area initiated the day after, on 14 July 2016, and attained its highest concentration on 16 July 2016.
The results obtained in this intensive field campaign can be summarised in the following conclusions and recommendations concerning O3 abatement policies.
-
The O3 source apportionment is very complex, with contributions from local and/or regional and remote sources, including the stratosphere. The relative contributions of these might vary in time and space (e.g. Lefhon et al., 2014).
-
Climate change might reduce the benefits of the O3 abatement policies (since heat waves increase O3 episodes). This, as well as the measures and policies in North America and Asia, will need to be considered in future Europe policies for O3 mitigation (Lefohn and Cooper, 2015; Sicard et al., 2017).
-
The phenomenology of O3 episodes in the WMB is extremely complex, mainly due to the close coupling between photochemistry processes and mesoscale atmospheric dynamics. This consequently requires abatement policies very different from the ones useful for central and northern Europe, as intensive research has demonstrated in the last decades.
-
In the MAB, during the highest O3 (accumulation) episodes, in addition to the contribution (to surface concentrations) by the fumigation of upper O3 (from regional transport, hemispheric free troposphere O3, and intruded stratospheric O3; X in Fig. 10), there is an added fraction produced locally and transported–recirculated within the MAB, which accumulates from one day to the next (Y in Fig. 10). If sensitivity analyses demonstrate that the abatement of specific precursors would have an effect on reducing O3 peaks, then the reduction strategies (geographic extension, timing, and so on) for decreasing the X and Y components are very different, and in most cases the X component will dominate the relative contributions. Thus, structural measures over wider regions would probably be more effective than local episodic measures (which might have a larger effect on the Y component). In terms of precursors, the OFP analysis carried out at the ISCIII site shows that, even if anthropogenic emissions may dominate O3 formation through the potential impact of alkenes and alkanes (not measured) and the high contribution of carbonyls (formaldehyde and acetaldehyde), biogenic emissions must be considered. Biogenic VOCs (primary and secondary) and aromatic compounds (C6 to C10) contribute to the same extent to the OFP according our calculations (Table S1 and Fig. S1).
-
The meteorological scenarios causing the summer accumulation episodes in the MAB (high temperatures, low synoptic winds, and relatively thinner PBL) should be forecast in order to drive an effective alert system.
-
A more detailed characterisation of O3 precursors (VOCs and BVOCs) in the MAB is necessary, especially in the source areas, to effectively predict the photochemical evolution of the plumes and the main impact areas where O3 from high-altitude reservoir layers formed the previous day(s) fumigates to the surface levels enriched in O3 and other precursors.
-
Modelling techniques and sensitivity analyses will allow for the simulation of real conditions concerning O3 abatement potential only if the following is achieved in advance: (i) the recirculation cells and other local and/or regional meteorological processes, such as the fumigation timing and regional plume transport, are reproduced; (ii) a geographically resolved and accurate emission inventory of O3 precursors in the source areas and their temporal modulation is included; and (iii) the origin of the high-altitude O3 strata from external origins is reproduced.
-
A good combination of regional- and/or local-scale modelling, able to reproduce horizontal and vertical recirculations of air masses and the behaviour of urban and industrial plumes in complex topography and meteorology, with modelling able to calculate contributions from long-range transport, free troposphere, and stratospheric O3 will be needed to efficiently support policy (see, for example, the following: ACP special issue on the Atmospheric Chemistry and Climate Model Intercomparison Project, ACCMIP, 2013; the FAIRMODE initiative, Thunis et al., 2015; and the Monitoring Atmospheric Composition & Climate, MACC, 2018).
The conceptual model described in this study for O3 episodes in the MMA confirms the relevance of the vertical recirculations (on top of the high atmospheric multi-source O3 background) that Millan et al. (1997, 2000), Gangoiti et al. (2001), and Millán (2014) highlighted, controlled in this case by specific synoptic conditions and the PBL depth, may also be applicable to most of the Western Mediterranean Basin (WMB). Thus, Otero et al. (2016) demonstrate that in central Europe, the highest temperature is the most statistically related parameter for O3 episodes, whereas in the WMB it is the O3 level recorded the day before (reflecting recirculation).
Data used for this study can be supplied by request to xavier.querol@idaea.csic.es in the case of vertical profile measurements. Air quality data can be provided by the Regional Government of Madrid and the Madrid City Council.
The supplement related to this article is available online at: https://doi.org/10.5194/acp-18-6511-2018-supplement.
The authors declare that they have no conflict of interest.
The present work was supported by the Spanish Ministry of Agriculture,
Fishing, Food and Environment, the Madrid City Council and Madrid Regional
Government, and by the Ministry of Economy, Industry and Competitiveness and
FEDER funds under the project HOUSE (CGL2016-78594-R) and the
Generalitat de Catalunya (AGAUR 2017 SGR41). Part of this research was
supported by the Korea Ministry of Environment through “The Eco-Innovation
project”. Support is also acknowledged from the CUD of Zaragoza (project CUD 2016-05), UPV/EHU
(UFI 11/47, GIU 16/03), the project PROACLIM CGL2014-52877-R, the City
Council of Majadahonda for logistic support, AEMET for providing surface
meteorological data, and data from radio soundings and ozone free soundings.
We thank Alava Ingenieros, TSI, Solma Environmental
Solutions, and Airmodus for their support and María Díez for her
computer support in the treatment of radiosonde data.
Dr. Escudero has been awarded a José Castillejo grant from the
Spanish Ministry of Education and Science (CAS17/00108).
Edited by: Evangelos Gerasopoulos
Reviewed by: two anonymous referees
ACCMIP: 2013 ACP Special Issue on the Atmospheric Chemistry and Climate Model Intercomparison Project, available at: https://www.atmos-chem-phys.net/special_issue296.html (last access: 15 March 2018), 2013.
Akritidis, D., Pozzer, A., Zanis, P., Tyrlis, E., Škerlak, B., Sprenger, M., and Lelieveld, J.: On the role of tropopause folds in summertime tropospheric ozone over the eastern Mediterranean and the Middle East, Atmos. Chem. Phys., 16, 14025–14039, https://doi.org/10.5194/acp-16-14025-2016, 2016.
Brines, M., Dall'Osto, M., Beddows, D. C. S., Harrison, R. M., Gómez-Moreno, F., Núñez, L., Artíñano, B., Costabile, F., Gobbi, G. P., Salimi, F., Morawska, L., Sioutas, C., and Querol, X.: Traffic and nucleation events as main sources of ultrafine particles in high-insolation developed world cities, Atmos. Chem. Phys., 15, 5929–5945, https://doi.org/10.5194/acp-15-5929-2015, 2015.
Carnerero, C., Pérez, N., Reche, C., Ealo, M., Titos, G., Lee, H.-K., Eun, H.-R., Park, Y.-H., Dada, L., Paasonen, P., Kerminen, V.-M., Mantilla, E., Escudero, M., Gómez-Moreno, F. J., Alonso-Blanco, E., Coz, E., Saiz-Lopez, A., Temime-Roussel, B., Marchand, N., Beddows, D. C. S., Harrison, R. M., Petäjä, T., Kulmala, M., Ahn, K.-H., Alastuey, A., and Querol, X.: Vertical and horizontal distribution of regional new particle formation events in Madrid, Atmos. Chem. Phys. Discuss., https://doi.org/10.5194/acp-2018-173, in review, 2018.
Carslaw, D. C. and Ropkins, K.: Openair – an R package for air quality data analysis, Environ. Modell. Softw., 27–28, 52–61, 2012.
Carslaw D. C., Murrells, T. P., Andersson, J., and Keenan, M.: Have vehicle emissions of primary NO2 peaked?, Faraday Discuss., 189, 439–454, 2016.
Castell, N., Mantilla, E., and Millán, M. M.: Analysis of tropospheric ozone concentration on a Western Mediterranean site: Castellon (Spain), Environ. Monit. Assess., 136, 3–11, 2008a.
Castell, N., Stein, A. F., Salvador, R., Mantilla, E., and Millán, M. M.: The impact of biogenic VOC emissions on photochemical ozone formation during a high ozone pollution episode in the Iberian Peninsula in the 2003 summer season, Adv. Sci. Res., 2, 9–15, 2008b.
Castell, N., Tellez, L., and Mantilla, E.: Daily, seasonal and monthly variations in ozone levels recorded at the Turia river basin in Valencia (Eastern Spain), Environ. Sci. Pollut. R., 19, 3461–3480, 2012.
Chevalier, A., Gheusi, F., Delmas, R., Ordóñez, C., Sarrat, C., Zbinden, R., Thouret, V., Athier, G., and Cousin, J.-M.: Influence of altitude on ozone levels and variability in the lower troposphere: a ground-based study for western Europe over the period 2001–2004, Atmos. Chem. Phys., 7, 4311–4326, https://doi.org/10.5194/acp-7-4311-2007, 2007.
Crespí S. N., Artíñano, B., and Cabal, H.: Synoptic classification of the mixed-layer height evolution, J. Appl. Meteorol., 34, 1668–1677, 1995.
Dieguez, J. J., Millán, M., Padilla, L., and Palau, J. L.: Estudio y evaluación de la contaminación atmosférica por ozono troposférico en España, CEAM Report for the Ministry of Agriculture, Food and Environment, INF FIN/O3/2009, 372 pp., http://www.mapama.gob.es/es/calidad-y-evaluacion-ambiental/temas/atmosfera-y-calidad-del-aire/8_A_Informe final ozono-ceam Julio 2009_tcm30-188048.pdf (last access: 26 April 2018), 2009.
Dieguez, J. J., Calatayud, V., and Mantilla, E.. CEAM Report for the Ministry of Agriculture, Food and Environment, Fundación Biodiversidad, Informe Final, Memoria Técnica Proyecto CONOZE, CONtaminación por OZono en España, 137 pp., http://www.mapama.gob.es/es/calidad-y-evaluacion-ambiental/temas/atmosfera-y-calidad-del-aire/Informe_t%C3%A9cnico_CONOZE[1]_tcm30-187899.pdf (last access: 26 April 2018), 2014.
Directive 2008/50/EC: Directive 2008/50/EC of the European Parliament and of the council of 21 May 2008 on ambient air quality and cleaner air for Europe, 2008.
Directive 2015/1480: Directive 2015/1480 of 28 August 2015 amending several annexes to Directives 2004/107/EC and 2008/50/EC of the European Parliament and of the Council laying down the rules concerning reference methods, data validation and location of sampling points for the assessment of ambient air quality, 2015.
Doval, M., Castell, N., Téllez, L., and Mantilla, E.: The use of experimental data and their uncertainty for assessing ozone photochemistry in the Eastern Iberian Peninsula, Chemosphere, 89, 796–804, 2012.
EC: Ozone dynamics in the Mediterranean Basin: A collection of scientific papers resulting from the MECAPIP, RECAPMA and SECAP Projects. Air Pollution Report 78, DG RTD I.2, LX 46 2/82, B-1049 Brussels, Belgium, 2002.
EC: European Commission Decision of 19 March 2004 “Concerning guidance for implementation of Directive 2002/3/EC of the European Parliament and the Council relating to ozone in ambient air (2004/279/EC), Official Journal of the European Union L87/50 of 25 March 2004, 2004.
EEA: Air quality in Europe-2017 report, EEA Report, No 13/2017, ISBN 978-92-9213-920-9, Luxembourg: Publications Office of the European Union, 74 pp., available at: https://www.eea.europa.eu/publications/air-quality-in-europe-2017 (last access: 15 March 2018), 2017.
EMEP: Air pollution trends in the EMEP region between 1990 and 2012, EMEP/CCC-Report 1/2016, ISBN: 978-82-425-2834-6, 107 pp., 2016.
Escudero, M., Lozano, A., Hierro, J., del Valle, J., and Mantilla, E.: Urban influence on increasing ozone concentrations in a characteristic Mediterranean agglomeration, Atmos. Environ., 99, 322–332, 2014.
Gangoiti, G., Millán, M. M., Salvador, R., and Mantilla, E.: Long-range transport and re-circulation of pollutants in the western Mediterranean during the project Regional Cycles of Air Pollution in the West-Central Mediterranean Area, Atmos. Environ., 35, 6267–6276, 2001.
Garcia Dos Santos, S., Benarroch Benarroch, R., Fernández Patier, R., Sintes Puertas, M. A., Cantón Gálvez, J. M., Alonso Herreros, J., and Guevara Hernández, S.: Atmospheric Pollution in North Africa. Facts and lessons in the Spanish City of Ceuta, 9TH International Conference on Air Quality Science and Application, 24–28 March 2014, Garmisch, Germany, 2014.
Gerasopoulos, E., Kouvarakis, G., Vrekoussis, M., Kanakidou, M., and Mihalopoulos, N.: Ozone variability in the marine boundary layer of the Eastern Mediterranean based on 7-year observations, J. Geophys. Res., 110, D15309, https://doi.org/10.1029/2005JD005991, 2005.
Giannakopoulos, C., Le Sager, P., Bindi, M., Moriondo, M., Kostopoulou, E., and Goodess, C. M. Climatic changes and associated impacts in the Mediterranean resulting from a 2 ∘C global warming, Global Planet. Change, 68, 209–224, 2009.
Gómez-Moreno, F. J., Pujadas, M., Plaza, J., Rodríguez-Maroto, J. J., Martínez-Lozano, P., and Artíñano, B.: Influence of seasonal factors on the atmospheric particle number concentration and size distribution in Madrid, Atmos. Environ., 45, 3199–3180, 2011.
Kalabokas, P. D., Viras, L. G., Bartzis, J. G., and Repapis, C. C.: Mediterranean rural ozone characteristics around the urban area of Athens, Atmos. Environ., 34, 5199–5208, 2000.
Kalabokas, P. D. and Repapis, C. C.: A climatological study of rural surface ozone in central Greece, Atmos. Chem. Phys., 4, 1139–1147, https://doi.org/10.5194/acp-4-1139-2004, 2004.
Kalabokas, P. D., Mihalopoulos, N., Ellul, R., Kleanthous, S., and Repapis, C. C.: An investigation of the meteorological and photochemical factors influencing the background rural and marine surface ozone levels in the Central and Eastern. Mediterranean, Atmos. Environ., 42, 7894–7906, 2008.
Kalabokas, P. D., Cammas, J.-P., Thouret, V., Volz-Thomas, A., Boulanger, D., and Repapis, C. C.: Examination of the atmospheric conditions associated with high and low summer ozone levels in the lower troposphere over the eastern Mediterranean, Atmos. Chem. Phys., 13, 10339–10352, https://doi.org/10.5194/acp-13-10339-2013, 2013.
Kalabokas, P. D., Thouret, V., Cammas, J. P., Volz-Thomas, A., Boulanger, D., and Repapis, C. C.: The geographical distribution of meteorological parameters associated with high and low summer ozone levels in the lower troposphere and the boundary layer over the Eastern Mediterranean (Cairo case), Tellus B, 67, 27853, https://doi.org/10.3402/tellusb.v67.27853, 2015.
Kalabokas, P., Hjorth, J., Foret, G., Dufour, G., Eremenko, M., Siour, G., Cuesta, J., and Beekmann, M.: An investigation on the origin of regional springtime ozone episodes in the western Mediterranean, Atmos. Chem. Phys., 17, 3905–3928, https://doi.org/10.5194/acp-17-3905-2017, 2017.
Kourtidis, K., Zerefos, C., Rapsomanikis, S., Simeonov, V., Balis, D., Perros, P. E., Thomson, A. M., Witte, J., Calpini, B., Sharobiem, W. M., Papayiannis, A., Mihalopoulos, N., and Drakou, R.: Regional levels of ozone in the troposphere over eastern Mediterranean, J. Geophys. Res., 107, 8140, https://doi.org/10.1029/2000JD000140, 2002.
Kouvarakis, G., Vrekoussis, M., Mihalopoulos, N., Kourtidis, K., Rappenglueck, B., Gerasopoulos, E., and Zerefos, C.: Spatial and temporal variability of tropospheric ozone in the boundary layer above the Aegean Sea (eastern Mediterranean), J. Geophys. Res., 107, 8137, https://doi.org/10.1029/2000JD000081, 2002.
Kulkarni, P. S., Bortoli, D., Salgado, R., Anton, M., Costa, M. J., and Silva, A. M.: Tropospheric ozone variability over the Iberian Peninsula, Atmos. Environ., 45, 174–182, 2011.
Kulmala, M. and Kerminen, V. M.: On the formation and growth of atmospheric nanoparticles, Atmos. Res., 90, 132–150, 2008.
Kulmala, M., Pirjola, L., and Mäkelä, J. M.: Stable Sulphate Clusters as a Source of New Atmospheric Particles, Nature, 404, 66–69, 2000.
Kulmala, M., Vehkamehk, H., Pet, P. T., Dal Maso, M., Lauri, A., Kerminen, V.-M., Birmili, W., and McMurry, P.: Formation and growth rates of ultrafine atmospheric particles: a review of observations, J. Aerosol Sci., 35, 143–176, 2004.
Lee, H.-K., Hwang, I.-K., and Ahn, K.-H.: Development and Evaluation of Hy-CPC, Particle and Aerosol Research, 10, 93–97, 2014.
Lefohn, A. S. and Cooper O. R.: Introduction to the Special Issue on Observations and Source Attribution of Ozone in Rural Regions of the Western United States, Atmos. Environ., 109, 279–281, 2015.
Lefohn, A. S., Wernli, H., Shadwick, D., Oltmans, S. J., and Shapiro, M.: Quantifying the frequency of stratospheric-tropospheric transport affecting enhanced surface ozone concentrations at high- and low-elevation monitoring sites in the United States, Atmos. Environ., 62, 646–656, 2012.
Lefohn, A. S., Emery, C., Shadwick, D., Wernli, H., Jung, J., and Oltmans, S. J.: Estimates of background surface ozone concentrations in the United States based on model-derived source apportionment, Atmos. Environ., 84, 275–288, 2014.
Lelieveld, J., Berresheim, H., Borrmann, S., Crutzen, P. J., Dentener, F. J., Fischer, H., Feichter, J., Flatau, P. J., Heland, J., Holzinger, R., Korrmann, R., Lawrence, M. G. , Levin, Z., Markowicz, K. M., Mihalopoulos, N., Minikin, A., Ramanathan, V., de Reus, M., Roelofs, G. J., Scheeren, H. A., Sciare, J., Schlager, H., Schultz, M. ., Siegmund, P., Steil, B., Stephanou E. G., Stier, P., Traub, M., Warneke, C., Williams, J., and Ziereis, H.: Global air pollution crossroads over the Mediterranean, Science 298, 794–799, 2002.
MACC: Monitoring Atmospheric Composition & Climate, http://www.gmes-atmosphere.eu/services/raq/raq_nrt/, last access: 16 March 2018.
Mantilla, E., Millán, M. M., Sanz, M. J., Salvador, R., and Carratalá, A.: Influence of mesometeorological processes on the evolution of ozone levels registered in the Valencian Community, in: I Technical workshop on ozone pollution in southern Europe, Valencia, Spain, 1997.
McKendry, I. G. and Lundgren, J.: Tropospheric layering of ozone in regions of urbanized complex and/or coastal terrain: a review, Prog. Phys. Geog., 24, 329–354 , 2000.
Millán, M. M.: Ozone dynamics in the Mediterranean basin, A collection of scientific papers resulting from the MECAPIP, RECAPMA and SECAP Projects, Air Pollution Research Report 78, Fundación Centro de Estudios Ambientales del Mediterráneo – CEAM, Valencia, Spain, 287 pp., 2002.
Millán, M. M.: Extreme hydrometeorological events and climate change predictions in Europe, J. Hydrol., 518B, 206–224, 2014.
Millán, M. M. and Sanz, M. J.: Ozone in Mountainous regions and in Southern Europe, in: Ad hoc Working group on Ozone Directive and Reduction Strategy Development, Ozone Position Paper 145–150, European Commission, Brussels, Belgium, 1999.
Millán, M. M., Artiñano, B., Alonso, L., Navazo, M., and Castro, M.: The effect of meso-scale flows on regional and long-range atmospheric transport in the Western Mediterranean area, Atmos. Environ., 25A, 5/6, 949–963, 1991.
Millán, M. M., Salvador, R., Mantilla, E., and Artiñano, B.: Meteorology and photochemical air pollution in southern Europe: experimental results from EC research projects, Atmos. Environ., 30, 1909–1924, 1996a.
Millán, M. M., Mantilla, E., Salvador, R., and Kallos, G.: Regional and long-range transport scenarios for photo-oxidants on the Mediterranean basin in summer, Ninth joint conference on applications of air pollution meteorology, 438–441, Am. Meteorol Soc., Boston, USA, 1996b.
Millán, M. M., Salvador, R., and Mantilla, E.: Mesoscale processes and photo-oxidants cycles on the Spanish Mediterranean coast, Ninth joint conference on applications of air pollution meteorology, 434–437, Am. Meteorol. Soc., Boston, USA, 1996c.
Millán, M. M., Salvador, R., Mantilla, E., and Kallos, G.: Photooxidant dynamics in the Mediterranean basin in summer: Results from European research projects, J. Geophys. Res., 102, 8811–8823, 1997.
Millán, M. M., Mantilla, E., Salvador, R., Carratalá, A., Sanz, M. J., Alonso, L., Gangoiti, G., and Navazo, M.: Ozone Cycles in the Western Mediterranean Basin: Interpretation of Monitoring Data in Complex Coastal Terrain, J. Appl. Meteorol., 39, 487–508, 2000.
Millán, M. M., Sanz, M. J., Salvador, R., and Mantilla, E. Atmospheric dynamics and ozone cycles related to nitrogen deposition in the western Mediterranean, Environ. Pollut., 118, 167–186, 2002.
Minguillón, M. C., Brines, M., Pérez, N., Reche, C., Pandolfi, M., Fonseca, A. S., Amato, F., Alastuey, A., Lyasota, A., Codina, B., Lee, H.-K., Eun, H.-R., Ahn, K.-H., and Querol, X.: New particle formation at ground level and in the vertical column over the Barcelona area, Atmos. Res., 164–165, 118–130, 2015.
Monks, P. S., Archibald, A. T., Colette, A., Cooper, O., Coyle, M., Derwent, R., Fowler, D., Granier, C., Law, K. S., Mills, G. E., Stevenson, D. S., Tarasova, O., Thouret, V., von Schneidemesser, E., Sommariva, R., Wild, O., and Williams, M. L.: Tropospheric ozone and its precursors from the urban to the global scale from air quality to short-lived climate forcer, Atmos. Chem. Phys., 15, 8889–8973, https://doi.org/10.5194/acp-15-8889-2015, 2015.
Ochoa-Hueso, R., Munzi, S., Alonso, R., Arróniz-Crespo, M., Avila, A., Bermejo, V., Bobbink, R., Branquinho, C., Concostrina-Zubiri, L., Cruz, C., Cruz de Carvalho, R., De Marco, A., Dias, T., Elustondo, D., Elvira, S., Estébanez, B., Fusaro, L., Gerosa, G., Izquieta-Rojano ,S., Lo Cascio, M., Marzuoli, R., Matos, P., Mereu, S., Merino, J., Morillas, L., Nunes, A., Paoletti, E., Paoli, L., Pinho, P., Rogers, I.B., Santos, A., Sicard, P., Stevens, C. J., and Theobald, M. R.: Ecological impacts of atmospheric pollution and interactions with climate change in terrestrial ecosystems of the Mediterranean Basin: Current research and future directions, Environ. Pollut., 227, 194–206, 2017.
Otero, N., Sillmann, J., Schnell, J. L., Rust, H., and Butler, T.: Synoptic and meteorological drivers of extreme ozone concentrations over Europe, Environ. Res. Lett., 11, 024005, https://doi.org/10.1088/1748-9326/11/2/024005, 2016.
Pandolfi, M., Tobías, A., Alastuey, A., Sunyer, J., Schwartz, J., Lorente, J., Pey, J., and Querol, X.: Effect of atmospheric mixing layer depth variations on urban air quality and daily mortality during Saharan dust outbreaks, Sci. Total Environ., 494–495, 283–289, 2014.
Paoletti, E., De Marco, A., Beddows, D. C. S., Harrison, R. M., and Manning, W. J. Ozone levels in European and USA cities are increasing more than at rural sites, while peak values are decreasing, Environ. Poll., 192, 295–299, 2014.
Parrish, D. D., Law, K. S., Staehelin, J., Derwent, R., Cooper, O. R., Tanimoto, H., Volz-Thomas, A., Gilge, S., Scheel, H.-E., Steinbacher, M., and Chan, E.: Long-term changes in lower tropospheric baseline ozone concentrations at northern mid-latitudes, Atmos. Chem. Phys., 12, 11485–11504, https://doi.org/10.5194/acp-12-11485-2012, 2012.
Plaza, J., Pujadas, M., and Artíñano, B. Formation and Transport of the Madrid Ozone Plume, JAPCA J. Air Waste Ma., 47, 766–774, 1997.
Querol, X., Alastuey, A., Pandolfi, M., Reche, C., Pérez, N., Minguillón, M. C., Moreno, T., Viana, M., Escudero, M., Orio, A., Pallarés, M., and Reina F.: 2001–2012 trends on air quality in Spain, Sci. Total Environ., 490, 957–969, 2014.
Querol, X., Alastuey, A., Orio, A., Pallares, M., Reina, F., Dieguez, J. J., Mantilla, E., Escudero, M., Alonso, L., Gangoiti, G., and Millán, M.: On the origin of the highest ozone episodes in Spain, Sci. Total Environ., 572, 379–389, 2016.
Querol, X., Gangoiti, G., Mantilla, E., Alastuey, A., Minguillón, M. C., Amato, F., Reche, C., Viana, M., Moreno, T., Karanasiou, A., Rivas, I., Pérez, N., Ripoll, A., Brines, M., Ealo, M., Pandolfi, M., Lee, H.-K., Eun, H.-R., Park, Y.-H., Escudero, M., Beddows, D., Harrison, R. M., Bertrand, A., Marchand, N., Lyasota, A., Codina, B., Olid, M., Udina, M., Jiménez-Esteve, B., Soler, M. R., Alonso, L., Millán, M., and Ahn, K.-H.: Phenomenology of high-ozone episodes in NE Spain, Atmos. Chem. Phys., 17, 2817–2838, https://doi.org/10.5194/acp-17-2817-2017, 2017.
Reche, C., Moreno, T., Amato, F., Pandolfi, M., Pérez, J., de la Paz, D., Díaz, E., Gómez-Moreno, F. J., Pujadas, M., Artíñano, B., Reina, F., Orio, A., Pallarés, M., Escudero, M., Tapia, O., Crespo, E., Vargas, R., Alastuey, A., and Querol, X., Spatio-temporal patterns of high summer ozone events in the Madrid Basin, Central Spain, Atmos. Environ., in press, 2018.
Saha, S., Moorthi, S., Wu, X., Wang, J., Nadiga, S., Tripp, P., Behringer, D., Hou, Y. T., Chuang, H. Y., Iredell, M., Ek, M., Meng, J., Yang, R., Peña Mendez, M., van den Dool, H., Zhang, Q., Wang, W., Chen, M., and Becker, E.: The NCEP Climate Forecast System Version 2, J. Climate, 27, 2185–2208, 2014.
Saiz-Lopez, A., Borge, R., Notario, A., Adame, J. A., De la Paz, D., Querol, X., Artíñano, B., Gomez-Moreno, F. J., and Cuevas, C. A.: Unexpected increase in the oxidation capacity of the urban atmosphere of Madrid, Spain, Sci. Rep, 7, 45956, https://doi.org/10.1038/srep45956, 2017.
Salma, I., Németh, Z., Kerminen, V.-M., Aalto, P., Nieminen, T., Weidinger, T., Molnár, Á., Imre, K., and Kulmala, M.: Regional effect on urban atmospheric nucleation, Atmos. Chem. Phys., 16, 8715–8728, https://doi.org/10.5194/acp-16-8715-2016, 2016.
Salvador, R., Millán, M. M., Mantilla, E., and Baldasano J. M.: Mesoscale modelling of atmospheric processes over the western Mediterranean area during summer, Int. J. Environ. Pollut., 8, 513–528, 1997.
Salvador R., Millán, M. M., and Calbo J.: Horizontal Grid Size Selection and its influence on Mesoscale Model Simulations, J. Appl. Meteorol., 38, 1311–1329, 1999.
Salvador, P., Artíñano, B., Viana, M., Alastuey, A., and Querol, X. Multicriteria approach to interpret the variability of the levels of particulate matter and gaseous pollutants in the Madrid metropolitan area, during the 1999–2012 period, Atmos. Environ., 109, 205–216, 2015.
Sicard, P., De Marco, A., Troussier, F., Renou, C., Vas, N., and Paoletti, E.: Decrease in surface ozone concentrations at Mediterranean remote sites and increase in the cities, Atmos. Environ., 79, 705–715, 2013.
Sicard, P., Anav, A., De Marco, A., and Paoletti, E.: Projected global ground-level ozone impacts on vegetation under different emission and climate scenarios, Atmos. Chem. Phys., 17, 12177–12196, https://doi.org/10.5194/acp-17-12177-2017, 2017.
Sipilä, M., Berndt, T., Petäjä, T., Brus, D., Vanhanen, J., Stratmann, F., Patokoski, J., Mauldin III, R. L., Hyvärinen, A.-P., Lihavainen, H., and Kulmala M.: The role of sulfuric acid in atmospheric nucleation, Science, 327, 1243–1246, 2010.
Stein, A. F., Mantilla, E., and Millán, M. M.: Ozone formation downwind an industrial complex in the western Mediterranean, in: 13th World Clean Air and Environmental Protection, 22–27 August 2004, London, UK, 2004.
Stein, A. F., Mantilla. E., and Millán. M. M.: Using measured and modelled indicators to assess ozone-NOx-VOC sensitivity in a western Mediterranean coastal environment, Atmos. Environ., 39, 7167–7180, 2005.
Thunis, P., Pisonia, E., Degraeuwe, B., Kranenburg, R., Schaap, M., and Clappier, S.: Dynamic evaluation of air quality models over European regions, Atmos. Environ., 111, 185–194, 2015.
Velchev, K., Cavalli, F., Hjorth, J., Marmer, E., Vignati, E., Dentener, F., and Raes, F.: Ozone over the Western Mediterranean Sea – results from two years of shipborne measurements, Atmos. Chem. Phys., 11, 675–688, https://doi.org/10.5194/acp-11-675-2011, 2011.
Zanis, P., Hadjinicolaou, P., Pozzer, A., Tyrlis, E., Dafka, S., Mihalopoulos, N., and Lelieveld, J.: Summertime free-tropospheric ozone pool over the eastern Mediterranean/Middle East, Atmos. Chem. Phys., 14, 115–132, https://doi.org/10.5194/acp-14-115-2014, 2014.