the Creative Commons Attribution 3.0 License.
the Creative Commons Attribution 3.0 License.
Dynamics and composition of the Asian summer monsoon anticyclone
Klaus-Dirk Gottschaldt
Hans Schlager
Robert Baumann
Duy Sinh Cai
Veronika Eyring
Phoebe Graf
Volker Grewe
Patrick Jöckel
Tina Jurkat-Witschas
Christiane Voigt
Andreas Zahn
Helmut Ziereis
This study places HALO research aircraft observations in the upper-tropospheric Asian summer monsoon anticyclone (ASMA) into the context of regional, intra-annual variability by hindcasts with the ECHAM/MESSy Atmospheric Chemistry (EMAC) model. The observations were obtained during the Earth System Model Validation (ESMVal) campaign in September 2012. Observed and simulated tracer–tracer relations reflect photochemical O3 production as well as in-mixing from the lower troposphere and the tropopause layer. The simulations demonstrate that tropospheric trace gas profiles in the monsoon season are distinct from those in the rest of the year, and the measurements reflect the main processes acting throughout the monsoon season. Net photochemical O3 production is significantly enhanced in the ASMA, where uplifted precursors meet increased NOx, mainly produced by lightning. An analysis of multiple monsoon seasons in the simulation shows that stratospherically influenced tropopause layer air is regularly entrained at the eastern ASMA flank and then transported in the southern fringe around the interior region. Radial transport barriers of the circulation are effectively overcome by subseasonal dynamical instabilities of the anticyclone, which occur quite frequently and are of paramount importance for the trace gas composition of the ASMA. Both the isentropic entrainment of O3-rich air and the photochemical conversion of uplifted O3-poor air tend to increase O3 in the ASMA outflow.
- Article
(24222 KB) - Full-text XML
- Companion paper
-
Supplement
(23506 KB) - BibTeX
- EndNote


The Asian monsoon system is one of the largest and most dominant atmospheric features on Earth. It is stronger than other monsoon systems because of the topography of the region, which insulates warm, moist air over South Asia (the sub-Himalayan countries of the Indian subcontinent) from the cold and dry extratropics (Boos and Kuang, 2010). This leads to a global maximum of surface moist static energy at the south-western flank of the Himalayas (Boos and Hurley, 2013), which drives deep convective updraughts during Northern Hemispheric summer. Elevated surface heating over the Tibetan plateau (Flohn, 1960; Fu et al., 2006), predominantly northward surface winds plus orographic uplifting at the southern/south-western slopes of the Himalayas (Li et al., 2005; Y. Liu et al., 2009) and deep convection over the Bay of Bengal (Park et al., 2009; Nützel et al., 2016) all additionally contribute to an overall ascending air current. This drives an anticyclonic circulation, centred at 200 to 100 hPa (Dunkerton, 1995; Randel and Park, 2006; Garny and Randel, 2016).
The location, shape and strength of the Asian summer monsoon anticyclone (ASMA) strongly vary on intra-seasonal, interannual and longer timescales (Dunkerton, 1995; Lin et al., 2008; Kunze et al., 2010; Pokhrel et al., 2012), which is subject to ongoing discussion (Pan et al., 2016; Nützel et al., 2016). An elliptical vortex is intrinsically unstable (Hsu and Plumb, 2001; Popovic and Plumb, 2001), thus prone to splitting up and eddy shedding to the west and east (Dethof et al., 1999; Vogel et al., 2014). Variable forcing by convection (Randel and Park, 2006; Garny and Randel, 2013), subseasonal oscillations (Lin et al., 2008; Goswami, 2012), the interaction with Rossby waves or midlatitude synoptic disturbances (Dethof et al., 1999) add further complexity. The overall upwelling in the eastern ASM region is accompanied by large-scale subsidence in the western part (Rodwell and Hoskins, 1996), making the Arabian Peninsula one of the warmest and driest regions on Earth. The heat low associated with the hot desert conditions in summer produces an anticyclone (Lelieveld et al., 2009) in the middle to upper troposphere, which interacts with the ASMA.
The interplay of the above dynamical ingredients makes the Asian summer monsoon a switch yard and mixing vessel for air masses of different origins and with different compositions, including the exchange between the troposphere and stratosphere. Monsoon air is received by regions around the globe (Rauthe-Schöch et al., 2016) and was, for instance, shown to affect the tropospheric chemical composition in the Mediterranean (Lelieveld et al., 2001, 2002; Scheeren et al., 2003). A mid-tropospheric (400–500 hPa) summertime O3 maximum over the eastern Mediterranean/Middle Eastern region (Li et al., 2001; Lelieveld et al., 2009; Schuck et al., 2010; Akritidis et al., 2016) is enhanced by the Asian monsoon outflow (Y. Liu et al., 2009; Richards et al., 2013; Barret et al., 2016), but it is not clear whether O3 in the ASMA plume is generally enhanced or depleted (Lawrence and Lelieveld, 2010).
In the following TL refers to the mixing zone at the tropopause, where cross-tropopause exchange of air masses on average creates a gradient between stratospheric and tropospheric trace gas signatures. The TL is also denoted by ExTL in the extratropics and TTL in the tropics, reflecting the changes in dominating physical processes at about the 30∘ in latitude. There are no rigid boundaries, but rather stratospheric influence decreases towards the troposphere over a range of several kilometres (Gettelman et al., 2011). In contrast, “upper troposphere” (UT) is used here to describe the altitude region that is dominated by the ASMA. Despite its importance for redistributing trace gases between the boundary layer, troposphere and lower stratosphere, the highly variable composition of the ASMA and the processes behind it are not well understood yet (Randel et al., 2016).
In situ measurements were conducted in the ASMA during the Earth System Model Validation (ESMVal) field experiment with the High Altitude and LOng Range (HALO) research aircraft in September 2012. A sudden enhancement of measured O3 when HALO entered the ASMA from the south was the motivation for the accompanying paper (Gottschaldt et al., 2017), since those measurements contrast with the presumption of decreased O3 in the ASMA. It was shown that the ASMA filament(s) encountered during that flight were associated with entrainments of lower-/mid-tropospheric air at the eastern ASMA flank as well as with stratospherically influenced TL air.
Here we put the specific situation observed during the HALO ESMVal campaign into a regional, seasonal and multi-annual perspective, which is provided by global chemistry climate simulations with the ECHAM/MESSy Atmospheric Chemistry (EMAC) model.
Recent papers discussed climatological trace gas distributions in the monsoon region (Santee et al., 2017), CO distributions in the context of daily ASMA dynamics (Pan et al., 2016) and monthly budgets of CO and O3 (Barret et al., 2016). Building on the ASMA observations during the HALO ESMVal campaign, the second objective of our study is to complement these papers by considering additional tracers on a 10-hourly scale to characterise key processes relevant for the O3 distribution in the monsoon region.
We first briefly summarise the data used here, then discuss the EMAC-simulated intra-annual variability of selected tracers in the ASMA region for the year of the HALO ESMVal campaign, put observed tracer–tracer relations in the context of simulated ones, discuss the interplay of the processes that contributed to the observed trace gas signatures and also show in the context of multiple monsoon seasons that the specific situation observed during the HALO ESMVal campaign was not exceptional. For brevity the main text only provides summarising statements about lightning NOx (LiNOx) and reactive nitrogen (NOy) in the ASMA, and we refer to the Supplement for details. Additional figures in the Supplement are provided for documentation and reproducibility.
We focus on the analyses of O3, CO, hydrogen chloride (HCl) and reactive nitrogen (NO, NOx, NOy), as those tracers reflect the processes most relevant for the interpretation of in situ measurements in the ASMA during the ESMVal flight from Male (Maldives) to Larnaca (Cyprus) on 18 September 2012. All in situ measurements used here are based on a data set with a 10 s time resolution, which is available from the HALO database (https://halo-db.pa.op.dlr.de). The corresponding measurement techniques are described in the accompanying paper and in more detail in publications about the individual instruments: CO (Hoor et al., 2004; Schiller et al., 2008; Müller et al., 2016), HCl (Jurkat et al., 2014; Voigt et al., 2014), NO/NOy (Ziereis et al., 2000) and O3 (Zahn et al., 2012). Among those tracers, only HCl mixing ratios were at the instrument's detection limit during the considered flight (Jurkat et al., 2016).
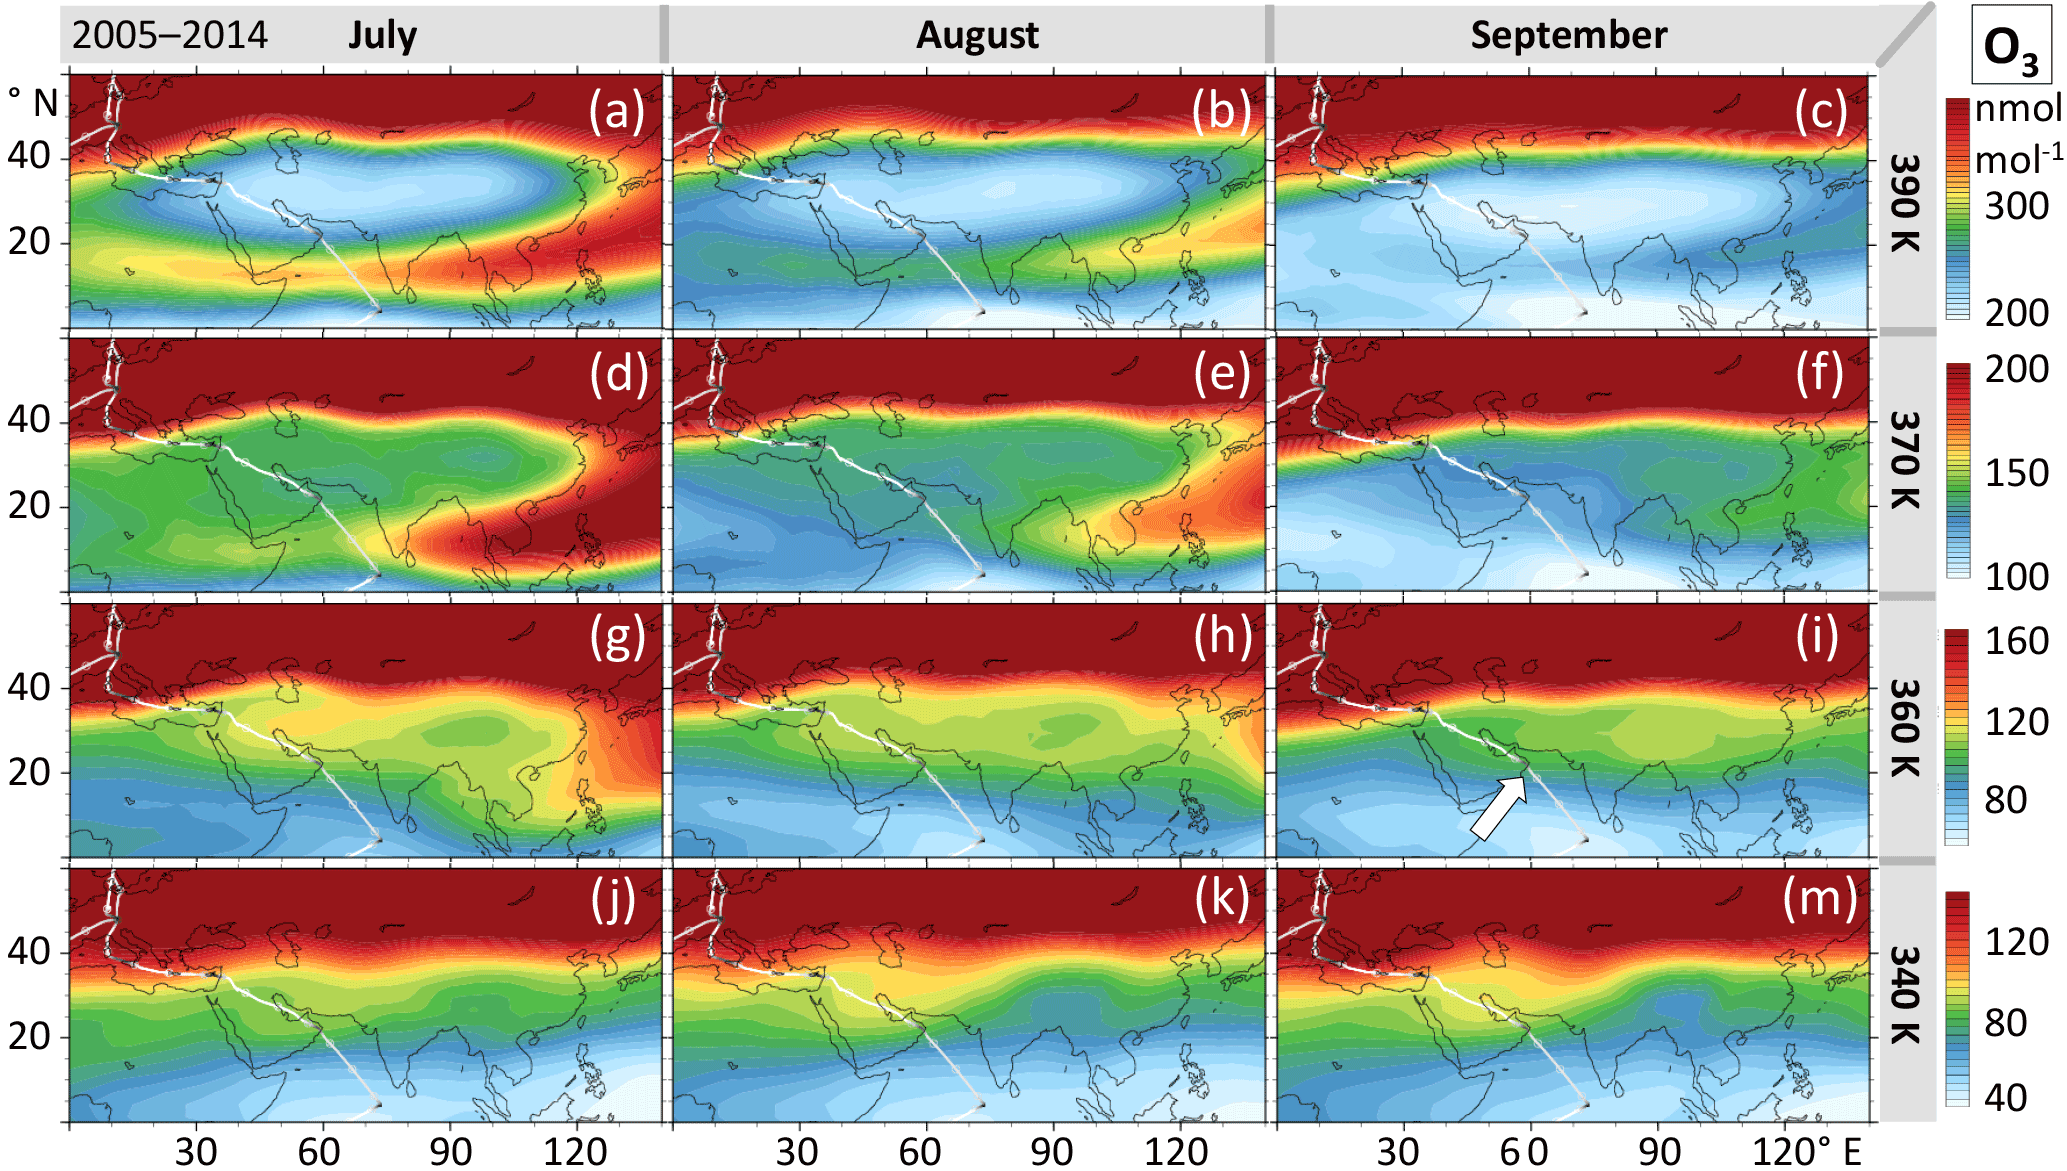
Figure 1EMAC-simulated O3 at different isentropic surfaces. Multi-annual monthly averages are calculated for the same period as in Santee et al. (2017) and agree well with their figures (370 and 390 K). However, at the level corresponding to the HALO flight altitude (360 K), O3 is enhanced in the ASMA in September (i) and the observed sudden increase at the southern ASMA edge over Oman is also reproduced (arrow).
The transport pathways of air parcels before being encountered by HALO were calculated with the Lagrangian HYSPLIT model (Draxler and Hess, 1998; Draxler and Rolph, 2015). Although published in the accompanying paper, those analyses are a basis for this study.
In the following all simulation data stem from global chemistry climate simulations with the EMAC model (Jöckel et al., 2010), performed within the ESCiMo (Earth System Chemistry integrated Modelling) project (Jöckel et al., 2016) and the DLR-internal ESMVal project. Our reference simulation has been described and generally evaluated as RC1SD-base-10a by Jöckel et al. (2016). Its set-up is designed for the best possible comparability to observations by nudging the dynamics to ECMWF ERA-Interim (Dee et al., 2011) reanalysis data and covers the period 1980–2013 (excluding spin-up). Convection is not resolved in the simulation, but its effects are captured by a parameterisation in EMAC. LiNOx emissions are parameterised on top of the convection parameterisation. Given the above uncertainties, simulated lightning activity compares acceptably with satellite observations (Supplement).
NOx background mixing ratios are crucial for O3 photochemistry, as will be discussed in more detail in Sect. 6.3. In situ measurements are the most accurate in the UT. We have shown in the accompanying paper that this simulation reproduces the measured trace gas mixing ratios along the HALO flight track of 18 September 2012 reasonably well, but this comparison is rather limited, spatially and temporally. Therefore we compare simulated NO and NOy to one of the most comprehensive observational data sets available for reactive nitrogen in the UT (Stratmann et al., 2016): IAGOS-CARIBIC (In-service Aircraft for a Global Observing System – Civil Aircraft for the Regular Investigation of the atmosphere Based on an Instrument Container; Brenninkmeijer et al., 2007, http://www.caribic-atmospheric.com). Our comparisons are based on the output of the EMAC S4D submodel (Jöckel et al., 2010), which provides simulation data along the given IAGOS-CARIBIC flight tracks at each model time step (Δt= 12 min). The agreement between simulated NO and corresponding IAGOS-CARIBIC observations is remarkable, particularly in the ASMA region (Supplement). Further comparisons between the EMAC RC1SD-base-10a simulation and IAGOS-CARIBIC are shown by Jöckel et al. (2016) for O3, CO and others, based on 10-hourly simulation output.
Ten-year averages of simulated O3 reproduce the low-O3 ASMA interior of satellite climatologies (Santee et al., 2017) as well as increased O3 found by HALO ESMVal at slightly lower potential temperatures (Fig. 1).
Additional EMAC simulations were performed in quasi-chemistry transport model mode (Deckert et al., 2011; Gottschaldt et al., 2013) to test the impact of LiNOx. These are described in the Supplement. “Simulation” without further specification refers to RC1SD-base-10a in the following.
As noted in the introduction, the ASMA is driven by a large-scale updraught originating from the south-western flank of the Himalayas, on the one hand, and by smaller-scale tropical deep convection events, on the other hand. The latter correlates with a maximum of outgoing long-wave radiation (OLR), which expands from the Bay of Bengal towards the Tibetan plateau and back in the course of the monsoon season (Nützel et al., 2016). In contrast, the large-scale updraught is tied to geographical features (maximum of moist static energy in the Indo-Gangetic plain, heating of the Tibetan plateau, orographic forcing of the Himalayas). The inland thermodynamic conditions of the Arabian Peninsula support the mid-tropospheric anticyclone in the west. It may intermittently merge with the ASMA, but we presume that the composition of the UT in the west is determined mainly by air transported in the eastern-driven circulation. We refer to the western and eastern parts as “Iranian” and “Tibetan”, respectively. ASMA unspecifically refers to the whole system.
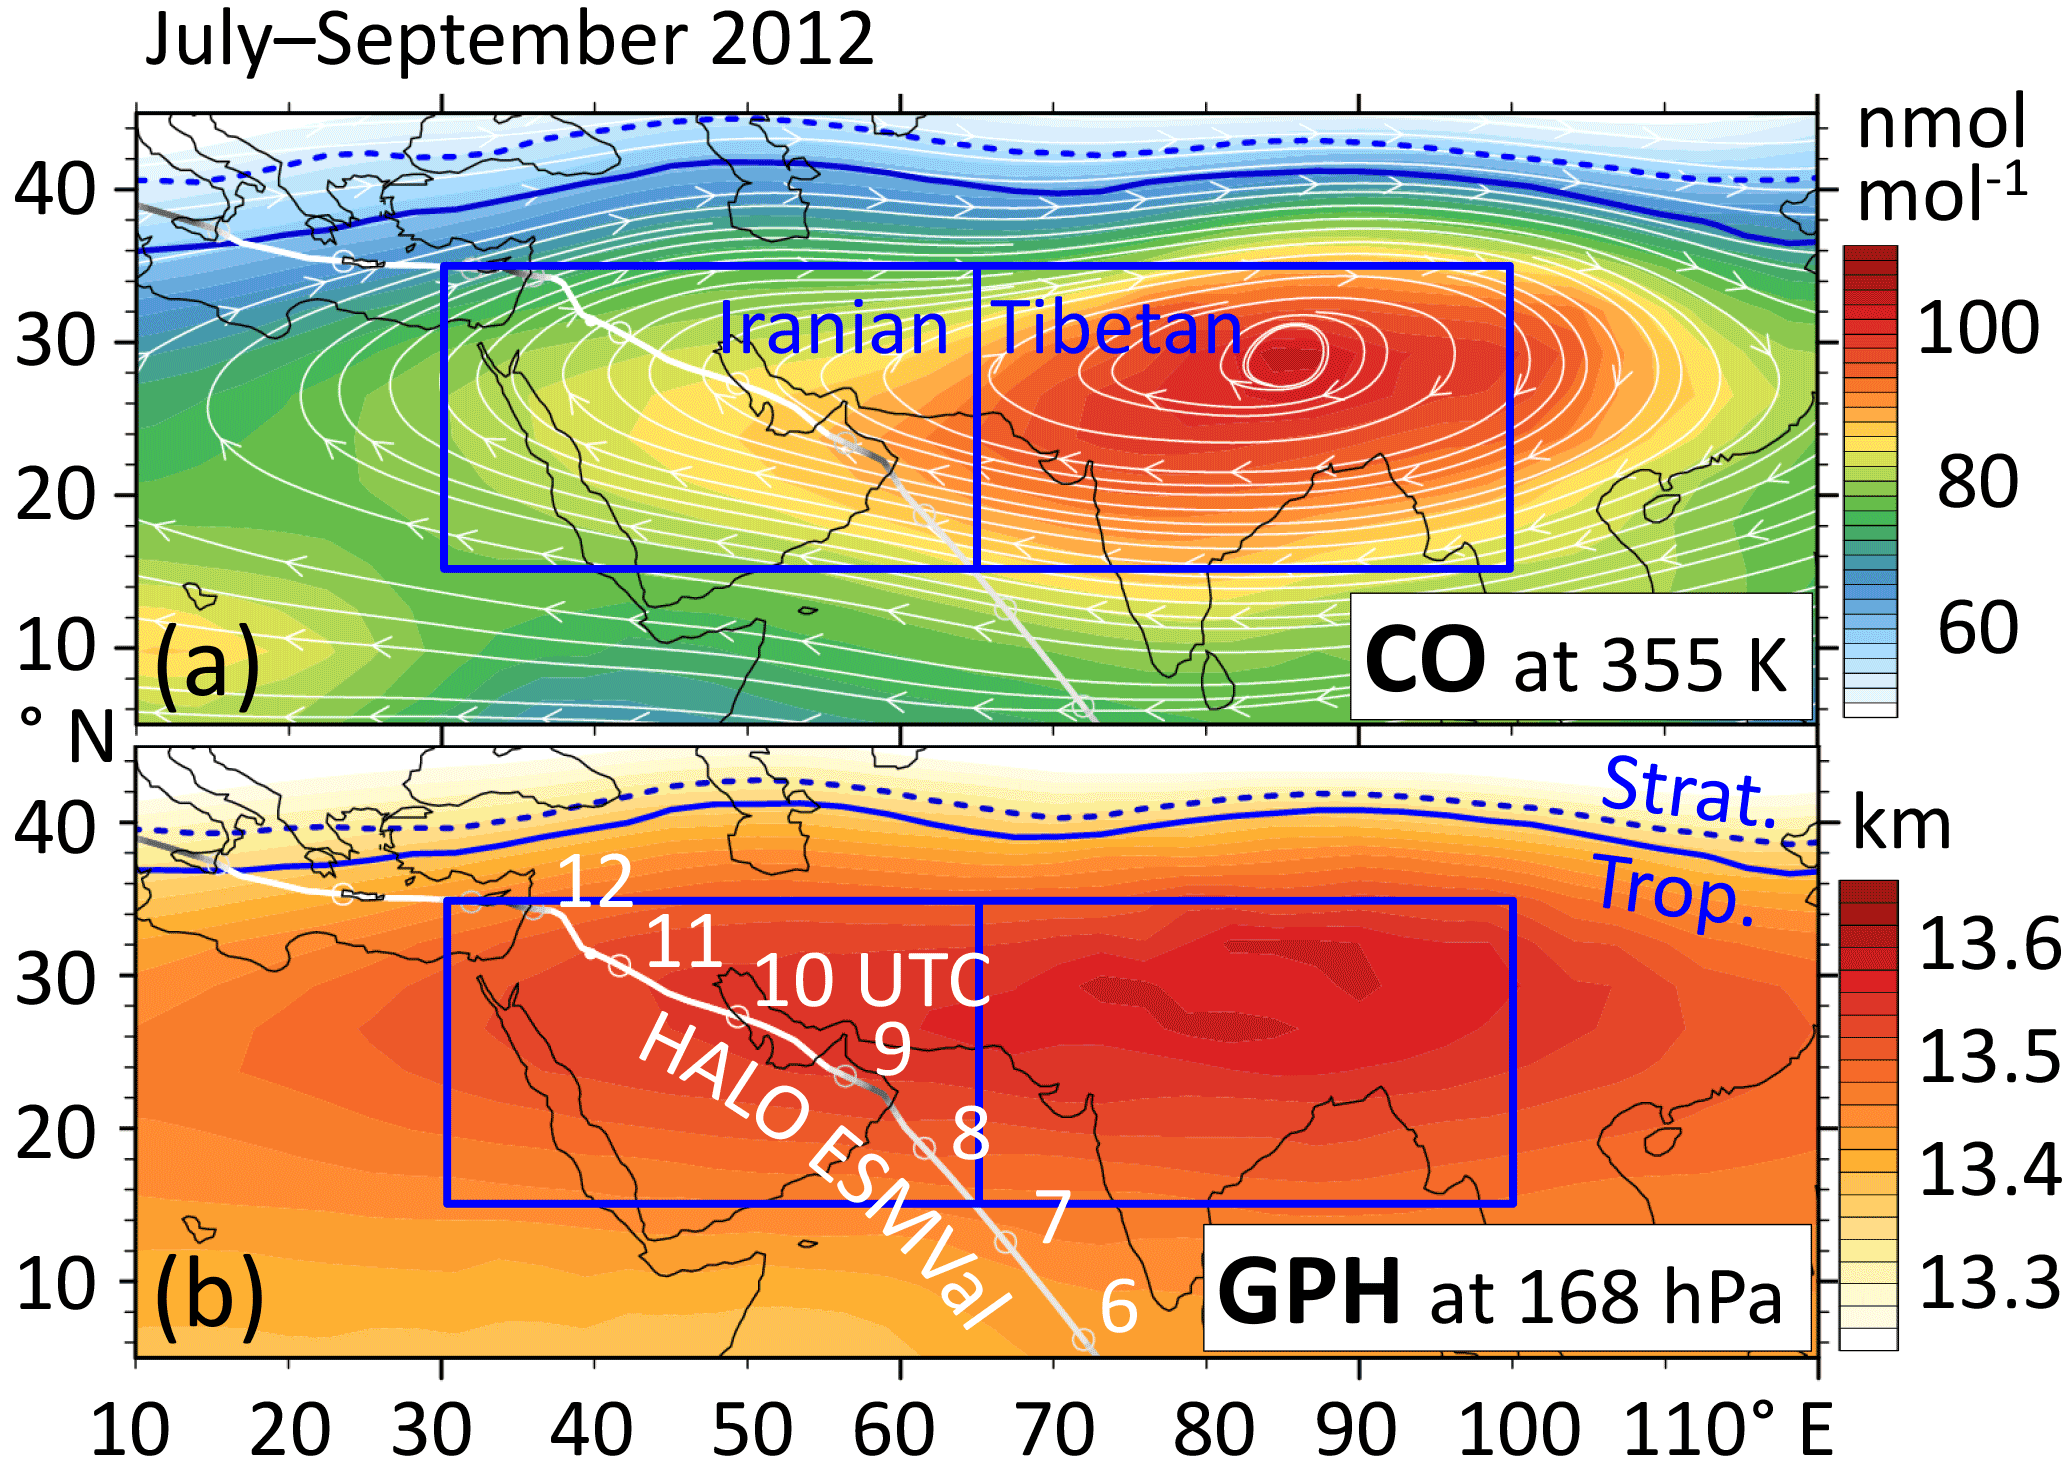
Figure 2CO mixing ratios and geopotential height (GPH) simulated by EMAC for the monsoon months of 2012. Enhanced CO is considered to be a chemical characteristic of the ASMA, and increased GPH is a dynamical proxy used to delimit the ASMA. The Iranian and Tibetan domains are used throughout the paper to discuss differences between the convectively driven eastern part and the western part that is mainly controlled by UT transport. The Iranian region was traversed by the HALO ESMVal campaign during a flight from Male (Maldives) to Larnaca (Cyprus) on 18 September 2012. Beads show the HALO positions at full UTC hours, and the chosen isentropic (a) or pressure (b) levels roughly correspond to UT flight sections.
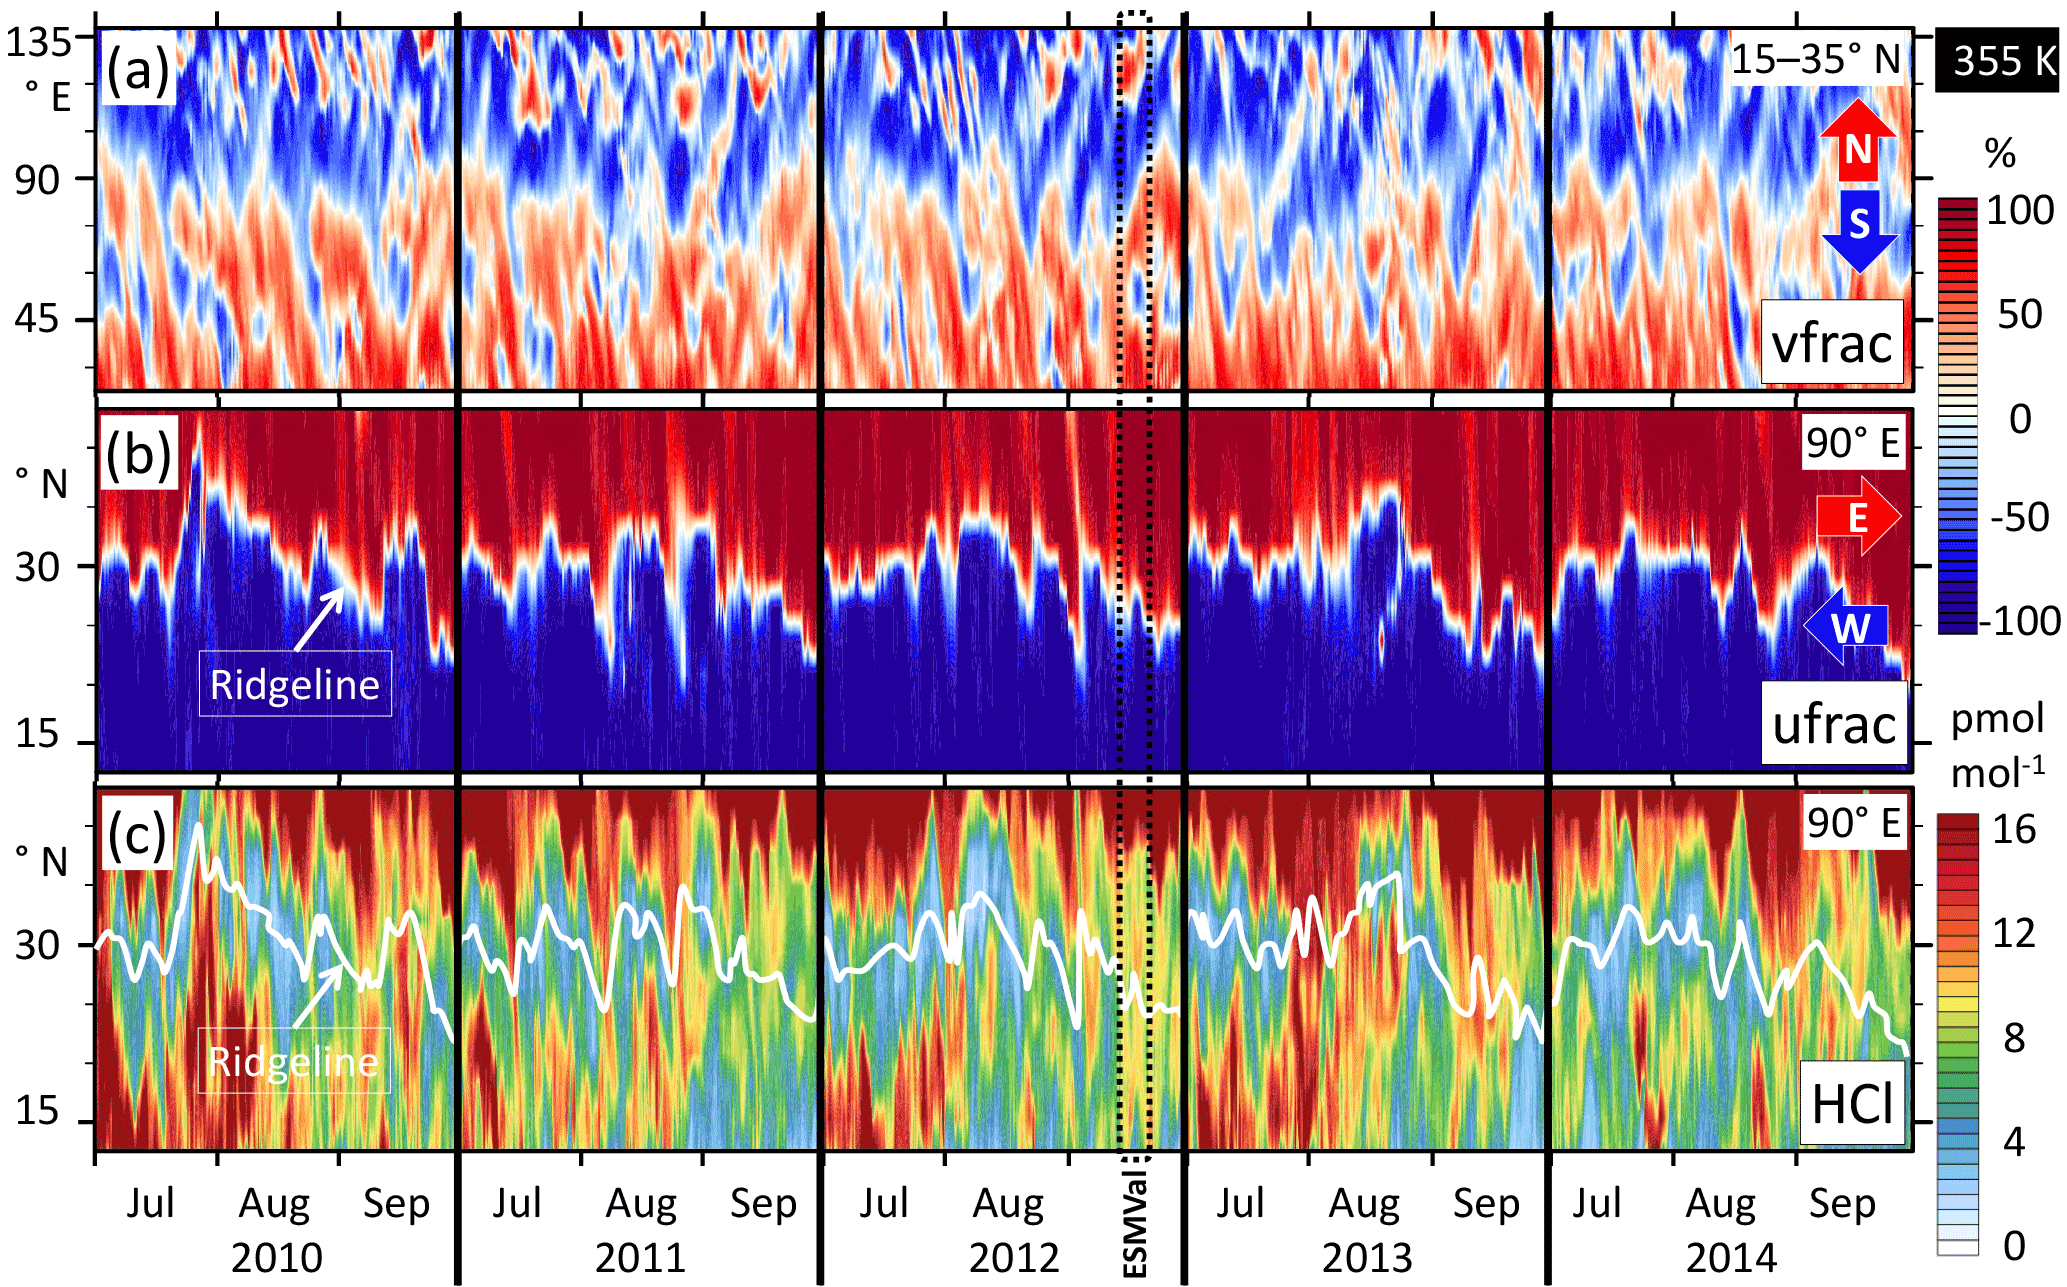
Figure 3Exploratory analyses of the frequency of occurrence of (i) dynamical instabilities of the ASMA and (ii) transport of TL air in the free troposphere along the southern ASMA fringe. All panels show 10-hourly EMAC simulation results at the 355 K isentropic level, for the summer monsoon months in the ASMA region. (a) Meridional wind fraction (calculated as , with meridional velocity v and zonal velocity u) along a wide zonal transect, averaged with dry grid-cell mass weighting at each longitude from 15 to 35∘ N. Blue shades indicate southward and red shades northward winds. Each red–blue pair (from west to east) at a given time marks an anticyclone or a smaller eddy. (b) As in panel (a), but for zonal wind fraction () along a meridional transect at 90∘ E. Blue shades indicate westward and red indicates eastward winds. (c) Time evolution of HCl mixing ratios. At any given time, locally increased HCl south of the ridgeline is a proxy for air from the TL or the stratosphere.
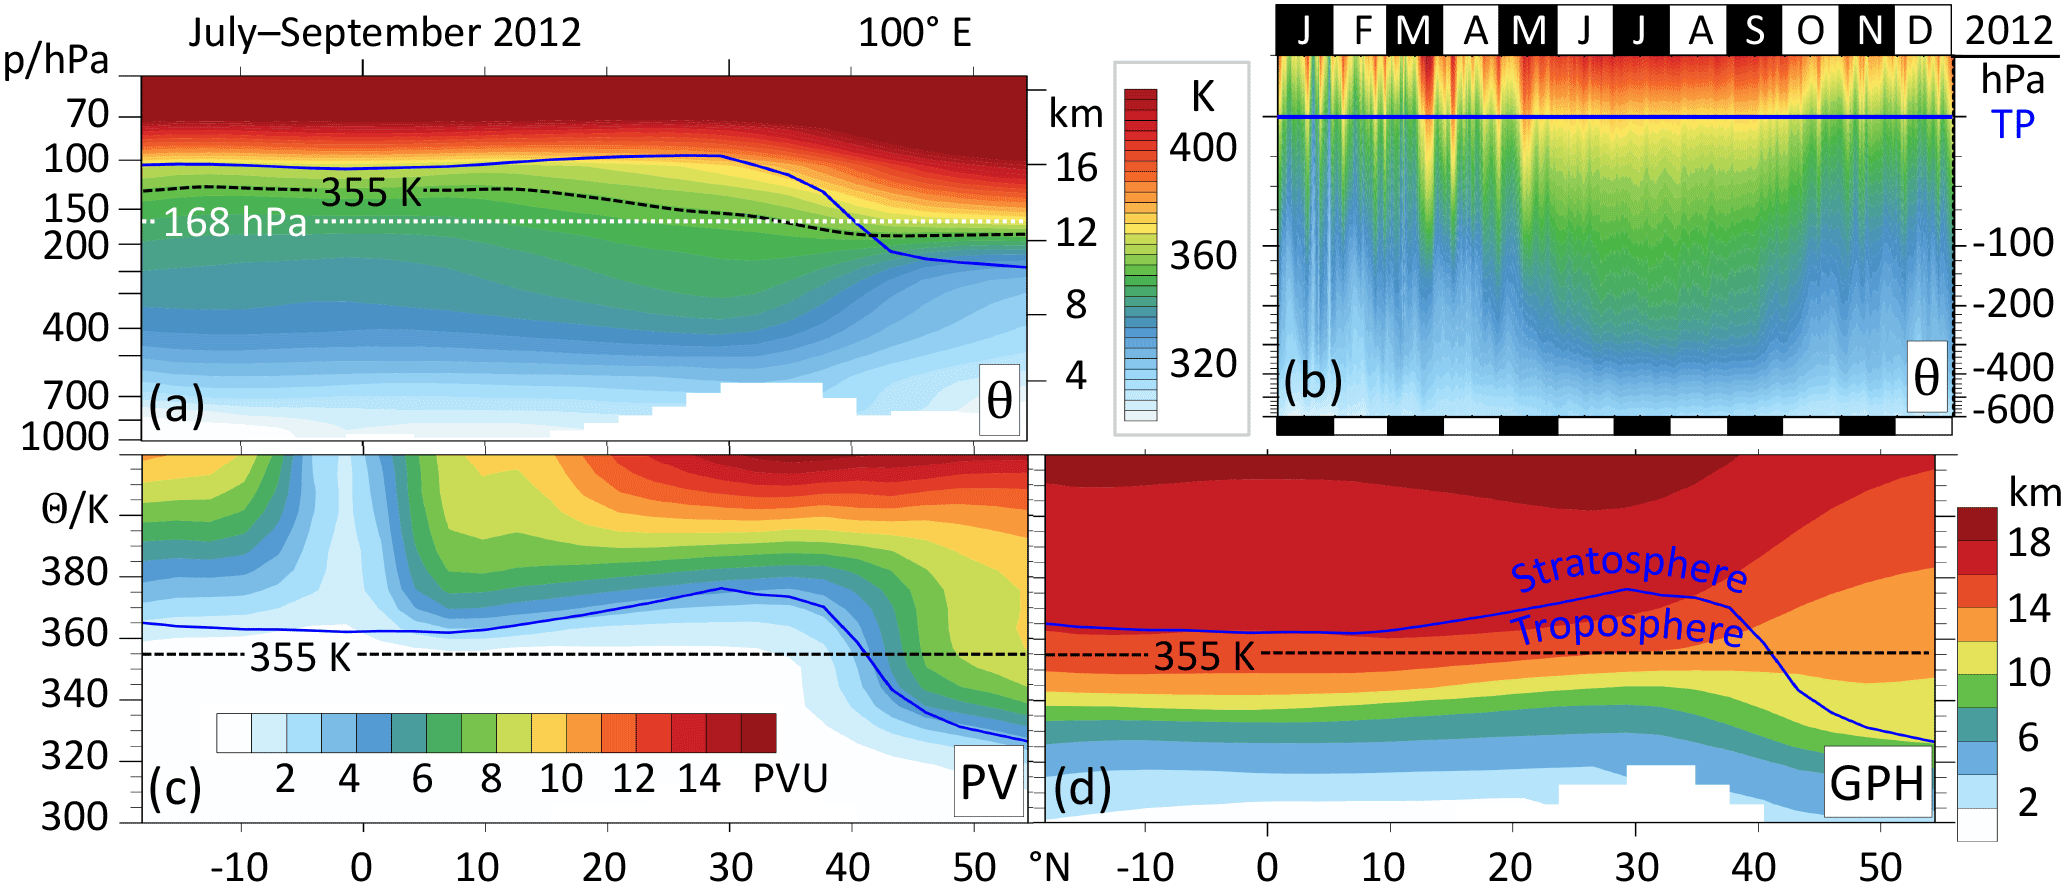
Figure 4EMAC-simulated relations between different parameters of the stratification of the atmosphere in the Tibetan region. Potential temperature (θ), potential vorticity (PV) and geopotential height (GPH) in vertical cross sections at 100∘ E. The levels of θ = 355 K and p = 168 hPa are chosen for horizontal slices in the paper. Panels (a), (c), (d) show time averages for the monsoon months of 2012. Panel (b) shows the evolution of θ profiles (grid-cell dry air mass weighted averages from 15–35∘ N, 65–100∘ E) throughout 2012 in pressure coordinates relative to the tropopause (TP). Note the steeply inclining TP over the Tibetan plateau, which marks the transition from the extratropics (dominated by baroclinic wave activity and downward stratospheric circulation) to the tropics (dominated by radiative-convective balance and upward stratospheric circulation). Heating of the Tibetan plateau in summer brings UT isentropes closer to the surface (panel b), leading to intersections between the inclined TP and a range of isentropes (panel a).
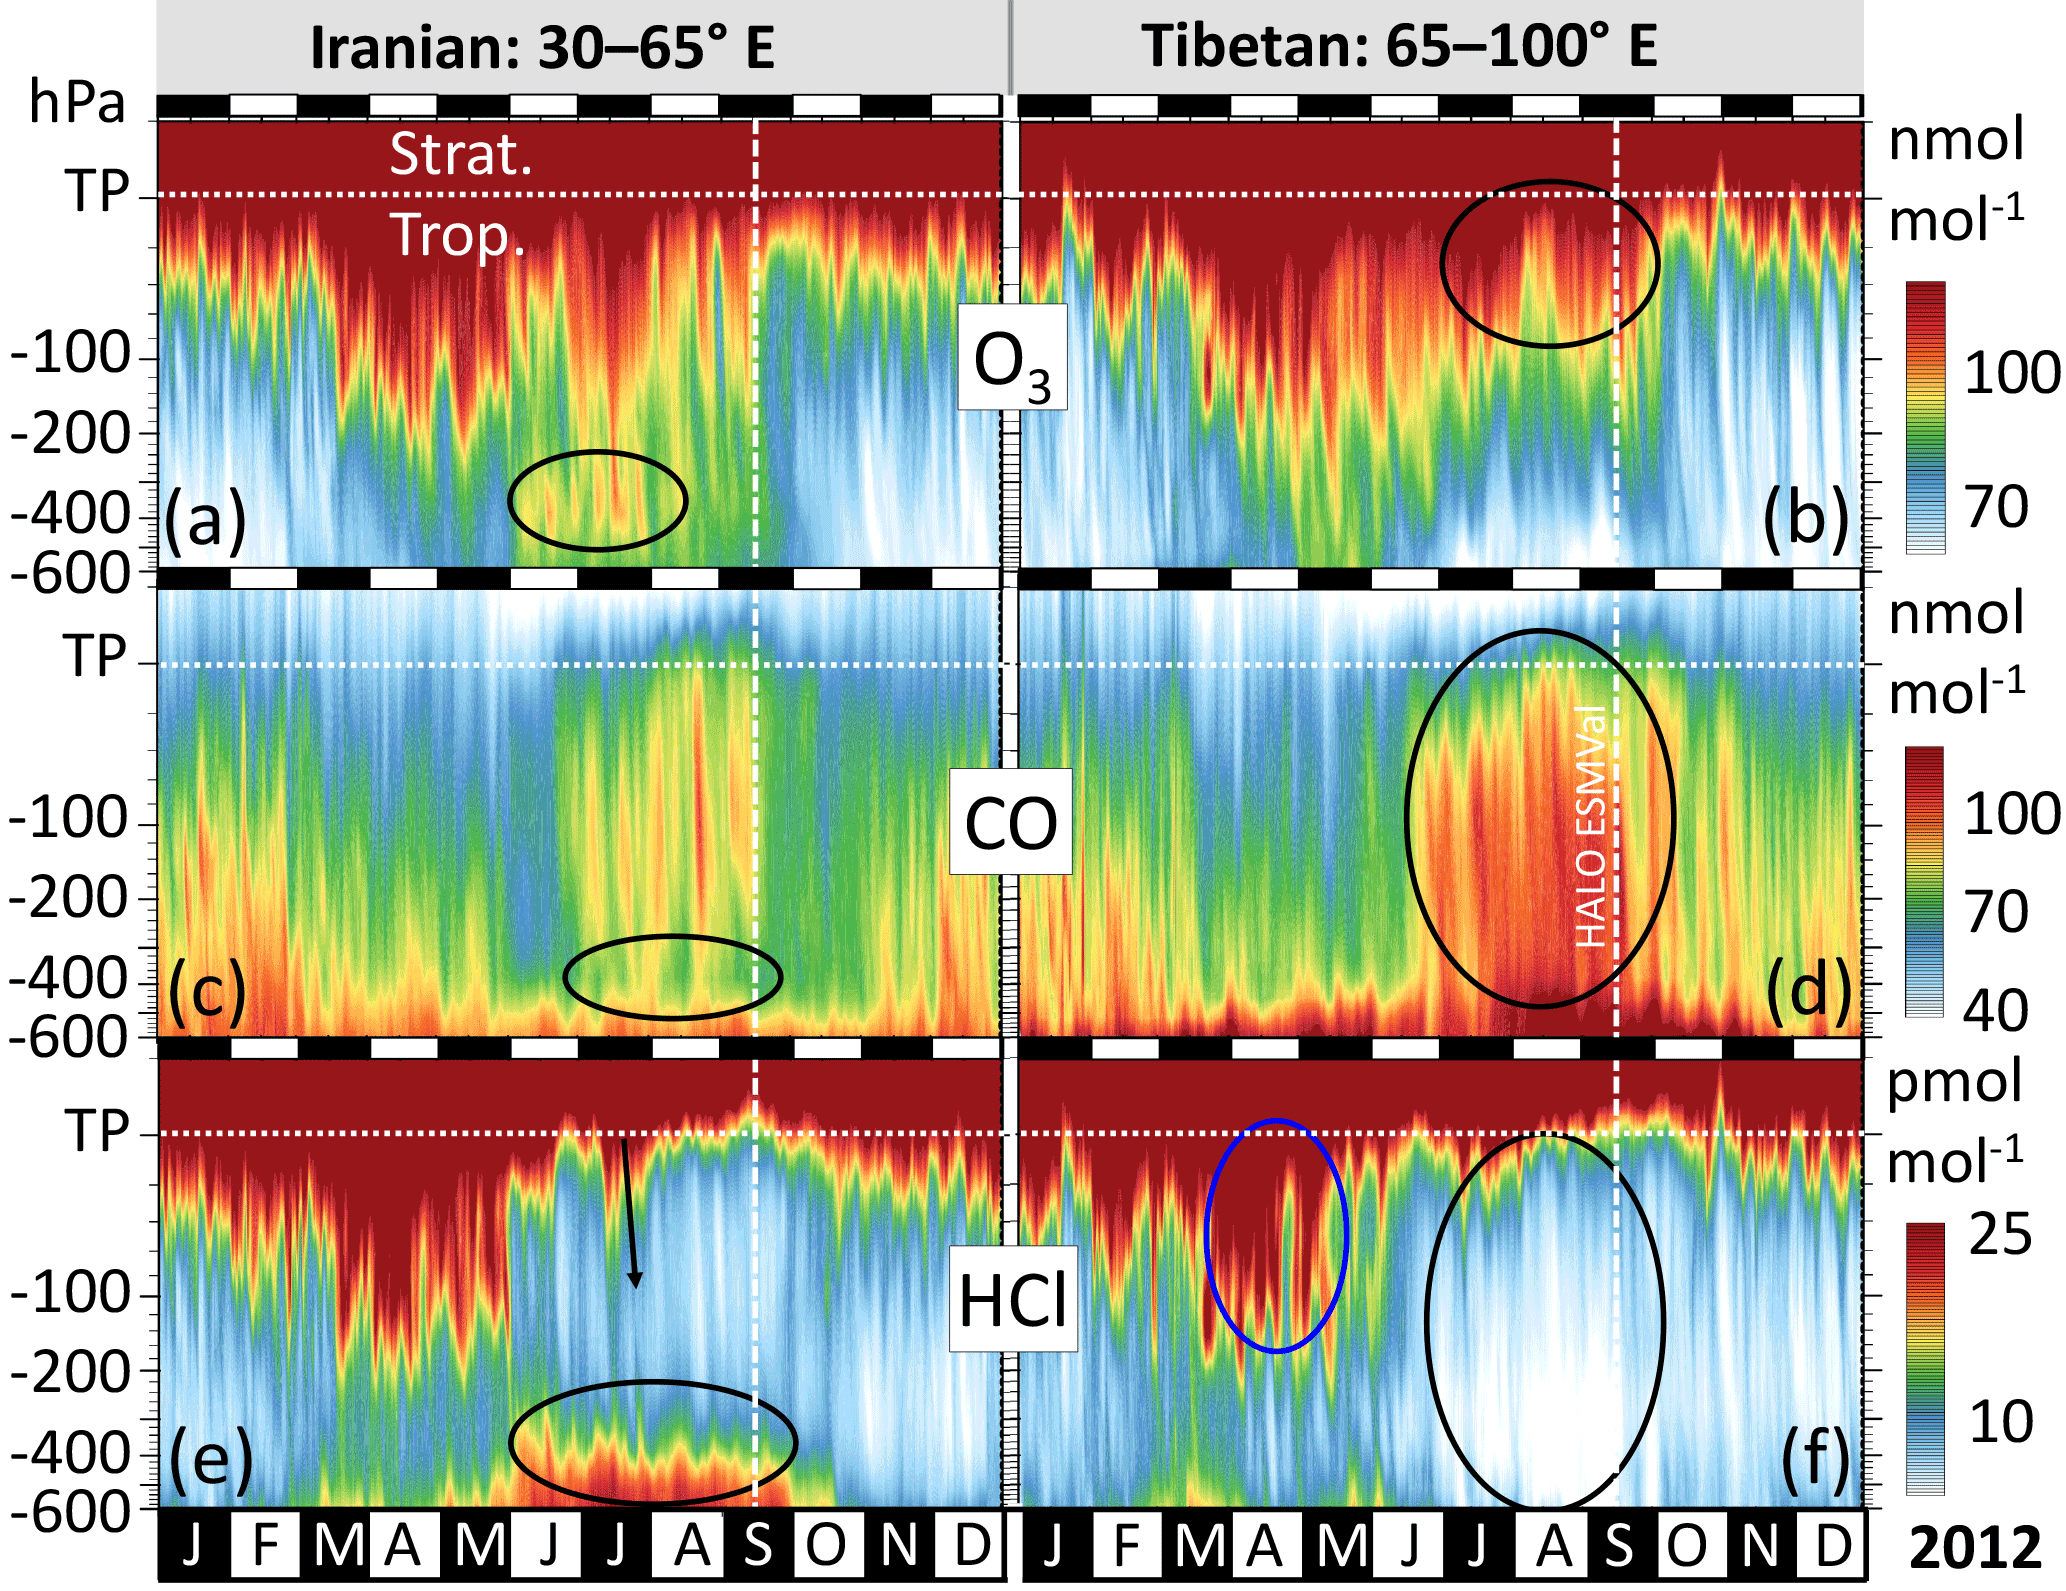
Figure 5Evolution of simulated trace gas profiles in the western and eastern ASMA regions throughout 2012. The time of the HALO ESMVal measurements is indicated by a dashed line. Vertical coordinates are given as pressure distance to the tropopause (TP), whose altitude depends on time and location. All values are grid-cell dry air mass weighted averages from 15 to 35∘ N (see Fig. 2). Marked features are discussed in the text.
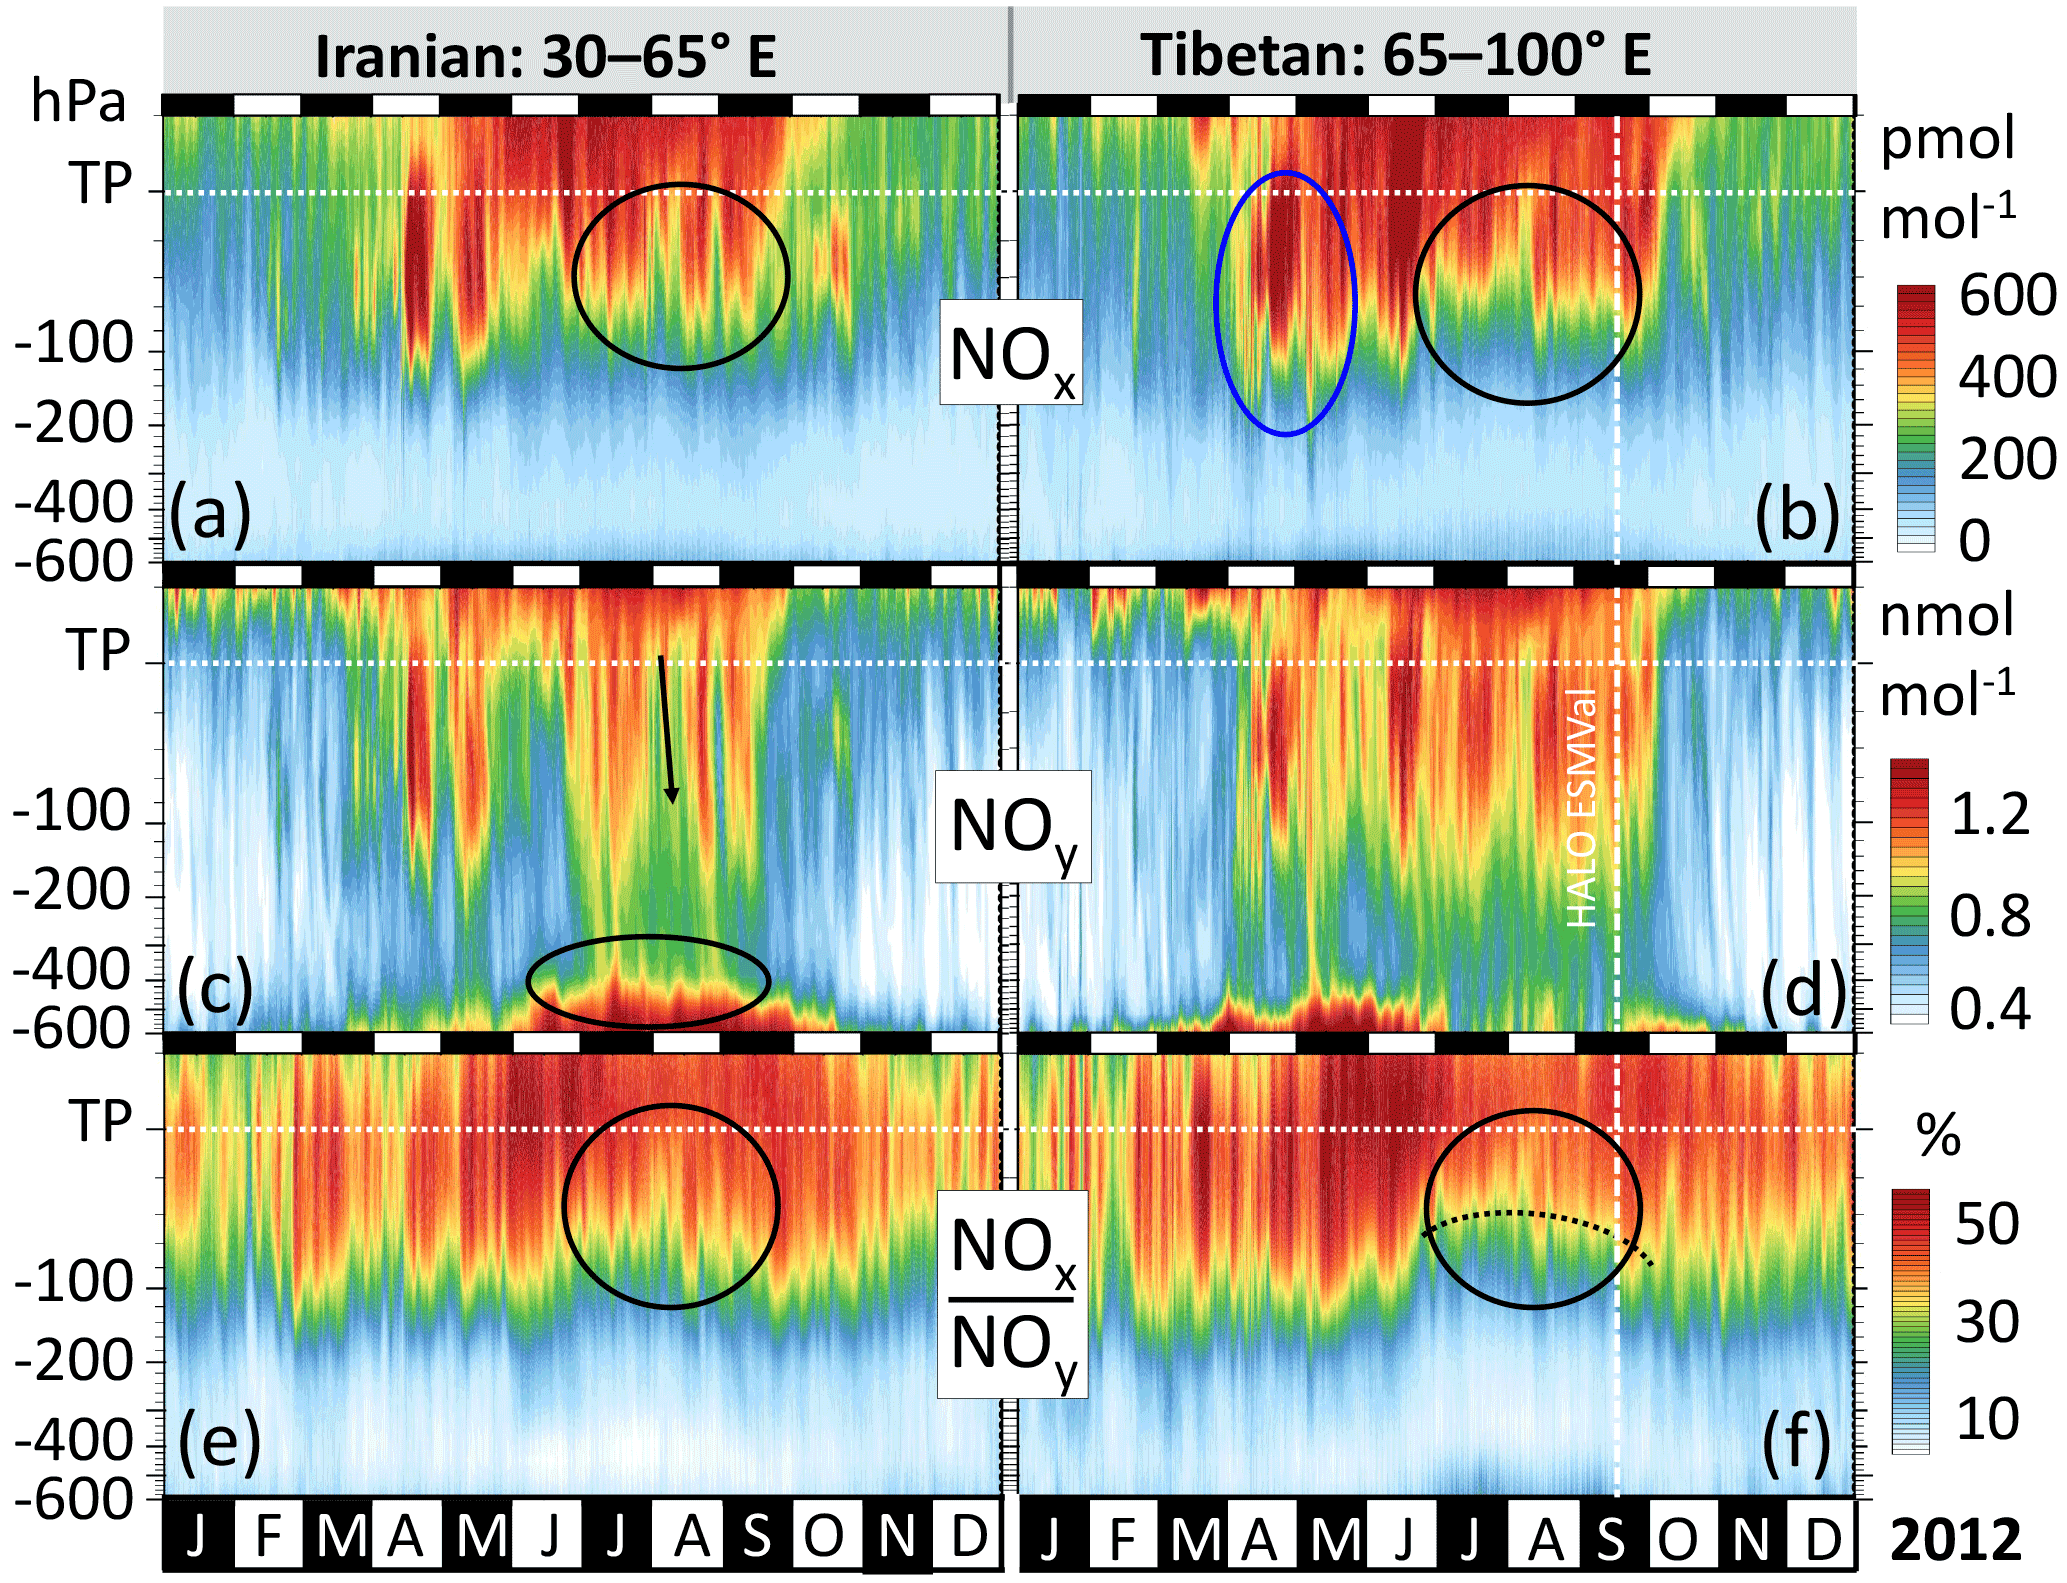
Figure 6As in Fig. 5, but focusing on reactive nitrogen. Examples of individual profiles from panels (c) and (d) are given in the Supplement.
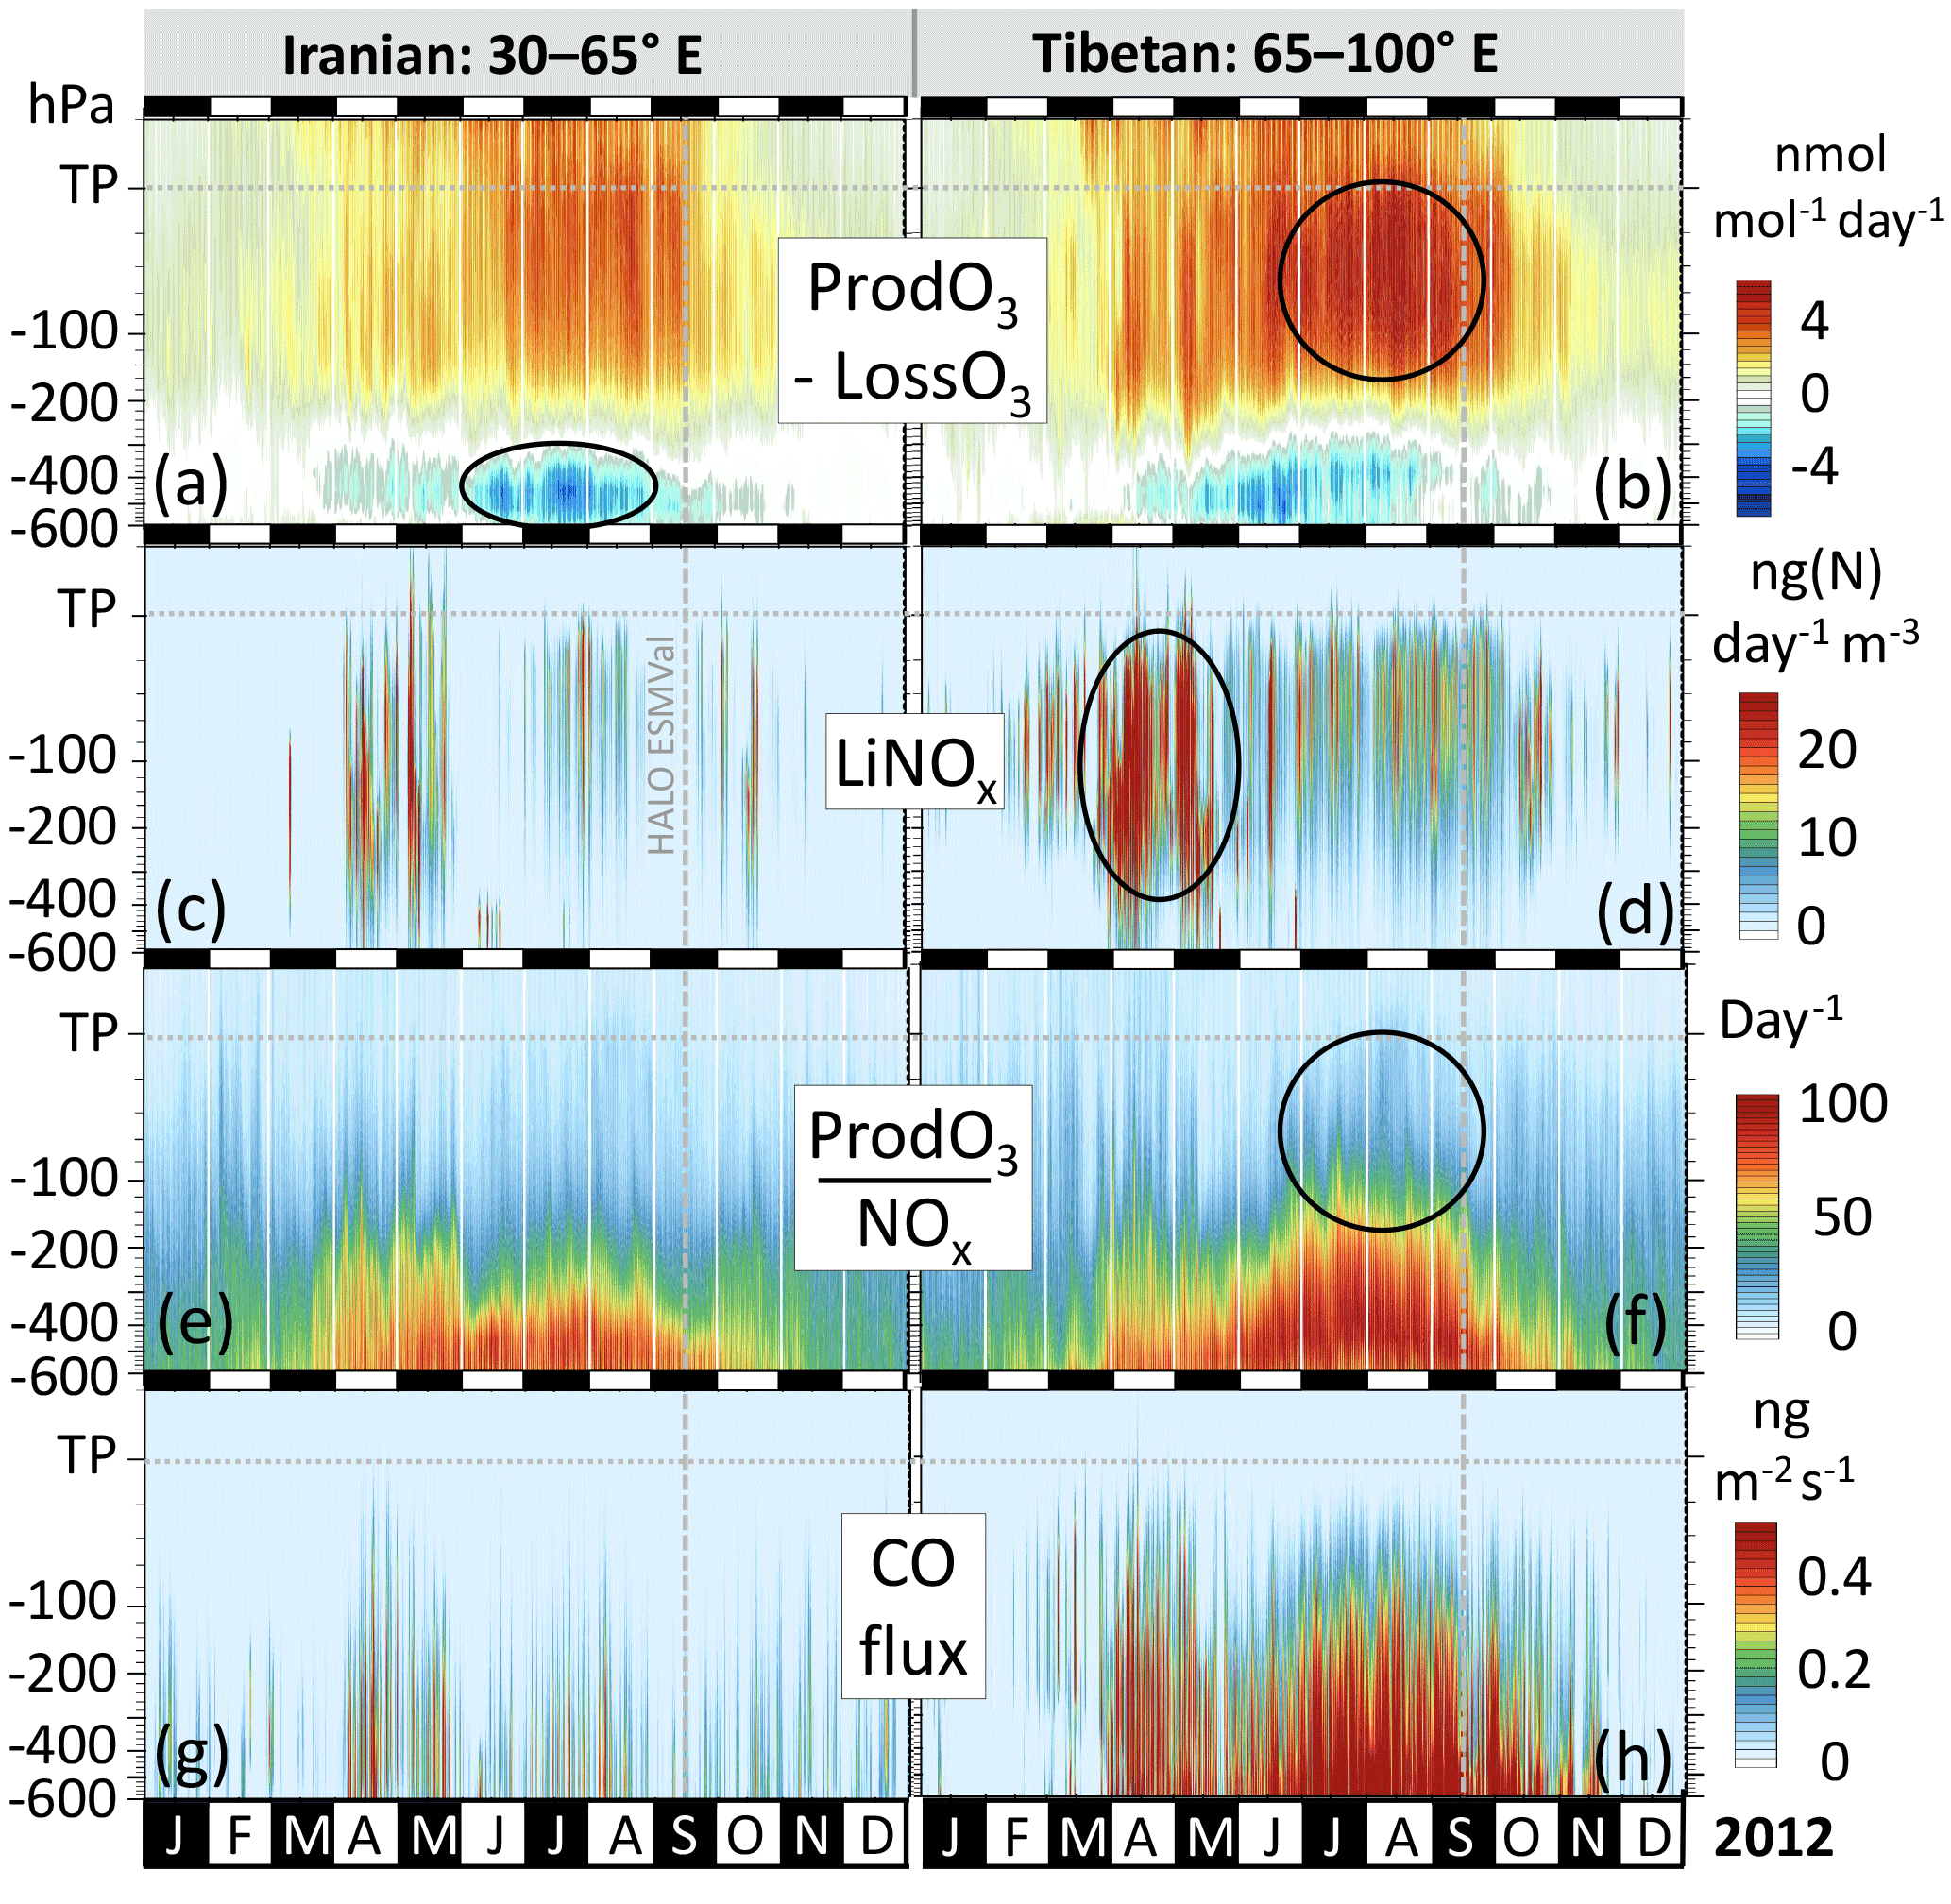
Figure 7As in Fig. 5, but for different parameters related to net photochemical O3 production (ProdO3 − LossO3). Lightning NOx (LiNOx) emissions in the model are determined by parameterisations for convection, lightning and NOx emissions per flash. CO flux reflects the concurrence of deep convective mass flux and CO mixing ratio, but as a simple product neither account for entrainment and detrainment of convection. Panels (e) and (f) highlight the non-linear dependence of O3 production on NOx mixing ratios. Strong gradients indicate the transition between NOx-limited and NOx-saturated photochemical regimes, but are superimposed by the effects of other O3 precursors. Individual profiles from panels (a) and (b) are shown in the Supplement.
The regions' delimitations (Fig. 2) for separate analyses of the different parts were chosen visually, considering the following: (i) to put the measurements into perspective, the regions shall capture the synoptic situation during the HALO ESMVal campaign; (ii) both parts shall be equally sized; (iii) the variability of the ASMA's location and extent shall be covered. The chosen meridional range of 15 to 35∘ N covers the simulated ASMA ridgeline for most of the monsoon season (shown in Fig. 3b). The zonal ranges are 30 to 65 and 65 to 100∘ E for the Iranian and Tibetan regions, respectively. For comparison, Yan et al. (2011) classified anticyclonic centres between 50 and 67.5∘ E in Iranian mode, and between 80 and 92.5∘ E in Tibetan mode.
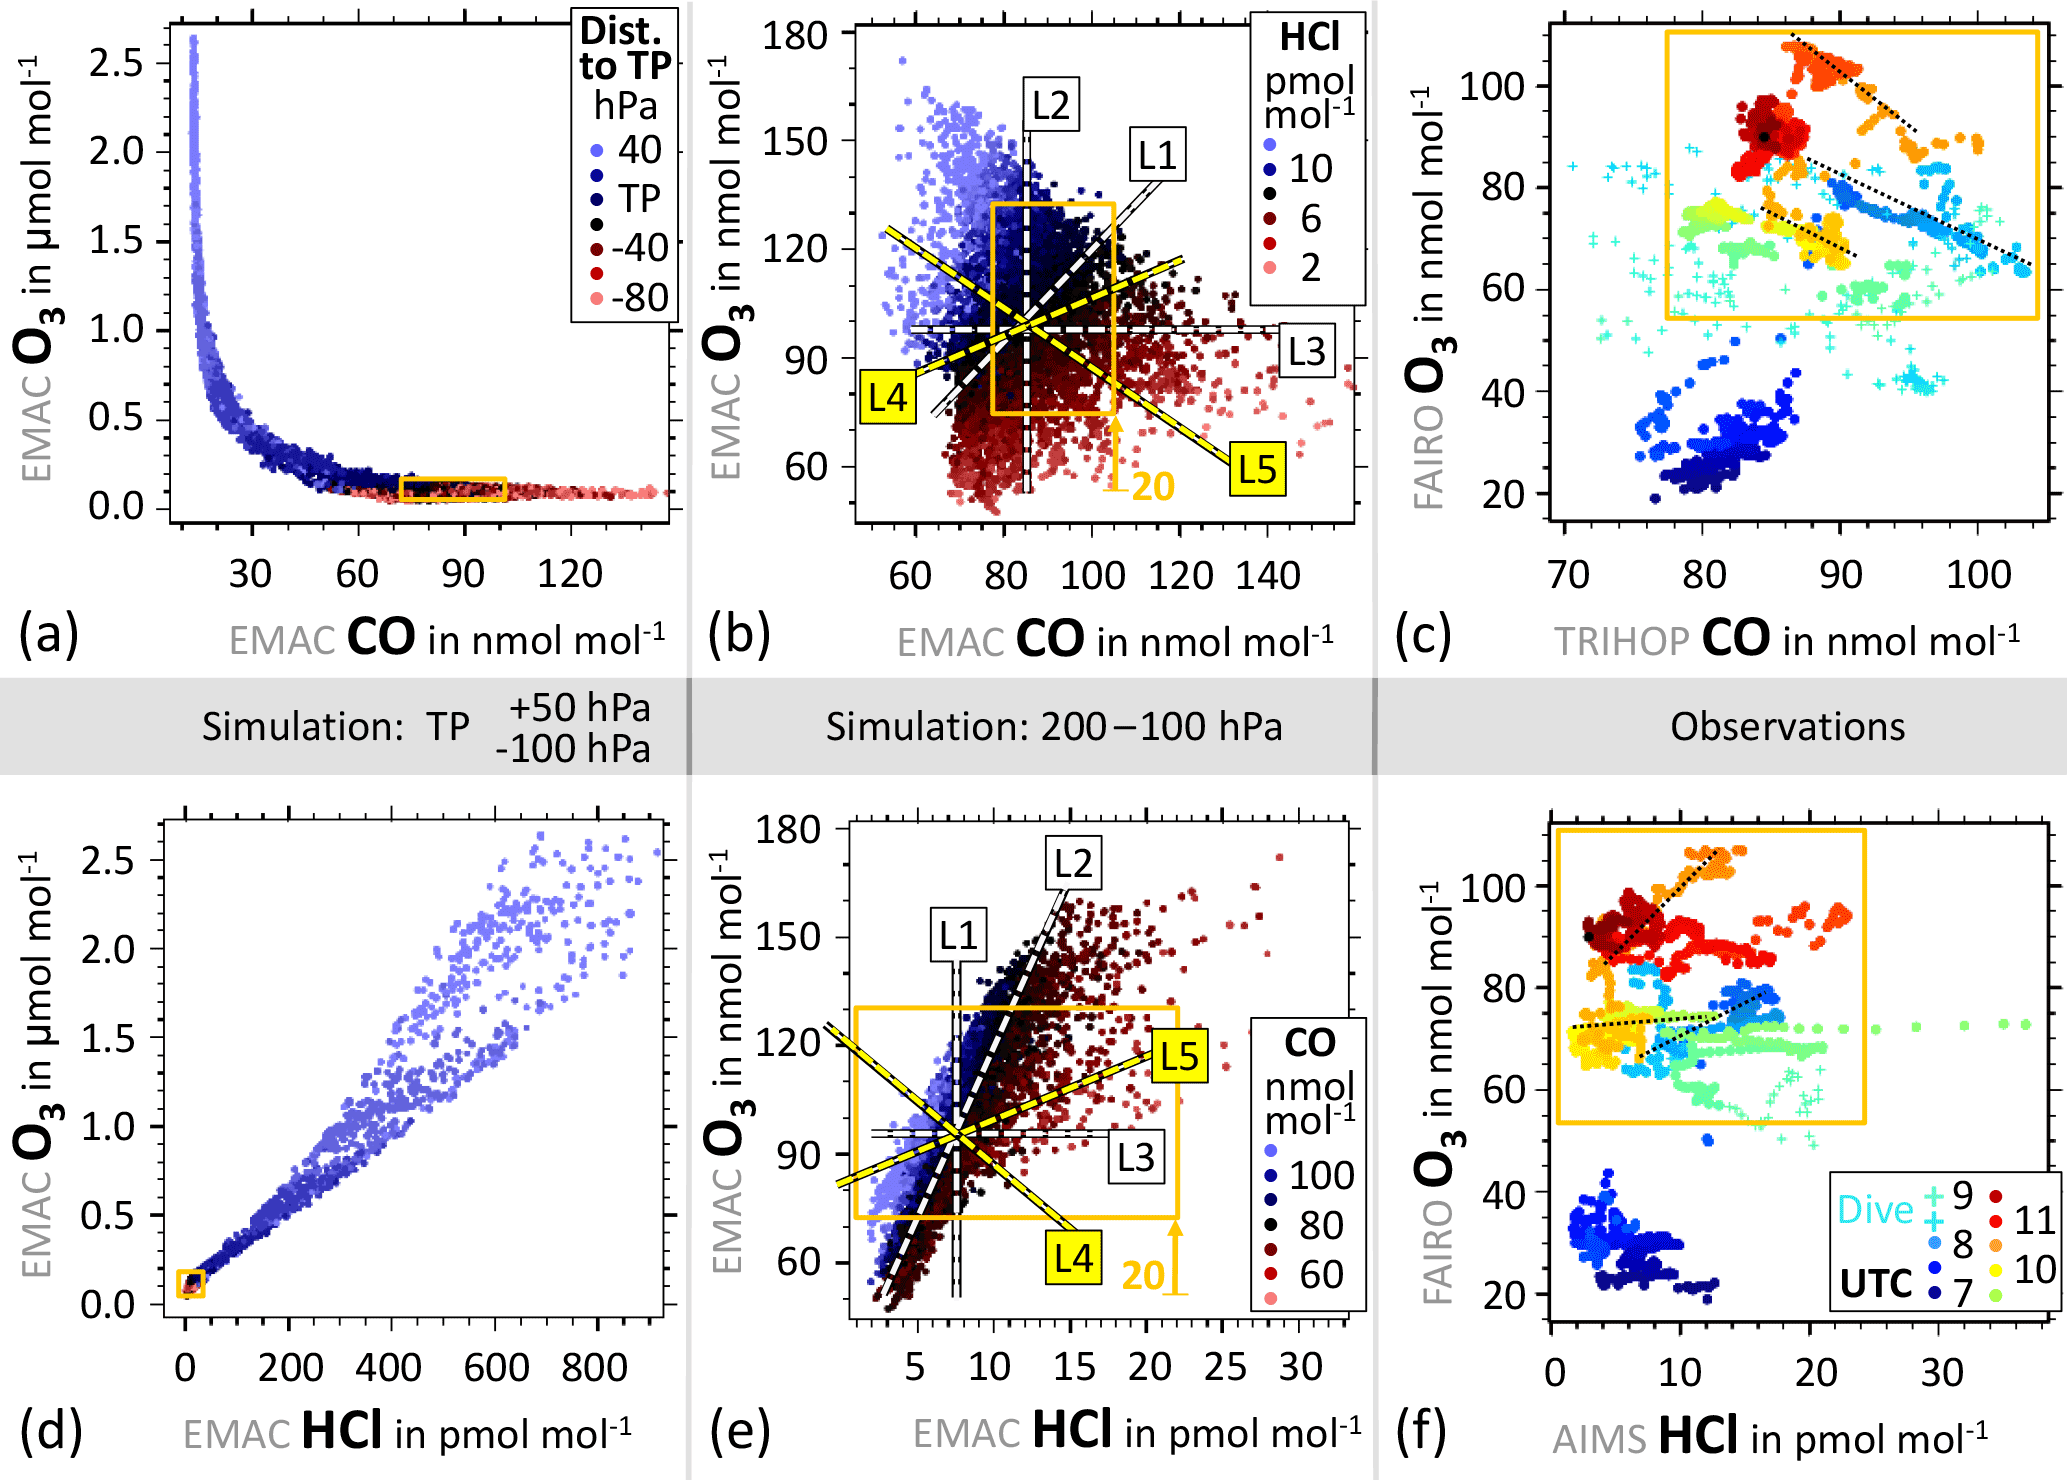
Figure 8Tracer–tracer relations simulated by EMAC for the whole of September 2012 in the ASMA region and observed by HALO during the HALO ESMVal campaign on 18 September 2012. (a, d) Simulated samples from the region 15–35∘ N, 30–100∘ E. Colour coding corresponds to the pressure distance to the tropopause, from 100 hPa below to 50 hPa above. (b, e) Simulated tracer mixing ratios from the same region, but limited to tropospheric cells in the pressure altitude range 200–100 hPa. Colour coding indicates corresponding mixing ratios of HCl. See text for details of hypothetic lines L1–L5. (c, f) Observed tracer mixing ratios of the HALO flight from Male to Larnaca (without initial and final stages). Colours correspond to the UTC time of measurement, also indicating spatial proximity. The orange boxes show the ranges covered by the measurements from within the ASMA.
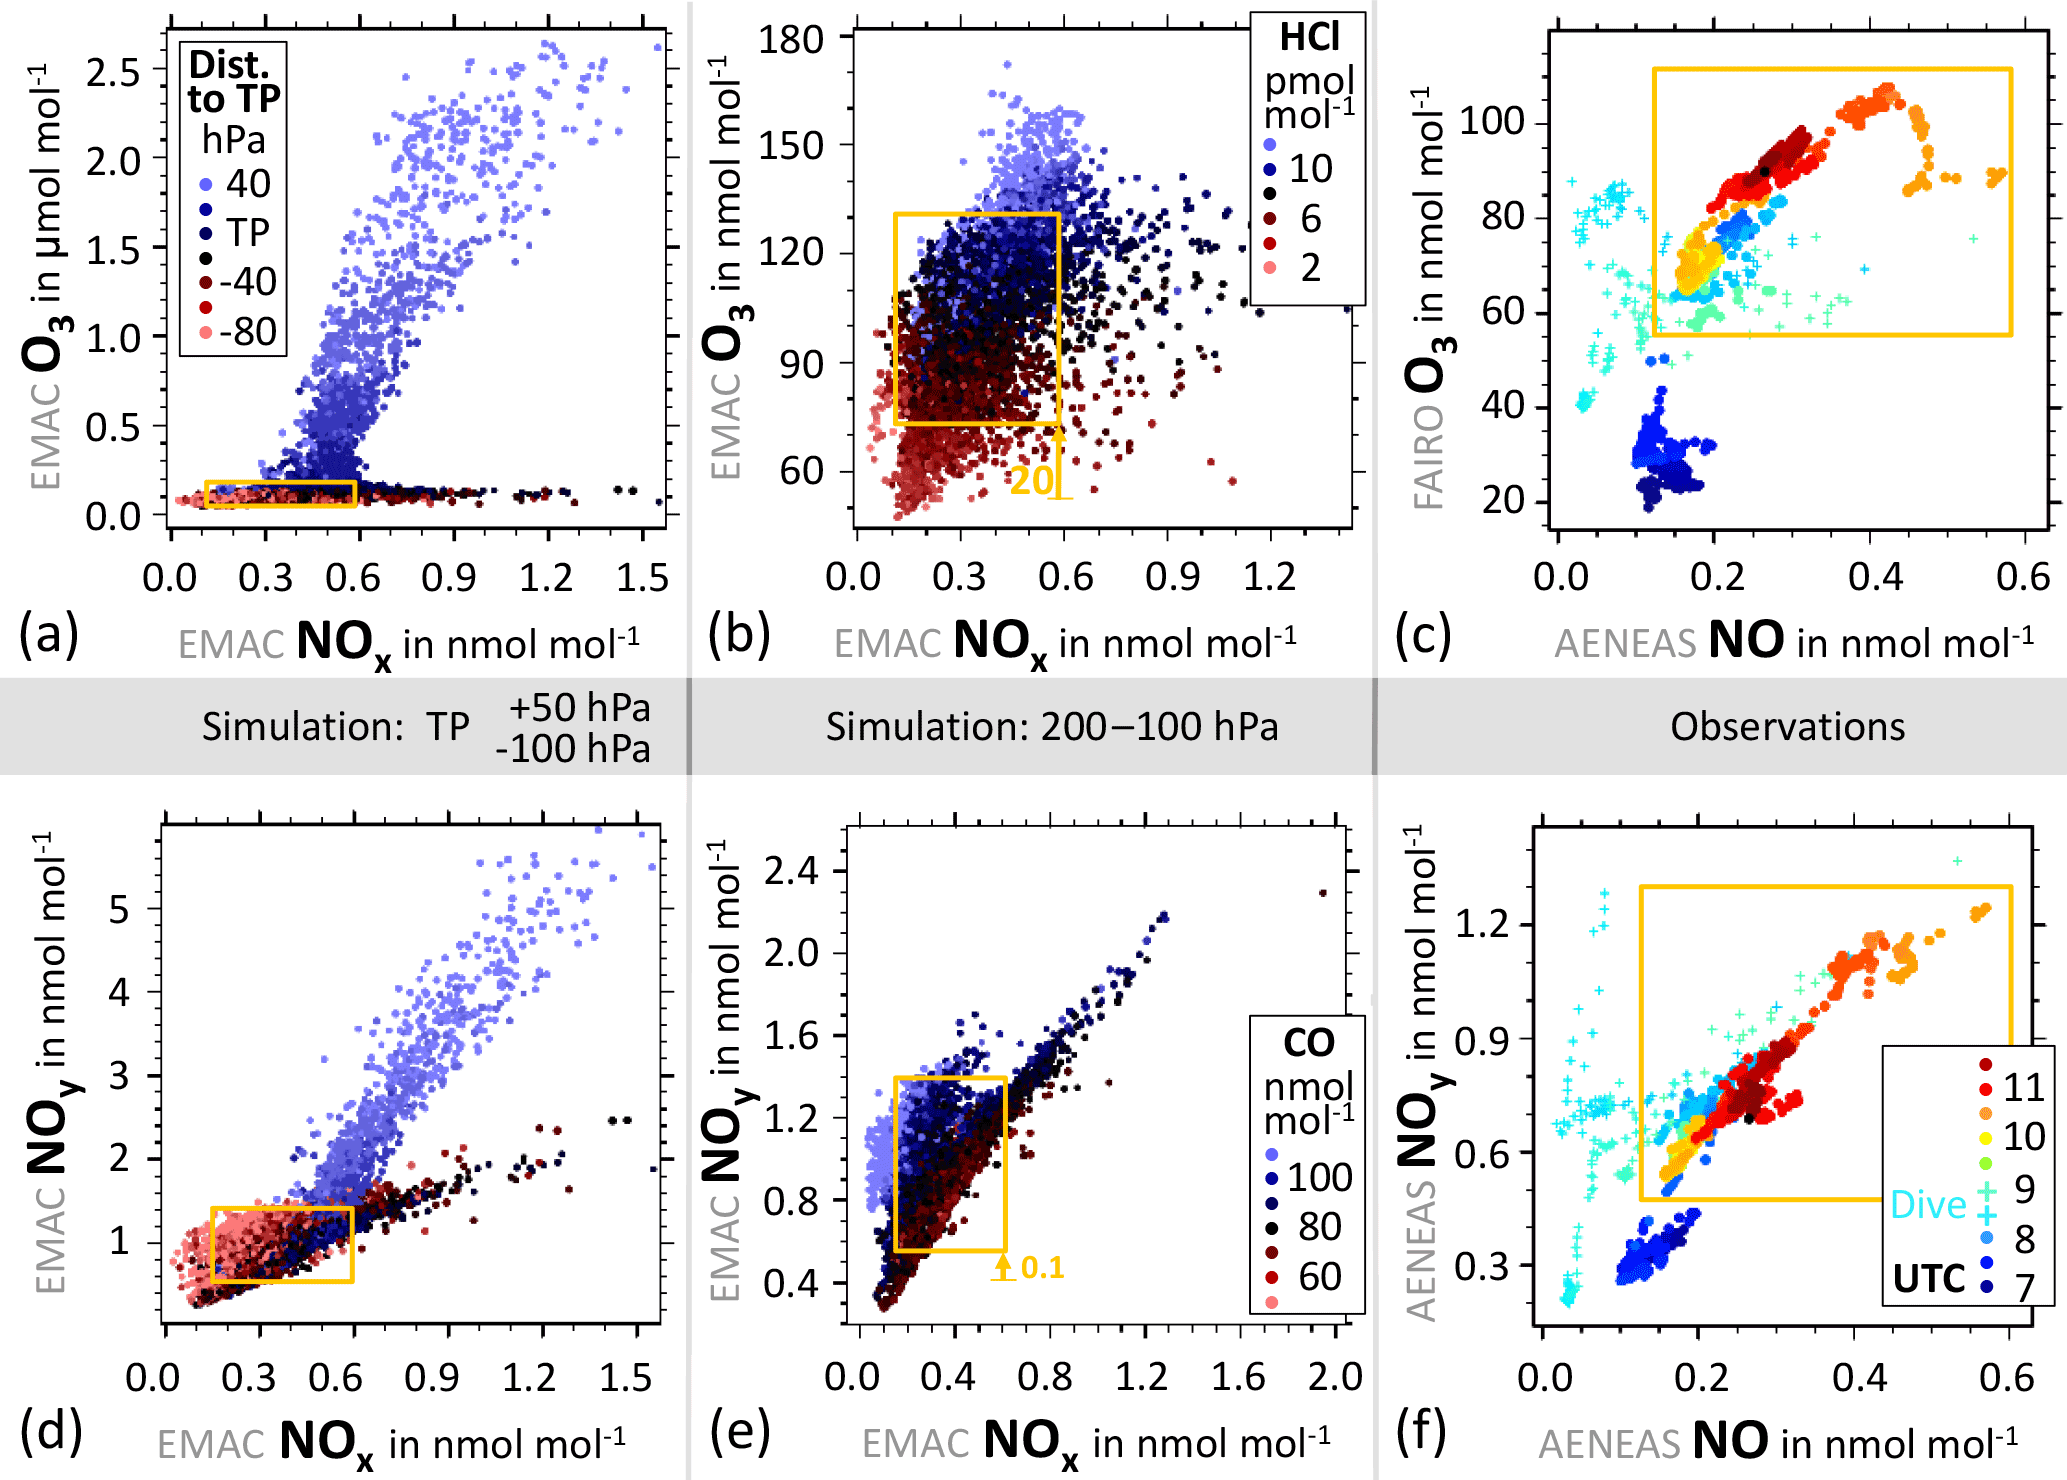
Figure 9As in Fig. 8, but focusing on reactive nitrogen. Panels (c) and (f) show NO instead of NOx, because only NO was measured. In the daytime, i.e. at the time of the measurements, NO is good proxy for NOx. The legend from panel (a) also applies to (d), and the legend from (f) applies to (c).
We decided not to adapt the regions dynamically to the actual ASMA, because the boundary definitions we are aware of (Ploeger et al., 2015; Barret et al., 2016; Pan et al., 2016) emphasise the concept of a closed ASMA volume or transport barriers on monthly or seasonal timescales. However, the ASMA boundaries are not always well defined, particularly during transitions between different dynamical modes. Our pre-fixed regions allow an unbiased view on the effects of complex, 10-hourly dynamics. This comes at the price that features from outside the ASMA might contribute to the analyses occasionally. We cannot rule out that concurrent but geographically distinct features feign correlations between different species, but monsoon-related features should mostly dominate the lateral averages in the chosen regions. Our approach detects differences between Iranian and Tibetan parts, because the corresponding circulation is tied to the geographical features of these regions. Enhanced CO is considered to be a chemical characteristic of the ASMA (Pan et al., 2016), and increased geopotential height (GPH) is a dynamical proxy (Barret et al., 2016). Simulated seasonal mean distributions of both proxies indicate that our regions capture the ASMA of 2012 well (Fig. 2).
Large-scale transport occurs mainly on isentropes, unlike convective transport. Pressure and isentropic vertical coordinates are similar in the UTLS in the tropics of the Tibetan region (Fig. 4a). In the EMAC simulation the TP has been diagnosed by a potential vorticity of 3.5 PVU in the extratropics and by the WMO definition between 30∘ N and 30∘ S (Jöckel et al., 2006). It is almost parallel to one isentrope in the tropics and to a lower one in the extratropics, but intersects isentropes around 360 K almost perpendicularly in the transition region at about 30∘ N. This facilitates isentropic in-mixing from the lower stratosphere or the TL, but only in combination with southward wind components. If winds follow the TP (e.g. subtropical jet), it is still a transport barrier. The latter aspect is relevant for stratosphere-to-troposphere trace gas gradients and is captured by coordinates relative to the TP (used for Figs. 5–7). The barrier effect of the TP is also relevant for convective transport (TP following coordinates also used for Fig. 7). Isentropic coordinates account for the seasonal evolution of potential temperature (θ, Fig. 4b) and best capture isentropic transport (used for Fig. 3, but also for the supplementary 5-year equivalents to Figs. 5–7).
The distribution of points in a tracer–tracer diagram provides hints on the origin and evolution of air masses. A short primer for the interpretation of such diagrams is provided in the Supplement.
4.1 Selected tracers
Here we focus on CO versus O3 and HCl versus O3 (Fig. 8) as well as on NOx versus O3 and NOx versus NOy (Fig. 9).
O3 mixing ratios in the TL exhibit a strong vertical gradient, increasing from the troposphere to the stratosphere. Given a chemical lifetime of the order of weeks, this reflects the degree of mixing between O3-poor UT air and O3-rich air from the lowermost stratosphere (Sprung and Zahn, 2010). That general picture might not hold in the ASMA though, where – depending on the availability of precursors – enhanced photochemical O3 production is superimposed on isentropic in-mixing from the stratosphere.
Enhanced CO is a tracer of boundary layer pollution and an O3 precursor in the troposphere. Oxidation with the hydroxyl radical (OH) prevails under stratospheric conditions, and CO mixing ratios decrease by about an order of magnitude across the tropopause (Hoor et al., 2002).
As a tracer for stratospheric air we use HCl (Marcy et al., 2004; Park et al., 2008), which in the UT has no significant photochemical sources but has a lifetime similar to O3. Wet scavenging in clouds effectively prevents convective transport of HCl to the UT, and no injections of HCl from volcanic activity affected the ESMVal flight from Male to Larnaca. Together this makes HCl a viable tracer of stratospheric O3 entrainments, until it is selectively removed by wet scavenging.
NOx (NO + NO2) is an O3 precursor and part of NOy. NOx primarily characterises fresh emissions. Only NO was measured during the HALO ESMVal campaign, but daytime NO is a good proxy for NOx in the UT (Seinfeld and Pandis, 2006). In the UTLS, enhanced NOy originates both from tropospheric and stratospheric sources. Thus it is not a viable tracer for stratospheric air on its own. In the lower troposphere odd nitrogen species are co-emitted with carbon monoxide in combustion processes. Lightning and aircraft emissions are sources in the UT. Photolysis of N2O peaks at about 30 km and is the principal source of NOx in the stratosphere, resulting in increasing mixing ratios of NOx and NOy above the TP (Seinfeld and Pandis, 2006).
4.2 Ranges covered by observed and simulated tracer–tracer distributions
In order to place the observed tracer–tracer relations into context, we plot the measured samples together with grid-cell samples from the EMAC simulation. Simulation output along the flight track is too sparse for a meaningful comparison (10 s resolution of measurements versus 12 min for the simulation). Therefore 5000 simulated samples per panel are chosen randomly, from the entire month of September 2012 and from throughout the ASMA region (Fig. 2: Tibetan and Iranian parts). Plotting all corresponding samples from the EMAC simulation would impair the visibility of clustering. Two different vertical ranges are chosen. The range from 50 above the TP to 100 hPa below it in the actual EMAC tropopause (Fig. 8a, d) provides a zoomed-out view of possible tropospheric and stratospheric tracer mixing ratios and tracer–tracer relations for the time of year and region of the measurements. Zooming-in to the altitude range of measurements, we choose tropospheric tracers from the pressure altitude range 200 to 100 hPa (Fig. 8b, e). The observations from the entire flight without ascent and descent are shown in (Fig. 8c, f).
Measurements south of the ASMA are marked by dark-blue dots in Fig. 8c, f and are clearly distinct from the measurements in the ASMA filament (orange boxes). The ranges covered by the measurements are also given in the corresponding panels with simulated data, but are adjusted for model biases there. Those biases were estimated according to visual comparisons of measured versus simulated trace gas mixing ratios along the flight track in the ASMA filament (shown in the accompanying paper). All measured ranges fit into the simulated monthly averages for September 2012 in the ASMA region; thus the simulation captures this aspect well and the measurements are unlikely to represent an exceptional situation. We also note that all measurements clearly fall into the tropospheric regions of the respective simulated tracer–tracer spaces. This is no surprise: all HALO ESMVal measurements considered here were taken well within the troposphere.
Simulated O3 and NOx increase in the stratosphere with a higher O3 ∕ NOx ratio than in the troposphere (Fig. 9a). However, since the range covered by the HALO ESMVal measurements is just at the intersection of the stratospheric and tropospheric branches (orange box in Fig. 9a), this does not help to distinguish the stratospheric influence from tropospheric in situ production.
4.3 In situ photochemistry, tropospheric and TL contributions
The colour code of the observations (Fig. 8c, f) corresponds to measurement time. Similar colours indicate spatial and temporal proximity, a prerequisite for mixing lines. Schematic lines L1–L5 (Fig. 8b, e) and their parallels indicate special, hypothetical cases for the evolution of air masses, which are discussed next.
4.3.1 CO versus O3 (Fig. 8a–c)
O3 and CO display opposite gradients across the tropopause and globally have lifetimes of several months in the UT (IPCC, 2013). Thus mixing lines in a CO versus O3 scatter plot are generally suited to identifying stirring and mixing processes in the UT that occur on timescales of days to weeks, including cross-tropopause mixing (Fischer et al., 2000). The well-known L-shape (Hoor et al., 2002; Pan et al., 2004; Müller et al., 2016) is reproduced by the simulation in the CO vs. O3 diagram for the UTLS (Fig. 8a), consisting of a CO-poor and O3-rich stratospheric branch connected by UTLS mixing lines to a CO-rich and O3-poor tropospheric branch.
However, the above studies (Hoor et al., 2002; Pan et al., 2004; Müller et al., 2016) focused on the extratropics. The ASMA is mostly situated in the tropics, where trace gas mixing ratios are controlled by different processes (Gettelman et al., 2011). The ASMA in particular constitutes a special atmospheric situation, because a continuous resupply of rapidly uplifted lower-tropospheric air impedes the UT photochemical equilibrium there. O3 is photochemically produced in the ASMA at a net rate of almost 4 nmol mol−1 day−1 (Barret et al., 2016; and Fig. 7b, which will be discussed in Sect. 6). Only 2 weeks are needed to increase O3 mixing ratios by 50 nmol mol−1, i.e. to produce the O3 enhancement observed at the southern ASMA edge. This is not much longer than the advection timescale (∼ 10 days) discussed in the context of the HALO ESMVal campaign. Thus photochemical production needs to be considered an alternative to stratospheric in-mixing to explain enhanced O3 in the ASMA. Photochemical ageing increases O3 and depletes CO here.
Mixing lines with negative slopes in CO vs. O3 space dominate the UT observations (black dotted in Fig. 8c). These types of mixing lines in the troposphere could result from one or a combination of the following: (i) mixing between stratospherically and tropospherically influenced air masses, (ii) mixing between photochemically aged and freshly uplifted lower-tropospheric air and (iii) an O3-depleting photochemical regime (Baker et al., 2011). While the latter is unlikely in the ASMA (Fig. 7b), we need to consider additional tracers to disentangle stratospheric influence and photochemical ageing.
4.3.2 HCl versus O3 (Fig. 8d–f)
HCl is a proxy for stratospheric entrainment and CO marks tropospheric influence. Consider the hypothetical case of constant HCl (lines L1 and parallels in Fig. 8b, e): increasing O3 corresponds to increasing CO. The trace gas gradients along that hypothetical line reflect a gradient in net O3 production rather than differences with respect to stratospheric influence between the two reservoirs. Now consider the opposite case, i.e. constant CO (lines L2): increasing O3 corresponds to increasing HCl, indicating a gradient of stratospheric influence. CO mixing ratios decrease for increasing HCl in the special case of constant O3 and different HCl mixing ratios (lines L3). This indicates mixing between a tropospheric and a stratospheric reservoir, where two opposite effects lead to almost constant O3 mixing ratios: increased net O3 production in the air with decreased HCl versus both increased O3 and HCl in the more stratospheric components. In intermediate cases the trace gas gradients in the tracer–tracer plots reflect a combination of gradients of in-mixing as well as in situ photochemistry. Spatial gradients of photochemical O3 production dominate over gradients of stratospheric influence (i.e. in-mixing from the TL or stratosphere) within the sampled air mass if increasing O3 correlates with increasing CO and decreasing HCl (lines L4). In contrast, gradients of stratospheric or TL in-mixing dominate if increasing O3 correlates with increasing HCl and decreasing CO (lines L5).
The measurements (Fig. 8c, f) mostly – but not exclusively – show the latter case (L5): neighbouring points form negatively sloped lines in CO vs. O3 space (black dotted in Fig. 8c), corresponding to horizontal to positively sloped lines in HCl vs. O3 space (black dotted lines in Fig. 8f). Thus, observed trace gas gradients are mostly due to gradients of stratospheric influence on some well-mixed UT background. This could either be the entrainment of tropospheric air into a more stratospheric background or the entrainment of TL air into a more tropospheric background. There are also a few almost vertical mixing lines in Fig. 8f, indicating case L3 described above. Systematic HCl gradients – like those across the tropopause – are not expected in convectively uplifted air. O3 variability in such air masses is at least partly due to different amounts of in situ produced O3. However, mixing between aged and young tropospheric air alone cannot explain the observations.
We further note that mixing lines in Fig. 8f cover similar ranges of HCl, but are separated by different levels of O3. The corresponding background air had seen similar amounts of stratospheric influence, but different O3 production. As long as all points of an individual mixing line are subject to similar O3 production, the entire line will be shifted to different O3 levels. The O3 ranges covered by individual mixing lines are similar to the offsets between different lines. Individual mixing lines in the measurements cover timescales of about 20 min (Fig. 8c), corresponding to 300 km at typical HALO speeds. The flight track in the ASMA filament covers more than 3000 km altogether and multiple mixing lines were found on that scale.
To summarise, our observations of O3, HCl and CO in an ASMA filament show that (i) both photochemical production and TL/stratospheric in-mixing contribute to increased O3 in the observed ASMA filament, and (ii) small-scale gradients of stratospheric influence are superimposed on background regions that are rather homogeneous on small scales (hundreds of kilometres), but differ in their amounts of photochemically produced O3 on larger scales (thousands of kilometres).
4.3.3 NOx versus O3 (Fig. 9a–c)
Similar HCl mixing ratios are simulated throughout the ranges of measured NOx and O3 (orange box in Fig. 9b). Measurements of increased NOx in combination with increased O3 (upper right corner of the orange boxes in Fig. 9) are compatible with both increased in situ O3 production and influence from the stratospheric branch. Consequently, NOx and O3 are well correlated on the scale of our ASMA measurements (Fig. 9c).
NOx versus NOy (Fig. 9d–f): There are three distinct regions in Fig. 9d: a blueish stratospheric branch, a dark TL branch and a reddish UT region. As a consequence of the local NOy minimum directly above the tropopause (Fig. 6d; examples of individual profiles in the Supplement), the most decreased NOy mixing ratios in Fig. 9d also show up in samples taken from near the tropopause. Measured NO and NOy values in the ASMA filament are well correlated (Fig. 9f), which is consistent with almost constant NOx ∕ NOy ratios in the UT (Fig. 6e, f). The narrow, linear distribution of the ASMA measurements in Fig. 9c, f can be explained by different amounts of lightning NOx of approximately the same age.
In this section we discuss the evolution of simulated trace gas profiles throughout the year 2012, separately for lateral averages over the western (Iranian) and eastern (Tibetan) ASMA regions (Fig. 2).
5.1 Ozone
Steep vertical gradients across the tropopause dominate O3 profiles in the monsoon regions (Fig. 5a, b), but the profiles also show temporal fluctuations on various timescales. Note that our lateral averaging regions are rather large, and smaller-scale structures get smoothed out, e.g. when an O3-poor interior is combined with an O3-rich fringe.
There is increased influx from the stratosphere in spring, enhancing O3 in the UT. This is in accordance with the study by Cristofanelli et al. (2010), but in contrast to their study there are non-negligible O3 enhancements connected to the stratosphere during the monsoon season (Fig. 5b, circled). In this respect our simulation is, however, consistent with trace gas budget considerations for the ASMA (Barret et al., 2016) and the TTL (Konopka et al., 2010). Entrainment from the TL rather than deep from within the stratosphere could reconcile the different findings. No other stratospheric contributions were found for the stratospherically influenced trace gas signatures in the HALO ESMVal ASMA observations.
Enhanced O3 is recognisable in the averaged profiles of the eastern ASMA part only from the tropopause to about 200 hPa below the tropopause, while the mid-troposphere in the Tibetan part is dominated by particularly O3-poor air during the monsoon season (Fig. 5b). The latter is consistent with the findings of Safieddine et al. (2016). O3 depletion in the mid-troposphere of the eastern part is contrasted by enhanced O3 in the mid-troposphere during the monsoon season in the western part (Fig. 5a, circled), marking the well-known summertime O3 maximum there.
5.2 Carbon monoxide
This is reflected in the evolution of CO profiles in the ASMA region in 2012 (Fig. 5c, d). CO-poor air dominates in the UT during spring, consistent with the stratospheric influx indicated by O3.
CO-rich air rises throughout the troposphere of the eastern part during the monsoon season (Fig. 5d, circled). On the western side there is a conspicuous CO-depleted zone 300 to 500 hPa below the tropopause during the monsoon season (Fig. 5c, circled), while CO is episodically enhanced in the UT. Uplifted air with enhanced CO mixing ratios hardly reaches higher than 450 hPa below the tropopause in summer.
This difference between CO profiles in the Tibetan and the Iranian parts is consistent with the findings of Pan et al. (2016). Occasional horizontal transport in the UT from the eastern to the western part of the ASMA is a possible explanation for the spatio-temporal evolution of CO mixing ratios, indicating that trace gas signatures in the Iranian part are dominated by the UT outflow of the Tibetan part of the ASMA.
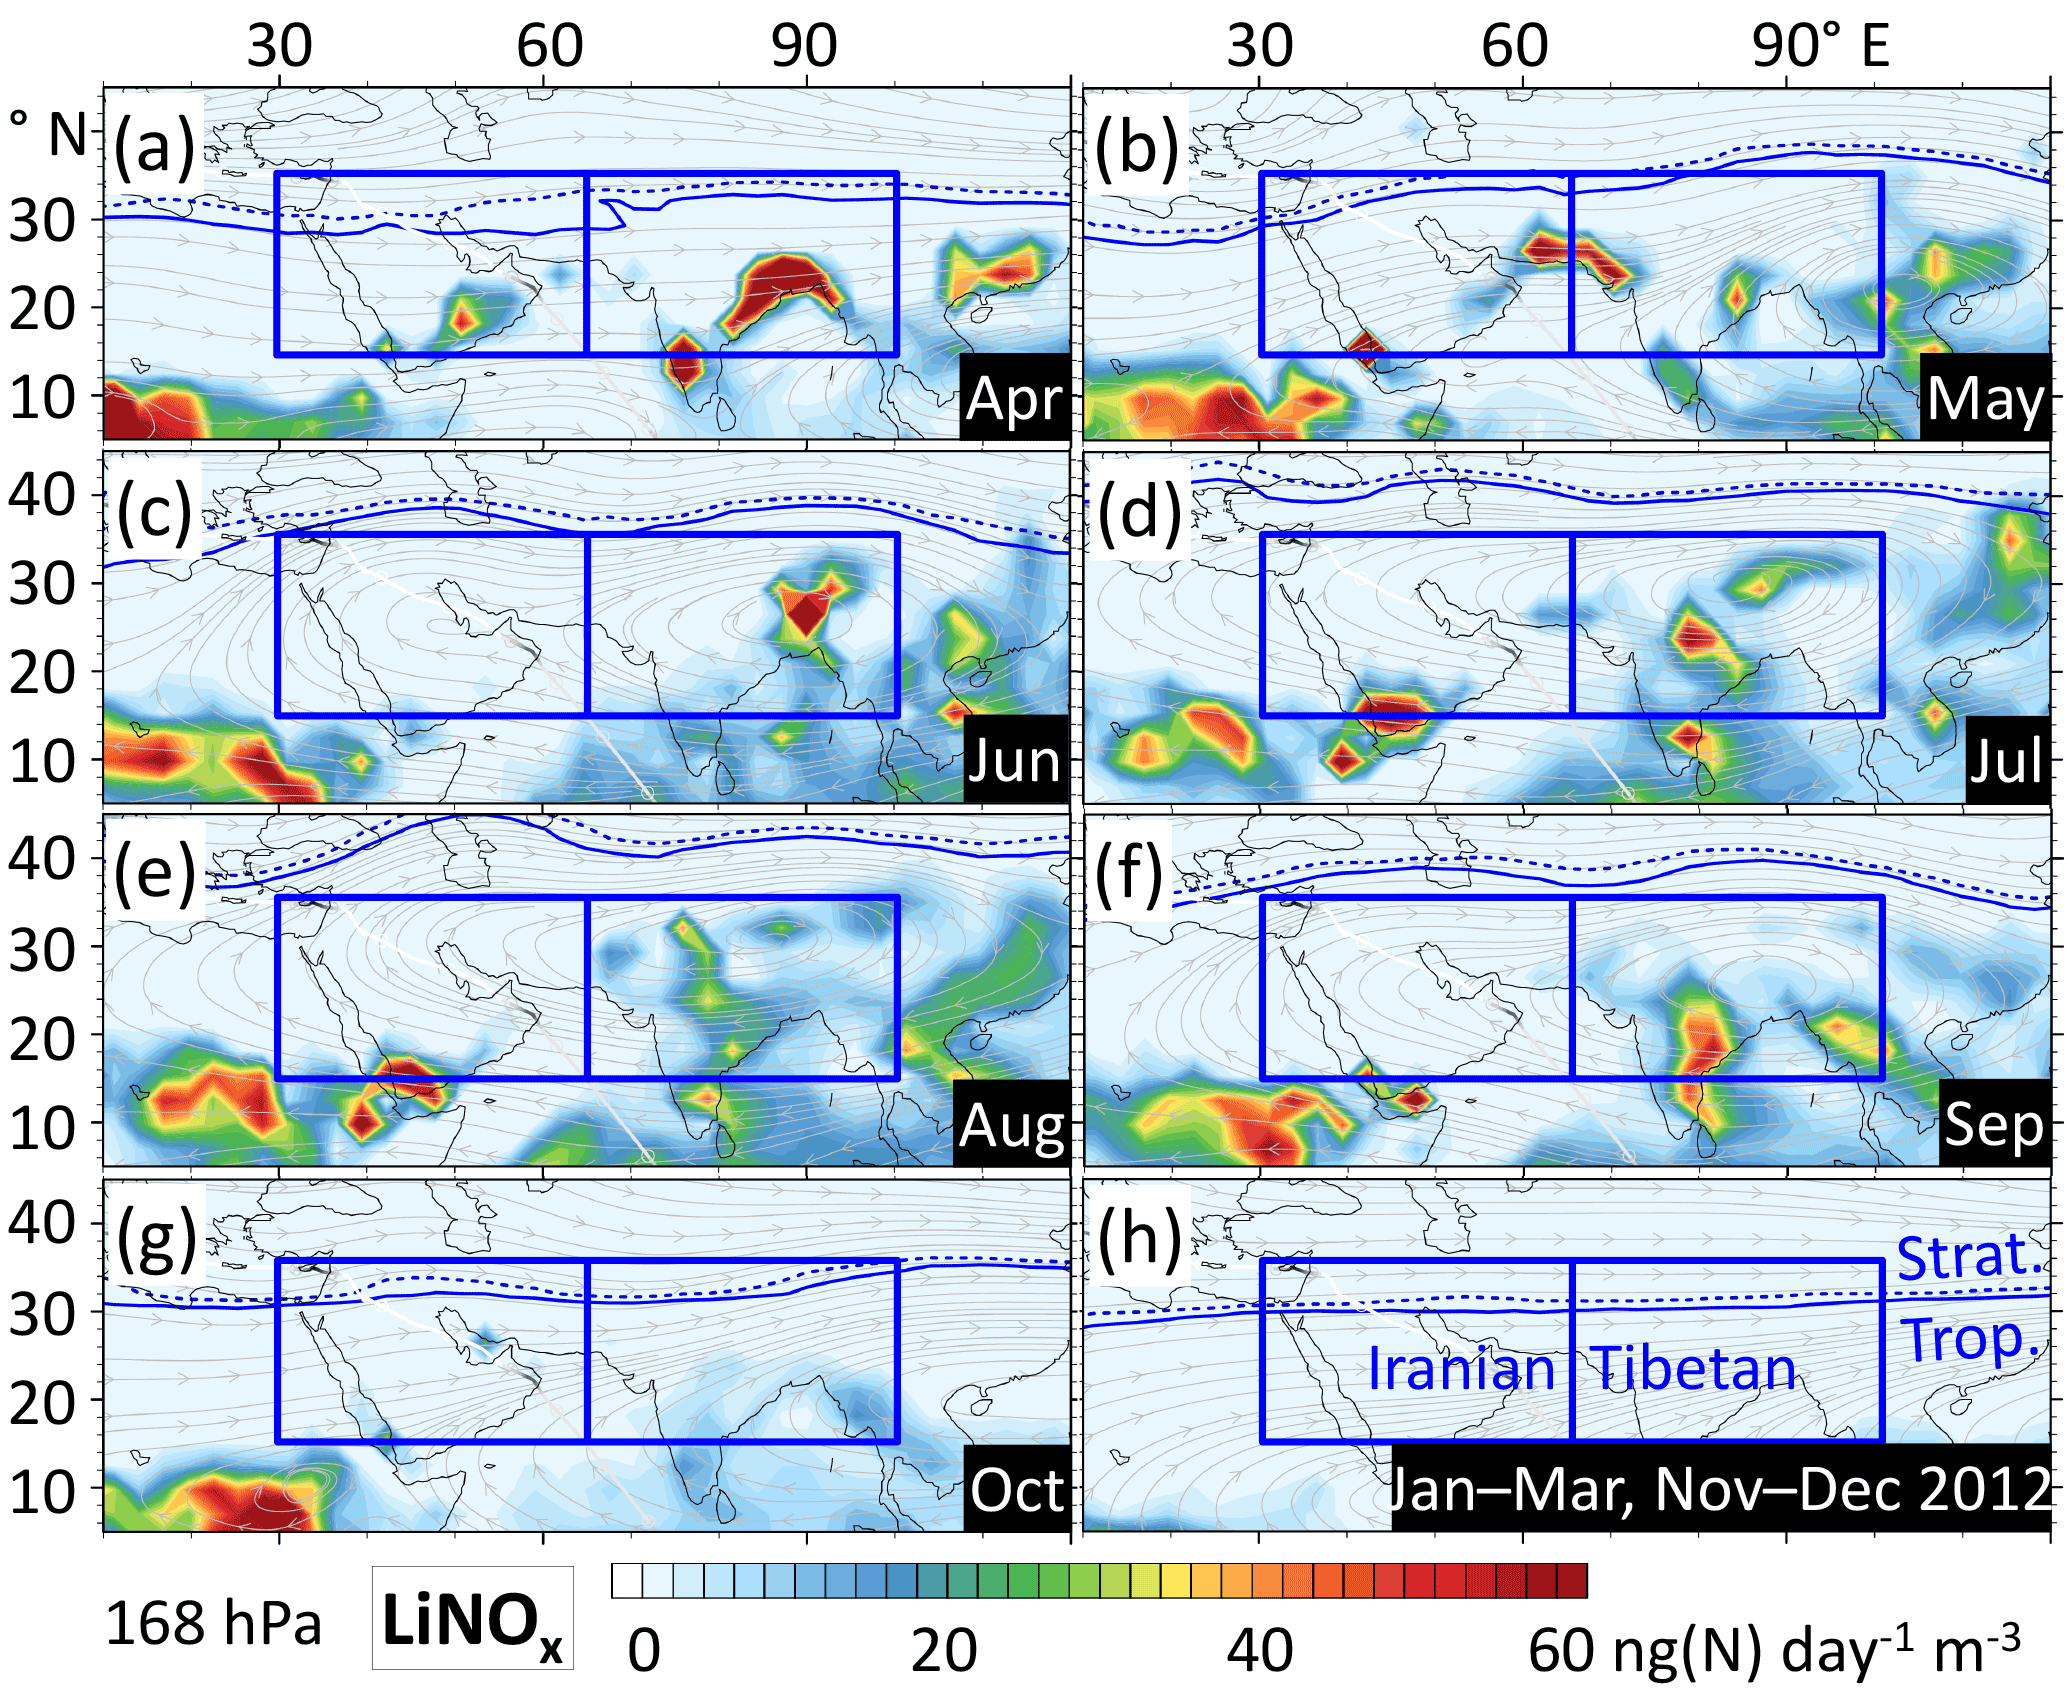
Figure 10Simulated monthly mean lightning NOx emission rates in 2012 at a pressure level corresponding to the HALO ESMVal measurements. Months with almost no emissions are combined in panel (h). The ASMA circulation dominates in the monthly mean wind fields from June to September, as shown by streamlines (grey). There are strong, localised emissions in spring (April–May), which in the Iranian part hardly reach the 355 K level. In contrast, LiNOx emissions are distributed throughout the Tibetan region in summer (July–September). The simulated spatio-temporal emission patterns are similar for 2013 and 2014 (not shown).
5.3 Hydrochloric acid
As expected for a stratospheric tracer, the simulated HCl profiles (Fig. 5e, f) show a strong anti-correlation with CO in the UT, with increased HCl in times of stratospheric influx (e.g. Fig. 5f, blue circle) and decreased HCl in the monsoon season. Stratosphere-to-troposphere exchange is pronounced during spring, consistent with the seasonality of the Brewer–Dobson circulation (Holton et al., 1995).
HCl plumes in the Iranian part rise to about 400 hPa below the tropopause in summer (Fig. 5e, circled), just like CO. Predominantly dry conditions in the western part prevent HCl from being washed out. However, CO and HCl are temporally anti-correlated in the mid-troposphere. Since HCl is emitted by the sea, we attribute this to alternating marine and continental origins in the uplifted air (Fig. 5c, e).
Some HCl descends from the tropopause into the mid-troposphere, as indicated by tilted patterns of enhanced HCl, which start at the tropopause and propagate downward (marked by an arrow in Fig. 5e). Similar telltale signs of descent is also recognisable in other species in the Iranian part during summer.
There is almost no HCl in the Tibetan part throughout the monsoon season (Fig. 5f, black circle), except for the UT. Convection and thunderstorms are frequent during the monsoon season in South Asia (Fig. 7d). Wet scavenging and subsequent washing out by precipitation does not affect CO, but effectively prevents transport of HCl to higher altitudes. Predominantly continental origins also contribute to an increased CO ∕ HCl ratio in the rising plumes of the eastern part.
5.4 Reactive nitrogen
Simulated NOx and NOy profiles in the ASMA region from April to September differ to the rest of the year (Fig. 6a–d). E- and C-shaped NOy profiles dominate the Tibetan and Iranian parts, respectively (Fig. 6c, d; examples of individual profiles in the Supplement).
NOx and NOy from boundary layer sources are uplifted, accompanied by conversion of some NOx into NOy. Solvable NOy components (e.g. HNO3) become increasingly washed out (Fig. 6d), leading to a minimum of reactive nitrogen in the mid-troposphere in the Tibetan part in summer (Fig. 6b, d). Uplift from the lower troposphere is less important for UT NOx and NOy than LiNOx and stratospheric entrainments. The dependence of detrainment on altitude hardly affects trace gas profiles in the mid-troposphere, as indicated by the corresponding CO profiles (Fig. 5d, circled).
Both NOx and NOy gradually increase above the tropopause due to stratospheric photochemistry. Stratospheric influx contributes to increased NOx mixing ratios in the UT in spring (blue circles in Figs. 5f, 6b), but enhanced UT NOx during the monsoon (Fig. 6b, black circle) is more due to lightning NOx emissions in the Tibetan part than to stratospheric entrainments (Supplement).
NOy can rise to about 400 hPa below the tropopause in the heat low over the Arabian Peninsula (circled in Fig. 6c). Downward transport (as indicated by anti-clockwise tilted signals, one example marked by an arrow in Fig. 6c) dominates above that altitude, preventing further uplift. With little in situ production of lightning NOx over the Arabian Peninsula in summer (Figs. 7c and 10), UT NOy in the Iranian part is dominated by the outflow of the Tibetan part.
As a combination of the different processes affecting NOx and NOy, the NOx ∕ NOy ratio maintains a broad maximum in the TL throughout the year (Fig. 6e, f). During the monsoon, the NOx ∕ NOy ratio in the UTLS is larger in the western than in the eastern ASMA part (Fig. 6e, f, circles). This indicates preferential export of high-NOx air from the Tibetan part or is an artefact of the possible dominance of a single source of LiNOx in the Iranian region (Fig. 10).
In this section the observed and simulated trace gas signatures are related to simulated photochemical, transport and mixing properties of the ASMA. The term “interplay” is thereby used in a neutral sense regarding the direction of feedbacks between different processes: it subsumes mostly one-way interactions (e.g. emissions affecting O3 production, dynamics affecting trace gas distributions). We note upfront that the intra-annual variability of trace gas dynamics in the Tibetan and Iranian ASMA regions discussed for the year 2012 in Sect. 5 is largely similar to the other considered years (2010–2014; shown in the Supplement).
6.1 Lightning NOx
In our EMAC simulations, LiNOx is released based on a parameterisation that links flash frequency to updraught velocity in – also parameterised – convection. It is difficult to pinpoint LiNOx emissions (Schumann and Huntrieser, 2007), and both parameterisations are a notorious source of uncertainty in global models. The parameterisations for convection (Tiedtke, 1989; Nordeng, 1994; Tost, 2006) and lightning (Grewe et al., 2001) used in our simulations have been tested in several studies (Tost et al., 2007; Grewe, 2009; Lopez, 2016) and appear to be state of the art. EMAC-simulated lightning activity matches the corresponding TRMM-LIS/OTD (Tropical Rainfall Measuring Mission Lightning Imaging Sensor/Optical Transient Detector) observations (Cecil, 2006) reasonably well, spatially and temporally (Supplement). Simulated and observed NO along the HALO ESMVal flight track agree remarkably well within the ASMA region (accompanying paper). The same is true for comparisons of IAGOS-CARIBIC measurements of NO and our simulation's output along the IAGOS-CARIBIC flight tracks, where the agreement is particularly noticeable for the monsoon season in the ASMA region (Supplement). A dedicated comparison to other models is still desirable, since NOx is complex to simulate and there might be compensating errors. For the current study, however, the above comparisons provide some confidence that LiNOx emissions have been captured well by the simulation.
Simulated LiNOx emission rate profiles for 2012 show prominent maxima for the eastern and western ASMA regions during spring (Fig. 7c, d). Overall, LiNOx emissions are much stronger in the Tibetan part. The emissions reach up to the tropopause throughout the year, implying that LiNOx is emitted at higher potential temperatures during the monsoon season (Fig. 4b). Despite higher emission rates in the laterally averaged profiles (Fig. 4d), lightning activity in the Tibetan part is more sporadic and localised in spring than in summer (Fig. 10d, e). During the monsoon season, LiNOx is constantly replenished in the ASMA throughout the region (Fig. 10g, h, i). Sensitivity simulations show that UT NOx (Fig. 6b) is mainly LiNOx during the monsoon season (Supplement).
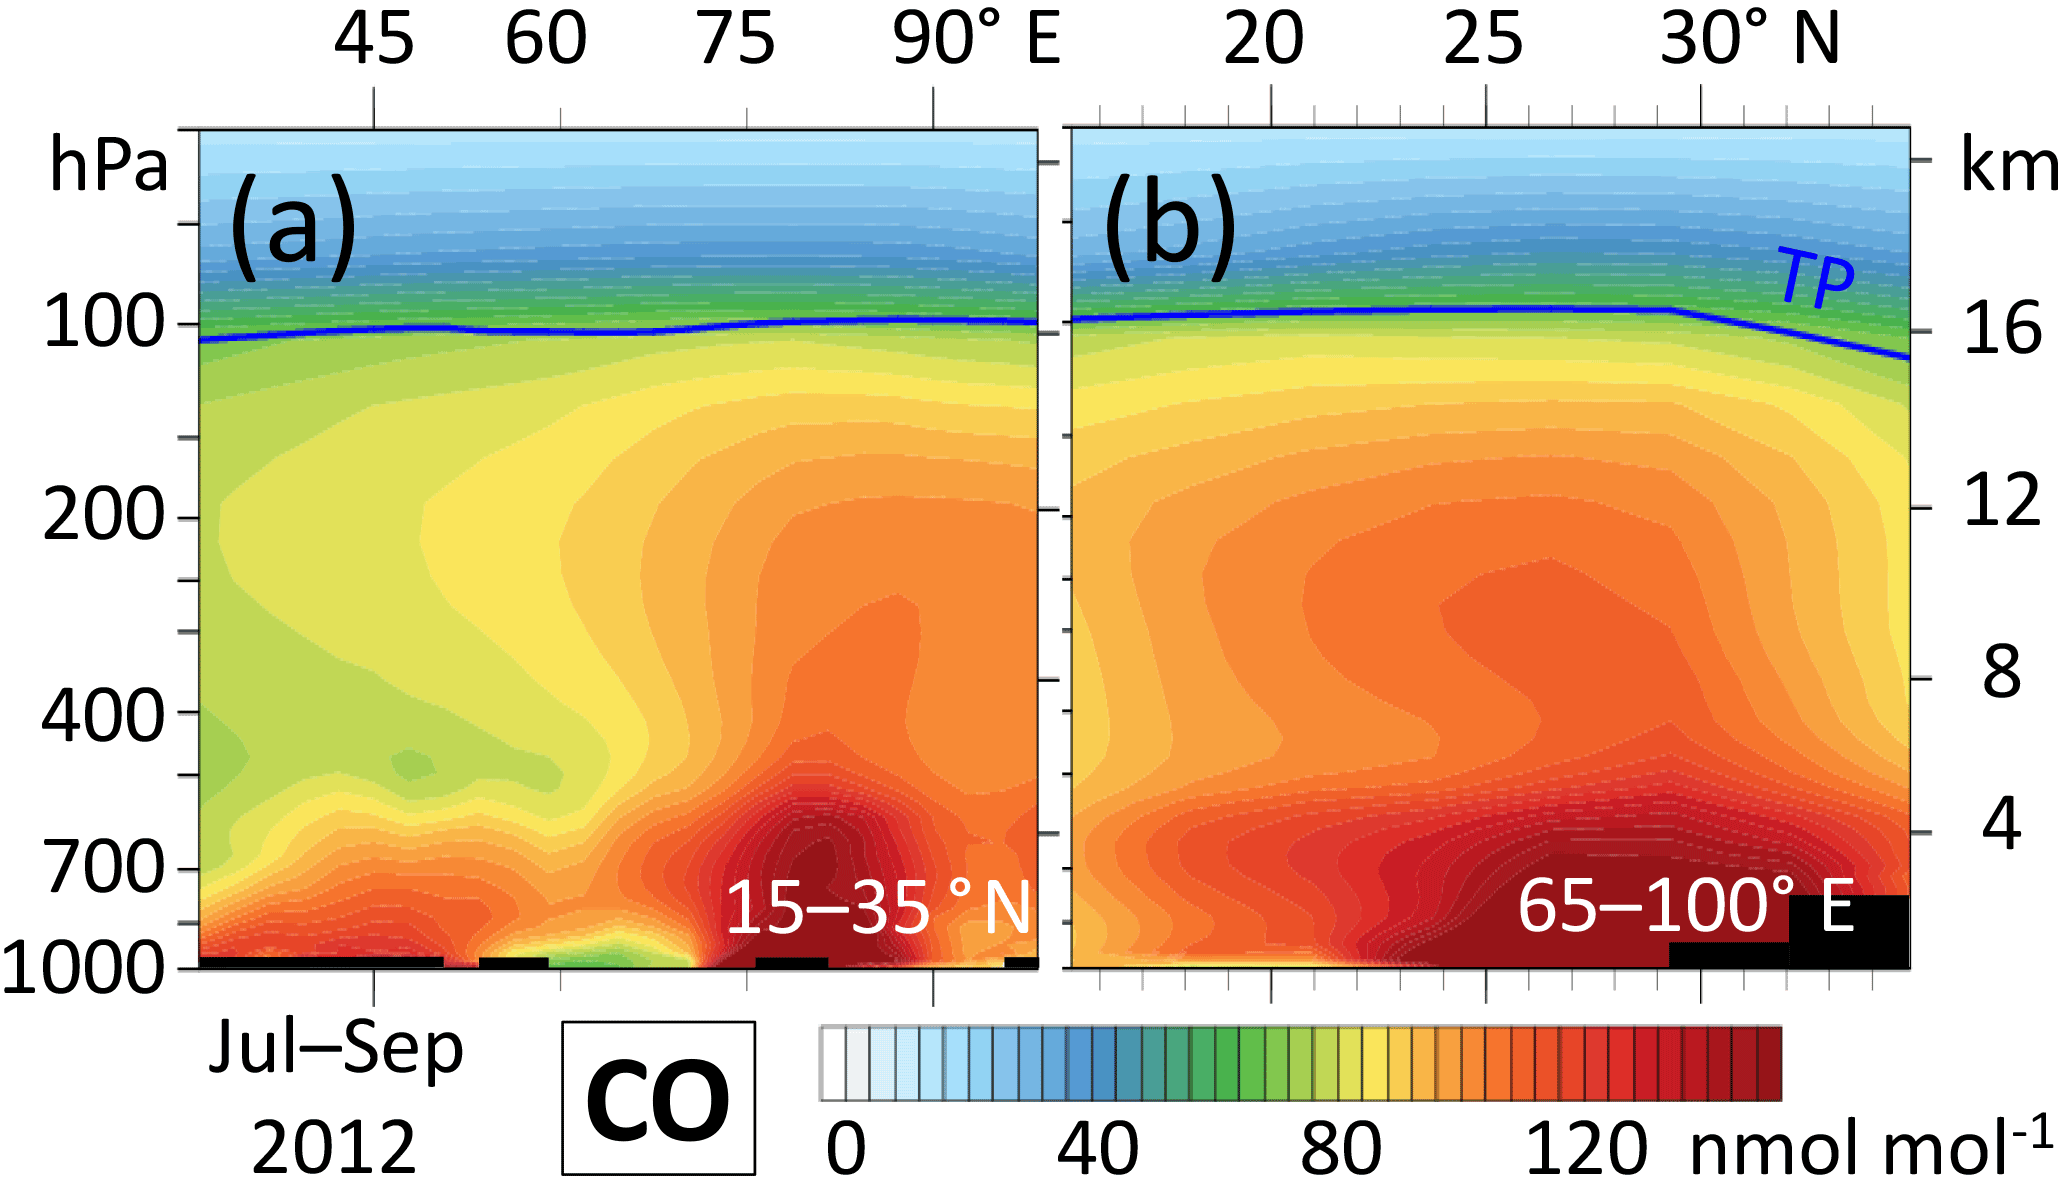
Figure 11Simulated 3-month mean vertical cross sections of CO mixing ratios: (a) Covering Iranian and Tibetan parts, meridional mean; (b) Tibetan part, zonal mean. On average, the hotspot of ascending CO in our simulation is located at about 29∘ N, 80∘ E, corresponding to the south-western flank of the Himalayas.
6.2 Entrainment of lower-tropospheric air
The uplift of lower-tropospheric air to the UT is a well-known characteristic of the ASMA (Pan et al., 2016). Simulated CO profiles in the Tibetan region show episodes of such uplift, not only for 2012 (Fig. 5d), but for every monsoon season during 2010–2014 (Supplement). This is consistent with the HALO ESMVal measurements, since the trace gas gradients observed in the ASMA can be explained by mixing between lower-tropospheric air and stratospherically influenced air.
CO uplift to the UT and LiNOx emissions are both related to convection and it is remarkable that there is a much stronger correlation between the two in summer than in spring (Figs. 5d, 7d). We attribute this to three effects: (i) the large-scale uplift at the south-western flank of the Himalayas is only active during the monsoon season and is not exclusively driven by deep convection (see Sects. 1, 3). It has been suggested to be the main transport pathway of pollutants to the UT (Bergman et al., 2013; Pan et al., 2016), which is supported by our simulation (Fig. 11) and the location of maximum moist static energy (Boos and Hurley, 2013). Back-trajectory calculations in the accompanying paper identified this pathway as the source of enhanced CO in some of the HALO ESMVal measurements, despite the underlying reanalysis not accounting for (small scale) convection. (ii) In the UT the ASMA is a leaky transport barrier, allowing some accumulation of the uplifted pollutants (Pan et al., 2016). There is no such transport barrier in spring. (iii) The spatial and temporal matches of deep convection and increased CO at different altitudes reflect the potential for entrainment and subsequent convective transport of CO (Fig. 7g, h). It is clearly increased in summer. More detailed analyses (Supplement) show that convection is localised over the coastal regions of West Bengal and Bangladesh in April 2012. In contrast, during August 2012 convection is ubiquitous throughout the Tibetan region. It is most persistent at the south-western flank of the Himalayas and over the Tibetan plateau. This coincides with the highest CO mixing ratios, which accumulate there due to the prevalent south-westerly winds during the monsoon season. Consequently, more CO is transported through the troposphere in the Tibetan region during summer.
6.3 Photochemical O3 production and ageing
The net photochemical O3 production rate (Fig. 7a, b) is derived from the difference between EMAC-simulated diagnostic tracers ProdO3 and LossO3 (Jöckel et al., 2016). Here we take into account effective O3 production and loss terms following Crutzen and Schmailzl, (1983) and extended by Grewe et al. (2017; see their Supplement). There are known high-O3 biases in the simulation (Jöckel et al., 2016), and uncertainties in the chemical mechanism (Gottschaldt et al., 2013) also impose uncertainties onto O3 photochemistry. Nevertheless our simulated net O3 production rates in the ASMA (Fig. 7b) agree remarkably well with the independent estimate by Barret et al. (2016).
O3 photochemistry is dominated by catalytic cycles in the troposphere and affected by a variety of parameters, e.g. ambient mixing ratios of H2O, O3, CO and NOx (Ehhalt and Rohrer, 1994; Grooß et al., 1998; Jaeglé et al., 1998; Seinfeld and Pandis, 1998). We focus on NOx and CO for illustration (Fig. 12). Photochemical O3 production1 (ProdO3) non-linearly depends on ambient NOx mixing ratios: it increases proportional to NOx in the NOx-limited regime, is almost independent of NOx variations at higher NOx mixing ratios, and a further increase of NOx even leads to decreasing ProdO3 (NOx-saturated regime). Increasing CO increases ProdO3 and shifts the point of maximum ProdO3 to higher NOx. Increasing H2O impacts ProdO3 in a qualitatively similar way to increasing CO. Decreasing O3 leads to higher ProdO3, but NOx at the point of maximum ProdO3 is at its lowest for medium O3 mixing ratios.
The simulation shows the superposition of the above effects, among others within the full complexity of the chemical mechanism. As a result, a net O3-producing photochemistry prevails in the ASMA throughout the monsoon season (circled in Fig. 7a, b). This is accompanied by net O3 destruction during the monsoon season, 300 hPa below the tropopause and lower. At the tropopause and slightly above, there is a local minimum of net O3 production, followed by increased net O3 production in the stratosphere. Net O3 production is at maximum in the altitude range, where uplifted young air (enriched in CO and co-emitted volatile, organic O3 precursors) mixes with NOx-rich UT air (Figs. 5d, 6b, 7b).
ProdO3 per NOx shows a strong gradient at the altitude of maximum net O3 production (circled in Fig. 7b, f). This indicates the transition from the NOx-limited to the NOx-saturated regime (Fig. 12), but is superimposed by gradients of CO and other O3 precursors. The maximum corresponds to about 300 pmol mol−1 NOx (circled in Fig. 8h), and variations of NOx in that region have a relatively small effect on net O3 production (2 in Fig. 12).
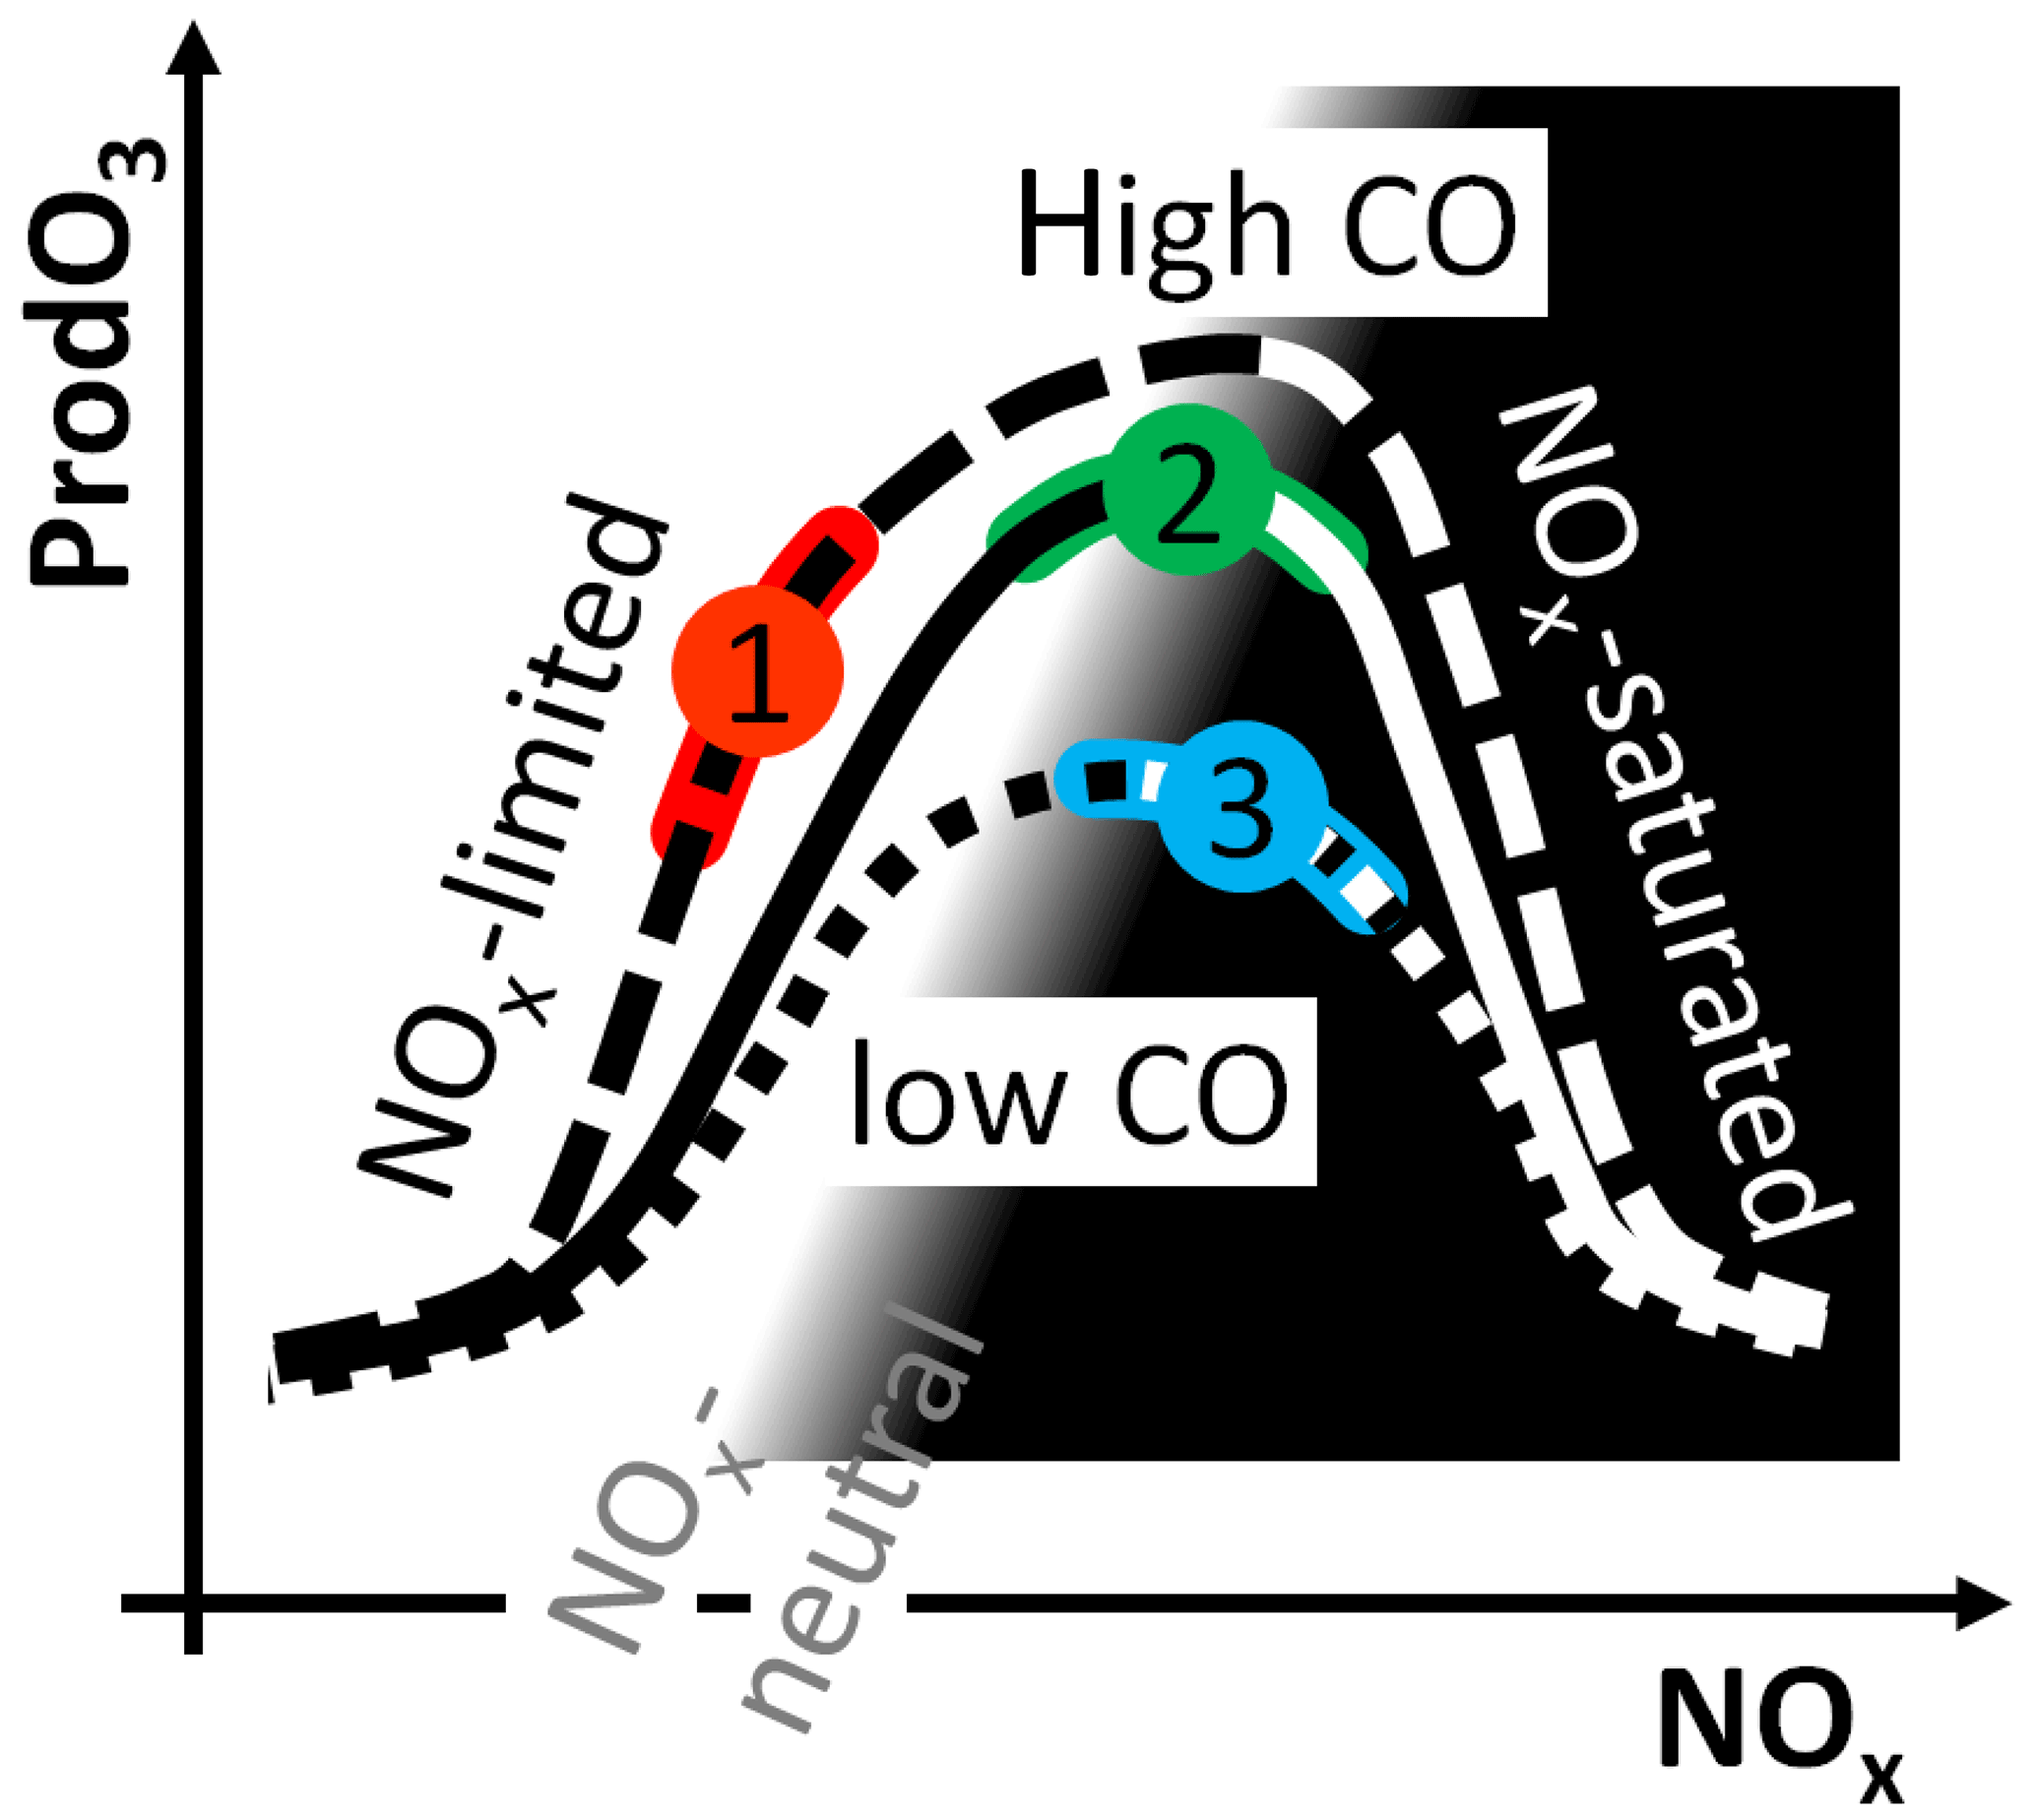
Figure 12Schematic of the dependence of photochemical O3 production (ProdO3) on NOx and CO mixing ratios (after Grooß et al., 1998). Red, green and blue highlight photochemical conditions that are discussed in the text. Approximate numbers (Ehhalt and Rohrer, 1994; Jaeglé et al., 1998; Grooß et al., 1998) for UT conditions at northern midlatitudes the point of maximum O3 production may vary between 200 and 700 pmol mol−1 NOx. The maximum net O3 production varies by a factor of about 4, depending on ambient conditions.
Going down from the TP in the ASMA, NOx and O3 generally decrease, while CO and H2O increase (Figs. 5, 6; H2O not shown). It is a multi-dimensional problem. CO (among others) determines the curve in the NOx vs. ProdO3 diagram, and NOx determines the operating point on the curve. Considering typical ranges of CO and NOx in different parts of the ASMA, an area on the surface in ProdO3–NOx–CO space is termed “operating mode of the chemical system” in the following. Different chemical regimes (e.g. NOx-limited or NOx-saturated) are allowed within one operating mode. The non-linear dependence of ProdO3 on ambient trace gas mixing ratios leads to the simulated maximum within the opposite gradients of those trace gases (NOx decreases below the TP, while CO increases) in the UT ASMA. Going down from the TP, the chemical system goes from operating mode 3 to 2 to 1 (Fig. 12). In principle, all those operating modes could be in the NOx-limited regime and still lead to a maximum of net O3 production in the UT. However, our simulations also show the NOx-saturated regime (Supplement).
Periods of enhanced lightning NOx in spring (circled in Fig. 7d) correspond to increased net O3 production (Fig. 7b), but despite higher LiNOx emissions in spring, net O3 production is at maximum in the ASMA. The main differences between the seasons are that there is less CO in the UT during spring (Fig. 5d) and lightning NOx is available only locally (Sect. 6.1. and Supplement). More CO in the UTLS in summer increases ProdO3 and the maximum possible O3 production (Fig. 12). Too high NOx in spring does not help ProdO3 – or even pushes the system into the NOx-saturated regime (3 in Fig. 12). NOx close to maximum ProdO3 conditions (2 in Fig. 12) throughout the region in summer leads to higher ProdO3 in the lateral average.
Both NOx and other precursors are more abundant in the UT of the Tibetan part, resulting in larger photochemical O3 production than in the Iranian part (Fig. 7a, b). This is consistent with other studies (J. J. Liu et al., 2009; Barret et al., 2016), which have also found such an asymmetry. O3-depleting conditions prevail in the mid-troposphere over the Arabian Peninsula throughout the summer (Fig. 7a, circled). Thus increased O3 there (Fig. 5a) must be due to transport.
Confinement in the ASMA circulation allows the mixed air to age, i.e. to produce O3. CO is being depleted in the process of ageing, and NOx is transferred to NOy. The other source of aged air is entrainment from the TL, which is, however, enriched in HCl (at least within the photochemical lifetime of HCl). O3 is produced in the ASMA at a net rate of about 4 nmol mol−1 day−1 (Fig. 7b), and simulated O3 mixing ratios in the UT of the ASMA region vary by about 120 nmol mol−1 (Fig. 8b). It would take 30 days to cover that range by photochemical O3 production alone. The observed values in the ASMA filament cover a range of about 48 nmol mol−1 (Fig. 8c), corresponding to 12 days of photochemical O3 production. According to the trajectory calculations in the accompanying paper, this is about the time needed to circle the ASMA. The above O3 variability of course includes different amounts of O3 from the TL, and O3 productivity varies too. Neglecting these uncertainties, it takes one or two rotations of the ASMA to transform O3-depleted, freshly uplifted air into aged, O3-enhanced air. O3-depletion in the ASMA relative to the regional average can only be maintained by frequent replenishment of young air.
6.4 Entrainment of tropopause layer air
Here we focus on the less well-known entrainment of stratospheric or TL air into the free troposphere, which is supported by the unique thermodynamic conditions over the Tibetan plateau in summer (Fig. 2). The prevailing northerly winds (Kunze et al., 2010) of the eastern ASMA flank (Fig. 2) tend to transport high potential vorticity (stratospheric or TL, Fig. 4c) air along the isentropic surfaces into the troposphere (Ren et al., 2014; Kunz et al., 2015). This effect was also detected by Konopka et al. (2010) as enhanced horizontal transport of O3-rich air from the extratropics into the TTL. This transport from the TL or even the extratropical lower stratosphere into the free tropical troposphere may not leave a telltale sign of increased potential temperature in the corresponding air masses in the tropics. This includes the 350–370 K isentropes that were encountered during the HALO ESMVal campaign in the tropics (Fig. 4; θ estimates for the measurements are shown in the Supplement).
Additional stratospheric or TL contributions at the outer ASMA edge, other than at the eastern flank, are also plausible. The eastern Mediterranean and central Asian region is a global hotspot of tropopause-folding activity (Tyrlis et al., 2014), which is related to ASMA dynamics and generates enhanced O3 levels through stratosphere–troposphere exchange (Akritidis et al., 2016). If the ASMA circulation encompasses that tropopause folding hotspot, it may pick up stratospheric entrainments.
Stratospheric influence is manifested in our measurements by increased HCl mixing ratios in combination with other tracers (Sect. 4.3).
Did the HALO ESMVal campaign encounter an exceptional situation, or does TL entrainment at the eastern ASMA flank occur more often? The synoptic situation in question is characterised by a filament of enhanced HCl that is carried along the south-eastern ASMA flank, around a HCl-depleted ASMA interior. Here we analyse the evolution of simulated HCl mixing ratios at θ = 355 K, on a meridional (N–S) transect at 90∘ E, throughout the monsoon seasons of 2010 to 2014. The transition between eastward and westward winds indicates the location of the ASMA centre on the meridional transect, which wobbles around 30∘ N (white “ridgeline” in Fig. 3b). Enhanced tropospheric HCl mixing ratios south of the ridgeline serve as an indicator of TL entrainment (Fig. 3c). Caution with this interpretation is only needed at times when the ASMA is shifted to the west (compare Fig. 3a), because the transect in Fig. 3c may then be too far within the eastern ASMA flank. Episodes of increased HCl in the southern or eastern ASMA flank cover at least half of the time axis, showing that entrainment of TL air into the ASMA circulation is quite a common process. One horizontal slice from each analysed month is shown in the Supplement, indicating that filaments of enhanced HCl often protrude from a TP trough of a Rossby wave at the eastern ASMA flank. The association of this mixing process with planetary wave-breaking events is a topic of ongoing research (Lubis and Nakamura, 2017).
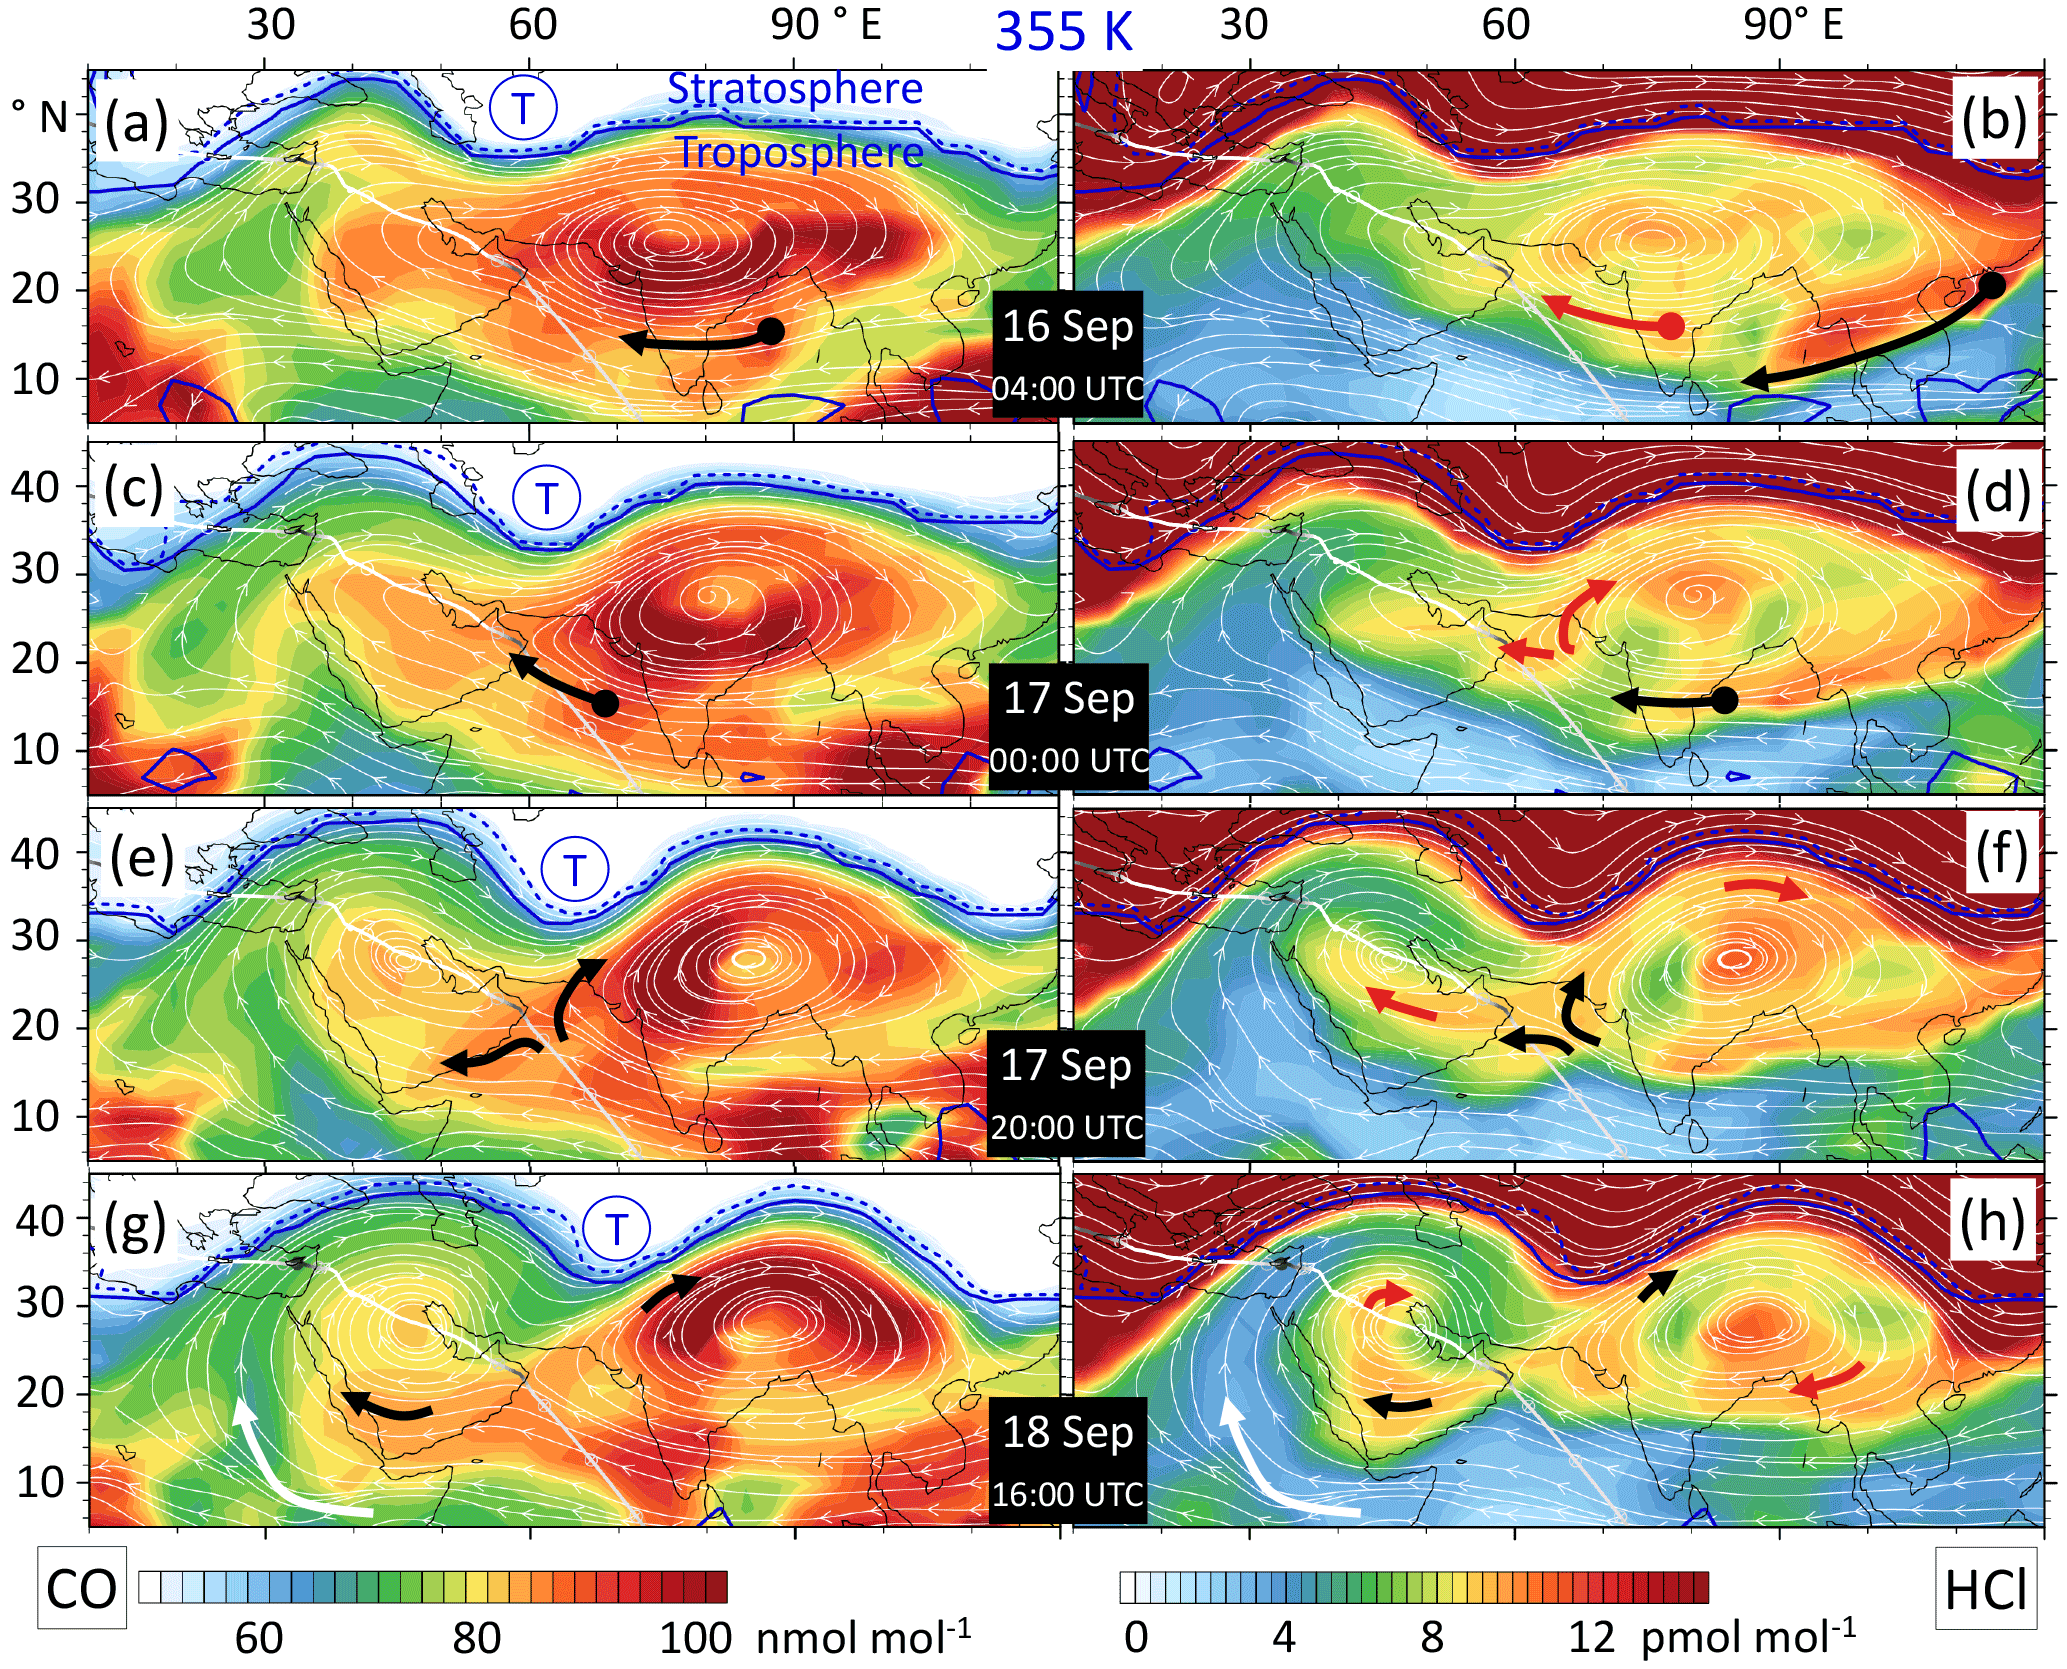
Figure 13Sequence of simulated tracer fields at 355 K, illustrating the stirring associated with the splitting-up event of the ASMA that occurred during the HALO ESMVal campaign in September 2012. Streamlines (grey) represent instantaneous wind fields, and arrows highlight the redistribution of selected air masses. CO mainly originates in the ASMA interior and HCl serves as a proxy with which to track the ASMA fringe. The sequence starts with an elongated anticyclone on 16 September 2012. Then a tropopause trough (T) evolves from the west along the northern ASMA flank. The anticyclone succumbs to the perturbation and splits up into a Tibetan and an Iranian part, shortly after the HALO flight from Male to Larnaca had passed through. A part of the increased CO interior region is entrained by the outer streamlines of the Iranian part, while the rest of the patch is diverted into the interior of the Tibetan anticyclone (black arrows in the left panels). The evolution of freshly entrained HCl (black arrows) and an older patch (red arrows) are shown in the right panels. We also note entrainment of tropospheric air by southerly winds at the western flank (white arrows).
6.5 Radial stratification and patchy trace gas distributions
Deep convection from the lower troposphere discharges more towards the ASMA interior, as shown by studies that report relatively young air there (Li et al., 2005; Randel and Park, 2006; Park et al., 2008; Y. Liu et al., 2009; Kunze et al., 2010; Liu et al., 2011; Santee et al., 2017) and also by our simulation (Sect. 6.4). In contrast, trace gas signatures in a belt of outer streamlines are dominated by a combination of photochemically aged lower-tropospheric air and entrainments of UT air surrounding the ASMA. In this schematic of an undisturbed anticyclone, interior trace gas signatures are generally characterised by lower O3 mixing ratios than fringe signatures. This radial zoning in the ASMA is an expression of almost closed circulation and was observed in IAGOS-CARIBIC in situ data of flights between Chennai, India and Frankfurt, Germany (Baker et al., 2011; Rauthe-Schöch et al., 2016). Increased O3 mixing ratios were found in the northern part of the ASMA and decreased levels towards the southern end of the flights.
Radial stratification is counteracted by the general on–off nature of TL entrainment, upwellings from the lower troposphere and lightning. Still considering only undisturbed ASMA circulation, all those effects lead to patches of air with different trace gas signatures. Each of these patches might again receive contributions from any of the above sources. In principle all sorts of combinations are possible, generating heterogeneity. In contrast, mixing and photochemical ageing are homogenising effects. In combination with closed streamlines the preferential positions of the different sources might still show up as radial stratification in the ASMA, or show up in individual situations (Sect. 6.4).
However, neither the HALO ESMVal measurements nor sequences of simulated snapshots (Supplement) show clear stratification. The idealised picture that the ASMA circulation is dominated by stationary, closed streamlines is certainly not realistic – at least not on the timescales of the homogenising effects.
6.6 Splitting-up and stirring
Transient streamlines, particularly eddy shedding or splitting of the ASMA, effectively overcome radial transport barriers. Whether stratified or patchy – any trace gas distribution in the ASMA might then be subject to effective stirring. There is an ongoing discussion about different dynamical modes of the ASMA (Nützel et al., 2016; Pan et al., 2016).
A splitting-up event occurred during the HALO ESMVal campaign, corresponding to the transition from a longitudinally elongated phase to a double centre phase in the nomenclature of Pan et al. (2016). A sequence of simulated streamlines and tracer distributions shows that parts of the fringe of the elongated anticyclone become part of the interiors of both resulting anticyclones after the splitting, and the interior parts are diverted into the fringes (Fig. 13). Even if not all possible cases are covered by the example, it is easily conceivable that the some or all of the fringing parts may stay in the fringes and some or all of the interior parts in the interiors. For a given location and timing of eddy shedding or splitting, the final trace gas distribution simply depends on the initial distribution of different patches. The redistribution of different parts of the anticyclone guarantees a high variability for outflow and interior, whenever the closed circulation breaks down.
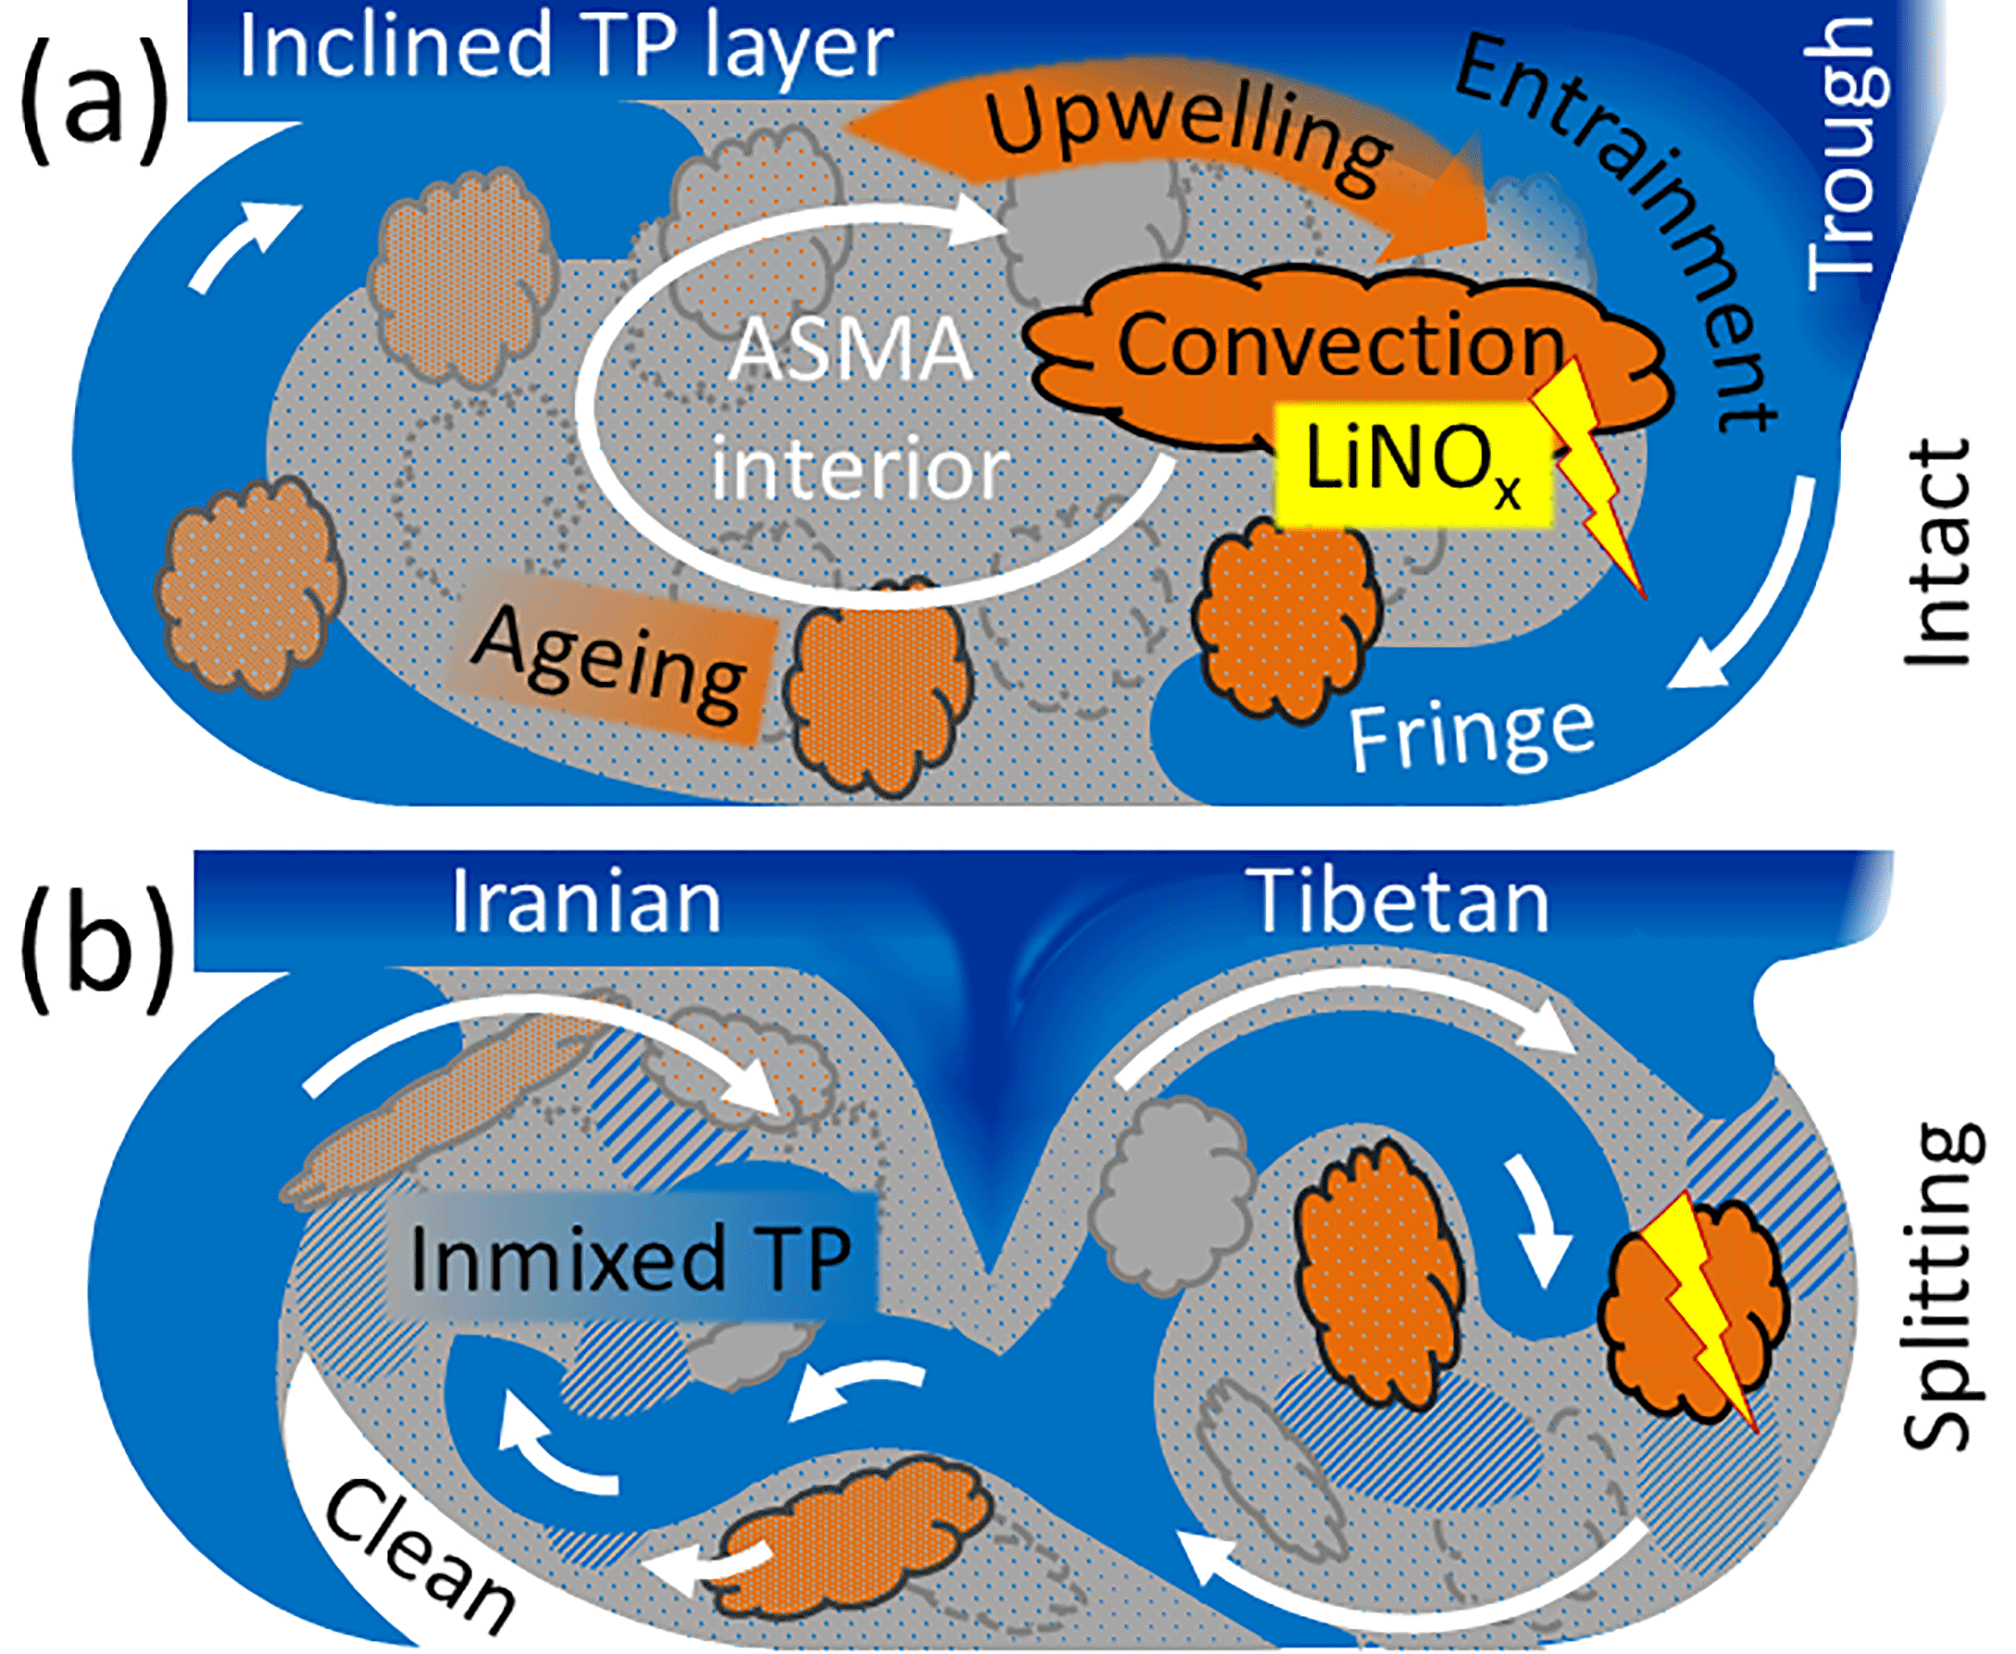
Figure 14Schematic of processes determining trace gas distributions in the ASMA at a UT level: (a) One undisturbed anticyclone, encompassing the Tibetan and Iranian regions. (b) Splitting into an Iranian and a Tibetan part. See text for details.
How often does this happen? Splitting and eddy shedding mainly occur in a zonal (E–W) direction, whereby the transition from a northward wind in the west to a southward wind in the east indicates the centre of an anticyclone or eddy. We analyse the evolution of meridional winds at θ = 355 K, on a wide (15–35∘ N) zonal transect, throughout the monsoon seasons of 2010 to 2014 (Fig. 3a).
The pattern at the given altitude is consistent with one dominating anticyclone, centred at about 90∘ E. While the northerly winds east of 90∘ E are relatively persistent, episodes of entirely southerly winds in the western part of the one-piece ASMA alternate with episodes of smaller, secondary anticyclones. Smaller anticyclones also regularly occur east of the Tibetan anticyclone, corresponding to eddy shedding to the east. The splitting event that occurred during the HALO ESMVal campaign is clearly visible in Fig. 3a, too. Such instabilities occur approximately twice a month. This coincidentally corresponds to the timescale needed to photochemically erase O3-depleted signatures in young air masses.
This study complements a detailed analysis of in situ trace gas measurements in the ASMA, obtained during the ESMVal campaign with the research aircraft HALO in September 2012 (Gottschaldt et al., 2017). The measurements are put in the context of the EMAC-simulated annual evolution of trace gas profiles in the ASMA region and simulated tracer–tracer relations. This led to the following qualitative understanding of the interplay of processes that determine the trace gas distributions in the ASMA and its outflow (Fig. 14): Air from the steeply inclined TL is entrained by outer ASMA streamlines at the eastern and possibly northern ASMA flank, defining a fringing zone. Tropopause troughs facilitate the entrainment.
Stratospherically enhanced tracers like HCl and O3 are reflected in the entrained air. Thus, the fringe is not just a transport barrier, separating the ASMA interior from the surrounding UT. It has a distinct genesis, resulting in air masses with distinct trace gas signatures that may be transported relatively unperturbed over long distances. Deep convection and a conduit of upwelling air over the Tibetan plateau (Bergman et al., 2013) inject lower-tropospheric air mainly into the Tibetan part of the ASMA. Enhanced CO is an indicator for this process. Convection is accompanied by in situ production of lightning NOx, mainly determining mixing ratios of this O3 precursor in the ASMA.
In the idealised case of one intact anticyclone (Fig. 14a) the interior would then be dominated by photochemical ageing of those O3-poor injections. Net O3 production dominates in the ASMA and is particularly enhanced where mainly lower-tropospheric O3 precursors (CO, volatile organic compounds) meet UT precursors (NOx). The preferential positions of convective versus TL entrainments facilitate radial stratification in the ASMA. The intermittent nature of the entrainments, combined with the varying position of the anticyclone, leads to patches of air that have different origins and are in different stages of ageing. Mixing and ageing are homogenising, but each of these patches might again receive fresh entrainments from the TL or by convection and lightning.
Eddy shedding or transitions between other dynamical modes of the ASMA effectively overcome radial transport barriers (Fig. 14b, summarising Figs. 13 and S18 in the Supplement). Whether stratified or patchy, any trace gas distribution in the ASMA is subject to effective stirring. Fringe air can be diverted into the interiors of both anticyclones, and likewise interior air is redistributed throughout the UT in the monsoon region. Remnants of earlier such events gradually lose memory of their origins, leading to a mixed background (grey in Fig. 14b).
We found that the processes that led to the curious combination of both enhanced lower tropospheric and TL tracers in the ASMA filaments encountered by the HALO ESMVal campaign are not exceptional: entrainment of TL air and dynamical instabilities of the ASMA occur quite frequently. Deep convection and thunderstorms are common throughout the monsoon season, accompanied by a net O3 producing photochemical regime. The alternating interplay of those processes results in highly variable, patchy trace gas distributions in the ASMA. Processes that increase O3 and its precursors dominate in the Tibetan part of the ASMA. The Iranian part is dynamically dominated by the Tibetan part in the UT. O3-rich TL entrainments and precursor-rich air, both of which are main ASMA components, tend to increase O3 in the tropospheric ASMA outflow – e.g. over the Arabian Peninsula.
The simulation results analysed here are archived at the German Climate Computing Center (DKRZ) and are available on request. It is planned to move them to the Climate and Environmental Retrieval and Archive (CERA) database at the German Climate Computing Centre (DKRZ; https://cera-www.dkrz.de, last access: 18 April 2018). The corresponding digital object identifiers (DOIs) will be published on the MESSy consortium web page (http://www.messy-interface.org, last access: 9 April 2018). The observational data of the HALO ESMVal flight used here are available from the HALO database (re3data.org, 2018). We used the NCAR Command Language (NCL) for data analysis and to create some of the figures of this study. NCL is developed by UCAR/NCAR/CISL/TDD and available online (UCAR/NCAR/CISL/TDD, 2017).
The supplement related to this article is available online at: https://doi.org/10.5194/acp-18-5655-2018-supplement.
KDG analysed the EMAC and final in situ data, conducted the Lagrangian calculations, produced the plots and drafted the paper. HS conceived the study, led the HALO ESMVal campaign and interpreted EMAC and in situ data. RB wrote and helped with the code that facilitated the HYSPLIT calculations. PJ led the ESCiMo project, coordinated the preparation of the EMAC simulations and conducted them. DSC and PG prepared a significant part of the boundary conditions, and VG was responsible for the ProdO3 and LossO3 diagnostics in the ESCiMo simulations. VE conceived and led the ESMVal project. TJW, CV, AZ and HZ supplied in situ measurements. All authors contributed to the text.
The authors declare that they have no conflict of interest.
This article is part of the special issue “The Modular Earth Submodel System (MESSy) (ACP/GMD inter-journal SI)”. It is not associated with a conference.
The authors gratefully thank Hella Garny and Peter Hoor for valuable comments on the manuscript, Angela Baker, Brice Barret, Björn Brötz, James Crawford, Franziska Frank, Heidi Huntrieser, Paul Konopka, Rolf Müller, Matthias Nützel, Laura Pan, Rongcai Ren, Michelle Santee, Michael Schultz, Gabriele Stiller and Bärbel Vogel for helpful discussions, and the ACAM (Atmospheric Composition and the Asian Monsoon; http://www2.acom.ucar.edu/acamTS13, last accessed: 9 April 2018) activity for providing a forum. We thank the German Science Foundation (DFG) for funding within HALO-SPP 1294 under the contracts JU 3059/1-1, SCHL 1857/2-2, SCHL 1857/4-1, VO 1504/2-1 and VO 1504/4-1. The HALO ESMVal aircraft campaign was funded by the DLR project ESMVal. Klaus-Dirk Gottschaldt and Hans Schlager appreciate support by the EU project StratoClim (grant no. 603557) and BMBF project Spitfire (grant no. 01LG1205B). Christiane Voigt and Tina Jurkat-Witschas are thankful for financing from the Helmholtz Association under contract no. VH-NG-309 and under contract no. W2/W3-60. In addition we thank the flight department of DLR for their great support during the campaign. Peter Hoor and Stefan Müller contributed to the CO measurements and Stefan Kaufmann supervised the HCl measurements during the flight.
The EMAC model simulations were performed at the German Climate Computing Centre (DKRZ) with support from the Bundesministerium für Bildung und Forschung (BMBF). DKRZ and its scientific steering committee are gratefully acknowledged for providing the HPC and data archiving resources for the projects 853 (ESCiMo – Earth System Chemistry integrated Modelling) and 854 (ESMVal).
Last but not least we thank the two anonymous reviewers for their insightful
comments regarding LiNOx, convective and isentropic transport, which
greatly helped to improve the paper.
The article processing charges for this open-access
publication were covered by a Research
Centre of the Helmholtz Association.
Edited by: Marc von Hobe
Reviewed by: two anonymous referees
Akritidis, D., Pozzer, A., Zanis, P., Tyrlis, E., Škerlak, B., Sprenger, M., and Lelieveld, J.: On the role of tropopause folds in summertime tropospheric ozone over the eastern Mediterranean and the Middle East, Atmos. Chem. Phys., 16, 14025–14039, https://doi.org/10.5194/acp-16-14025-2016, 2016.
Baker, A. K., Schuck, T. J., Slemr, F., van Velthoven, P., Zahn, A., and Brenninkmeijer, C. A. M.: Characterization of non-methane hydrocarbons in Asian summer monsoon outflow observed by the CARIBIC aircraft, Atmos. Chem. Phys., 11, 503–518, https://doi.org/10.5194/acp-11-503-2011, 2011.
Barret, B., Sauvage, B., Bennouna, Y., and Le Flochmoen, E.: Upper-tropospheric CO and O3 budget during the Asian summer monsoon, Atmos. Chem. Phys., 16, 9129–9147, https://doi.org/10.5194/acp-16-9129-2016, 2016.
Bergman, J. W., Fierli, F., Jensen, E. J., Honomichl, S., and Pan, L. L.: Boundary layer sources for the Asian anticyclone: Regional contributions to a vertical conduit, J. Geophys. Res.-Atmos., 118, 2560–2575, https://doi.org/10.1002/jgrd.50142, 2013.
Boos, W. R. and Kuang, Z.: Dominant control of the South Asian monsoon by orographic insulation versus plateau heating, Nature, 463, 218–222, https://doi.org/10.1038/nature08707, 2010.
Boos, W. R. and Hurley, J. V.: Thermodynamic Bias in the Multimodel Mean Boreal Summer Monsoon, J. Climate, 26, 2279–2287, https://doi.org/10.1175/jcli-d-12-00493.1, 2013.
Brenninkmeijer, C. A. M., Crutzen, P., Boumard, F., Dauer, T., Dix, B., Ebinghaus, R., Filippi, D., Fischer, H., Franke, H., Frieß, U., Heintzenberg, J., Helleis, F., Hermann, M., Kock, H. H., Koeppel, C., Lelieveld, J., Leuenberger, M., Martinsson, B. G., Miemczyk, S., Moret, H. P., Nguyen, H. N., Nyfeler, P., Oram, D., O'Sullivan, D., Penkett, S., Platt, U., Pupek, M., Ramonet, M., Randa, B., Reichelt, M., Rhee, T. S., Rohwer, J., Rosenfeld, K., Scharffe, D., Schlager, H., Schumann, U., Slemr, F., Sprung, D., Stock, P., Thaler, R., Valentino, F., van Velthoven, P., Waibel, A., Wandel, A., Waschitschek, K., Wiedensohler, A., Xueref-Remy, I., Zahn, A., Zech, U., and Ziereis, H.: Civil Aircraft for the regular investigation of the atmosphere based on an instrumented container: The new CARIBIC system, Atmos. Chem. Phys., 7, 4953–4976, https://doi.org/10.5194/acp-7-4953-2007, 2007.
Cecil, D. J.: LIS/OTD 2.5 Degree Low Resolution Monthly Climatology Time Series (LRMTS): Data set available online from the NASA Global Hydrology Resource Center DAAC, Huntsville, Alabama, USA, https://doi.org/10.5067/LIS/LIS-OTD/DATA311 (last access: 18 September 2017), 2006.
Cristofanelli, P., Bracci, A., Sprenger, M., Marinoni, A., Bonafè, U., Calzolari, F., Duchi, R., Laj, P., Pichon, J. M., Roccato, F., Venzac, H., Vuillermoz, E., and Bonasoni, P.: Tropospheric ozone variations at the Nepal Climate Observatory-Pyramid (Himalayas, 5079 m a.s.l.) and influence of deep stratospheric intrusion events, Atmos. Chem. Phys., 10, 6537–6549, https://doi.org/10.5194/acp-10-6537-2010, 2010.
Crutzen, P. J. and Schmailzl, U.: Chemical budgets of the stratosphere, Planet. Space Sci., 31, 1009–1032, 1983.
Deckert, R., Jöckel, P., Grewe, V., Gottschaldt, K.-D., and Hoor, P.: A quasi chemistry-transport model mode for EMAC, Geosci. Model Dev., 4, 195–206, https://doi.org/10.5194/gmd-4-195-2011, 2011.
Dee, D. P., Uppala, S. M., Simmons, A. J., Berrisford, P., Poli, P., Kobayashi, S., Andrae, U., Balmaseda, M. A., Balsamo, G., Bauer, P., Bechtold, P., Beljaars, A. C. M., van de Berg, L., Bidlot, J., Bormann, N., Delsol, C., Dragani, R., Fuentes, M., Geer, A. J., Haimberger, L., Healy, S. B., Hersbach, H., Hólm, E. V., Isaksen, L., Kållberg, P., Köhler, M., Matricardi, M., McNally, A. P., Monge-Sanz, B. M., Morcrette, J. J., Park, B. K., Peubey, C., de Rosnay, P., Tavolato, C., Thépaut, J. N., and Vitart, F.: The ERA-Interim reanalysis: configuration and performance of the data assimilation system, Q. J. Roy. Meteor. Soc., 137, 553–597, https://doi.org/10.1002/qj.828, 2011.
Dethof, A., O'Neill, A., Slingo, J. M., and Smit, H. G. J.: A mechanism for moistening the lower stratosphere involving the Asian summer monsoon, Q. J. Roy. Meteor. Soc., 125, 1079–1106, https://doi.org/10.1002/qj.1999.49712555602, 1999.
Draxler, R. R. and Hess, G. D.: An overview of the HYSPLIT_4 modelling system for trajectories, dispersion and deposition, Aust. Meteorol. Mag., 47, 295–308, 1998.
Draxler, R. R. and Rolph, G.: HYSPLIT (HYbrid Single-ParticleLagrangian Integrated Trajectory) model, available at: http://www.arl.noaa.gov/ready/hysplit4.html, last access: 26 June 2015.
Dunkerton, T. J.: Evidence of meridional motion in the summer lower stratosphere adjacent to monsoon regions, J. Geophys. Res., 100, 16675–16688, https://doi.org/10.1029/95JD01263, 1995.
Ehhalt, D. H. and Rohrer, F.: The impact of commercial aircraft on tropospheric ozone, Proceedings of the 7th BOC Priestley Conference, Lewisburg, Pennsylvania, USA, 24–27 June 1994, 1994.
Fischer, H., Wienhold, F. G., Hoor, P., Bujok, O., Schiller, C., Siegmund, P., Ambaum, M., Scheeren, H. A., and Lelieveld, J.: Tracer correlations in the northern high latitude lowermost stratosphere: Influence of cross-tropopause mass exchange, Geophys. Res. Lett., 27, 97–100, https://doi.org/10.1029/1999gl010879, 2000.
Flohn, H.: Recent investigation on the mechanism of the “summer monsoon” of southern and eastern Asia, in: Proc. Symp. Monsoon of the World, New Delhi, 19–21 February 1958, 75–88, 1960.
Fu, R., Hu, Y., Wright, J. S., Jiang, J. H., Dickinson, R. E., Chen, M., Filipiak, M., Read, W. G., Waters, J. W., and Wu, D. L.: Short circuit of water vapor and polluted air to the global stratosphere by convective transport over the Tibetan Plateau, P. Natl. Acad. Sci. USA, 103, 5664–5669, https://doi.org/10.1073/pnas.0601584103, 2006.
Garny, H. and Randel, W. J.: Dynamic variability of the Asian monsoon anticyclone observed in potential vorticity and correlations with tracer distributions, J. Geophys. Res.-Atmos., 118, 13421–13433, https://doi.org/10.1002/2013jd020908, 2013.
Garny, H. and Randel, W. J.: Transport pathways from the Asian monsoon anticyclone to the stratosphere, Atmos. Chem. Phys., 16, 2703–2718, https://doi.org/10.5194/acp-16-2703-2016, 2016.
Gettelman, A., Hoor, P., Pan, L. L., Randel, W. J., Hegglin, M. I., and Birner, T.: The Extratropical Upper Troposphere and Lower Stratosphere, Rev. Geophys., 49, RG3003, https://doi.org/10.1029/2011rg000355, 2011.
Goswami, B. N.: South Asian monsoon, in: Intraseasonal Variability in the Atmosphere-Ocean Climate System, 2nd ed., edited by: Lau, W. K. M. and Waliser, D. E., Springer-Verlag, Berlin, Heidelberg, Germany, 21–72, 2012.
Gottschaldt, K., Voigt, C., Jöckel, P., Righi, M., Deckert, R., and Dietmüller, S.: Global sensitivity of aviation NOx effects to the HNO3-forming channel of the HO2 + NO reaction, Atmos. Chem. Phys., 13, 3003–3025, https://doi.org/10.5194/acp-13-3003-2013, 2013.
Gottschaldt, K.-D., Schlager, H., Baumann, R., Bozem, H., Eyring, V., Hoor, P., Jöckel, P., Jurkat, T., Voigt, C., Zahn, A., and Ziereis, H.: Trace gas composition in the Asian summer monsoon anticyclone: a case study based on aircraft observations and model simulations, Atmos. Chem. Phys., 17, 6091–6111, https://doi.org/10.5194/acp-17-6091-2017, 2017.
Grewe, V., Brunner, D., Dameris, M., Grenfell, J. L., Hein, R., Shindell, D., and Staehelin, J.: Origin and variability of upper tropospheric nitrogen oxides and ozone at northern mid-latitudes, Atmos. Environ., 35, 3421–3433, 2001.
Grewe, V.: Impact of Lightning on Air Chemistry and Climate, in: Lightning: Principles, Instruments and Applications, edited by: Betz, H. D., Schumann, U., and Laroche, P., Springer Science+Business Media B. V., Dordrecht, 537–549, 2009.
Grewe, V., Tsati, E., Mertens, M., Frömming, C., and Jöckel, P.: Contribution of emissions to concentrations: the TAGGING 1.0 submodel based on the Modular Earth Submodel System (MESSy 2.52), Geosci. Model Dev., 10, 2615–2633, https://doi.org/10.5194/gmd-10-2615-2017, 2017.
Grooß, J. U., Brühl, C., and Peter, T.: Impact of aircraft emissions on tropospheric and stratospheric ozone. Part 1: Chemistry and 2-d model results, Atmos. Environ., 32, 3171–3184, 1998.
HALO database: https://halo-db.pa.op.dlr.de, last access: 9 April 2018.
Holton, J. R., Haynes, P. H., McIntyre, M. E., Douglass, A. R., Rood, R. B., and Pfister, L.: Stratosphere-troposphere exchange, Rev. Geophys., 33, 403–439, https://doi.org/10.1029/95RG02097, 1995.
Hoor, P., Fischer, H., Lange, L., Lelieveld, J., and Brunner, D.: Seasonal variations of a mixing layer in the lowermost stratosphere as identified by the CO-O3 correlation from in situ measurements, J. Geophys. Res., 107, 4044, https://doi.org/10.1029/2000jd000289, 2002.
Hoor, P., Gurk, C., Brunner, D., Hegglin, M. I., Wernli, H., and Fischer, H.: Seasonality and extent of extratropical TST derived from in-situ CO measurements during SPURT, Atmos. Chem. Phys., 4, 1427–1442, https://doi.org/10.5194/acp-4-1427-2004, 2004.
Hsu, C. J. and Plumb, R. A.: Nonaxisymmetric Thermally Driven Circulations and Upper-Tropospheric Monsoon Dynamics, J. Atmos. Sci., 57, 1255–1276, https://doi.org/10.1175/1520-0469(2000)057<1255:NTDCAU>2.0.CO;2, 2001.
IPCC: Climate Change 2013: The Physical Science Basis. Contribution of Working Group I to the Fifth Assessment Report of the Intergovernmental Panel on Climate Change, edited by: Stocker, T. F., Qin, D., Plattner, G.-K., Tignor, M., Allen, S. K., Boschung, J., Nauels, A., Xia, Y., Bex, V., and Midgley, P. M., Cambridge University Press, Cambridge, UK and New York, NY, USA,, 1535 pp., 2013.
Jaeglé, L., Jacob, D. J., Brune, W. H., Tan, D., Faloona, I. C., Weinheimer, A. J., Ridley, B. A., Campos, T. L., and Sachse, G. W.: Sources of HOxand production of ozone in the upper troposphere over the United States, Geophys. Res. Lett., 25, 1709–1712, https://doi.org/10.1029/98gl00041, 1998.
Jöckel, P., Tost, H., Pozzer, A., Brühl, C., Buchholz, J., Ganzeveld, L., Hoor, P., Kerkweg, A., Lawrence, M. G., Sander, R., Steil, B., Stiller, G., Tanarhte, M., Taraborrelli, D., van Aardenne, J., and Lelieveld, J.: The atmospheric chemistry general circulation model ECHAM5/MESSy1: consistent simulation of ozone from the surface to the mesosphere, Atmos. Chem. Phys., 6, 5067–5104, https://doi.org/10.5194/acp-6-5067-2006, 2006.
Jöckel, P., Kerkweg, A., Pozzer, A., Sander, R., Tost, H., Riede, H., Baumgaertner, A., Gromov, S., and Kern, B.: Development cycle 2 of the Modular Earth Submodel System (MESSy2), Geosci. Model Dev., 3, 717–752, https://doi.org/10.5194/gmd-3-717-2010, 2010.
Jöckel, P., Tost, H., Pozzer, A., Kunze, M., Kirner, O., Brenninkmeijer, C. A. M., Brinkop, S., Cai, D. S., Dyroff, C., Eckstein, J., Frank, F., Garny, H., Gottschaldt, K.-D., Graf, P., Grewe, V., Kerkweg, A., Kern, B., Matthes, S., Mertens, M., Meul, S., Neumaier, M., Nützel, M., Oberländer-Hayn, S., Ruhnke, R., Runde, T., Sander, R., Scharffe, D., and Zahn, A.: Earth System Chemistry integrated Modelling (ESCiMo) with the Modular Earth Submodel System (MESSy) version 2.51, Geosci. Model Dev., 9, 1153–1200, https://doi.org/10.5194/gmd-9-1153-2016, 2016.
Jurkat, T., Voigt, C., Kaufmann, S., Zahn, A., Sprenger, M., Hoor, P., Bozem, H., Müller, S., Dörnbrack, A., Schlager, H., Bönisch, H., and Engel, A.: A quantitative analysis of stratospheric HCl, HNO3, and O3 in the tropopause region near the subtropical jet, Geophys. Res. Lett., 41, 3315–3321, https://doi.org/10.1002/2013gl059159, 2014.
Jurkat, T., Kaufmann, S., Voigt, C., Schäuble, D., Jeßberger, P., and Ziereis, H.: The airborne mass spectrometer AIMS – Part 2: Measurements of trace gases with stratospheric or tropospheric origin in the UTLS, Atmos. Meas. Tech., 9, 1907–1923, https://doi.org/10.5194/amt-9-1907-2016, 2016.
Konopka, P., Grooß, J.-U., Günther, G., Ploeger, F., Pommrich, R., Müller, R., and Livesey, N.: Annual cycle of ozone at and above the tropical tropopause: observations versus simulations with the Chemical Lagrangian Model of the Stratosphere (CLaMS), Atmos. Chem. Phys., 10, 121–132, https://doi.org/10.5194/acp-10-121-2010, 2010.
Kunz, A., Sprenger, M., and Wernli, H.: Climatology of potential vorticity streamers and associated isentropic transport pathways across PV gradient barriers, J. Geophys. Res.-Atmos., 120, 3802–3821, https://doi.org/10.1002/2014jd022615, 2015.
Kunze, M., Braesicke, P., Langematz, U., Stiller, G., Bekki, S., Brühl, C., Chipperfield, M., Dameris, M., Garcia, R., and Giorgetta, M.: Influences of the Indian Summer Monsoon on Water Vapor and Ozone Concentrations in the UTLS as Simulated by Chemistry–Climate Models, J. Climate, 23, 3525–3544, https://doi.org/10.1175/2010jcli3280.1, 2010.
Lawrence, M. G. and Lelieveld, J.: Atmospheric pollutant outflow from southern Asia: a review, Atmos. Chem. Phys., 10, 11017–11096, https://doi.org/10.5194/acp-10-11017-2010, 2010.
Lelieveld, J., Crutzen, P. J., Ramanathan, V., Andreae, M. O., Brenninkmeijer, C. A. M., Campos, T., Cass, G. R., Dickerson, R. R., Fischer, H., de Gouw, J. A., Hansel, A., Jefferson, A., Kley, D., de Laat, A. T. J., Lal, S., Lawrence, M. G., Lobert, J. M., Mayol-Bracero, O. L., Mitra, A. P., Novakov, T., Oltmans, S. J., Prather, K. A., Reiner, T., Rodhe, H., Scheeren, H. A., Sikka, D., and Williams, J.: The Indian Ocean Experiment: Widespread Air Pollution from South and Southeast Asia, Science, 291, 1031–1036, https://doi.org/10.1126/science.1057103, 2001.
Lelieveld, J., Berresheim, H., Borrmann, S., Crutzen, P. J., Dentener, F. J., Fischer, H., Feichter, J., Flatau, P. J., Heland, J., Holzinger, R., Korrmann, R., Lawrence, M. G., Levin, Z., Markowicz, K. M., Mihalopoulos, N., Minikin, A., Ramanathan, V., de Reus, M., Roelofs, G. J., Scheeren, H. A., Sciare, J., Schlager, H., Schultz, M., Siegmund, P., Steil, B., Stephanou, E. G., Stier, P., Traub, M., Warneke, C., Williams, J., and Ziereis, H.: Global Air Pollution Crossroads over the Mediterranean, Science, 298, 794–799, https://doi.org/10.1126/science.1075457, 2002.
Lelieveld, J., Hoor, P., Jöckel, P., Pozzer, A., Hadjinicolaou, P., Cammas, J.-P., and Beirle, S.: Severe ozone air pollution in the Persian Gulf region, Atmos. Chem. Phys., 9, 1393–1406, https://doi.org/10.5194/acp-9-1393-2009, 2009.
Li, Q., Jacob, D. J., Logan, J. A., Bey, I., Yantosca, R. M., Liu, H., Martin, R. V., Fiore, A. M., Field, B. D., Duncan, B. N., and Thouret, V.: A Tropospheric Ozone Maximum Over the Middle East, Geophys. Res. Lett., 28, 3235–3238, https://doi.org/10.1029/2001GL013134, 2001.
Li, Q., Jiang, J. H., Wu, D. L., Read, W. G., Livesey, N. J., Waters, J. W., Zhang, Y., Wang, B., Filipiak, M. J., Davis, C. P., Turquety, S., Wu, S., Park, R. J., Yantosca, R. M., and Jacob, D. J.: Convective outflow of South Asian pollution: A global CTM simulation compared with EOS MLS observations, Geophys. Res. Lett., 32, L14826, https://doi.org/10.1029/2005gl022762, 2005.
Lin, J.-L., Weickman, K. M., Kiladis, G. N., Mapes, B. E., Schubert, S. D., Suarez, M. J., Bacmeister, J. T., and Lee, M.-I.: Subseasonal Variability Associated with Asian Summer Monsoon Simulated by 14 IPCC AR4 Coupled GCMs, J. Climate, 21, 4541–4567, https://doi.org/10.1175/2008jcli1816.1, 2008.
Liu, J. J., Jones, D. B. A., Worden, J. R., Noone, D., Parrington, M., and Kar, J.: Analysis of the summertime buildup of tropospheric ozone abundances over the Middle East and North Africa as observed by the Tropospheric Emission Spectrometer instrument, J. Geophys. Res., 114, D05304, https://doi.org/10.1029/2008jd010993, 2009.
Liu, J. J., Jones, D. B. A., Zhang, S., and Kar, J.: Influence of interannual variations in transport on summertime abundances of ozone over the Middle East, J. Geophys. Res., 116, D20310, https://doi.org/10.1029/2011jd016188, 2011.
Liu, Y., Wang, Y., Liu, X., Cai, Z., and Chance, K.: Tibetan middle tropospheric ozone minimum in June discovered from GOME observations, Geophys. Res. Lett., 36, L05814, https://doi.org/10.1029/2008gl037056, 2009.
Lopez, P.: A Lightning Parameterization for the ECMWF Integrated Forecasting System, Mon. Weather Rev., 144, 3057–3075, https://doi.org/10.1175/mwr-d-16-0026.1, 2016.
Lubis, S. W. and Nakamura, N.: Stratospheric Influence on Summer Monsoon and Associated Planetary Wave Breaking and Mixing in the Subtropical Tropopause Region, AGU Fall Meeting, A51N-05, 15 December 2017, New Orleans, LA, USA, 2017.
Marcy, T. P., Fahey, D. W., Gao, R. S., Popp, P. J., Richard, E. C., Thompson, T. L., Rosenlof, K. H., Ray, E. A., Salawitch, R. J., Atherton, C. S., Bergmann, D. J., Ridley, B. A., Weinheimer, A. J., Loewenstein, M., Weinstock, E. M., and Mahoney, M. J.: Quantifying Stratospheric Ozone in the Upper Troposphere with in Situ Measurements of HCl, Science, 304, 261–265, https://doi.org/10.1126/science.1093418, 2004.
Müller, S., Hoor, P., Bozem, H., Gute, E., Vogel, B., Zahn, A., Bönisch, H., Keber, T., Krämer, M., Rolf, C., Riese, M., Schlager, H., and Engel, A.: Impact of the Asian monsoon on the extratropical lower stratosphere: trace gas observations during TACTS over Europe 2012, Atmos. Chem. Phys., 16, 10573–10589, https://doi.org/10.5194/acp-16-10573-2016, 2016.
Nützel, M., Dameris, M., and Garny, H.: Movement, drivers and bimodality of the South Asian High, Atmos. Chem. Phys., 16, 14755–14774, https://doi.org/10.5194/acp-16-14755-2016, 2016.
Pan, L. L., Randel, W. J., Gary, B. L., Mahoney, M. J., and Hintsa, E. J.: Definitions and sharpness of the extratropical tropopause: A trace gas perspective, J. Geophys. Res.-Atmos., 109, D23103, https://doi.org/10.1029/2004jd004982, 2004.
Pan, L. L., Honomichl, S. B., Kinnison, D., Abalos, M., Randel, W. J., Bergman, J. W., and Bian, J.: Transport of chemical tracers from the boundary layer to stratosphere associated with the dynamics of the Asian summer monsoon, J. Geophys. Res.-Atmos., 121, 1–16, https://doi.org/10.1002/2016JD025616, 2016.
Park, M., Randel, W. J., Emmons, L. K., Bernath, P. F., Walker, K. A., and Boone, C. D.: Chemical isolation in the Asian monsoon anticyclone observed in Atmospheric Chemistry Experiment (ACE-FTS) data, Atmos. Chem. Phys., 8, 757–764, https://doi.org/10.5194/acp-8-757-2008, 2008.
Park, M., Randel, W. J., Emmons, L. K., and Livesey, N. J.: Transport pathways of carbon monoxide in the Asian summer monsoon diagnosed from Model of Ozone and Related Tracers (MOZART), J. Geophys. Res., 114, D08303, https://doi.org/10.1029/2008jd010621, 2009.
Ploeger, F., Gottschling, C., Griessbach, S., Grooß, J.-U., Guenther, G., Konopka, P., Müller, R., Riese, M., Stroh, F., Tao, M., Ungermann, J., Vogel, B., and von Hobe, M.: A potential vorticity-based determination of the transport barrier in the Asian summer monsoon anticyclone, Atmos. Chem. Phys., 15, 13145–13159, https://doi.org/10.5194/acp-15-13145-2015, 2015.
Pokhrel, S., Chaudhari, H. S., Saha, S. K., Dhakate, A., Yadav, R. K., Salunke, K., Mahapatra, S., and Rao, S. A.: ENSO, IOD and Indian Summer Monsoon in NCEP climate forecast system, Clim. Dynam., 39, 2143–2165, https://doi.org/10.1007/s00382-012-1349-5, 2012.
Popovic, J. M. and Plumb, R. A.: Eddy Shedding from the Upper-Tropospheric Asian Monsoon Anticyclone, J. Atmos. Sci., 58, 93–104, https://doi.org/10.1175/1520-0469(2001)058<0093:ESFTUT>2.0.CO;2, 2001.
Randel, W. J. and Park, M.: Deep convective influence on the Asian summer monsoon anticyclone and associated tracer variability observed with Atmospheric Infrared Sounder (AIRS), J. Geophys. Res., 111, D12314, https://doi.org/10.1029/2005jd006490, 2006.
Randel, W. J., Pan, L. L., and Bian, J.: Workshop on dynamics, transport and chemistry of the UTLS Asian Monsoon, Adv. Atmos. Sci., 33, 1096–1098, https://doi.org/10.1007/s00376-016-6169-9, 2016.
Rauthe-Schöch, A., Baker, A. K., Schuck, T. J., Brenninkmeijer, C. A. M., Zahn, A., Hermann, M., Stratmann, G., Ziereis, H., van Velthoven, P. F. J., and Lelieveld, J.: Trapping, chemistry, and export of trace gases in the South Asian summer monsoon observed during CARIBIC flights in 2008, Atmos. Chem. Phys., 16, 3609–3629, https://doi.org/10.5194/acp-16-3609-2016, 2016.
re3data.org: HALO database; editing status 2018-02-07; re3data.org – Registry of Research Data Repositories, https://doi.org/10.17616/R39Q0T, last access: 28 March 2018.
Ren, R., Wu, G., Cai, M., Sun, S., Liu, X., and Li, W.: Progress in Research of Stratosphere-Troposphere Interactions: Application of Isentropic Potential Vorticity Dynamics and the Effects of the Tibetan Plateau, J. Meteor. Res., 28, 714–731, https://doi.org/10.1007/s13351-014-4026-2, 2014.
Richards, N. A. D., Arnold, S. R., Chipperfield, M. P., Miles, G., Rap, A., Siddans, R., Monks, S. A., and Hollaway, M. J.: The Mediterranean summertime ozone maximum: global emission sensitivities and radiative impacts, Atmos. Chem. Phys., 13, 2331–2345, https://doi.org/10.5194/acp-13-2331-2013, 2013.
Rodwell, M. J. and Hoskins, B. A.: Monsoons and the dynamics of deserts, Q. J. Roy. Meteor. Soc., 122, 1385–1404, https://doi.org/10.1002/qj.49712253408, 1996.
Safieddine, S., Boynard, A., Hao, N., Huang, F., Wang, L., Ji, D., Barret, B., Ghude, S. D., Coheur, P.-F., Hurtmans, D., and Clerbaux, C.: Tropospheric ozone variability during the East Asian summer monsoon as observed by satellite (IASI), aircraft (MOZAIC) and ground stations, Atmos. Chem. Phys., 16, 10489–10500, https://doi.org/10.5194/acp-16-10489-2016, 2016.
Santee, M. L., Manney, G. L., Livesey, N. J., Schwartz, M. J., Neu, J. L., and Read, W. G.: A comprehensive overview of the climatological composition of the Asian summer monsoon anticyclone based on 10 years of Aura Microwave Limb Sounder measurements, J. Geophys. Res.-Atmos., 122, 5491-5514, https://doi.org/10.1002/2016jd026408, 2017.
Scheeren, H. A., Lelieveld, J., Roelofs, G. J., Williams, J., Fischer, H., de Reus, M., de Gouw, J. A., Warneke, C., Holzinger, R., Schlager, H., Klüpfel, T., Bolder, M., van der Veen, C., and Lawrence, M.: The impact of monsoon outflow from India and Southeast Asia in the upper troposphere over the eastern Mediterranean, Atmos. Chem. Phys., 3, 1589–1608, https://doi.org/10.5194/acp-3-1589-2003, 2003.
Schiller, C. L., Bozem, H., Gurk, C., Parchatka, U., Königstedt, R., Harris, G. W., Lelieveld, J., and Fischer, H.: Applications of quantum cascade lasers for sensitive trace gas measurements of CO, CH4, N2O and HCHO, App. Phys. B, 92, 419–430, https://doi.org/10.1007/s00340-008-3125-0, 2008.
Schuck, T. J., Brenninkmeijer, C. A. M., Baker, A. K., Slemr, F., von Velthoven, P. F. J., and Zahn, A.: Greenhouse gas relationships in the Indian summer monsoon plume measured by the CARIBIC passenger aircraft, Atmos. Chem. Phys., 10, 3965–3984, https://doi.org/10.5194/acp-10-3965-2010, 2010.
Schumann, U. and Huntrieser, H.: The global lightning-induced nitrogen oxides source, Atmos. Chem. Phys., 7, 3823–3907, https://doi.org/10.5194/acp-7-3823-2007, 2007.
Seinfeld, J. H. and Pandis, S. N.: Relative roles of VOC and NOx in ozone formation, in: Atmospheric Chemistry and Physics, John Wiley & Sons, New York, 209–303, 1998.
Seinfeld, J. H. and Pandis, S. N.: Atmospheric chemistry and physics: from air pollution to climate change, 2nd edition ed., John Wiley & Sons, Inc., Hoboken, New Jersey, 151–154 and 224–225, 2006.
Sprung, D. and Zahn, A.: Acetone in the upper troposphere/lowermost stratosphere measured by the CARIBIC passenger aircraft: Distribution, seasonal cycle, and variability, J. Geophys. Res., 115, D16301, https://doi.org/10.1029/2009jd012099, 2010.
Stratmann, G., Ziereis, H., Stock, P., Brenninkmeijer, C. A. M., Zahn, A., Rauthe-Schöch, A., Velthoven, P. V., Schlager, H., and Volz-Thomas, A.: NO and NOy in the upper troposphere: Nine years of CARIBIC measurements onboard a passenger aircraft, Atmos. Environ., 133, 93–111, https://doi.org/10.1016/j.atmosenv.2016.02.035, 2016.
Tiedtke, M.: A comprehensive mass flux scheme for cumulus parameterization in large-scale models, Mon. Weather Rev., 117, 1179–1800, 1989.
Tost, H.: Global Modelling of Cloud, Convection and Precipitation Influences on Trace Gases and Aerosols, PhD, University Bonn, Bonn, 2006.
Tost, H., Jöckel, P., and Lelieveld, J.: Lightning and convection parameterisations – uncertainties in global modelling, Atmos. Chem. Phys., 7, 4553-4568, 2007.
Tyrlis, E., Škerlak, B., Sprenger, M., Wernli, H., Zittis, G., and Lelieveld, J.: On the linkage between the Asian summer monsoon and tropopause fold activity over the eastern Mediterranean and the Middle East, J. Geophys. Res.-Atmos., 119, 3202–3221, https://doi.org/10.1002/2013jd021113, 2014.
UCAR/NCAR/CISL/TDD: The NCAR Command Language (Version 6.3.0) (Software), Boulder, Colorado, USA, https://doi.org/10.5065/D6WD3XH5, 2017.
Vogel, B., Günther, G., Müller, R., Grooß, J. U., Hoor, P., Krämer, M., Müller, S., Zahn, A., and Riese, M.: Fast transport from Southeast Asia boundary layer sources to northern Europe: rapid uplift in typhoons and eastward eddy shedding of the Asian monsoon anticyclone, Atmos. Chem. Phys., 14, 12745–12762, https://doi.org/10.5194/acp-14-12745-2014, 2014.
Voigt, C., Jessberger, P., Jurkat, T., Kaufmann, S., Baumann, R., Schlager, H., Bobrowski, N., Giuffrida, G., and Salerno, G.: Evolution of CO2, SO2, HCl, and HNO3 in the volcanic plumes from Etna, Geophys. Res. Lett., 41, 2196–2203, https://doi.org/10.1002/2013GL058974, 2014.
Yan, R.-C., Bian, J.-C., and Fan, Q.-J.: The Impact of the South Asia High Bimodality on the Chemical Composition of the Upper Troposphere and Lower Stratosphere, Atmos. Ocean. Sci. Lett., 4, 229–234, 2011.
Zahn, A., Weppner, J., Widmann, H., Schlote-Holubek, K., Burger, B., Kühner, T., and Franke, H.: A fast and precise chemiluminescence ozone detector for eddy flux and airborne application, Atmos. Meas. Tech., 5, 363–375, https://doi.org/10.5194/amt-5-363-2012, 2012.
Ziereis, H., Schlager, H., and Schulte, P.: Distributions of NO, NOx, and NOy in the upper troposphere and lower stratosphere between 28∘ and 61∘ N during POLINAT 2, J. Geophys. Res., 105, 3653–3664, https://doi.org/10.1029/1999JD900870, 2000.
Net O3 production in the UT is determined by ProdO3 rather than by LossO3 (Supplement, Figs. S6, S9, S17), so it is sufficient to analyse ProdO3 in this context.
- Abstract
- Introduction
- Data
- The ASMA region
- Tracer–tracer relations in September 2012
- Simulated intra-annual variability of trace gas dynamics in the monsoon region
- Processes and their interplay in the ASMA
- Summary
- Data availability
- Author contributions
- Competing interests
- Special issue statement
- Acknowledgements
- References
- Supplement