the Creative Commons Attribution 3.0 License.
the Creative Commons Attribution 3.0 License.
Near-field emission profiling of tropical forest and Cerrado fires in Brazil during SAMBBA 2012
Amy K. Hodgson
William T. Morgan
Sebastian O'Shea
Stéphane Bauguitte
James D. Allan
Eoghan Darbyshire
Michael J. Flynn
Dantong Liu
James Lee
Ben Johnson
Jim M. Haywood
Karla M. Longo
Paulo E. Artaxo
We profile trace gas and particulate emissions from near-field airborne measurements of discrete smoke plumes in Brazil during the 2012 biomass burning season. The South American Biomass Burning Analysis (SAMBBA) Project conducted during September and October 2012 sampled across two distinct fire regimes prevalent in the Amazon Basin. Combined measurements from a Compact Time-of-Flight Aerosol Mass Spectrometer (C-ToF-AMS) and a Single Particle Soot Photometer (SP2) are reported for the first time in a tropical biomass burning environment. Emissions from a mostly smouldering tropical forest wildfire in Rondônia state and numerous smaller flaming Cerrado fires in Tocantins state are presented. While the Cerrado fires appear to be representative of typical fire conditions in the existing literature, the tropical forest wildfire likely represents a more extreme example of biomass burning with a bias towards mostly smouldering emissions. We determined fire-integrated modified combustion efficiencies, emission ratios and emission factors for trace gas and particulate components for these two fire types, alongside aerosol microphysical properties. Seven times more black carbon was emitted from the Cerrado fires per unit of fuel combustion (EFBC of 0.13 ± 0.04 g kg−1) compared to the tropical forest fire (EFBC of 0.019 ± 0.006 g kg−1), and more than 6 times the amount of organic aerosol was emitted from the tropical forest fire per unit of fuel combustion (EFOM of 8.00 ± 2.53 g kg−1, EFOC of 5.00 ± 1.58 g kg−1) compared to the Cerrado fires (EFOM of 1.31 ± 0.42 g kg−1, EFOC of 0.82 ± 0.26 g kg−1).
Particulate-phase species emitted from the fires sampled are generally lower than those reported in previous studies and in emission inventories, which is likely a combination of differences in fire combustion efficiency and fuel mixture, along with different measurement techniques. Previous modelling studies focussed on the biomass burning season in tropical South America have required significant scaling up of emissions to reproduce in situ and satellite aerosol concentrations over the region. Our results do not indicate that emission factors used in inventories are biased low, which could be one potential cause of the reported underestimates in modelling studies. This study supplements and updates trace gas and particulate emission factors for fire-type-specific biomass burning in Brazil for use in weather and climate models. The study illustrates that initial fire conditions can result in substantial differences in terms of their emitted chemical components, which can potentially perturb the Earth system.
- Article
(33908 KB) - Full-text XML
-
Supplement
(7269 KB) - BibTeX
- EndNote


Atmospheric aerosols represent the largest uncertainty in current understanding of radiative forcing of climate (Boucher et al., 2013), with biomass burning aerosol (BBA) aerosol–radiation interactions estimated to have a radiative forcing of 0.0 Wm−2 but with a very large uncertainty of ±0.2 Wm−2 and significant perturbations on the regional scale (Boucher et al., 2013). BBAs have both a global and a regional effect on weather and climate via perturbation of the atmospheric radiation balance and cloud microphysical properties (Ramanathan et al., 2001; Andreae et al., 2004) and visibility (Andreae et al., 1988), and they can also affect human health (Cançado et al., 2006; Arbex et al., 2007; do Carmo et al., 2013). Biomass burning in the tropics contributes more than 80 % of all the emissions produced from total biomass burning globally (Ward et al., 1992). The Amazon Basin in Brazil contains approximately 4 × 10⁶ km2 of evergreen tropical forest (Christian et al., 2007), and during the dry season (August–October) intense widespread burning occurs, leading to high levels of atmospheric particulate matter (Chand et al., 2006). A range of climate and fire types occurs in Brazil, with fire-impacted ecosystems including pure grassland, a gradient of wooded savannah into dry (seasonal) tropical forest and evergreen tropical forest (Ward et al., 1992; Yamasoe et al., 2000). Deforestation and Cerrado (savannah-like) fires are commonly used for land clearing and pasture maintenance (Martin et al., 2010), which leads to high levels of black carbon, organic matter and gas-phase species in the atmosphere. Detailed representation of the emissions and properties of gas- and particulate-phase species from BB in Brazil are therefore required in global climate models for their outputs to be accurate and reliable (Bowman et al., 2009).
Emissions from BB are quantified either by emission ratios (ERs or ERx∕y, the relative excess amounts of two smoke species, x and y) or emission factors (EFs, grams of species released per kilogram of dry fuel burnt), and these are used in order to compute trace gas and particulates released from biomass burning fires. Numerous scientific studies have taken place to study smoke from biomass burning both in the field (e.g. Reid and Hobbs, 1998) and in the laboratory (e.g. McMeeking et al., 2009). Every fire is unique, differing in vegetation type and a dynamic, variable mix of combustion phases, e.g. flaming or smouldering, while other factors such as moisture content of the fuel, the environmental conditions and whether the vegetation is dead or alive can alter the emissions of certain BB species (e.g. Ward et al., 1996; Yokelson et al., 1996). However, while there is significant inter-fire variability, fires over a particular region often exist within broader distinct regimes depending on the dominant fuel type and combustion properties. Recent studies by McMeeking et al. (2009) and Akagi et al. (2011) have compiled emissions from different vegetation types and showed large variations in the composition of the emitted species and their overall abundance. All of these previous studies provide data for emission inventories, which can then be directly used in atmospheric models. However, due to the large uncertainties and factors influencing BB emissions, further understanding of these emission variations is needed.
Recent instrument developments including the Time of Flight Aerosol Mass Spectrometer (ToF-AMS, Aerodyne Research, Inc., Billerica, MA, USA; Canagaratna et al., 2007) and a Single Particle Soot Photometer (SP2, Droplet Measurement Technologies, Boulder, CO, USA; Stephens et al., 2003) have been used recently to study biomass burning emissions in North America (e.g. Kondo et al., 2011; Akagi et al., 2012; May et al., 2014; Jolleys et al., 2015; Liu et al., 2016). Previous measurements of the chemical composition of particulate emissions from South American tropical biomass burning were conducted over a decade ago using filter-based sampling, which have known biases (e.g. Bond and Bergstrom, 2006; Chow et al., 2007; Lack et al., 2008; Petzold et al., 2013; Bond et al., 2013). The South American Biomass Burning Analysis Project (SAMBBA) is the first experiment to utilise both of these instruments in a tropical environment for studies of biomass burning. These fire-type-specific measurements are important as recent biomass burning studies in Brazil have found a shift from forest to savannah burning, which will impact trace gas and particulate emissions in the region (Ten Hoeve et al., 2012; Chen et al., 2013).
The airborne campaign of SAMBBA conducted 20 flights from 13 September to 4 October 2012. Two of the flights focussed on near-source biomass burning emissions, sampling across contrasting environments in terms of vegetation and fire regime. We present emission ratios and emission factors for a range of gas- and particle-phase species, alongside measurements of the physical and chemical properties of the plumes sampled by the aircraft.
2.1 Instrumentation
In situ measurements presented here took place on the UK Facility for Airborne Atmospheric Measurement (FAAM) British Aerospace 146 (BAe-146) Atmospheric Research Aircraft. The BAe-146 aircraft has a wide range of instruments on board, but only those relevant to the analysis are discussed below. Mass concentrations of particulate species are reported at standard temperature and pressure in micrograms per standard cubic metre (µg sm−3, where sm−3 refers to standard cubic metre at 273.15 K and 1013.25 hPa).
A compact variant of the ToF-AMS (C-ToF-AMS) provided real-time, size-resolved mass measurements of non-refractory (NR) organic aerosol (OA) and inorganic component mass: sulfate, nitrate, chloride and ammonium (Drewnick et al., 2005; Canagaratna et al., 2007). This instrument provides quantitative high-time-resolution data with high precision and accuracy, making it ideal for use in aircraft campaigns. Measured mass concentrations for the C-ToF-AMS have an uncertainty of approximately 30 % (Bahreini et al., 2009). Previous studies by Crosier et al. (2007), Morgan et al. (2009) and Morgan et al. (2010) have detailed the sampling strategy and calibration protocols for the AMS on the BAe-146. Plume interceptions utilised the “fast mass spectrum” mode of the AMS (Kimmel et al., 2011), which provided data at 1 s time resolution. The instrument was calibrated using monodisperse ammonium nitrate and ammonium sulfate to provide the ionisation efficiency of nitrate, along with relative ionisation efficiencies for sulfate and ammonium. A collection efficiency of 1.0 was applied to the data based on comparisons with a Scanning Mobility Particle Sizer (SMPS) using data from the entire campaign (further details available in Allan et al., 2014). This is supported by the independent measurements of Brito et al. (2014), who also reported a collection efficiency of 1.0 for their Aerosol Chemical Speciation Monitor (ACSM) measurements conducted at a ground site in Porto Velho during the SAMBBA experiment.
The early flights of the campaign (up to and including B737 on 20 September 2012) suffered from a partial blockage of the AMS pinhole (part of the inlet system where particles enter the instrument aerodynamic lens), which reduced the reported mass concentrations. When comparing the AMS concentrations with optical particle counter and total scattering measurements, a clear and consistent discrepancy was evident pre- and post-blockage. In order to correct for this, a scaling factor was applied to recover the mass concentrations by comparing the mass concentrations to total scattering coefficients measured by a TSI nephelometer during low-altitude sampling while the AMS was operating in slow mode. The applied scaling factor was 2.69 ± 0.3 based on measured mass scattering efficiencies of 16.1 ± 0.3 and 5.98 ± 0.3 m2 g−1 for the partially blocked and unblocked flights respectively and is applied to the data for B737 in this study. The scaling factor represents an additional uncertainty in the AMS mass concentrations for this flight.
The SP2 provides a determination of the single-particle BC mass, the number of particles containing BC and the total mass of particles containing refractory black carbon (rBC) species (Baumgardner et al., 2004; Schwarz et al., 2006). The term rBC is defined as the incandescent material measured by the SP2, following the definition of Petzold et al. (2013). The SP2 instrument operation and subsequent data interpretation have been described elsewhere (Liu et al., 2010; McMeeking et al., 2010). Calibration of the SP2 incandescence signal in order to calculate single-particle rBC mass was accomplished using monodisperse Aquadag BC particle standards (Aqueous Deflocculated Acheson Graphite, manufactured by Acheson Inc., USA) using a scaling factor of 0.75 (Baumgardner et al., 2012). A 30 % uncertainty in the SP2 black carbon mass is used as in previous studies (e.g. McMeeking et al., 2010, 2012). The SP2 sample flow rate was approximately 120 vccm and operated without sample dilution. During near-source plume sampling, multiple coincident particles may be sampled at the same time by the instrument, and such peaks in each single-particle event are identified by the data analysis software, with the mass loading being the summation of the single-particle masses from the identified peak signals. An offline comparison of the SP2 with a Sunset OC ∕ EC measurement at very high BC mass loadings was performed by measuring the direct diesel emissions using the Manchester aerosol chamber (Liu et al., 2017), which suggested a high correlation between both measurements under high BC mass loading (up to approximately 15 µg sm−3). Above this limit, the SP2 measurement was biased low. Several plume interceptions exceeded this concentration limit, but the impact on BC mass concentration is expected to be relatively small given that the effect is predominantly on small particles with limited mass (Yuan et al., 2017).
The C-ToF-AMS and SP2 both sampled via Rosemount inlets (Foltescu et al., 1995). These have been shown to enhance aerosol concentrations dependent on the mean bulk density of the aerosol sample (Trembath et al., 2012), with the enhancement being largest for the super-micron size range (e.g. up to a factor of 10 for Saharan dust). For European pollution aerosol, which has a comparable density to BBA, the enhancement is negligible for particles below an optical diameter of 0.6 µm. Given the size ranges of the C-ToF-AMS and SP2 and the general dominance of sub-micron aerosol in this environment based on size distribution measurements, limited enhancement is expected for the measurements presented here.
The C-ToF-AMS and SP2 measured downstream of Nafion driers to prevent condensation of water in the inlet lines, which, combined with the cabin temperature exceeding the ambient temperature, resulted in the sample being dried to a significant extent. Nafion driers are subject to losses, which will add additional uncertainties to the measured concentrations that have been ignored in our subsequent uncertainty calculations. Sample line relative humidity measurements were typically between 20 and 60 % during flights in Rondônia and from 20 to 30 % in Tocantins at the flight altitudes of interest here.
The Fast Greenhouse Gas Analyzer (FGGA, Model RMT-200, Los Gatos Research Ltd, USA) utilises a cavity-enhanced absorption spectrometer to provide high-accuracy 1 Hz measurements of carbon dioxide and methane mixing ratios with a 0.1 % uncertainty (O'Shea et al., 2013), and the vacuum ultraviolet (VUV) fast fluorescence CO analyser measures carbon monoxide mixing ratios with a 2 % uncertainty (Hopkins et al., 2006; O'Shea et al., 2013).
2.2 Biomass burning emission calculations
2.2.1 Background ambient and in-plume measurements
Excess mixing ratios of species x (Δx) are needed in order to calculate the ER and EF of a species. In order to calculate Δx, the ambient background mixing ratios of species x must be subtracted from the values measured in the smoke plume. The ambient background mixing ratio was defined as the fifth percentile for each species while outside the plume during constant-altitude runs in the boundary layer for each flight. Plume identification was performed manually based on the time series of CO, OA and rBC. We note the discussion by Yokelson et al. (2013) that examines the limitations of the excess mixing ratios approach due to changes in background air composition through tropospheric mixing; as our measurements were made close to initial source through numerous plume intercepts on both flights and background concentrations were constant throughout, we do not consider this mixing of background air into the plume to be a significant effect in this study.
The numerous instruments on board the BAe-146 each had different response times and inlet lag times, leading to difficulties when comparing data from different instruments. Therefore, an integral-based approach was used which helps to compensate for these different response times (Yokelson et al., 1996, 2009, 2011; Karl et al., 2007). Integrated methods have been found to be more robust and decrease uncertainty compared to the direct point-by-point method (Karl et al., 2007).
Given the AMS measures organic matter (OM), rather than organic carbon (OC), which is the most typical reported value for OA in the literature and emission inventories, OM ∕ OC is converted using a value of 1.6 following the work of Yokelson et al. (2009) and Akagi et al. (2012) for fresh biomass burning. The OM ∕ OC ratio value is composition, source and age dependent, with values ranging from 1.4 for fresh urban aerosol to 2.2 for aged non-urban aerosol (Turpin and Lim, 2001); therefore this adds another source of uncertainty to the calculated OC emissions.
2.2.2 Modified combustion efficiency
The combustion efficiency (CE) and modified combustion efficiency (MCE) can be used to define the relative amount of flaming or smouldering combustion taking place. The CE is defined as the ratio of carbon emitted as CO2 to the total carbon emitted. Total carbon emitted includes CO2, CO, CH4, non-methane organic gases and carbon-containing particulates (Ward and Radke, 1993). Measuring all of these emitted carbon species can be difficult in field campaigns; therefore we use the MCE which is defined below following Ward and Radke (1993):
CE and MCE are closely related with a difference of only a few percent, as CO and CO2 represent the majority of the carbon species emitted (Ward and Radke, 1993; Ferek et al., 1998). MCE can be interpreted as a relative scale of varying degrees of smouldering and flaming combustion; values greater than 90 % are typically biased towards a fire in the flaming stage, whereas a MCE less than 90 % is defined as being biased towards the smouldering phase (Ward and Radke, 1993). The excess concentrations of CO and CO2 were integrated over the plume interception time to give integrated excess values. These values for each plume interception were then plotted with the intercept forced to zero to give the fire average MCE.
2.2.3 Emission ratio
ERs are calculated to give the relative emission of species x to a simultaneously measured reference gas, usually CO or CO2 as these gases are non-reactive and conserved (Andreae and Merlet, 2001; Sinha et al., 2003). The ER of species x using CO as the reference gas is defined below:
For gas-phase species, ERx is usually given as the molar ratio, and for aerosol species ER is stated as the mass ratio at 273.15 K and 1013.25 hPa. When only one pass is made through a BB plume, the calculation of ERx is trivial using the equation above. The ERx can also be derived when multiple passes are made through the BB plume by using the regression slope of the excess species concentration of x versus the reference species with the line forced through zero (Yokelson et al., 1999). This method utilises a simple linear regression that only minimises the sum of the square of the deviations in the y axis. An alternative method is a more complex regression that minimises the sum of the square of the deviations in both the x and y axis weighted by the uncertainty in each individual data point; Paton-Walsh and Yokelson (2017) conclude that the uncertainty associated with the simpler method is insignificant compared to the real overall uncertainty in fire emission ratios. Therefore we use the simpler method in this study, where the excess concentrations of species x and the reference species concentration are integrated over the plume intercept, with the regression slope of these species giving ERx.
Uncertainties in the ERs are derived as the 1-standard-deviation error in the slope of the line of best fit following e.g. Akagi et al. (2012). Such uncertainties will represent an underestimate as they only include random errors given that the uncertainties in each point are correlated.
2.2.4 Emission factor
Another parameter used to define the emission of a particulate species from fires is the EF. EF is reported as the mass of species x emitted per kilogram of dry fuel burnt. The dry fuel burnt is approximated by the total mass of carbon species released in the form of CO2, CO, CH4, non-methane organic gases, particulate carbon etc. (Yokelson et al., 2013; Stockwell et al., 2015). EFs were calculated using the carbon mass balance method (Ward and Radke, 1993; Yokelson et al., 1996). The mass fraction of carbon in the fuel is needed for EF calculation; as this quantity was not measured during the campaign we used a value of 0.5 ± 0.05, which is typical in the literature (e.g. Wooster et al., 2011). Susott et al. (1996) presented data that show the carbon content of Brazilian vegetation ranges from 45 to 55 %. As we only used CO2, CO and CH4 as the carbon-containing species in the EF calculations, our EFs are likely to be overestimated by a few percent (Susott et al., 1996; Andreae and Merlet, 2001), although the particulate-phase carbon is usually only a small fraction of the carbon emitted (Lipsky and Robinson, 2006; McMeeking et al., 2009). The EF for species x (g kg−1) is defined below following Yokelson et al. (1999) and Wooster et al. (2011):
where 1000 g kg−1 is a unit conversion factor; MMx is the molecular mass of species x (g); MMcarbon is the atomic mass of carbon (12); and Cx ∕ CT is the ratio of the number of moles of species x in the plume interception to the total number of moles of carbon, which is calculated following Yokelson et al. (2009) and Wooster et al. (2011):
where ER is the ER of species x to CO2, NCj is the number of carbon atoms in compound j and the sum is over all carbon species including CO2 (e.g. Wooster et al., 2011).
Uncertainties in the EFs are derived in quadrature from the uncertainty in the carbon content of the fuel (0.05) and the uncertainty in the associated ER values.
3.1 Flight overview
Two of the flights during SAMBBA focussed on near-field in situ measurements of active fires. The fires were sampled within the boundary layer, with out-of-plume aerosol samples dominated by biomass burning haze. The general features of the fires are summarised below.
3.1.1 Rondônia flight
Flight B737 (Facility for Airborne Atmospheric Measurements, Natural Environment Research Council, and Met Office, 2014a) took place in Rondônia state in the west of Brazil on 20 September 2012, with take-off at 14:45 UTC (10:45 local time) and a duration of 3 h 45 min. The natural vegetation in Rondônia is characterised by dense Amazonian tropical forest, but the region has become one of the most deforested areas of the Amazon. Figure 1a shows a large smouldering tropical forest fire, which was suspected to be a natural wildfire, likely initiated by lightning. The fire was located in a national park many kilometres from the nearest road, in a region well away from any deforestation. However, we cannot rule out that the fire may have been started by the presence of indigenous people, which would mean the fire was anthropogenic in origin. It is unlikely the fire was a deforestation fire, which is the dominant form of fire in the region and the typical focus of previous campaigns. Moderate Resolution Imaging Spectroradiometer (MODIS) hotspot data from the Terra overpass at 14:26 UTC on 19 September 2012 indicated that this fire likely started on the day before our flight. The near-field plume interceptions shown on the flight track for B737 on Fig. 1b took place at an altitude of 1800 m a.s.l. with far-field interceptions at an altitude of 2500 m a.s.l. The fire was located on a 900 m high plateau; therefore the plume was intercepted at 900 m above the fire, with smoke estimated to be approximately 6 min old (based on vertical wind velocity measurements). This paper only focusses on the near-field measurements to understand initial emissions, while a future publication (Morgan et al., 2018) will characterise the ageing and transformation of the plume downwind.
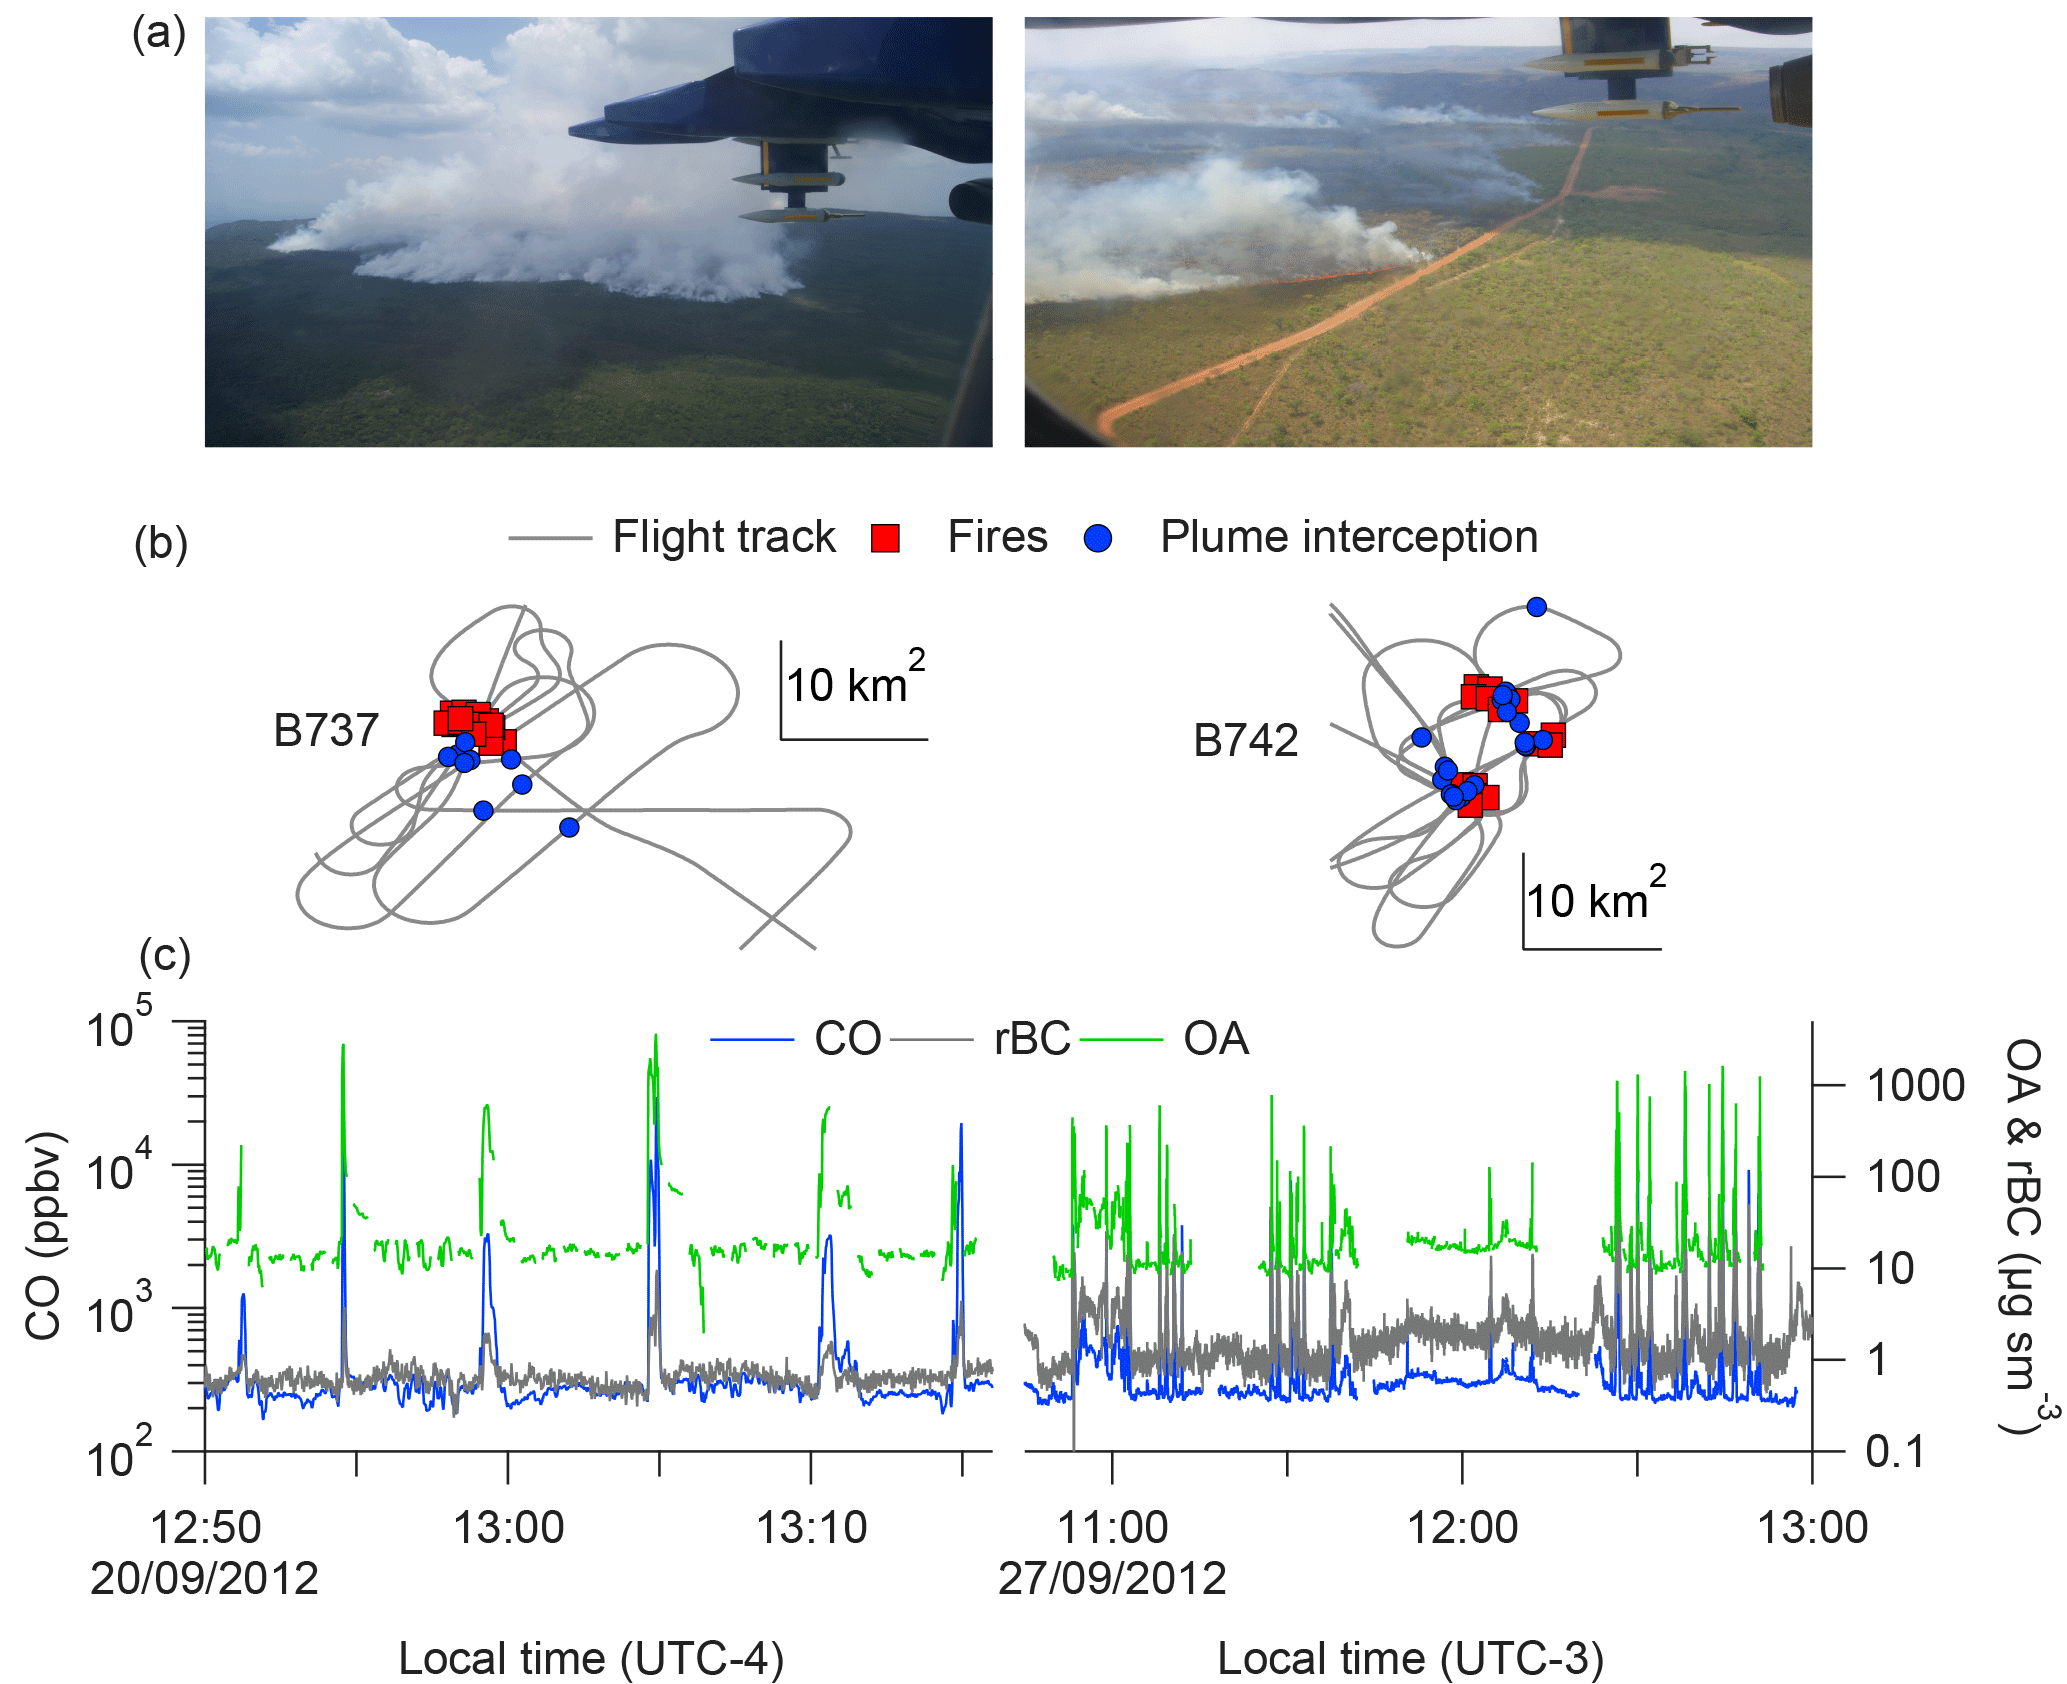
Figure 1Overview of case studies used in the analysis with the Rondônia flight (B737) shown on the left and the Tocantins flight (B742) shown on the right. (a) Photographs taken from the aircraft of the Rondônia and Tocantins fires courtesy of William T. Morgan and Axel Wellpott respectively. Full-size photographs are included in the Supplement. (b) Low-level flight tracks including MODIS hotspot data from Terra and Aqua overpasses for the dates of interest. Plume interceptions are also marked. 10 km2 box represents scale for flight-track. (c) Time series of CO, rBC and OA during the near-field fire sampling periods of the flight.
Some mid-level cloud was present in central Rondônia, and a large pyrocumulus cloud was observed over the BB plume above the boundary layer. Winds were from the north-north-west, and relative humidity outside of plume interceptions was high, with values of around 70 % at 900 m. During this flight, nine separate plume interceptions took place, each lasting approximately 15 s, shown in Fig. 1c, with large increases in CO, rBC and OA clearly visible. Plume interceptions were made prior to the pyrocumulus cloud. Background concentrations of CO, OA and rBC were 213 ppbv, 9.81 µg sm−3 and 0.31 µg sm−3 respectively. Plume maxima ranged from 1261 to 29 554 ppbv for CO, 134 to 3661 µg sm−3 for OA and 1 to 9 µg sm−3 for rBC.
The Rondônia fire MCE of 0.79 ± 0.02 is effectively identical to the MCE of 0.788 for residual smouldering combustion of logs in Brazil from a ground-based experiment (Christian et al., 2007), although compared to other tropical forest-like fires reported in the literature that are summarised in Table 1, the MCE for Rondônia fire is much lower; for example, Ferek et al. (1998) reported a value of 0.87 for tropical deforestation fires in Brazil measured on an aircraft.
3.1.2 Tocantins flight
Flight B742 (Facility for Airborne Atmospheric Measurements, Natural Environment Research Council, and Met Office, 2014b) took place in Tocantins state of Brazil on 27 September 2012, with take-off at 13:00 UTC (10:00 local) and a flight duration of 3 h 15 min. Tocantins state is characterised by Cerrado vegetation, in particular grasslands (campo limpo/campo sujo) and open woodland (Cerrado sensu) forms (Mistry, 1998). Figure 1a shows an example of some of the fires sampled during the Tocantins flight, with flames visible in the closest fire. The vegetation consists mainly of grassland with some trees. During the flight, numerous new fires were starting, which are likely a consequence of man-made agricultural burning based on existing knowledge of fire in the region (e.g. Longo et al., 2013). The BB smoke plumes were sampled at an altitude of 600 m above the fires, with smoke sampled being approximately 4 min old, which we define as initial smoke. The flight track is shown in Fig. 1b, with the MODIS hotspot data from NASA's Terra satellite (Kaufman et al., 1998, 2003; Giglio et al., 2006), shown by the red markers to indicate the fire locations and with the plume interceptions shown by the blue markers.
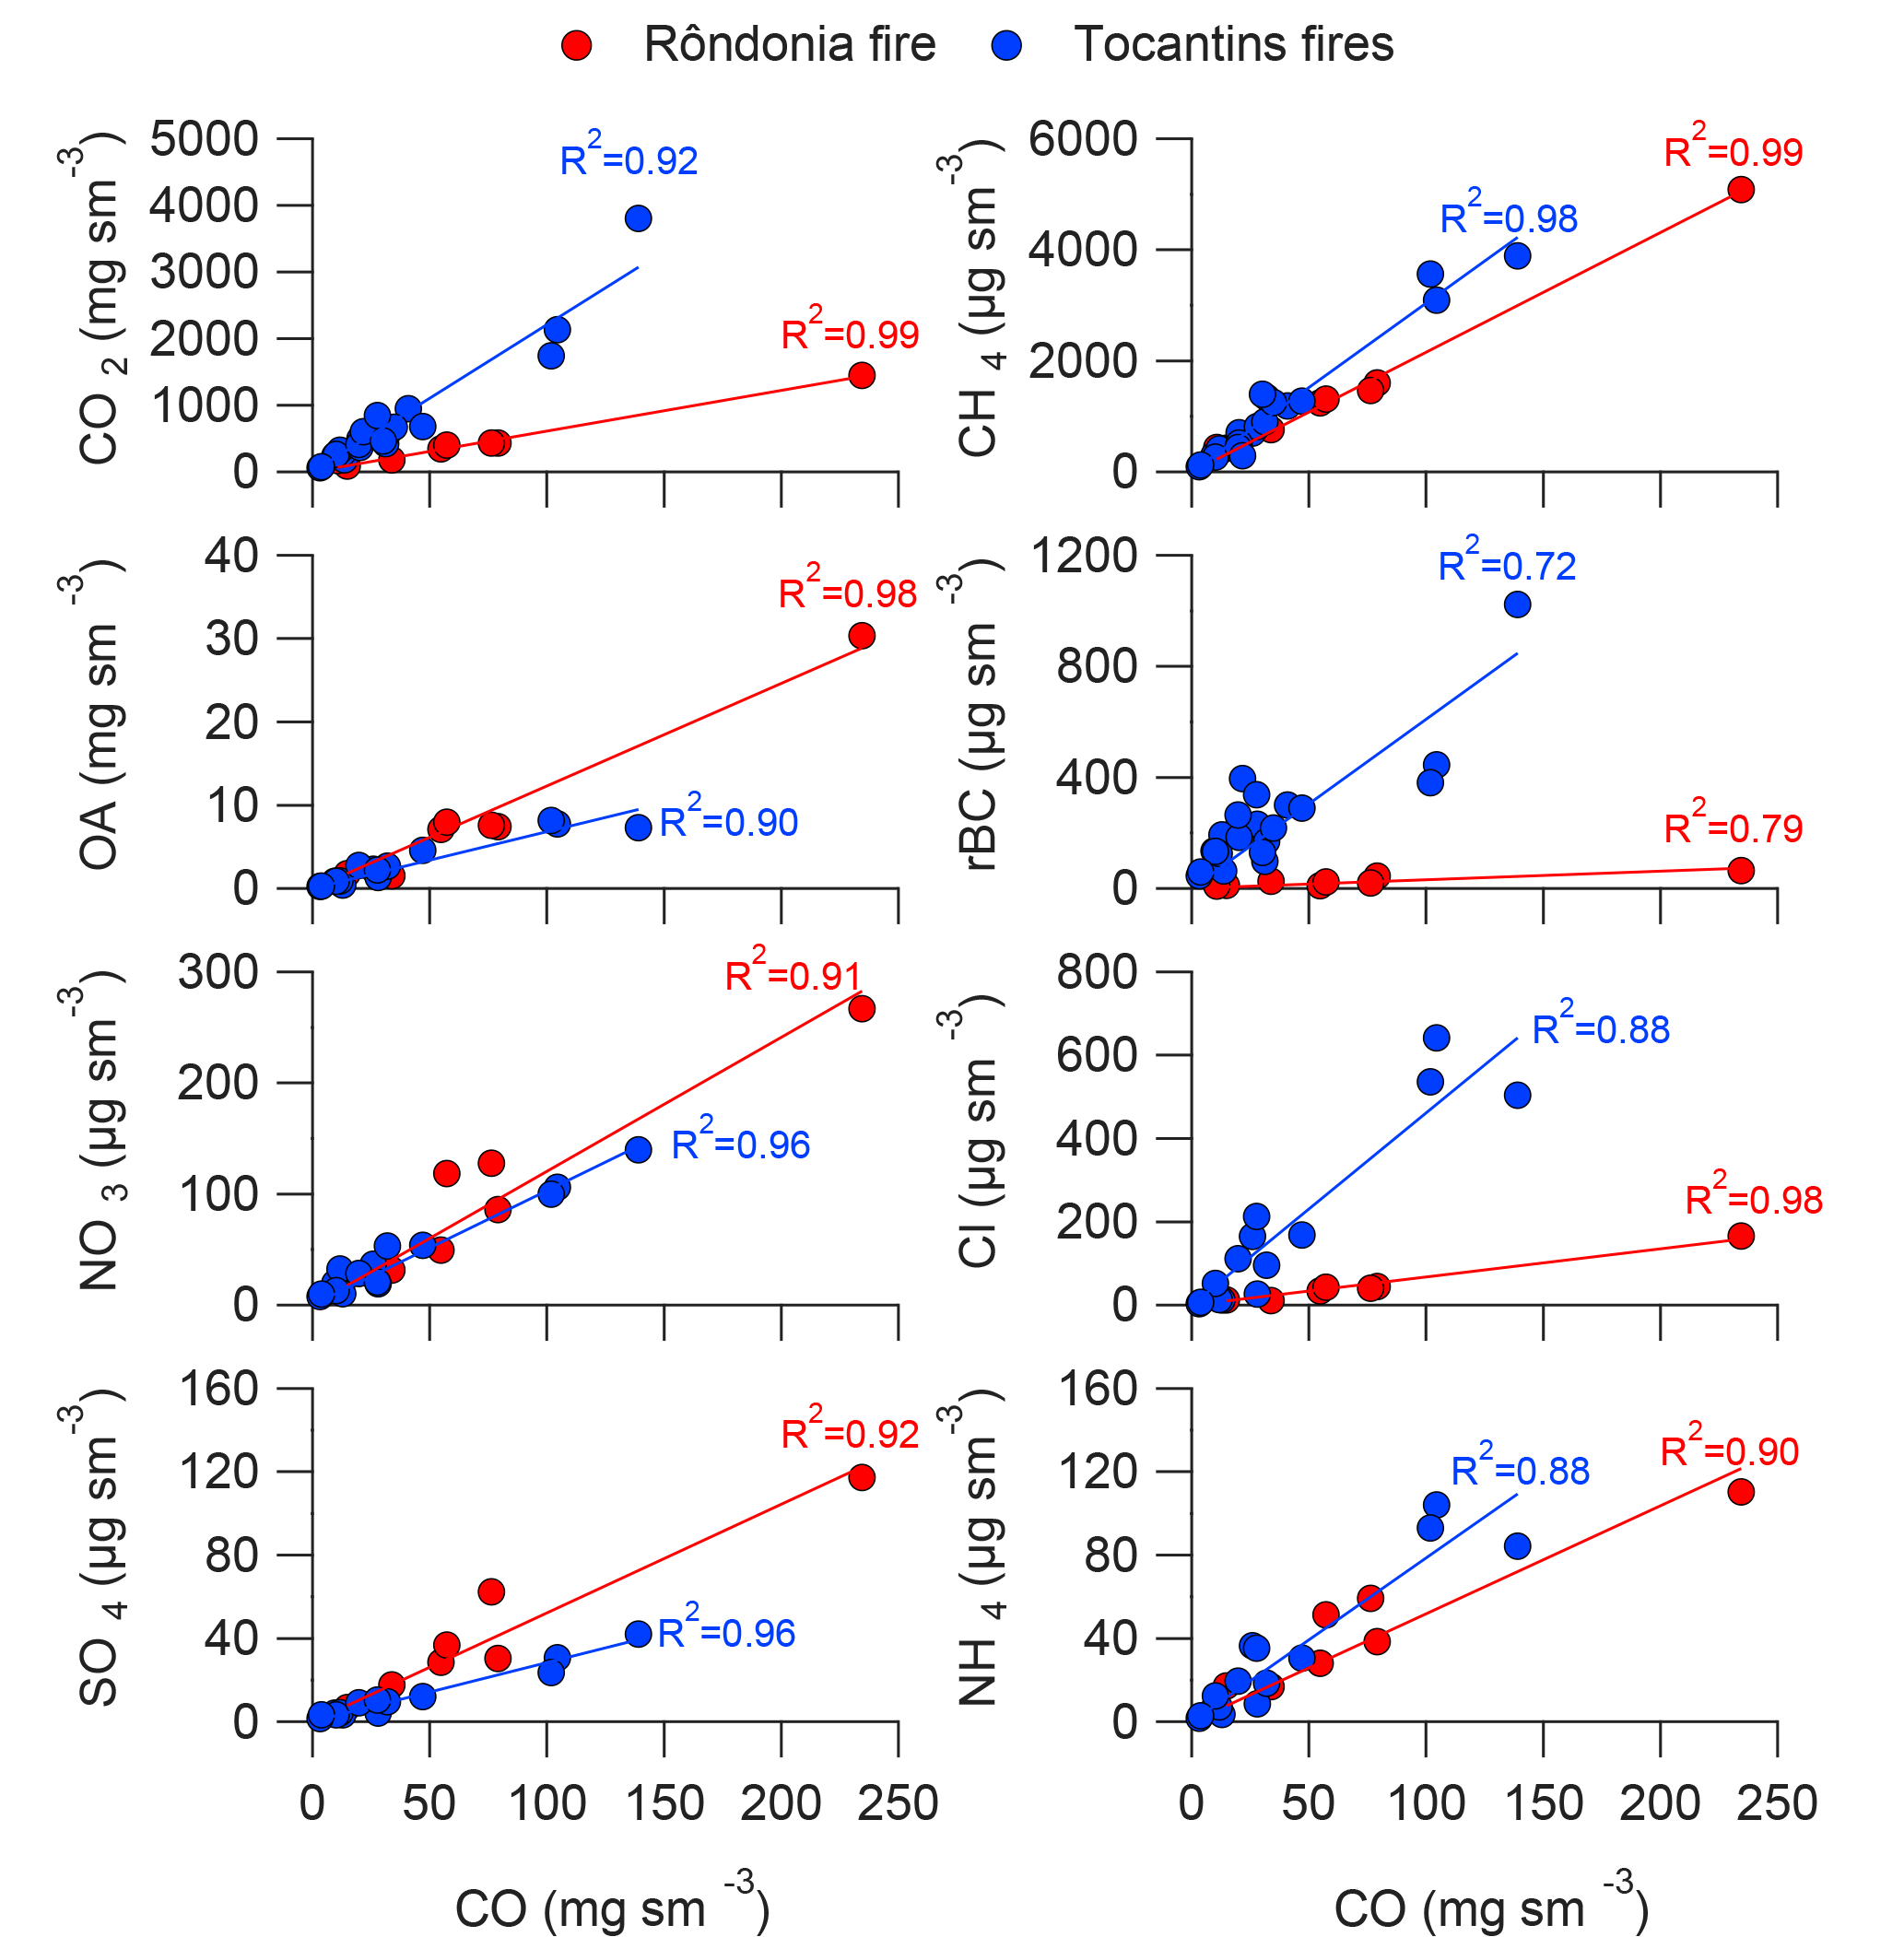
Figure 2Relationship between excess concentrations of trace gas and particulate-phase species relative to excess carbon monoxide for the Rondônia and Tocantins fires. Solid lines show line of best fit from linear regressions forced through zero.
There was little cloud cover in the area, with low relative humidity values of around 30 % at an altitude of 600m outside of plume interceptions, and winds were light, coming from the south-east at 950 hPa. During this flight, 23 plume interceptions took place, each lasting between 5 and 10 s. The plume interceptions can clearly be seen in the time series of CO, rBC and OA shown in Fig. 1c. Background concentrations at 600 m altitude were 228 ppbv for CO, 0.77 µg sm−3 for rBC and 9.31 µg sm−3 for OA. Maximum concentrations in the plume interceptions ranged from 750 to 17 732 ppbv for CO, 10 to 110µg sm−3 for rBC and 65 to 1636 µg sm−3 for OA.
The MCE of the Tocantins fires was 0.94 ± 0.02, identical to similar aircraft measurements of Cerrado fire emissions reported by Ferek et al. (1998). Compared with the existing literature on savannah/Cerrado fires (see Table 1), the Tocantins MCE is very similar; for example, African savannah fires (Yokelson et al., 2003), California chaparral fires (Akagi et al., 2012) and Australian savannah fires (Desservettaz et al., 2017) have similar MCE values of 0.94, 0.93 and 0.86–0.99 respectively.
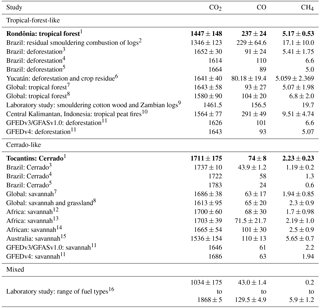
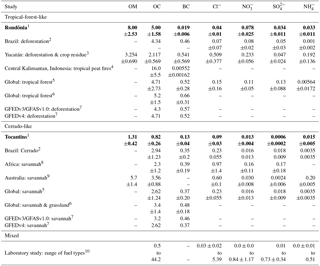
Table 1Modified combustion efficiency (MCE) for the Rondônia fire and the Tocantins fires. Calculation methods as described in Sect. 2.2.2. Also included are other studies MCEs from Brazil and from other locations with the specific fuel type quoted. Values in bold are from this study.
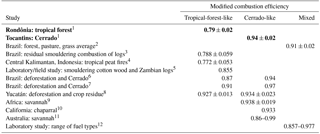
1 This study. 2 Yokelson et al. (2007). 3 Christian et al. (2007). 4 Stockwell et al. (2016). 8 Bertschi et al. (2003). 6 Ferek et al. (1998) following Akagi et al. (2011). 7 Kaufman et al. (1992). 8 Yokelson et al. (2009). 9 Yokelson et al. (2003). 10 Akagi et al. (2011). 11 Desservettaz et al. (2017). 12 McMeeking et al. (2009).
Table 2Emission ratios (ppmv ∕ ppmv) and uncertainties for CO and CH4 with respect to CO (ERx∕CO) and CO2 (ER) for the Rondônia fire and the Tocantins fires. Uncertainties for the two fires shown are 1 standard deviation in the line of best fit. Calculation methods are described in Sect. 2.2.3. Also included are ERs from other studies conducted in Brazil and other locations with the specific fuel type quoted. Values in bold are from this study.
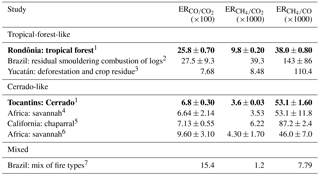
1 This study. 2 Christian et al. (2007). 3 Yokelson et al. (2009). 4 Yokelson et al. (2003). 5 Akagi et al. (2012). 6 Wooster et al. (2011). 7 Crutzen et al. (1985).
3.2 Trace gas emissions
Figure 2 shows the scatter plots used for derivation of the trace gas ERs, with the derived values shown in Table 2, with an uncertainty of 1 standard deviation in the line of best fit. The trace gas species measured on the aircraft are very strongly correlated, with r-squared values between 0.92 and 0.99 illustrating that the plumes are well mixed and that these active fires likely burnt a homogeneous fuel bed. The different points in the Tocantins figures are derived from data from multiple fires, and the lack of variability indicates similarity between the fires, although the level of emission does vary significantly. Table 3 shows the calculated EF values for CO2, CO and CH4. Also presented are reported values from other studies from the literature.
Table 3Trace gas emission factors (g kg−1 of dry fuel burnt) for Rondônia and Tocantins fires determined using the calculations as shown in Sect. 2.2.4. EF values from previous studies in Brazil are included for comparison with the specific fuel type stated. Also included are EFs from different geographical locations around the world and values used in GFEDv3/GFASv1.0 and GFEDv4 emission inventories (van der Werf et al., 2010; Kaiser et al., 2012). Values in bold are from this study.
1 This study. 2 Christian et al. (2007). 3 Ferek et al. (1998) following Akagi et al. (2011). 4 Ward et al. (1992). 5 Kaufman et al. (1992). 6 Yokelson et al. (2009). 7 Akagi et al. (2011). 8 Andreae and Merlet (2001). 9 Bertschi et al. (2003). 10 Stockwell et al. (2016). 11 van der Werf et al. (2010); Kaiser et al. (2012). 12 Sinha et al. (2003). 13 Yokelson et al. (2003). 14 Wooster et al. (2011). 15 Desservettaz et al. (2017). 16 McMeeking et al. (2009).
The Rondônia fire EF of 1447 ± 145 g kg−1 and EFCO of 237 ± 24 g kg−1 are very similar to those reported by Christian et al. (2007) for smouldering logs in Brazil, which were 1346 and 229 g kg−1 respectively. Similarly, measurements of tropical peat fires in Indonesia by Stockwell et al. (2016) are within experimental uncertainties for EF and EFCO compared to our measurements. Our EF is similar to previous studies reporting emission factors for deforestation fires in Brazil, e.g. Ward et al. (1992), Kaufman et al. (1992), Ferek et al. (1998) and Yokelson et al. (2007). However, our EFCO is typically 2–3 times larger than other previous studies in Brazil, other than the Christian et al. (2007) study. Global average values reported in the literature are typically slightly larger in the case of EF and significantly lower in the case of EFCO. Andreae and Merlet (2001) and Akagi et al. (2011) determined tropical forest global averages that were 11 and 14 % larger than our reported EF, while the GFEDv3/4 (Global Fire Emissions Database) and GFASv1.0 (Global Fire Assimilation System) emission inventories (van der Werf et al., 2010; Kaiser et al., 2012) report a value that is 12–14 % greater; EFCO values are 56, 61 and 57–61 % lower.
Our value of 5.17 ± 0.53 g kg−1 for EF is around 3 times lower than was reported by Christian et al. (2007), while being similar to those reported by Ferek et al. (1998), Kaufman et al. (1992) and Yokelson et al. (2007). The global averages for tropical forest also agree well (5.07 ± 1.98 g kg−1 in Akagi et al., 2011; 6.8 ± 2.0 g kg−1 in Andreae and Merlet, 2001). The value of 6.6 g kg−1 used in the GFEDv3 and GFASv1.0 emission inventories for deforestation fires is 28 % higher than our reported value for the Rondônia tropical forest fire, although the latest GFEDv4 release reports a value of 5.07 g kg−1, which is very similar to ours.

Figure 3Mass fraction of aerosol components as a percentage of total aerosol mass including black carbon, organic aerosol, chloride, ammonium, sulfate and nitrate for the Rondônia fire and Tocantins fires, as well as values for previous studies from the Yucatán (Yokelson et al., 2003), Brazil (Ferek et al., 1998), California (Sahu et al., 2012) and North America (Kondo et al., 2011).
Table 4Mass fraction of aerosol components as a percentage of total aerosol mass including black carbon, organic aerosol, chloride, ammonium, sulfate and nitrate for the Rondônia fire and Tocantins fires, as well as values from previous studies. Ferek et al. (1998) and Yokelson et al. (2009) reported a percentage total including other particulate matter that we did not measure in our study; therefore we recalculated the values presented just including BC, organics and inorganics in order to compare values. OA for the two Brazilian values estimated assuming OM ∕ OC is 1.6 in fresh smoke (Yokelson et al., 2009; Akagi et al., 2012). Values in bold are from this study.
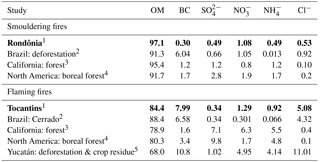
1 This study. 2 Ferek et al. (1998). 3 Sahu et al. (2012). 4 Kondo et al. (2011). 5 Yokelson et al. (2009).
Emission factors for CO2 and CO for the Tocantins were 1711 ± 175 g kg−1 and 74 ± 8 g kg−1, which are similar to existing values reported in the literature for Cerrado fires in Brazil. Similarly, our observed EF is comparable to global average savannah and grassland values from Andreae and Merlet (2001) and Akagi et al. (2011), which are 6 and 1 % lower respectively, while being 4 % higher than the value of 1646 g kg−1 used in the GFEDv3 and GFASv1.0 emission inventories for savannah fires. For EFCO, our value is 14, 17, 21 and 17 % larger than those reported by Andreae and Merlet (2001), Akagi et al. (2011), GFEDv3/GFASv1.0 and GFEDv4 emission inventories respectively. The Tocantins fires EF value of 2.23 ± 0.23 g kg−1 is similar to previous measurements of Cerrado fires in Brazil and global average savannah fires.
3.3 Particulate emissions
The total excess mass of aerosol species integrated over the plume interceptions as a percentage of the total mass of aerosols measured (BC, OA, chloride, ammonium, sulfate and nitrate) is presented in Fig. 3 and Table 4.
The aerosol emitted by the Rondônia fire was composed of over 97 % organic mass, greater than the value of 91.3 % reported by Ferek et al. (1998) for a smouldering Brazilian tropical forest fire. The Ferek et al. (1998) value of 6.04 % for BC mass is over an order of magnitude greater than our value for smouldering tropical forest BC mass of 0.3 %.
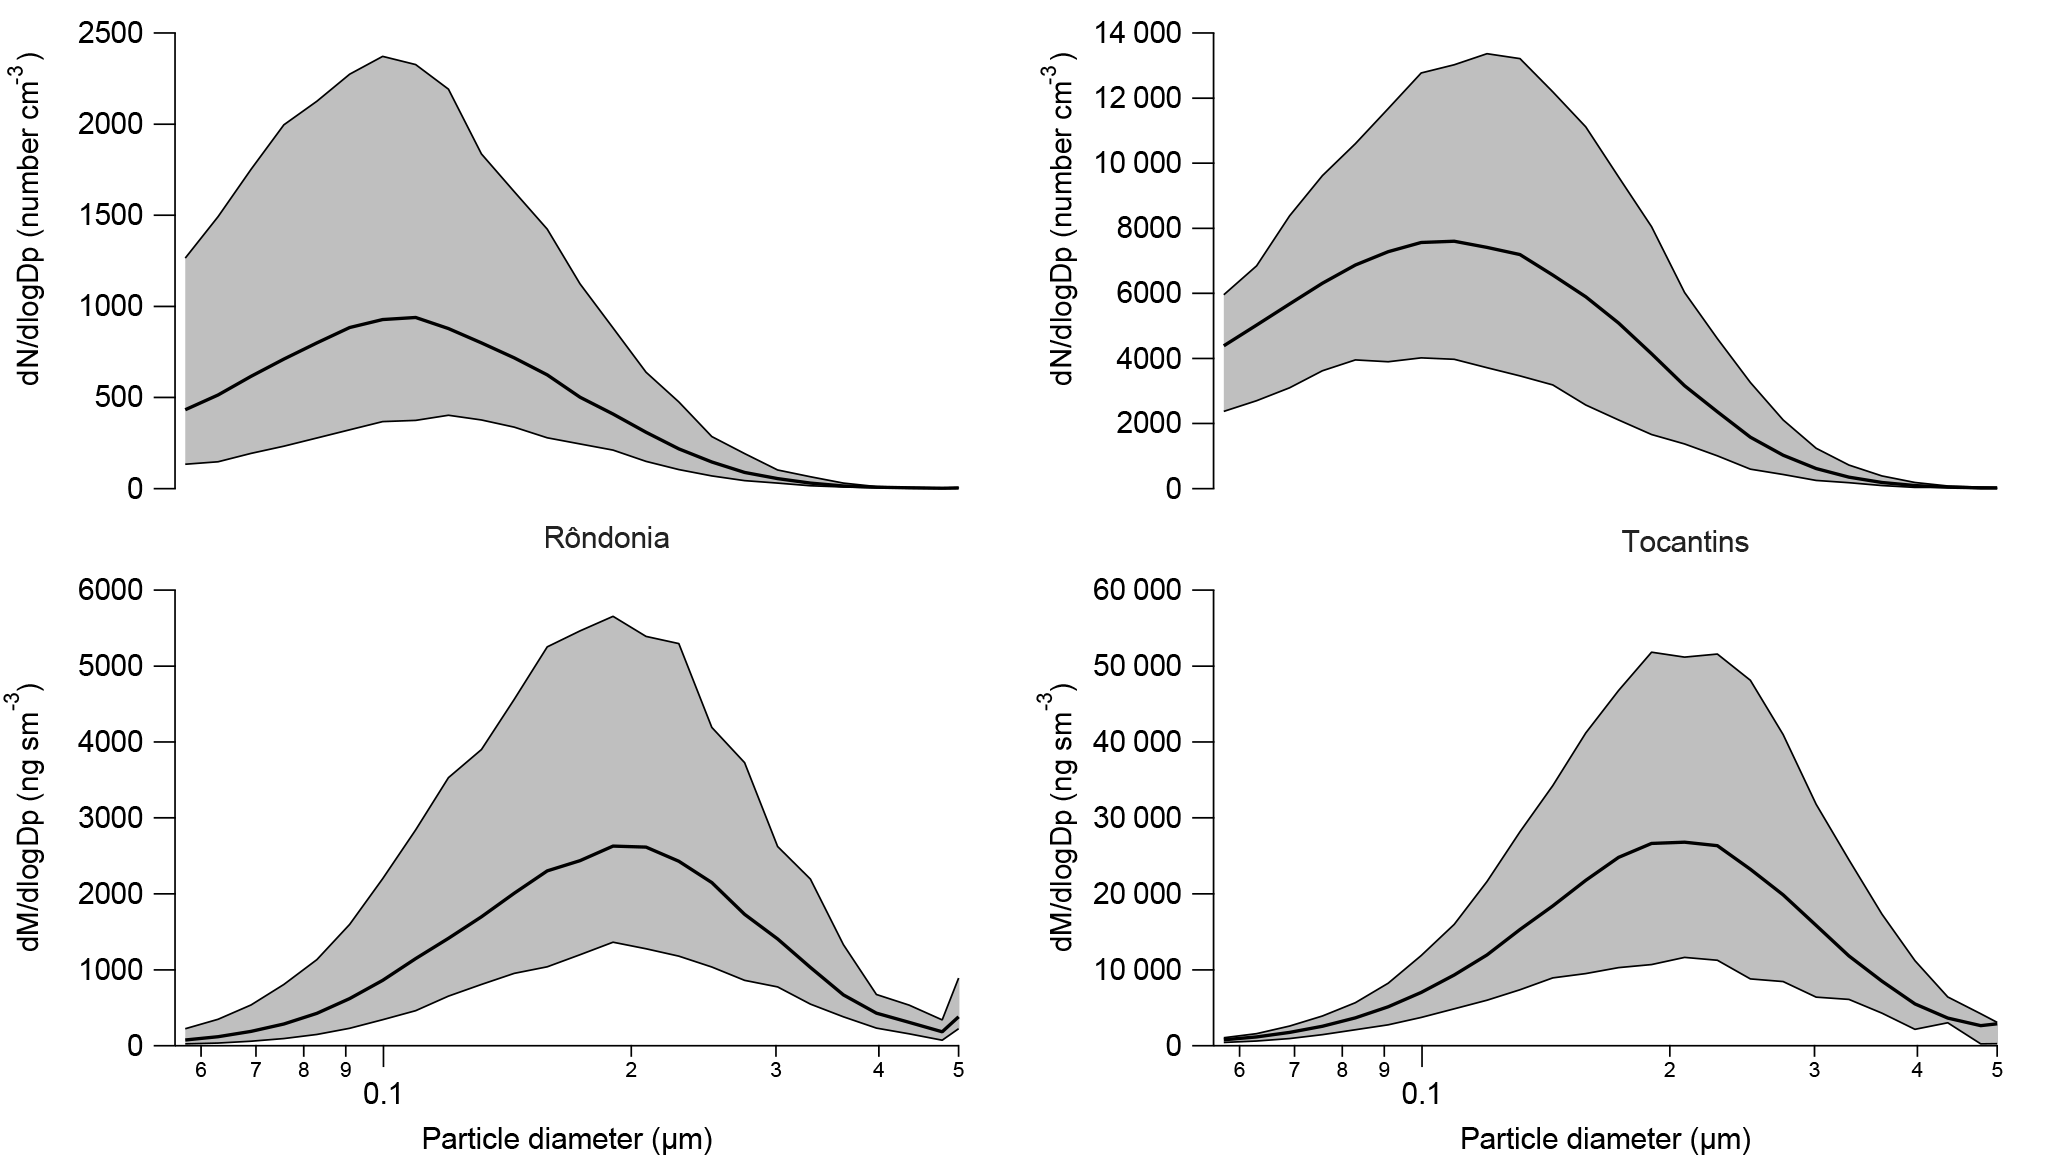
Figure 4Black carbon number and mass size distributions for in-plume measurements of the Rondônia and Tocantins fires. The grey bound shading indicates the minimum and maximum size distributions from the plume intercepts on each flight, and the solid black line gives the average over all plume interceptions. Note the difference in scales between Rondônia and Tocantins size distributions.
The value of 88.4 % for OM for Cerrado fires in Brazil reported by Ferek et al. (1998) is similar to our value of 84.4 % for the Tocantins Cerrado fires. Ferek et al. (1998) values for BC (6.58 %), chloride (4.32 %) and nitrate (0.301 %) for Cerrado fires are also all comparable to our measurements for Brazilian Cerrado of 7.99, 5.08 and 1.29 % respectively.
The Rondônia fire emitted 12.7 % more OA than the Tocantins fire in terms of their average mass fraction. The flaming Cerrado fires emitted over 25 times more BC by mass to the total particulate mass than the smouldering tropical forest fire. Yamasoe et al. (2000) found the difference was only 3 times as much when comparing tropical deforestation and Cerrado fires in Brazil. The Tocantins fires emitted almost 10 times more Cl− by mass of total particulates than the Rondônia fire, which is similar to Yamasoe et al. (2000), who found the difference was approximately 11 times more for the flaming Cerrado fires than for the smouldering tropical forest fire. Grass is known to be high in chlorine (Lobert et al., 1999), which would explain the relative abundance of chloride sampled from the Tocantins fires.
Figure 4 shows the black carbon mass and number core size distributions for the Rondônia and Tocantins fires, which gives an indication of the size of particles at source. The grey shading shows the minimum and maximum size distributions from the plume intercepts on each flight to show the plume-to-plume variations, with the solid black line indicating the average mean. There is little difference in the BC size distributions of the two fires despite the large difference in fuel and burning characteristics. Average mass median core diameters are 0.19 and 0.20 µm for B737 and B742 respectively, while average number median core diameters are 0.10 µm for both fires, calculated from the log-normal fits based on the distributions shown in Fig. 4.
Figure 2 includes the scatter plots used to derive the particulate species ERs, while their derived values are listed in Table 5. Particulate-phase species and trace gas emissions are strongly correlated, with r-squared values of between 0.72 and 0.98. Table 6 shows the calculated EF values for particulate species with their associated uncertainties, alongside reported values from the literature for comparison. Given that directly comparable measurements from fires in Brazil are more scarce for particulate emissions than trace gases and the substantial range from region to region reported in the literature (e.g. Jolleys et al., 2012), in the following text we focus on comparing with global average values and those used in emission inventories in the absence of Brazil-specific emission factors.
3.3.1 Organic aerosol
The Rondônia and Tocantins fire EFOC values were 5.00 ± 1.58 and 0.82 ± 0.26 g kg−1 respectively, representing approximately a sixfold increase in OC per kilogram fuel burnt when comparing the two fires.
The Rondônia fire EFOC is similar to the deforestation value of 4.34 reported by Ferek et al. (1998). From a global perspective, our value is very similar to those reported by Akagi et al. (2011) and Andreae and Merlet (2001) for average global tropical forests, which were 4.71 ± 2.73 and 5.2 ± 1.5 g kg−1 respectively. Our value is 16 % higher than the EFOC value of 4.3 g kg−1 used for deforestation fires in the GFEDv3 and GFASv1.0 emission inventories.
Ferek et al. (1998) reported a EFOC of 2.94 g kg−1 for Cerrado burning, which is 3.5 times greater than our EFOC for the Tocantins fire. Global average savannah values for EFOC reported by Akagi et al. (2011) and Andreae and Merlet (2001), which were 2.62 ± 1.24 and 3.4 ± 1.4 g kg−1 respectively, are 3–4 times greater than our value. Similarly, the GFEDv3 and GFASv1.0 emission inventories value of 3.2 g kg−1 for savannah fires is almost 4 times higher than the value we calculated for the Tocantins fire.
3.3.2 Black carbon
Our EFBC values were 0.019 ± 0.006 and 0.13 ± 0.04 g kg−1 for the Rondônia and Tocantins fires respectively, approximately 1 order of magnitude apart.
Our EFBC value for the Rondônia fire is an order of magnitude smaller than the value of 0.46 g kg−1 reported by Ferek et al. (1998) for deforestation fires in Brazil. This divergence between our EFBC value and those in the literature is similar when comparing with global averages; values of 0.52 ± 0.28 g kg−1 (Akagi et al., 2011) and 0.66 ± 0.31 g kg−1 (Andreae and Merlet, 2001) for global average tropical forest fires are more than an order of magnitude greater than our reported value. The GFEDv3 and GFASv1.0 emission inventories use a value of 0.57 g kg−1 for deforestation fires, which is again over an order of magnitude greater than our value for the Rondônia fire. Our value is most similar to those measured for smouldering Indonesian peat by Stockwell et al. (2016) using in situ photoacoustic spectroscopy, with a value that is approximately 3 times lower than our measurement.
Compared with Ferek et al. (1998), our EFBC is more than a factor of 2.5 smaller than their value of 0.35 g kg−1 for Cerrado fires in Brazil. EFBC values for African savannah fires and global average savannah fires are also larger than our value, 0.39 ± 0.19 g kg−1 (Sinha et al., 2003) and 0.37 ± 0.20 g kg−1 (Akagi et al., 2011) respectively. The GFEDv3 and GFASv1.0 emission inventories use a value of 0.46 g kg−1, which is 3.5 times greater than the value we calculated for the Tocantins fires.
3.3.3 Inorganic aerosol
Values for EFCl of 0.04 ± 0.01 and 0.09 ± 0.03 g kg−1 for the Rondônia and Tocantins fires respectively are 2–4 times smaller than global averages reported by Akagi et al. (2011) for tropical forest and savannah fires. For the Rondônia and Tocantins fires, values for EF were 0.078 ± 0.025 and 0.013 ± 0.004 g kg−1; global average tropical forest and savannah fires reported in Akagi et al. (2011) are 41 and 23 % greater than our reported values respectively. The Rondônia fire EF value of 0.034 ± 0.011 g kg−1 is close to a factor of 4 smaller than the value of 0.133 g kg−1 for the global tropical forest average reported in Akagi et al. (2011). The Tocantins fire EF value of 0.0006 ± 0.0002 g kg−1 is 30 times smaller than the value of 0.018 g kg−1 for the global average of savannah fires in Akagi et al. (2011). Values for EF were 0.033 ± 0.011 and 0.015 ± 0.005 g kg−1 for the Rondônia and Tocantins fires respectively, which are approximately 6 and 4 times greater than the global average tropical forest and savannah fires reported by Akagi et al. (2011).
4.1 How representative are the Rondônia and Tocantins fires?
Section 3.2 reports comparisons between our gas-phase emission factors and those in the existing literature and emission inventories, which can serve as a basis for judging the representativeness of our particle-phase measurements. Gas-phase emission factors are more numerous, up to date and robust than their particle-phase counterparts, so we focus on those to place our measurements in the context of the existing literature.
Table 5Emission ratios and uncertainties for particulate species with respect to CO (ERx∕CO) and CO2 (ER) for the Rondônia fire and the Tocantins fires. The ERs are presented as molar ratios and are multiplied by 1000. Calculation methods are described in Sect. 2.2.3. Also included are ERs from other studies conducted in Brazil and other locations with the specific fuel type quoted. Values in bold are from this study.
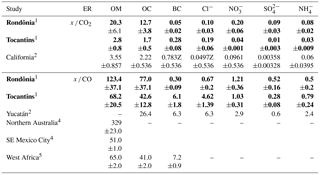
1 This study. 2 Akagi et al. (2012): California chaparral. 3 Yokelson et al. (2009): Mix of crop residue and deforestation. 4 Jolleys et al. (2012). 5 Capes et al. (2008) using OM ∕ OC ratio of 1.4.
Table 6Particulate species emission factors (g kg−1 of dry fuel burnt) for Rondônia and Tocantins fires determined using the calculations as shown in Sect. 2.2.4. EF values from previous studies in Brazil are included for comparison with the specific fuel type stated. Also included are EFs from different geographical locations around the world and values used in GFEDv3/GFASv1.0 and GFEDv4 emission inventories (van der Werf et al., 2010; Kaiser et al., 2012). Values in bold are from this study.
1 This study. 2 Ferek et al. (1998) following Akagi et al. (2011). 3 Yokelson et al. (2009). 4 Stockwell et al. (2016). 5 Akagi et al. (2011). 6 Andreae and Merlet (2001). 7 van der Werf et al. (2010); Kaiser et al. (2012). 8 Sinha et al. (2003). 9 Desservettaz et al. (2017). 10 McMeeking et al. (2009).
For the major trace gas emissions reported here, the Tocantins fire emission factors are very similar to previous measurements in the Brazilian Cerrado as well as global average savannah and grassland fires; this suggests from a gas-phase perspective that the Tocantins fires are consistent with previous measurements and likely representative of typical flaming Cerrado fires. Flaming combustion is predominant in Cerrado fires due to the dry fine fuel, which burns quickly with high combustion efficiency (generally of 0.93 or greater; e.g. Ward et al., 1992; Ferek et al., 1998), which is consistent with our observations of the Tocantins fires.
For the Rondônia wildfire, our EF value is similar to previous emission factors reported for deforestation fires in Brazil, as well as global average values and those used in emission inventories. However, our value for EFCO is 2–3 times greater than those reported in previous studies aside from measurements by Christian et al. (2007) focussing on smouldering logs in Brazil and Stockwell et al. (2016) investigating Indonesian peat fires. For EF, there is no clear discrepancy between our value and those reported across the literature, although the range of values is large for deforestation and tropical fires. This suggests that the Rondônia fire represents a mostly smouldering example of biomass burning in Brazil; deforestation fires in Brazil have been shown to have a more balanced mix of flaming and smouldering combustion; for instance, Ward et al. (1992) observed combustion efficiencies ranging from 0.88 to less than 0.80. A further factor that will lower the combustion efficiency is the water content of the fuel, which was likely much greater for the Rondônia fire as a growing forest, whereas typical deforestation fires may have seen the fuel dried for a season before burning. A key outstanding question is how different stages of combustion evolve for these types of fires, with our Rondônia example likely representing one extreme of this evolution as a mature wildfire.
4.2 Particulate emissions compared to the existing literature
For the Rondônia fire, organic aerosol made up 97 % of the emitted particulate mass on average, which is very similar to global average values for tropical forests and those used for deforestation fires in emission inventories. Values of EFOC are scarce in the literature for Brazilian biomass burning fires, with the only other comparable value from Ferek et al. (1998) being similar to our value. Major differences are found between our emission factors for the other particulate species measured by our study when compared with the existing literature, particularly in the case of rBC, which was more than an order of magnitude smaller. These differences are likely due to the mostly smouldering nature of the fire, with EFBC being strongly coupled to combustion efficiency and the fuel type of the vegetation. rBC made up just 0.3 % of the emitted mass of particulate species, which is much less than that observed at the regional scale during SAMBBA (4.79–5.42 %) as reported by Darbyshire et al. (2018). In order for conditions during the Rondônia fire to be typical of biomass burning emissions during the study, substantial evaporation or loss of non-rBC aerosol species would be required, which is not observed when assessing transformations at the plume or regional scale (Morgan et al., 2018). Therefore we conclude that the conditions prevalent during the Rondônia fire are unlikely to represent the dominant mode of biomass burning emissions during the wider study.
While particulate emission factors for the Tocantins fire were generally of the same order of magnitude as values for average global savannah and grassland emissions, they were lower by factors of 2–4. Emission factors for inorganic particulate species from these environments are severely lacking, so drawing specific conclusions would be unwise. For OC and BC, more emission factors are available in the literature, so consideration of these differences is more warranted. Given that the combustion efficiency of the fires was very similar to those previously reported in the literature, the most likely candidates for the differences are the fuel type and sampling methods.
Assessing the role of fuel type is not possible within this study, but we can discuss potential biases due to sampling methods. Previous measurements have relied on a variety of methods involving prior collection on a filter followed by thermal, optical or combined thermal–optical techniques, which are then analysed either offline or in real time. Thermal-based approaches are prone to biases due to pyrolysis or charring of carbonaceous material during the analytical protocol, which can make separation of the OC and BC components challenging and uncertain (e.g. Chow et al., 2007; Petzold et al., 2013). Optical measurements can overestimate BC due the presence of other absorbers such as OA as well as optical interactions between particles and the filter matrix (Bond and Bergstrom, 2006; Lack et al., 2008; Bond et al., 2013). Furthermore, such measurements rely on converting absorption to BC mass, which can vary significantly and is a major strand of current research into BC (e.g. Bond et al., 2013).
The SP2 measures BC mass directly without relying on converting from absorption, so it is likely better suited to sampling in this environment. The SP2 however will not detect BC-containing particles with a core diameter less than 60 nm, which would bias the reported BC mass concentrations lower. The closed BC mass size distributions in Fig. 4 though render this unlikely without a very large amount of BC-containing particles below the SP2 size cut-off, which would be required to substantially increase the BC mass concentration. Furthermore, while we do not have SMPS size distributions in the plumes, in the near field at the regional scale we do not observe a highly enhanced ultrafine mode, which would be expected if there were a large BC contribution at these sizes. Kondo et al. (2011) studied BC emissions from biomass burning in North America and Asia using the SP2 instrument. While the study is not directly comparable to ours due to the emissions being a few hours old rather than a few minutes old and from a different environment, they found BC emission ratios were similarly lower (factor of 2–5) than other literature values. This would support a potential reason for the differences between our reported BC emissions being at least in part due to differences in the measurement techniques. However, May et al. (2014) when studying prescribed fires in the United States found that laboratory and airborne derived EFs using a SP2 were generally higher than values previously reported in the literature. Uncertainties relating to the SP2 instrument response to different types of BC are a potential source of bias given that both instruments were calibrated using a reference standard for urban anthropogenic BC rather than one specific to biomass burning. Stockwell et al. (2016) reported emission factors for black carbon and elemental carbon of 0.0055 ± 0.0016 and 0.24 ± 0.10 g kg−1 respectively, illustrating the significant differences in what is usually assumed to represent EFBC when using different measurement techniques. Future studies in both the laboratory and field environments utilising a range of measurement techniques would be highly beneficial in terms of examining potential biases in different methods.
Determination of EROC and EFOC using the C-ToF-AMS relies on converting OM to OC using an uncertain ratio, which typically ranges from 1.4 for fresh urban aerosol to 2.2 for aged non-urban aerosol (Turpin and Lim, 2001). We used a value of 1.6 in this study, which is considered typical for fresh biomass burning (Yokelson et al., 2009; Akagi et al., 2012). Given that the differences between our reported EFOC and those in the literature are much larger than the range in OM ∕ OC previously observed, this is unlikely to be a major driver of the differences reported here. Due to the significant concentrations of OA relative to inorganic species in this environment, the default fragmentation table (Allan et al., 2004) used to apportion measured signals in the C-ToF-AMS to gas- and particle-phase chemical components was modified based on calibrating the response of the instrument to sulfate. This method follows established protocols for biomass burning (Ortega et al., 2013), yielding a change in OA of only a few percent, and can therefore be discounted as a potential major source of bias and uncertainty in our reported EROC and EFOC.
4.3 Implications
Global and regional numerical models are typically unable to reproduce aerosol optical depth (AOD) using standard configurations for emission inventories without scaling emissions by factors that vary both model to model and region by region (Kaiser et al., 2012; Tosca et al., 2013). Scaling factors can range from 1.5 to 5, representing a significant under-prediction of aerosol abundance in the atmospheric column. The EF values presented here are generally either similar to or lower than previous values reported for this biomass burning environment, suggesting that the EFs used in models are not responsible for the underestimate of AOD over tropical South America; several modelling studies have been undertaken during SAMBBA (Archer-Nicholls et al., 2015; Reddington et al., 2016; Pereira et al., 2016; Johnson et al., 2016) and have required scaling of their emissions to match in situ and satellite measurements. Consequently, scaling emission factors to match observations implies that the discrepancy lies elsewhere if it does relate to emissions (e.g. fire detections being biased low, uncertainties in the evolution of fires) or other aspects of models such as their processes and assumptions.
We observe significant contrasts between the chemical components emitted by the Rondônia and Tocantins fires that are consistent with the differences in fuel and combustion efficiency of the fires. The Tocantins fire emitted 18 % more CO2 than the Rondônia fire, while for the particulate-phase species 97 % of the total mass for the Rondônia tropical forest fire was composed of organic aerosol, compared to 84 % for the Tocantins Cerrado fires. These results illustrate how the combustion efficiency and fuel content of a fire can strongly influence the composition of the emissions, particularly in the case of the relative contribution of BC. Such contrasts will strongly control the single-scattering albedo of the emitted smoke (e.g. Pokhrel et al., 2016) and perturb atmospheric heating rates and radiative forcing. Greater relative emissions of OA can significantly affect cloud droplet formation given that 45–75 % of biomass burning OA has been shown to be water soluble (Reid et al., 2005; Asa-Awuku et al., 2008), which can again perturb the radiative balance of the atmosphere. Consequently, the initial conditions at source can potentially play a large role in determining the weather, climate and air quality implications of the significant atmospheric burden of biomass burning across the region.
In situ observations of near-field biomass burning emissions from two distinct fire types in Brazil are presented and evaluated. We presented fire-integrated emission ratios and emission factors from a large smouldering tropical forest fire in Rondônia state and several smaller man-made flaming Cerrado fires in Tocantins state. We believe that the Rondônia fire was most likely a wildfire. The two fires differed substantially in emissions of CO and CO2, resulting in MCEs of 0.79 and 0.94 for the Rondônia and Tocantins fires respectively. OA emissions also varied, with the Rondônia smouldering tropical forest fire having a higher emission factor for OA than the Tocantins flaming Cerrado fires, with OA comprising 97 % of the emitted sub-micron mass in the former and 84 % in the latter. The BC emission per kilogram fuel burnt was an order of magnitude higher for the Tocantins fires than the Rondônia fire. These results confirm that the initial fire conditions can play a significant role in determining the impacts on the Earth system by biomass burning emissions. In particular, the relative contribution of BC can vary significantly, which will represent a major control on the single-scattering albedo of the aerosol burden over a given region and fire regime.
Compared with previous deforestation fire EFs in the literature and in emission inventories, the Rondônia particulate emissions differ substantially, with the only exception being the EF value for OA. This was likely due to the bias towards smouldering emissions of the wildfire, which represents the lower extreme in terms of combustion efficiency compared to previous deforestation fire measurements. Gas-phase EFs for the Cerrado environment suggest that the fires are representative of previous measurements in the literature. However, particulate emission factors for the Tocantins fire were 2–4 times lower for BC and OA than those reported in the literature for Cerrado or savannah type fires. One potential reason for this discrepancy is the different measurement techniques used in this study, which measure OA and BC more directly than the filter-based measurements typically used in past studies. We recommend that comparisons of techniques be made in the future to assess the size of any such potential biases. Our calculated EFs do not indicate that the scaling of emissions that is required within global and regional numerical models to reproduce in situ and satellite aerosol concentrations over Brazil (Kaiser et al., 2012; Tosca et al., 2013; Archer-Nicholls et al., 2015; Reddington et al., 2016; Pereira et al., 2016; Johnson et al., 2016) is related to underestimates in EFs used in emission inventories.
All raw time series data used to derive the emission ratios and factors from the FAAM research aircraft are publicly available from the Centre for Environmental Data Analysis website (http://www.ceda.ac.uk/, last access: 12 March 2018). Direct links to the flight data records are given in the reference list (Facility for Airborne Atmospheric Measurements, Natural Environment Research Council, and Met Office, 2014a, b).
SP2 size distribution data is available on request due to the size of the data files. Data masks for categorising flight patterns into plume sampling and other sampling types (vertical profiles and SLRs) are currently available on request. Active fire data used in the manuscript are available publicly from NASA (see Acknowledgements for further details).
The supplement related to this article is available online at: https://doi.org/10.5194/acp-18-5619-2018-supplement.
AKH and WTM analysed the data and wrote the manuscript. SO'S, JDA, ED, DL and JL provided additional data analysis support, including data processing and quality assurance. SB and MJF operated the gas-phase and aerosol instruments respectively during the field campaign. BJ, JMH, KML, PEA and HC led the planning of the field campaign and were co-principal investigators on the SAMBBA project.
The authors declare that they have no conflict of interest.
This article is part of the special issue “South American Biomass Burning Analysis (SAMBBA)”. It is not associated with a conference.
We would like to acknowledge the substantial efforts of the whole SAMBBA team
before, during and after the project. Airborne data were obtained using the
BAe-146-301 Atmospheric Research Aircraft (ARA) flown by Directflight Ltd and
managed by the Facility for Airborne Atmospheric Measurements (FAAM), which
is a joint entity of the Natural Environment Research Council (NERC) and the
Met Office. Active fire data were produced by the University of Maryland and
acquired from the online Fire Information for Resource Management System (FIRMS;
https://earthdata.nasa.gov/data/near-real-time-data/firms/abouts, last access: 13 February 2018;
specific product: MCD14ML). Eoghan Darbyshire was supported by NERC
studentship NE/J500057/1 and NE/K500859/1. This work was supported by the
NERC SAMBBA project NE/J010073/1.
Edited by: Meinrat O. Andreae
Reviewed by: Robert Yokelson, Gavin McMeeking,
and Clare Paton-Walsh
Akagi, S. K., Yokelson, R. J., Wiedinmyer, C., Alvarado, M. J., Reid, J. S., Karl, T., Crounse, J. D., and Wennberg, P. O.: Emission factors for open and domestic biomass burning for use in atmospheric models, Atmos. Chem. Phys., 11, 4039–4072, https://doi.org/10.5194/acp-11-4039-2011, 2011. a, b, c, d, e, f, g, h, i, j, k, l, m, n, o, p, q, r, s, t
Akagi, S. K., Craven, J. S., Taylor, J. W., McMeeking, G. R., Yokelson, R. J., Burling, I. R., Urbanski, S. P., Wold, C. E., Seinfeld, J. H., Coe, H., Alvarado, M. J., and Weise, D. R.: Evolution of trace gases and particles emitted by a chaparral fire in California, Atmos. Chem. Phys., 12, 1397–1421, https://doi.org/10.5194/acp-12-1397-2012, 2012. a, b, c, d, e, f, g, h
Allan, J. D., Delia, A. E., Coe, H., Bower, K. N., Alfarra, M. R., Jimenez, J. L., Middlebrook, A. M., Drewnick, F., Onasch, T. B., Canagaratna, M. R., Jayne, J. T., and Worsnop, D. R.: A generalised method for the extraction of chemically resolved mass spectra from aerodyne aerosol mass spectrometer data, J. Aerosol Sci., 35, 909–922, https://doi.org/10.1016/j.jaerosci.2004.02.007, 2004. a
Allan, J. D., Morgan, W. T., Darbyshire, E., Flynn, M. J., Williams, P. I., Oram, D. E., Artaxo, P., Brito, J., Lee, J. D., and Coe, H.: Airborne observations of IEPOX-derived isoprene SOA in the Amazon during SAMBBA, Atmos. Chem. Phys., 14, 11393–11407, https://doi.org/10.5194/acp-14-11393-2014, 2014. a
Andreae, M. O. and Merlet, P.: Emission of trace gases and aerosols from biomass burning, Global Biogeochem. Cy., 15, 955–966, https://doi.org/10.1029/2000GB001382, 2001. a, b, c, d, e, f, g, h, i, j, k
Andreae, M. O., Browell, E. V., Garstang, M., Gregory, G. L., Harriss, R. C., Hill, G. F., Jacob, D. J., Pereira, M. C., Sachse, G. W., Setzer, A. W., Dias, P. L. S., Talbot, R. W., Torres, A. L., and Wofsy, S. C.: Biomass-burning emissions and associated haze layers over Amazonia, J. Geophys. Res., 93, 1509, https://doi.org/10.1029/JD093iD02p01509, 1988. a
Andreae, M. O., Rosenfeld, D., Artaxo, P., Costa, A. A., Frank, G. P., Longo, K. M., and Silva-Dias, M. A. F.: Smoking rain clouds over the Amazon, Science, 303, 1337–1342, https://doi.org/10.1126/science.1092779, 2004. a
Arbex, M. A., Martins, L. C., de Oliveira, R. C., Pereira, L. A. A., Arbex, F. F., Cançado, J. E. D., Saldiva, P. H. N., and Braga, A. L. F.: Air pollution from biomass burning and asthma hospital admissions in a sugar cane plantation area in Brazil, J. Epidemiol. Commun. H., 61, 395–400, https://doi.org/10.1136/jech.2005.044743, 2007. a
Archer-Nicholls, S., Lowe, D., Darbyshire, E., Morgan, W. T., Bela, M. M., Pereira, G., Trembath, J., Kaiser, J. W., Longo, K. M., Freitas, S. R., Coe, H., and McFiggans, G.: Characterising Brazilian biomass burning emissions using WRF-Chem with MOSAIC sectional aerosol, Geosci. Model Dev., 8, 549–577, https://doi.org/10.5194/gmd-8-549-2015, 2015. a, b
Asa-Awuku, A., Sullivan, A. P., Hennigan, C. J., Weber, R. J., and Nenes, A.: Investigation of molar volume and surfactant characteristics of water-soluble organic compounds in biomass burning aerosol, Atmos. Chem. Phys., 8, 799–812, https://doi.org/10.5194/acp-8-799-2008, 2008. a
Bahreini, R., Ervens, B., Middlebrook, A. M., Warneke, C., de Gouw, J. A., DeCarlo, P. F., Jimenez, J. L., Brock, C. A., Neuman, J. A., Ryerson, T. B., Stark, H., Atlas, E., Brioude, J., Fried, A., Holloway, J. S., Peischl, J., Richter, D., Walega, J., Weibring, P., Wollny, A. G., and Fehsenfeld, F. C.: Organic aerosol formation in urban and industrial plumes near Houston and Dallas, Texas, J. Geophys. Res., 114, D00F16, https://doi.org/10.1029/2008JD011493, 2009. a
Baumgardner, D., Kok, G., and Raga, G.: Warming of the Arctic lower stratosphere by light absorbing particles, Geophys. Res. Lett., 31, L06117, https://doi.org/10.1029/2003GL018883, 2004. a
Baumgardner, D., Popovicheva, O., Allan, J., Bernardoni, V., Cao, J., Cavalli, F., Cozic, J., Diapouli, E., Eleftheriadis, K., Genberg, P. J., Gonzalez, C., Gysel, M., John, A., Kirchstetter, T. W., Kuhlbusch, T. A. J., Laborde, M., Lack, D., Müller, T., Niessner, R., Petzold, A., Piazzalunga, A., Putaud, J. P., Schwarz, J., Sheridan, P., Subramanian, R., Swietlicki, E., Valli, G., Vecchi, R., and Viana, M.: Soot reference materials for instrument calibration and intercomparisons: a workshop summary with recommendations, Atmos. Meas. Tech., 5, 1869–1887, https://doi.org/10.5194/amt-5-1869-2012, 2012. a
Bertschi, I., Yokelson, R. J., Ward, D. E., Babbitt, R. E., Susott, R. A., Goode, J. G., and Hao, W. M.: Trace gas and particle emissions from fires in large diameter and belowground biomass fuels, J. Geophys. Res.-Atmos., 108, https://doi.org/10.1029/2002JD002100, 2003. a, b
Bond, T. C. and Bergstrom, R.: Light Absorption by Carbonaceous Particles: An Investigative Review, Aerosol Sci. Tech., 40, 27–67, https://doi.org/10.1080/02786820500421521, 2006. a, b
Bond, T. C., Doherty, S. J., Fahey, D. W., Forster, P. M., Berntsen, T., DeAngelo, B. J., Flanner, M. G., Ghan, S., Kärcher, B., Koch, D., Kinne, S., Kondo, Y., Quinn, P. K., Sarofim, M. C., Schultz, M. G., Schulz, M., Venkataraman, C., Zhang, H., Zhang, S., Bellouin, N., Guttikunda, S. K., Hopke, P. K., Jacobson, M. Z., Kaiser, J. W., Klimont, Z., Lohmann, U., Schwarz, J. P., Shindell, D., Storelvmo, T., Warren, S. G., and Zender, C. S.: Bounding the role of black carbon in the climate system: A scientific assessment, J. Geophys. Res.-Atmos., 118, 5380–5552, https://doi.org/10.1002/jgrd.50171, 2013. a, b, c
Boucher, O., Randall, D., Artaxo, P., Bretherton, C., Feingold, G., Forster, P., Kerminen, V.-M., Kondo, Y., Liao, H., Lohmann, U., Rasch, P., Satheesh, S., Sherwood, S., Stevens, B., and Zhang, X.: Clouds and Aerosols, in: Climate Change 2013: The Physical Science Basis. Contribution of Working Group I to the Fifth Assessment Report of the Intergovernmental Panel on Climate Change, edited by: Stocker, T., Qin, D., Plattner, G.-K., Tignor, M., Allen, S., Boschung, J., Nauels, A., Xia, Y., Bex, V., and Midgley, P., Cambridge University Press, Cambridge, United Kingdom and New York, NY, USA, 2013. a, b
Bowman, D. M. J. S., Balch, J. K., Artaxo, P., Bond, W. J., Carlson, J. M., Cochrane, M. A., D'Antonio, C. M., DeFries, R. S., Doyle, J. C., Harrison, S. P., Johnston, F. H., Keeley, J. E., Krawchuk, M. A., Kull, C. A., Marston, J. B., Moritz, M. A., Prentice, I. C., Roos, C. I., Scott, A. C., Swetnam, T. W., van der Werf, G. R., and Pyne, S. J.: Fire in the Earth System, Science, 324, 481–484, https://doi.org/10.1126/science.1163886, 2009. a
Brito, J., Rizzo, L. V., Morgan, W. T., Coe, H., Johnson, B., Haywood, J., Longo, K., Freitas, S., Andreae, M. O., and Artaxo, P.: Ground-based aerosol characterization during the South American Biomass Burning Analysis (SAMBBA) field experiment, Atmos. Chem. Phys., 14, 12069–12083, https://doi.org/10.5194/acp-14-12069-2014, 2014. a
Canagaratna, M. R., Jayne, J. T., Jimenez, J. L., Allan, J. D., Alfarra, M. R., Zhang, Q., Onasch, T. B., Drewnick, F., Coe, H., Middlebrook, A., Delia, A., Williams, L. R., Trimborn, A. M., Northway, M. J., DeCarlo, P. F., Kolb, C. E., Davidovits, P., and Worsnop, D. R.: Chemical and microphysical characterization of ambient aerosols with the aerodyne aerosol mass spectrometer, Mass Spectrom. Rev., 26, 185–222, https://doi.org/10.1002/mas.20115, 2007. a, b
Cançado, J. E. D., Saldiva, P. H. N., Pereira, L. A. A., Lara, L. B. L. S., Artaxo, P., A, L. M., Arbex, M. A., Zanobetti, A., and Braga, A. L. F.: The Impact of Sugar Cane-Burning Emissions on the Respiratory System of Children and the Elderly, Environ. Health Persp., 114, 725–729, 2006. a
Capes, G., Johnson, B., McFiggans, G. B., Williams, P. I., Haywood, J. M., and Coe, H.: Aging of biomass burning aerosols over West Africa: Aircraft measurements of chemical composition, microphysical properties, and emission ratios, J. Geophys. Res., 113, D00C15cro, https://doi.org/10.1029/2008JD009845, 2008. a
Chand, D., Guyon, P., Artaxo, P., Schmid, O., Frank, G. P., Rizzo, L. V., Mayol-Bracero, O. L., Gatti, L. V., and Andreae, M. O.: Optical and physical properties of aerosols in the boundary layer and free troposphere over the Amazon Basin during the biomass burning season, Atmos. Chem. Phys., 6, 2911–2925, https://doi.org/10.5194/acp-6-2911-2006, 2006. a
Chen, Y., Morton, D. C., Jin, Y., Gollatz, G. J., Kasibhatla, P. S., Van Der Werf, G. R., Defries, R. S., and Randerson, J. T.: Long-term trends and interannual variability of forest, savanna and agricultural fires in South America, Carbon Manag., 4, 617–638, https://doi.org/10.4155/cmt.13.61, 2013. a
Chow, J. C., Yu, J. Z., Watson, J. G., Ho, S. S. H., Bohannan, T. L., Hays, M. D., and Fung, K. K.: The application of thermal methods for determining chemical composition of carbonaceous aerosols: A review, J. Environ. Sci. Heal. C, 42, 1521–1541, https://doi.org/10.1080/10934520701513365, 2007. a, b
Christian, T. J., Yokelson, R. J., Carvalho, J. A., Griffith, D. W. T., Alvarado, E. C., Santos, J. C., Neto, T. G. S., Veras, C. A. G., and Hao, W. M.: The tropical forest and fire emissions experiment: Trace gases emitted by smoldering logs and dung from deforestation and pasture fires in Brazil, J. Geophys. Res.-Atmos., 112, D18308, https://doi.org/10.1029/2006JD008147, 2007. a, b, c, d, e, f, g, h, i
Crosier, J., Allan, J. D., Coe, H., Bower, K. N., Formenti, P., and Williams, P. I.: Chemical composition of summertime aerosol in the Po Valley (Italy), northern Adriatic and Black Sea, Q. J. Roy. Meteor. Soc., 133, 61–75, https://doi.org/10.1002/qj.88, 2007. a
Crutzen, P. J., Delany, A. C., Greenberg, J., Haagenson, P., Heidt, L., Lueb, R., Pollock, W., Seiler, W., Wartburg, A., and Zimmerman, P.: Tropospheric chemical composition measurements in Brazil during the dry season, J. Atmos. Chem., 2, 233–256, https://doi.org/10.1007/BF00051075, 1985. a
Darbyshire, E., Morgan, W. T., Allan, J. D., Liu, D., Flynn, M. J., Dorsey, J. R., O'Shea, S. J., Lowe, D., Szpek, K., Marenco, F., Johnson, B. T., Bauguitte, S., Haywood, J. M., Brito, J. F., Artaxo, P. E., Longo, K. M., and Coe, H.: The vertical distribution of biomass burning pollution over tropical South America from aircraft in-situ measurements during SAMBBA, in preparation, 2018.
Desservettaz, M., Paton-Walsh, C., Griffith, D. W. T., Kettlewell, G., Keywood, M. D., Vanderschoot, M. V., Ward, J., Mallet, M. D., Milic, A., Miljevic, B., Ristovski, Z. D., Howard, D., Edwards, G. C., and Atkinson, B.: Emission factors of trace gases and particles from tropical savanna fires in Australia, J. Geophys. Res.-Atmos., 122, 6059–6074, https://doi.org/10.1002/2016JD025925, 2017. a, b, c, d
do Carmo, C. N., Alves, M. B., and Hacon, S. S.: Impact of biomass burning and weather conditions on children's health in a city of Western Amazon region, Air Qual. Atmos. Hlth, 6, 517–525, https://doi.org/10.1007/s11869-012-0191-6, 2013. a
Drewnick, F., Hings, S. S., DeCarlo, P., Jayne, J. T., Gonin, M., Fuhrer, K., Weimer, S., Jimenez, J. L., Demerjian, K. L., Borrmann, S., and Worsnop, D. R.: A New Time-of-Flight Aerosol Mass Spectrometer (TOF-AMS) – Instrument Description and First Field Deployment, Aerosol Sci. Tech., 39, 637–658, https://doi.org/10.1080/02786820500182040, 2005. a
Facility for Airborne Atmospheric Measurements, Natural Environment Research Council, and Met Office: FAAM B737 SAMBBA flight, number 7: Airborne atmospheric measurements from core and non-core instrument suites on board the BAE-146 aircraft, NCAS British Atmospheric Data Centre, https://doi.org/10.5285/6034214ae46c48a7835608866a823f56 2014a. a, b
Facility for Airborne Atmospheric Measurements, Natural Environment Research Council, and Met Office: FAAM B742 SAMBBA flight, number 12: Airborne atmospheric measurements from core and non-core instrument suites on board the BAE-146 aircraft. NCAS British Atmospheric Data Centre, https://doi.org/10.5285/7e7783fcd44e4a3890f3bd67e89e585e, 2014b. a, b
Ferek, R. J., Reid, J. S., Hobbs, P. V., Blake, D. R., and Liousse, C.: Emission factors of hydrocarbons, halocarbons, trace gases and particles from biomass burning in Brazil, J. Geophys. Res.-Atmos., 103, 32107–32118, https://doi.org/10.1029/98JD00692, 1998. a, b, c, d, e, f, g, h, i, j, k, l, m, n, o, p, q, r, s, t, u
Foltescu, V., Selin, E., and Below, M.: Corrections for particle losses and sizing errors during aircraft aerosol sampling using a rosemount inlet and the PMS LAS-X, Atmos. Environ., 29, 449–453, https://doi.org/10.1016/1352-2310(94)00258-M, 1995. a
Giglio, L., Csiszar, I., and Justice, C. O.: Global distribution and seasonality of active fires as observed with the Terra and Aqua Moderate Resolution Imaging Spectroradiometer (MODIS) sensors, J. Geophys. Res.-Biogeo., 111, G02016, https://doi.org/10.1029/2005JG000142, 2006. a
Hopkins, J. R., Boddy, R. K., Hamilton, J. F., Lee, J. D., Lewis, A. C., Purvis, R. M., and Watson, N. J.: An observational case study of ozone and precursors inflow to South East England during an anticyclone, J. Environ. Monitor., 8, 1195–1202, https://doi.org/10.1039/B608062F, 2006. a
Johnson, B. T., Haywood, J. M., Langridge, J. M., Darbyshire, E., Morgan, W. T., Szpek, K., Brooke, J. K., Marenco, F., Coe, H., Artaxo, P., Longo, K. M., Mulcahy, J. P., Mann, G. W., Dalvi, M., and Bellouin, N.: Evaluation of biomass burning aerosols in the HadGEM3 climate model with observations from the SAMBBA field campaign, Atmos. Chem. Phys., 16, 14657–14685, https://doi.org/10.5194/acp-16-14657-2016, 2016. a, b
Jolleys, M. D., Coe, H., McFiggans, G., Capes, G., Allan, J. D., Crosier, J., Williams, P. I., Allen, G., Bower, K. N., Jimenez, J. L., Russell, L. M., Grutter, M., and Baumgardner, D.: Characterizing the aging of biomass burning organic aerosol by use of mixing ratios: a meta-analysis of four regions, Environ. Sci. Technol., 46, 13093–13102, https://doi.org/10.1021/es302386v, 2012. a, b
Jolleys, M. D., Coe, H., McFiggans, G., Taylor, J. W., O'Shea, S. J., Le Breton, M., Bauguitte, S. J.-B., Moller, S., Di Carlo, P., Aruffo, E., Palmer, P. I., Lee, J. D., Percival, C. J., and Gallagher, M. W.: Properties and evolution of biomass burning organic aerosol from Canadian boreal forest fires, Atmos. Chem. Phys., 15, 3077–3095, https://doi.org/10.5194/acp-15-3077-2015, 2015. a
Kaiser, J. W., Heil, A., Andreae, M. O., Benedetti, A., Chubarova, N., Jones, L., Morcrette, J.-J., Razinger, M., Schultz, M. G., Suttie, M., and van der Werf, G. R.: Biomass burning emissions estimated with a global fire assimilation system based on observed fire radiative power, Biogeosciences, 9, 527–554, https://doi.org/10.5194/bg-9-527-2012, 2012. a, b, c, d, e, f
Karl, T., Guenther, A., Yokelson, R. J., Greenberg, J., Potosnak, M., Blake, D. R., and Artaxo, P.: The tropical forest and fire emissions experiment: Emission, chemistry, and transport of biogenic volatile organic compounds in the lower atmosphere over Amazonia, J. Geophys. Res., 112, 1–17, https://doi.org/10.1029/2007JD008539, 2007. a, b
Kaufman, Y. J., Setzer, A., Ward, D., Tanre, D., Holben, B. N., Menzel, P., Pereira, M. C., and Rasmussen, R.: Biomass Burning Airborne and Spaceborne Experiment in the Amazonas (BASE-A), J. Geophys. Res.-Atmos., 97, 14581–14599, https://doi.org/10.1029/92JD00275, 1992. a, b, c, d
Kaufman, Y. J., Justice, C. O., Flynn, L. P., Kendall, J. D., Prins, E. M., Giglio, L., Ward, D. E., Menzel, W. P., and Setzer, A. W.: Potential global fire monitoring from EOS-MODIS, J. Geophys. Res.-Atmos., 103, 32215–32238, https://doi.org/10.1029/98JD01644, 1998. a
Kaufman, Y. J., Ichoku, C., Giglio, L., Korontzi, S., Chu, D. A., Hao, W. M., Li, R.-R., and Justice, C. O.: Fire and smoke observed from the Earth Observing System MODIS instrument–products, validation, and operational use, Int. J. Remote Sens., 24, 1765–1781, https://doi.org/10.1080/01431160210144741, 2003. a
Kimmel, J. R., Farmer, D. K., Cubison, M. J., Sueper, D., Tanner, C., Nemitz, E., Worsnop, D. R., Gonin, M., and Jimenez, J. L.: Real-time aerosol mass spectrometry with millisecond resolution, Int. J. Mass Spectrom., 303, 15–26, https://doi.org/10.1016/j.ijms.2010.12.004, 2011. a
Kondo, Y., Matsui, H., Moteki, N., Sahu, L., Takegawa, N., Kajino, M., Zhao, Y., Cubison, M. J., Jimenez, J. L., Vay, S., Diskin, G. S., Anderson, B., Wisthaler, A., Mikoviny, T., Fuelberg, H. E., Blake, D. R., Huey, G., Weinheimer, A. J., Knapp, D. J., and Brune, W. H.: Emissions of black carbon, organic, and inorganic aerosols from biomass burning in North America and Asia in 2008, J. Geophys. Res., 116, D08204, https://doi.org/10.1029/2010JD015152, 2011. a, b, c, d
Lack, D. A., Cappa, C. D., Covert, D. S., Baynard, T., Massoli, P., Sierau, B., Bates, T. S., Quinn, P. K., Lovejoy, E. R., and Ravishankara, A. R.: Bias in Filter-Based Aerosol Light Absorption Measurements Due to Organic Aerosol Loading: Evidence from Ambient Measurements, Aerosol Sci. Tech., 42, 1033–1041, 2008. a, b
Lobert, J. M., Keene, W. C., Logan, J. A., and Yevich, R.: Global chlorine emissions from biomass burning: Reactive Chlorine Emissions Inventory, J. Geophys. Res., 104, 8373–8389, https://doi.org/10.1029/1998JD100077, 1999. a
Lipsky, E. M. and Robinson, A. L.: Effects of Dilution on Fine Particle Mass and Partitioning of Semivolatile Organics in Diesel Exhaust and Wood Smoke, Environ. Sci. Technol., 40, 155–162, https://doi.org/10.1021/es050319p, 2006. a
Liu, D., Flynn, M., Gysel, M., Targino, A., Crawford, I., Bower, K., Choularton, T., Jurányi, Z., Steinbacher, M., Hüglin, C., Curtius, J., Kampus, M., Petzold, A., Weingartner, E., Baltensperger, U., and Coe, H.: Single particle characterization of black carbon aerosols at a tropospheric alpine site in Switzerland, Atmos. Chem. Phys., 10, 7389–7407, https://doi.org/10.5194/acp-10-7389-2010, 2010. a
Liu, X., Zhang, Y., Huey, L. G., Yokelson, R. J., Wang, Y., Jimenez, J. L., Campuzano-Jost, P., Beyersdorf, A. J., Blake, D. R., Choi, Y., St. Clair, J. M., Crounse, J. D., Day, D. A., Diskin, G. S., Fried, A., Hall, S. R., Hanisco, T. F., King, L. E., Meinardi, S., Mikoviny, T., Palm, B. B., Peischl, J., Perring, A. E., Pollack, I. B., Ryerson, T. B., Sachse, G., Schwarz, J. P., Simpson, I. J., Tanner, D. J., Thornhill, K. L., Ullmann, K., Weber, R. J., Wennberg, P. O., Wisthaler, A., Wolfe, G. M., and Ziemba, L. D.: Agricultural fires in the southeastern U.S. during SEAC4RS: Emissions of trace gases and particles and evolution of ozone, reactive nitrogen, and organic aerosol, J. Geophys. Res., 7383–7414, https://doi.org/10.1002/2016JD025040, 2016. a
Liu, D., Whitehead, J., Alfarra, M. R., Reyes-Villegas, E., Spracklen, D. V., Reddington, C. L., Kong, S., Williams, P. I., Ting, Y.-C., Haslett, S., Taylor, J. W., Flynn, M. J,. Morgan, W. T., McFiggans, G., Coe, H., and Allan, J. D.: Black-carbon absorption enhancement in the atmosphere determined by particle mixing state, Nat. Geosci., 10, 184–188, https://doi.org/10.1038/ngeo2901, 2017. a
Longo, K. M., Freitas, S. R., Andreae, M. O., Yokelson, R., and Artaxo, P.: Biomass Burning in Amazonia: Emissions, Long-Range Transport of Smoke and Its Regional and Remote Impacts, in: Amazonia and Global Change, American Geophysical Union, 207–232, https://doi.org/10.1029/2008GM000717, 2013. a
Martin, S. T., Andreae, M. O., Althausen, D., Artaxo, P., Baars, H., Borrmann, S., Chen, Q., Farmer, D. K., Guenther, A., Gunthe, S. S., Jimenez, J. L., Karl, T., Longo, K., Manzi, A., Müller, T., Pauliquevis, T., Petters, M. D., Prenni, A. J., Pöschl, U., Rizzo, L. V., Schneider, J., Smith, J. N., Swietlicki, E., Tota, J., Wang, J., Wiedensohler, A., and Zorn, S. R.: An overview of the Amazonian Aerosol Characterization Experiment 2008 (AMAZE-08), Atmos. Chem. Phys., 10, 11415–11438, https://doi.org/10.5194/acp-10-11415-2010, 2010. a
May, A. A., McMeeking, G. R., Lee, T., Taylor, J. W., Craven, J. S., Burling, I., Sullivan, A. P., Akagi, S., Collett, J. L., Flynn, M., Coe, H., Urbanski, S. P., Seinfeld, J. H., Yokelson, R. J., and Kreidenweis, S. M.: Aerosol emissions from prescribed fires in the United States: A synthesis of laboratory and aircraft measurements, J. Geophys. Res., 119, 11826–11849, https://doi.org/10.1002/2014JD021848, 2014. a, b
McMeeking, G. R., Kreidenweis, S. M., Baker, S., Carrico, C. M., Chow, J. C., Collett, J. L., Hao, W. M., Holden, A. S., Kirchstetter, T. W., Malm, W. C., Moosmüller, H., Sullivan, A. P., and Wold, C. E.: Emissions of trace gases and aerosols during the open combustion of biomass in the laboratory, J. Geophys. Res., 114, D19210, https://doi.org/10.1029/2009JD011836, 2009. a, b, c, d, e, f
McMeeking, G. R., Hamburger, T., Liu, D., Flynn, M., Morgan, W. T., Northway, M., Highwood, E. J., Krejci, R., Allan, J. D., Minikin, A., and Coe, H.: Black carbon measurements in the boundary layer over western and northern Europe, Atmos. Chem. Phys., 10, 9393–9414, https://doi.org/10.5194/acp-10-9393-2010, 2010. a, b
McMeeking, G. R., Bart, M., Chazette, P., Haywood, J. M., Hopkins, J. R., McQuaid, J. B., Morgan, W. T., Raut, J.-C., Ryder, C. L., Savage, N., Turnbull, K., and Coe, H.: Airborne measurements of trace gases and aerosols over the London metropolitan region, Atmos. Chem. Phys., 12, 5163–5187, https://doi.org/10.5194/acp-12-5163-2012, 2012. a
Mistry, J.: Fire in the cerrado (savannas) of Brazil: an ecological review, Prog. Phys. Geog., 22, 425–448, https://doi.org/10.1177/030913339802200401, 1998. a
Morgan, W. T., Allan, J. D., Bower, K. N., Capes, G., Crosier, J., Williams, P. I., and Coe, H.: Vertical distribution of sub-micron aerosol chemical composition from North-Western Europe and the North-East Atlantic, Atmos. Chem. Phys., 9, 5389–5401, https://doi.org/10.5194/acp-9-5389-2009, 2009. a
Morgan, W. T., Allan, J. D., Bower, K. N., Highwood, E. J., Liu, D., McMeeking, G. R., Northway, M. J., Williams, P. I., Krejci, R., and Coe, H.: Airborne measurements of the spatial distribution of aerosol chemical composition across Europe and evolution of the organic fraction, Atmos. Chem. Phys., 10, 4065–4083, https://doi.org/10.5194/acp-10-4065-2010, 2010. a
Morgan, W. T., Allan, J. D., Darbyshire, E., Flynn, M. J., Liu, D., Johnson, B. T., Haywood, J. M., Longo, K. M., Artaxo, P. E., and Coe, H.: Transformation and aging of biomass burning aerosol over tropical South America from aircraft in-situ measurements during SAMBBA, in preparation, 2018.
Ortega, A. M., Day, D. A., Cubison, M. J., Brune, W. H., Bon, D., de Gouw, J. A., and Jimenez, J. L.: Secondary organic aerosol formation and primary organic aerosol oxidation from biomass-burning smoke in a flow reactor during FLAME-3, Atmos. Chem. Phys., 13, 11551–11571, https://doi.org/10.5194/acp-13-11551-2013, 2013. a
O'Shea, S. J., Bauguitte, S. J.-B., Gallagher, M. W., Lowry, D., and Percival, C. J.: Development of a cavity-enhanced absorption spectrometer for airborne measurements of CH4 and CO2, Atmos. Meas. Tech., 6, 1095–1109, https://doi.org/10.5194/amt-6-1095-2013, 2013. a, b
Hodgson, A. K., Morgan, W. T., O'Shea, S., Bauguitte, S., Allan, J. D., Darbyshire, E., Flynn, M. J., Liu, D., Lee, J., Johnson, B., Haywood, J., Longo, K. M., Artaxo, P. E., and Coe, H.: Near-field emission profiling of Rainforest and Cerrado fires in Brazil during SAMBBA 2012, Atmos. Chem. Phys. Discuss., https://doi.org/10.5194/acp-2016-1019, in review, 2017. a
Pereira, G., Siqueira, R., Rosário, N. E., Longo, K. L., Freitas, S. R., Cardozo, F. S., Kaiser, J. W., and Wooster, M. J.: Assessment of fire emission inventories during the South American Biomass Burning Analysis (SAMBBA) experiment, Atmos. Chem. Phys., 16, 6961–6975, https://doi.org/10.5194/acp-16-6961-2016, 2016. a, b
Petzold, A., Ogren, J. A., Fiebig, M., Laj, P., Li, S.-M., Baltensperger, U., Holzer-Popp, T., Kinne, S., Pappalardo, G., Sugimoto, N., Wehrli, C., Wiedensohler, A., and Zhang, X.-Y.: Recommendations for reporting “black carbon” measurements, Atmos. Chem. Phys., 13, 8365–8379, https://doi.org/10.5194/acp-13-8365-2013, 2013. a, b, c
Pokhrel, R. P., Wagner, N. L., Langridge, J. M., Lack, D. A., Jayarathne, T., Stone, E. A., Stockwell, C. E., Yokelson, R. J., and Murphy, S. M.: Parameterization of single-scattering albedo (SSA) and absorption Ångström exponent (AAE) with EC ∕ OC for aerosol emissions from biomass burning, Atmos. Chem. Phys., 16, 9549–9561, https://doi.org/10.5194/acp-16-9549-2016, 2016. a
Ramanathan, V., Crutzen, P. J., Kiehl, J. T., and Rosenfeld, D.: Aerosols, climate, and the hydrological cycle, Science, 294, 2119–2124, https://doi.org/10.1126/science.1064034, 2001. a
Reddington, C. L., Spracklen, D. V., Artaxo, P., Ridley, D. A., Rizzo, L. V., and Arana, A.: Analysis of particulate emissions from tropical biomass burning using a global aerosol model and long-term surface observations, Atmos. Chem. Phys., 16, 11083–11106, https://doi.org/10.5194/acp-16-11083-2016, 2016. a, b
Reid, J. S., Koppmann, R., Eck, T. F., and Eleuterio, D. P.: A review of biomass burning emissions part II: intensive physical properties of biomass burning particles, Atmos. Chem. Phys., 5, 799–825, https://doi.org/10.5194/acp-5-799-2005, 2005. a
Reid, J. S. and Hobbs, P. V.: Physical and optical properties of young smoke from individual biomass fires in Brazil, J. Geophys. Res.-Atmos., 103, 32013–32030, https://doi.org/10.1029/98JD00159, 1998. a
Sahu, L. K., Kondo, Y., Moteki, N., Takegawa, N., Zhao, Y., Cubison, M. J., Jimenez, J. L., Vay, S., Diskin, G. S., Wisthaler, A., Mikoviny, T., Huey, L. G., Weinheimer, A. J., and Knapp, D. J.: Emission characteristics of black carbon in anthropogenic and biomass burning plumes over California during ARCTAS-CARB 2008, J. Geophys. Res., 117, 1–20, https://doi.org/10.1029/2011JD017401, 2012. a, b
Schwarz, J. P., Gao, R. S., Fahey, D. W., Thomson, D. S., Watts, L. A., Wilson, J. C., Reeves, J. M., Darbeheshti, M., Baumgardner, D. G., Kok, G. L., Chung, S. H., Schulz, M., Hendricks, J., Lauer, A., Kärcher, B., Slowik, J. G., Rosenlof, K. H., Thompson, T. L., Langford, A. O., Loewenstein, M., and Aikin, K. C.: Single-particle measurements of midlatitude black carbon and light-scattering aerosols from the boundary layer to the lower stratosphere, J. Geophys. Res., 111, 1–15, https://doi.org/10.1029/2006JD007076, 2006. a
Sinha, P., Hobbs, P. V., Yokelson, R. J., Bertschi, I. T., Blake, D. R., Simpson, I. J., Gao, S., Kirchstetter, T. W., and Novakov, T.: Emissions of trace gases and particles from savanna fires in southern Africa, J. Geophys. Res.-Atmos., 108, 8487, https://doi.org/10.1029/2002JD002325, 2003. a, b, c, d
Stephens, M., Turner, N., and Sandberg, J.: Particle Identification by Laser-Induced Incandescence in a Solid-State Laser Cavity, Appl. Optics, 42, 3726, https://doi.org/10.1364/AO.42.003726, 2003. a
Stockwell, C. E., Veres, P. R., Williams, J., and Yokelson, R. J.: Characterization of biomass burning emissions from cooking fires, peat, crop residue, and other fuels with high-resolution proton-transfer-reaction time-of-flight mass spectrometry, Atmos. Chem. Phys., 15, 845–865, https://doi.org/10.5194/acp-15-845-2015, 2015. a
Stockwell, C. E., Jayarathne, T., Cochrane, M. A., Ryan, K. C., Putra, E. I., Saharjo, B. H., Nurhayati, A. D., Albar, I., Blake, D. R., Simpson, I. J., Stone, E. A., and Yokelson, R. J.: Field measurements of trace gases and aerosols emitted by peat fires in Central Kalimantan, Indonesia, during the 2015 El Niño, Atmos. Chem. Phys., 16, 11711–11732, https://doi.org/10.5194/acp-16-11711-2016, 2016. a, b, c, d, e, f, g
Susott, R. A., Olbu, G. J., Baker, S. P., Ward, D. E., Kauffman, J. B., and Shea, R.: Carbon, hydrogen, nitrogen, and thermogravimetric analysis of tropical ecosystem biomass, in: Biomass Burning and Global Change, edited by: Levine, J. S., MIT Press, Cambridge, Massachusetts and London, England, 1996. a, b
Ten Hoeve, J. E., Remer, L. A., Correia, A. L., and Jacobson, M. Z.: Recent shift from forest to savanna burning in the Amazon Basin observed by satellite, Environ. Res. Lett., 7, 024020, https://doi.org/10.1088/1748-9326/7/2/024020, 2012. a
Tosca, M. G., Randerson, J. T., and Zender, C. S.: Global impact of smoke aerosols from landscape fires on climate and the Hadley circulation, Atmos. Chem. Phys., 13, 5227–5241, https://doi.org/10.5194/acp-13-5227-2013, 2013. a, b
Trembath, J., Bart, M., and Brooke, J.: FAAM Technical Note 01: Efficiencies of Modified Rosemount Housings for Sampling Aerosol on a Fast Atmospheric Research Aircraft, Tech. Rep. December, Facility for Airborne Atmospheric Measurement (FAAM), 2012. a
Turpin, B. J. and Lim, H.-J.: Species Contributions to PM2.5 Mass Concentrations: Revisiting Common Assumptions for Estimating Organic Mass, Aerosol Sci. Tech., 35, 602–610, https://doi.org/10.1080/02786820119445, 2001. a, b
van der Werf, G. R., Randerson, J. T., Giglio, L., Collatz, G. J., Mu, M., Kasibhatla, P. S., Morton, D. C., DeFries, R. S., Jin, Y., and van Leeuwen, T. T.: Global fire emissions and the contribution of deforestation, savanna, forest, agricultural, and peat fires (1997–2009), Atmos. Chem. Phys., 10, 11707–11735, https://doi.org/10.5194/acp-10-11707-2010, 2010. a, b, c, d
Ward, D. E. and Radke, L. F.: Emissions Measurements from Vegetation Fires: A Comparative Evaluation of Methods and Results, in: Environmental Sciences Research Report; Fire in the environment: The ecological, atmospheric, and climatic importance of vegetation fires, edited by: Crutzen, P. J. and Goldammer, J. G., 53–76, Environmental Sciences Research Report, John Wiley and Sons, Inc., 605 Third Avenue, New York, New York 10158-0012, USA, John Wiley and Sons Ltd., Baffin Lane, Chichester PO 19 1UD, England, 1993. a, b, c, d, e
Ward, D. E., Susott, R. A., Kauffman, J. B., Babbitt, R. E., Cummings, D. L., Dias, B., Holben, B. N., Kaufman, Y. J., Rasmussen, R. A., and Setzer, A. W.: Smoke and fire characteristics for cerrado and deforestation burns in Brazil: BASE-B Experiment, J. Geophys. Res., 97, 14601, https://doi.org/10.1029/92JD01218, 1992. a, b, c, d, e, f
Ward, D. E., Hao, W. M., Susott, R. A., Babbitt, R. E., Shea, R. W., Kauffman, J. B., and Justice, C. O.: Effect of fuel composition on combustion efficiency and emission factors for African savanna ecosystems, J. Geophys. Res.-Atmos., 101, 23569–23576, https://doi.org/10.1029/95JD02595, 1996. a
Wooster, M. J., Freeborn, P. H., Archibald, S., Oppenheimer, C., Roberts, G. J., Smith, T. E. L., Govender, N., Burton, M., and Palumbo, I.: Field determination of biomass burning emission ratios and factors via open-path FTIR spectroscopy and fire radiative power assessment: headfire, backfire and residual smouldering combustion in African savannahs, Atmos. Chem. Phys., 11, 11591–11615, https://doi.org/10.5194/acp-11-11591-2011, 2011. a, b, c, d, e, f
Yamasoe, M. A., Artaxo, P., Miguel, A. H., and Allen, A. G.: Chemical composition of aerosol particles from direct emissions of vegetation fires in the Amazon Basin: water-soluble species and trace elements, Atmos. Environ., 34, 1641–1653, https://doi.org/10.1016/S1352-2310(99)00329-5, 2000. a, b, c
Yokelson, R. J., Griffith, D. W. T., and Ward, D. E.: Open-path Fourier transform infrared studies of large-scale laboratory biomass fires, J. Geophys. Res.-Atmos., 101, 21067–21080, https://doi.org/10.1029/96JD01800, 1996. a, b, c
Yokelson, R. J., Goode, J. G., Ward, D. E., Susott, R. A., Babbitt, R. E., Wade, D. D., Bertschi, I., Griffith, D. W. T., and Hao, W. M.: Emissions of formaldehyde, acetic acid, methanol, and other trace gases from biomass fires in North Carolina measured by airborne Fourier transform infrared spectroscopy, J. Geophys. Res., 104, 30109, https://doi.org/10.1029/1999JD900817, 1999. a, b
Yokelson, R. J., Bertschi, I. T., Christian, T. J., Hobbs, P. V., Ward, D. E., and Hao, W. M.: Trace gas measurements in nascent, aged, and cloud-processed smoke from African savanna fires by airborne Fourier transform infrared spectroscopy (AFTIR), J. Geophys. Res.-Atmos., 108, 8478, https://doi.org/10.1029/2002JD002322, 2003. a, b, c, d, e
Yokelson, R. J., Karl, T., Artaxo, P., Blake, D. R., Christian, T. J., Griffith, D. W. T., Guenther, A., and Hao, W. M.: The Tropical Forest and Fire Emissions Experiment: overview and airborne fire emission factor measurements, Atmos. Chem. Phys., 7, 5175–5196, https://doi.org/10.5194/acp-7-5175-2007, 2007. a, b, c
Yokelson, R. J., Crounse, J. D., DeCarlo, P. F., Karl, T., Urbanski, S., Atlas, E., Campos, T., Shinozuka, Y., Kapustin, V., Clarke, A. D., Weinheimer, A., Knapp, D. J., Montzka, D. D., Holloway, J., Weibring, P., Flocke, F., Zheng, W., Toohey, D., Wennberg, P. O., Wiedinmyer, C., Mauldin, L., Fried, A., Richter, D., Walega, J., Jimenez, J. L., Adachi, K., Buseck, P. R., Hall, S. R., and Shetter, R.: Emissions from biomass burning in the Yucatan, Atmos. Chem. Phys., 9, 5785–5812, https://doi.org/10.5194/acp-9-5785-2009, 2009. a, b, c, d, e, f, g, h, i, j, k, l
Yokelson, R. J., Burling, I. R., Urbanski, S. P., Atlas, E. L., Adachi, K., Buseck, P. R., Wiedinmyer, C., Akagi, S. K., Toohey, D. W., and Wold, C. E.: Trace gas and particle emissions from open biomass burning in Mexico, Atmos. Chem. Phys., 11, 6787–6808, https://doi.org/10.5194/acp-11-6787-2011, 2011. a
Yokelson, R. J., Andreae, M. O., and Akagi, S. K.: Pitfalls with the use of enhancement ratios or normalized excess mixing ratios measured in plumes to characterize pollution sources and aging, Atmos. Meas. Tech., 6, 2155–2158, https://doi.org/10.5194/amt-6-2155-2013, 2013. a
Yokelson, R. J., Burling, I. R., Gilman, J. B., Warneke, C., Stockwell, C. E., de Gouw, J., Akagi, S. K., Urbanski, S. P., Veres, P., Roberts, J. M., Kuster, W. C., Reardon, J., Griffith, D. W. T., Johnson, T. J., Hosseini, S., Miller, J. W., Cocker III, D. R., Jung, H., and Weise, D. R.: Coupling field and laboratory measurements to estimate the emission factors of identified and unidentified trace gases for prescribed fires, Atmos. Chem. Phys., 13, 89–116, https://doi.org/10.5194/acp-13-89-2013, 2013. a
Yuan, J.-F., Corbin, J. C., Modini, R. L., Zanatta, M., Muller, T., and Gysel, M.: The accuracy of commercial pulsed LII compared with reference rBC mass in laboratory and field measurements, European Aerosol Conference 2017, Zurich, Abstract T306N3c3, 2017. a