the Creative Commons Attribution 3.0 License.
the Creative Commons Attribution 3.0 License.
Gaseous elemental mercury (GEM) fluxes over canopy of two typical subtropical forests in south China
Qian Yu
Yao Luo
Shuxiao Wang
Zhiqi Wang
Jiming Hao
Lei Duan
Mercury (Hg) exchange between forests and the atmosphere plays an important role in global Hg cycling. The present estimate of global emission of Hg from natural source has large uncertainty, partly due to the lack of chronical and valid field data, particularly for terrestrial surfaces in China, the most important contributor to global atmospheric Hg. In this study, the micrometeorological method (MM) was used to continuously observe gaseous elemental mercury (GEM) fluxes over forest canopy at a mildly polluted site (Qianyanzhou, QYZ) and a moderately polluted site (Huitong, HT, near a large Hg mine) in subtropical south China for a full year from January to December in 2014. The GEM flux measurements over forest canopy in QYZ and HT showed net emission with annual average values of 6.67 and 0.30 , respectively. Daily variations of GEM fluxes showed an increasing emission with the increasing air temperature and solar radiation in the daytime to a peak at 13:00, and decreasing emission thereafter, even as a GEM sink or balance at night. High temperature and low air Hg concentration resulted in the high Hg emission in summer. Low temperature in winter and Hg absorption by plant in spring resulted in low Hg emission, or even adsorption in the two seasons. GEM fluxes were positively correlated with air temperature, soil temperature, wind speed, and solar radiation, while it is negatively correlated with air humidity and atmospheric GEM concentration. The lower emission fluxes of GEM at the moderately polluted site (HT) when compared with that in the mildly polluted site (QYZ) may result from a much higher adsorption fluxes at night in spite of a similar or higher emission fluxes during daytime. This shows that the higher atmospheric GEM concentration at HT restricted the forest GEM emission. Great attention should be paid to forests as a crucial increasing Hg emission source with the decreasing atmospheric GEM concentration in polluted areas because of Hg emission abatement in the future.
- Article
(5757 KB) - Full-text XML
-
Supplement
(3751 KB) - BibTeX
- EndNote


Mercury (Hg) is a globally concerning environmental contaminant due to its cyclic transport between air, water, soil, and the biosphere, and its tendency to bioaccumulate in the environment as neurotoxic methylated compounds (MeHg) (Driscoll et al., 2013), which can cause damage to the environment and human health (Lindqvist et al., 1991). Atmospheric Hg exists in three different forms with different chemical and physical properties: gaseous elemental mercury (GEM, Hg0), gaseous oxidized mercury (GOM, Hg2+), and particulate-bound mercury (PBM, Hgp). Because of its mild reactivity, high volatility, and low dry deposition velocity and water solubility, GEM is the most abundant form of Hg in the atmosphere (Gustin and Jaffe, 2010; Holmes et al., 2010), and can transport over long distances due to the long residence time (0.5–2 years) (Schroeder et al., 1998).
Hg emission flux from anthropogenic sources has been quantified with reasonable consistency from 1900 to 2500 t yr−1 (Streets et al., 2009, 2011; Zhang et al., 2015, 2016). However, the present estimates of natural Hg emission from waters, soils, and vegetation are poorly constrained and have large uncertainties, with the values larger than anthropogenic emission (e.g., 2000 t yr−1: Lindqvist et al., 1991; 5207 t yr−1: Pirrone et al., 2010; 4080–6950 t yr−1: UNEP, 2013; 4380–6630 t yr−1: Zhu et al., 2016). The reliable quantification of natural Hg source, specifically GEM exchange between terrestrial ecosystem and the atmosphere would contribute to the understanding of global and regional Hg cycling budgets (Pirrone et al., 2010; Wang et al., 2014b; Song et al., 2015).
As a dominant ecosystem on the Earth, forest is generally regarded as an active pool of Hg (Lindberg et al., 2007; Ericksen et al., 2003; Sigler et al., 2009). Hg in the forest ecosystem is derived primarily from atmospheric deposition (Grigal, 2003), and foliar uptake of GEM has been recognized as a principal pathway for atmospheric Hg to enter terrestrial ecosystems (Frescholtz et al., 2003; Niu et al., 2011; Obrist, 2007). Accumulated Hg in foliage is transferred to soil reservoirs via plant detritus (St Louis et al., 2001) or may partially be released back into the atmosphere (Bash and Miller, 2009). In addition, Hg may enter the foliage by recycling processes, releasing GEM from underlying soil surfaces (Millhollen et al., 2006b). Soil–air GEM exchange is controlled by numerous factors, including physicochemical properties of soil substrate and abiotic/biotic processes in the soil, meteorological conditions, and atmospheric composition (Bahlmann et al., 2006; Carpi and Lindberg, 1997; Engle et al., 2005; Fritsche et al., 2008a; Gustin, 2011; Rinklebe et al., 2010; Mauclair et al., 2008; Zhang et al., 2008). The majority of reported GEM flux measurements over terrestrial soils have indicated net emission in warmer seasons and near-zero fluxes in cold temperatures (Sommar et al., 2013). There are ongoing debates regarding whether or not forest is a sink or a source of GEM because the forest–air exchange flux is the sum of vegetation and soil exchange flux, depending on not only atmospheric concentration and meteorological conditions but also plant community composition (Bash and Miller, 2009; Converse et al., 2010) over shorter or longer periods.
China is currently the world's top emitter of anthropogenic Hg, with a value of 538 t in 2010 (Zhang et al., 2015) and 530 t in 2014 (Wu et al., 2016), which has resulted in an elevated Hg deposition to terrestrial ecosystem and thus Hg accumulation in land surface. Given that forest is likely to have large GEM re-emission of legacy Hg stored through old deposition, it is important to know the role of forests in China in global Hg transport and cycles. However, there are far fewer long-term studies of forest GEM exchange flux in China, especially for the subtropical forest. In this study, direct measurements of net exchange of GEM over canopy of subtropical forests was conducted at a relatively mildly polluted site and a moderately polluted site impacted by an adjacent Hg mine in south China. The objective of this study is to quantify the natural Hg emission from the typical forest ecosystems and to analyze its influencing factors.
2.1 Site description
This study was conducted at Qianyanzhou (QYZ) and Huitong (HT) experimental stations, managed by the Chinese Academy of Sciences (CAS) and Central South University of Forestry and Technology (CSUFT), respectively. The QYZ station (115∘04′ E, 26∘45′ N) is located in Taihe County, Jiangxi Province (Fig. 1, Table 1), surrounded by farmland, with no obviously anthropogenic mercury sources such as coal-fired power plants and metal smelters in a 25 km radius. The HT station (109∘45′ E, 26∘50′ N) is located in Huitong County, Hunan Province, about 100 km away from the Wanshan Mercury Mine (WS), which used to be the largest mercury mine in China. The two study sites have similar climate conditions. The dominant soil and vegetation types (Table 1) are widely distributed in subtropical monsoon climate zone in south China. The subtropical evergreen coniferous forests have fairly thick canopy, even in winter.

Figure 1Locations of the QYZ station, HT station and WS Mercury Mine. Vegetation map of China (CAS., 2007) as background.
Table 1Description of QYZ and HT experimental station.
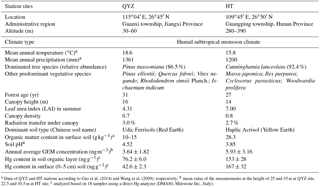
a Data of QYZ and HT stations according to Gao et al. (2014) and Wang et al. (2009), respectively; b mean value of the measurements at the height of 25 and 35 m at QYZ site, 22.5 and 30.5 m at HT site; c analyzed based on 18 samples using a direct Hg analyzer (DMA80, Milestone Inc., Italy).
2.2 Flux monitoring
The continuous monitoring system of the GEM vertical concentration gradient over the forest canopy included a Hg detector, two series of intake pipeline, and an automatically controlled valve system (Fig. 2). The air sampling head and pipeline was arranged on the flux tower, while the valve system and mercury detector were set in the cabin near the flux tower. Two automatic GEM analyzers, model 2537X and 2537B (Tekran Instruments Inc.), with the same working principle and detection limit (less than 0.1 ng m−3: Gustin et al., 2013), were used at sites QYZ and HT, respectively. Air intakes were placed at two different heights (25 and 35 m on the 41 m high flux tower at site QYZ; 22.5 and 30.5 m on the 33 m high flux tower at site HT). Considering the extremely large disturbance of temperature and wind speed over forest canopy, especially close to the canopy, the lower air intake should be set to at least half canopy height (Table 1) above the canopy to ensure the stability of the results (Lindberg et al., 1998). In addition, all the air intakes were fixed outside of the tower body at a distance of more than 1 m to avoid the influence of the tower. Passing a particulate filter membrane (0.2 µm) and a soda-lime adsorption tank just after the intake to remove particulate matters, organic matters and acid gases, the in-gas from each height was pumped through a separated pipe (Φ=0.25 in) to the same Hg detector in turn, controlled by two three-way electromagnetic valves manipulated by a time relay. The electromagnetic valve switched once every 10 min – i.e., the measuring time of the gas from each height was 10 min – and it took 20 min for a whole measuring cycle. The design of the system including the pump ensured the continuing air flow at the same velocity in the two pipeline, whether the gas was sent to detect or not, to avoid the retention of air of the last cycle in the pipeline. The pipeline, air intakes and valves are made of Teflon to avoid the adsorption of Hg.
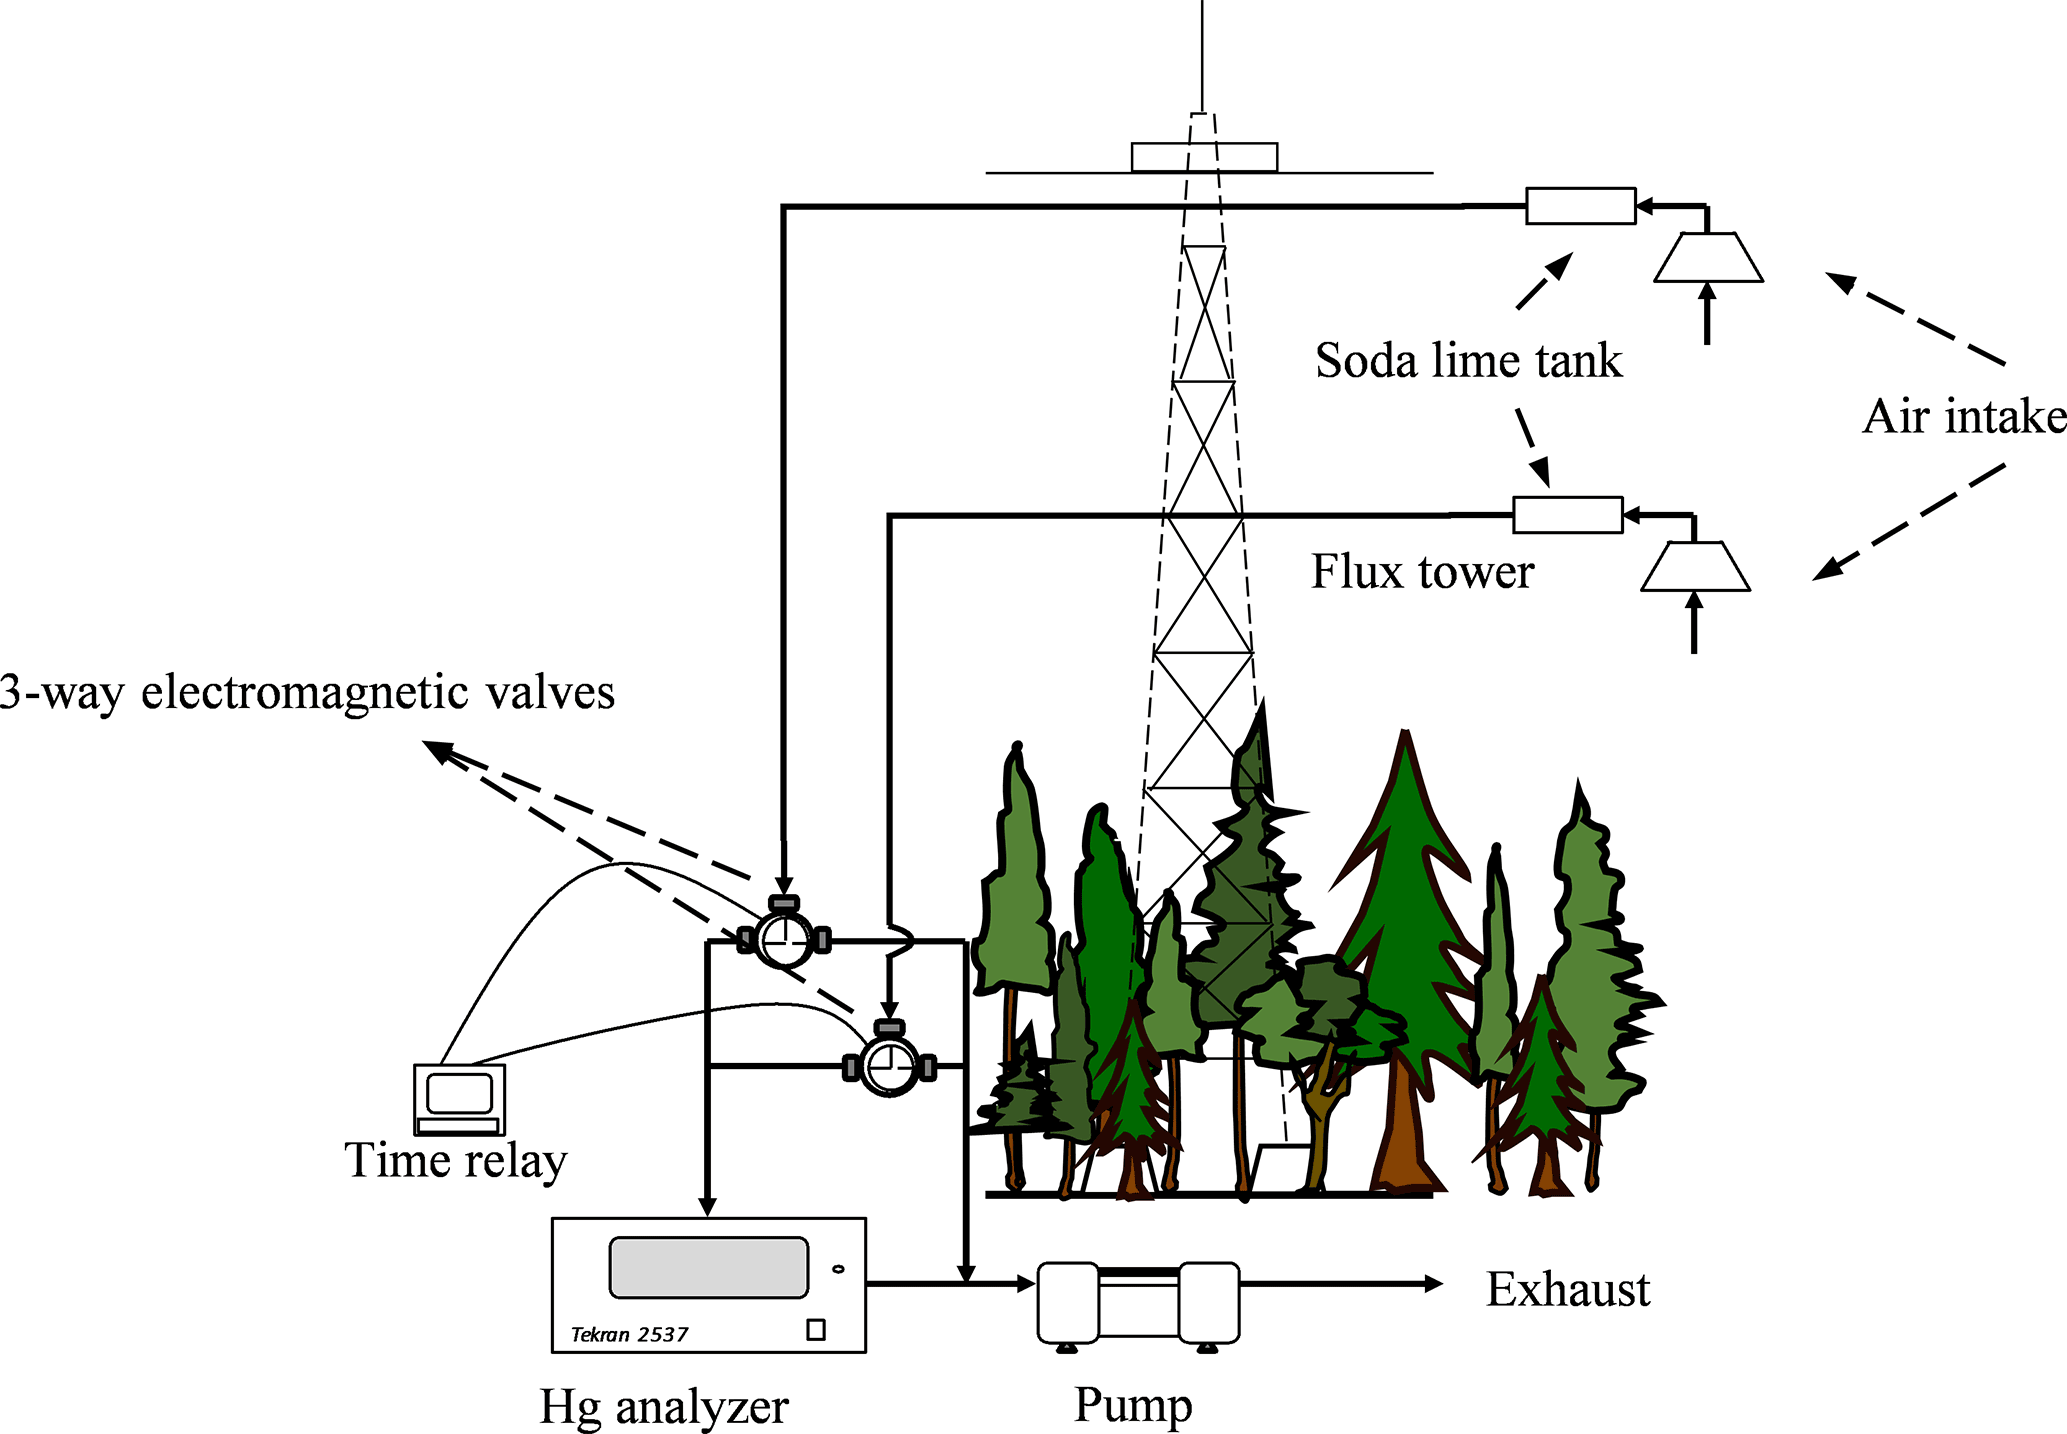
Figure 2Apparatus used to monitor vertical concentration gradient of GEM above forest canopy
Meteorological parameters were also measured continuously by setting air temperature, humidity and wind speed sensors at the two heights (same to the air intakes), the solar radiation sensor and rainfall monitor at the higher height, and soil temperature and moisture sensors at 5 cm depth in soil about 20 m away from the flux tower (Table S1 in the Supplement). A variety of meteorological data was output by the data acquisition system (CR1000, Campbell Scientific Inc., USA) every 5 min.
The observations of GEM concentration gradient and meteorological parameters lasted for 1 year at both sites from January to December in 2014.
2.3 GEM flux calculation
The dynamic flux chamber (DFC) and micrometeorological techniques (MM) are the mostly widely applied approaches for surface–atmosphere GEM flux quantification (Zhu et al., 2016). The MM methods, including the direct flux measurement method (the relaxed eddy accumulation method, REA) and the gradient methods (further divided into the aerodynamic gradient method, AGM, and the modified Bowen-ratio method, MBR), were usually applied to measure the GEM flux over forest canopy with the advantages of no interference on measuring interface and high capability of chronical measuring large-scale fluxes. The AGM method, which has been used over grasslands, agricultural lands, salt marshes, landfills, and snow surface (Lee et al., 2000; Kim et al., 2001, 2003; Cobbett et al., 2007; Cobbett and Van Heyst, 2007; Fritsche et al., 2008b, c; Baya and Van Heyst, 2010), was used in this study. According to the AGM method, the GEM fluxes (F, ) over forest canopy were calculated on the basis of the measurement of the vertical concentration gradient by using Eq. (1):
where K is turbulent transfer coefficient (m2 s−1), c is GEM concentration in the atmosphere (ng m−3), and z is the vertical height (m). Here, the GEM concentrations difference between the two air intakes divided by the height difference was assumed to be the vertical gradient of atmospheric GEM concentration. Since the automatic GEM analyzer switches between two gold tubes and gets a value every 5 min, the two concentrations were averaged in each 10 min (matched to the single height sampling interval by adjusting the time relay) to avoid possible bias caused by different gold tubes. The 20 min variations of GEM concentration at certain height were between −2 and 2 % and −4 and 4 % (95 % confidence interval) at sites QYZ and HT, respectively. Thus, the GEM concentration was in a semi-steady state during the sampling interval. The GEM concentration differences were calculated as the average concentrations at the higher height minus the two adjacent average concentrations at the lower sampling height (all in 10 min interval). Thus, the vertical gradient of air GEM concentration can be gained every 10 min. Turbulent transfer coefficient K was calculated through specific steps (Supplement) according to the similarity theory after the measurement of the wind speed and temperature profile (Yu and Sun, 2006).
2.4 Quality control
In order to ensure the accuracy of the measurement results, regular maintenance and calibration were performed on the continuous monitoring system at both sites. The particulate filter membrane on the air intake was changed once a week. In addition, the soda-lime tank after the air intake and the filter membrane before the Hg analyzer was replaced monthly. The automatic calibrations of the internal mercury source of Tekran 2537X and Tekran 2537B were done once every 24 h. Manual calibration by placing the air intakes in a certain Hg concentration (Tekran 2505, Tekran Inc.) for 24 h was done once every month. The recovery rates were between 95 and 105 % with an average value of 100.3 %.
We did blank experiments, i.e., measuring the detection limit of the concentration gradient for the monitoring systems before the installation, when the air intakes were both placed indoor with stable mercury concentration. It turned out that the differences of GEM concentration between the pipelines were 0.004±0.017 and 0.010±0.024 ng m−3 (n>60) at sites QYZ and HT, respectively. The detection limit of the concentration gradient of the system was defined as the mean of detecting difference results plus 1 SD (Fritsche et al., 2008b). Therefore, the detection limits were 0.021 and 0.034 ng m−3 at sites QYZ and HT, respectively. This means that there was no significant difference between the two GEM concentrations at different height when the discrepancy was lower than the detection limits in the field experiments. In addition, the parallelity of the two pipelines in the system was detected every month by moving the air intakes to the cabin and running continuously for at least 24 h. The pipeline was cleaned by soaking for 24 h with 15 % nitric acid and then cleaning with ultrapure water and acetone in turn, before finally drying with zero mercury gas (Zero Air Tank, Tekran Inc.) until the difference of GEM concentration between the two pipelines was less than 0.02 ng m−3. There was a spare pipeline system at each site to meet demands during a break in monitoring due to pipeline cleaning. The blank experiments to measure the monitoring system error were conducted before the installation by placing the air intakes in the zero mercury gas (Zero Air Tank, Tekran Inc.) for 48 h. There were almost no adsorption/emission from the monitoring system (including of the long Teflon tube, the soda-lime tank and the electromagnetic valves), with the measurement results less than the detection limit of the instrument (0.1 ng m−3).
The result measured by AGM represented a mean value of regional GEM flux, i.e., the footprint area of tower, which is related to the measuring height and meteorological conditions (Fritsche et al., 2008b). A previous study estimated that the footprint of intake at 40 m height on the flux tower was 100–400 m (Zhao et al., 2005). Therefore, the footprints of the intakes located at different height may be similar due to the relatively uniform distribution of Pinus massoniana or Cunninghamia lanceolata forest within 500 m around the flux towers in our research.
Concentration gradients lower than the system detection limit could not be truncated in the case of the overestimation of GEM flux when calculating the average GEM flux in previous studies (Fritsche et al., 2008b; Converse et al., 2010). The proportion of the data which had the GEM concentration gradient larger than the detection limit in this study was larger than 85 %, which was higher than that in a previous study on grassland (about 50 %; Fritsche et al., 2008b). The reason for such high-quality data might be the larger height difference (10 m at site QYZ and 8 m at site HT, vs. 2 m in the grassland study), higher GEM concentration, and larger exchange surface of forest than grassland. In accordance with the inaccurate measurement by AGM under the high atmospheric stability (Converse et al., 2010), especially in temperature inversion, the calculation of turbulent transfer coefficient K could not converge, and the flux was eliminated. In addition, the data were eliminated when the GEM flux exceeded the range of the monthly mean ±3 SD, or during instrument failure and operation instability.
3.1 Hourly and daily variations in GEM concentrations and fluxes
Stations QYZ and HT both have subtropical monsoon climate, with hot and rainy summers and cold and dry winters (Table S2). Atmospheric GEM concentrations (the average concentration at two heights) were lower during spring and summer and higher in winter and fall, with an annual average value of 3.64 ng m−3 (1.89–6.26 ng m−3, 5–95 % confidence interval) at site QYZ (Fig. 3), which was far higher than the mercury concentrations in background region in the Northern Hemisphere (1.5–2.0 ng m−3: Steffen et al., 2005; Kock et al., 2005; 1.51 ng m−3 in 2014: Sprovieri et al., 2016) and correspond to the observed results in southeast China (2.7–5.4 ng m−3: Wang et al., 2014a). Although there were no major anthropogenic mercury emission sources near the QYZ station, the high concentration may be attributed to regional residential coal combustion (Wu et al., 2016) and high background GEM concentration in China (Fu et al., 2015). The annual average GEM concentration at station HT was 5.93 ng m−3 (2.46–11.6 ng m−3, 5–95 % confidence interval), even higher than that at station QYZ.
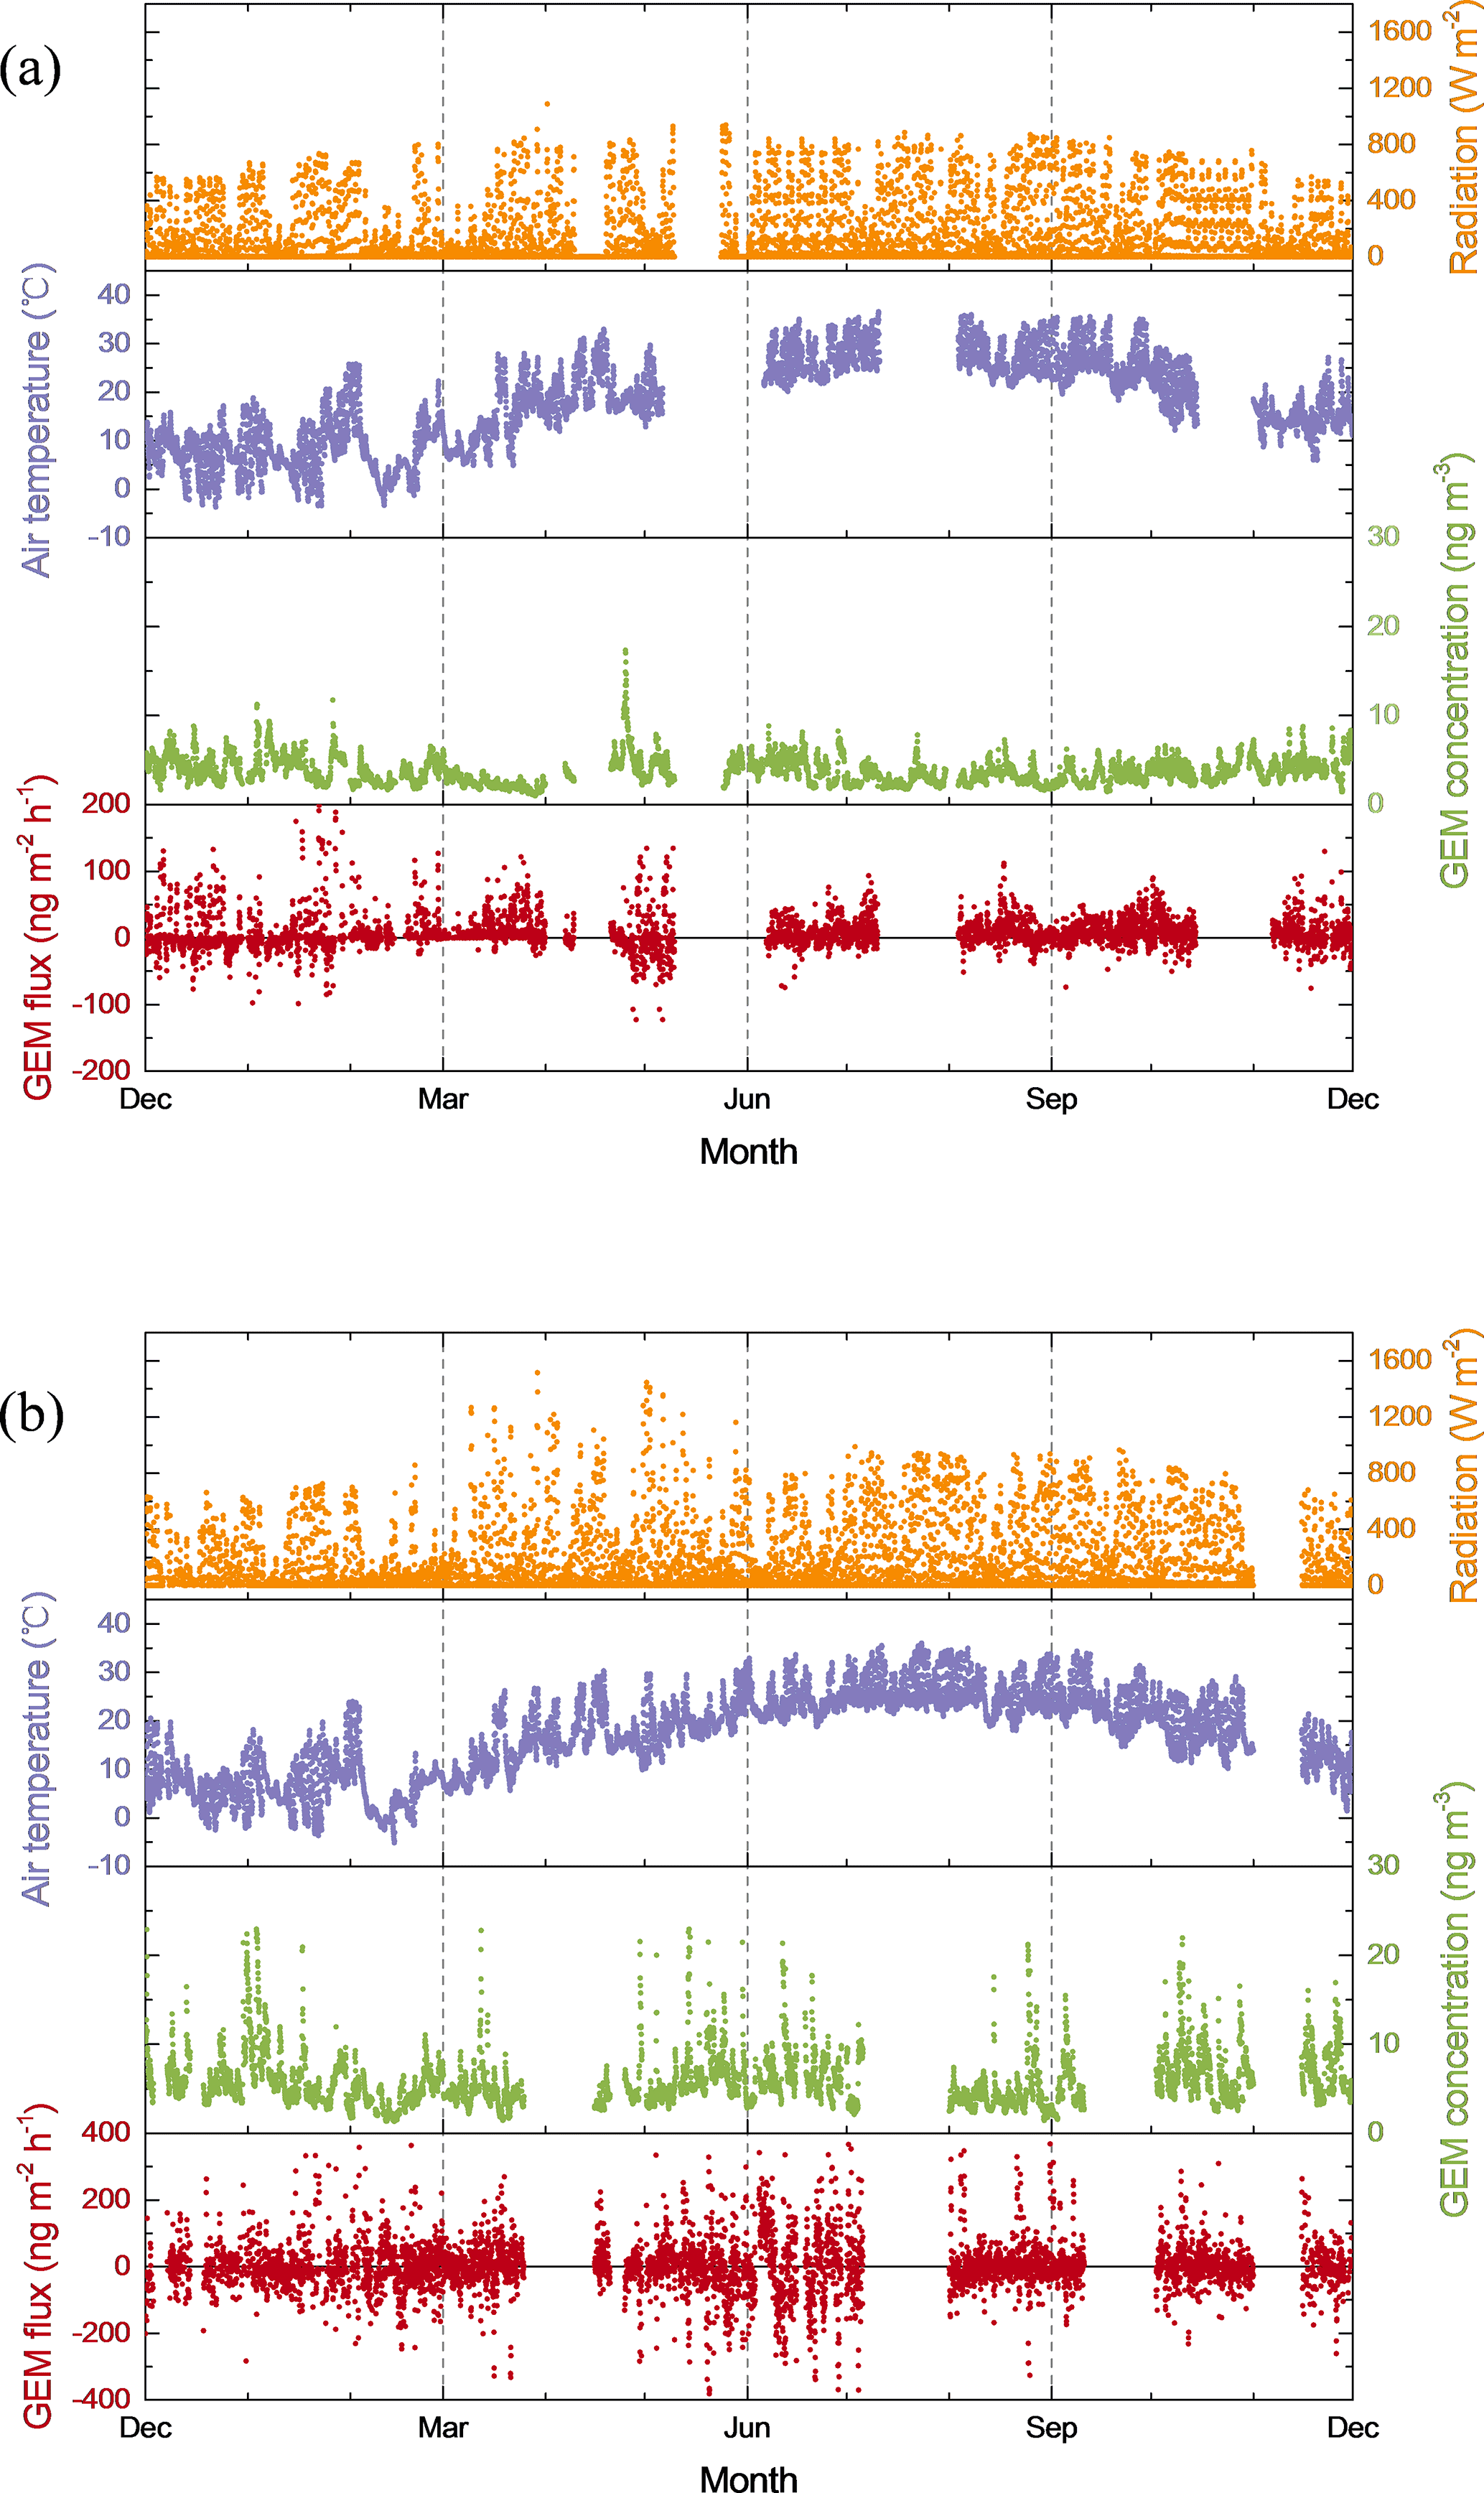
Figure 3Annual variations of solar radiation, air temperature, GEM concentration (the average value of the GEM concentration at two heights), and GEM fluxes at (a) QYZ and (b) HT stations. The observations lasted for 1 year at both sites (January to December in 2014). The data in April, May and December were supplemented with the data in 2013 due to the use of the mercury analyzer for measuring the soil and vegetation emission at site HT. Data loss was caused by elimination of the values outside the range of the monthly mean ±3 SD, as well as the problematic data during high atmospheric stability, instrument failure and operational instability. The annual variations of GEM gradient and turbulent transfer coefficient (K) are shown in Fig. S1 in the Supplement.
The diurnal variation of fluxes indicated that the GEM flux increased gradually with the increase in air temperature and solar radiation in the daytime in all four seasons. The peak fluxes were averaged to 30.9, 29.3, 50.9 and 29.6 (22.6, 46.2, 46.2 and 44.7 ) in winter (December–February), spring (March–May), summer (June–August) and fall (September–November), respectively, at QYZ (HT) at around 13:00. In contrast, the GEM fluxes were stable at around zero or even negative at night, indicating a state of Hg balance at site QYZ and a strong sink at site HT. This pattern was similar to the Hg emission characteristics of soil (Ma et al., 2016), vegetation (Luo et al., 2016), and terrestrial surfaces (Stamenkovic et al., 2008). Modeling results of the diurnal variation of GEM fluxes over canopy for deciduous needleleaf forest (Wang et al., 2016) also showed a similar trend.
A clear GEM absorption (negative fluxes) occurred not only at night but also in the morning in spring at both sites (Fig. 4b). A small and a large depletion peaked at 09:00 and 11:00 at sites QYZ and HT, respectively, in spring might result from the vegetation uptake, which was found by direct monitoring of GEM emission from foliage (Luo et al., 2016; Converse et al., 2010; Stamenkovic and Gustin, 2009). The daytime GEM emission fluxes were significantly higher in summer and lower in winter with changes in air temperature and solar radiation. With longer daytime and higher temperature, there were fewer hours per day in a state of GEM sink in summer (Fig. 4c). The atmosphere–forest exchange of GEM became weaker in the fall with the decline in temperature and the dormancy of plant growth (Fig. 4d). There were also seasonal differences in diurnal variation of GEM emission from soil (Ma et al., 2016) and vegetation (Luo et al., 2016), with highest values occurring in summer, followed by spring and fall, while the lowest value was in winter.
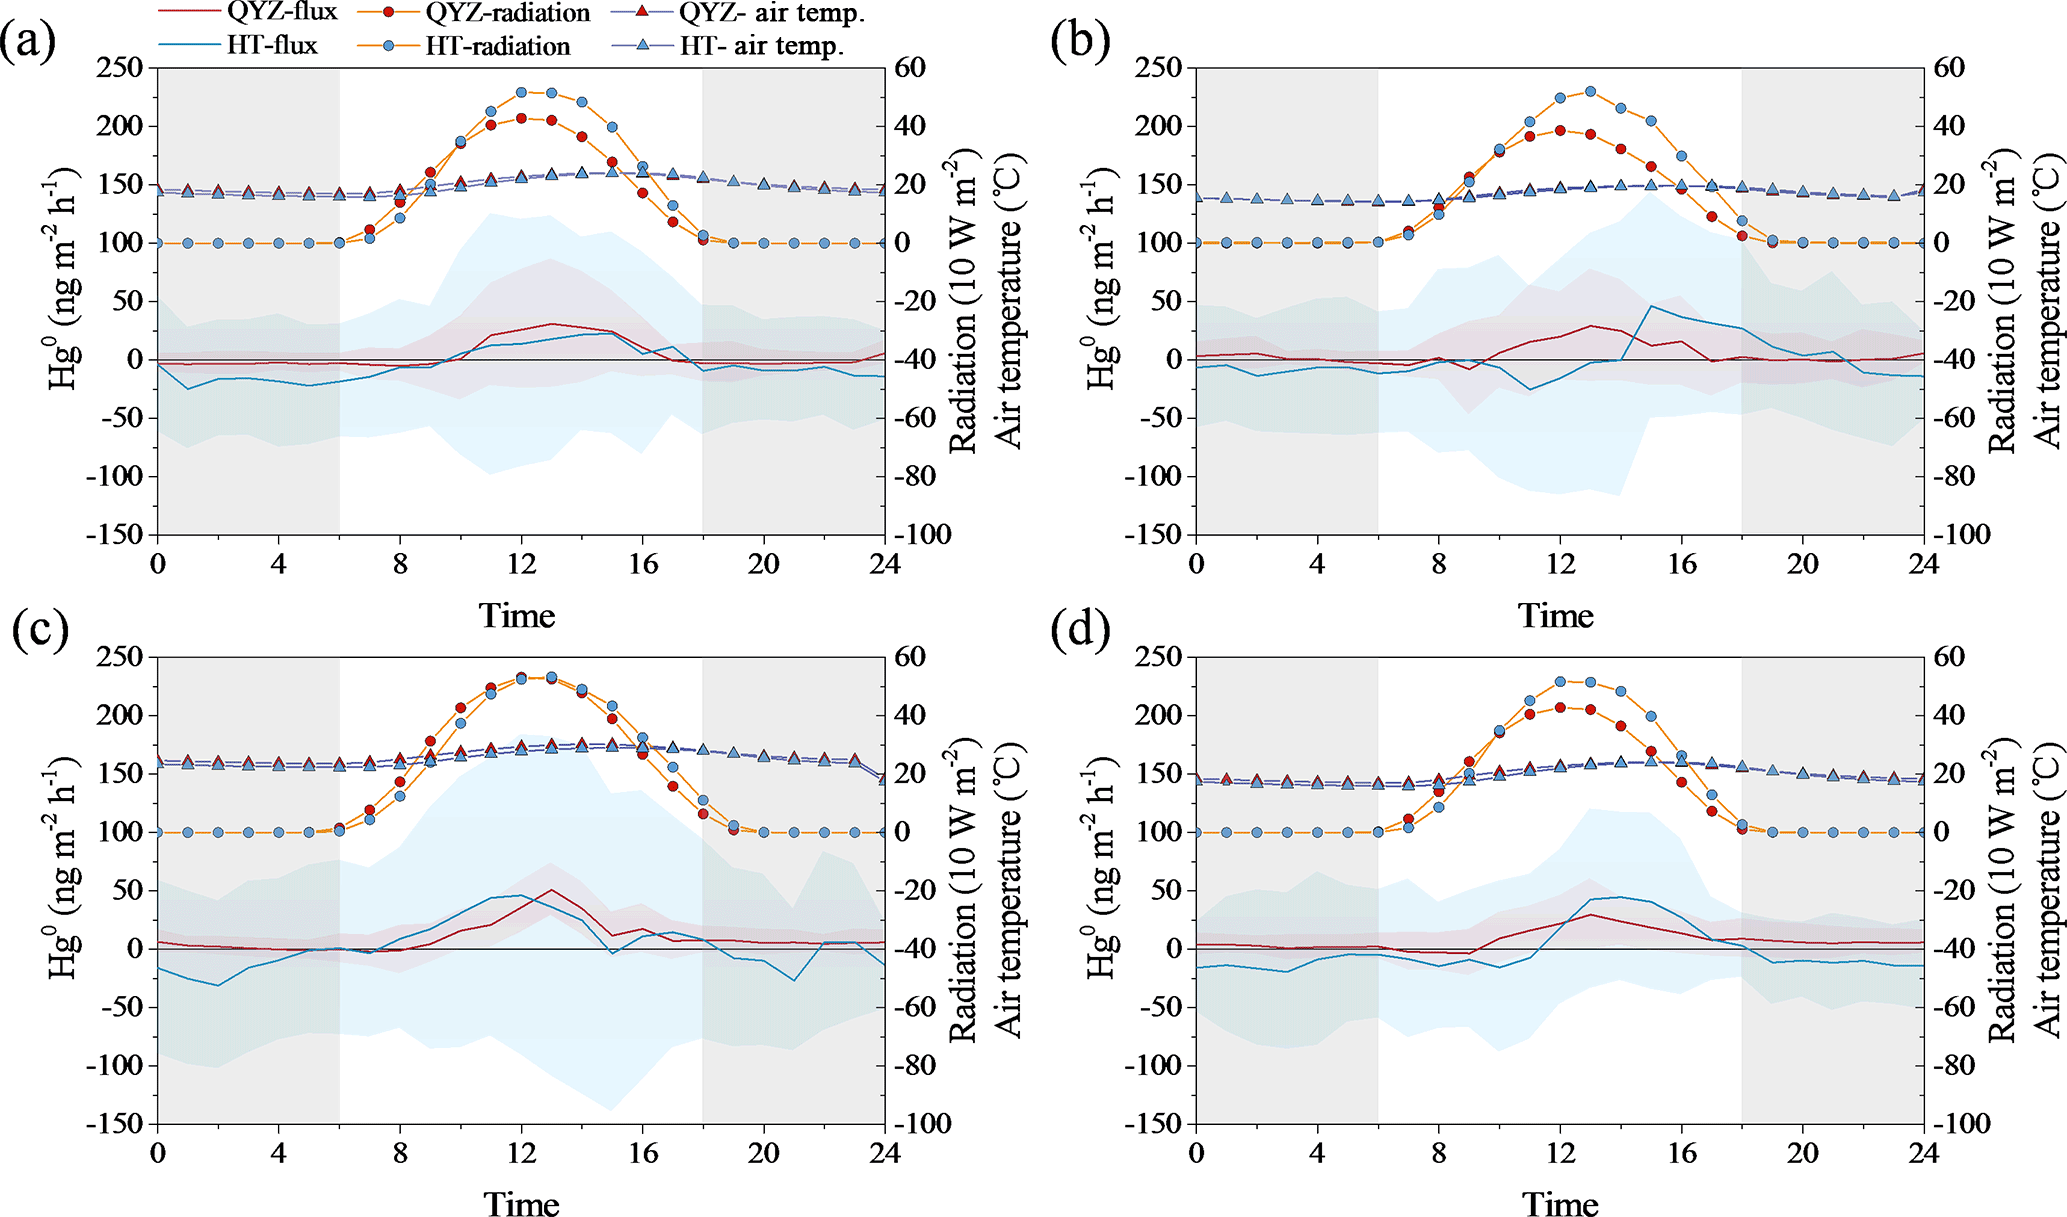
Figure 4Diurnal variation in GEM fluxes, air temperature and solar radiation over forest canopy in each season. (a) Winter: December to February; (b) spring: March to May; (c) summer: June to August; (d) fall: September to October. Lines and envelopes depict mean values and standard variances. Diurnal variation in GEM gradient and turbulent transfer coefficient (K) in each season at two sites is presented in Fig. S2.
The two stations had similar temperatures due to the same climate conditions and latitude (Table 1 and S2). A relatively higher value and later peak of solar radiation (except for summer) at site HT might result from the higher altitude and lower longitude, which would enhance and delay the peaks of emission flux in winter, spring, and fall. Relatively larger standard variance of the GEM flux at site HT indicated a higher fluctuation, which might be ascribed to the fluctuating GEM concentration. Station HT is close to the WS Mercury Mine, and the GEM concentration is influenced by meteorological factors like wind direction.
3.2 Monthly variations in GEM concentrations and fluxes
The monthly mean value of GEM concentration seemed quite even throughout the year at both site QYZ and HT, with three peak values in January, June, and November (4.52, 4.32, and 4.25 ng m−3 at site QYZ; 6.73, 6.74, and 7.14 ng m−3 at site HT), and two low values of 2.33 and 2.89 ng m−3 (in March and July) at site QYZ and 4.29 and 3.34 ng m−3 (in February and July) at site HT. In general, monthly variations of fluxes exhibited an opposite trend in concentration; almost all the larger fluxes emerged in the months with lower GEM concentration.
All the monthly mean GEM fluxes were positive at QYZ station (Fig. 5), indicating that the forest was a net atmospheric GEM source in each month. A relatively low GEM flux (3.13 ) and the lowest air temperature (7.15 ∘C) occurred in December. The monthly mean GEM fluxes rapidly rose from December to March, coinciding with the increase in air temperature and solar radiation, followed by a sudden fall to 1.56 in April, and a slight increase to 4.40 in June. After that, the GEM flux rapidly increased to 11.5 in July and peaked at August (12.8 ), then gradually reduced to 6.84 in November, corresponding to the decrease in air temperature. Generally, the increase in solar radiation and air temperature would cause the increasing in GEM emission from soil and vegetation (see Sect. 3.3). The monthly variations of annual Hg emission fluxes from forest soil in South Korea showed a similar trend with air temperature (Han et al., 2016). Mainly affected by soil emissions, the changes in GEM fluxes showed a similar trend to those of air temperature and solar radiation in winter and fall. In contrast, the GEM fluxes greatly decreased in the growing season, mainly influenced by vegetation uptake of GEM (Millhollen et al., 2006a; Stamenkovic and Gustin, 2009).
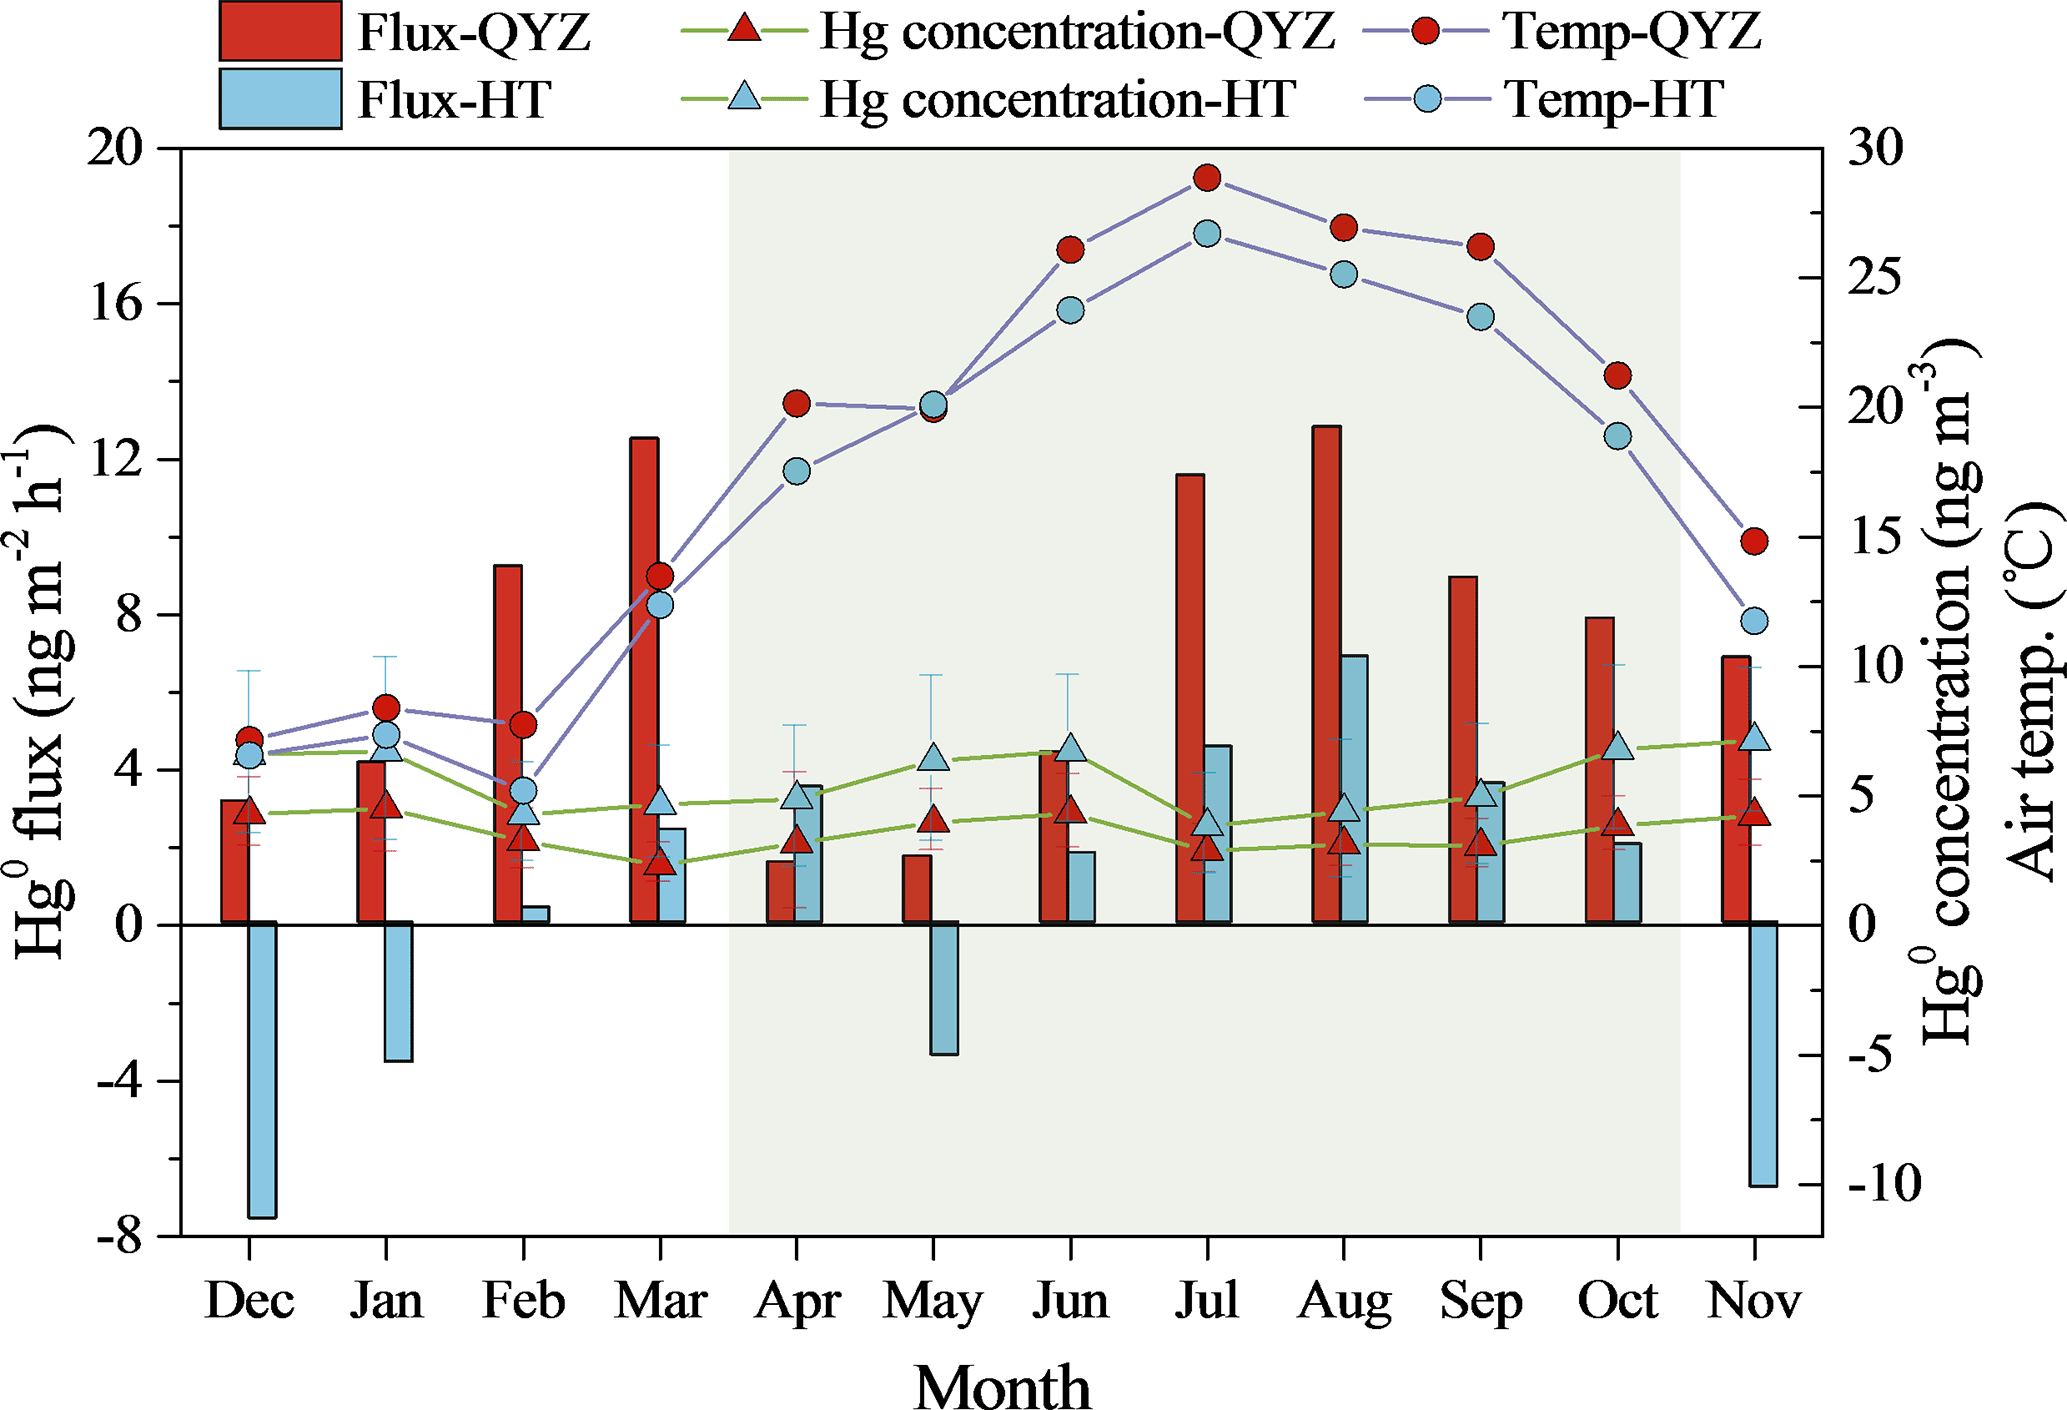
Figure 5Monthly variations of GEM flux, GEM concentration and air temperature at sites QYZ and HT. The leaf-growing season is marked as the shaded area.
Different from QYZ station, the forest was a GEM sink in November, December and January with a negative value of monthly mean GEM flux of −6.82, −7.64, and −3.60 , respectively, at HT station (Fig. 5). The monthly mean GEM fluxes gradually increased and became positive in February to April, before subsequently falling to negative in May. Then, coinciding with the change in air temperature, the GEM fluxes increased again, peaked in August (6.86 ), and gradually decreased to negative in November. Although monthly variation of GEM fluxes at site HT was similar to that at site QYZ, site HT had overall lower GEM fluxes but higher atmospheric GEM concentration than QYZ station. The annual average atmospheric mercury concentration at site HT was 62 % higher than that at site QYZ (Table 1). Higher concentrations of atmospheric mercury would inhibit the Hg release from soil and plants and increase the GEM absorption of foliage (see also in Sect. 3.2). In addition to the influence of high atmospheric GEM concentration, the current-year foliage of Cunninghamia lanceolata (dominant species at HT station, Table 1) has larger absorption than Pinus massoniana at QYZ, indicated by larger Hg content in needles and litter (Fig. S3; Luo et al., 2016).
The monthly mean daytime-GEM fluxes always had positive values, which were much larger than the values at night (with small negative values in December, January, April and May, and near-zero in other months) at site QYZ (Fig. 6). Thus, the GEM flux over forest canopy was mainly attributed to the emission during the daytime at site QYZ. The monthly mean GEM fluxes were also positive during the daytime but all negative at night at site HT. Site HT had larger monthly mean emission fluxes during the daytime and larger absorption fluxes at night (Fig. 6). As a total effect, the monthly fluxes were lower than those in QYZ (Fig. 5).
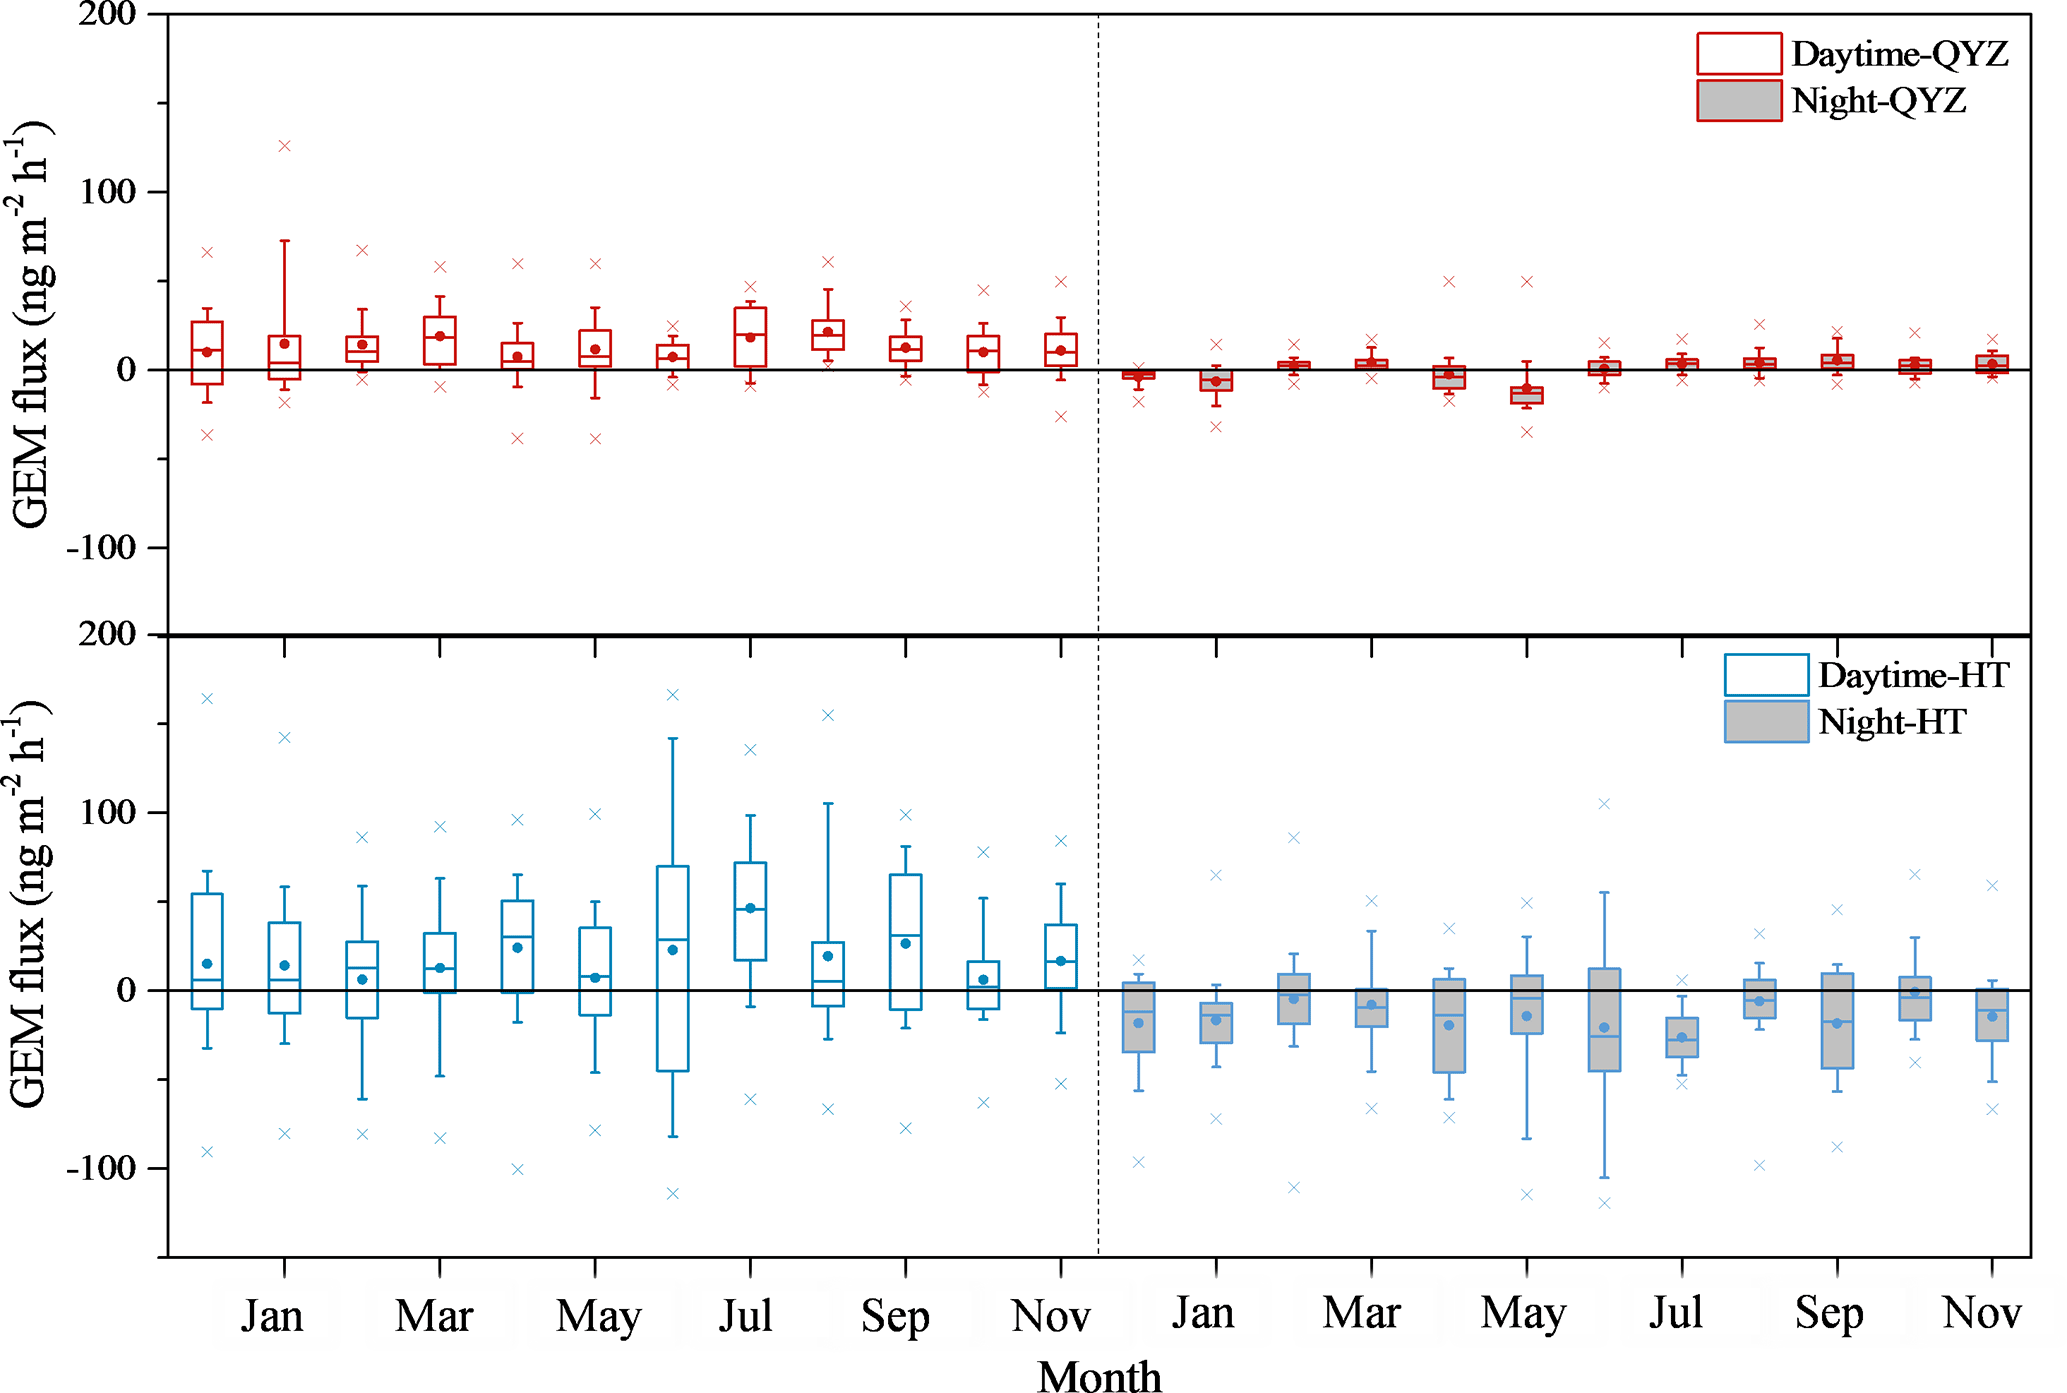
Figure 6Monthly variation in daytime GEM flux (lower panels) and night GEM flux (under panels) during the measurement periods at sites (a) QYZ and (b) HT. Box horizontal border lines represent the 25th, 50th and 75th percentiles from bottom to top, the whiskers include the 10th and 90th percentiles, and the outliers (cross) represent the minimum and maximum percentiles. The solid circle in the box represents the mean value.
3.3 Factors influencing GEM flux
In order to evaluate the influences of the environmental conditions and atmospheric GEM concentration on the GEM fluxes, the correlation analysis between the flux and each factor was calculated (Table 2). This showed that the GEM flux over forest canopy was negatively correlated with atmospheric GEM concentration at both sites except in summer at QYZ station. The inhibiting effect of atmospheric GEM concentration on GEM emission was not only reflected by the lower emission fluxes at site HT comparing with those at site QYZ (Fig. 5) but also by an instant decline in GEM flux after a sudden increase in ambient GEM concentration. For instance, continuous measurement data during five typical days in each season (Fig. 7) showed an absorption peak on 3 February and 5 May at site QYZ and 14 May and 24 August at site HT caused by an increase in air GEM concentrations. According to the wind direction records, the sudden rise of GEM concentration to 22.94 ng m−3 on 14 May and 21.21 ng m−3 on 24 August at site HT might be caused by the approach of a high-mercury-content air mass from the WS Mercury Mine led by northwest wind. Elevated ambient GEM concentration has been found to suppress GEM flux by reducing the GEM concentration gradient at the interfacial surfaces (Xin and Gustin, 2007). At locations where ambient Hg concentration is high, absorption (or deposition) is predominately observed despite the influence of meteorological factors (Wang et al., 2007; Niu et al., 2011). Although the increase in GEM concentration would inhibit mercury emissions of foliage and soil, the emission fluxes had positive correlation with atmospheric GEM concentration in summer (Fig. S4) because the large emission of GEM concentration in hot summer might result in an increase in air mercury concentration.
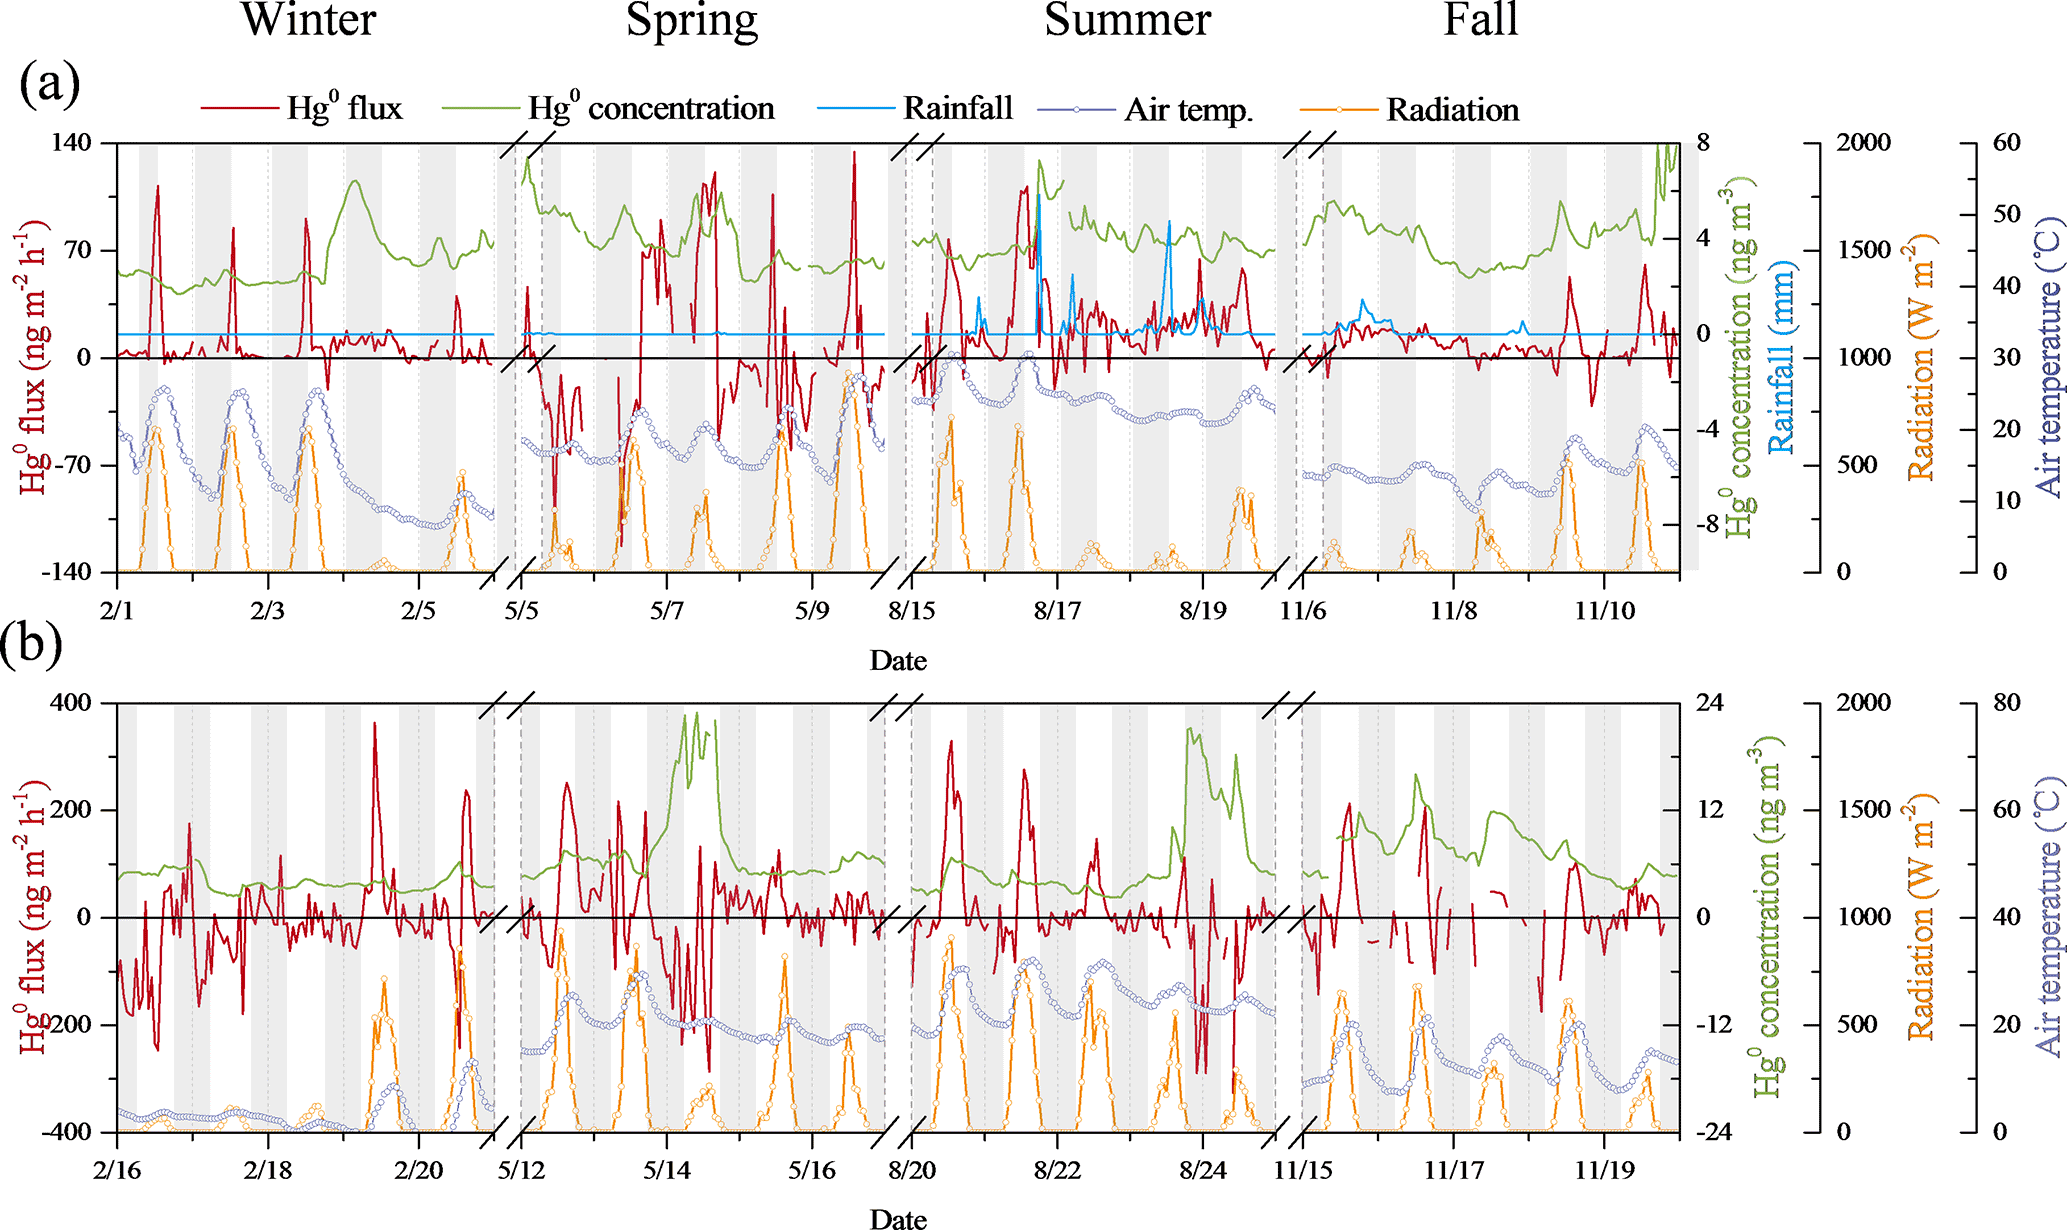
Figure 7The GEM flux, concentration and environmental conditions on some typical days in each season at sites (a) QYZ and (b) HT. Dates refer to China Standard Time (major ticks indicate midnight). All the data are indicated as 1 h average.
Table 2Pearson's correlation coefficient between GEM flux over forest canopy and atmospheric GEM concentration or each environmental factor.
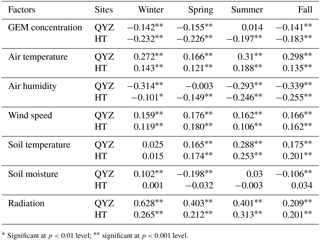
∗ Significant at p<0.01 level; significant at p<0.001 level.
The GEM flux was positively correlated with solar radiation, air temperature, and wind speed at both site QYZ and HT (Table 2). Solar radiation has been found to be highly positively correlated with soil and vegetation GEM flux (Carpi and Lindberg, 1997; Boudala et al., 2000; Zhang et al., 2001; Gustin et al., 2002; Poissant et al., 2004; Bahlmann et al., 2006), because it can enhance Hg2+ reduction and therefore facilitate GEM evasion (Gustin et al., 2002). For instance, there was a high GEM emission peak at noon in winter (Fig. 7; from 1 to 3 February at site QYZ and 19 to 20 February at site HT) even with extremely low temperature. In addition to solar radiation, air temperature had a significant effect on GEM flux, especially in summer. Continued GEM emissions occurred in the daytime without strong solar radiation, or in the evening under high temperatures in the summer (Fig. 7; 18 to 19 August at site QYZ). Recent studies have also shown that the GEM emission flux from soil would be mainly controlled by the air temperature (Moore and Carpi, 2005; Bahlmann et al., 2006). Compared with that in summer, GEM emission peak had decreased (Fig. 7; 53.0 and 60.8 on 9 and 10 November vs. 77.6 on 16 August at site QYZ; 213, 206 and 103 on 15, 16 and 18 November vs. 322 and 276 on 21 and 22 August at site HT) on a sunny day in the fall due to the decrease in temperature. In addition, as wind speed increased, the air turbulence on the surface of soil and foliage would speed up and thus enhance the desorption of GEM on the interface (Wallschlager et al., 2002; Gillis and Miller, 2000; Eckley et al., 2010; Lin et al., 2012), which may explain the positive correlation between GEM flux and wind speed. Soil temperature mainly impacted the emission of soil, as well as showing positive correlation with GEM fluxes, except for in the winter, with low soil temperature (Table 2). One possible explanation for the exception was that the change in soil temperature had no significant influence on the microbial activity and the reaction rate in soil if soil temperature was lower than a certain value (Corbett-Hains et al., 2012).
Air humidity generally was negatively correlated to the GEM flux over forest canopy (Table 2). Higher relative humidity may decrease stomatal conductance and thus lower transpiration of needles, which would result in decreases in GEM emissions (Luo et al., 2016). The correlation between GEM flux and soil moisture was uncertain at the QYZ station, e.g., positive in winter, negative in spring and fall, but not significant in summer. It seems that the influence of soil moisture on soil mercury emissions was uncertain, depending on the state soil water saturation (Fig. S5). Previous studies supported that adding water to dry soil promotes Hg reduction, because water molecules likely replace soil GEM binding sites and facilitates GEM emission. However, Hg emission is suppressed in water saturated soil because the soil pore space filled with water hampers Hg mass transfer (Gillis and Miller, 2000; Gustin and Stamenkovic, 2005; Pannu et al., 2014). For instance, intensive soil GEM emission was synchronized to the rainfall at around 21:00 on 16 August and 20:00 on 17 August at site QYZ (Fig. 7). In addition, the continuous but weaker rainfall from 6 to 7 November might also increase the GEM emission, in comparison with that in 8 November under the same solar radiation and temperature. Continuous but weaker rainfall would lead to an increase in soil moisture but would not necessarily cause soil water saturation. Soil moisture content monitoring results have shown that the soil moisture content had a certain increase but remained below 0.28 during this period, which was lower than the highest value (0.52) during the annual monitoring. However, no significant emission flux was observed on 19 August after a series of strong rainfall events. Repeated rewetting experiments showed a smaller increase in emission, implying GEM needs to be resupplied by means of reduction and dry deposition after a wetting event (Gustin and Stamenkovic, 2005; Song and Van Heyst, 2005; Eckley et al., 2011). The correlation between GEM flux and soil moisture was not significant in all of the seasons since the fluctuation of soil moisture content was small with the annual range of 0.21–0.34 at site HT, and the change in soil moisture content had far less impact on the soil GEM emissions.
The temporal variation of vegetation growth plays an important role in the forest GEM emission because of the vital function of vegetation to Hg cycle in forest ecosystem through changing environmental variables at ground surfaces (e.g., reducing solar radiation, temperature and friction velocity) (Gustin et al., 2004) and providing active surfaces for Hg uptake. Recent measurements have suggested that air–surface exchange of GEM is largely bidirectional between air and plant, and that growing plants act as a net sink (Ericksen et al., 2003; Stamenkovic et al., 2008; Hartman et al., 2009). The negative exchange GEM fluxes at night at both sites in this study should be mainly attributed to GEM adsorption by vegetation (Fig. 6). In addition, GEM absorption capacity of foliage began to weaken at the end of the growing season in November, when the absorption peaks were smaller than that in spring at both site QYZ and HT (Fig. 7). The stomata opening in the morning will also accelerate the forest absorption of Hg by vegetation, leading to the emergence of an absorption peak even in the morning (Luo et al., 2016).
3.4 Forest as source/sink of GEM
GEM flux measurements over forest canopy indicated that QYZ forest at the mildly polluted site was a net source of GEM in all seasons, with the highest and lowest GEM emissions in summer (8.09 ) and spring (5.25 , early growing season), respectively. In contrast, significant differences in GEM fluxes were observed among seasons at HT, the moderately polluted site, indicating a clear sink in winter (dormant season), a slight source in spring and fall, and a large source in summer (Table 3). As the total effect, the forest ecosystem at site HT had a net GEM emission with a magnitude of 0.30 for a whole year. These results suggest that the subtropical forests in our study region should be the substantial GEM source, and the differences among seasons emphasized the importance of capturing GEM flux seasonality when determining total Hg budgets. As mentioned before, there was almost no difference in climate conditions between sites QYZ and HT, with similar soil types and latitude, and little difference in the vegetation growth. However, the HT site, with higher atmospheric GEM concentration, had relatively lower GEM fluxes in all seasons in comparison with those at the QYZ site. This emphasized again the importance of atmospheric GEM concentration on the GEM fluxes.
Table 3Comparison of the GEM flux () from different observations.
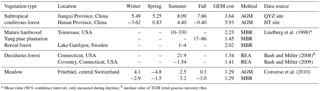
a Mean value (90 % confidence interval), only measured during daytime; b median value of TGM (total gaseous mercury) flux.
The GEM fluxes over forest canopy were the sum of emission fluxes from soil and vegetation and are extremely difficult to quantify. GEM exchange of foliage–atmosphere or soil–atmosphere is bi-directional, with net adsorption occurring at elevated air Hg concentration, while net emission occurred when typical ambient concentration was lower than the “compensation point” (Converse et al., 2010; Ericksen et al., 2003; Stamenkovic et al., 2008; Hartman et al., 2009). However, the study of foliage–atmosphere mercury exchange at QYZ indicated that the vegetation presented as a net GEM source as the total effects with a value of 1.32 (2.19, 0.32, 2.51 and −0.01 in winter, spring, summer and fall, respectively) caused by high rates of photoreduction and plant transpiration due to high temperature and radiation, relatively large leaf surface area and elevated mercury deposition, but a clear sink in the growing season with stomatal opening (Luo et al., 2016) even under the relatively lower atmospheric GEM concentration. In addition, the study of the mercury exchange between atmosphere and soil under the forest canopy at QYZ using the DFC method also showed the soil manifested as net GEM sources at all the seasons (Fig. S6, 0.13±0.43, 1.54±1.78, 4.76±1.86 and 2.07±1.73 in winter, spring, summer and fall, respectively; unpublished data). Thus, the net emissions observed at QYZ were contributed by both soil and foliar emissions. The GEM fluxes over forest canopy (8.09 ) in this study were almost similar to the sum (7.27 ) of emission fluxes from foliage and soil in summer, but had larger values in other seasons. It might be because of the underestimation of the GEM fluxes from soil due to the decreased turbulence in chamber using the DFC method, and the lack of GEM fluxes from the undergrowth vegetation. Although the foliage–atmosphere and soil–atmosphere mercury exchange at HT have not been measured individually, the comparison of Hg content of current-year foliage and soil between two sites might indicate that there were larger GEM emission fluxes from soil but much larger GEM adsorption by foliage. Until now, there are very few studies using AGM to monitor the GEM flux above forest canopy even over short periods. Previous studies have shown that the exchange fluxes of GEM vary in sign and magnitude (Table 3). Lindberg et al. (1998) measured GEM fluxes over a mature deciduous forest, a yang pine plantation, and a boreal forest floor using the MBR method and suggested that global forest is a net source of GEM with respective emissions of 10–330, 17–86 and 1–4 during the day (Table 3). The observation of Hg fluxes in a deciduous forest using an REA method showed a net GEM emission of 21.9 during summer (Bash and Miller, 2008). However, a study in Québec, Canada, showed that GEM concentrations at a maple forest site are consistently lower than those measured at an adjacent open site, indicating a Hg sink for the forest (Poissant et al., 2008). Similarly, the lower GEM concentrations observed in the leaf-growing season at forest sites across in Coventry, Connecticut, USA (Bash and Miller, 2009); Mt. Changbai, Northeast China (Fu et al., 2016); and the Atmospheric Mercury Network (AMNet) in the USA (Lan et al., 2012) also suggest forest as a net GEM sink during the growing season. Different results were obtained by AGM and MBR methods at the same time (Converse et al., 2010) (Table 3). The comparability of flux data reported in the literature is limited because of the lack of a standard method protocol for GEM flux quantification (Gustin, 2011; Zhu et al., 2015). The discrepancy in the measured GEM exchanges between forest and atmosphere is partially attributed to the uncertainties of the flux quantification method (Sommar et al., 2013), but the forest structure, climate condition, background Hg concentration, and forest soil Hg content could play crucial roles in GEM emission from forest ecosystem. Unlike deciduous forest as a sink of GEM in most previous studies, evergreen foliage with relatively higher leaf area index in all seasons in the subtropical forests in this study (in spite of the seasonal variations of vegetation growth) was demonstrated as a net GEM source to the atmosphere (Luo et al., 2016). Evergreen tree species generally have higher exchange capabilities of GEM relative to deciduous tree species and result in high rates of photoreduction and plant transpiration under high temperatures, solar radiation and soil Hg content. In addition, extremely high soil Hg content (42.6 and 167 ng g−1 at sites QYZ and HT shown in Table 1, compared to 63 ng g−1 in Québec, Canada; Poissant et al., 2008) result from long-term elevated Hg deposition; high temperature and solar radiation would also contribute the net emission flux of GEM from forest soil in subtropical south China. However, the observations in this study were not higher than the results in the forests as GEM sources in previous studies, possibly due to the higher ambient GEM concentration (3.64 and 5.93 ng m−3 at sites QYZ and HT vs. 2.23 ng m−3 in Tennessee, USA, and 1.34 in Connecticut, USA; Table 3). Although there were net GEM emissions (58.5 ) from forest in this study at site QYZ based on the measurement of the GEM fluxes over forest canopy, on account of extremely large Hg deposition (wet deposition: 14.4 ; dry deposition: 52.5 ; Luo et al., 2016), the forest was overall a Hg source.
The high-quality direct observation data of a mildly polluted and a moderately polluted site with typical climate, vegetation type and soil type in south China could have important implications for the regional Hg cycling estimation and for the awareness of the role of forests in the global mercury cycle. From continuously quantitative MM-flux measurements covering wide temporal scales at sites QYZ and HT in subtropical south China, it is inferred that forest ecosystems can represent a net GEM source, with the average magnitudes of 6.67 and 1.21 for a full year at a mildly polluted site (QYZ) and a moderately polluted site (HT), respectively. GEM flux measurements were a net source in all seasons at the mildly polluted site, with the highest in summer because of the relatively high air temperature and radiation, and the lowest in spring result from the vegetation growth. For the moderately polluted site, a net sink occurred in the winter, a significant source in summer, and no significant flux during spring and fall. The GEM emission dominated in the daytime, and peaked at around 13:00, while the forest served as a GEM sink or balance at night. It is worth noting that there was a lower emission flux of GEM at the moderately polluted site resulting from similar or even higher emission fluxes during daytime, but there were much higher adsorption fluxes at night than the mildly polluted site under the similar meteorological conditions. Because of that, the larger Hg content in soil enhances the emission of soil and vegetation during daytime, but the elevated GEM concentration suppresses the Hg emission and increases the absorption by vegetation at night at the moderately polluted site. The results indicated that the atmospheric GEM concentration plays an importance role in inhibiting the GEM fluxes between forest and air, coinciding with the negative correlation between GEM fluxes and atmospheric GEM concentration. In addition, attention should be paid to forests as a crucial increasing source with the decline in atmospheric GEM concentration because of Hg emission abatement in the future, and the increasing emission might result from the re-emission of legacy Hg stored in the forest.
The GEM flux over forest canopy was the sum emission flux of soil and vegetation, and it showed monthly variations caused by the temporal variation of vegetation growth, atmospheric GEM concentration and meteorological conditions, including air temperature, radiation and wind speed. The correlation between GEM fluxes and factors has been analyzed and combined with the characteristics of GEM exchange between soil (or foliage) and air. This indicated that GEM fluxes were positively correlated with air temperature, soil temperature, wind speed, and solar radiation, but they were negatively correlated with air humidity. The influence of soil moisture content was uncertain and depends on whether the soil water was saturated and on the initial state of the soil. In addition, vegetation growth plays an important role in the decline of forest GEM emission in spring. The difference in climate conditions and ambient GEM concentration should be considered when estimating the global forest GEM emission.
Data in this research are available in the Supplement.
The supplement related to this article is available online at: https://doi.org/10.5194/acp-18-495-2018-supplement.
The authors declare that they have no conflict of interest.
The authors are grateful for the financial support of the National
Basic Research Program of China (no. 2013CB430000) and the National
Natural Science Foundation of China (no. 21 377 064 and
no. 21221004). The authors also greatly acknowledge the support
from Qianyanzhou Forest Experimental Station and Huitong Forest
Experimental Station, and the help with system maintenance from
Yuanfen Huang and Yungui Yang.
Edited by: Ashu Dastoor
Reviewed by: two
anonymous referees
Bahlmann, E., Ebinghaus, R., and Ruck, W.: Development and application of a laboratory flux measurement system (LFMS) for the investigation of the kinetics of mercury emissions from soils, J. Environ. Manage., 81, 114–125, https://doi.org/10.1016/j.jenvman.2005.09.022, 2006.
Bash, J. O. and Miller, D. R.: A relaxed eddy accumulation system for measuring surface fluxes of total gaseous mercury, J. Atmos. Ocean. Tech., 25, 244–257, https://doi.org/10.1175/2007jtecha908.1, 2008.
Bash, J. O. and Miller, D. R.: Growing season total gaseous mercury (TGM) flux measurements over an Acer rubrum L. stand, Atmos. Environ., 43, 5953–5961, https://doi.org/10.1016/j.atmosenv.2009.08.008, 2009.
Baya, A. P. and Van Heyst, B.: Assessing the trends and effects of environmental parameters on the behaviour of mercury in the lower atmosphere over cropped land over four seasons, Atmos. Chem. Phys., 10, 8617–8628, https://doi.org/10.5194/acp-10-8617-2010, 2010.
Boudala, F. S., Folkins, I., Beauchamp, S., Tordon, R., Neima, J., and Johnson, B.: Mercury flux measurements over air and water in Kejimkujik National Park, Nova Scotia, Water Air Soil Poll., 122, 183–202, https://doi.org/10.1023/a:1005299411107, 2000.
Carpi, A. and Lindberg, S. E.: Sunlight-mediated emission of elemental mercury from soil amended with municipal sewage sludge, Environ. Sci. Technol., 31, 2085–2091, https://doi.org/10.1021/es960910+, 1997.
CAS, C., (The China Vegetation Editiorial Committee, Chinese Academy of Science): Vegetation map of the People's Republic of China (1:1 000 000), in Chinese, Geological Publishing House, Beijing, 2007.
Cobbett, F. D. and Van Heyst, B. J.: Measurements of GEM fluxes and atmospheric mercury concentrations (GEM, RGM and Hg-P) from an agricultural field amended with biosolids in Southern Ont., Canada (October 2004–November 2004), Atmos. Environ., 41, 2270–2282, https://doi.org/10.1016/j.atmosenv.2006.11.011, 2007.
Cobbett, F. D., Steffen, A., Lawson, G., and Van Heyst, B. J.: GEM fluxes and atmospheric mercury concentrations (GEM, RGM and Hg-P) in the Canadian Arctic at Alert, Nunavut, Canada (February–June 2005), Atmos. Environ., 41, 6527–6543, https://doi.org/10.1016/j.atmonsenv.2007.04.033, 2007.
Converse, A. D., Riscassi, A. L., and Scanlon, T. M.: Seasonal variability in gaseous mercury fluxes measured in a high-elevation meadow, Atmos. Environ., 44, 2176–2185, https://doi.org/10.1016/j.atmosenv.2010.03.024, 2010.
Corbett-Hains, H., Walters, N. E., and Van Heyst, B. J.: Evaluating the effects of sub-zero temperature cycling on mercury flux from soils, Atmos. Environ., 63, 102–108, https://doi.org/10.1016/j.atmosenv.2012.09.047, 2012.
Driscoll, C. T., Mason, R. P., Chan, H. M., Jacob, D., and Pirrone, N.: Mercury as a global pollutant: sources, pathways and effects, Environ. Sci. Technol., 47, 4967–4983, 2013.
Eckley, C. S., Gustin, M., Lin, C. J., Li, X., and Miller, M. B.: The influence of dynamic chamber design and operating parameters on calculated surface-to-air mercury fluxes, Atmos. Environ., 44, 194–203, https://doi.org/10.1016/j.atmosenv.2009.10.013, 2010.
Eckley, C. S., Gustin, M., Miller, M. B., and Marsik, F.: Scaling non-point-source mercury emissions from two active industrial gold mines: influential variables and annual emission estimates, Environ. Sci. Technol., 45, 392–399, https://doi.org/10.1021/es101820q, 2011.
Engle, M. A., Gustin, M. S., Lindberg, S. E., Gertler, A. W., and Ariya, P. A.: The influence of ozone on atmospheric emissions of gaseous elemental mercury and reactive gaseous mercury from substrates, Atmos. Environ., 39, 7506–7517, https://doi.org/10.1016/j.atmosenv.2005.07.069, 2005.
Ericksen, J. A., Gustin, M. S., Schorran, D. E., Johnson, D. W., Lindberg, S. E., and Coleman, J. S.: Accumulation of atmospheric mercury in forest foliage, Atmos. Environ., 37, 1613–1622, https://doi.org/10.1016/s1352-2310(03)00008-6, 2003.
Frescholtz, T. F., Gustin, M. S., Schorran, D. E., and Fernandez, G. C. J.: Assessing the source of mercury in foliar tissue of quaking aspen, Environ. Toxicol. Chem., 22, 2114–2119, https://doi.org/10.1897/1551-5028(2003)022<2114:atsomi>2.0.co;2, 2003.
Fritsche, J., Obrist, D., and Alewell, C.: Evidence of microbial control of Hg0 emissions from uncontaminated terrestrial soils, J. Plant Nutr. Soil Sc., 171, 200–209, https://doi.org/10.1002/jpln.200625211, 2008a.
Fritsche, J., Obrist, D., Zeeman, M. J., Conen, F., Eugster, W., and Alewell, C.: Elemental mercury fluxes over a sub-alpine grassland determined with two micrometeorological methods, Atmos. Environ., 42, 2922–2933, https://doi.org/10.1016/j.atmosenv.2007.12.055, 2008b.
Fritsche, J., Wohlfahrt, G., Ammann, C., Zeeman, M., Hammerle, A., Obrist, D., and Alewell, C.: Summertime elemental mercury exchange of temperate grasslands on an ecosystem-scale, Atmos. Chem. Phys., 8, 7709–7722, https://doi.org/10.5194/acp-8-7709-2008, 2008c.
Fu, X., Zhu, W., Zhang, H., Sommar, J., Yu, B., Yang, X., Wang, X., Lin, C.-J., and Feng, X.: Depletion of atmospheric gaseous elemental mercury by plant uptake at Mt. Changbai, Northeast China, Atmos. Chem. Phys., 16, 12861–12873, https://doi.org/10.5194/acp-16-12861-2016, 2016.
Gao, Y., He, N., Yu, G., Chen, W., and Wang, Q.: Long-term effects of different land use types on C, N, and P stoichiometry and storage in subtropical ecosystems: a case study in China, Ecol. Eng., 67, 171–181, 2014.
Gillis, A. A. and Miller, D. R.: Some local environmental effects on mercury emission and absorption at a soil surface, Sci. Total Environ., 260, 191–200, https://doi.org/10.1016/s0048-9697(00)00563-5, 2000.
Grigal, D. F.: Mercury sequestration in forests and peatlands: a review, J. Environ. Qual., 32, 393–405, 2003.
Gustin, M. and Jaffe, D.: Reducing the uncertainty in measurement and understanding of mercury in the atmosphere, Environ. Sci. Technol., 44, 2222–2227, https://doi.org/10.1021/es902736k, 2010.
Gustin, M. S.: Exchange of mercury between the atmosphere and terrestrial ecosystems, 423–451, 2011.
Gustin, M. S. and Stamenkovic, J.: Effect of watering and soil moisture on mercury emissions from soils, Biogeochemistry, 76, 215–232, https://doi.org/10.1007/s10533-005-4566-8, 2005.
Gustin, M. S., Biester, H., and Kim, C. S.: Investigation of the light-enhanced emission of mercury from naturally enriched substrates, Atmos. Environ., 36, 3241–3254, https://doi.org/10.1016/s1352-2310(02)00329-1, 2002.
Gustin, M. S., Ericksen, J. A., Schorran, D. E., Johnson, D. W., Lindberg, S. E., and Coleman, J. S.: Application of controlled mesocosms for understanding mercury air-soil-plant exchange, Environ. Sci. Technol., 38, 6044–6050, https://doi.org/10.1021/es0487933, 2004.
Gustin, M. S., Huang, J., Miller, M. B., Peterson, C., Jaffe, D. A., Ambrose, J., Finley, B. D., Lyman, S. N., Call, K., Talbot, R., Feddersen, D., Mao, H., and Lindberg, S. E.: Do We Understand What the Mercury Speciation Instruments Are Actually Measuring? Results of RAMIX, Environ. Sci. Technol., 47, 7295–7306, https://doi.org/10.1021/es3039104, 2013.
Han, J.-S., Seo, Y.-S., Kim, M.-K., Holsen, T. M., and Yi, S.-M.: Total atmospheric mercury deposition in forested areas in South Korea, Atmos. Chem. Phys., 16, 7653–7662, https://doi.org/10.5194/acp-16-7653-2016, 2016.
Hartman, J. S., Weisberg, P. J., Pillai, R., Ericksen, J. A., Kuiken, T., Lindberg, S. E., Zhang, H., Rytuba, J. J., and Gustin, M. S.: Application of a rule-based model to estimate mercury exchange for three background biomes in the Continental United States, Environ. Sci. Technol., 43, 4989–4994, https://doi.org/10.1021/es900075q, 2009.
Holmes, C. D., Jacob, D. J., Corbitt, E. S., Mao, J., Yang, X., Talbot, R., and Slemr, F.: Global atmospheric model for mercury including oxidation by bromine atoms, Atmos. Chem. Phys., 10, 12037–12057, https://doi.org/10.5194/acp-10-12037-2010, 2010.
Kim, K. H., Kim, M. Y., and Lee, G.: The soil-air exchange characteristics of total gaseous mercury from a large-scale municipal landfill area, Atmos. Environ., 35, 3475–3493, https://doi.org/10.1016/s1352-2310(01)00095-4, 2001.
Kim, K. H., Kim, M. Y., Kim, J., and Lee, G.: Effects of changes in environmental conditions on atmospheric mercury exchange: comparative analysis from a rice paddy field during the two spring periods of 2001 and 2002, J. Geophys. Res.-Atmos., 108, 4607–4622, https://doi.org/10.1029/2003jd003375, 2003.
Kock, H. H., Bieber, E., Ebinghaus, R., Spain, T. G., and Thees, B.: Comparison of long-term trends and seasonal variations of atmospheric mercury concentrations at the two European coastal monitoring stations Mace Head, Ireland, and Zingst, Germany, Atmos. Environ., 39, 7549–7556, https://doi.org/10.1016/j.atmosenv.2005.02.059, 2005.
Lan, X., Talbot, R., Castro, M., Perry, K., and Luke, W.: Seasonal and diurnal variations of atmospheric mercury across the US determined from AMNet monitoring data, Atmos. Chem. Phys., 12, 10569–10582, https://doi.org/10.5194/acp-12-10569-2012, 2012.
Lee, X., Benoit, G., and Hu, X. Z.: Total gaseous mercury concentration and flux over a coastal saltmarsh vegetation in Connecticut, USA, Atmos. Environ., 34, 4205–4213, https://doi.org/10.1016/s1352-2310(99)00487-2, 2000.
Lin, C.-J., Zhu, W., Li, X., Feng, X., Sommar, J., and Shang, L.: Novel dynamic flux chamber for measuring air–surface exchange of Hg0 from soils, Environ. Sci. Technol., 46, 8910–8920, https://doi.org/10.1021/es3012386, 2012.
Lindberg, S., Bullock, R., Ebinghaus, R., Engstrom, D., Feng, X., Fitzgerald, W., Pirrone, N., Prestbo, E., and Seigneur, C.: A synthesis of progress and uncertainties in attributing the sources of mercury in deposition, Ambio, 36, 19–32, 2007.
Lindberg, S. E., Hanson, P. J., Meyers, T. P., and Kim, K. H.: Air/surface exchange of mercury vapor over forests – the need for a reassessment of continental biogenic emissions, Atmos. Environ., 32, 895–908, https://doi.org/10.1016/s1352-2310(97)00173-8, 1998.
Lindqvist, O., Johansson, K., Aastrup, M., Andersson, A., Bringmark, L., Hovsenius, G., Håkanson, L., Iverfeldt, Å., Meili, M., and Timm, B.: Mercury in the Swedish environment – Recent research on causes, consequences and corrective methods, Water Air Soil Poll., 55, 1–261, 1991.
Luo, Y., Duan, L., Driscoll, C. T., Xu, G., Shao, M., Taylor, M., Wang, S., and Hao, J.: Foliage/atmosphere exchange of mercury in a subtropical coniferous forest in south China, J. Geophys. Res.-Biogeo., 121, 2006–2016, https://doi.org/10.1002/2016jg003388, 2016.
Ma, M., Wang, D., Du, H., Sun, T., Zhao, Z., Wang, Y., and Wei, S.: Mercury dynamics and mass balance in a subtropical forest, southwestern China, Atmos. Chem. Phys., 16, 4529–4537, https://doi.org/10.5194/acp-16-4529-2016, 2016.
Mauclair, C., Layshock, J., and Carpi, A.: Quantifying the effect of humic matter on the emission of mercury from artificial soil surfaces, Appl. Geochem., 23, 594–601, https://doi.org/10.1016/j.apgeochem.2007.12.017, 2008.
Millhollen, A. G., Gustin, M. S., and Obrist, D.: Foliar mercury accumulation and exchange for three tree species, Environ. Sci. Technol., 40, 6001–6006, https://doi.org/10.1021/es0609194, 2006a.
Millhollen, A. G., Obrist, D., and Gustin, M. S.: Mercury accumulation in grass and forb species as a function of atmospheric carbon dioxide concentrations and mercury exposures in air and soil, Chemosphere, 65, 889–897, https://doi.org/10.1016/j.chemosphere.2006.03.008, 2006b.
Moore, C. and Carpi, A.: Mechanisms of the emission of mercury from soil: role of UV radiation, J. Geophys. Res.-Atmos., 110, 9–9, https://doi.org/10.1029/2004jd005567, 2005.
Niu, Z., Zhang, X., Wang, Z., and Ci, Z.: Field controlled experiments of mercury accumulation in crops from air and soil, Environ. Pollut., 159, 2684–2689, https://doi.org/10.1016/j.envpol.2011.05.029, 2011.
Obrist, D.: Atmospheric mercury pollution due to losses of terrestrial carbon pools?, Biogeochemistry, 85, 119–123, https://doi.org/10.1007/s10533-007-9108-0, 2007.
Pannu, R., Siciliano, S. D., and O'Driscoll, N. J.: Quantifying the effects of soil temperature, moisture and sterilization on elemental mercury formation in boreal soils, Environ. Pollut., 193, 138–146, https://doi.org/10.1016/j.envpol.2014.06.023, 2014.
Pirrone, N., Cinnirella, S., Feng, X., Finkelman, R. B., Friedli, H. R., Leaner, J., Mason, R., Mukherjee, A. B., Stracher, G. B., Streets, D. G., and Telmer, K.: Global mercury emissions to the atmosphere from anthropogenic and natural sources, Atmos. Chem. Phys., 10, 5951–5964, https://doi.org/10.5194/acp-10-5951-2010, 2010.
Poissant, L., Pilote, M., Constant, P., Beauvais, C., Zhang, H. H., and Xu, X. H.: Mercury gas exchanges over selected bare soil and flooded sites in the bay St. Francois wetlands (Quebec, Canada), Atmos. Environ., 38, 4205–4214, https://doi.org/10.1016/j.atmosenv.2004.03.068, 2004.
Poissant, L., Pilote, M., Yumvihoze, E., and Lean, D.: Mercury concentrations and foliage/atmosphere fluxes in a maple forest ecosystem in Quebec, Canada, J. Geophys. Res.-Atmos., 113, 10307–10319, https://doi.org/10.1029/2007jd009510, 2008.
Rinklebe, J., During, A., Overesch, M., Du Laing, G., Wennrich, R., Staerk, H.-J., and Mothes, S.: Dynamics of mercury fluxes and their controlling factors in large Hg-polluted floodplain areas, Environ. Pollut., 158, 308–318, https://doi.org/10.1016/j.envpol.2009.07.001, 2010.
Schroeder, W. H., Anlauf, K. G., Barrie, L. A., Lu, J. Y., Steffen, A., Schneeberger, D. R., and Berg, T.: Arctic springtime depletion of mercury, Nature, 394, 331–332, https://doi.org/10.1038/28530, 1998.
Sigler, J. M., Mao, H., and Talbot, R.: Gaseous elemental and reactive mercury in Southern New Hampshire, Atmos. Chem. Phys., 9, 1929–1942, https://doi.org/10.5194/acp-9-1929-2009, 2009.
Sommar, J., Zhu, W., Lin, C.-J., and Feng, X.: Field Approaches to measure Hg exchange between natural surfaces and the atmosphere a review, Critical Reviews in Environmental Science and Technology, 43, 1657–1739, https://doi.org/10.1080/10643389.2012.671733, 2013.
Song, S., Selin, N. E., Soerensen, A. L., Angot, H., Artz, R., Brooks, S., Brunke, E.-G., Conley, G., Dommergue, A., Ebinghaus, R., Holsen, T. M., Jaffe, D. A., Kang, S., Kelley, P., Luke, W. T., Magand, O., Marumoto, K., Pfaffhuber, K. A., Ren, X., Sheu, G.-R., Slemr, F., Warneke, T., Weigelt, A., Weiss-Penzias, P., Wip, D. C., and Zhang, Q.: Top-down constraints on atmospheric mercury emissions and implications for global biogeochemical cycling, Atmos. Chem. Phys., 15, 7103–7125, https://doi.org/10.5194/acp-15-7103-2015, 2015.
Song, X. X. and Van Heyst, B.: Volatilization of mercury from soils in response to simulated precipitation, Atmos. Environ., 39, 7494–7505, https://doi.org/10.1016/j.atmosenv.2005.07.064, 2005.
Stamenkovic, J. and Gustin, M. S.: Nonstomatal vs. stomatal uptake of atmospheric mercury, Environ. Sci. Technol., 43, 1367–1372, https://doi.org/10.1021/es801583a, 2009.
Stamenkovic, J., Gustin, M. S., Arnone III, J. A., Johnson, D. W., Larsen, J. D., and Verburg, P. S. J.: Atmospheric mercury exchange with a tallgrass prairie ecosystem housed in mesocosms, Sci. Total Environ., 406, 227–238, https://doi.org/10.1016/j.scitotenv.2008.07.047, 2008.
Steffen, A., Schroeder, W., Macdonald, R., Poissant, L., and Konoplev, A.: Mercury in the Arctic atmosphere: an analysis of eight years of measurements of GEM at Alert (Canada) and a comparison with observations at Amderma (Russia) and Kuujjuarapik (Canada), Sci. Total Environ., 342, 185–198, https://doi.org/10.1016/j.scitotenv.2004.12.048, 2005.
St Louis, V. L., Rudd, J. W. M., Kelly, C. A., Hall, B. D., Rolfhus, K. R., Scott, K. J., Lindberg, S. E., and Dong, W.: Importance of the forest canopy to fluxes of methyl mercury and total mercury to boreal ecosystems, Environ. Sci. Technol., 35, 3089–3098, https://doi.org/10.1021/es001924p, 2001.
Streets, D. G., Zhang, Q., and Wu, Y.: Projections of Global Mercury Emissions in 2050, Environ. Sci. Technol., 43, 2983–2988, https://doi.org/10.1021/es802474j, 2009.
Streets, D. G., Devane, M. K., Lu, Z., Bond, T. C., Sunderland, E. M., and Jacob, D. J.: All-Time releases of mercury to the atmosphere from human activities, Environ. Sci. Technol., 45, 10485–10491, https://doi.org/10.1021/es202765m, 2011.
Tian, S. L., Pan, Y. P., and Wang, Y. S.: Size-resolved source apportionment of particulate matter in urban Beijing during haze and non-haze episodes, Atmos. Chem. Phys., 16, 1–19, https://doi.org/10.5194/acp-16-1-2016, 2016.
UNEP Minamata Convention on Mercury: http://www.mercuryconvention.org, last access: 25 March 2017, 2013.
Wallschlager, D., Kock, H. H., Schroeder, W. H., Lindberg, S. E., Ebinghaus, R., and Wilken, R. D.: Estimating gaseous mercury emissions from contaminated floodplain soils to the atmosphere with simple field measurement techniques, Water Air Soil Poll., 135, 39–54, https://doi.org/10.1023/a:1014711831589, 2002.
Wang, L., Wang, S., Zhang, L., Wang, Y., Zhang, Y., Nielsen, C., McElroy, M. B., and Hao, J.: Source apportionment of atmospheric mercury pollution in China using the GEOS-Chem model, Environ. Pollut., 190, 166–175, https://doi.org/10.1016/j.envpol.2014.03.011, 2014a.
Wang, Q., Wang, S., and Zhang, J.: Assessing the effects of vegetation types on carbon storage fifteen years after reforestation on a Chinese fir site, Forest Ecol. Manag., 258, 1437–1441, https://doi.org/10.1016/j.foreco.2009.06.050, 2009.
Wang, S., Feng, X., Qiu, G., Fu, X., and Wei, Z.: Characteristics of mercury exchange flux between soil and air in the heavily air-polluted area, eastern Guizhou, China, Atmos. Environ., 41, 5584–5594, https://doi.org/10.1016/j.atmosenv.2007.03.002, 2007.
Wang, X., Lin, C.-J., and Feng, X.: Sensitivity analysis of an updated bidirectional air–surface exchange model for elemental mercury vapor, Atmos. Chem. Phys., 14, 6273–6287, https://doi.org/10.5194/acp-14-6273-2014, 2014b.
Wang, X., Lin, C.-J., Yuan, W., Sommar, J., Zhu, W., and Feng, X.: Emission-dominated gas exchange of elemental mercury vapor over natural surfaces in China, Atmos. Chem. Phys., 16, 11125–11143, https://doi.org/10.5194/acp-16-11125-2016, 2016.
Wu, Q., Wang, S., Li, G., Liang, S., Lin, C.-J., Wang, Y., Cai, S., Liu, K., and Hao, J.: Temporal trend and spatial distribution of speciated atmospheric mercury emissions in China during 1978–2014, Environ. Sci. Technol., 50, 13428–13435, https://doi.org/10.1021/acs.est.6b04308, 2016.
Xin, M. and Gustin, M. S.: Gaseous elemental mercury exchange with low mercury containing soils: investigation of controlling factors, Appl. Geochem., 22, 1451–1466, https://doi.org/10.1016/j.apgeochem.2007.02.006, 2007.
Yu, G. and Sun, X.: The Principle and Method of Terrestrial Ecosystems Flux Observations, Higher Education Press, Beijing, 2006 (in Chinese).
Zhang, H., Lindberg, S. E., Marsik, F. J., and Keeler, G. J.: Mercury air/surface exchange kinetics of background soils of the Tahquamenon River watershed in the Michigan Upper Peninsula, Water Air Soil Poll., 126, 151–169, https://doi.org/10.1023/a:1005227802306, 2001.
Zhang, H., Lindberg, S. E., and Kuiken, T.: Mysterious diel cycles of mercury emission from soils held in the dark at constant temperature, Atmos. Environ., 42, 5424–5433, https://doi.org/10.1016/j.atmosenv.2008.02.037, 2008.
Zhang, L., Wang, S., Wang, L., Wu, Y., Duan, L., Wu, Q., Wang, F., Yang, M., Yang, H., Hao, J., and Liu, X.: Updated emission inventories for speciated atmospheric mercury from anthropogenic sources in China, Environ. Sci. Technol., 49, 3185–3194, https://doi.org/10.1021/es504840m, 2015.
Zhang, Y., Jacob, D. J., Horowitz, H. M., Chen, L., Amos, H. M., Krabbenhoft, D. P., Slemr, F., St Louis, V. L., and Sunderland, E. M.: Observed decrease in atmospheric mercury explained by global decline in anthropogenic emissions, P. Natl. Acad. Sci. USA, 113, 526–531, https://doi.org/10.1073/pnas.1516312113, 2016.
Zhao, X., Guan, D., Wu, J., Jin, C., and Han, S.: Distribution of footprint and flux source area of the mixed forest of broad-leaved and Korean pine in Changbai Mountain, Journal of Beijing Forestry University, 27, 17–22, 2005.
Zhu, W., Sommar, J., Lin, C.-J., and Feng, X.: Mercury vapor air–surface exchange measured by collocated micrometeorological and enclosure methods – Part I: Data comparability and method characteristics, Atmos. Chem. Phys., 15, 685–702, https://doi.org/10.5194/acp-15-685-2015, 2015.
Zhu, W., Lin, C.-J., Wang, X., Sommar, J., Fu, X., and Feng, X.: Global observations and modeling of atmosphere–surface exchange of elemental mercury: a critical review, Atmos. Chem. Phys., 16, 4451–4480, https://doi.org/10.5194/acp-16-4451-2016, 2016.