the Creative Commons Attribution 3.0 License.
the Creative Commons Attribution 3.0 License.
Mixing layer height on the North China Plain and meteorological evidence of serious air pollution in southern Hebei
Xiaowan Zhu
Jianping Guo
Tao Song
Lili Wang
Jinyuan Xin
Wenkang Gao
Christoph Münkel
Klaus Schäfer
Xin Li
Yuesi Wang
To investigate the spatiotemporal variability of the mixing layer height (MLH) on the North China Plain (NCP), multi-site and long-term observations of the MLH with ceilometers at three inland stations (Beijing, BJ; Shijiazhuang, SJZ; Tianjin, TJ) and one coastal site (Qinhuangdao) were conducted from 16 October 2013 to 15 July 2015. The MLH of the inland stations in the NCP were highest in summer and lowest in winter, while the MLH on the coastal area of Bohai was lowest in summer and highest in spring. As a typical site in southern Hebei, the annual mean of the MLH at SJZ was 464 ± 183 m, which was 15.0 and 21.9 % lower than that at the BJ (594 ± 183 m) and TJ (546 ± 197 m) stations, respectively. Investigation of the shear term and buoyancy term in the NCP revealed that these two parameters in southern Hebei were 2.8 times lower and 1.5 times higher than that in northern NCP within 0–1200 m in winter, respectively, leading to a 1.9-fold higher frequency of the gradient Richardson number > 1 in southern Hebei compared to the northern NCP. Furthermore, combined with aerosol optical depth and PM2.5 observations, we found that the pollutant column concentration contrast (1.2 times) between these two areas was far less than the near-ground PM2.5 concentration contrast (1.5 times). Through analysis of the ventilation coefficient in the NCP, the near-ground heavy pollution in southern Hebei mainly resulted from the lower MLH and wind speed. Therefore, due to the importance of unfavorable weather conditions, heavily polluting enterprises should be relocated and strong emission reduction measures should be introduced to improve the air quality in southern Hebei.
- Article
(2467 KB) - Full-text XML
-
Supplement
(871 KB) - BibTeX
- EndNote


The convective boundary layer is the region where turbulence is fully developed. The height of the interface where turbulence is discontinuous is usually referred to as the mixing layer height (MLH; Stull, 1988). The mixing layer is regarded as the link between the near-surface and free atmosphere, and the MLH is one of the major factors affecting the atmospheric dissipation capacity, which determines both the volume into which ground-emitted pollutants can disperse, as well as the convective timescales within the mixing layer (Seidel et al., 2010). In addition, continuous MLH observations will be of great importance for the improvement of boundary layer parameterization schemes and for the promotion of meteorological model accuracy.
Conventionally, the MLH is usually estimated from radiosonde profiles (Seidel et al., 2010). Although meteorological radiosonde observations can provide high-quality data, they are not suitable for continuous fine-resolution MLH retrievals due to their high cost and limited observation intervals (Seibert et al., 2000). As the most advanced method of MLH detection, remote sensing techniques based on the profile measurements from ground-based instruments such as sodar, radar, or lidar that have unique vertically resolved observational capabilities are becoming increasingly popular (Beyrich, 1997; Chen et al., 2001; He and Mao, 2005). Because sound waves can be easily attenuated in the atmosphere, the vertical range of sodar is generally limited to within 1000 m. However, the optical remote sensing techniques can provide higher height ranges (at least several kilometers). The single-lens ceilometers developed by Vaisala have been widely used in a variety of MLH studies (Emeis et al., 2004, 2009, 2011; Münkel and Räsänen, 2004; Münkel et al., 2007; Eresmaa et al., 2006; Wagner et al., 2006; Wagner and Schäfer, 2015; Muñoz and Undurraga, 2010; Schween et al., 2014; Sokół et al., 2014; Tang et al., 2015, 2016; Geiß et al., 2017). Compared with other remote sensing instruments, this type of lidar has special features favorable for long-term and multi-station observations (Emeis et al., 2009; Wiegner et al., 2014; Tang et al., 2016), including the low-power system, the eye-safe operation within a near-infrared laser band and the low cost and ease of maintenance during all weather conditions (excluding rainy, very windy or sandstorm weather conditions) with only regular window cleaning required (Emeis et al., 2004; Tang et al., 2016).
The North China Plain (NCP) region is the political, economic and cultural center of China. With the rapid economic development, energy use has increased substantially, resulting in frequent air pollution episodes (Guo et al., 2011; Li et al., 2013; Y. S. Wang et al., 2013; Wang et al., 2014; Zhang et al., 2014; Liu et al., 2016; Xu et al., 2016; Tang et al., 2017b). The haze pollution has had an adverse impact on human health (Tang et al., 2017a) and has aroused a great deal of concern (Tang et al., 2009; Ji et al., 2012; H. Zhang et al., 2015). To achieve the integrated development of the Jing–Jin–Ji region, readjustment of the regional industrial structure and layout is imperative. To this end, the industrial capacity of heavily polluting enterprises in the areas with unfavorable weather conditions should be reduced, and these heavily polluting enterprises should be removed to improve the air quality. For the remaining enterprises, the industrial air pollutant emissions structure should be changed, and strong emission reduction measures must be implemented. Although the government has carried out some strategies for joint prevention and control, with the less well-understood distributions of regional weather condition on the NCP, how and where to adjust the industrial structures on the NCP are questions in pressing need of answers. As one of the key factors influencing the regional heavy haze pollution (Tang et al., 2012, 2016, 2017b; Quan et al., 2013; Hu et al., 2014; W. Zhang et al., 2016; Zhu et al., 2016), the MLH to some extent represents the atmospheric environmental capacity, and the regional distribution and variation of MLH on the NCP can offer a scientific basis for regional industrial distribution readjustment, which will be of great importance for regional haze management.
Nevertheless, due to the scarcity of MLH observations on the NCP, reliable and explicit characteristics of MLH on the NCP remain unknown. Tang et al. (2016) utilized the long-term observation data of MLH from ceilometers to analyze the characteristics of MLH variations in Beijing (BJ) and verified the reliability of ceilometers. The results demonstrated that MLH in BJ was high in spring and summer and low in autumn and winter with two transition months in February and September. A multi-station analysis of MLH on the NCP region was conducted in February 2014, and the characteristics of high MLH at coastal stations and low MLH at southwest piedmont stations were reported (Li et al., 2015). Miao et al. (2015) modeled the seasonal variations of MLH on the NCP and discovered that the MLH was high in spring due to the strong mechanical forcing and low in winter as a result of the strong thermodynamic stability in the near-surface layer. The mountain–plain breeze and the sea breeze circulations played an important role in the mixing layer process when the background synoptic patterns were weak in summer and autumn (Tang et al., 2016; Wei et al., 2017).
To overcome previous studies' deficiencies, our study first conducted a 22-month (from 16 October 2013 to 15 July 2015) observation of MLH with ceilometers on the NCP. The observation stations included three inland stations (BJ; Shijiazhuang, SJZ; Tianjin, TJ) and one coastal site (Qinhuangdao, QHD). First, we will describe the spatial and temporal distribution of MLH on the NCP. Subsequently, reasons for spatial difference of MLH on the NCP will be explained in the discussion section. Finally, the meteorological evidence of serious air pollution in southern Hebei will be studied.
2.1 Sites
To study the MLH characteristics on the NCP, observations with ceilometers were conducted at the BJ, SJZ, TJ and QHD stations from 16 October 2013 to 15 July 2015 (Fig. 1 and Supplement Table S1). The SJZ, TJ and QHD sites were set around Beijing in the southwest, southeast and east directions, respectively. The BJ station was at the base of the Taihang and Yan mountains on the northern NCP. The MLH observation site was built in the courtyard of the Institute of Atmospheric Physics, Chinese Academy of Sciences (116.32∘ E, 39.90∘ N). SJZ was near the Taihang Mountain in southern Hebei; the location was in the Hebei University of Economics (114.26∘ E, 38.03∘ N). The TJ site was set in the courtyard of the Tianjin Meteorological Bureau, which was located south of the urban area, with a geographic location of 117.20∘ E, 39.13∘ N. The QHD station was an eastern coastal site of Bohai Bay, which was set up in the Environmental Management College of China (119.57∘ E, 39.95∘ N), and the surrounding areas are mostly residential buildings with no high structures. Since the TJ site was approximately 50 km away from the coast and the QHD station was only 2 km, the TJ station, by contrast, was supposed to be an inland station.
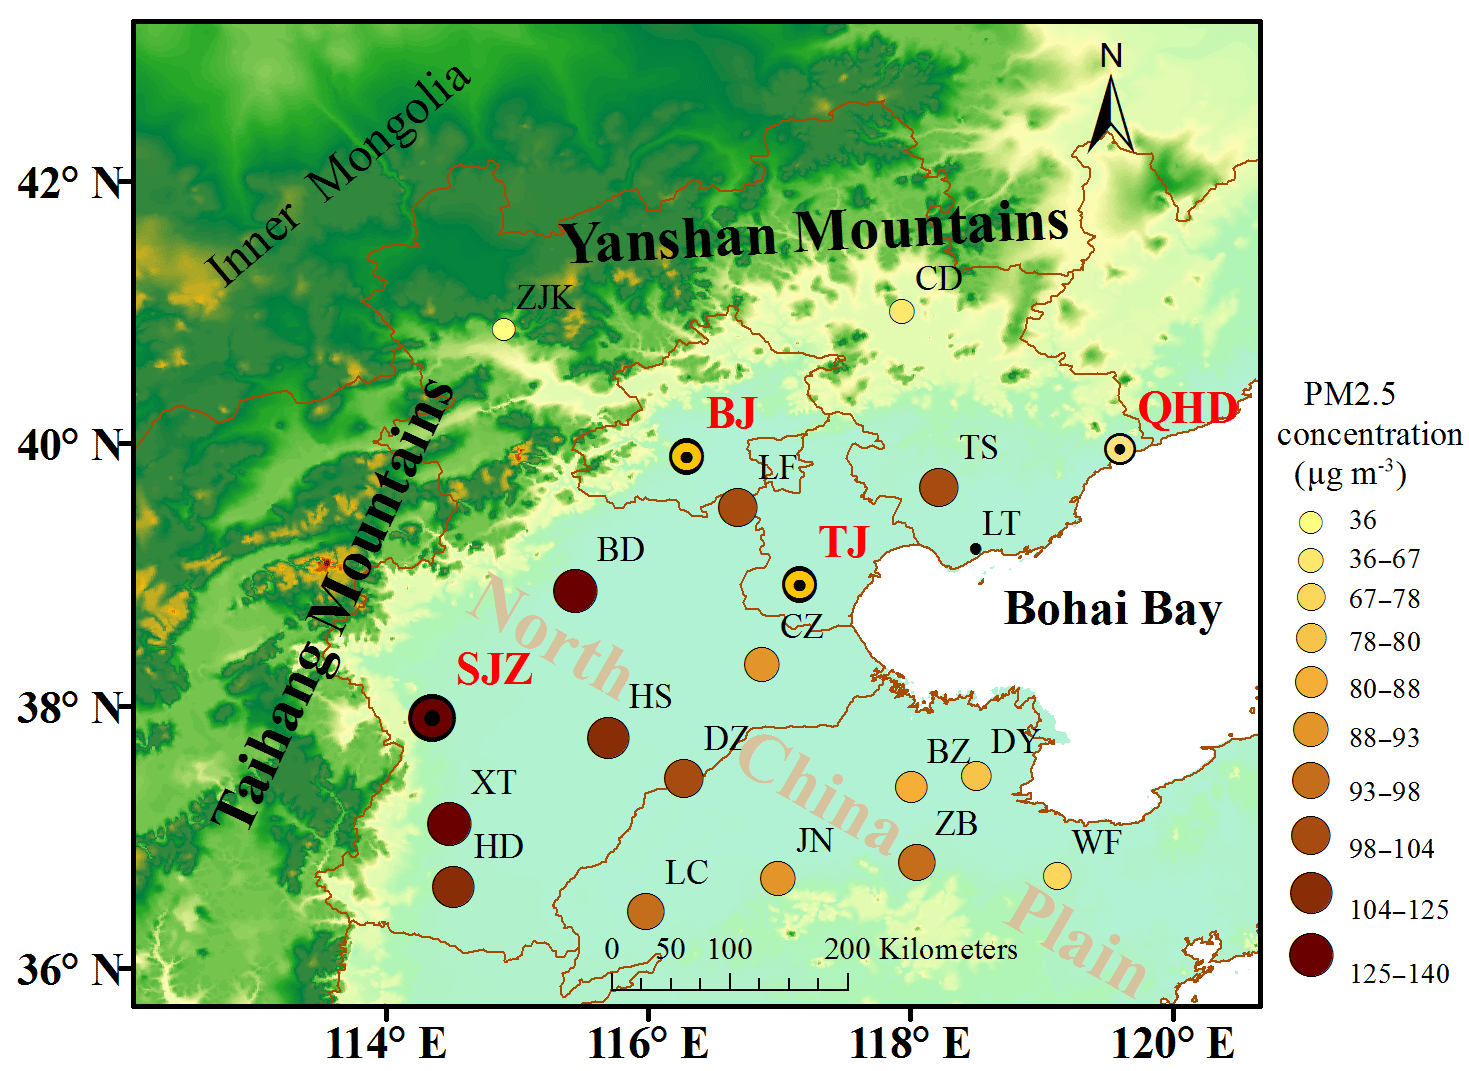
Figure 1Locations of the ceilometers observation sites (BJ, SJZ, TJ and QHD) are marked with red and bold abbreviations; other PM2.5 observation sites (ZJK, CD, LF, TS, CZ, BD, HS, XT, HD, DZ, LC, JN, BZ, DY, ZB and WF) and the sounding observation sites (BJ, LT and XT) are marked on the map with black abbreviations. The size and color of the circular mark are representative of the annual mean near-ground PM2.5 concentration; the larger and darker the circle is, the greater the concentration is.
2.2 Measurement of MLH
The instrument used to measure the MLH at the four stations was an enhanced single-lens ceilometer (Vaisala, Finland), which utilized the strobe laser lidar (laser detection and range measurement) technique (910 nm) to measure the attenuated backscattering coefficient profiles. As large differences existed in the aerosol concentrations between the mixing layer and the free atmosphere, the MLH can be determined from the vertical attenuated backscattering coefficient (β) gradient, whereby a strong, sudden change in the negative gradient (−dβ∕dx) can indicate the MLH. In the present study, the Vaisala software product BL-VIEW was utilized to calculate the MLH by determining the location of the maximum in the attenuated backscattering coefficient. To strengthen the echo signals and reduce the detection noise, spatial and temporal averaging should be conducted before the gradient method is used to calculate the MLH. The BL-VIEW software was utilized with temporal smoothing of 1200 s and vertical distance smoothing of 240 m. The instrument installed at the BJ station was a CL31 ceilometer and the CL51 ceilometers were used at the SJZ, TJ and QHD stations. Some of the properties of these two instruments are listed in Table 1, and basic technical descriptions can be found in Münkel et al. (2007) and Tang et al. (2015).
To ensure the consistency of the MLH measurements with the two different ceilometer versions, before we set up the ceilometer observation network in the NCP, we made a comparison of the MLHs observed by CL31 and CL51 at BJ from 1 to 8 October 2013 (Fig. S1 in the Supplement). The MLH observed by CL31 was highly relevant to those observed by the CL51 ceilometers, with correlation coefficients (R) of 0.86–0.92. Therefore, the impact of version discrepancy on the MLH measurement can be neglected.
Since the ceilometers can reflect rainy conditions and the precipitation will influence the MLH retrieval, the precipitation data were excluded. In addition, a previous study has compared MLH measurements retrieved from ceilometers and sounding data (Tang et al., 2016). The results revealed that the ceilometers underestimate the MLH under neutral conditions caused by strong winds and overestimate the MLH when sandstorms occur. Therefore, data points for these three special weather conditions were eliminated manually. The criterion to exclude these data points is as follows: (a) precipitation, i.e., a cloud base lower than 4000 m and the attenuated backscattering coefficient of at least 2 × 10⁻⁶ m−1 sr−1 within 0 m and the cloud base, (b) sandstorm, i.e., the ratio of PM2.5 to PM10 suddenly decreased to 30 % or lower and the PM10 concentration was higher than 500 µg m−3, and (c) strong winds, i.e., a sudden change in temperature and wind speed (WS) when cold fronts passed by (Muñoz and Undurraga, 2010; Van der Kamp and McKendry, 2010; Tang et al., 2016).
2.3 Other data
The hourly data of near-ground relative humidity (RH) and temperature (T) in the NCP region were obtained from the China Meteorological Administration (http://www.weather.com.cn/weather/101010100.shtml/, last access: January 2015). To study the reason for the MLH difference between the northern NCP and southern Hebei, meteorological sounding data were included in this paper. The data were provided by the upgraded radiosonde network of China, where the GTS1 digital electronic radiosonde was required to be operationally launched twice per day at 08:00 and 20:00 LT by the China Meteorological Administration (Guo et al., 2016). Considering the deficiency of sounding data at the SJZ and QHD stations, data from the Xingtai (XT) and Laoting (LT) stations were used instead after a consistency test with the reanalysis data (Fig. S2). The reanalysis data at these four sites were downloaded from the website of European Centre for Medium-Range Weather Forecasts (http://apps.ecmwf.int/datasets/data/interim-full-mnth/levtype=pl/, last access: May 2017).
The near-ground PM2.5 and PM10 concentrations at the 20 observation sites from December 2013 to November 2014 were provided by the Ministry of Environmental Protection with a time resolution of 1 h (http://www.zhb.gov.cn/). Details for the near-ground PM2.5 and PM10 observation sites are shown in Table S1 and Fig. 1.
The aerosol optical depth (AOD) data within the NCP region were retrieved with the dark target algorithm from the Moderate Resolution Imaging Spectroradiometer aerosol products on board the National Aeronautics and Space Administration Earth Observing System Terra satellite from December 2013 to November 2014 (Q. Zhang et al., 2016; https://ladsweb.modaps.eosdis.nasa.gov/, last access: June 2017), and then the AOD data were interpolated to 0.1∘ × 0.1∘ to produce the regional distribution in the NCP.
2.4 Atmospheric stability criterion
The gradient Richardson number (Ri) is usually used to estimate the atmospheric turbulent stability within the mixing layer and is defined as follows (Eq. 1):
where Δz is the height increment over which a specific calculation of Ri is being made, g is the acceleration of gravity, is the mean virtual potential temperature within that height increment and and are the mean wind speeds in zonal and meridional directions within the height increment.

Figure 2Frequency distribution of the daily maximum MLH at the (a) BJ, (b) SJZ, (c) TJ and (d) QHD stations from December 2013 to November 2014.
Using Ri to diagnose turbulence is a classical approach and has been covered in many textbooks on boundary layer turbulence (Stull, 1988; Garratt, 1994). It can be interpreted as the ratio of the buoyancy term ( to the shear term ( in the turbulent kinetic equation. When the Ri > 1, the turbulence was suppressed and the mixing layer development will be restrained (Stull, 1988). In our study, the frequency of Ri > 1 was used to represent the atmospheric stability in the NCP. The larger the frequency is, the more stable turbulent stratification is.
3.1 Frequency distribution of MLH
Since October 2013, continuous operation of the ceilometers observation network in the NCP has provided 22 months of MLH data. For the purpose of analyzing the MLH temporal and spatial variation, the hourly averages of MLH for a whole year (from December 2013 to November 2014) at the BJ, SJZ, TJ and QHD stations were chosen in the following sections. Hourly means of MLH under rainy, sandstorm and windy conditions were removed, resulting in data availability of 81, 89, 83 and 77 % at the BJ, SJZ, TJ and QHD stations, respectively. In this study, March, April and May are defined as spring; June, July and August are defined as summer; September, October and November are defined as autumn; and December, January and February are defined as winter.
To study the regional distribution characteristic of MLH on the NCP, we analyzed the frequency of the daily maximum MLH distribution in Fig. 2. The daily maximum MLH at the BJ, SJZ and TJ stations could reach 2400 m. The large daily maximum values mostly existed in spring and summer, while the low values always appeared in autumn and winter and were as low as 200 m. The daily maximum MLH values at the BJ, SJZ and TJ stations were mainly distributed between 600 and 1800, 400 and 1600, and 800 and 1800 m, accounting for 74.2, 72.0 and 67.0 % of the total samples, respectively. Notably, the daily maximum MLH in SJZ was lower than at the MLHs at the BJ and TJ stations in spring, autumn and winter. Values below 600 m at the SJZ station occurred primarily in autumn and winter. The most frequent daily maximum MLH existed in the range of 1000–1200 m, which was 200–600 m lower than that at the TJ station. This demonstrated a weaker atmospheric diffusion capacity at the SJZ station in spring, autumn and winter than the northern NCP stations.
The frequency distribution of the daily maximum MLH at the coastal site showed different features. The daily maximum MLH in QHD was mainly distributed between 800 and 1800 m with a relatively small seasonal fluctuation (Fig. 2d). Values lower than 600 m were mainly distributed in summer, which was probably influenced by the frequent occurrence of a thermal internal boundary layer (TIBL) in summer. Reasons for this are illustrated in Sect. 4.1.
3.2 Spatiotemporal variation of MLH
3.2.1 Seasonal variation
Monthly variations of MLH at the BJ, SJZ, TJ and QHD stations are shown in Fig. 3. The monthly means of the regional MLH ranged between 300 and 750 m. The maximum and minimum MLH existed in June 2014 at the BJ station and in January 2014 at the SJZ station, with values of 741 and 308 m, respectively. Most of the monthly averages were between 400 and 700 m, which accounted for 81.3 % of the total samples.
The MLH at the BJ, SJZ and TJ stations showed obvious seasonal variations with high values in spring and summer and low values in autumn and winter. Seasonal means of MLH at the three stations followed the same order: summer > spring > autumn > winter, with maximum values of 722 ± 169, 623 ± 161 and 655 ± 165 m in summer, respectively, and minimum values of 493 ± 131, 347 ± 153 and 436 ± 178 m in winter, respectively (Table S2). Obvious annual changes of the MLH with large values in spring and summer and low values in autumn and winter at the BJ, SJZ and TJ stations implied that MLH is influenced by seasonal changes of solar radiation (Stull, 1988).
Nevertheless, the seasonal variation of MLH at the coastal site of Bohai was different from that at the inland stations. The MLH in QHD exhibited a decreasing trend from spring to summer and an increasing trend from autumn to winter, with the maximum seasonal mean of 498 ± 217 m in spring and the minimum seasonal mean of 447 ± 153 m in summer. Moreover, the MLH in spring and summer at QHD was much lower than those at other stations. Similar to our analysis of frequency distributions of daily maximum MLH in Sect. 3.1, the lower MLH at QHD in spring and summer mainly resulted from the frequent occurrence of the TIBL. A detailed explanation of the TIBL impact was included in Sect. 4.1. The effect of TIBL on the coastal boundary layer was consistent with previous studies (Jing et al., 2012; Zhang et al., 2013), which demonstrated that ceilometers can properly retrieve the coastal MLH as well.
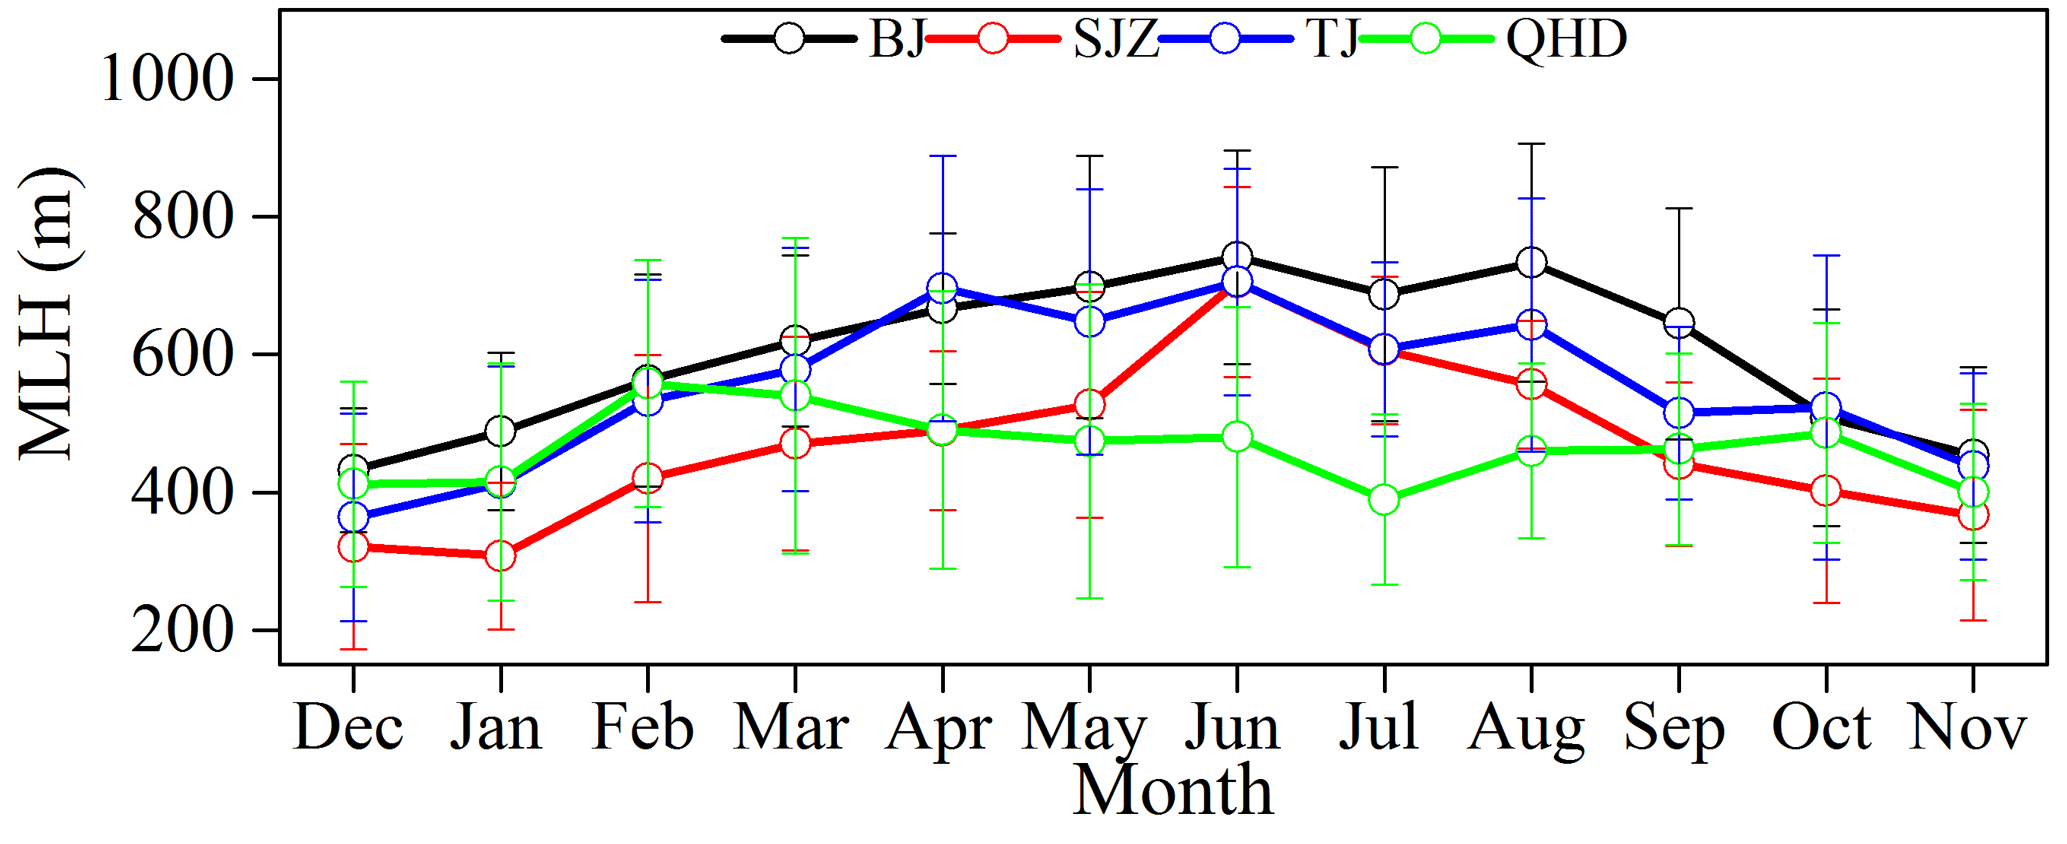
Figure 3Monthly variations of MLH at the BJ, SJZ, TJ and QHD stations from December 2013 to November 2014.
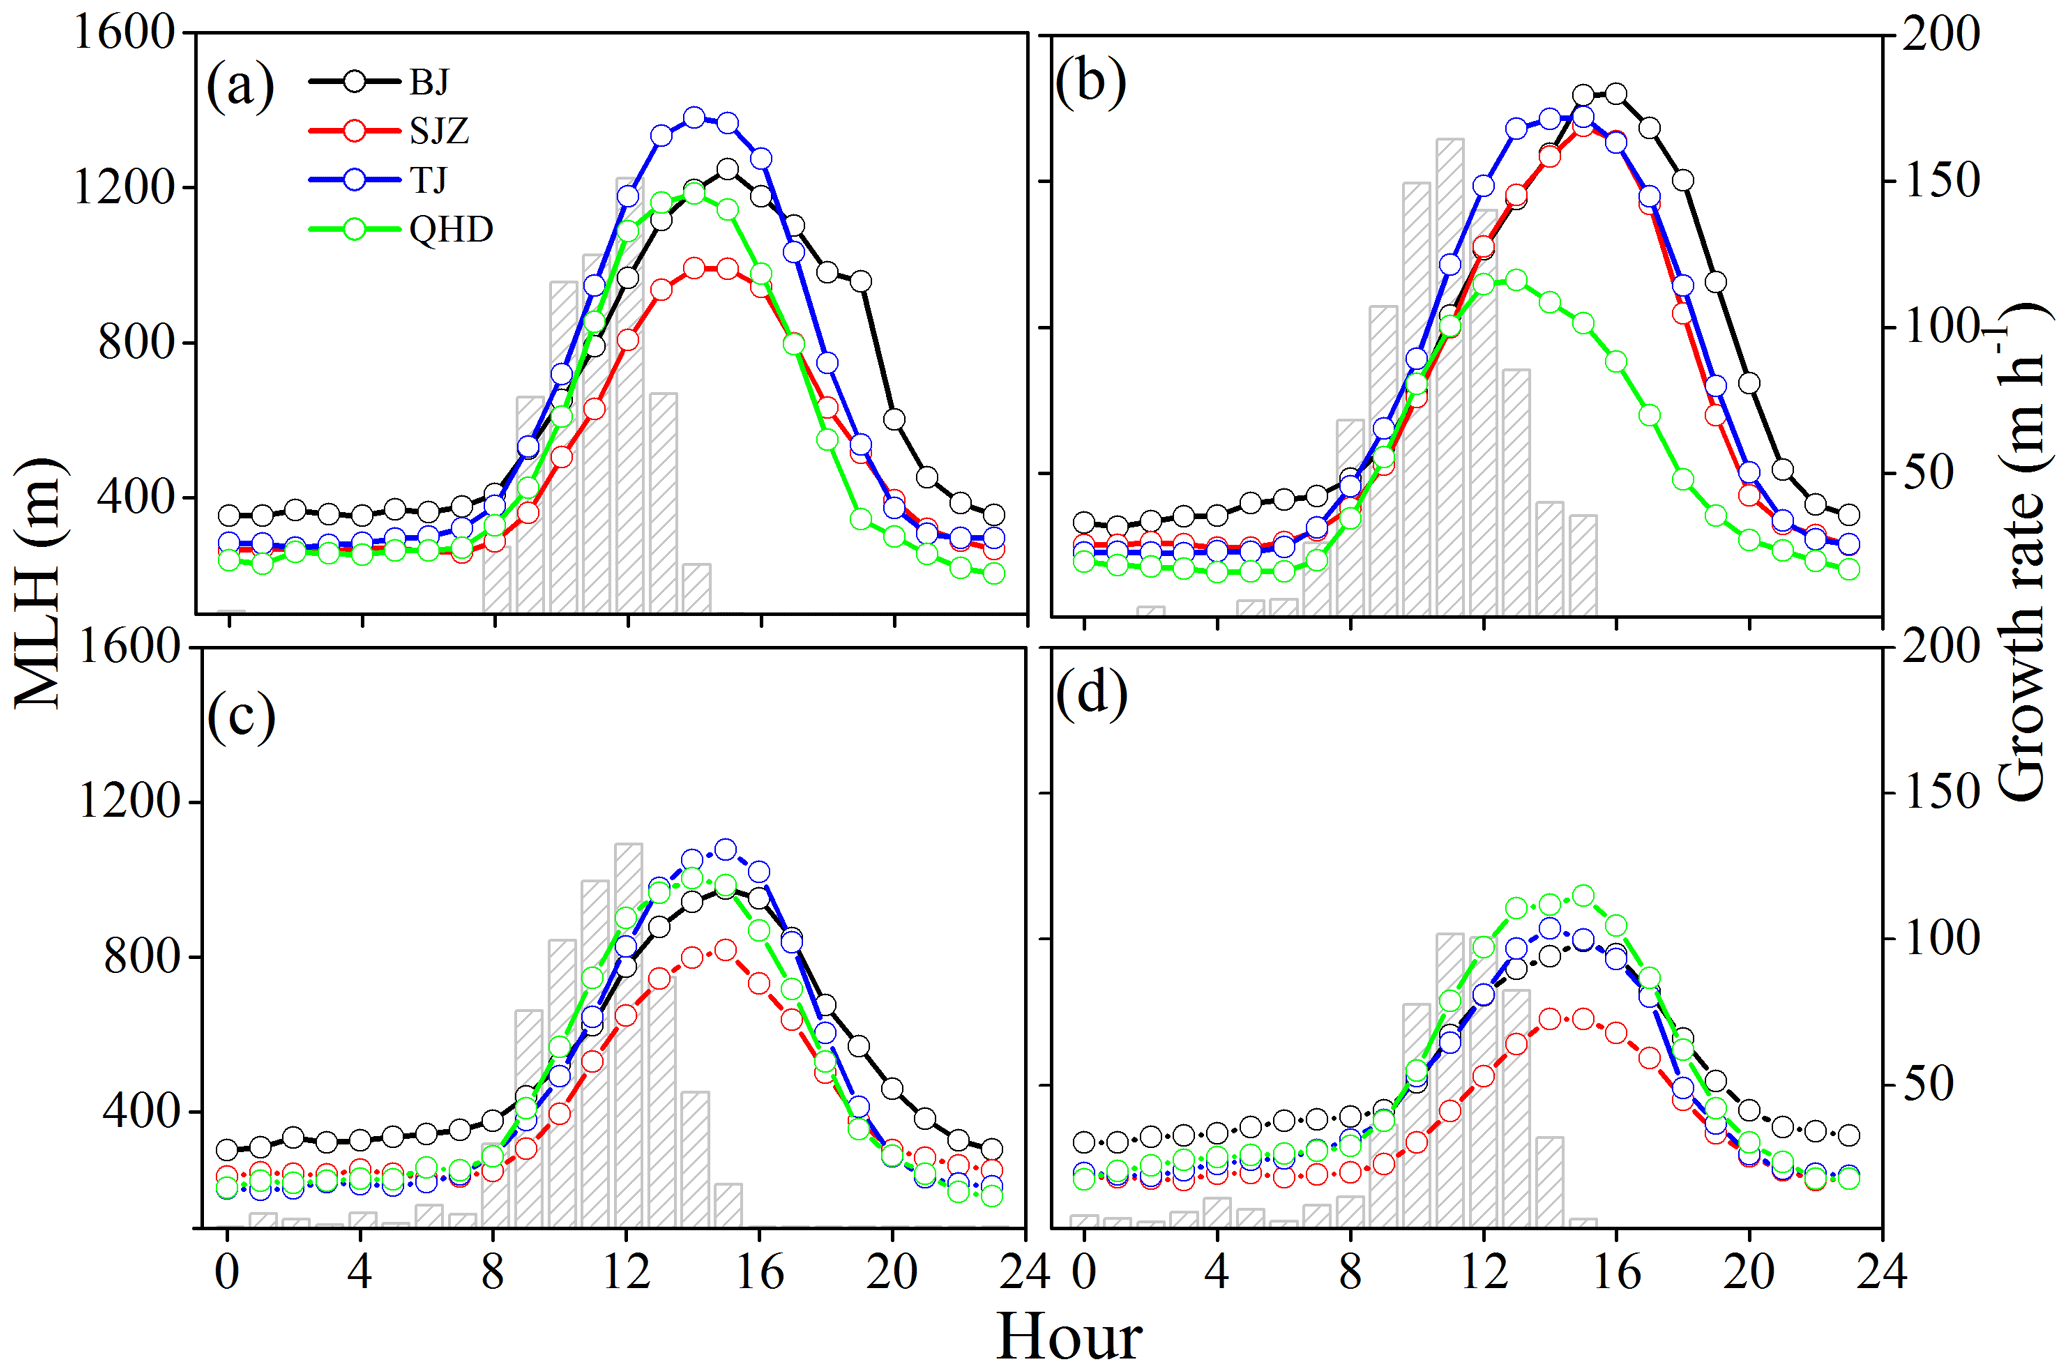
Figure 4Diurnal variations of MLH at the BJ, SJZ, TJ and QHD stations in (a) spring, (b) summer, (c) autumn and (d) winter seasons are indicated by lines and scatters. The growth rates averaged over the four sites are drawn with gray columns for each season to represent the MLH growth velocity, and only positive values are shown in the figure.
3.2.2 Diurnal variations
Seasonal variations of diurnal MLH change patterns were investigated to reveal the 24 h evolution characteristics of the MLH on the NCP. As shown in Fig. 4, diurnal variations of MLH in different seasons all had single peak patterns. With sunrise and increased solar radiation, MLH at the four stations started to develop and peaked in the early afternoon. After sunset, turbulence in the MLH decayed quickly, and the mixing layer underwent a transition to the nocturnal stable layer (less than 400 m). The annual averaged diurnal ranges of MLH at the BJ, SJZ, TJ and QHD stations were 782, 699, 914 and 790 m, respectively. The annual averaged diurnal range of MLH in SJZ was approximately 100–200 m smaller than those at the other stations, which was associated with its shallow daytime MLHs in spring, autumn and winter (Fig. 4a, c and d). This indicated that SJZ has the worst pollutant diffusivity.
Growth rates averaged over the four stations during each season were plotted with gray columns in Fig. 4. It was obvious that the growth rates of the MLH varied by season. The MLH developed the earliest in summer (at approximately 07:00 LT) and reached the highest growth rates (164.5 m h−1) at approximately 11:00 LT, and the time when MLH started to develop was found to be 1 h later (at approximately 08:00 LT) in spring and autumn than in summer. Furthermore, the MLH developed the latest (at approximately 09:00 LT) and slowest in winter, with the maximum growth rate (101.8 m h−1) occurring at approximately 11:00 LT.
Annual averages of MLH at the BJ, SJZ, TJ and QHD stations were also calculated, and the values were 594 ± 183, 464 ± 183, 546 ± 197 and 465 ± 175 m, respectively. The MLH at SJZ was approximately 21.9, 15.0 and 0.2 % lower than at the BJ, TJ and QHD stations, respectively. Therefore, according to the analysis above in Sect. 3.1 and 3.2, an obvious phenomenon can be observed in the MLH distribution on the NCP: the MLH in southern Hebei was lower than in the northern NCP in spring, autumn and winter but was almost equal to the northern areas in summer.
Through preliminary study of the spatiotemporal variation of MLH on the NCP region, we found something interesting: (a) the MLH at the coastal site was lower than the inland sites in summer; (b) the MLH in southern Hebei was lower than the northern NCP in spring, autumn and winter, but was almost consistent between these two areas in summer. Reasons for these two phenomena will be illustrated in the following Section (4.1 and 4.2). Finally, we will investigate the meteorological evidence for serious haze pollution in southern Hebei in Sect. 4.3.

Figure 5Monthly diurnal wind vectors at the BJ, SJZ, TJ and QHD stations from December 2013 to November 2014.
4.1 The TIBL impact in coastal site
From the studies in Sect. 3.1 and 3.2, we found that the maximum MLH at the QHD station was larger and arrived earlier than the BJ, SJZ and TJ stations in summer (Fig. 4b). However, this characteristic was not evident in other seasons (Fig. 4a, c and d). The sea–land breeze was a local circulation that occurs when there is no large-scale synoptic system passes. In our study, we first excluded days with large-scale synoptic systems. Then, according to the coastline orientation, if the southeast wind at the TJ station and south and southwest winds at the QHD station occurred at approximately 11:00 LT, and the northwest wind started to blow at approximately 20:00 LT, and then this type of circulation was supposed to be a sea–land circulation. The prevailing southeast wind at the TJ station and the south and southwest wind at the QHD station were regarded as sea breezes (Fig. 5).
The sea breeze usually brings a cold and stable air mass from the sea to the coastal region. When the top of the local mixing layer was higher than the top of the air mass, a TIBL will develop within the mixing layer under the influence of the abrupt change of aerodynamic roughness and temperature between the land and sea surfaces. Then, the local mixing layer will be replaced by the TIBL. In the presence of warm air on land, the cold sea air advects downwind and is warmed, leading to a weak temperature difference between the air and the ground. As a consequence, the TIBL warms less rapidly due to the decreased heat flux at the ground, and the rise rate is reduced. In addition, since the TIBL deepens with distance downwind and usually cannot extend all the way to the top of the intruding marine air, the remaining cool marine air above the TIBL will hinder vertical development of the TIBL (Stull, 1988; Puygrenier et al., 2005; Sicard et al., 2006; Tomasi et al., 2011). With distance inland, the top of the intruding marine air will enhance and exceed the local MLH; if so, the TIBL will not form, and the TIBL impact will be impaired with distance inland (Stull, 1988). Accompanied by the weak synoptic system and the frequent occurrence of sea breezes in summer, the TIBL formed easily and the MLH peak time and value at the QHD station were earlier and lower than other stations (Figs. 3 and 4). For the TJ station, with a distance of approximately 50 km out to sea, the TIBL will not extend so far. Therefore, although the TJ station can be affected by the sea breeze, the local MLH cannot be influenced by the TIBL.
4.2 Reasons for low MLH in southern Hebei
Turbulent stability was mainly responsible for the MLH development, and the generation of turbulent energy was highly correlated with the heat flux (mainly sensible heat fluxes) produced by radiation and the momentum flux caused by wind shear (Stull, 1988). As presented in Sect. 2.4, the Ri could describe the turbulent stability not only from the perspective of thermal forces, but also from the perspective of mechanical forces; it was calculated in this section with meteorological sounding profiles to study the reason for MLH differences between southern Hebei and the northern NCP, and the frequency values of Ri > 1 were given in this study. With larger frequency comes more stable stratification. Considering the geographic locations (Fig. 1), sounding data from the XT station were used due to the lack of sounding data at the SJZ station; meanwhile, sounding data from the LT station were used instead of the data from QHD. Each of the four parameter profiles (WS, shear term, buoyancy term and the frequency of Ri > 1) at the BJ, XT and LT stations are depicted in Fig. 6. The profiles were averaged over 08:00 and 20:00 LT and vertically smoothed using a 100 m running average to reduce unexpected fluctuations for viewing purposes only.

Figure 6Vertical profiles of (a, e) horizontal WS, (b, f) shear term, (c, g) buoyancy term and (d, h) frequency of Ri > 1 at the BJ, XT and LT stations in summer (a–d) and winter (e–h).
Using the winter and summer as examples, when we analyzed the seasonal means of shear term and the buoyancy term between the XT and the BJ stations, some distinct features were observed. As shown in Fig. 6f and g, the shear term and the buoyancy term in XT were 2.8 times lower and 1.5 times higher than that in BJ within 0–1200 m in winter, respectively. The largest discrepancies of the wind shear term and buoyancy term between southern Hebei and the northern NCP reached 2.84 × 10⁻⁵ s−2 at the altitude of 800 m and 3.93 × 10⁻⁴ s−2 at 200 m, respectively. As a result, the frequency of Ri > 1 in XT was approximately 1.9 times larger than that in BJ within 0–1200 m, leading to a much more stable stratification in southern Hebei (Fig. 6h). The shear term, buoyancy term and the frequency of Ri > 1 in spring and autumn displayed similar characteristics to those in winter, and the averaged frequency of Ri > 1 in southern Hebei was approximately 1.5 and 1.3 times larger than those in northern NCP in spring and autumn, respectively (Fig. S3). In summer, the shear term, buoyancy term and the frequency of Ri > 1 were almost the same between southern Hebei and the northern NCP (Fig. 6b–d).
As a result, the lower MLH in southern Hebei was due to a more stable atmospheric turbulent structure than the northern NCP in spring, autumn and winter. This probably resulted from the frequent effect of cold air on the northern NCP, and such cold air was usually too weak to reach southern Hebei (Su et al., 2004). Then the cold front resulting from the cold air system will enhance the wind shear over the northern NCP. In addition, a previous study has revealed that the warm advection from the Loess Plateau usually developed from southwest to northeast, and the higher buoyancy term (Fig. 6g) and lower MLH in southern Hebei will be partially related to the enhanced thermal inversion at the altitude of 1500 m (Hu et al., 2014; Zhu et al., 2016). In summer, due to the northward lift and westward intrusion of the subtropical high on the NCP, the diminishing existence of the weak cold air on the northern NCP accompanied with the regional-scale strong solar radiation and strong turbulent activities will lead to a small turbulent stability contrast between southern Hebei and the northern NCP.
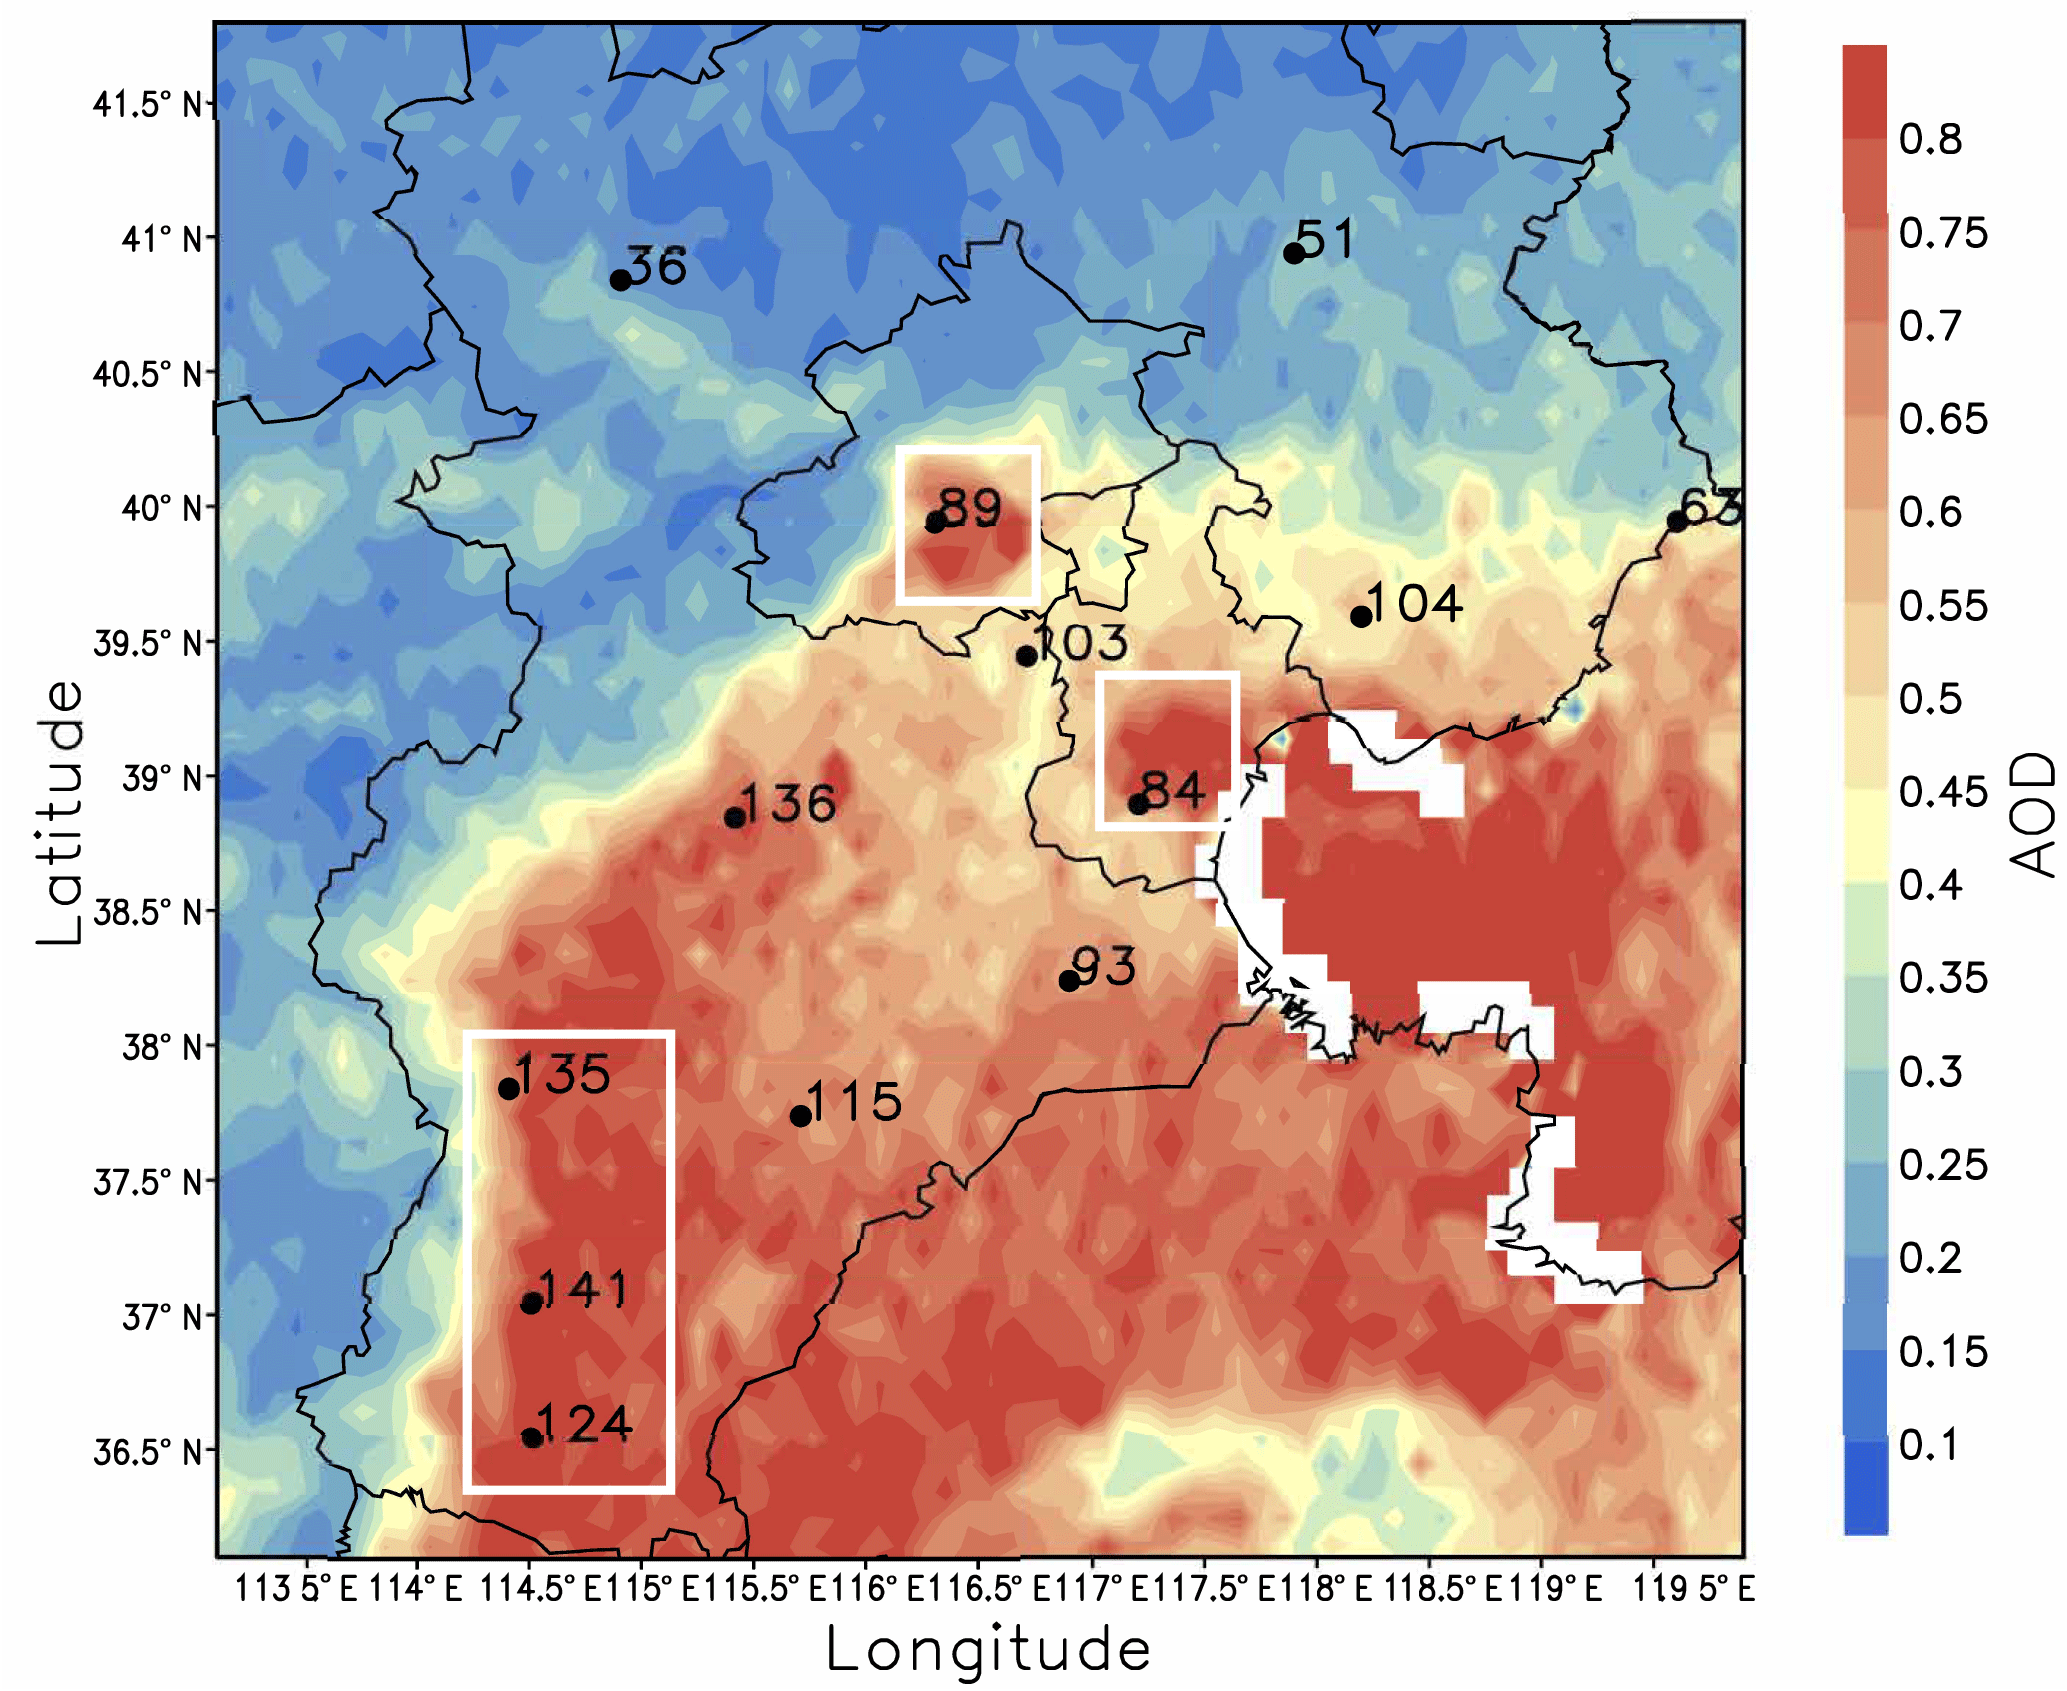
Figure 7Distribution of the annual mean values of AOD from December 2013 to November 2014 in the NCP. The PM2.5 concentrations of the 13 observation sites were also marked beside each station. The major sites in the northern NCP (BJ and TJ) and southern Hebei (SJZ, XT and HD) are enclosed by white rectangles.
In addition, other researchers proposed that absorbing aerosols above the MLH is another factor affecting the MLH (Y. Wang et al., 2013; Li et al., 2016; Peng et al., 2016). Absorbing aerosols give rise to increasing temperature aloft but decreasing temperature at the surface, which enhances the strength of capping inversion and inhibits convection. In contrast, absorbing aerosols within the mixing layer could reduce the capping inversion intensity despite the reduction in the surface buoyancy flux and raise the MLH (Yu et al., 2002). Considering the higher concentrations of surface PM2.5 in southern Hebei, absorbing aerosols could have some impacts on MLH development. However, the comprehensive influences from the feedback of absorbing aerosols above and below the MLH are hard to explain without sufficient knowledge of vertical variations in absorbing aerosols at the four stations. Additionally, the mixed state and morphology of absorbing aerosols dominate the absorption effects (Jacobson, 2001; Bond et al., 2013). Therefore, without sufficient observation data, it is difficult to discuss the possible influences of air pollution feedback on MLH development in this study. Elaborate experiments of vertical profiles and the morphology of absorbing aerosols are needed in future studies.
4.3 Meteorological evidence of serious air pollution in southern Hebei
When we analyzed the near-ground PM2.5 and PM10 concentration distributions on the NCP from December 2013 to November 2014, a unique phenomenon was found and is shown in Figs. 1 and S4. The annual means of near-ground PM2.5 concentration in southern Hebei (SJZ, XT and HD) were 133.3 µg m−3 (225.3 µg m−3 for the PM10 concentrations), while in the northern areas (BJ and TJ), it was 86.5 µg m−3 (126.0 µg m−3 for the PM10 concentrations), and the difference in the near-ground PM2.5 concentration between the two areas was as high as 1.5 fold (1.8 fold for the PM10 concentrations). Since AOD represents the aerosol column concentration, it is a much better indicator for the emissions difference than the PM2.5. Additionally, the averaged annual AOD in southern Hebei was only 1.2 times that of the northern NCP (Fig. 7). If the difference in AOD represents the emission discrepancy, the remaining differences of PM2.5 may be induced by the meteorology. In other words, meteorological conditions may play an important role in heavier haze formation in southern Hebei and the contrasting meteorological conditions between these two areas may have contributed at most 60 % (considering the aerosol–radiation interactions) to the PM2.5 concentration discrepancy.
Previous studies revealed that the most significant meteorological factors for regional heavy haze formation in the NCP were RH and MLH (Tang et al., 2016; Zhu et al., 2016). In addition, the T influences the particles' physicochemical reaction rate and the ventilation coefficients (Vc) can be used as an index to evaluate the total diffusibility of the atmosphere; thus, the RH, T and Vc were compared and analyzed among the four stations (BJ, SJZ, TJ and QHD) in the next section. The regional particle growth and the atmospheric dissipation will be discussed separately, each from a meteorological point of view.
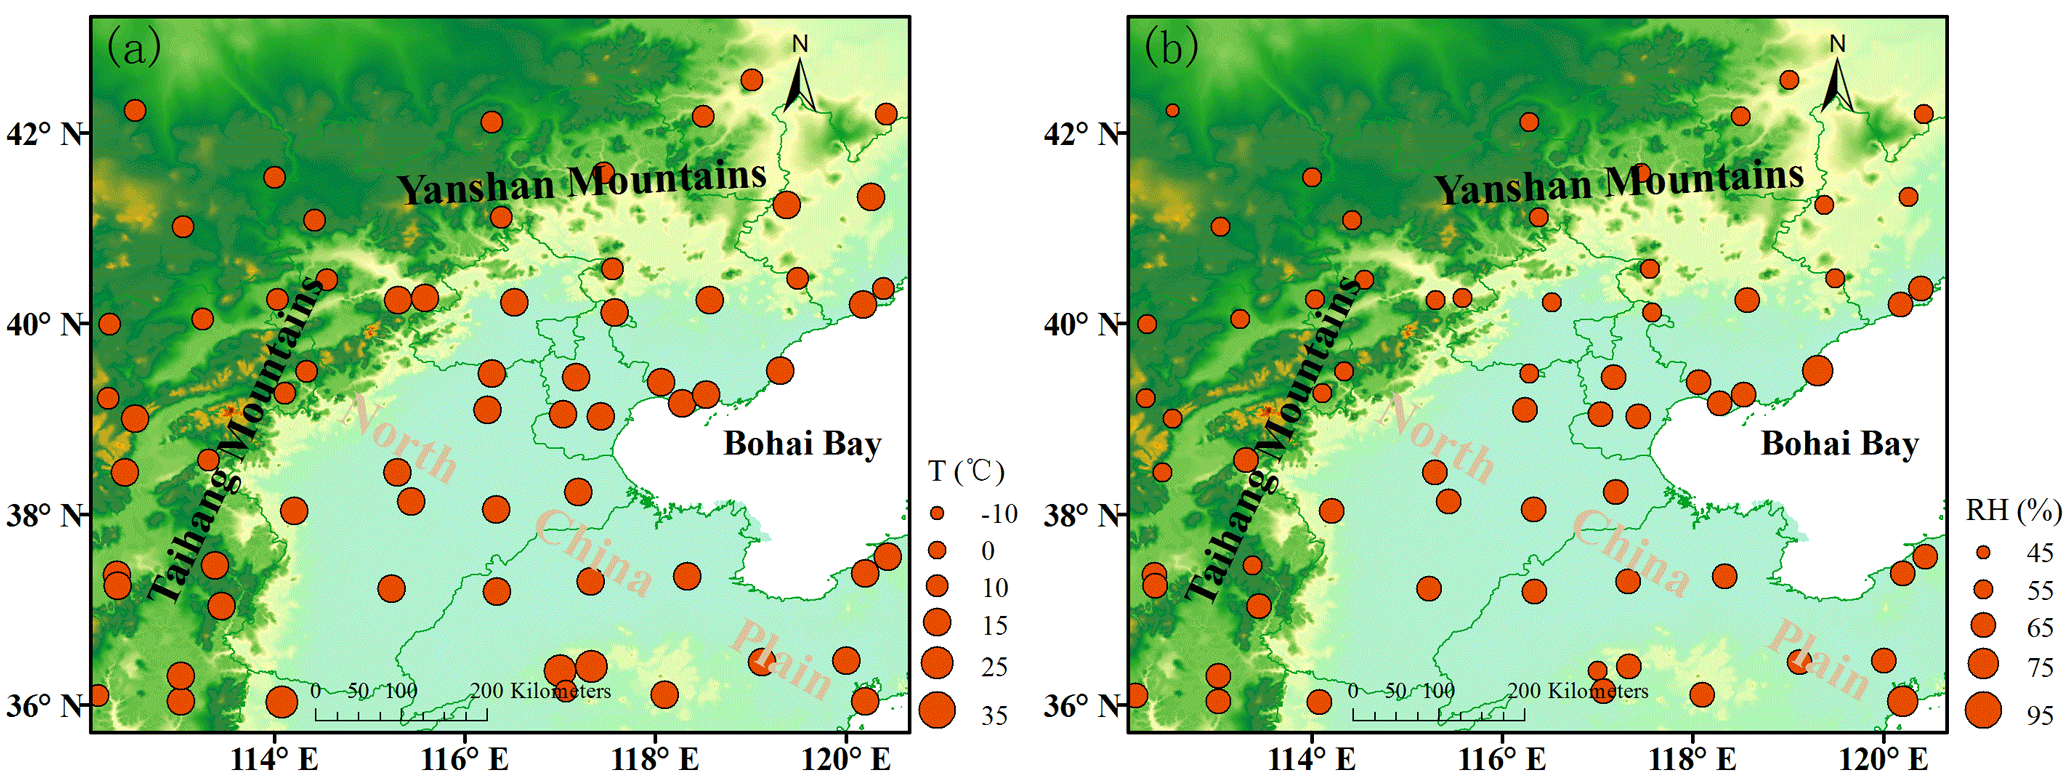
Figure 8Distribution of annual means of (a) T and (b) RH in the NCP region from December 2013 to November 2014.
4.3.1 Meteorological factors for particle growth
Distributions of annual means of T and RH are shown in Fig. 8, and the distributions of seasonal means of T and RH were added in Figs. S5 and S6. The T value in southern Hebei was similar to that on the northern NCP but was higher than that at the coastal site (Figs. 8a and S5). This indicated an almost consistent temperature condition for an atmospheric physicochemical reaction (Garratt et al., 1994; Zhang, 2010). However, differences existed in RH between southern Hebei and the northern NCP. The RH at the SJZ station was always higher than that at the BJ and TJ stations but was slightly lower than that at the coastal sites (Figs. 8b and S6). The annual averages of RH at the BJ, SJZ, TJ and QHD sites were 51.2, 65.7, 57.0 and 68.6 %, respectively, and the RH at SJZ was 22.1 and 13.2 % higher than that at the BJ and TJ sites, respectively (Table S3). Since RH is a key factor for haze development, higher RH is beneficial to fine particle growth through hygroscopic growth processes and heterogeneous reactions (Seinfeld and Pandis, 1998; Hu et al., 2006; Liu et al., 2011; Zhao et al., 2013; Fu et al., 2014; R. Y. Zhang et al., 2015; Wang et al., 2016). Thus, a higher RH provided a favorable meteorological condition for haze development, which could be partially responsible for heavier pollution in southern Hebei.
4.3.2 Meteorological factors for particle dissipation
As MLH and WS can represent the atmospheric dissipation potential in the vertical and horizontal directions, respectively, in addition to the MLH, we analyzed the WS variations on the NCP. Similar to our analysis in Sect. 4.2, as SJZ and QHD had no sounding data and due to the close geographic proximity among SJZ and XT as well as LT and QHD, sounding data from the XT and LT stations were used instead of the data at SJZ and QHD, respectively. The WS profiles were averaged every 100 m at each station and are depicted in Figs. 6 and S3. Except for summer, the WS in southern Hebei was far less than that on the northern NCP in spring, autumn and winter (Figs. 6e, S3a and S3e) but was nearly consistent in summer (Fig. 6a). This finding indicated a weaker horizontal diffusion potential in southern Hebei than that on the northern NCP.
The Vc is an important factor in pollutant dissipation and air quality studies; it accounts for the vertical dispersion and advection of pollutants. With a larger Vc, strong dissipation potential follows. The Vc is defined as the product of MLH and wind transport (UT ) as shown in Eq. (2).
When we utilized the wind profiles in Figs. 6 and S3 with equal spacing in the vertical direction, UT could be regarded as the mean wind transport; i.e., , where Ui is the WS observed at each level and n is the number of levels within the mixing layer (Nair et al., 2007). Since the WS was a climatic parameter, the WS profiles at 08:00 and 20:00 LT were used to approximate Vc approximately. Considering the monthly averaged MLH at the BJ, SJZ and QHD stations, the monthly Vc were depicted in Fig. 9. Vc at southern Hebei was always lower than that in the northern NCP during the whole study period. The seasonal means of Vc at the BJ, SJZ and QHD stations in spring, summer, autumn and winter were 4112.0, 2733.3 and 4008.5; 3227.5, 2908.8 and 2593.7; 2481.4, 1421.9 and 2581.7; and 2397.2, 1117.7 and 2900.0 m2 s−1, respectively. It was clear that the SJZ station usually had the lowest Vc, and the annual averaged Vc at SJZ was almost 1.5 and 1.5 times smaller than the BJ and QHD stations, respectively (Table S3). As a result, the particle dissipation potential in southern Hebei was much weaker than that in the northern NCP and coastal areas.
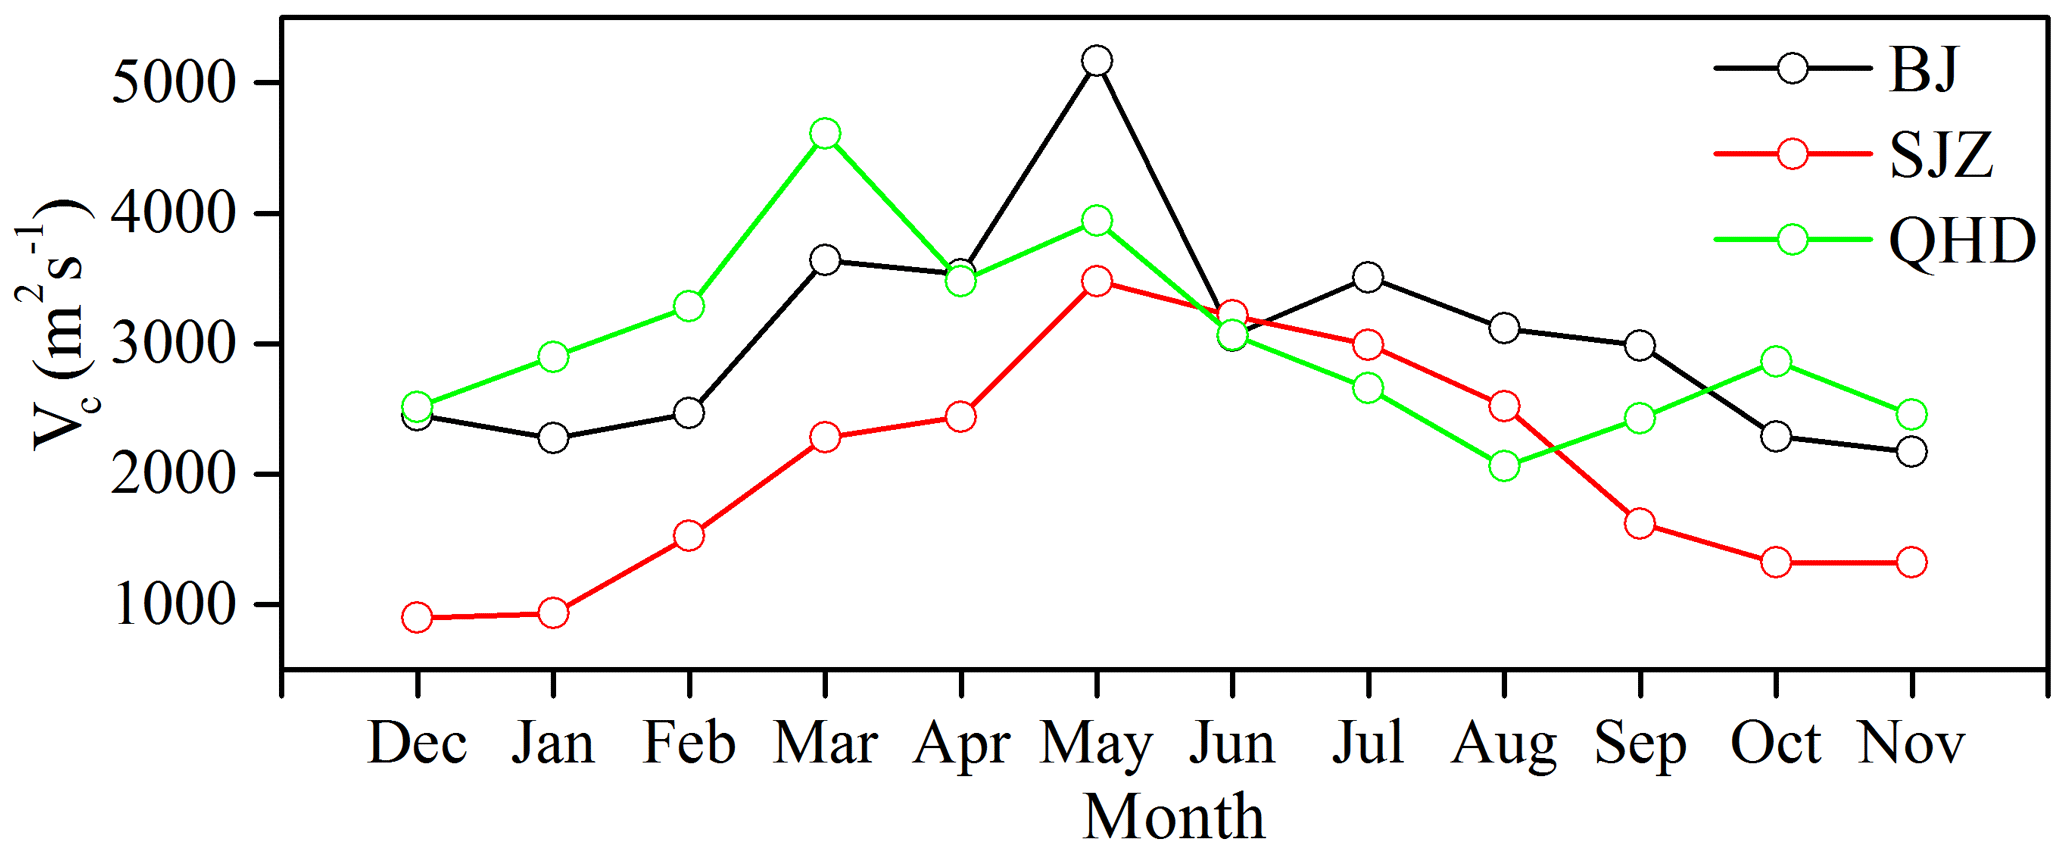
Figure 9Seasonal variations of Vc at the BJ, SJZ and QHD stations from December 2013 to November 2014. The Vc is defined as the product of MLH and wind transport (Nair et al., 2007) (Eq. 2). With a larger Vc, strong dissipation potential follows.
Therefore, with lower MLH, lower WS and higher RH occurrence in southern Hebei compared to the northern NCP, the near-ground PM2.5 showed a large contrast between these two areas. However, the AOD had little difference between southern Hebei and the northern NCP. Apart from the emission contrast, the contrasting meteorological conditions between these two areas heavily contributed to the heavy haze in southern Hebei, and the industrial structure is in need of readjustment for the NCP (Fig. 10).
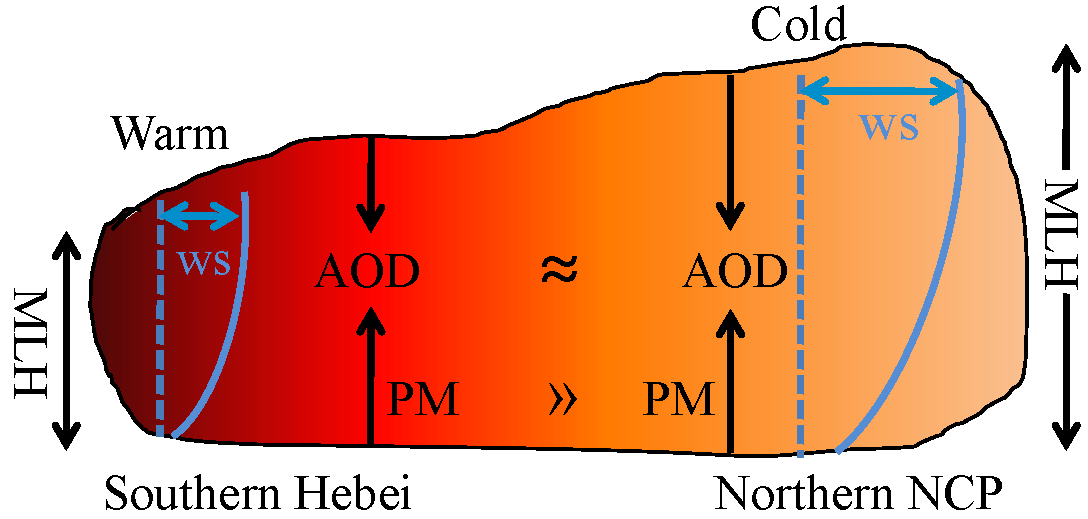
Figure 10The schematic diagram of the meteorological causes for heavy haze in southern Hebei.
To gain new insight into the spatiotemporal variation of the regional MLH, in the present study we conducted simultaneous observation with ceilometers at three inland stations (BJ, SJZ and TJ) and one coastal site (QHD) to obtain MLH data at high spatial and temporal resolution. The experiment period lasted for 22 months from 16 October 2013 to 15 July 2015, and a whole year of data (from December 2013 to November 2014) were utilized for further study. Conclusions were drawn as follows.
The ceilometers retrieve both inland and coastal MLH properly. The MLHs in the inland areas of the NCP were high in spring and summer and low in autumn and winter. While under the impact of TIBL, the coastal MLH had an opposite variation trend than inland sites and the lowest MLH in QHD occurred in summer. The TIBL impaired the local MLH development at the coastal site and caused the mixing layer to peak early in summer; this effect weakened with distance inland.
The MLH in southern Hebei was lower than that on the northern NCP, especially in spring, autumn and winter. This mainly resulted from the more stable turbulent structure (weak shear term, higher buoyancy term and larger frequency of Ri > 1) than the northern NCP, and the stable stratification in southern Hebei was partially related to the Siberian High and warm advection from the Loess Plateau. In summer, the atmospheric stability was almost consistent between southern Hebei and the northern NCP, and the MLHs between these two areas were nearly identical.
The lower MLH and WS in southern Hebei restricted the atmospheric environmental potential and the pollutant dissipation potential, respectively. Accompanied by higher RH values (stronger pollutant growth potential), the adverse weather conditions will cause severe haze to occur easily in southern Hebei, and the industrial layout in the NCP is in need of restructuring. Heavily polluting enterprises should be relocated to locations with better weather conditions (e.g., some northern areas and coastal areas), and strong emission reduction measures should be implemented in the remaining industrial enterprises to improve air quality.
Overall, the present study is the first to conduct a long-term observation of the MLH with high spatial and temporal resolution on a regional scale. The observation results will be of great importance for model parameterization scheme promotion and provide basic information on the distribution of weather conditions in the NCP region. A weakness of this study is that we did not account for the transport effect on PM2.5 concentrations. Because pollutants are usually transported from south to north in the NCP region during haze episodes (Tang et al., 2015; Zhu et al., 2016), pollutant transport has a greater impact on the northern areas and has less influence on the results of this analysis. The absence of sounding data at noon is another shortcoming, and the daytime observations will be implemented in future experiments. Nevertheless, with data only at 08:00 and 20:00 LT, we still provide fundamental knowledge about the reasons for MLH contrast between northern NCP and southern Hebei, and our study can provide reasonable and scientific suggestions for industrial layout and air pollution emission reduction measures for the NCP region. This will be of great importance for achieving integrated development goals.
The datasets used in this study can be accessed by contacting the corresponding author (Guiqian Tang: tgq@dq.cern.ac.cn).
The supplement related to this article is available online at: https://doi.org/10.5194/acp-18-4897-2018-supplement.
The authors declare that they have no conflict of interest.
This article is part of the special issue “Regional transport and transformation of air pollution in eastern China”. It is not associated with a conference.
This work was supported by the National Key R&D Program of China
(2017YFC0210000), the National Natural Science Foundation of China
(41705113), the Beijing Municipal Science and Technology Project
(ZL171100000617002) and the National Earth System Science Data Sharing
Infrastructure, National Science & Technology Infrastructure of China.
Edited by: Renyi Zhang
Reviewed by: three anonymous referees
Beyrich, F.: Mixing height estimation from SODAR data – a critical discussion, Atmos. Environ., 31, 3941–3953, 1997.
Bond, T. C., Doherty, S. J., Fahey, D. W., Forster, P. M., Berntsen, T., DeAngelo, B. J., Flanner, M. G., Ghan, S., Kärcher, B., Koch, D., Kinne, S., Kondo, Y., Quinn, P. K., Sarofim, M. C., Schultz, M. G., Schulz, M., Venkataraman, C., Zhang, S., Bellouin, N., Guttikunda, S. K., Hopke, P. K., Jacobson, M. Z., Kaiser, J. W., Klimont, Z., Lohmann, U., Schwarz, J. P., Shindell, D., Storelvmo, T., Warren, S. G., and Zender, C. S.: Bounding the role of black carbon in the climate system: a scientific assessment, J. Geophys. Res., 118, 1–173, https://doi.org/10.1002/jgrd.50171, 2013.
Chen, W. B., Kuze, H., Uchiyama, A., Suzuki, Y., and Takeuchi, N.: One-year observation of urban mixed layer characteristics at Tsukuba, Japan using a micro pulse lidar, Atmos. Environ., 35, 4273–4280, https://doi.org/10.1016/S1352-2310(01)00181-9, 2001.
Emeis, S., Münkel, C., Vogt, S., Müller, W. J., and Schäfer, K.: Atmospheric boundary-layer structure from simultaneous SODAR, RASS, and ceilometer measurements, Atmos. Environ., 38, 273–286, https://doi.org/10.1016/j.atmosenv.2003.09.054, 2004.
Emeis, S., Schäfer, K., and Münkel, C.: Observation of the structure of the urban boundary layer with different ceilometers and validation by RASS data, Meteorol. Z., 18, 149–154, https://doi.org/10.1127/0941-2948/2009/0365, 2009.
Emeis, S., Schäfer, K., Münkel, C., Friedl, R., and Suppan, P.: Evaluation of the Interpretation of Ceilometer Data with RASS and Radiosonde Data, Bound.-Lay. Meteorol., 143, 25–35, https://doi.org/10.1007/s10546-011-9604-6, 2011.
Eresmaa, N., Karppinen, A., Joffre, S. M., Räsänen, J., and Talvitie, H.: Mixing height determination by ceilometer, Atmos. Chem. Phys., 6, 1485–1493, https://doi.org/10.5194/acp-6-1485-2006, 2006.
Fu, G. Q., Xu, W. Y., Yang, R. F., Li, J. B., and Zhao, C. S.: The distribution and trends of fog and haze in the North China Plain over the past 30 years, Atmos. Chem. Phys., 14, 11949–11958, https://doi.org/10.5194/acp-14-11949-2014, 2014.
Garratt, J.: The atmospheric boundary layer, Cambridge University Press, Cambridge, UK, 316 pp., 1994.
Geiß, A., Wiegner, M., Bonn, B., Schäfer, K., Forkel, R., von Schneidemesser, E., Münkel, C., Chan, K. L., and Nothard, R.: Mixing layer height as an indicator for urban air quality?, Atmos. Meas. Tech., 10, 2969–2988, https://doi.org/10.5194/amt-10-2969-2017, 2017.
Guo, J., Zhang, X., Wu, Y., Che, H., Laba, and Li, X.: Spatio-temporal variation trends of satellite-based aerosol optical depth in China during 1980–2008, Atmos. Environ., 45, 6802–6811, https://doi.org/10.1016/j.atmosenv.2011.03.068, 2011.
Guo, J., Miao, Y., Zhang, Y., Liu, H., Li, Z., Zhang, W., He, J., Lou, M., Yan, Y., Bian, L., and Zhai, P.: The climatology of planetary boundary layer height in China derived from radiosonde and reanalysis data, Atmos. Chem. Phys., 16, 13309–13319, https://doi.org/10.5194/acp-16-13309-2016, 2016.
He, Q. S. and Mao, J. T.: Observation of urban mixed layer at Beijing using a micro pulse lidar, Acta Meteorol. Sin., 63, 374–384, 2005.
Hu, M., Liu, S., Wu, Z. J., Zhang, J., Zhao, Y. L., Wehner, B., and Wiedensolher, A.: Effects of high temperature, high relative humidity and rain process on particle size distributions in the summer of Beijing, Environ. Sci., 27, 2293–2298, 2006.
Hu, X. M., Ma, Z. Q., Lin, W. L., Zhang, H. L., Hu, J. L., Wang, Y., Xu, X. B., Fuentes, J. D., and Xue, M.: Impact of the Loess Plateau on the atmospheric boundary layer structure and air quality in the North China Plain?: A case study, Sci. Total Environ., 499, 228–237, https://doi.org/10.1016/j.scitotenv.2014.08.053, 2014.
Jacobson, M. Z.: Strong radiative heating due to the mixing state of black carbon in atmospheric aerosols, Nature, 409, 695–697, 2001.
Ji, D. S., Wang, Y. S., Wang, L. L., Chen, L. F., Hu, B., Tang, G. Q., Xin, J. Y., Song, T., Wen, T. X., Sun, Y., Pan, Y. P., and Liu, Z. R.: Analysis of heavy pollution episodes in selected cities of northern China, Atmos. Environ., 50, 338–348, 2012.
Jing, T. U., Zhang, S. P., Cheng, X. K., Yang, W. Y., and Yang, Y. Q.: Temporal and Spatial Variation of Atmospheric Boundary Layer Height (ABLH) over the Yellow East China Sea, J. Ocean U. China, 42, 7–18, 2012.
Li, M., Tang, G. Q., Huang, X. J., Liu, Z. R., An, J. L., and Wang, Y. S.: Relationship between atmospheric MLH and winter haze pollution in the Jing-Jin-Ji region, Environ. Sci., 2015,, 1935–1943, 2015.
Li, P., Xin, J. Y., Bai, X. P., Wang, Y. S., Wang, S. G., Liu, S. X., and Feng, X. X.: Observational studies and a statistical early warning of surface ozone pollution in Tangshan, the largest heavy industry city of North China, Inter. J. Env. Res. Pub. Heal., 10, 1048–1061, https://doi.org/10.3390/ijerph10031048, 2013.
Li, Z. Q., Lau, W. K. M., Ramanathan, V., Wu, G., Ding, Y., Manoj, M. G., Liu, J., Qian, Y., Li, J., Zhou, T., Fan, J., Rosenfeld, D., Ming, Y., Wang, Y., Huang, J., Wang, B., Xu, X., Lee, S. S., Cribb, M., Zhang, F., Yang, X., Zhao, C., Takemura, T., Wang, K., Xia, X., Yin, Y., Zhang, H., Guo, J., Zhai, P. M., Sugimoto, N., Babu, S. S., and Brasseur, G. P.: Aeosol and monsoon climate interactions over Asia, Rev. Geophys., 54, 886–929, https://doi.org/10.1002/2015RG000500, 2016.
Liu, Z. R., Sun, Y., Li, L., and Wang, Y. S.: Particle mass concentrations and size distribution during and after the Beijing Olympic Games, Environ. Sci., 32, 913, https://doi.org/10.13227/j.hjkx.2011.04.015, 2011.
Liu, Z. R., Hu, B., Zhang, J., Yu, Y., and Wang, Y. S.: Characteristics of aerosol size distributions and chemical compositions during wintertime pollution episodes in Beijing, Atmos. Res., 168, 1–12, https://doi.org/10.1016/j.atmosres.2015.08.013, 2016.
Miao, Y. C., Hu, X. M., Liu, S. H., Qian, T. T., Xue, M., Zheng, Y. J., and Wang, S.: Seasonal variation of local atmospheric circulations and boundary layer structure in the Beijing-Tianjin-Hebei region and implications for air quality, J. Adv. Model. Earth. Sy., 7, 1602–1626, https://doi.org/10.1002/2015ms000522, 2015.
Münkel, C. and Räsänen, J.: New optical concept for commercial lidar ceilometers scanning the boundary layer, Proc. SPIE, 5571, 364–374, 2004.
Münkel, C., Eresmaa, N., Räsänen, J., and Karppinen, A.: Retrieval of mixing height and dust concentration with lidar ceilometer, Bound.-Lay. Meteorol., 124, 117–128, https://doi.org/10.1007/s10546-006-9103-3, 2007.
Muñoz, R. C. and Undurraga, A. A.: Daytime Mixing layer over the Santiago Basin: Description of Two Years of Observations with a Lidar Ceilometer, J. Appl. Meteorol. Clim., 49, 1728–1741, https://doi.org/10.1175/2010jamc2347.1, 2010.
Nair, V. S., Moorthy, K. K., Alappattu, D. P., Kunhikrishnan, P. K., George, S., Nair, P. R., Babu, S. S., Abish, B., Satheesh, S. K., Tripathi, S. N., Niranjan, K., Madhavan, B. L., Srikant, V., Dutt, C. B. S., Badarinath, K. V. S., and Reddy, R. R.: Wintertime aerosol characteristics over the Indo-Gangetic Plain (IGP): Impacts of local boundary layer processes and long-rang transport, J. Geophys. Res., 112, D13205, https://doi.org/10.1029/2006JD008099, 2007.
Peng, J. F., Hu, M., Guo, S., Du, Z. F., Zheng, J., Shang, D. J., Misti, L. Z., Zeng, L. M., Shao, M., Wu, Y. S., Zheng, J., Wang, Y., Glen, C. R., Collins, D. R., and Molina, M. J.: Markedly enhanced absorption and direct radiative forcing of black carbon under polluted urban environments, P. Natl. Acad. Sci. USA, 113, 4266–4271, https://doi.org/10.1073/pnas.1602310113, 2016.
Puygrenier, V., Lohou, F., Campistron, B., Saïd, F., Pigeon, G., Bénech, B., and Serça, D.: Investigation on the fine structure of sea-breeze during ESCOMPTE experiment, Atmos. Res., 74, 329–353, https://doi.org/10.1016/j.atmosres.2004.06.011, 2005.
Quan, J. N., Gao, Y., Zhang, Q., Tie, X. X., Cao, J. J., Han, S. Q., Meng, J. W., Chen, P. F., and Zhao, D. L.: Evolution of planetary boundary layer under different weather conditions, and its impact on aerosol concentrations, Particuology, 11, 34–40, https://doi.org/10.1016/j.partic.2012.04.005, 2013.
Schween, J. H., Hirsikko, A., Löhnert, U., and Crewell, S.: Mixing-layer height retrieval with ceilometer and Doppler lidar: from case studies to long-term assessment, Atmos. Meas. Tech., 7, 3685–3704, https://doi.org/10.5194/amt-7-3685-2014, 2014.
Seibert, P., Beyrich, F., Grying, S. E., Joffre, S., Rasmussen, A., and Tercier, P.: Review and intercomparison of operational methods for the determination of the mixing height, Atmos. Environ., 34, 1001–1027, https://doi.org/10.1016/S1352-2310(99)00349-0, 2000.
Seidel, D. J., Ao, C. O., and Li, K.: Estimating climatological planetary boundary layer heights from radiosonde observations: Comparison of methods and uncertainty analysis, J. Geophys. Res., 115, D16113, https://doi.org/10.1029/2009JD013680, 2010.
Seinfeld, J. and Pandis, S.: Atmospheric Chemistry and Physics: From Air Pollution to Climate Change, John Wiley and Sons, New York, USA, 1998.
Sicard, M., Pérez, C., Rocadenbosch, F., Baldasano, J. M., and García-Vizcaino, D.: Mixed-Layer Depth Determination in the Barcelona Coastal Area From Regular Lidar Measurements: Methods, Results and Limitations, Bound.-Lay. Meteorol., 119, 135–157, 2006.
Sokół, P., Stachlewska, I. S., Ungureanu, I., and Stefan, S.: Evaluation of the boundary layer morning transition using the CL-31 ceilometer signals, Acta Geophys., 62, 367–380, https://doi.org/10.2478/s11600-013-0158-5, 2014.
Stull, R.: An Introduction to Boundary Layer Meteorology, Kluwer Academic Publishers, Dordrecht, the Netherlands, 1988.
Su, F. Q., Yang, M. Z., Zhong, J. H., and Zhang, Z. G.: The effects of synoptic type on regional atmospheric contamination in North China, Res. Of Environ. Sci., 17, 16–20, https://doi.org/10.13198/j.res.2004.03.18.sufq.006, 2004.
Tang, G., Li, X., Wang, Y., Xin, J., and Ren, X.: Surface ozone trend details and interpretations in Beijing, 2001–2006, Atmos. Chem. Phys., 9, 8813–8823, https://doi.org/10.5194/acp-9-8813-2009, 2009.
Tang, G., Wang, Y., Li, X., Ji, D., Hsu, S., and Gao, X.: Spatial-temporal variations in surface ozone in Northern China as observed during 2009–2010 and possible implications for future air quality control strategies, Atmos. Chem. Phys., 12, 2757–2776, https://doi.org/10.5194/acp-12-2757-2012, 2012.
Tang, G., Zhu, X., Hu, B., Xin, J., Wang, L., Münkel, C., Mao, G., and Wang, Y.: Impact of emission controls on air quality in Beijing during APEC 2014: lidar ceilometer observations, Atmos. Chem. Phys., 15, 12667–12680, https://doi.org/10.5194/acp-15-12667-2015, 2015.
Tang, G., Zhang, J., Zhu, X., Song, T., Münkel, C., Hu, B., Schäfer, K., Liu, Z., Zhang, J., Wang, L., Xin, J., Suppan, P., and Wang, Y.: Mixing layer height and its implications for air pollution over Beijing, China, Atmos. Chem. Phys., 16, 2459–2475, https://doi.org/10.5194/acp-16-2459-2016, 2016.
Tang, G. Q., Zhao, P. S., Wang, Y. H., Gao, W. K., Cheng, M. T., Xin, J. Y., Li, X., and Wang, Y. S.: Mortality and air pollution in Beijing: the long-term relationship, Atmos. Environ., 150, 238–243, https://doi.org/10.1016/j.atmosenv.2016.11.045, 2017a.
Tang, G. Q., Zhu, X. W., Xin, J. Y., Hu, B., Song, T., Sun, Y., Zhang, J. Q., Wang, L. L., Cheng, M. T., Chao, N., Kong, L. B., Li, X., and Wang, Y. S.: Modelling study of boundary-layer ozone over northern China – Part I: Ozone budget in summer, Atmos. Res., 187, 128–137, 2017b.
Tomasi, F. D., Miglietta, M. M., and Perrone, M. R.: A Case Study, Bound.-Lay. Meteorol., 139, 521–541, https://doi.org/10.1007/s10546-011-9592-6, 2011.
Van der Kamp, D. and Mckendry, I.: Diurnal and Seasonal Trends in Convective Mixed-Layer Heights Estimated from Two Years of Continuous Ceilometer Observations in Vancouver, BC, Bound.-Lay. Meteorol., 137, 459–475, https://doi.org/10.1007/s10546-010-9535-7, 2010.
Wagner, M., Emeis, S., Freudenthaler, V., Heese, B., Junkermann, W., Münkel, C., Schäfer, K., Seefeldner, M., and Vogt, S.: Mixing layer height over Munich, Germany: Variability and comparisons of different methodologies, J. Geophys. Res., 111, D13201, https://doi.org/10.1029/2005JD006593, 2006.
Wagner, P. and Schäfer, K.: Influence of mixing layer height on air pollutant concentrations in an urban street canyon, Urban Climate, 22, 64–79, https://doi.org/10.1016/j.uclim.2015.11.001, 2015.
Wang, G. H., Zhang, R. Y., and Gomesz, M. E., et al.: Persistent sulfate formation from London Fog to Chinese haze, P. Natl. Acad. Sci. USA, 113, 13630–13635, https://doi.org/10.1073/pnas.1616540113, 2016.
Wang, L. L., Zhang, N., Liu, Z. R., Sun, Y., Ji, D. S., and Wang, Y. S.: The Influence of Climate Factors, Meteorological Conditions, and Boundary-Layer Structure on Severe Haze Pollution in the Beijing-Tianjin-Hebei Region during January 2013, Adv. Meteorol., 2014, 1–14, https://doi.org/10.1155/2014/685971, 2014.
Wang, Y. S., Yao, L., Wang, L. L., Liu, Z. R., Ji, D. S., Tang, G. Q., Zhang, J. K., Sun, Y., Hu, B., and Xin, J. Y.: Mechanism for the formation of the January 2013 heavy haze pollution episode over central and eastern China, Sci. China Earth Sci., 57, 14–25, https://doi.org/10.1007/s11430-013-4773-4, 2013.
Wang, Y., Khalizov, A., Levy, M., and Zhang, R. Y.: New Directions: Light absorbing aersols and their atmospheric impacts, Atmos. Environ., 81, 713–715, https://doi.org/10.1016/j.atmosenv.2013.09.034, 2013.
Wei, J., Tang, G. Q., Zhu, X. W., Wang, L. L., Liu, Z. R., Cheng, M. T., Münkel, C., Li, X., and Wang, Y. S.: Thermal internal boundary layer and its effects on air pollutants during summer in a coastal city in North China, J. Environ. Sci., JES-01353:1-8, 1001–0742, https://doi.org/10.1016/j.jes.2017.11.006, 2017.
Wiegner, M., Madonna, F., Binietoglou, I., Forkel, R., Gasteiger, J., Geiß, A., Pappalardo, G., Schäfer, K., and Thomas, W.: What is the benefit of ceilometers for aerosol remote sensing? An answer from EARLINET, Atmos. Meas. Tech., 7, 1979–1997, https://doi.org/10.5194/amt-7-1979-2014, 2014.
Xu, R. G., Tang, G. Q., Wang, Y. S., and Tie, X. X: Analysis of a long-term measurement of air pollutants (2007–2011) in North China Plain (NCP); Impact of emission reduction during the Beijing Olympic Games, Chemosphere, 159, 647–658, https://doi.org/10.1016/j.chemosphere.2016.06.025, 2016.
Yu, H., Liu, S. C., and Dickinson, R. E.: Radiative effects of aerosols on the evolution of the atmospheric boundary layer, J. Geophys. Res.-Atmos., 107, AAC-1-AAC 3–14, https://doi.org/10.1029/2001JD000754, 2002.
Zhang, H., Wang, Y., Hu, J., Ying, Q., and Hu, X. M.: Relationships between meteorological parameters and criteria air pollutants in three megacities in China, Environ. Res., 140, 242–254, https://doi.org/10.1016/j.envres.2015.04.004, 2015.
Zhang, J. K., Sun, Y., Liu, Z. R., Ji, D. S., Hu, B., Liu, Q., and Wang, Y. S.: Characterization of submicron aerosols during a month of serious pollution in Beijing, 2013, Atmos. Chem. Phys., 14, 2887–2903, https://doi.org/10.5194/acp-14-2887-2014, 2014.
Zhang, Q., Xin, J. Y., Yin, Y., Wang, L. L., and Wang, Y. S.: The Variation and Trends of MODIS C5 & C6 Products' Errors in the Recent Decade over the Background and Urban Areas of North China, Remote Sens., 9, 754, https://doi.org/10.3390/rs8090754, 2016.
Zhang, R. Y.: Getting to the Critical Nucleus of Aerosol Formation, Science, 328, 1366–1367, https://doi.org/10.1126/science.1189732, 2010.
Zhang, R. Y., Wang, G. H., Guo, S., Zamora, M. L., Ying, Q., Lin, Y., Wang, W. G., Hu, M., and Wang, Y.: Formation of Urban Fine Particulate Matter, Chem. Rev., 115, 3803–3855, https://doi.org/10.1021/acs.chemrev.5b00067, 2015.
Zhang, W., Guo, J., Miao, Y., Liu, H., Zhang, Y., Li, Z., and Zhai, P.: Planetary boundary layer height from CALIOP compared to radiosonde over China, Atmos. Chem. Phys., 16, 9951–9963, https://doi.org/10.5194/acp-16-9951-2016, 2016.
Zhang, Z. Z., Cai, X. H., Song, Y., Kang, L., Huang, X., and Li, Q. Y.: Temporal and spatial variation of atmospheric boundary layer height over Hainan Island and its adjacent sea areas, Acta. Sci. Nat. Univ. Pekin., 49, 83–90, https://doi.org/10.13209/j.0479-8023.2013.105, 2013.
Zhao, X. J., Zhao, P. S., Xu, J., Meng,, W., Pu, W. W., Dong, F., He, D., and Shi, Q. F.: Analysis of a winter regional haze event and its formation mechanism in the North China Plain, Atmos. Chem. Phys., 13, 5685–5696, https://doi.org/10.5194/acp-13-5685-2013, 2013.
Zhu, X. W., Tang, G. Q., Hu, B., Wang, L. L., Xin, J. Y., Zhang, J. K., Liu, Z. R., Münkel, C., and Wang, Y. S.: Regional pollution and its formation mechanism over North China Plain: A case study with ceilometer observations and model simulations, J. Geophys. Res.-Atmos., 121, 574–588, 2016.