the Creative Commons Attribution 4.0 License.
the Creative Commons Attribution 4.0 License.
 | 03 Apr 2018
Comparing airborne and satellite retrievals of cloud optical thickness and particle effective radius using a spectral radiance ratio technique: two case studies for cirrus and deep convective clouds
Trismono C. Krisna
Manfred Wendisch
André Ehrlich
Evelyn Jäkel
Frank Werner
Ralf Weigel
Stephan Borrmann
Christoph Mahnke
Ulrich Pöschl
Meinrat O. Andreae
Christiane Voigt
Luiz A. T. Machado
Solar radiation reflected by cirrus and deep convective clouds (DCCs) was measured by the Spectral Modular Airborne Radiation Measurement System (SMART) installed on the German High Altitude and Long Range Research Aircraft (HALO) during the Mid-Latitude Cirrus (ML-CIRRUS) and the Aerosol, Cloud, Precipitation, and Radiation Interaction and Dynamic of Convective Clouds System – Cloud Processes of the Main Precipitation Systems in Brazil: A Contribution to Cloud Resolving Modelling and to the Global Precipitation Measurement (ACRIDICON-CHUVA) campaigns. On particular flights, HALO performed measurements closely collocated with overpasses of the Moderate Resolution Imaging Spectroradiometer (MODIS) aboard the Aqua satellite. A cirrus cloud located above liquid water clouds and a DCC topped by an anvil cirrus are analyzed in this paper. Based on the nadir spectral upward radiance measured above the two clouds, the optical thickness τ and particle effective radius reff of the cirrus and DCC are retrieved using a radiance ratio technique, which considers the cloud thermodynamic phase, the vertical profile of cloud microphysical properties, the presence of multilayer clouds, and the heterogeneity of the surface albedo. For the cirrus case, the comparison of τ and reff retrieved on the basis of SMART and MODIS measurements yields a normalized mean absolute deviation of up to 1.2 % for τ and 2.1 % for reff. For the DCC case, deviations of up to 3.6 % for τ and 6.2 % for reff are obtained. The larger deviations in the DCC case are mainly attributed to the fast cloud evolution and three-dimensional (3-D) radiative effects. Measurements of spectral upward radiance at near-infrared wavelengths are employed to investigate the vertical profile of reff in the cirrus. The retrieved values of reff are compared with corresponding in situ measurements using a vertical weighting method. Compared to the MODIS observations, measurements of SMART provide more information on the vertical distribution of particle sizes, which allow reconstructing the profile of reff close to the cloud top. The comparison between retrieved and in situ reff yields a normalized mean absolute deviation, which ranges between 1.5 and 10.3 %, and a robust correlation coefficient of 0.82.
- Article
(6868 KB) - Full-text XML
- BibTeX
- EndNote


Clouds constitute an important component of the global climate system. Covering about 75 % of the Earth, their high albedo strongly affects the Earth's energy budget (Wylie et al., 2005; Kim and Ramanathan, 2008; Stubenrauch et al., 2013). In particular, optically thin cirrus is expected to warm the atmosphere below the cloud, while thick cirrus may rather cool the atmosphere (e.g., Liou, 1986; Wendisch et al., 2005, 2007; Voigt et al., 2017). Cirrus clouds reflect solar radiation and reduce the loss of radiative energy to space due to absorption of terrestrial radiation and re-emission at a lower temperature (greenhouse effect). Given the fact that their regional coverage can be as high as about 50 % in the tropics and 30 % over Europe, cirrus clouds pose large challenges when predicting future climate changes (Heymsfield et al., 2017) because they are not adequately represented in general circulation models.
On the other hand, deep convective clouds (DCCs) alter the radiative energy distribution in the atmosphere by reflection of solar and absorption or emission of terrestrial radiation, as well as by changes of liquid and ice water and hydrometeor profiles (Jensen and Del Genio, 2003; Sherwood et al., 2004; Sohn et al., 2015). Their life cycle is determined by complex microphysical processes including different cloud particle growth/shrinking mechanisms, changes of the thermodynamic phase, and the development of precipitation. DCCs are optically thick and often associated with heavy precipitation, strong turbulence, considerable vertical motion, lightning, hail formation, and icing (Mecikalski et al., 2007; Lane and Sharman, 2014).
Two important properties which determine the cloud radiative impact are the cloud optical thickness τ and particle effective radius reff (King et al., 2013). These parameters determine the cooling and warming effects of clouds (Slingo, 1990; Shupe and Intrieri, 2004). Several passive remote sensing techniques have been developed to retrieve τ and reff using spectral upward (cloud-reflected) solar or emitted thermal-infrared radiance measured by airborne and satellite sensors, where the most common technique relies on the bi-spectral methods (e.g., Nakajima and King, 1990; King et al., 1997; Stephens and Kummerow, 2007; Platnick et al., 2017). Furthermore, a radiance ratio method was introduced by Werner et al. (2013), which is able to reduce the retrieval uncertainties.
Airborne remote sensing of cirrus and DCC properties gives a snapshot of the cloud field only, whereas satellite remote sensing (e.g., MODIS) may provide statistical data on a global scale and record long time series to determine temporal changes of cloud properties (Rosenfeld and Lensky, 1998; Lindsey et al., 2006; Berendes et al., 2008). Post-launch validation activities of satellite measurements are crucial to verify the quality of satellite products. It is essential to address all components of the measurement system, i.e., sensors and algorithms, along with the originally measured radiances and derived data products, and continue validation activities throughout the satellite lifetime (Larar et al., 2010). Radiance measurements above highly reflecting surfaces such as salt lake, desert, snow/ice (Wan, 2014), and clouds (Mu et al., 2017) are usually evaluated in order to monitor the long-term stability of the satellite sensors. An estimated uncertainty of about 1–5 % in the case of MODIS reflective solar bands (RSBs) was reported by Xiong et al. (2003). This measurement error propagates into the retrieval results. Additional uncertainties may arise from inappropriate assumptions of surface albedo and ice crystal habit in the case of ice or mixed-phase clouds. According to Rolland and Liou (2001), Fricke et al. (2014), and Ehrlich et al. (2017), an inaccurate assumption of surface albedo can lead to uncertainties of up to 83 % for τ and 62 % for reff. Eichler et al. (2009) demonstrated that uncertainties of up to 70 % for τ and 20 % for reff are obtained when an inappropriate ice crystal habit is assumed in cirrus retrievals. Furthermore, the influence of three-dimensional (3-D) radiative effects due to the horizontal heterogeneity that enhances the retrieval uncertainties has been demonstrated by Liang et al. (2009), Zhang and Platnick (2011), and King et al. (2013).
Among others, Platnick (2000) and van Diedenhoven et al. (2016) emphasized that reff retrieved from reflected solar radiation measurements depends on the vertical penetration of reflected photons into the cloud. At a wavelength with higher absorption by cloud particles, the probability of photons being scattered back out of the cloud without being absorbed decreases. Therefore, retrievals using different near-infrared wavelengths will result in reff from different cloud altitudes. This technique commonly assumes in-cloud vertical homogeneity, where the retrieved reff represents a bulk value of the entire cloud layer. Thus, the retrieved reff is hardly comparable with in situ observations, where the particle effective radius is sampled at a specific cloud altitude reff(z). A direct comparison at a certain cloud altitude is problematic because it is unclear for what level the retrieved reff corresponds to the in situ reff. This needs to be kept in mind when comparing remote sensing and in situ measurements; otherwise, a systematic discrepancy might be misinterpreted.
Studies of liquid water clouds by Painemal and Zuidema (2011) and King et al. (2013), who compared reff retrieved from MODIS observations with the mean value of reff measured by cloud probes near the cloud top, revealed absolute deviations of up to 20 %. King et al. (2013) argued that there is no apparent link between the variation of the reff retrieved using different near-infrared wavelengths of MODIS and the vertical structure of reff measured by in situ methods, while Painemal and Zuidema (2011) identified four potential reasons for this deviation: the variability of droplet size distributions, the formation of precipitation, water vapor absorption above the cloud, and viewing-geometry-dependent biases. For cirrus clouds, Wang et al. (2009) and Zhang et al. (2010) demonstrated that the differences between retrievals and in situ measurements are also influenced by the simplifying assumption of in-cloud vertical homogeneity.
Standard satellite retrievals such as that applied by MODIS commonly assume a priori that there is only a single homogeneous cloud layer with a specific thermodynamic phase, either liquid water or ice (Platnick et al., 2017). However, studies by Hahn et al. (1984) and Warren et al. (1985) analyzing ground-based observations reported that the coexistence of multilayer clouds (e.g., cirrus above liquid water clouds) is found in about 50 % of the cases. Chang and Li (2005) and Sourdeval et al. (2015) have demonstrated that omitting the low liquid water cloud in the retrieval algorithm introduces significant uncertainties in the retrieved cirrus properties.
In order to assess the issues discussed above, collocated airborne and satellite remote sensing measurements accompanied by in situ observations are necessary. The similar observation geometry of airborne and satellite radiation sensors allows a direct comparison of upward radiance data and a stringent validation of methodologies and retrieval algorithms. The validity of the retrieval results can be explored by comparison with collocated in situ measurements. This has been realized in this paper for two typical cloud cases: a cirrus above low liquid water clouds and a DCC topped by an anvil cirrus.
Measurements of spectral solar radiation using the Spectral Modular Airborne Radiation Measurement System (SMART) installed aboard the High Altitude and Long Range Research Aircraft (HALO) during the Mid-Latitude Cirrus (ML-CIRRUS) campaign (Voigt et al., 2017) and the Aerosol, Cloud, Precipitation, and Radiation Interaction and Dynamic of Convective Clouds System – Cloud Processes of the Main Precipitation Systems in Brazil: A Contribution to Cloud Resolving Modelling and to the Global Precipitation Measurement (ACRIDICON-CHUVA) campaign (Wendisch et al., 2016) are analyzed. For the purpose of airborne-satellite validation, designated flights above clouds were carried out during the ML-CIRRUS and ACRIDICON-CHUVA campaigns, which were closely collocated with overpasses of the A–Train satellites (Savtchenko et al., 2008). HALO with its long endurance of up to 8 h and high ceiling of up to 15 km altitude is optimally suited to fly above cirrus and DCCs.
The two airborne campaigns, the involved instrumentations, and the satellite observations are introduced in Sect. 2. In Sect. 3, the comparison techniques, data filters, and results of upward radiance comparison are presented. The radiance ratio algorithm and uncertainty estimation, impact of underlying liquid water cloud on the cirrus retrieval, forward simulation of vertically inhomogeneous cloud, vertical weighting function, and results of τ and reff comparison are discussed in Sect. 4. In Sect. 5, the methods and results of the comparison between in situ and retrieved effective radius are presented. Finally, the conclusions are given in Sect. 6.
2.1 Airborne campaigns
Between 21 March and 15 April 2014, the ML-CIRRUS campaign performed 16 research flights over Europe and the Atlantic ocean to study nucleation, life cycle, and climate impact of natural cirrus and aircraft-induced contrail cirrus (Voigt et al., 2017; Schumann et al., 2017). Between 1 September and 4 October 2014, the ACRIDICON-CHUVA campaign performed 14 research flights combined with satellite and ground-based observations over the Brazilian Amazon rainforest to quantify aerosol–cloud–precipitation interactions and the thermodynamic, dynamic, and radiative effects of tropical DCCs over the Amazon rainforest (Wendisch et al., 2016). One common objective of ML-CIRRUS and ACRIDICON-CHUVA was to compare airborne and satellite measurements and products. Therefore, closely collocated measurements with overpasses of the A-Train satellites were performed. One flight from the ML-CIRRUS flight number 15 (ML-15, 13 April 2014) and another one from the ACRIDICON-CHUVA flight number 18 (AC-18, 28 September 2014) were selected for detailed analyses. The flight path of ML-15 is shown in Fig. 1a. During the MODIS overpass at 13:55:00 UTC, HALO flew west of Portugal over the North Atlantic. In this area, a wide field of cirrus was located above low liquid water clouds (stratocumulus). Figure 1b shows the flight trajectory of AC-18, when HALO flew in the northwest of Brazil over Amazon rainforest during MODIS overpass at 17:55:00 UTC. In this location, a DCC topped by an anvil cirrus was observed.
2.2 Airborne instrumentation
A comprehensive overview of commonly applied airborne instrumentation is given by Wendisch and Brenguier (2013). During the ML-CIRRUS and ACRIDICON-CHUVA campaigns, a set of remote sensing and in situ instruments was operated aboard HALO (Wendisch et al., 2016; Voigt et al., 2017). SMART measured spectral upward radiance , as well as spectral upward irradiance and downward irradiance . The index “s” refers to measurements by SMART, while λ indicates spectral quantities in units of nm−1. The irradiance data can be used to determine the spectral surface albedo (Wendisch et al., 2001, 2004; Wendisch and Mayer, 2003). An active stabilization system keeps the optical inlets in a horizontal position during aircraft movements of up to ±6∘ from the horizontal plane (Wendisch et al., 2001). The spectral resolution defined by the full width at half maximum (FWHM) is 2–3 nm for the visible-to-near-infrared (VNIR) spectrometer and 8–10 nm for the the shortwave-infrared (SWIR) spectrometer (Werner et al., 2013).
SMART has two separate types of spectrometers, which measure in the solar spectrum. The VNIR spectrometer covers wavelengths from 300 to 1000 nm and the SWIR spectrometer covers from 1000 to 2200 nm. The combination of both spectrometers covers approximately 97 % of the entire solar spectrum (Bierwirth, 2008). However, due to the decreasing sensitivity of the spectrometers at small and large wavelengths, the reasonable wavelength range was restricted to 400–1800 nm.
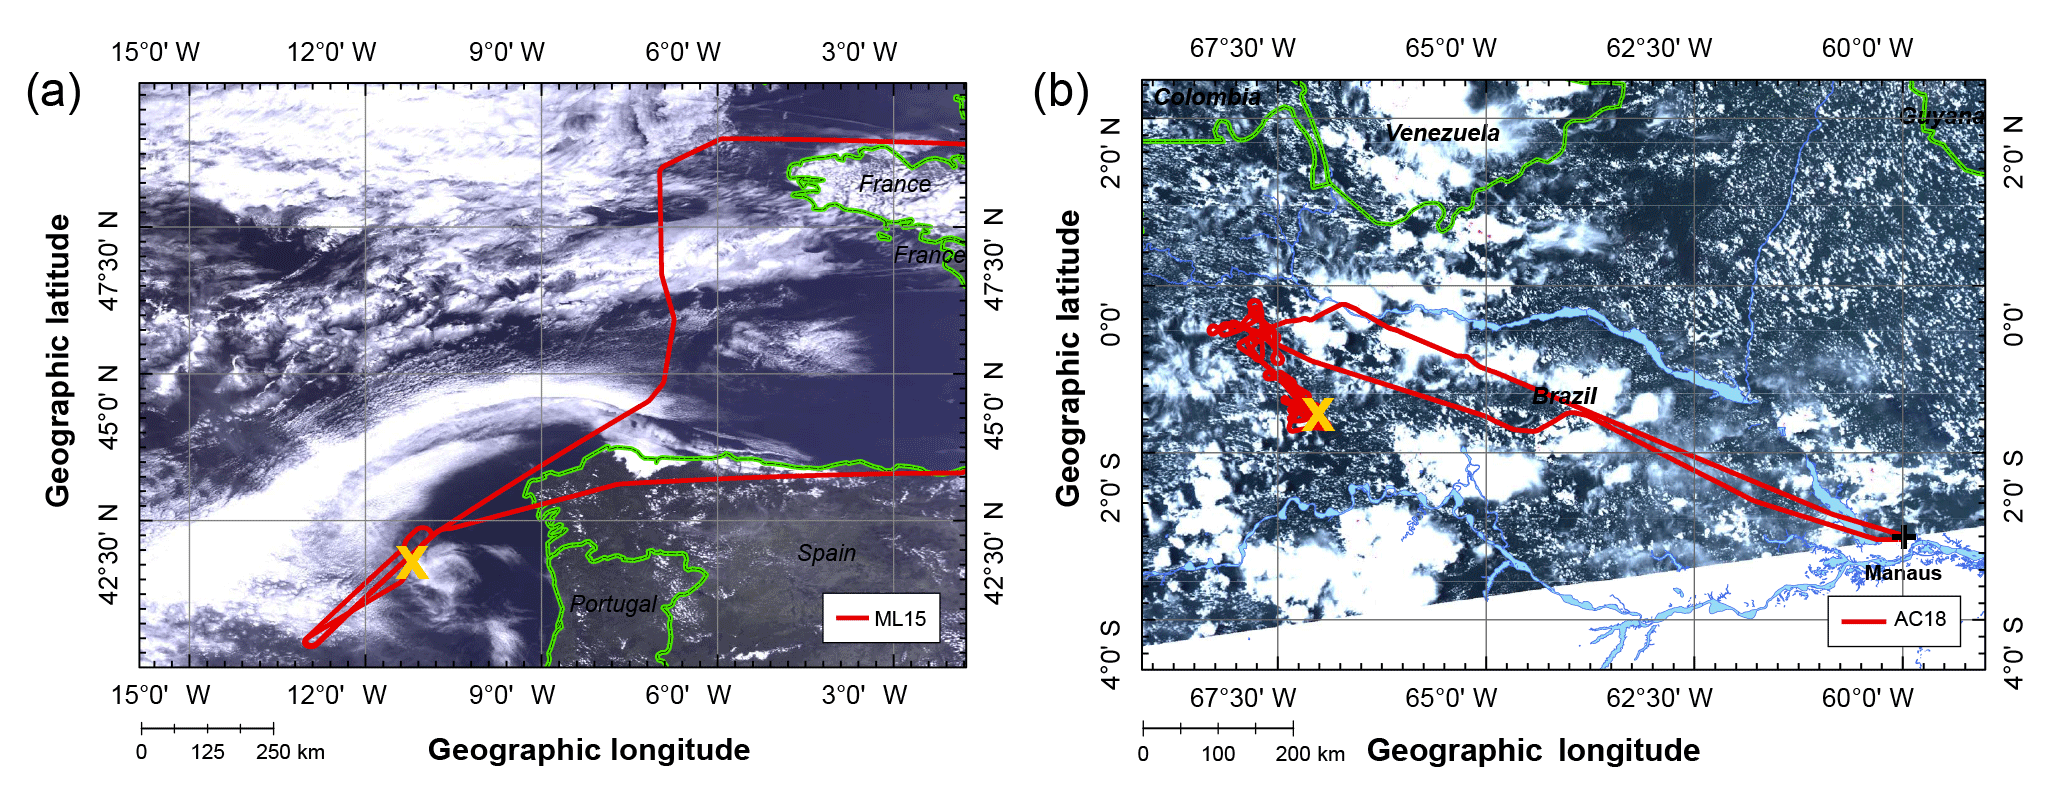
Figure 1(a) The red line is the HALO flight path of ML-15 on 13 April 2014, while (b) is for AC-18 on 28 September 2014 overlaid with corresponding MODIS true color image. The yellow cross indicates the flight section that is selected for the analysis.
In this study, only the radiance data are analyzed. The radiance optical inlet has a field of view (FOV) of 2∘ looking at nadir (Wolf et al., 2017). The nadir radiance measured by SMART is comparable to measurements of MODIS RSBs in the band numbers 1–19, and 26 ranging between 410 and 2130 µm (Xiong and Barnes, 2006). SMART is calibrated radiometrically before, during, and after each campaign using certified calibration standards traceable to the National Institute of Standards and Technology (NIST) and by the secondary calibration using a traveling standard. The measurement uncertainty of is determined by the accuracy of the spectral calibration, spectrometer noise, and dark current, as well as radiometric and transfer calibrations (Eichler et al., 2009; Brückner et al., 2014; Wolf et al., 2017). The main uncertainty results from the signal-to-noise ratio (SNR) and the calibration standard, while spectral and transfer calibration errors are negligible. The resulting total uncertainty is about 4 % for the VNIR and 10 % for the SWIR.
The Cloud Combination Probe (CCP) incorporates two separate instruments, the Cloud Droplet Probe (CDP) and the greyscale Cloud Imaging Probe (CIPgs) (Weigel et al., 2016). The CCP overall covers a diameter range from 2 to 960 µm, including large aerosol particles, liquid cloud droplets, and small frozen hydrometeors (Klingebiel et al., 2015). The CDP part detects the forward-scattered laser light when cloud particles cross the CDP laser beam (Lance et al., 2010). Thus, the CDP provides an improved replacement for the Forward Scattering Spectrometer Probe (FSSP) (Dye and Baumgardner, 1984; Baumgardner et al., 1985). Molleker et al. (2014) showed that the CCP exhibits a nominal limit for cloud particle diameters from 3 up to 50 µm. The CIPgs records two-dimensional shadow images of cloud particles in a size range from 15 up to 960 µm with an optical resolution of 15 µm (Klingebiel et al., 2015; Weigel et al., 2016). Special algorithms are used to process and analyze the captured images in order to estimate particle number concentrations and particle size distributions, and to differentiate particle shapes (Korolev, 2007).
The CCP measurements are employed to derive the reff for the comparison with the retrieval products from SMART and MODIS. The reff from the CCP is derived from the geometrical properties and number of detected particles. Many definitions of reff exist as summarized in McFarquhar and Heymsfield (1998). In general, reff as a measure for the cloud radiative properties is defined as the ratio of the third to the second moment of a cloud particle size distribution, implying spheres of equivalent cross-sectional area for any cloud particle shape (McFarquhar and Heymsfield, 1996; Frey et al., 2011). The accuracy of the cloud particle sizing is conservatively estimated to be about 10 % for spherical particles (Molleker et al., 2014). The sizing uncertainty increases as a function of particles' shape complexity (i.e., when dendrites or particles with elevated aspect ratio were predominant). The size bin limits of the CCP cloud particle data are adapted to reduce ambiguities due to the Mie curve, particularly for cloud particles with small sizes less than 5 µm. The instrument sample volume is calculated as a product of the probe air speed (measurement condition) and the instrument specific effective detection area. All concentration data are corrected concerning the air compression upstream of the underwing cloud probe at the high flight speeds (Weigel et al., 2016). The robust performance of the specific CCP instrument used in this study was demonstrated by Frey et al. (2011) for tropical convective outflow, Molleker et al. (2014) for polar stratospheric clouds, and Klingebiel et al. (2015) for low-level mixed-phase clouds in the Arctic, as well as by Braga et al. (2017) and Cecchini et al. (2017) for tropical convective clouds.
Water vapor was measured by the Water Vapor Analyzer (WARAN), which is a tunable diode laser hygrometer based on the absorption of a laser beam by gaseous water molecules at λ=1370 nm (Voigt et al., 2014; Kaufmann et al., 2014). The WARAN is installed on the forward-facing HALO trace gas inlet (HALO-TGI). The instrument measures total water, i.e., gas phase plus enhanced ice water content (IWC), in the range between 50 and 40 000 ppm with an accuracy of about ±50 ppm or 5 % of reading. Detailed descriptions about the measurement strategy and uncertainties in the data processing are discussed in Afchine et al. (2017). IWC is derived from the difference between the amount of total enhanced water (H2Otot) and the amount of gas-phase water (H2Ogas) (Kaufmann et al., 2016). Due to the enhancement factor (Voigt et al., 2006) at the HALO-TGI, which is about 20–35, the minimum detectable IWC is in the range between 1 and 2000 ppm (1–2000 × 10−2 mg m−3). In this study, the IWC is used to obtain the profile of cloud optical thickness τ(z).
2.3 Satellite observations
Satellite data used in this study stem from the Level 1B Moderate Resolution Imaging Spectroradiometer (MODIS) – Aqua Collection 6. Detailed instrument specifications and features of MODIS have been described by Platnick et al. (2003), Xiong and Barnes (2006), and others. The data contain calibrated and geolocated radiances and reflectances for 36 discrete spectral bands distributed between 0.41 and 14.2 µm, including 20 RSBs and 16 thermal emissive bands (TEBs) (Platnick et al., 2003; Xiong and Barnes, 2006), with a nadir horizontal resolutions of about 1 km. The radiances are generated from MODIS Level 1A scans of raw radiance and in the process converted to geophysical units. The solar reflectance values are based on a solar diffuser panel for reflectance calibration up through the RSBs and an accompanying diffuser stability monitor for assessing the stability of the diffuser of up to 1 µm (Platnick et al., 2003). The spectral response is determined by an interference filter overlying a detector array imaging a 10 km along-track scene for each scan (40, 20, and 10 element arrays for the 250 m, 500 m, and 1 km bands, respectively). Onboard instruments used for in-orbit radiometric calibration were discussed by Xiong et al. (2003) and Sun et al. (2007).
3.1 Spectral and spatial resolution adjustment
SMART and MODIS have different spectral resolutions. MODIS measures in broad spectral bands, while SMART measures in much narrower spectral bands with FWHM between 2 and 10 nm. To allow the comparison, the spectral upward radiance measured by SMART must be convoluted with the MODIS relative spectral response R(λ). The convoluted radiance of SMART is calculated by
In this study, upward radiances centered at the MODIS band 1 (λ=645 nm), band 5 (λ=1240 nm), and band 6 (λ=1640 nm) will be primarily used to retrieve τ and reff. It is known that 15 of the 20 detectors in the MODIS-Aqua band 6 are either nonfunctional or noisy. However, according to Wang et al. (2006), the MODIS radiance band 6 IM,B6 can be retrieved using band 7 IM,B7 (λ=2130 nm). This technique was originally developed and tested on the basis of snow surfaces assuming that the spectral characteristics of the snow reflectivity between MODIS bands 6 and 7 do not change significantly for different snow types. Assuming that ice clouds and snow have similar optical properties, the same approach can be applied. Similar to Wang et al. (2006), a parameterization of IM,B6 is developed on the basis of radiative transfer simulations of upward radiance performed for cirrus with different τ and reff. A polynomial fit is applied to quantify the relation between IM,B6 and IM,B7 which results in the parameterization
The validity of the parameterization is tested using the remaining detectors of MODIS band 6 for observations above cirrus (not shown here). The linear regression between original and retrieved IM,B6 shows differences below 5 % (slope of 0.95 and zero bias) with a correlation coefficient R2 of 0.94.
MODIS data used in this study are delivered at a horizontal resolution of 1 km at nadir, whereas the spatial resolution of SMART varies depending on the flight altitude and temporal resolution. At a flight altitude of 10 km, SMART has a swath of approximately 349 m at the Earth's surface. During the two campaigns, the temporal resolution of SMART was between 0.2 and 0.5 s, depending on the measurement conditions. This has to be considered in the data analysis. In order to decrease biases resulting from comparisons of individual measurements, SMART data are averaged over 1 s resolution using a binning method.
3.2 Data filter
Only clouds with a top altitude higher than 8 km are selected for this study. The higher proximity to the top of atmosphere (TOA) reduces the influence of scattering and absorption by atmospheric molecules and aerosol particles above the cloud. Consequently, no correction for the influence of the atmospheric layer above HALO is needed. To assure a similar viewing zenith angle of SMART and MODIS, only nadir observations in the center of MODIS swath were selected for the comparison. Werner et al. (2013) discussed that off-nadir measurements of less than 5∘ may lead to a bias in the retrieved τ and reff of up to 1 and 5 %, respectively. To minimize this bias, SMART measurements with roll and pitch angles larger than 3∘ are discarded and only straight flight legs with altitude changes of less than 50 m are analyzed.
Table 1Flight descriptions and atmospheric conditions during cloud measurements. Horizontal wind speed v and solar zenith angle θ0 are averaged during the selected time series.
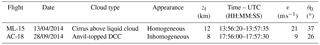
The nadir point of MODIS moves much faster than the aircraft. Therefore, it is impossible that SMART and MODIS always measure exactly above each other along the joint flight track. To analyze the effects caused by time shifts between SMART and MODIS measurements, data from the ML-CIRRUS and ACRIDICON-CHUVA are divided into groups within and without a threshold of 500 s for the cirrus and 300 s for the DCC. Scatter plots of SMART and MODIS radiance at λ=645 nm are shown in Fig. 2a for the cirrus and Fig. 2b for the DCC. For the cirrus (Fig. 2a), and are in a better agreement for s with R2=0.96, while for s deviations are larger with R2=0.58. The large scatter for s is mainly attributed to the fast horizontal wind speed during the measurements (see Table 1). Additionally, the wind direction is also a key factor causing a significant cloud drift for the larger time delay. For the DCC (Fig. 2b), the scatter is significantly larger compared to the cirrus for the given threshold of s and even worse for the threshold of s with R2=0.79 and −0.09, respectively. In this case, the horizontal wind speed is smaller, but the fast cloud evolution is the major issue. Luo et al. (2014) and Schumacher et al. (2015) reported that tropical DCCs located at altitude between 6 and 8 km typically have an updraft velocity about 2–4 m s−1. According to this analysis, the comparisons are restricted to s for the cirrus case, while for the DCC case the threshold is tightened to s.
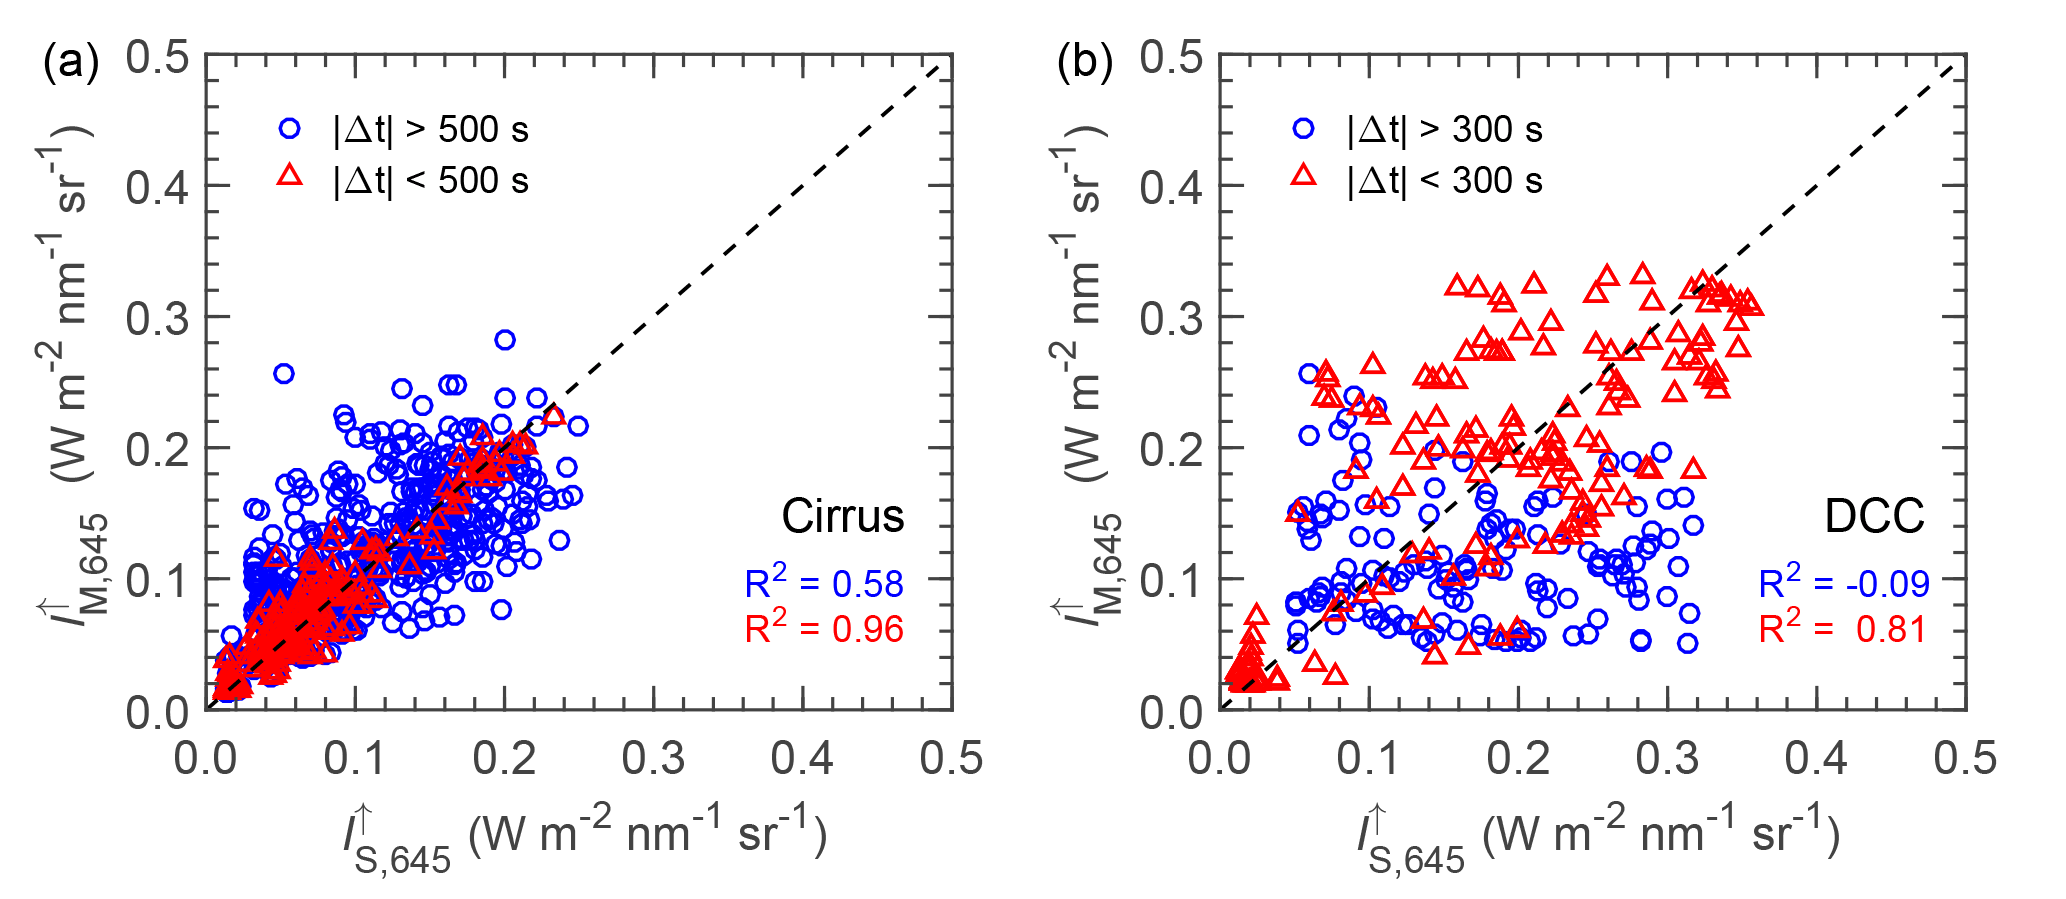
Figure 2Scatter plots of upward radiance at λ=645 nm measured by SMART () and MODIS () within a threshold of 500 s for the cirrus (a) and 300 s the DCC (b). Blue circles and red triangles represent data within and without the predetermined threshold. The dashed line represents the one-to-one line.
Figure 3MODIS radiance band 1 (λ=645 nm) for the cirrus case (a) and the DCC case (b) superimposed with the selected flight legs of HALO during cloud measurements (red line). The flight direction is from point A to B.
After the filtering, two suitable cases are left which fulfill most requirements of the analysis. The first case, a cirrus cloud located above low liquid water clouds, is selected from ML-15 between 13:56:20 and 13:57:35 UTC as shown in Fig. 3a. The cloud top altitude zt of the cirrus was about 12 km while HALO flew at about 12.3 km altitude. The second case, a DCC topped by an anvil cirrus, is selected from AC-18 between 17:56:00 and 17:57:30 UTC as presented in Fig. 3b. The zt of the selected DCC was about 8 km while HALO flew at 8.3 km altitude. Flight descriptions and atmospheric conditions during cloud measurements are summarized in Table 1. The selected time periods extend to 75 s for the cirrus and 90 s for the DCC case. For HALO flying at constant altitude, those correspond to horizontal distances of about 15 and 18 km, respectively. The cloud mask algorithm by Ackerman et al. (1998) is employed to discriminate clear and cloudy pixels for the MODIS data. Cloud edges are associated with sharp changes of and higher 3-D radiative effects. Fisher (2014) discussed variations in cloud height and surface orology to find an offset distance assigned to an uncertainty of ±40 m. Therefore, the first pixel and the last pixel of MODIS cloudy pixels are discarded in the data analysis.
3.3 Result of upward radiance comparison
Upward radiances measured by SMART and MODIS are compared for the two selected cloud cases. Figure 4 shows time series of upward radiance measured by SMART and MODIS centered at λ=645 nm (a), 1240 nm (b), and 1640 nm (c) for the cirrus case, while Fig. 5 shows the same for the DCC case. Those three wavelengths will be primarily utilized to retrieve the cloud properties in this study. The scatter plots of the respective measurements are shown in Fig. 6. Time series of upward radiances in Figs. 4 and 5 illustrate that the cirrus is more homogeneous along the flight legs compared to the DCC. For the DCC, the cloud anvil is observed between 17:56:00 and 17:56:20 UTC. Later, increases sharply corresponding to the DCC core and decreases again towards the cloud edge. Figure 6 shows that the scatter is larger for the DCC case which is caused by the remaining effects of the cloud evolution. For the cirrus case, the scatter is significantly smaller because high cirrus typically change less rapidly.
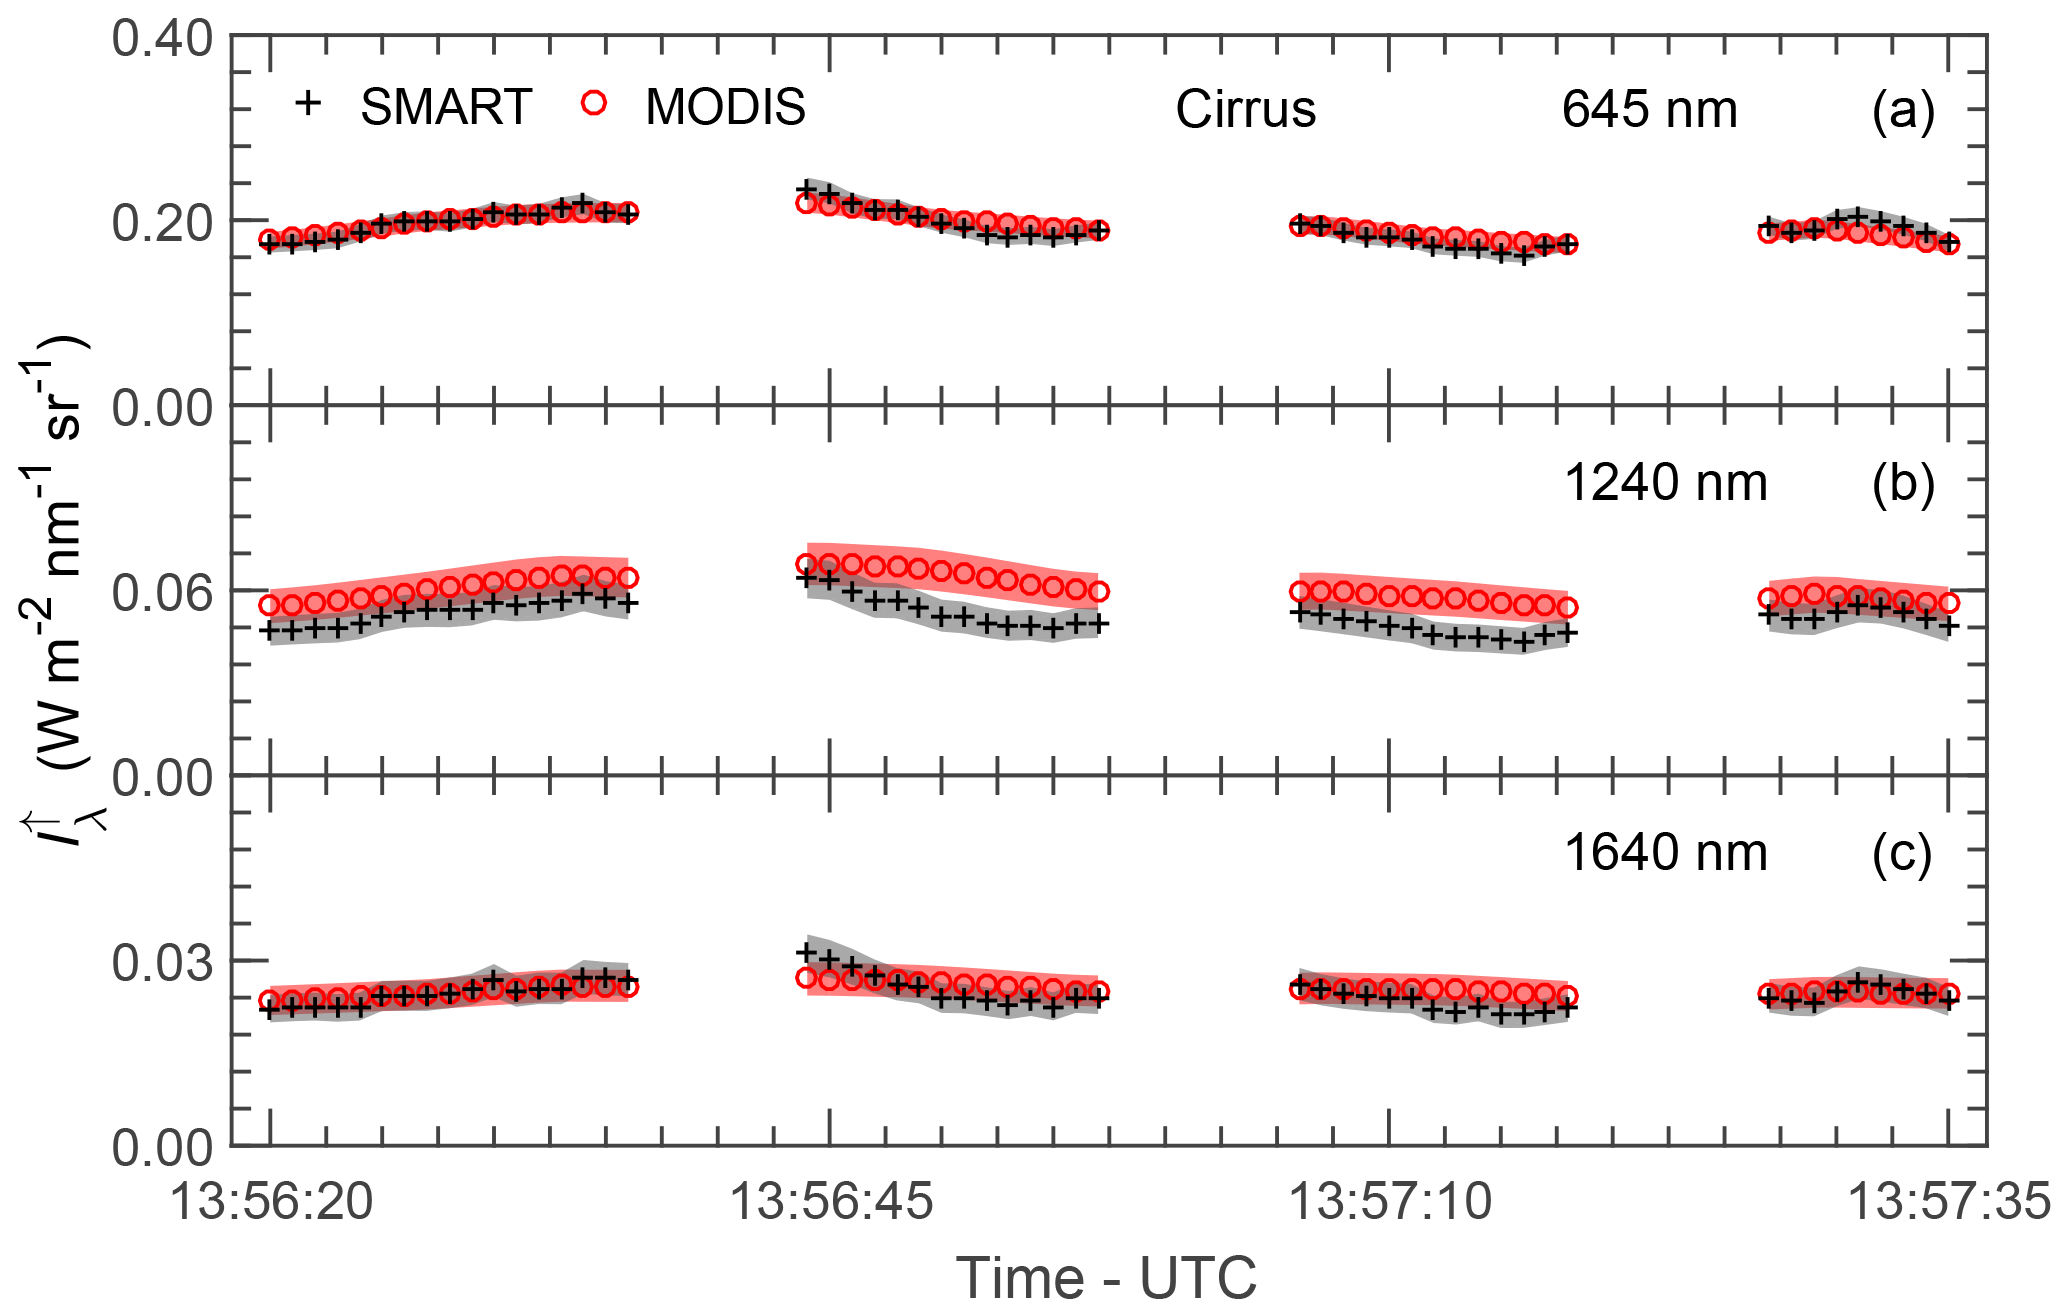
Figure 4Time series of centered at λ=645 nm (a), 1240 nm (b), and 1640 nm (c) measured by SMART (black) and MODIS (red) for the cirrus case. Shaded areas are measurement uncertainties. Gaps on the time series indicate when the shutter of SMART closed for dark current measurements.
Table 2Comparison of SMART and MODIS for the cirrus (ci) and DCC case. η is the mean standard deviation with the subscripts “S” for SMART and “M” for MODIS. ζ is the normalized mean absolute deviation between SMART and MODIS measurements.
Figure 7 shows the comparison of mean spectral upward radiance measured by SMART and MODIS for the cirrus (a) and DCC case (b). The solid line represents spectral radiance measured by SMART , while is the convoluted radiance of SMART using Eq. (1), and is the radiance measured by MODIS. The values of mean standard deviation η at each spectral wavelength are summarized in Table 2. Note that all standard deviation values in this paper refer to the ± values. To quantify the agreement, the normalized mean absolute deviation ζ is calculated by
where n is the number of observed values, xi are the individual values, and is the mean value of the radiances measured by SMART and MODIS along the selected time series. For the cirrus case, ζ645 is found to be 0.04 %, while ζ1240 and ζ1640 are 7.68 and 1.36 %, respectively. For the DCC case, ζ645 yields a value of 4.25 %, while ζ1240 and ζ1640 are 6.72 and 5.61 %, respectively. The good agreement between SMART and MODIS again justifies the application of the retrieval of MODIS band 6 using the parameterization given in Eq. (2). Overall, all the values of ζ in Table 2 lie within the measurement uncertainties. The comparison yields a better agreement for the cirrus than for the DCC case. The larger deviations in the case of DCC are not only influenced by the cloud evolution but also by larger 3-D radiative effects. Liang et al. (2009), Zhang and Platnick (2011), and King et al. (2013) estimated the influence of 3-D radiative effects using the cloud heterogeneity index σsub. The σsub is defined as a ratio between the standard deviation and the mean value of MODIS radiance band 2 (λ=858 nm and 250 m spatial resolution). For the cirrus case, the σsub results in a value of about 0.1. Higher heterogeneities are found for the DCC case with σsub of about 0.4. This shows that 3-D radiative effects are potentially larger for the DCC case and therefore have to be considered when interpreting the retrieval results from different instruments.
4.1 Radiance ratio retrieval and uncertainty estimation
A radiance ratio technique adapted from Werner et al. (2013) is applied to retrieve τ and reff of the cirrus and the DCC based on the nadir upward radiance measured by SMART and MODIS. In the case that radiance ratios are applied, the uncertainties are reduced because the uncertainties of the radiation source identically influence all measured radiances and therefore do not contribute to the uncertainty of the ratio. In the radiance ratio algorithm, the upward radiance at the MODIS bands centered at λ0=645 nm (band 1), λ1=1240 nm (band 5), and λ2=1640 nm (band 6) is employed to calculate the following radiance ratios, and .
In the retrieval algorithm, a decision tree is applied to select the retrieval mode. The retrieval can be performed either in the liquid water or ice mode. To decide which mode is used, a cloud phase index (Ip) is determined by the spectral slope method according to Jäkel et al. (2013). In this study, Ip is defined from the spectral slope of SMART radiance measurements at λ=1550 and 1700 nm, where the value is typically larger than zero for ice clouds. A threshold of 0.2 is used to discriminate between ice and liquid water clouds. For the cirrus case, time series of Ip calculated from the SMART observations yield values larger than 0.4 indicating ice clouds. This indicates that for the cirrus case the underlying liquid water clouds did not significantly influence Ip. Additionally, the high values of Ip show that Ip is mostly sensitive to the thermodynamic phase of the top cloud layer (cirrus), while the underlying liquid water clouds below the cirrus have a limited influence on the radiances within the wavelength range analyzed for the Ip. For the DCC case, Ip varies between 0.2 and 0.4 along the time series with a mean value of 0.25. Based on the high Ip values, the retrievals in both analyzed cloud cases are performed by assuming ice clouds.
Forward simulations of upward radiance have been performed by 1-D radiative transfer simulations using the radiative transfer package LibRadtran 2.0 (Mayer, 2005; Emde et al., 2016), the discrete ordinate radiative transfer solver (DISORT) version 2 (Stamnes et al., 2000), and assuming vertically homogeneous clouds. The atmospheric profiles of gases and constituents are adapted from the standard profile (Anderson et al., 1986) “mid-latitude” for ML-CIRRUS and “tropical” for ACRIDICON-CHUVA, and are adjusted to the radio sounding data (temperature and humidity) close to the measurement area. Extraterrestrial spectral irradiance is taken from Gueymard (2004). The standard aerosol particle profile for “spring/summer condition” of “maritime aerosol type” is applied (Shettle, 1989). For the cirrus case, the spectral surface albedo ρ of ocean implemented in the forward simulations was measured by SMART. For the DCC case, which is above Amazonian rainforest, no corresponding SMART albedo measurements at low altitude covering exactly the same flight path are available. In this area, the heterogeneity of the surface albedo is very high because forested and deforested areas are located close to each other. This implies that a representative assumption of a homogeneous surface for the whole flight legs is not appropriate. Therefore, ρ derived from the MODIS Bidirectional Reflectance Distribution Function (BRDF)/Albedo product (Strahler et al., 1999) is used to include the horizontal variability of the surface albedo of tropical rainforest.
In the forward simulations, the optical properties of liquid water droplets are derived from Mie calculation (Wiscombe, 1980). The assumption of ice crystal habit considers ice crystal shapes measured by the in situ probes during the two campaigns (Voigt et al., 2017; Järvinen et al., 2016). For the cirrus, representative ice crystal properties of a general habit mixture based on severely roughened aggregates (so-called GHM) by Baum et al. (2014) is applied, while for the DCC ice properties of plate with a high surface roughness (Yang et al., 2013) are assumed. These particle habits differ from the MODIS Collection 6 retrievals which use severely roughened compact aggregates of solid columns (so-called aggregated columns) by Yang et al. (2013). A sensitivity study infers that the retrievals assuming GHM and plate generally will result in a larger τ and smaller reff (not shown here), which is in agreement with findings by van Diedenhoven et al. (2014) and Holz et al. (2016). The radiance is simulated for both the actual flight altitude of HALO for the SMART measurements and the TOA for MODIS observations. Due to the high flight altitude, no significant differences are obtained.
For the cirrus case, a liquid water cloud layer is considered in the forward simulations due to the multilayer cloud situation. The properties of the liquid water cloud are estimated by comparing the entire spectral signature of the radiance measured by SMART and the simulations assuming different combinations of cloud properties. For the average of the selected time series, a simulation (not shown here) with a liquid water cloud located between 1.5 and 2 km, τ=8, and reff=10 µm shows the best agreements with the measurements particularly in the water vapor absorption bands (e.g., λ=940 and 1135 nm) and the O2 A band (λ=760 nm), which are sensitive to such multilayer cloud conditions (Rozanov and Kokhanovsky, 2004; Wind et al., 2010). The radiance lookup tables for the cirrus case are shown in Fig. 8a and b, whereas Fig. 8c and d are for the DCC case. The upward radiance at a non-absorbing wavelength is combined with ℜ1240 (combination 1 – C1) and with ℜ1640 (combination 2 – C2). is most sensitive to τ, while ratios ℜ1240 and ℜ1640 are most sensitive to reff. For the cirrus case, the lookup tables cover τ between 1 and 5, with steps of 1, and reff between 5 and 60 µm with steps of 3 µm. For the DCC case, the lookup tables cover τ between 6 and 40, with steps of 1 for τ between 6 and 22, and steps of 2 for τ between 24 and 40, while reff ranges between 5 and 90 µm, with steps of 3 µm for reff between 5 and 56 µm, and steps of 4 µm for reff between 60 and 90 µm.
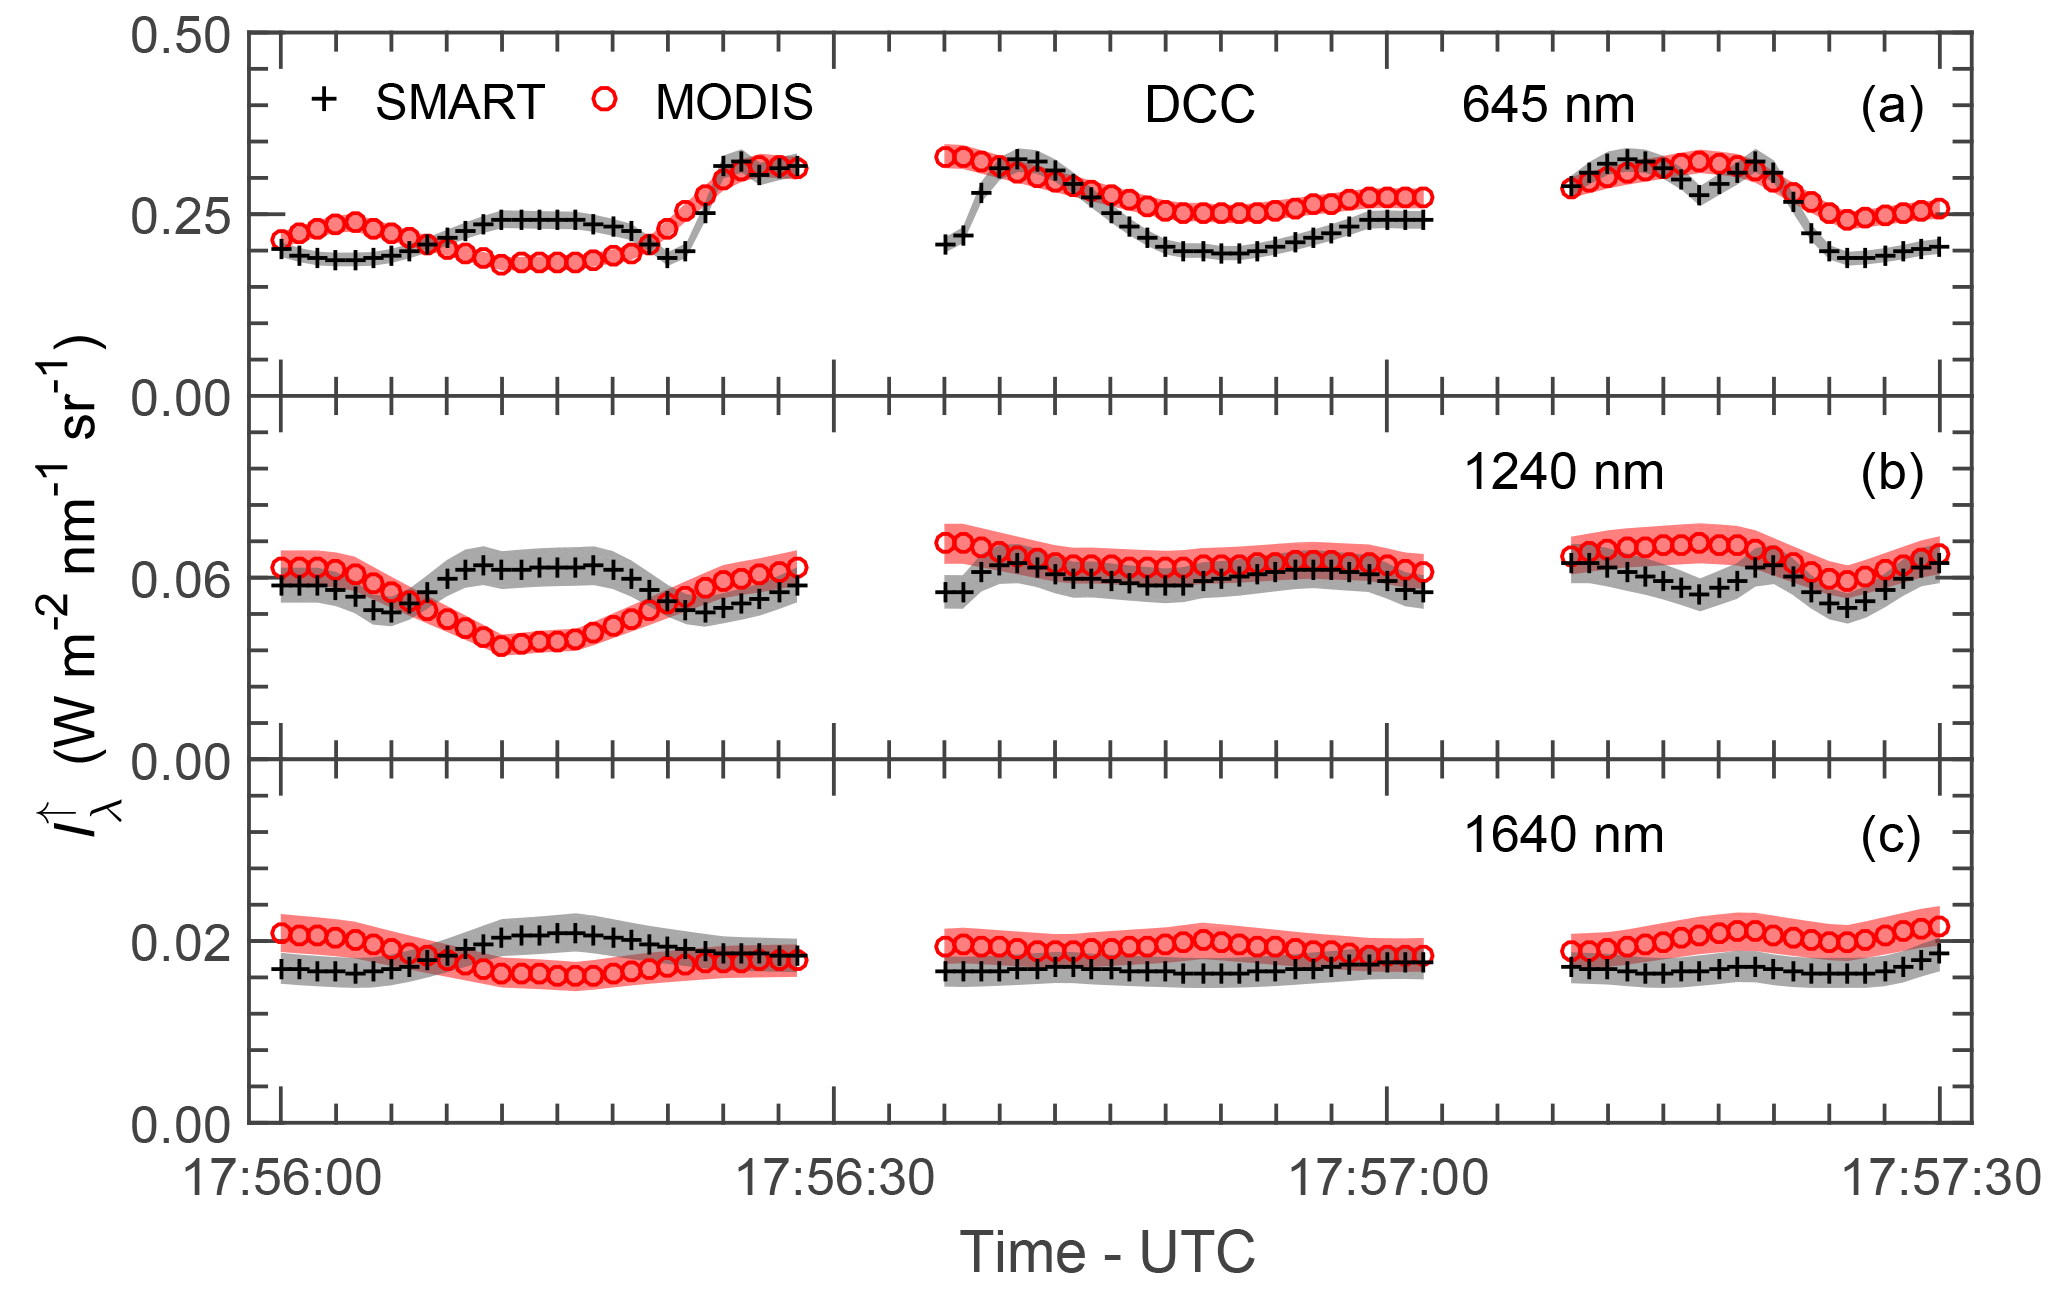
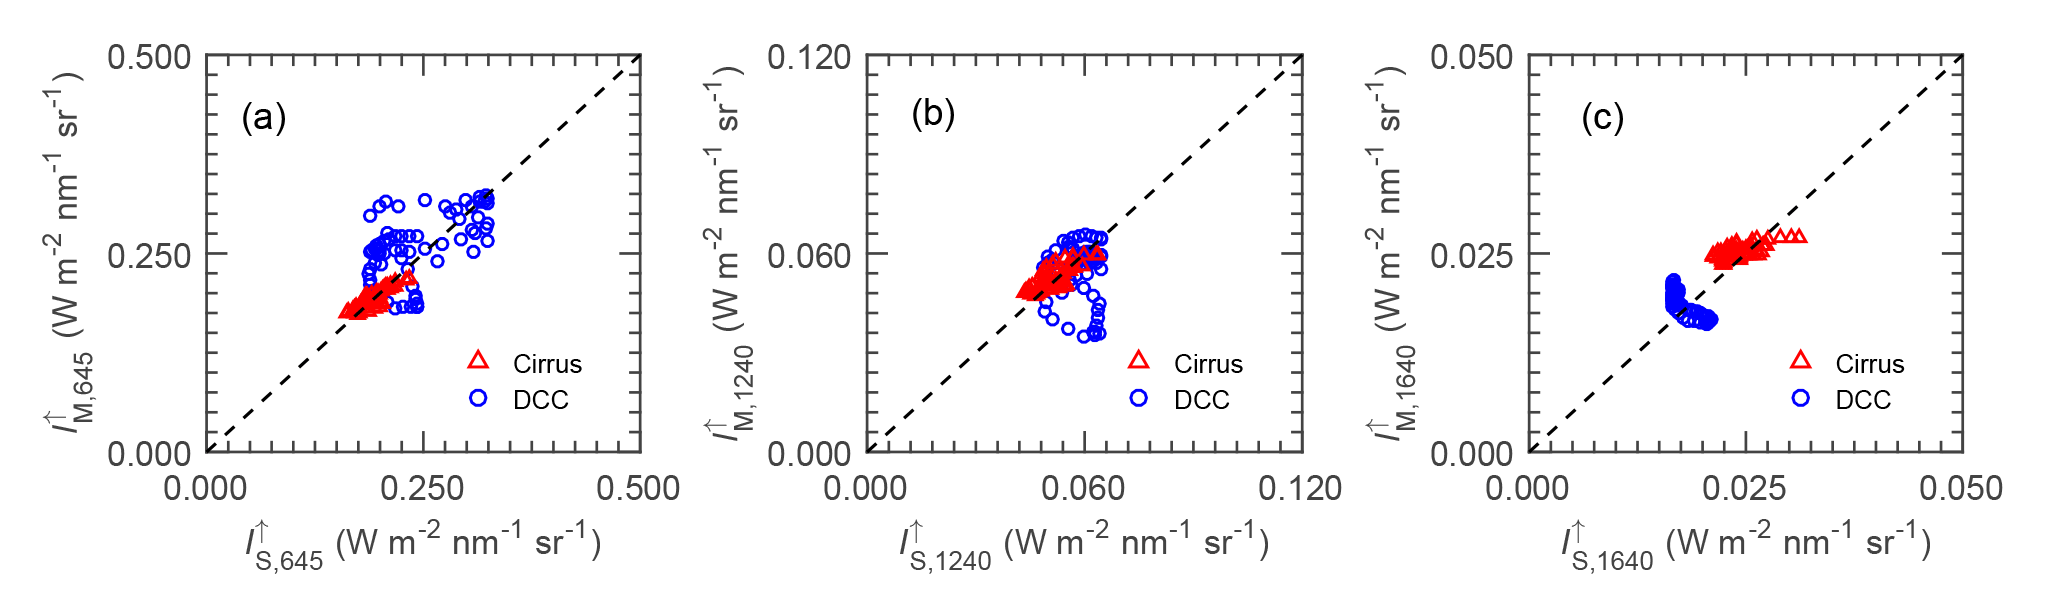
Figure 6Scatter plots of upward radiance centered at λ=645 nm (a), 1240 nm (b), and 1640 nm (c) measured by SMART and MODIS for the cirrus (red triangles) and the DCC (blue dots) case.
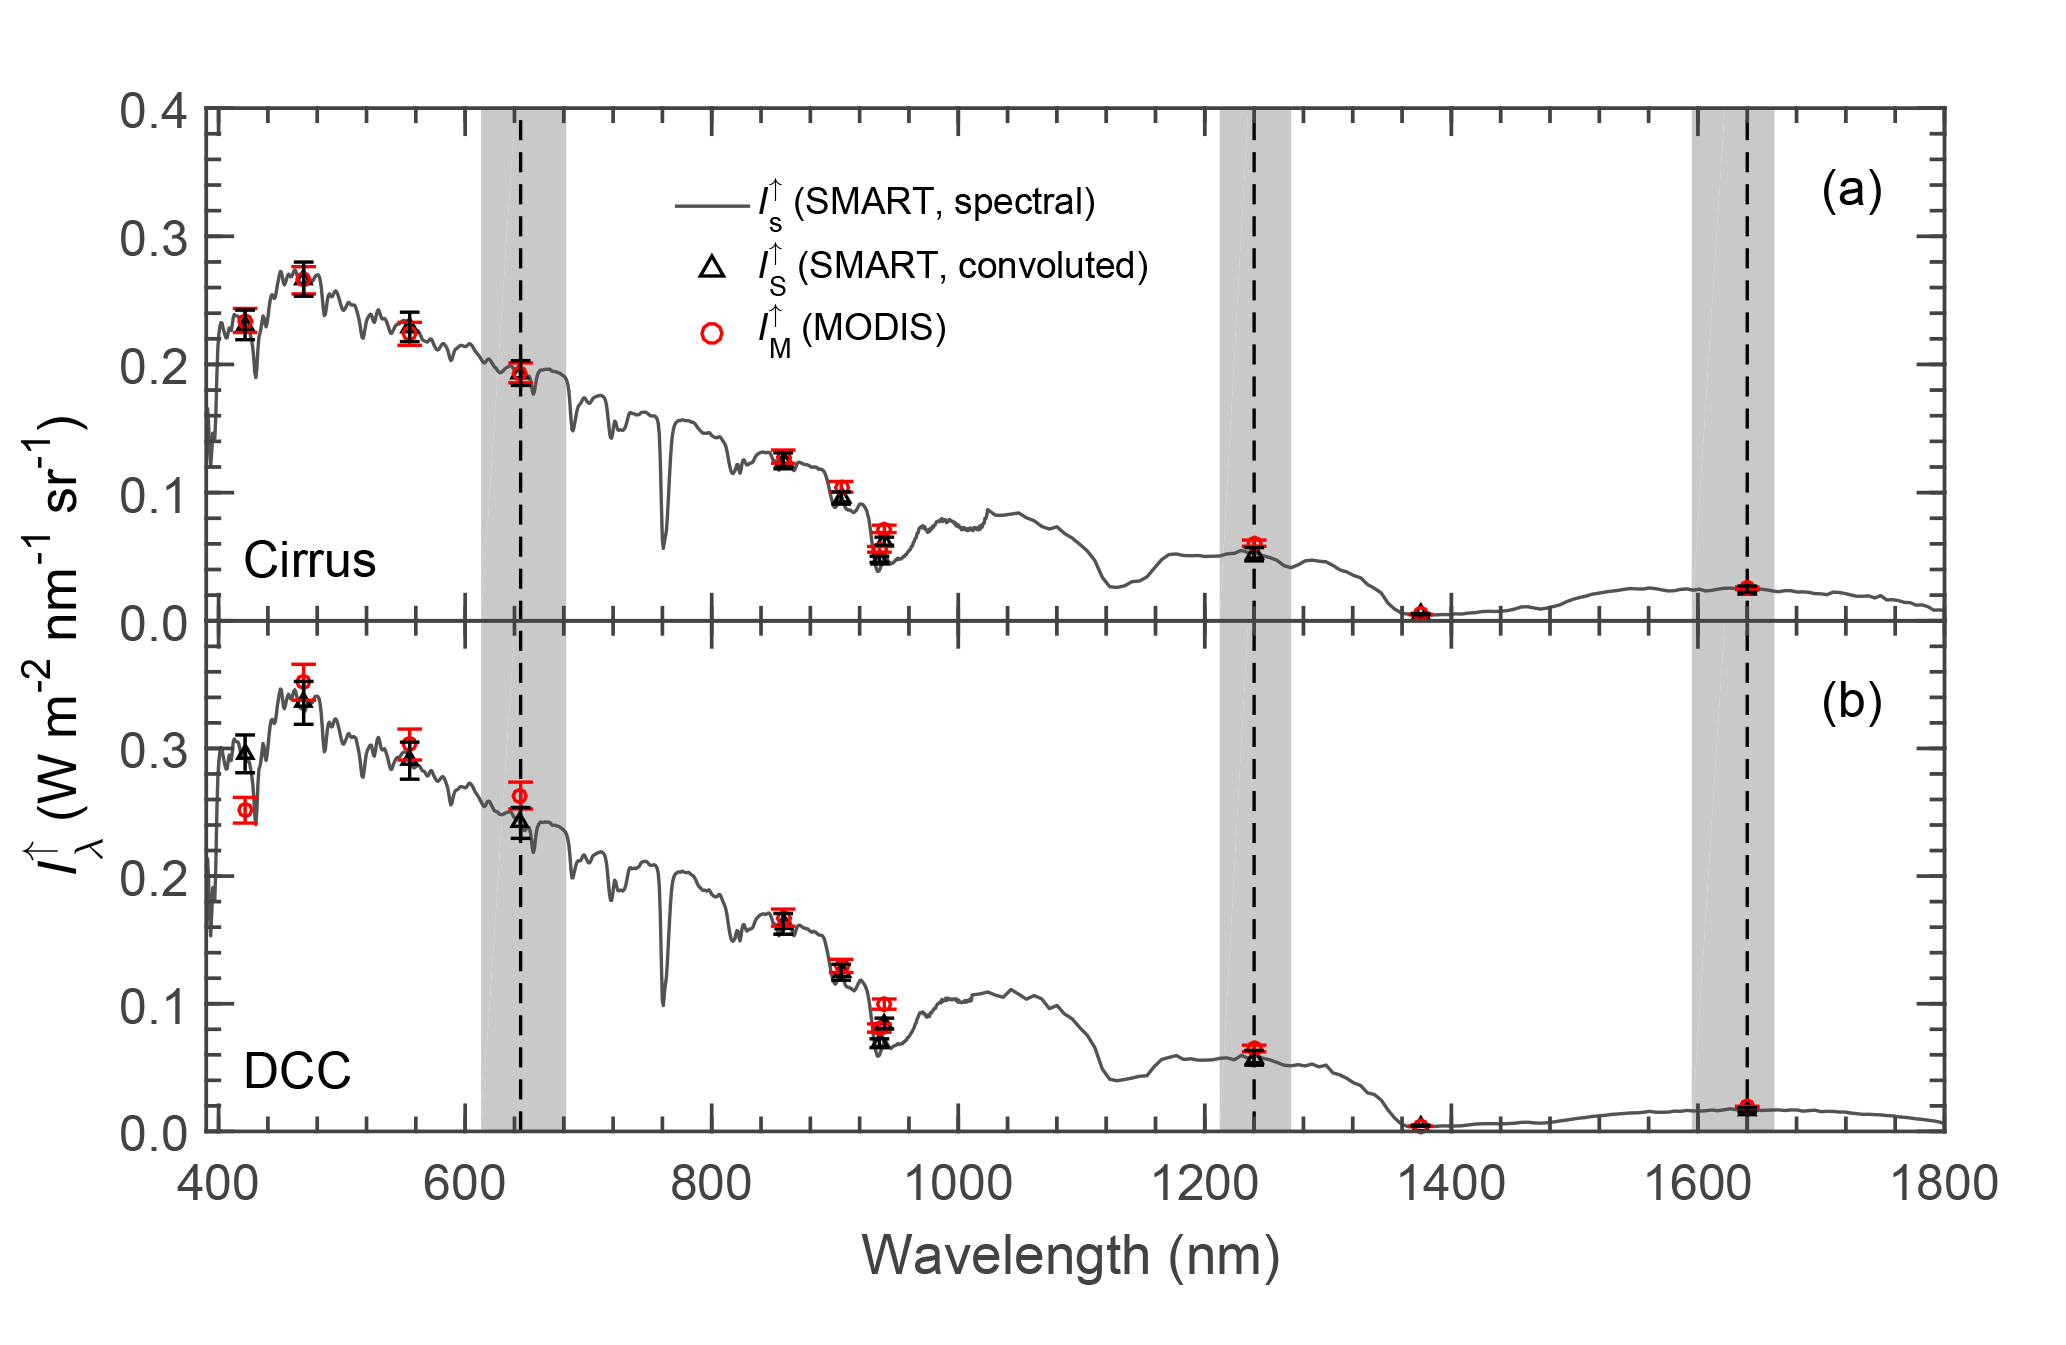
Figure 7Comparison of mean measured by SMART and MODIS for the cirrus case (a) and the DCC case (b) at λ between 400 and 1800 nm. Error bars represent measurement uncertainties. Wavelengths centered at λ=645, 1240, and 1640 nm are indicated by dashed lines, while grey bands correspond to the interval of MODIS relative spectral response R(λ) for the respective wavelengths.

Figure 8Radiance lookup tables for the cirrus case (a, b) and DCC case (c, d). Panels (a) and (c) are using C1 ( and ℜ1240), while (b) and (d) are using C2 ( and ℜ1640). For the cirrus case, the simulations are performed with θ0=37∘ and assuming GHM (Baum et al., 2014), while for the DCC case θ0=26∘ and the ice habit of plate (Yang et al., 2013) are applied. Radiance measurements of SMART and MODIS are illustrated by symbols.
The measurements of SMART (black crosses) and MODIS (blue circles) are included for both scenes in Fig. 8. For the combination C1, which is based on , the MODIS data do not match the lookup table solution space. The results in Sect. 3.3 show clearly that values are higher than by about 15 %. Using the original for the cirrus case, all the retrievals of reff fail because the measurements lie far outside the lookup table solution space (see Fig. 8a), while for the DCC case the retrieval failure is smaller (see Fig. 8c). Enhancing retrieval failure in the cirrus case is due to the larger θ0. At a larger θ0, the upward radiance becomes more insensitive to the changes of reff and consequently the lookup tables are denser. To gain meaningful retrieved cloud properties, a correction of is applied. Following Lyapustin et al. (2014), a correction factor g is calculated by the slope of linear regression between and , which results in g=0.88 for the cirrus case and g=0.90 for the DCC case. The corrected (red circles) are added in Fig. 8 and now match the solution space. Therefore, all following radiance ratio retrievals for the two selected cloud cases use these corrected .
In the radiance ratio method, measurement uncertainties of 4 % for and 6 % for ℜ1240 and ℜ1640 are considered. The retrieval uncertainties are estimated by considering the measurement uncertainties expressed by its double standard deviation (2σ). The retrieval is performed by varying each measurement separately by adding and subtracting 2σ, which results in four solutions. The median of the four solutions is used as the retrieval result of τ and reff, while the standard deviation is used to represent the retrieval uncertainties, Δτ for τ and Δreff for reff. Note that the retrievals of reff using C1 will result in larger uncertainties than by using C2 due to smaller absorption by cloud particles at λ=1240 nm. As a result, the lookup tables of reff for C1 are more narrow. At a given 6 % measurement uncertainty of ℜ1240, a retrieval of reff can result in uncertainties up to 50 %.
4.2 Impact of underlying liquid layer clouds on the cirrus retrieval
For the cirrus case, the properties of the low liquid water cloud are assumed to be constant along the flight legs. This assumption might not hold in reality and affect the retrieved cirrus properties. Therefore, the sensitivity of the cirrus retrieval to the assumed properties of the low liquid water cloud is quantified using radiative transfer simulations. Spectral upward radiances are simulated for different combinations of the liquid water cloud and cirrus properties. The liquid water cloud is varied for τliq=6–10 (steps of 1) and –14 µm (steps of 2 µm), while the cirrus is changed for τci=2–8 (steps of 1 µm) and –40 µm (steps of 5). These simulated upward radiances are used as synthetic measurements and analyzed with the retrieval algorithm using C2 ( and ℜ1640), which assumes a liquid water cloud with τliq=8 and µm. The comparison of synthetically retrieved and original τci and reff,ci is shown in Fig. 9. Above one-to-one line is when the retrieval is run with an underestimation, while below the one-to-one line is with an overestimation of the properties of the low liquid water cloud. The retrieved τci values are analyzed in Fig. 9a for different τliq, while reff,ci and reff,liq are fixed to 20 and 10 µm, respectively. Similarly, the retrieved reff,ci values are analyzed in Fig. 9b for different reff,liq but for a fixed combination of τci=3 and τliq=8. In general, the results show that an overestimation of τliq leads to an underestimation of τci because, in this case, the liquid water cloud contributes more strongly to the reflected radiation than in reality. Therefore, a smaller τci is required to match the measurement, and vice versa. For the range of τci analyzed here, the retrieved τci is found to be over- or underestimated by 1.3, when in reality τliq is 6 or 10, while the retrieval assumes τliq=8. These biases show that τliq needs to be estimated accurately because a wrong assumption of τliq almost directly propagates in the uncertainties of τci.
A similar behavior is found for the retrieval of reff,ci, where an overestimation of reff,liq leads to an underestimation of reff,ci, and vice versa. Assuming larger liquid droplets than in reality implies that these droplets contribute more strongly to the measured absorption at λ=1640 nm, and therefore the ice crystals only contribute less (smaller reff,ci). Figure 9b illustrates that the impact of reff,liq is strongest when small liquid droplets (reff,liq ≤ 8 µm) are present. For larger liquid droplets ( µm), the impact is reduced. The maximum uncertainties of reff,ci found for the range of reff,ci and reff,liq considered here are about 8 µm for the underestimation of reff,liq, which show a tendency of higher uncertainties for higher reff,ci. The retrieval of reff,ci is less affected by reff,liq, when the cirrus layer is sufficiently thick (τci>5) since then the cirrus layer will dominate the reflected radiation in the absorption bands.
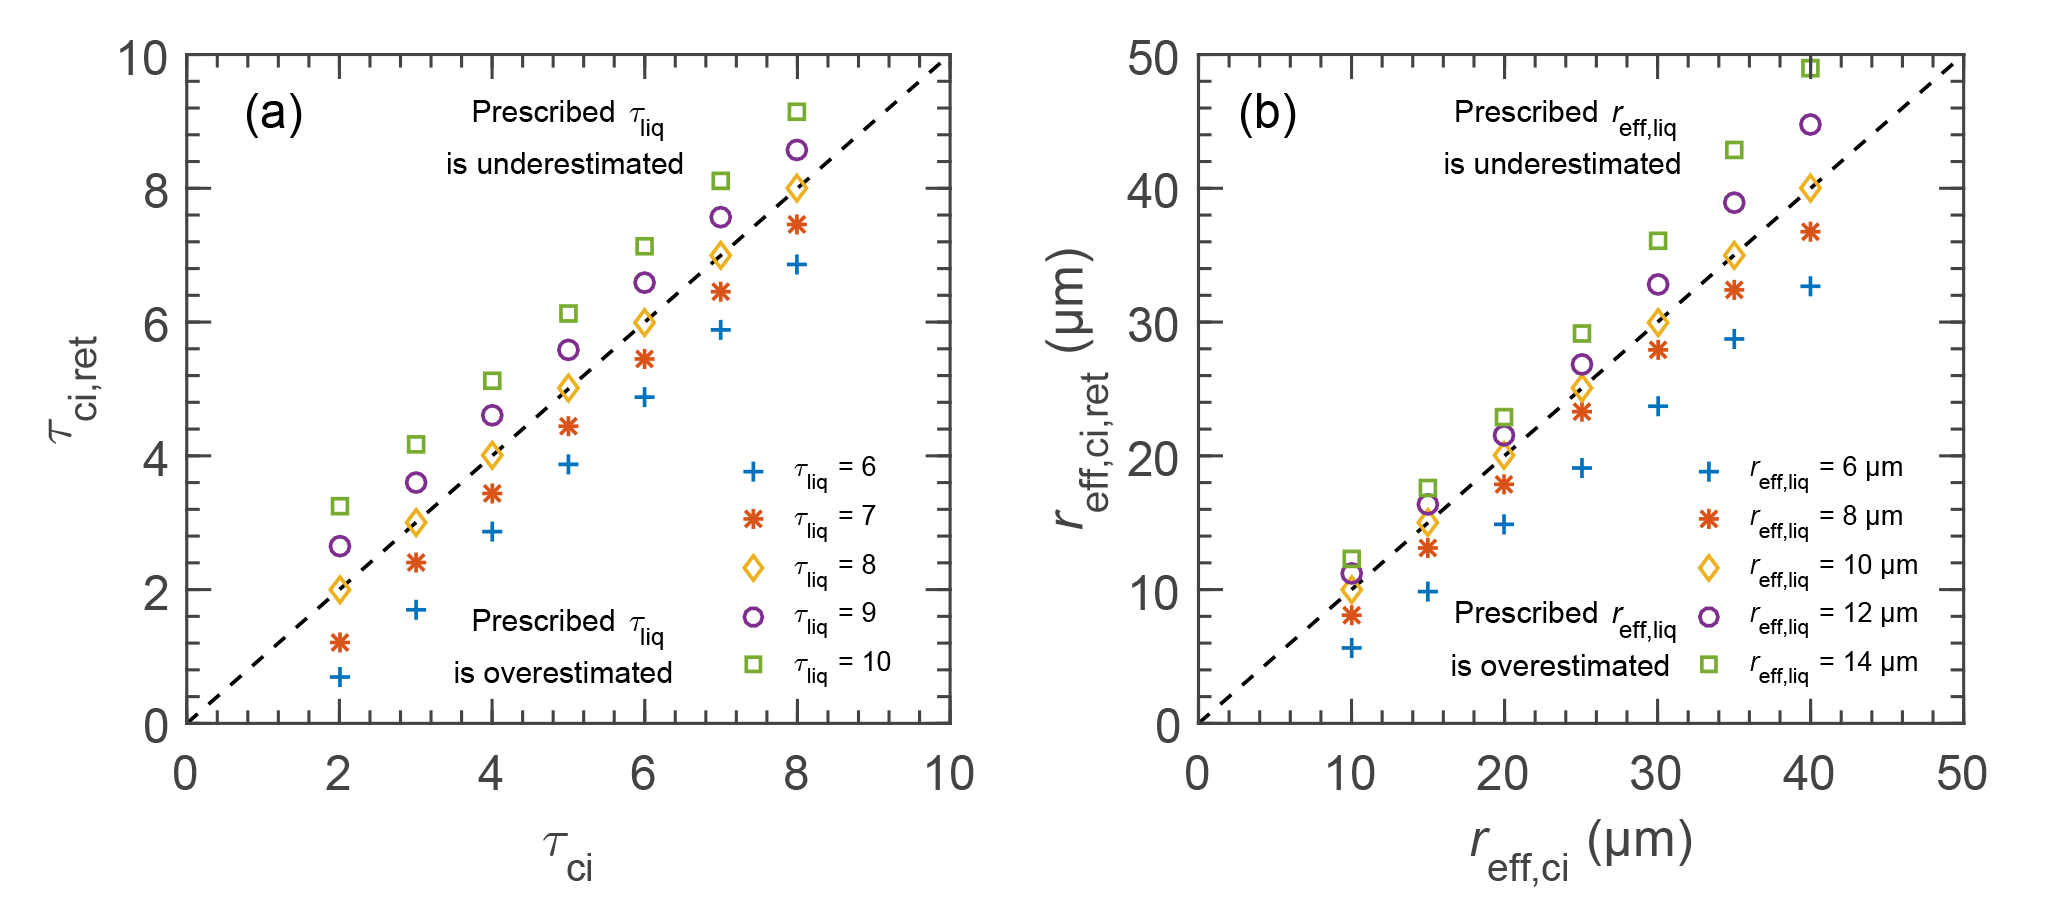
Figure 9Comparison of synthetically retrieved τci (a) and reff,ci (b). Calculations in panel (a) are performed by changing τliq, while the original value is 8. µm and µm are fixed. In panel (b), reff,liq is changed, while the original value is 10 µm. τci=3 and τliq=8 are fixed.
4.3 Forward simulation of vertically inhomogeneous clouds
It is known from measurements that cloud particle sizes can significantly vary with altitude. For non-precipitating ice clouds, ice crystal sizes typically decrease as a function of altitude (e.g., Heymsfield et al., 2017). However, to simplify the retrieval algorithm, vertically homogeneous clouds are commonly assumed in the forward radiative transfer simulations. To quantify the effects of such simplifications, simulations with vertically inhomogeneous ice clouds are performed. Analytical profiles of effective radius as a function of geometrical height are developed using a modified parameterization that was originally proposed by Platnick (2000):
where the altitude z ranges from 0 at the cloud base to h at the cloud top. The parameters , , and are determined from prescribed boundary conditions of the cloud top effective radius reff,t and the cloud base effective radius reff,b. To represent a typical vertical structure of ice clouds, k=3 is chosen. The profiles of effective radius are coupled with the profiles of ice water content, which typically decrease as a function of altitude in ice clouds.
Table 3Total optical thickness τc, effective radius at the cloud top reff,t and cloud base reff,b, and IWC from the cloud base to the cloud top. zb and zt are the altitudes of the cloud base and cloud top, respectively. Retrieved reff,ret is compared to the weighting estimate for two near-infrared wavelengths at λ=1240 and 1640 nm.
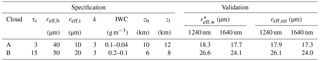
Figure 10a and b show the profile of effective radius for a representative cirrus (cloud A) and a DCC composed of ice particles only (cloud B). The cloud profiles are divided into 20 layers for the implementation in the radiative transfer simulation, where each layer has a homogeneous thin layer of dτ=0.15 for cloud A and 0.75 for cloud B. The parameters used to set up both clouds A and B are summarized in Table 3. Forward radiative transfer simulations are performed to calculate spectral upward radiance above the cloud using an adding-superposition technique from the cloud top to the cloud base.
4.4 Vertical weighting function
The vertical photon transport depends on the absorption characteristics at the considered wavelengths. With increasing absorption, the probability of a photon being scattered back out of the cloud without being absorbed decreases. Thus, utilizing different near-infrared wavelengths with different absorption characteristics in the retrieval will result reff from different altitudes in the cloud (King et al., 2013). To quantify this effect, the vertical weighting function wm is investigated. The wm describes the contribution of each cloud layer to the absorption considering multiple scattering (Platnick, 2000). Therefore, it can be used to characterize the cloud level where the retrieved reff is most representative. For nadir observation, wm as a function of optical thickness τ is expressed by
I is the radiance above the cloud and τc is the total cloud optical thickness. Platnick (2000) showed that wm can be used to estimate the retrieved value of effective radius (so-called weighting estimate) from a given profile of reff(τ) by
The wm calculated for clouds A and B is shown in Fig. 10c and d, respectively. For cloud A with τc=3, it is found that wm for λ=1240 and 1640 nm is almost homogeneously distributed along the entire profile. Each cloud layer has nearly equal contribution to the absorption and therefore to the retrieved reff. However, for cloud B with τc=15, the upper cloud layers contribute most to the absorption. wm profiles for clouds A and B show that for λ=1640 nm the maximum is found closer to the cloud top, while for λ=1240 nm it is located in a deeper layer. This illustrates, that a retrieval of reff using λ=1640 nm will result in an reff that represents particle sizes located at a higher altitude compared to λ=1240 nm. For the two idealized cloud cases (clouds A and B), this would in general lead to reff,1640 < reff,1240. Additionally, the results show clearly that each cloud layer has a contribution to the absorption. Therefore, it should be noted that reff retrieved by this technique does not represent a particle size at a single cloud layer only.

Figure 10Panel (a) shows an analytic reff profile of a cirrus (cloud A) while (b) is for a DCC composed of ice particles only (cloud B). Detailed specifications of the two analytic profiles are summarized in Table 3. Panel (c) is the wm calculated for cloud A at λ=1240 and 1640 nm, while (d) is for cloud B.
Figure 11a shows the wm calculated for cloud A at λ=1000–2000 nm, while Fig. 11b is the single scattering albedo of GHM with reff of 10 and 15 µm. The strongly depends on reff and describes the degree of absorption by cloud particles at each individual wavelength. The is smaller for larger particles, and therefore the absorption is higher. The wm at each individual cloud layer clearly shows a wavelength dependence. For a wavelength with smaller (high absorption by cloud particles), the maximum of wm is located closer to the cloud top. In contrast, for a wavelength with ≈ 1 (small absorption by cloud particles), the wm in the lower layers significantly increases and the maximum wm is reduced correspondingly. Figure 11a also shows that spectral measurements in the near-infrared wavelengths offer more information on the particle sizes located in different cloud altitudes.
It is found that wm is a function of the cloud profile itself. Assuming a vertically homogeneous profile in the forward simulation will result in different wm compared to assuming a realistic profile. This may lead to discrepancies in the reff retrieved using both assumptions. With the help of wm, possible impacts are investigated by comparing the weighting estimate and the retrieved reff,ret using λ=1240 and 1640 nm. Radiances above clouds A and B calculated for the entire cloud layer , as described in Sect. 4.3, serve as synthetic measurements for the radiance ratio retrieval. Both combinations, C1 (1240 nm) and C2 (1640 nm), are employed. The resulting and reff,ret are summarized in Table 3. The absolute deviation between and is 0.4 µm for cloud A and 0.5 µm for cloud B. Between and , the absolute deviation is 0.4 µm for cloud A and 0.1 µm for cloud B. The reff retrieved by using measurements at λ=1640 nm is consistently smaller than λ=1240 nm, which agrees with a condition where the particle size decreases towards the cloud top.
The comparisons between and reff,ret for clouds A and B yield a systematic deviation. It is found that retrievals using a vertically homogeneous assumption result in a slight underestimation of reff,ret compared to which assumes a realistic cloud profile with decreasing particle size towards the cloud top. For the two realistic profiles (clouds A and B), larger particles with higher absorption are located in the lower layers. Consequently, wm in the lower cloud layers becomes higher, while wm in the upper cloud layers is slightly smaller compared to a vertically homogeneous cloud profile (not shown here). Nevertheless, the impact of the vertical profile assumption will reduce for retrievals using wavelengths with higher absorption by cloud particles such as λ=1640 nm.
4.5 Impact of underlying liquid water cloud on the vertical weighting function
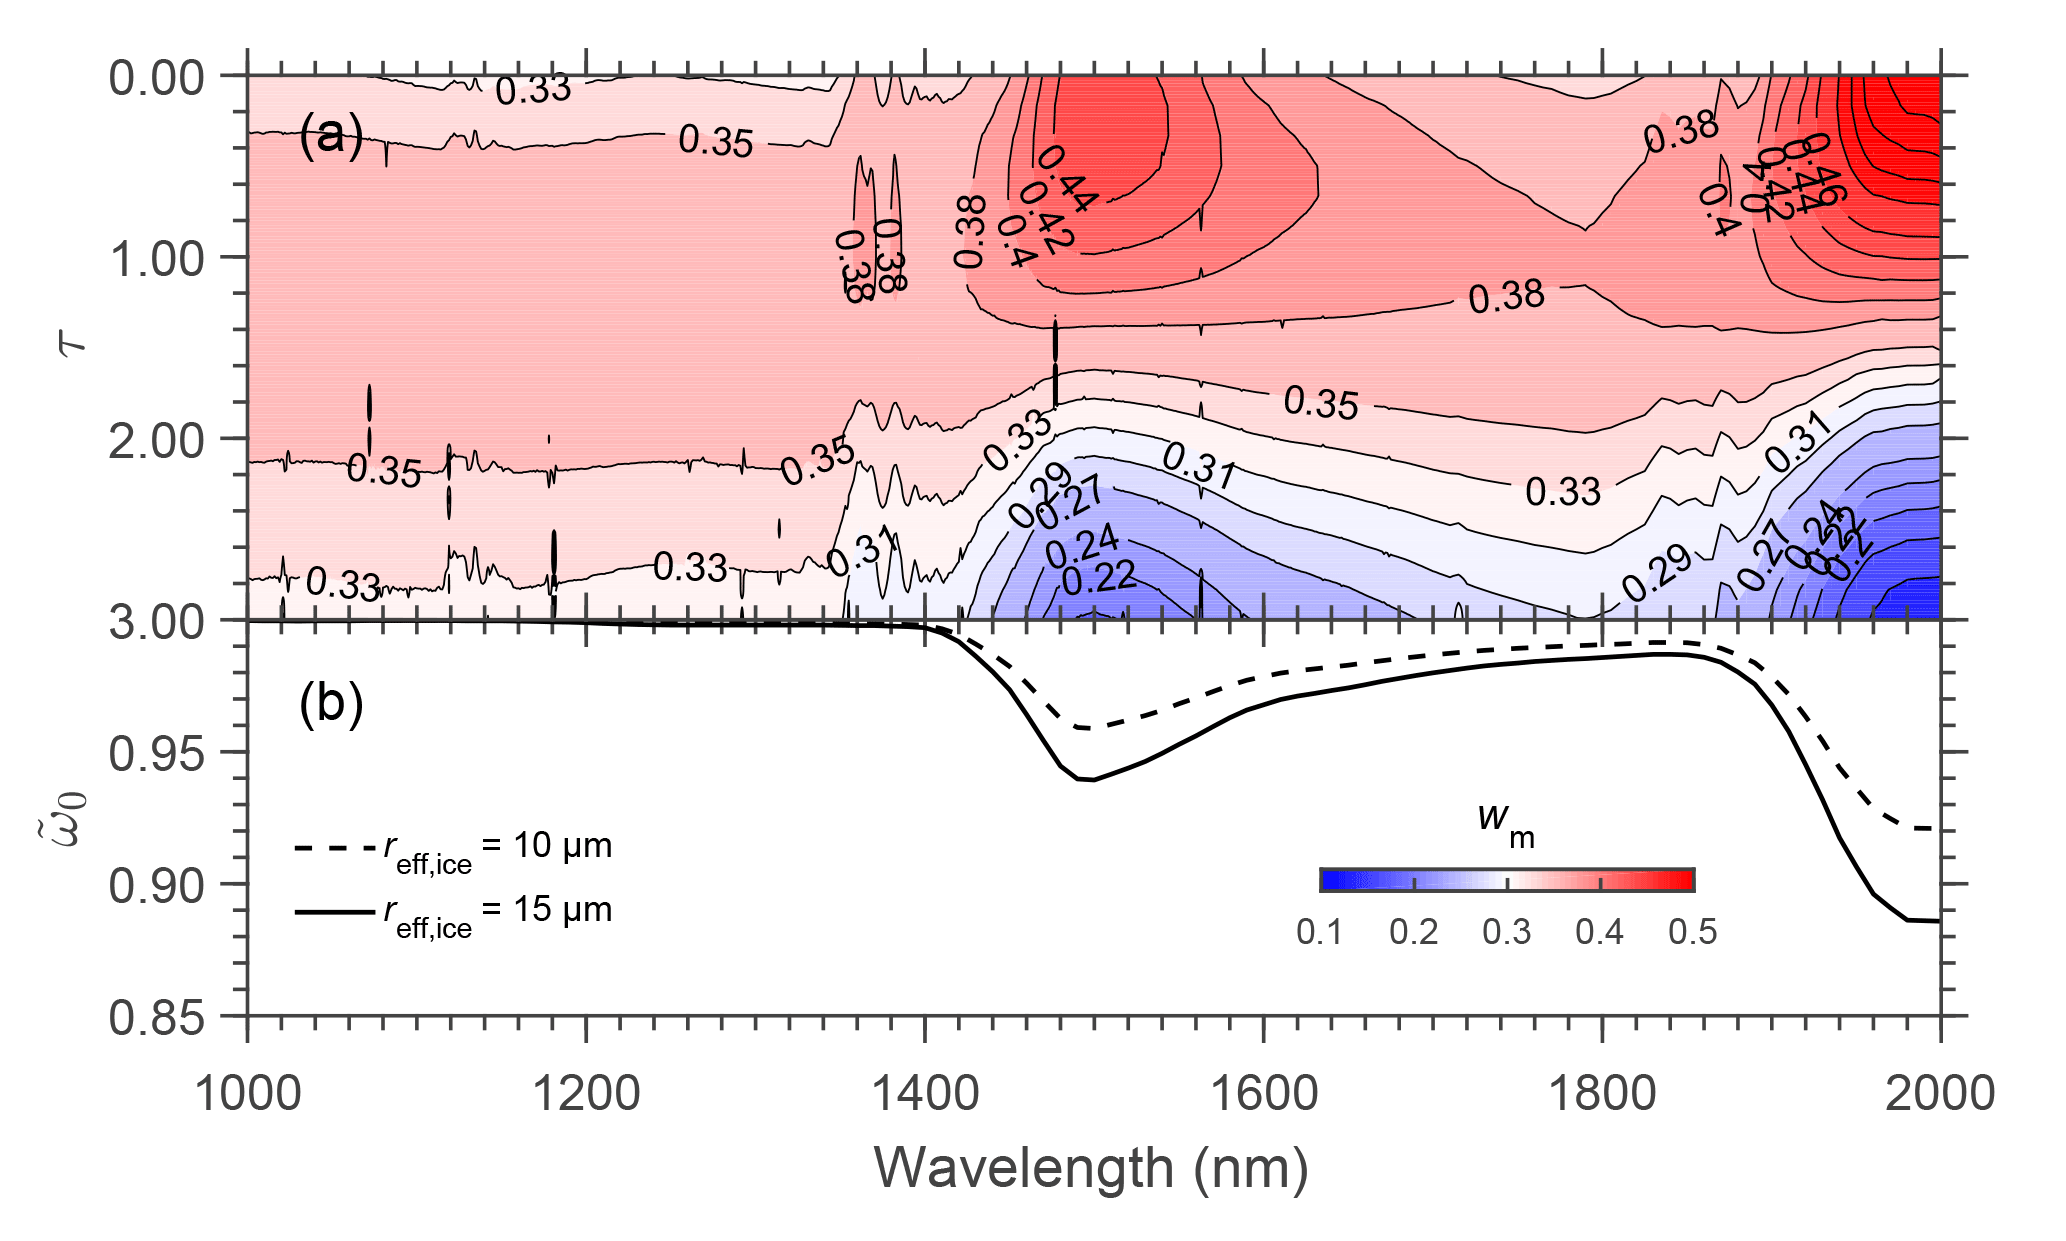
Figure 11(a) The wm calculated for cloud A at λ=1000–2000 nm. The color represents the weighting. (b) Single scattering albedo of GHM (Baum et al., 2014) with reff = 10 µm (dashed line) and 15 µm (solid line).
The changes of the wm due to the presence of liquid water clouds below clouds A and B are investigated. Therefore, the calculations of wm for clouds A and B presented in Sect. 4.4 are repeated by adding a liquid water cloud layer. For cloud A, the liquid water cloud is located between 1.5 and 2 km, with τ=8 and reff=10 µm, which represent a cirrus above a low liquid water cloud. For cloud B, the liquid water cloud is located between 5 and 6 km with τ=15 and reff=15 µm, which represents a DCC topped by an anvil cirrus, where the lower core of DCC is assumed to be a liquid water cloud. For simplification, the profiles of the liquid water cloud are assumed to be vertically homogeneous. For comparison, wm values are calculated and normalized for the ice cloud only. Figure 12a and b show wm at λ=1240 nm (black) and 1640 nm (red) calculated for cloud A and cloud B in a condition with (solid line) and without (dashed line) the presence of the liquid water cloud. Additionally, the single scattering albedo of GHM (blue) and liquid droplets (red) with reff of 10 µm (dashed line) and 15 µm (solid line) is displayed in Fig. 12c.
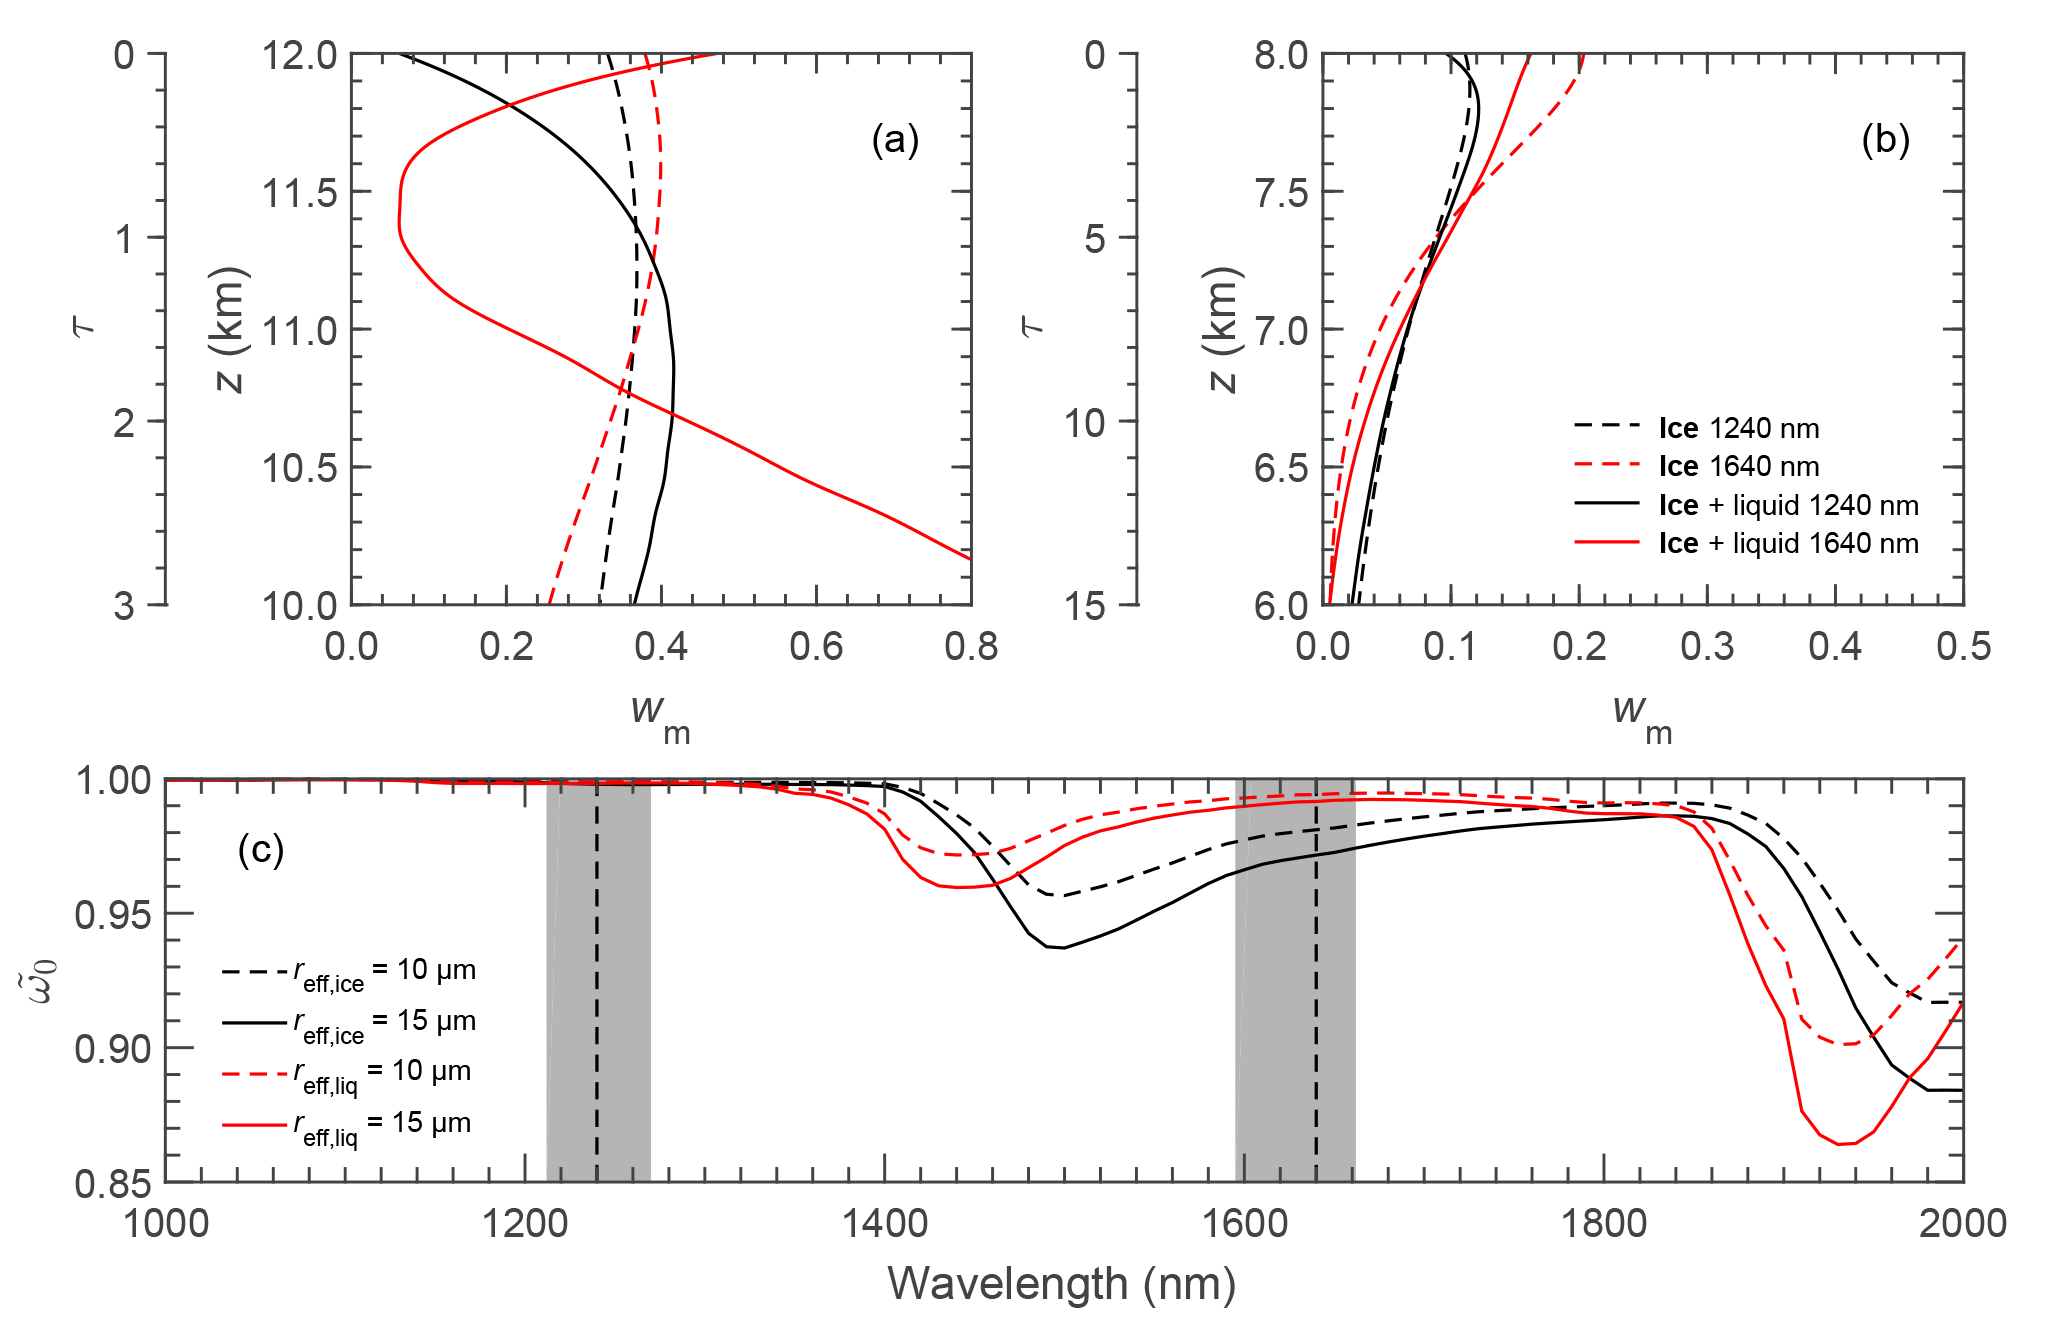
Figure 12(a) The wm calculated for cloud A at λ=1240 and 1640 nm, while panel (b) is for cloud B. Solid line and dashed line describe wm calculated with and without the presence of underlying liquid water cloud, respectively. (c) Single scattering albedo of GHM and liquid water droplets with reff of 10 and 15 µm.
According to Platnick (2000), it is expected that the low liquid water cloud changes wm similar to a bright surface, where the maximum weighting at cloud top will be reduced and shifted to a lower altitude due to the enhanced reflection of transmitted radiation back to the cloud base eventually reaching the sensor above cloud top. Consequently, this will result in a larger retrieved reff for clouds with decreasing particle size towards the cloud top. The results in Fig. 12a and b show that this indeed holds for the wm at λ=1240 nm where scattering by cloud particles dominates. For clouds A and B, the maximum of wm is shifted to lower altitudes due to multiple reflections of radiation between the surface (liquid water cloud) and cloud base (ice cloud). The wm at λ=1640 nm changes differently when adding a liquid water cloud below the ice cloud. The changes of wm for cloud A are significantly larger compared to cloud B. This behavior results from the stronger absorption by the ice particles at λ=1640 nm. For optically thick cloud B with τc=15, the ice cloud does not transmit sufficient radiation to have a strong interaction with the low-level cloud which leads to a similar wm. In contrast, wm at cloud top is modified for optically thin cloud A with τc=3 due to the underlying liquid water cloud. Here, the different particle phase and size of the liquid water cloud layer lead to a reduction of the upward radiance when an ice cloud layer is added to the simulations. Given that small liquid droplets have a higher at λ=1640 nm, the liquid water cloud alone reflects more strongly than it does together with the ice cloud which adds large ice crystals characterized by smaller reducing the total . Decreasing strongly contributes to the wm close to the cloud top, while at about τ=1 the minimum of wm is observed where changes only slightly. Below τ=1 (lower altitudes), the impact of the liquid water cloud vanishes and scattering by the ice particles increases again corresponding to higher wm towards cloud base. In general, a similar behavior is imprinted in the wm of cloud B but not relevant for the entire wm due to the higher τc of the ice cloud. This also demonstrates that for optically thick clouds such as the DCC case investigated in this study, a retrieval assuming only ice cloud can be applied to retrieve reff of the uppermost cloud layer, even if liquid water clouds are present below the ice cloud layer.
4.6 Comparison of optical thickness and effective radius retrieved by SMART and MODIS
Time series of τ and reff retrieved from SMART and MODIS radiance measurements, along with the MODIS cloud product, are compared for the two cloud cases. The MODIS cloud product, namely MYD06_L2, provides three different reff values (so-called , , and ), which are retrieved using respective near-infrared wavelengths centered at λ=1640, 2130, and 3700 nm (Platnick et al., 2017). However, the information of is very limited due to problems of the detectors, and therefore it cannot be used in this comparison. Due to the similar ice crystal absorption at λ=1640 and 2130 nm, both wavelengths have an almost identical wm (Wang et al., 2009; Zhang et al., 2010). For typical cloud profiles analyzed in Sect. 4.4, the differences of reff retrieved using λ=1640 and 2130 nm are less than 1 µm. Therefore, can be compared with SMART and MODIS reff retrieved using C2 (1640 nm). For observations over land, the MODIS algorithm combines the reflectivity at λ=645 and 2130 nm (combination 3 – C3), while over the ocean, it combines the reflectivity at λ=858 and 2130 nm (combination 4 – C4).
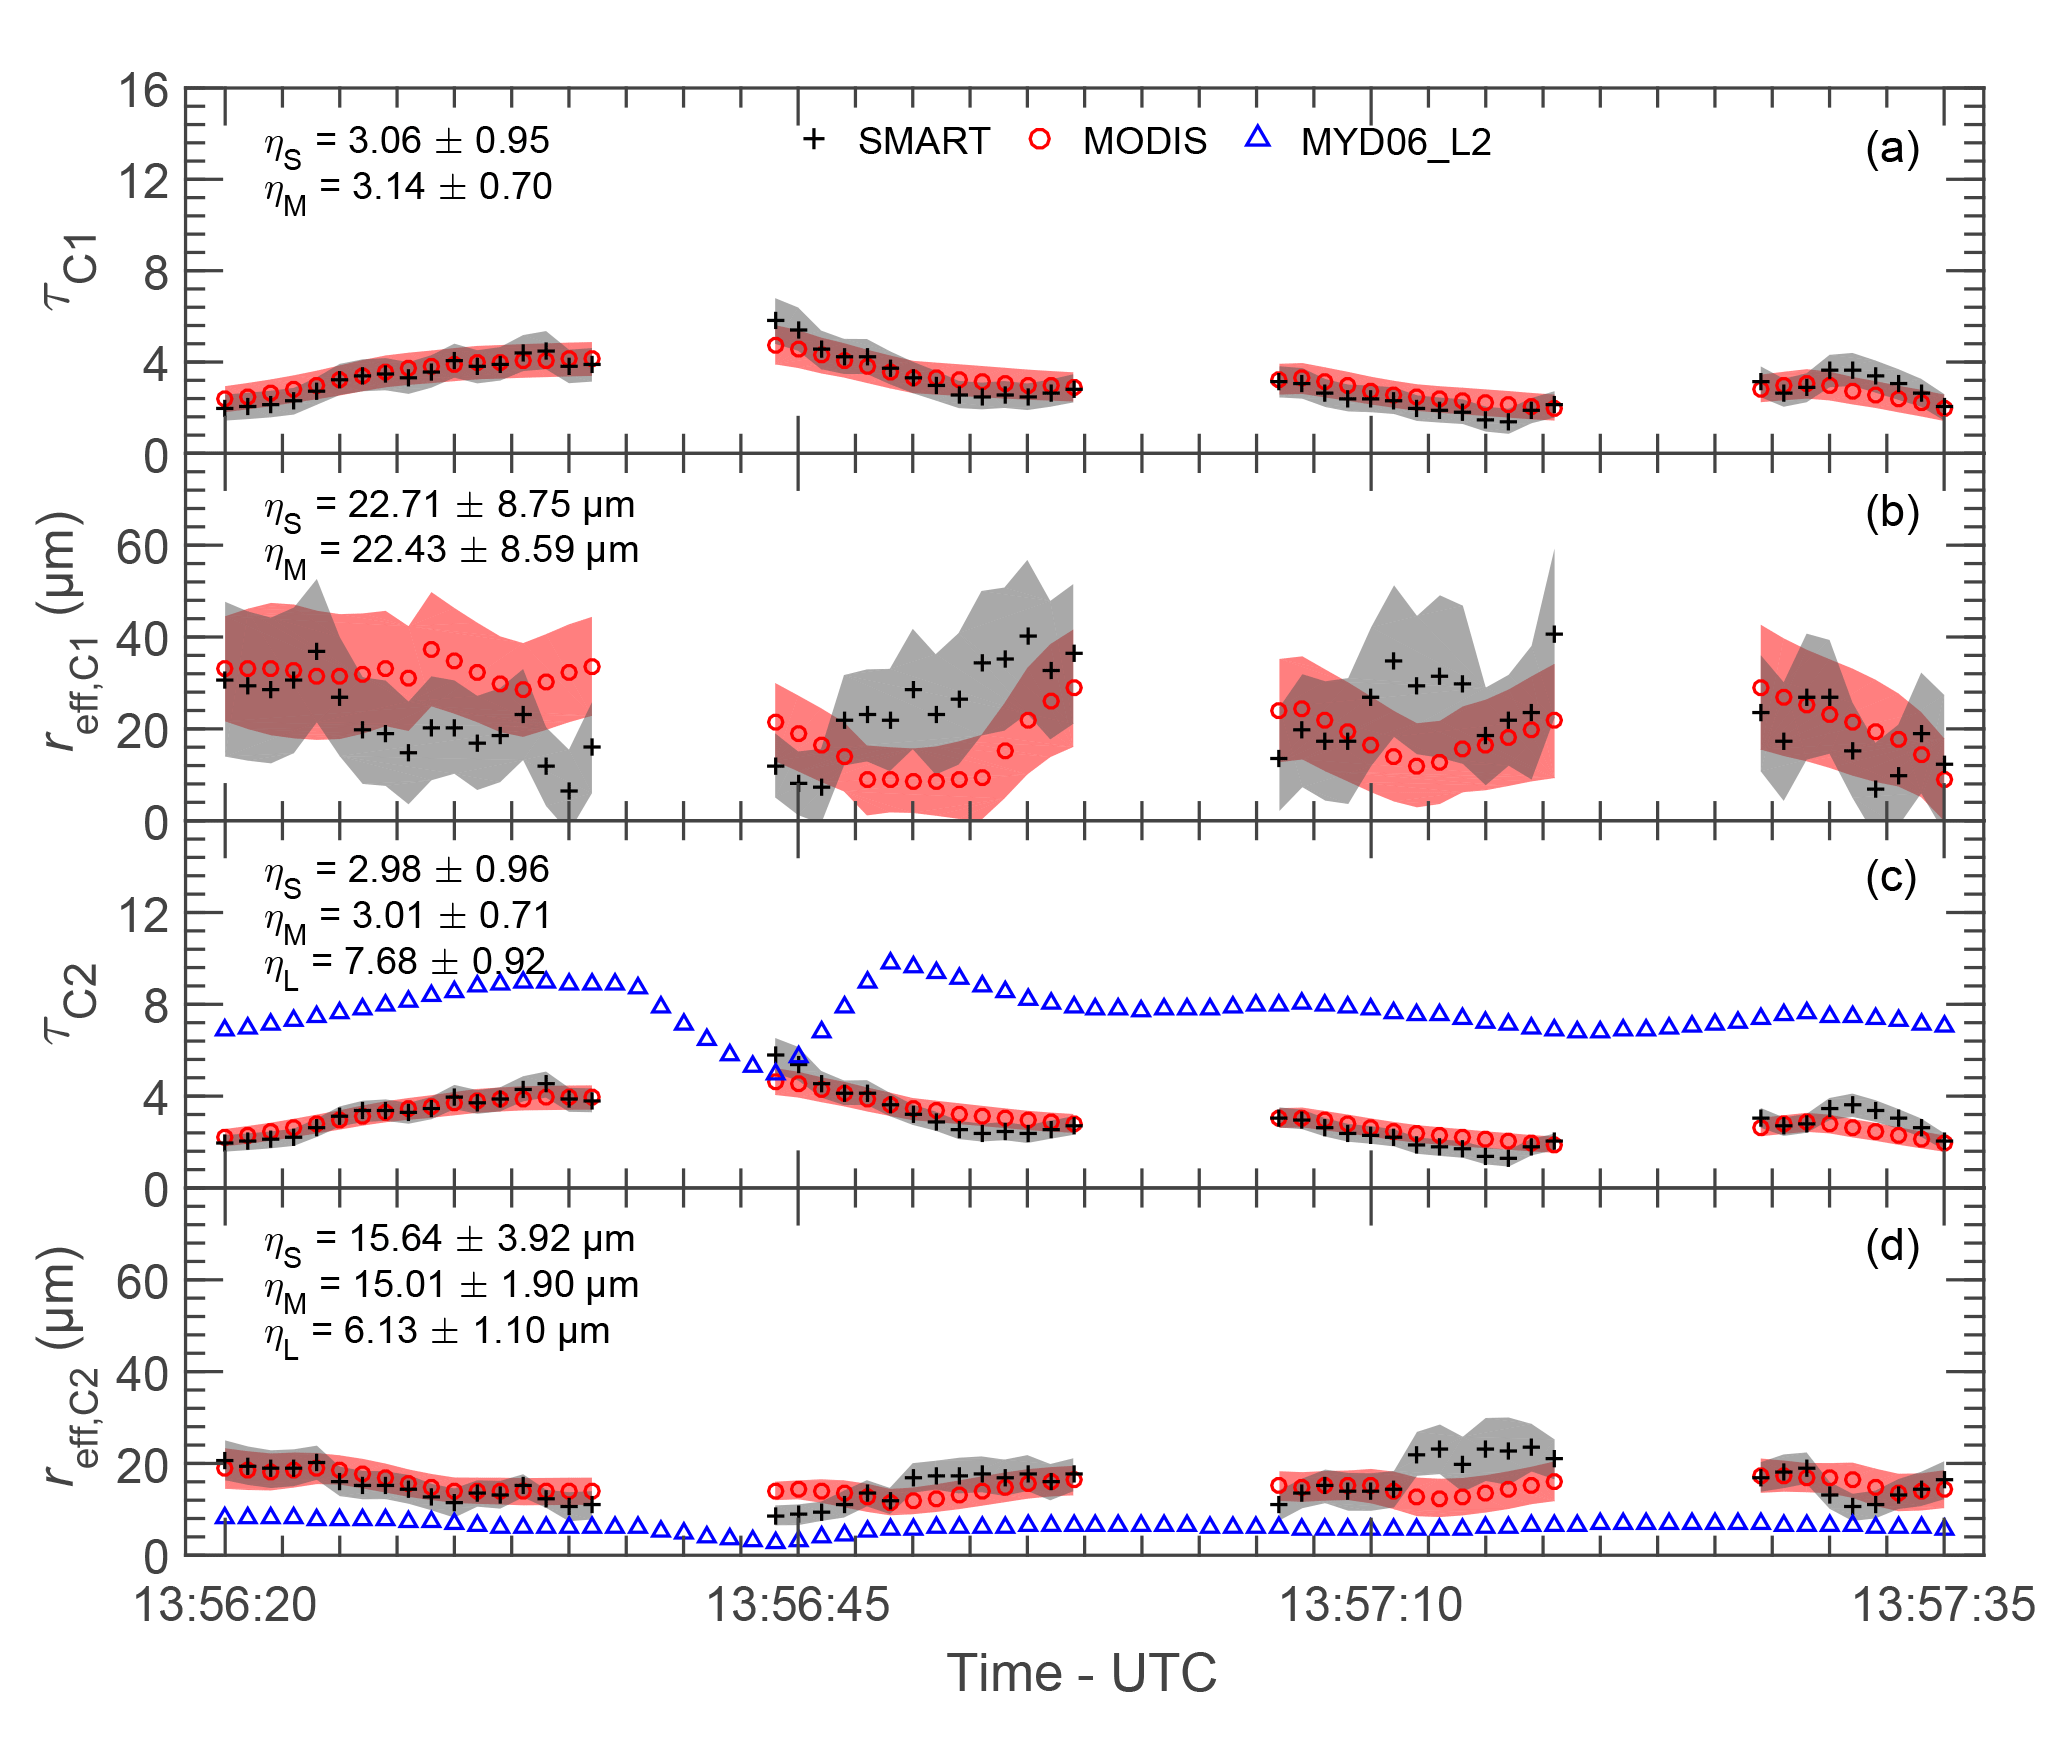
Figure 13Time series of cirrus τ (a) and reff (b) retrieved from SMART (black) and MODIS (red) using combination 1 (C1). The dark shaded area describes retrieval uncertainties. ηS (SMART) and ηM (MODIS) represent the mean standard deviation along time series. Panels (c) and (d) are the respective properties retrieved using combination 2 (C2). Cloud properties derived from the MODIS cloud product (MYD06_L2), τL and , are shown in blue (only in panels c and d) with the corresponding ηL.
Time series of cirrus optical thickness and effective radius retrieved using C1, τci,C1 and , are presented in Fig. 13a and b, respectively. The η describes the mean standard deviation of the corresponding cloud properties along the selected time series with the subscripts “S” for SMART and “M” for MODIS. To quantify the agreement of the retrieved cirrus properties based on SMART and MODIS, the normalized mean absolute deviation ζ is calculated. A of 1.2 % and a of 0.7 % are obtained. Figure 13c and d show time series of cirrus optical thickness and effective radius retrieved using C2, τci,C2 and , respectively. A of 0.5 % and a of 2.1 % are obtained. The analysis shows that deviations between SMART and MODIS in the retrieved cloud properties are only slightly enhanced by the non-linearity in the retrieval algorithm. Additionally, cloud properties derived from the MODIS cloud product (blue) are also shown in Fig. 13c and d, where η with the subscript “L” describes the respective mean standard deviation along the selected time series.
Cirrus properties retrieved using combinations C1 and C2 are compared to the MODIS cloud product (combination C4). Along the selected time series, all combinations show that τci is homogeneous as indicated by the small standard deviation . However, it is found that derived from the MODIS cloud product significantly overestimates τci,C2 (see Fig. 13c). The absolute deviation between the mean value and is found up to 4.7 (160 % relative difference). For the MODIS cloud product, the retrieval is always performed with the assumption of a single cloud layer even if a multilayer condition is detected (Platnick et al., 2017). Omitting the low liquid water cloud consequently results in a significant overestimation of the retrieved τci. When including a low liquid water cloud in the radiance ratio retrieval as applied to SMART and MODIS, more realistic τci are obtained. Furthermore, small differences between τci,C1 and τci,C2 are found. For a cirrus cloud where the particle size decreases towards the cloud top, it is expected that reff,C1 > reff,C2. Due to the remaining coupling between τ and reff (non-orthogonal radiance lookup tables), these differences propagate into the retrieved τ and lead to .
The results from all approaches show that the mean of . It should be noted that due to omitting the underlying liquid water cloud, underestimates the actual value. The difference between reff,C1 and reff,C2 results from the different wm as discussed in Sect. 4.4, which makes for a cirrus with decreasing particle size towards the cloud top. Additionally, the results show that the standard deviation of . This indicates that the horizontal variability of ice crystals is higher in lower cloud layers, while close to the cloud top the ice crystals are distributed more homogeneously along the flight legs. Smaller ice particles with low sedimentation velocity remain at the higher altitudes, while larger ice particles with faster sedimentation velocity drop into the cloud layers below. This sedimentation is horizontally inhomogeneous due to the variability of the vertical wind velocity and leads to a size sorting and the observed horizontal variability of the particle sizes. The analysis shows that the uncertainty of . This confirms that retrievals of reff using a wavelength with a smaller absorption by cloud particles will result in a larger uncertainty. Additionally, it is found that increasing τ and reff has a positive correlation with increasing Δτ and Δreff, which is due to decreasing sensitivity in the radiance lookup tables for larger τ and reff.
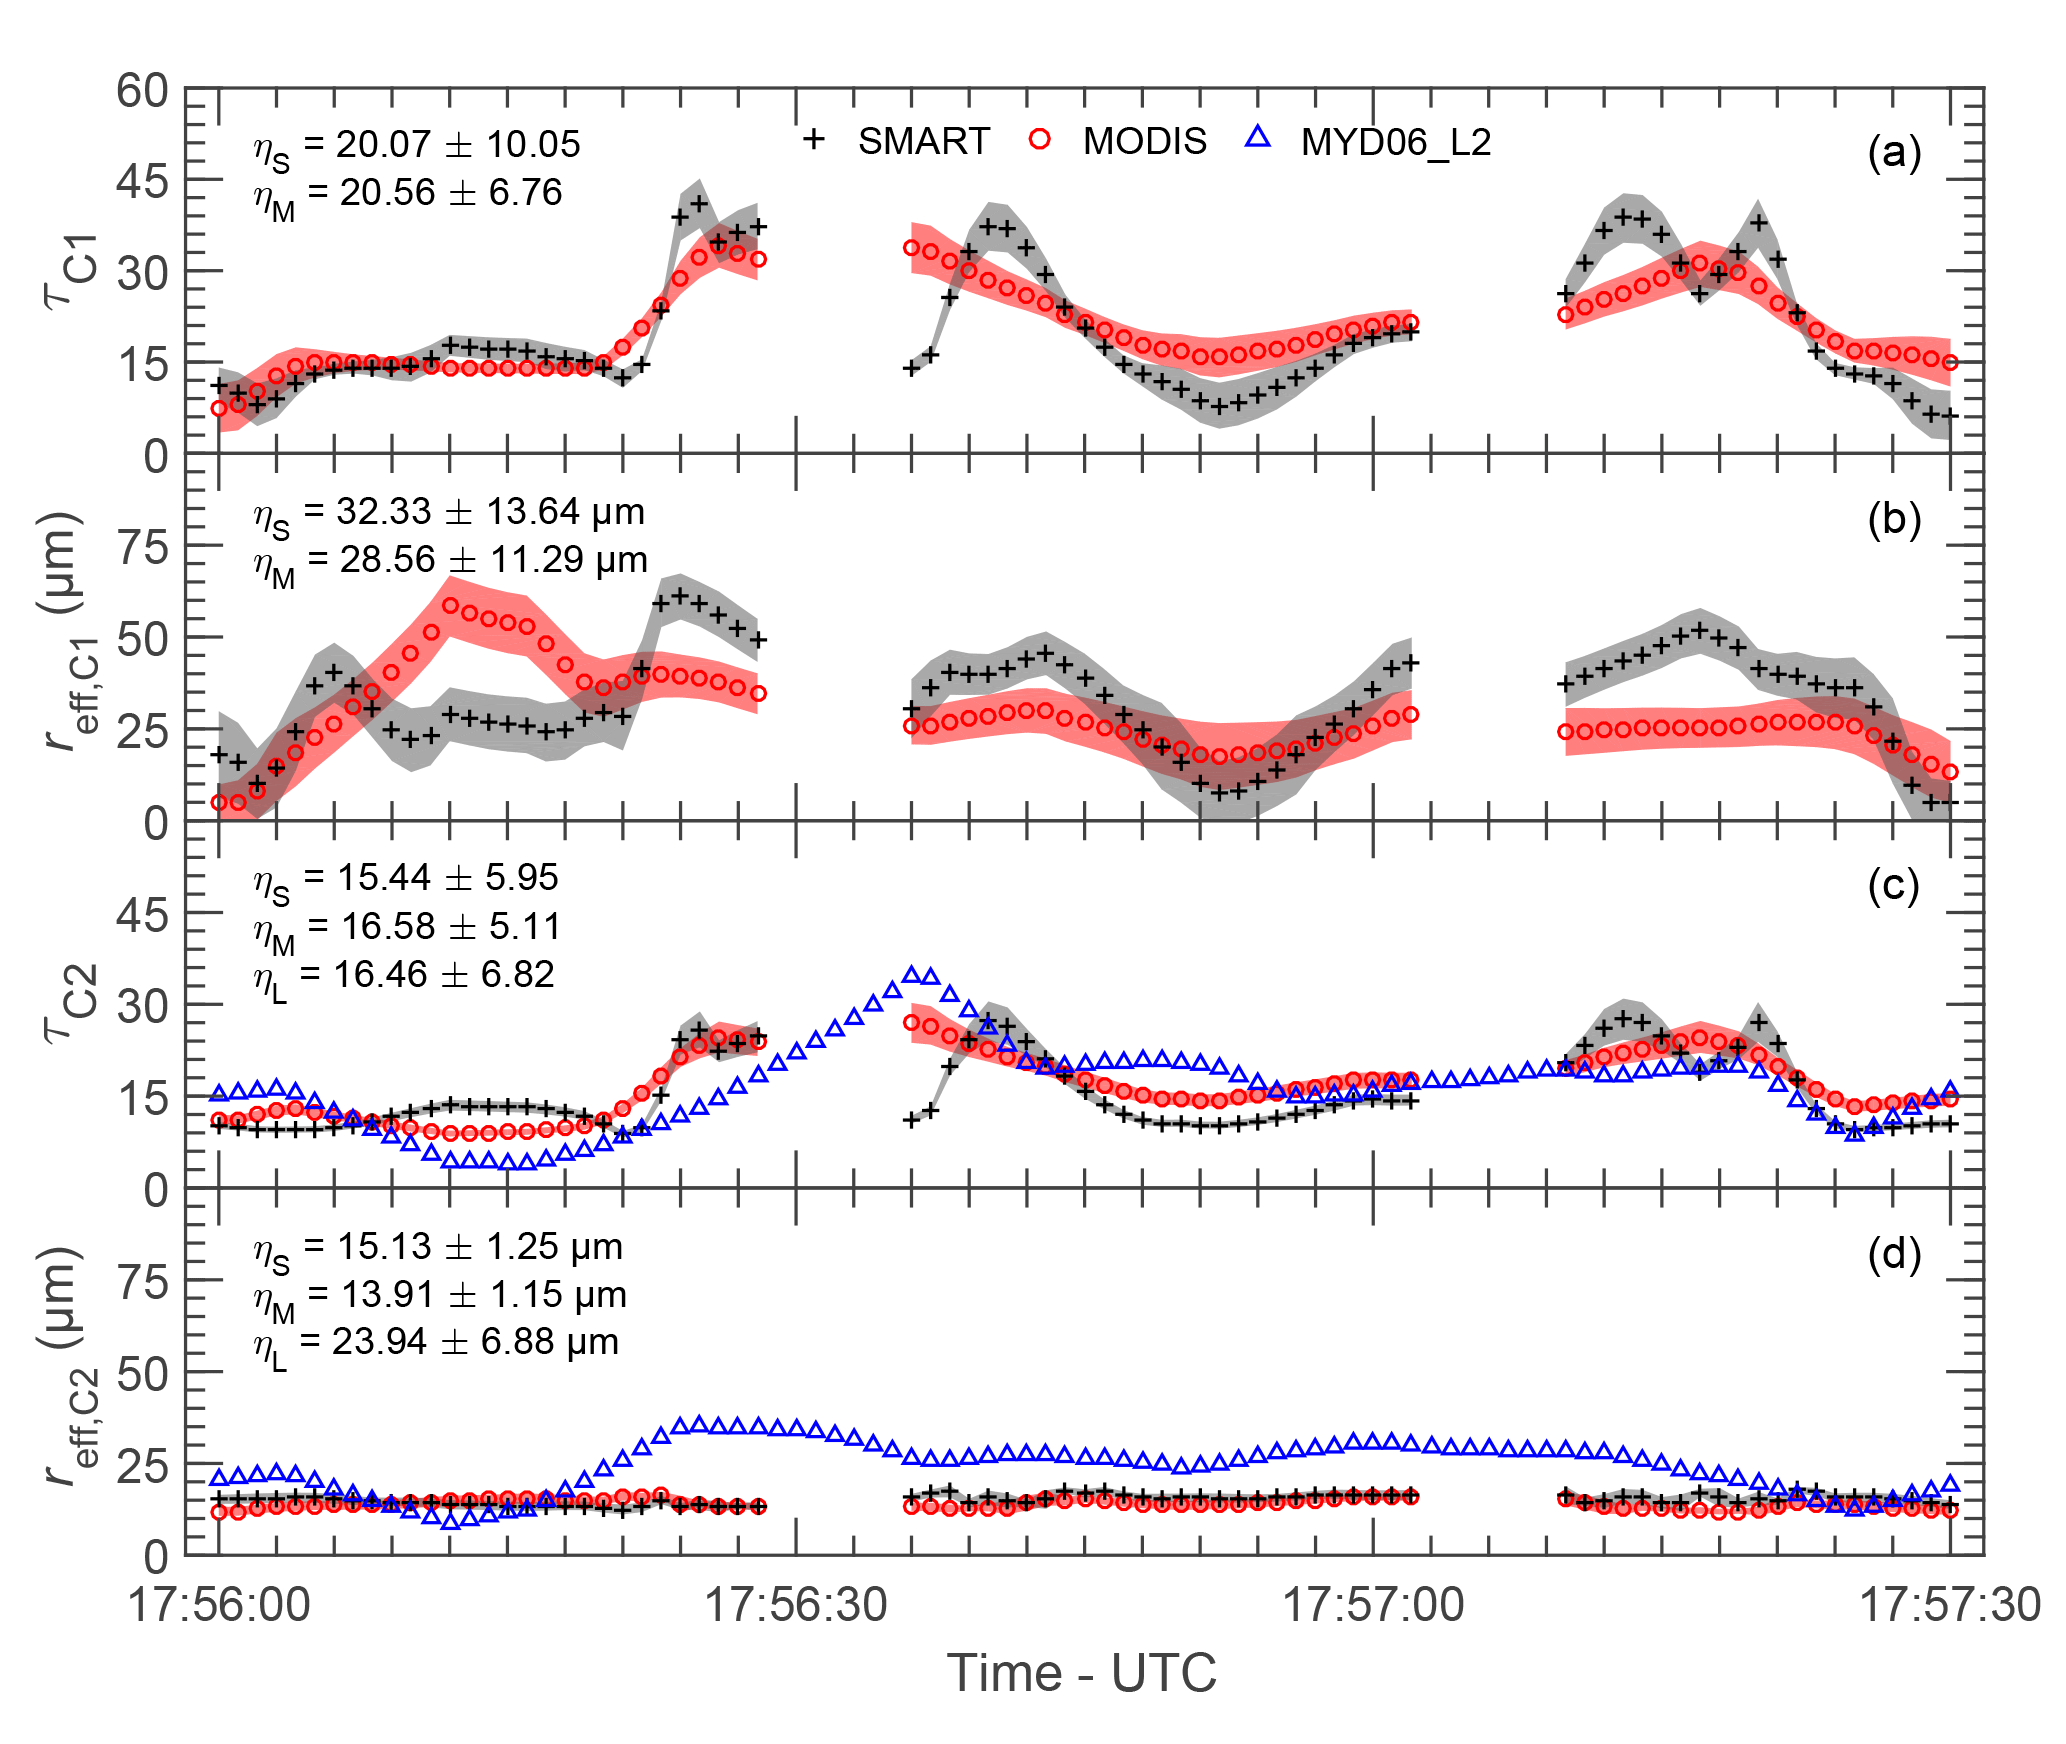
Time series of DCC optical thickness and effective radius retrieved using C1, τdcc,C1 and , are shown in Fig. 14a and b, respectively. A of 1.2 % and a of 6.2 % are obtained between SMART and MODIS retrievals. Compared to the cirrus case, the larger horizontal variability indicates a strong evolution of microphysical properties in the deeper layer of DCC. Figure 14c and d show time series of DCC optical thickness and effective radius retrieved using C2, τdcc,C2 and , respectively. A of 3.6 % and a of 4.6 % are obtained in this case. In addition to the fast cloud evolution, larger 3-D radiative effects are likely influencing the observations, which can enhance the deviations of retrieved cloud properties. The cloud properties derived from the MODIS cloud product (blue) are also presented in Fig. 14c and d. In this case (over land), the MODIS cloud product algorithm uses C3. The high values of standard deviation from approaches C1, C2, and C3, which are up to 10.1, indicate that τdcc is heterogeneous except in the anvil region. The DCC anvil is observed between 17:56:00 and 17:56:20 UTC, which is characterized by relatively smaller τ between 8 and 15. Later, τdcc increases sharply corresponding to the DCC core and decreases again towards the cloud edge. The mean value of indicates decreasing particle size towards the cloud top. It is found that is larger than , corresponding to the different assumptions of the ice crystal habit of plate (SMART and MODIS retrievals) and aggregated columns (MODIS cloud product). Given that and , this illustrates that the particle sizes are more homogeneous in the level of compared to the level of and .
The retrieved and in situ reff are compared for the cirrus case. Here, the terminology of reff(z) is used to describe the particle effective radius sampled at a specific vertical layer z, while the retrieved reff represents a bulk property of the entire cloud as discussed in Sect. 4.4. CCP provides reff(z) at 1 Hz temporal resolution. Further, the data are averaged to derive reff(z) with a vertical resolution of 65 m. Figure 15a shows that CCP detected a cirrus between 10.7 and 12 km with the mean values (solid line) ranging between 3 and 30 µm. The grey area illustrates the estimated uncertainties of the in situ data. The smallest particles with reff=3.1 µm are found at the cloud base zb=10.7 km and grow rapidly up to 30.2 µm at z=10.8 km. Later, reff decreases, reaching a value of 8.4 µm at the cloud top zb=11.97 km.
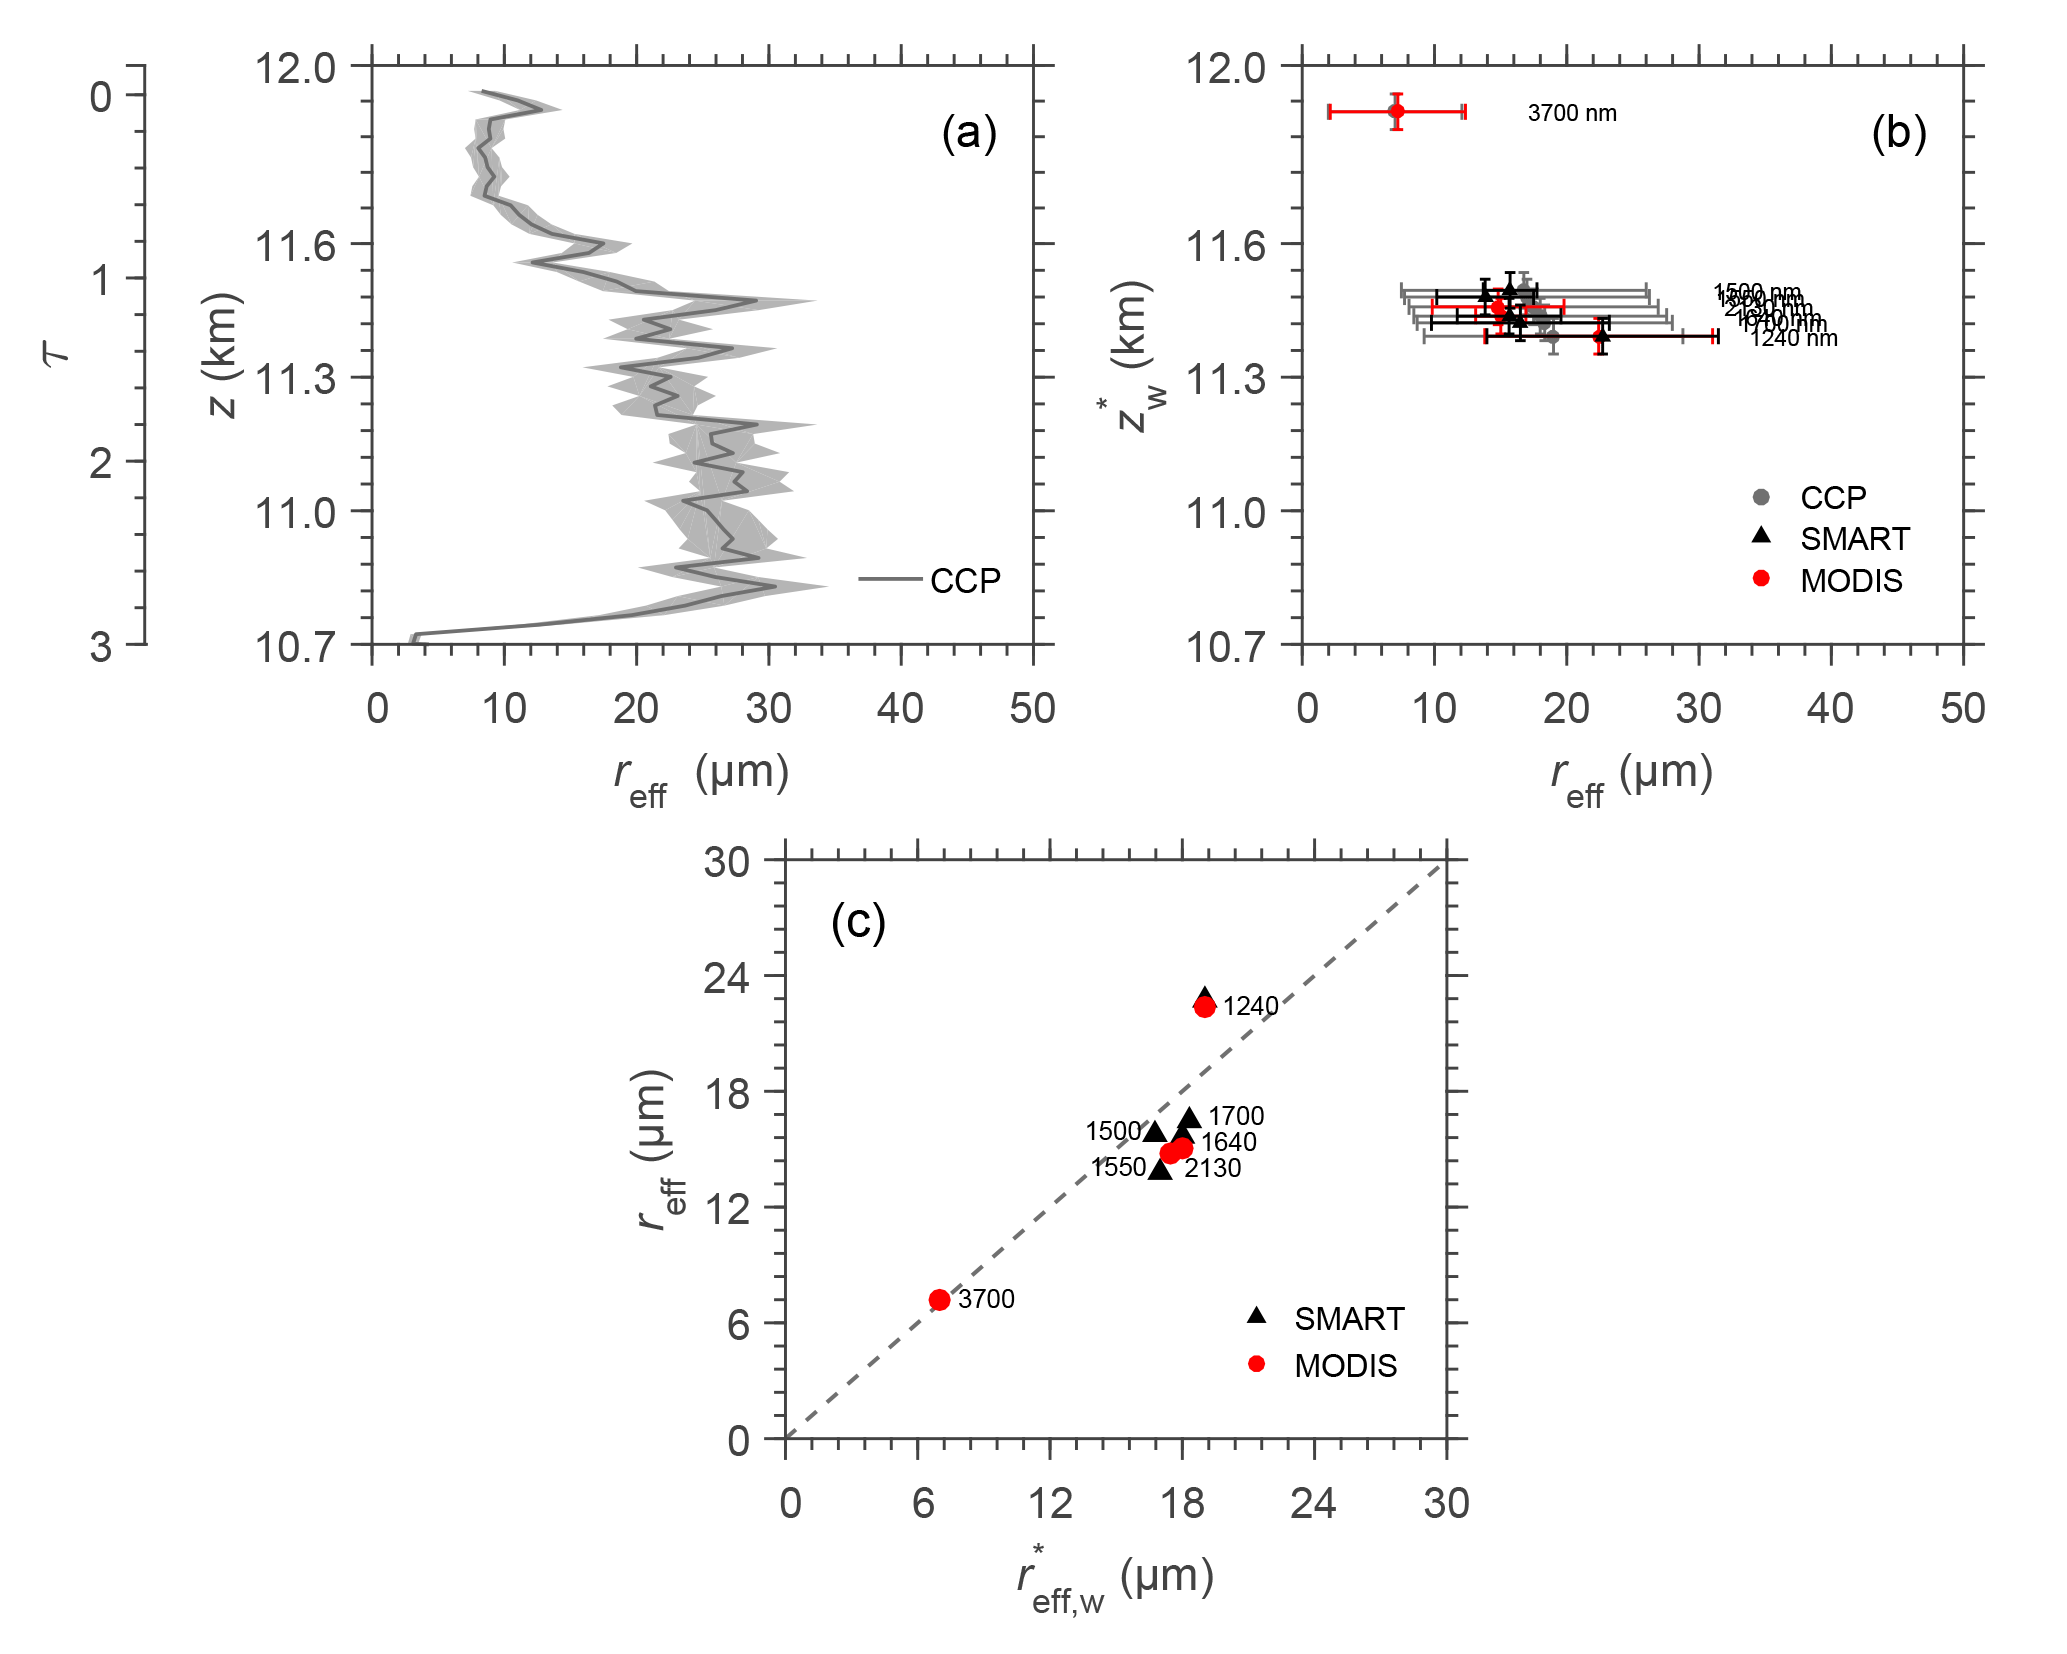
Figure 15(a) Profile of effective radius reff(z) derived from in situ CCP (solid line) with the corresponding uncertainties (grey area). (b) Comparison of the in situ and the mean value of reff retrieved from SMART and MODIS using λ between 1240 and 3700 nm. Horizontal error bars represent the standard deviation of reff, while vertical error bars are the uncertainty of . (c) Scatter plots between the in situ and the mean value of retrieved reff. The dashed line is the one-to-one line. The labels at each data point describe the wavelengths used to retrieve the reff.
To compare retrieved and in situ reff, the vertical weighting function wm has to be considered. A direct comparison between reff and reff(z) at a single layer is inappropriate because both are defined differently. Note that the wm in this study is calculated in terms of τ increasing from the cloud top towards the cloud base. Therefore, the conversion of geometrical altitude and optical thickness τ(z) needs to be specified. For this purpose, IWC(z) measured by WARAN and reff(z) derived from CCP are converted into a profile of the extinction coefficient β(z) following the scheme introduced by Fu and Liou (1993) and Wang et al. (2009):
where and b=3.686. βe(z) is in units of m−1, IWC(z) in g m−3, and reff(z) in µm. Further, the extinction profile is used to calculate τ(z) by integrating βe(z) from the cloud top to the altitude level z:
Using τ(z), reff(z) can be converted into reff(τ). To calculate the wm, the cloud is divided into 20 layers, where each cloud layer is assigned to a reff(τ). Finally, the reff(τ) is convoluted with the wm to calculate the in situ weighting estimate given by Eq. (6) to allow a comparison with the retrieved reff. Similarly, the weighting altitude which characterizes the altitude corresponding to the and the retrieved reff can be calculated by
Due to different absorption characteristics, it is expected that will vary for different near-infrared wavelengths. The stronger the absorption by cloud particles in the wavelength, the higher the (closer to the cloud top).
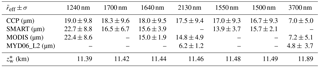
Table 4The mean standard deviation of reff from in situ (CCP), retrievals (SMART and MODIS), and MODIS cloud product (MYD06_L2) for different near-infrared wavelengths between 1240 and 3700 nm. The wavelengths have been sorted so that the degree of absorption by cloud particles increases to the right. The last line is the weighting altitude .
The comparison of and the mean value of retrieved reff is presented in Fig. 15b by symbols. Horizontal error bars represent the standard deviation of reff. Vertical error bars indicate the estimated uncertainty of the with a value of 40 m. This value is defined as the standard deviation of by varying ice crystal habits in the forward simulations. Additionally, the reff retrieved using SMART radiance measurements at λ=1500, 1550, and 1700 nm, and also MODIS radiances centered at λ=2130 nm and 3700 nm (band 20), are applied in this comparison. The retrieval and the calculation of wm for λ=3700 nm are performed by considering both solar and thermal radiation. Using these additional wavelengths allows to enhance the vertical resolution of retrieved reff. Figure 15b shows that in situ and retrieved reff agree within the standard deviation for all altitudes and reproduce the decrease of particle size towards the cloud top. However, it is obvious that although retrievals of reff using multiple near-infrared wavelengths result in particle sizes from different cloud altitudes, this retrieval technique only provides information of particle size in the cloud top layers. This is because the retrieved reff represents a vertically weighted value, where the cloud top layers are weighted at most.
Table 4 summarizes the mean standard deviation η of in situ and retrieved reff from SMART and MODIS, and for near-infrared wavelengths between 1240 and 3700 nm. Additionally, MODIS cloud products (MYD06_L2), and , are included in the table for the comparison. To quantify the agreement between in situ and retrieved reff, the normalized mean absolute deviation ζ is calculated. The deviations of in situ and SMART reff range between ζ=3.2 % (λ=1500 nm) and ζ=10.3 % (λ=1550 nm). Between and MODIS reff, the ζ results in a value between 1.5 % for λ=3700 nm and 9.1 % for λ=1640 nm. Overall, the values of ζ are in the range between 1.5 and 10.3 %, and agree within the horizontal standard deviation, as shown in Fig. 15b.
The reff values derived from the MODIS cloud product are obviously affected by the low liquid water cloud, which is not included in the algorithm of MODIS operational retrieval. Therefore, a ζ of 47.5 and 19.3 % is obtained for and , respectively. The deviation for is smaller because the absorption by the ice crystals at λ=3700 nm is very strong. Consequently, the first top layers will dominate the absorption and significantly reduce the effect of the underlying liquid water cloud. Figure 15c shows scatter plots of in situ and reff retrieved from SMART (black triangles) and MODIS (red dots), while the dashed line represents the one-to-one line. There is a robust agreement between in situ and retrieved reff with R2 of 0.82. The variability of particle size distributions, the uncertainties of deriving reff from the in situ measurements, the presence of the liquid water cloud below the cirrus, and the uncertainties caused by the choice of ice crystal shapes for the retrievals are considered as the main contributors to address the discrepancies between in situ and retrieved reff.
Accurate solar radiation measurements are necessary to retrieve high-quality cloud products such as the optical thickness τ and particle effective radius reff. Small measurement uncertainties propagate through the retrieval processes. Additional retrieval uncertainties arise from the assumption of the surface albedo, ice crystal habit, cloud vertical profile, and multilayer cloud scenes. Such situations make remote sensing of cloud properties complex and challenging. Collocated airborne and satellite measurements incorporated with in situ observation are one option to assess the uncertainties. Two selected cloud cases, a cirrus above low liquid water clouds and a DCC topped by an anvil cirrus measured during the ML-CIRRUS and ACRIDICON-CHUVA campaigns, are investigated in this study.
Spectral upward radiance measured above the clouds by SMART and MODIS are compared. Comparisons of spectral upward radiance at wavelengths between 400 and 1800 nm yield a normalized mean absolute deviation between 0.2 and 7.7 % for the cirrus and 1.5 and 8.3 % for the DCC case. The deviation is larger for the DCC case due to the fast cloud evolution, which changes the cloud properties during the time delay between SMART and MODIS observations. A radiance ratio retrieval is applied to retrieve τ and reff simultaneously. Two combinations, C1 ( and ℜ1) and C2 ( and ℜ2), are used in the retrieval algorithm, where and . By applying the ratios, the measurement uncertainties due to the radiometric calibration of the sensor are reduced. Therefore, the uncertainties of radiance ratio retrieval are smaller compared to the usual bi-spectral technique. Using different near-infrared wavelengths with different absorption by cloud particles in the retrieval algorithm provides reff from different cloud altitudes. The vertical weighting function shows that a retrieval using C1 (1240 nm) results in reff from a lower cloud layer, while using C2 (1640 nm) results in reff from a layer which is closer to the cloud top. To some degree, retrievals using these two combinations give a snapshot of the vertical variation of particle sizes in the cloud.
The vertical weighting function is used to analyze the impact of the vertical profile assumption in the retrieval of reff. A systematic deviation is found between retrievals assuming a vertically homogeneous compared to realistic cloud profiles. For ice clouds with decreasing particle size towards the cloud top, retrievals assuming a vertically homogeneous cloud result in an underestimation of up to 1 µm. The impact is larger for retrievals using wavelengths with smaller absorption by cloud particles (e.g., λ=1240 nm) because the lower cloud layers contribute more strongly to the upward radiance. The analysis of the vertical weighting function shows that each individual cloud layer has a contribution to the absorption imprinted in the upward radiance with a weighting depending on the cloud profile itself and the chosen wavelength. Therefore, it has to be kept in mind that the retrieved reff does not represent reff at a single cloud layer. Instead, the retrieved reff represents a bulk property of the entire cloud layer.
The occurrence of a low liquid water cloud leads to an overestimation of the retrieved cirrus τ, when the cloud is not considered in the forward simulation. The vertical weighting function of the cirrus will change and bias the retrieved cirrus reff, particularly when the cirrus layer is thin (τ<5). In this condition, the radiation is transmitted through the cirrus and reflected by the low cloud back to the cirrus. Consequently, the absorption in the lower cloud layers is enhanced. For cirrus clouds with decreasing particle size towards the cloud top, the retrieved cirrus reff becomes larger when a liquid water cloud occurs below the cirrus. When the cirrus is sufficiently thick (τ>5), the impact decreases. The accuracy of the properties of the liquid water cloud strongly determines the uncertainties of the retrieved cirrus properties. Underestimating the liquid water τ will artificially increase cirrus τ. When the liquid water reff underestimates the actual value, the retrieved cirrus reff becomes larger than in reality. The opposite results are expected when the properties of the liquid water cloud are overestimated.
The cloud properties retrieved by SMART and MODIS are compared for the two selected cloud cases. For the cirrus case, the normalized mean absolute deviation yields a value of up to 1.2 % for τ and 2.1 % for reff. The deviations are slightly larger than those found in the comparison of upward radiance, showing that the errors are only slightly amplified by the non-linearity in the retrieval algorithm. The cirrus τ derived from the MODIS cloud product overestimates the retrieval results because the MODIS cloud product algorithm assumes only a single cloud layer. For the DCC case, the deviation is in the range of 3.6 % for τ and 6.2 % for reff. In this case, the fast cloud evolution and larger 3-D radiative effects contribute to the deviations and retrieval uncertainties. For both cloud cases, it is found that the particle size decreases towards the cloud top. A higher horizontal variability of reff is observed in the lower cloud layers, while in the upper layers the particle sizes are more homogeneous.
For the cirrus case, the retrieved reff values are compared to in situ measurements. To allow the comparison of both methods, the vertical weighting function is considered. Using additional near-infrared wavelengths of SMART and MODIS increases the information on particle size extracted from the spectral measurements and the vertical resolution of retrieved reff. The normalized mean absolute deviation between retrieved and in situ reff ranges between 1.5 and 10.3 %, which falls within the standard deviation. A robust correlation coefficient is obtained with a value of 0.82. The variability of particle size distributions, the uncertainties of deriving reff from the in situ measurements, the presence of the liquid water cloud below the cirrus, and the uncertainties caused by unconstrained choice of ice crystal habit for the retrievals are identified as the major contributors which can reveal the discrepancies between retrieved and in situ reff. The assumption of the vertically homogeneous cloud in the retrieval algorithm has only a small impact on the retrieval results.
The primary data of the two HALO campaigns are accessible from the HALO database (https://halo-db.pa.op.dlr.de/) under data sharing policies. For SMART data, contact André Ehrlich (a.ehrlich@uni-leipzig.de). CCP data are provided by Ralf Weigel (weigelr@uni-mainz.de), and WARAN data are managed by Christiane Voigt (christiane.voigt@dlr.de). Other related data are available upon request to Trismono C. Krisna (trismono_candra.krisna@uni-leipzig.de).
The authors declare that they have no conflict of interest.
This article is part of the special issues “The ACRIDICON-CHUVA campaign to study deep convective clouds and precipitation over Amazonia using the new German HALO research aircraft (ACP/AMT inter-journal SI)” and “ML-CIRRUS – the airborne experiment on natural cirrus and contrail cirrus in mid-latitudes with the high-altitude long-range research aircraft HALO (ACP/AMT inter-journal SI)”. It is not associated with a conference.
This work was supported by the Max Planck Society (MPG), the German Science
Foundation (DFG) funding the SPP HALO 1294 and the grants WE 1900/35-1 and
VO 1504/4-1, the German Aerospace Center (DLR), and the FAPESP (São Paulo
Research Foundation) grants 2009/15235-8 and 2013/05014-0. The HGF is
acknowledged for support under contract no. W2/W3-60. Christoph
Mahnke and Ralf Weigel received funding from the German BMBF within the joint
ROMIC project SPITFIRE (01LG1205A). Trismono C. Krisna acknowledges the
Ministry of Research, Technology and Higher Education of the Republic of
Indonesia (RISTEKDIKTI) and the German Academic Exchange Service (DAAD) for
the research grant under the scheme of the Indonesia-German Scholarship Programme
(IGSP). The entire ML-CIRRUS and ACRIDICON-CHUVA team is gratefully
acknowledged for collaboration and
support.
Edited by: Ulrich Schumann
Reviewed by: two anonymous referees
Ackerman, S., Moeller, C., Strabala, K., Gerber, H., Gumley, L., Menzel, W., and Tsay, S.-C.: Retrieval of effective microphysical properties of clouds: A wave cloud case study, Geophys. Res. Lett., 25, 1121–1124, 1998. a
Afchine, A., Rolf, C., Costa, A., Spelten, N., Riese, M., Buchholz, B., Ebert, V., Heller, R., Kaufmann, S., Minikin, A., Voigt, C., Zöger, M., Smith, J., Lawson, P., Lykov, A., Khaykin, S., and Krämer, M.: Ice particle sampling from aircraft – influence of the probing position on the ice water content, Atmos. Meas. Tech. Discuss., https://doi.org/10.5194/amt-2017-373, in review, 2017. a
Anderson, G., Clough, S., Kneizys, F., Chetwynd, J., and Shettle, E.: AFGL Atmospheric Constituent Profiles (0–120 km), Tech. Rep. AFGL-TR-86-0110, AFGL (OPI), Hanscom AFB, MA 01736, 1986. a
Baum, B. A., Yang, P., Heymsfield, A. J., Bansemer, A., Cole, B. H., Merrelli, A., Schmitt, C., and Wang, C.: Ice cloud single-scattering property models with the full phase matrix at wavelengths from 0.2 to 100 µm, J. Quant. Spectrosc. Ra., 146, 123–139, https://doi.org/10.1016/j.jqsrt.2014.02.029, 2014. a, b, c
Baumgardner, D., Strapp, W., and Dye, J. E.: Evaluation of the Forward Scattering Spectrometer Probe. Part II: Corrections for Coincidence and Dead-Time Losses, J. Atmos. Ocean. Tech., 2, 626–632, https://doi.org/10.1175/1520-0426(1985)002<0626:EOTFSS>2.0.CO;2, 1985. a
Berendes, T. A., Mecikalski, J. R., MacKenzie, W. M., Bedka, K. M., and Nair, U. S.: Convective cloud identification and classification in daytime satellite imagery using standard deviation limited adaptive clustering, J. Geophys. Res., 113, D20207, https://doi.org/10.1029/2008JD010287, 2008. a
Bierwirth, E.: Airborne measurements of the spectral surface albedo over morocco and its influence on the radiative forcing of saharan dust, PhD thesis, Johannes Gutenberg University Mainz, Germany, 2008. a
Braga, R. C., Rosenfeld, D., Weigel, R., Jurkat, T., Andreae, M. O., Wendisch, M., Pöhlker, M. L., Klimach, T., Pöschl, U., Pöhlker, C., Voigt, C., Mahnke, C., Borrmann, S., Albrecht, R. I., Molleker, S., Vila, D. A., Machado, L. A. T., and Artaxo, P.: Comparing parameterized versus measured microphysical properties of tropical convective cloud bases during the ACRIDICON–CHUVA campaign, Atmos. Chem. Phys., 17, 7365–7386, https://doi.org/10.5194/acp-17-7365-2017, 2017. a
Brückner, M., Pospichal, B., Macke, A., and Wendisch, M.: A new multispectral cloud retrieval method for ship-based solar transmissivity measurements, J. Geophys. Res.-Atmos., 119, 11338–11354, https://doi.org/10.1002/2014JD021775, 2014. a
Cecchini, M. A., Machado, L. A. T., Andreae, M. O., Martin, S. T., Albrecht, R. I., Artaxo, P., Barbosa, H. M. J., Borrmann, S., Fütterer, D., Jurkat, T., Mahnke, C., Minikin, A., Molleker, S., Pöhlker, M. L., Pöschl, U., Rosenfeld, D., Voigt, C., Weinzierl, B., and Wendisch, M.: Sensitivities of Amazonian clouds to aerosols and updraft speed, Atmos. Chem. Phys., 17, 10037–10050, https://doi.org/10.5194/acp-17-10037-2017, 2017. a
Chang, F. L. and Li, Z. Q.: A new method for detection of cirrus overlapping water clouds and determination of their optical properties, J. Atmos. Sci., 62, 3993–4009, 2005. a
Dye, J. E. and Baumgardner, D.: Evaluation of the Forward Scattering Spectrometer Probe. Part I: Electronic and Optical Studies, J. Atmos. Ocean. Tech., 1, 329–344, https://doi.org/10.1175/1520-0426(1984)001<0329:EOTFSS>2.0.CO;2, 1984. a
Ehrlich, A., Bierwirth, E., Istomina, L., and Wendisch, M.: Combined retrieval of Arctic liquid water cloud and surface snow properties using airborne spectral solar remote sensing, Atmos. Meas. Tech., 10, 3215–3230, https://doi.org/10.5194/amt-10-3215-2017, 2017. a
Eichler, H., Ehrlich, A., Wendisch, M., Mioche, G., Gayet, J.-F., Wirth, M., Emde, C., and Minikin, A.: Influence of ice crystal shape on retrieval of cirrus optical thickness and effective radius: A case study, J. Geophys. Res., 114, D19203, https://doi.org/10.1029/2009JD012215, 2009. a, b
Emde, C., Buras-Schnell, R., Kylling, A., Mayer, B., Gasteiger, J., Hamann, U., Kylling, J., Richter, B., Pause, C., Dowling, T., and Bugliaro, L.: The libRadtran software package for radiative transfer calculations (version 2.0.1), Geosci. Model Dev., 9, 1647–1672, https://doi.org/10.5194/gmd-9-1647-2016, 2016. a
Fisher, A.: Cloud and cloud-shadow detection in SPOT5 HRG imagery with automated morphological feature extraction, Remote Sensing, 6, 776–800, https://doi.org/10.3390/rs6010776, 2014. a
Frey, W., Borrmann, S., Kunkel, D., Weigel, R., de Reus, M., Schlager, H., Roiger, A., Voigt, C., Hoor, P., Curtius, J., Krämer, M., Schiller, C., Volk, C. M., Homan, C. D., Fierli, F., Di Donfrancesco, G., Ulanovsky, A., Ravegnani, F., Sitnikov, N. M., Viciani, S., D'Amato, F., Shur, G. N., Belyaev, G. V., Law, K. S., and Cairo, F.: In situ measurements of tropical cloud properties in the West African Monsoon: upper tropospheric ice clouds, Mesoscale Convective System outflow, and subvisual cirrus, Atmos. Chem. Phys., 11, 5569–5590, https://doi.org/10.5194/acp-11-5569-2011, 2011. a, b
Fricke, C., Ehrlich, A., Jäkel, E., Bohn, B., Wirth, M., and Wendisch, M.: Influence of local surface albedo variability and ice crystal shape on passive remote sensing of thin cirrus, Atmos. Chem. Phys., 14, 1943–1958, https://doi.org/10.5194/acp-14-1943-2014, 2014. a
Fu, Q. and Liou, K.: Parameterization of the radiative properties of cirrus clouds, J. Atmos. Sci., 50, 2008–2025, 1993. a
Gueymard, C. A.: The sun's total and spectral irradiance for solar energy applications and solar radiation models, Sol. Energy, 76, 423–453, 2004. a
Hahn, J., Warren, G., London, J., Chervin, M., and Jenne, R.: Atlas of simultaneous occurrence of different cloud types over land, NCAR Technical Note NCAR/TN-241+STR, https://doi.org/10.5065/D6Q81B2M, 1984. a
Heymsfield, A. J., Krämer, M., Luebke, A., Brown, P., Cziczo, D. J., Franklin, C., Lawson, P., Lohmann, U., McFarquhar, G., Ulanowski, Z., and Tricht, K. V.: Cirrus Clouds, Meteor. Mon., 58, 2.1–2.26, https://doi.org/10.1175/AMSMONOGRAPHS-D-16-0010.1, 2017. a, b
Holz, R. E., Platnick, S., Meyer, K., Vaughan, M., Heidinger, A., Yang, P., Wind, G., Dutcher, S., Ackerman, S., Amarasinghe, N., Nagle, F., and Wang, C.: Resolving ice cloud optical thickness biases between CALIOP and MODIS using infrared retrievals, Atmos. Chem. Phys., 16, 5075–5090, https://doi.org/10.5194/acp-16-5075-2016, 2016. a
Jäkel, E., Walter, J., and Wendisch, M.: Thermodynamic phase retrieval of convective clouds: impact of sensor viewing geometry and vertical distribution of cloud properties, Atmos. Meas. Tech., 6, 539–547, https://doi.org/10.5194/amt-6-539-2013, 2013. a
Järvinen, E., Schnaiter, M., Mioche, G., Jourdan, O., Shcherbakov, V. N., Costa, A., Afchine, A., Krämer, M., Heidelberg, F., Jurkat, T., Voigt, C., Schlager, H., Nichman, L., Gallagher, M., Hirst, E., Schmitt, C., Bansemer, A., Heymsfield, A., Lawson, P., Tricoli, U., Pfeilsticker, K., Vochezer, P., Möhler, O., and Leisner, T.: Quasi-Spherical Ice in Convective Clouds, J. Atmos. Sci., 73, 3885–3910, https://doi.org/10.1175/JAS-D-15-0365.1, 2016. a
Jensen, M. P. and Del Genio, A. D.: Radiative and microphysical characteristics of deep convective systems in the tropical western Pacific, J. Appl. Meteorol., 42, 1234–1254, 2003. a
Kaufmann, S., Voigt, C., Jeßberger, P., Jurkat, T., Schlager, H., Schwarzenboeck, A., Klingebiel, M., and Thornberry, T.: In situ measurements of ice saturation in young contrails, Geophys. Res. Lett., 41, 702–709, 2014. a
Kaufmann, S., Voigt, C., Jurkat, T., Thornberry, T., Fahey, D. W., Gao, R.-S., Schlage, R., Schäuble, D., and Zöger, M.: The airborne mass spectrometer AIMS – Part 1: AIMS-H2O for UTLS water vapor measurements, Atmos. Meas. Tech., 9, 939–953, https://doi.org/10.5194/amt-9-939-2016, 2016. a
Kim, D. Y. and Ramanathan, V.: Solar radiation budget and radiative forcing due to aerosols and clouds, J. Geophys. Res., 113, D02203, https://doi.org/10.1029/2007JD008434, 2008. a
King, M., Tsay, S.-C., Platnick, S., Wang, M., and Liou, K.-N.: Cloud retrieval algorithms for MODIS: Optical thickness, effective particle radius, and thermodynamic phase, MODIS Algorithm Theoretical Basis Document, No. ATBD-MOD-05, 1997. a
King, N. J., Bower, K. N., Crosier, J., and Crawford, I.: Evaluating MODIS cloud retrievals with in situ observations from VOCALS-REx, Atmos. Chem. Phys., 13, 191–209, https://doi.org/10.5194/acp-13-191-2013, 2013. a, b, c, d, e, f
Klingebiel, M., de Lozar, A., Molleker, S., Weigel, R., Roth, A., Schmidt, L., Meyer, J., Ehrlich, A., Neuber, R., Wendisch, M., and Borrmann, S.: Arctic low-level boundary layer clouds: in situ measurements and simulations of mono- and bimodal supercooled droplet size distributions at the top layer of liquid phase clouds, Atmos. Chem. Phys., 15, 617–631, https://doi.org/10.5194/acp-15-617-2015, 2015. a, b, c
Korolev, A.: Limitations of the Wegener-Bergeron-Findeisen mechanism in the evolution of mixed-phase clouds, J. Atmos. Sci., 64, 3372–3375, 2007. a
Lance, S., Brock, C. A., Rogers, D., and Gordon, J. A.: Water droplet calibration of the Cloud Droplet Probe (CDP) and in-flight performance in liquid, ice and mixed-phase clouds during ARCPAC, Atmos. Meas. Tech., 3, 1683–1706, https://doi.org/10.5194/amt-3-1683-2010, 2010. a
Lane, T. P. and Sharman, R. D.: Intensity of thunderstorm-generated turbulence revealed by large-eddy simulation, Geophys. Res. Lett., 41, 2221–2227, https://doi.org/10.1002/2014GL059299, 2014. a
Larar, A. M., Smith, W. L., Zhou, D. K., Liu, X., Revercomb, H., Taylor, J. P., Newman, S. M., and Schlüssel, P.: IASI spectral radiance validation inter-comparisons: case study assessment from the JAIVEx field campaign, Atmos. Chem. Phys., 10, 411–430, https://doi.org/10.5194/acp-10-411-2010, 2010. a
Liang, L. S., Di Girolamo, L., and Platnick, S.: View-angle consistency in reflectance, optical thickness and spherical albedo of marine water-clouds over the northeastern Pacific through MISR-MODIS fusion, Geophys. Res. Lett., 36, L09811, https://doi.org/10.1029/2008GL037124, 2009. a, b
Lindsey, D. T., Hillger, D. W., Grasso, L., Knaff, J. A., and Dostalek, J. F.: GOES climatology and analysis of thunderstorms with enhanced 3.9-mu m reflectivity, Mon. Weather Rev., 134, 2342–2353, 2006. a
Liou, K.-N.: Influence of cirrus clouds on weather and climate processes: A global perspective, Mon. Weather Rev., 114, 1167–1199, 1986. a
Luo, Z. J., Jeyaratnam, J., Iwasaki, S., Takahashi, H., and Anderson, R.: Convective vertical velocity and cloud internal vertical structure: An A-Train perspective, Geophys. Res. Lett., 41, 723–729, https://doi.org/10.1002/2013GL058922, 2013GL058922, 2014. a
Lyapustin, A., Wang, Y., Xiong, X., Meister, G., Platnick, S., Levy, R., Franz, B., Korkin, S., Hilker, T., Tucker, J., Hall, F., Sellers, P., Wu, A., and Angal, A.: Scientific impact of MODIS C5 calibration degradation and C6+ improvements, Atmos. Meas. Tech., 7, 4353–4365, https://doi.org/10.5194/amt-7-4353-2014, 2014. a
Mayer: Book Review: Barry, R. G., The Late R. Chorley: Atmosphere, Weather and Climate, 8th Edn., Meteorol. Z., 14, 79–80, 2005. a
McFarquhar, G. and Heymsfield, A.: Microphysical characteristics of three anvils sampled during the central equatorial pacific experiment, J. Atmos. Sci., 53, 2401–2423, 1996. a
McFarquhar, G. M. and Heymsfield, A. J.: The definition and significance of an effective radius for ice clouds, J. Atmos. Sci., 55, 2039–2052, 1998. a
Mecikalski, J. R., Feltz, W. F., Murray, J. J., Johnson, D. B., Bedka, K. M., Bedka, S. T., Wimmers, A. J., Pavolonis, M., Berendies, T. A., Haggerty, J., Minnis, P., Bernstein, B., and Williams, E.: Aviation applications for satellite-based observations of cloud properties, convection initiation, in-flight icing, turbulence, and volcanic ash, B. Am. Meteorol. Soc., 88, 1589–1607, https://doi.org/10.1175/BAMS-88-10-1589, 2007. a
Molleker, S., Borrmann, S., Schlager, H., Luo, B., Frey, W., Klingebiel, M., Weigel, R., Ebert, M., Mitev, V., Matthey, R., Woiwode, W., Oelhaf, H., Dörnbrack, A., Stratmann, G., Grooß, J.-U., Günther, G., Vogel, B., Müller, R., Krämer, M., Meyer, J., and Cairo, F.: Microphysical properties of synoptic-scale polar stratospheric clouds: in situ measurements of unexpectedly large HNO3-containing particles in the Arctic vortex, Atmos. Chem. Phys., 14, 10785–10801, https://doi.org/10.5194/acp-14-10785-2014, 2014. a, b, c
Mu, Q., Wu, A., Xiong, X., Doelling, D. R., Angal, A., Chang, T., and Bhatt, R.: Optimization of a Deep Convective Cloud Technique in Evaluating the Long-Term Radiometric Stability of MODIS Reflective Solar Bands, Remote Sensing, 9, 535, https://doi.org/10.3390/rs9060535, 2017. a
Nakajima, T. and King, M.: Determination of the optical thickness and effective particle radius of clouds from reflected solar radiation measurements. Part I: Theory, J. Atmos. Sci., 47, 1878–1893, 1990. a
Painemal, D. and Zuidema, P.: Assessment of MODIS cloud effective radius and optical thickness retrievals over the Southeast Pacific with VOCALS-REx in situ measurements, J. Geophys. Res., 116, d24206, https://doi.org/10.1029/2011JD016155, 2011. a, b
Platnick, S.: Vertical photon transport in cloud remote sensing problems, J. Geophys. Res., 105, 22919–22935, 2000. a, b, c, d, e
Platnick, S., King, M. D., Ackerman, S. A., Menzel, W. P., Baum, B. A., Riédi, J. C., and Frey, R. A.: The MODIS cloud products: Algorithms and examples from Terra, IEEE T. Geosci. Remote, 41, 459–473, 2003. a, b, c
Platnick, S., Meyer, K. G., King, M. D., Wind, G., Amarasinghe, N., Marchant, B., Arnold, G. T., Zhang, Z., Hubanks, P. A., Holz, R. E., Yang, P., Ridgway, W. L., and Riedi, J.: The MODIS Cloud Optical and Microphysical Products: Collection 6 Updates and Examples From Terra and Aqua, IEEE T. Geosci. Remote, 55, 502–525, https://doi.org/10.1109/TGRS.2016.2610522, 2017. a, b, c, d
Rolland, P. and Liou, K.: Surface variability effects on the remote sensing of thin cirrus optical and microphysical properties, J. Geophys. Res., 106, 22965–22977, https://doi.org/10.1029/2001JD900160, 2001. a
Rosenfeld, D. and Lensky, I. M.: Satellite-based insights into precipitation formation processes in continental and maritime convective clouds, B. Am. Meteorol. Soc., 79, 2457–2476, 1998. a
Rozanov, V. and Kokhanovsky, A.: Semianalytical cloud retrieval algorithm as applied to the top altitude and the cloud geometrical thickness determination from top-of-atmosphere reflectance measurements in the oxygen A band, J. Geophys. Res., 109, D05202, https://doi.org/10.1029/2003JD004104, 2004. a
Savtchenko, A., Kummerer, R., Smith, P., Gopalan, A., Kempler, S., and Leptoukh, G.: A-Train Data Depot: Bringing Atmospheric Measurements Together, IEEE T. Geosci. Remote, 46, 2788–2795, https://doi.org/10.1109/TGRS.2008.917600, 2008. a
Schumacher, C., Stevenson, S. N., and Williams, C. R.: Vertical motions of the tropical convective cloud spectrum over Darwin, Australia, Q. J. Roy. Meteor. Soc., 141, 2277–2288, https://doi.org/10.1002/qj.2520, 2015. a
Schumann, U., Baumann, R., Baumgardner, D., Bedka, S. T., Duda, D. P., Freudenthaler, V., Gayet, J.-F., Heymsfield, A. J., Minnis, P., Quante, M., Raschke, E., Schlager, H., Vázquez-Navarro, M., Voigt, C., and Wang, Z.: Properties of individual contrails: a compilation of observations and some comparisons, Atmos. Chem. Phys., 17, 403–438, https://doi.org/10.5194/acp-17-403-2017, 2017. a
Sherwood, S. C., Minnis, P., and McGill, M.: Deep convective cloud-top heights and their thermodynamic control during CRYSTAL-FACE, J. Geophys. Res., 109, d20119, https://doi.org/10.1029/2004JD004811, 2004. a
Shettle, E.: Comments on the use of LOWTRAN in transmission calculations for sites with the ground elevated relative to sea level, Appl. Optics, 28, 1451–1452, 1989. a
Shupe, M. D. and Intrieri, J. M.: Cloud radiative forcing of the Arctic surface: The influence of cloud properties, surface albedo, and solar zenith angle, J. Climate, 17, 616–628, 2004. a
Slingo, A.: Sensitivity of the Earths Radiation Budget to Changes in Low Clouds, Nature, 343, 49–51, 1990. a
Sohn, B.-J., Choi, M.-J., and Ryu, J.: Explaining darker deep convective clouds over the western Pacific than over tropical continental convective regions, Atmos. Meas. Tech., 8, 4573–4585, https://doi.org/10.5194/amt-8-4573-2015, 2015. a
Sourdeval, O., C.-Labonnote, L., Baran, A. J., and Brogniez, G.: A methodology for simultaneous retrieval of ice and liquid water cloud properties. Part I: Information content and case study, Q. J. Roy. Meteor. Soc., 141, 870–882, https://doi.org/10.1002/qj.2405, 2015. a
Stamnes, K., Tsay, S.-C., Wiscombe, W., and Laszlo, I.: DISORT, a General-Purpose Fortran Program for Discrete-Ordinate-Method Radiative Transfer in Scattering and Emitting Layered Media: Documentation of Methodology, Tech. rep., Dept. of Physics and Engineering Physics, Stevens Institute of Technology, Hoboken, NJ 07030, 2000. a
Stephens, G. L. and Kummerow, C. D.: The remote sensing of clouds and precipitation from space: A review, J. Atmos. Sci., 64, 3742–3765, 2007. a
Strahler, A., Muller, J., and Members, M. S. T.: MODIS BRDF/Albedo product: Algorithm Theoretical Basis Document Version 5.0, 1999. a
Stubenrauch, C., Rossow, W., Kinne, S., et al.: Assessment of global cloud datasets from satellites: Project and database initiated by the GEWEX radiation panel, B. Am. Meteorol. Soc., 94, 1031–1049, 2013. a
Sun, J.-Q., Xiong, X., Barnes, W. L., and Guenther, B.: MODIS reflective solar bands on-orbit lunar calibration, IEEE T. Geosci. Remote, 45, 2383–2393, 2007. a
van Diedenhoven, B., Fridlind, A. M., Cairns, B., and Ackerman, A. S.: Variation of ice crystal size, shape, and asymmetry parameter in tops of tropical deep convective clouds, J. Geophys. Res., 119, 11809–11825, https://doi.org/10.1002/2014JD022385, 2014. a
van Diedenhoven, B., Fridlind, A. M., Cairns, B., Ackerman, A. S., and Yorks, J. E.: Vertical variation of ice particle size in convective cloud tops, Geophys. Res. Lett., 43, 4586–4593, https://doi.org/10.1002/2016GL068548, 2016GL068548, 2016. a
Voigt, C., Schlager, H., Ziereis, H., Kärcher, B., Luo, B., Schiller, C., Krämer, M., Popp, P., Irie, H., and Kondo, Y.: Nitric acid in cirrus clouds, Geophys. Res. Lett., 33, L05803, https://doi.org/10.1029/2005GL025159, 2006. a
Voigt, C., Jessberger, P., Jurkat, T., Kaufmann, S., Baumann, R., Schlager, H., Bobrowski, N., Giuffrida, G., and Salerno, G.: Evolution of CO2, SO2, HCl, and HNO3 in the volcanic plumes from Etna, Geophys. Res. Lett., 41, 2196–2203, 2014. a
Voigt, C., Schumann, U., Minikin, A., Abdelmonem, A., Afchine, A., Borrmann, S., Boettcher, M., Buchholz, B., Bugliaro, L., Costa, A., Curtius, J., Dollner, M., Dörnbrack, A., Dreiling, V., Ebert, V., Ehrlich, A., Fix, A., Forster, L., Frank, F., Fütterer, D., Giez, A., Graf, K., Grooß, J.-U., Groß, S., Heimerl, K., Heinold, B., Hüneke, T., Järvinen, E., Jurkat, T., Kaufmann, S., Kenntner, M., Klingebiel, M., Klimach, T., Kohl, R., Krämer, M., Krisna, T. C., Luebke, A., Mayer, B., Mertes, S., Molleker, S., Petzold, A., Pfeilsticker, K., Port, M., Rapp, M., Reutter, P., Rolf, C., Rose, D., Sauer, D., Schäfler, A., Schlage, R., Schnaiter, M., Schneider, J., Spelten, N., Spichtinger, P., Stock, P., Walser, A., Weigel, R., Weinzierl, B., Wendisch, M., Werner, F., Wernli, H., Wirth, M., Zahn, A., Ziereis, H., and Zöger, M.: ML-CIRRUS: The Airborne Experiment on Natural Cirrus and Contrail Cirrus with the High-Altitude Long-Range Research Aircraft HALO, B. Am. Meteorol. Soc., 98, 271–288, https://doi.org/10.1175/BAMS-D-15-00213.1, 2017. a, b, c, d, e
Wan, Z.: New refinements and validation of the collection-6 MODIS land-surface temperature/emissivity product, Remote Sens. Environ., 140, 36–45, https://doi.org/10.1016/j.rse.2013.08.027, 2014. a
Wang, L., Qu, J. J., Xiong, X., Hao, X., Xie, Y., and Che, N.: A new method for retrieving band 6 of aqua MODIS, IEEE Geosci. Remote S., 3, 267–270, https://doi.org/10.1109/LGRS.2006.869966, 2006. a, b
Wang, X., Liou, K. N., Ou, S. S. C., Mace, G. G., and Deng, M.: Remote sensing of cirrus cloud vertical size profile using MODIS data, J. Geophys. Res., 114, d09205, https://doi.org/10.1029/2008JD011327, 2009. a, b, c
Warren, S., Hahn, C., and London, J.: Simultaneous occurrence of different cloud types, J. Climate Appl. Meteor., 24, 658–667, 1985. a
Weigel, K., Rozanov, A., Azam, F., Bramstedt, K., Damadeo, R., Eichmann, K.-U., Gebhardt, C., Hurst, D., Kraemer, M., Lossow, S., Read, W., Spelten, N., Stiller, G. P., Walker, K. A., Weber, M., Bovensmann, H., and Burrows, J. P.: UTLS water vapour from SCIAMACHY limb measurementsV3.01 (2002–2012), Atmos. Meas. Tech., 9, 133–158, https://doi.org/10.5194/amt-9-133-2016, 2016. a, b, c
Wendisch, M. and Brenguier, J.-L.: Airborne Measurements for Environmental Research – Methods and Instruments, Wiley–VCH Verlag GmbH & Co. KGaA, Weinheim, Germany, Weinheim, Germany, iSBN: 978-3-527-40996-9, 2013. a
Wendisch, M. and Mayer, B.: Vertical distribution of spectral solar irradiance in the cloudless sky: A case study, Geophys. Res. Lett., 30, 1183–1186, https://doi.org/10.1029/2002GL016529, 2003. a
Wendisch, M., Heintzenberg, J., and Bussemer, M.: Measurement-based aerosol forcing calculations: the influence of model complexity, Meteorol. Z., 10, 45–60, 2001. a, b
Wendisch, M., Pilewskie, P., Jäkel, E., Schmidt, S., Pommier, J., Howard, S., Jonsson, H. H., Guan, H., Schröder, M., and Mayer, B.: Airborne measurements of areal spectral surface albedo over different sea and land surfaces, J. Geophys. Res., 109, D08203, https://doi.org/10.1029/2003JD004392, 2004. a
Wendisch, M., Pilewskie, P., Pommier, J., Howard, S., Yang, P., Heymsfield, A. J., Schmitt, C. G., Baumgardner, D., and Mayer, B.: Impact of cirrus crystal shape on solar spectral irradiance: A case study for subtropical cirrus, J. Geophys. Res., 110, d03202, https://doi.org/10.1029/2004JD005294, 2005. a
Wendisch, M., Yang, P., and Pilewskie, P.: Effects of ice crystal habit on thermal infrared radiative properties and forcing of cirrus, J. Geophys. Res., 112, D03202, https://doi.org/10.1029/2006JD007899, 2007. a
Wendisch, M., Pöschl, U., Andreae, M. O., Machado, L. A. T., Albrecht, R., Schlager, H., Rosenfeld, D., Martin, S. T., Abdelmonem, A., Afchine, A., Araujo, A., Artaxo, R., Aufmhoff, H., Barbosa, H. M. J., Borrmann, S., Braga, R., Buchholz, B., Cecchini, M. A., Costa, A., Curtius, J., Dollner, M., Dorf, M., Dreiling, V., Ebert, V., Ehrlich, A., Ewald, F., Fisch, G., Fix, A., Frank, F., Fütterer, D., Heckl, C., Heidelberg, F., Hüneke, T., Jäkel, E., Järvinen, E., Jurkat, T., Kanter, S., Kästner, U., Kenntner, M., Kesselmeier, J., Klimach, T., Knecht, M., Kohl, R., Kölling, T., Krämer, M., Krüger, M., Krisna, T. C., Lavric, J. V., Longo, K., Mahnke, C., Manzi, A. O., Mayer, B., Mertes, S., Minikin, A., Molleker, S., Münch, S., Nillius, B., Pfeilsticker, K., Pöhlker, C., Roiger, A. E., Rose, D., Rosenow, D., Sauer, D., Schnaiter, M., Schneider, J., Schulz, C., de Souza, R. A. F., Spanu, A., Stock, P., Vila, D., Voigt, C., Walser, A., Walter, D., Weigel, R., Weinzierl, B., Werner, R., Yamasoe, M. A., Ziereis, H., Zinner, T., and Zöger, M.: The ACRIDICON-CHUVA campaign: Studying tropical deep convective clouds and precipitation over Amazonia using the new German research aircraft HALO, B. Am. Meteorol. Soc., 97, 1885–1908, https://doi.org/10.1175/BAMS-D-14-00255.1, 2016. a, b, c
Werner, F., Siebert, H., Pilewskie, P., Schmeissner, T., Shaw, R. A., and Wendisch, M.: New airborne retrieval approach for trade wind cumulus properties under overlying cirrus, J. Geophys. Res.-Atmos., 118, 3634–3649, https://doi.org/10.1002/jgrd.50334, 2013. a, b, c, d
Wind, G., Platnick, S., King, M. D., Hubanks, P. A., Pavolonis, M. J., Heidinger, A. K., Yang, P., and Baum, B. A.: Multilayer Cloud Detection with the MODIS Near-Infrared Water Vapor Absorption Band, J. Appl. Meteorol. Clim., 49, 2315–2333, https://doi.org/10.1175/2010JAMC2364.1, 2010. a
Wiscombe, W.: Improved Mie scattering algorithms, Appl. Optics, 19, 1505–1509, 1980. a
Wolf, K., Ehrlich, A., Hüneke, T., Pfeilsticker, K., Werner, F., Wirth, M., and Wendisch, M.: Potential of remote sensing of cirrus optical thickness by airborne spectral radiance measurements at different sideward viewing angles, Atmos. Chem. Phys., 17, 4283–4303, https://doi.org/10.5194/acp-17-4283-2017, 2017. a, b
Wylie, D., Jackson, D. L., Menzel, W. P., and Bates, J. J.: Trends in global cloud cover in two decades of HIRS observations, J. Climate, 18, 3021–3031, 2005. a
Xiong, X., Sun, J., Chiang, K., Xiong, S., and Barnes, W.: MODIS on-orbit characterization using the moon, Sensors, Systems And Next-Generation Satellites Vi, 4881, 299–307, 2003. a, b
Xiong, X. X. and Barnes, W.: An overview of MODIS radiometric calibration and characterization, Adv. Atmos. Sci., 23, 69–79, 2006. a, b, c
Yang, P., Bi, L., Baum, B. A., Liou, K.-N., Kattawar, G. W., Mishchenko, M. I., and Cole, B.: Spectrally consistent scattering, absorption, and polarization properties of atmospheric ice crystals at wavelengths from 0.2 to 100 µm, J. Atmos. Sci., 70, 330–347, https://doi.org/10.1175/JAS-D-12-039.1, 2013. a, b, c
Zhang, Z. and Platnick, S.: An assessment of differences between cloud effective particle radius retrievals for marine water clouds from three MODIS spectral bands, J. Geophys. Res., 116, d20215, https://doi.org/10.1029/2011JD016216, 2011. a, b
Zhang, Z. B., Platnick, S., Yang, P., Heidinger, A. K., and Comstock, J. M.: Effects of ice particle size vertical inhomogeneity on the passive remote sensing of ice clouds, J. Geophys. Res., 115, D17203, https://doi.org/10.1029/2010JD013835, 2010. a, b
- Abstract
- Introduction
- Observations
- Comparison of upward radiance
- Retrieval of cloud optical thickness τ and particle effective radius reff
- Comparison of retrieval results with in situ measurements for the cirrus case
- Conclusions
- Data availability
- Competing interests
- Special issue statement
- Acknowledgements
- References