the Creative Commons Attribution 4.0 License.
the Creative Commons Attribution 4.0 License.
Modeling reactive ammonia uptake by secondary organic aerosol in CMAQ: application to the continental US
Shupeng Zhu
Jeremy R. Horne
Julia Montoya-Aguilera
Mallory L. Hinks
Sergey A. Nizkorodov
Ammonium salts such as ammonium nitrate and ammonium sulfate constitute an important fraction of the total fine particulate matter (PM2.5) mass. While the conversion of inorganic gases into particulate-phase sulfate, nitrate, and ammonium is now well understood, there is considerable uncertainty over interactions between gas-phase ammonia and secondary organic aerosols (SOAs). Observations have confirmed that ammonia can react with carbonyl compounds in SOA, forming nitrogen-containing organic compounds (NOCs). This chemistry consumes gas-phase NH3 and may therefore affect the amount of ammonium nitrate and ammonium sulfate in particulate matter (PM) as well as particle acidity. In order to investigate the importance of such reactions, a first-order loss rate for ammonia onto SOA was implemented into the Community Multiscale Air Quality (CMAQ) model based on the ammonia uptake coefficients reported in the literature. Simulations over the continental US were performed for the winter and summer of 2011 with a range of uptake coefficients (10−3–10−5). Simulation results indicate that a significant reduction in gas-phase ammonia may be possible due to its uptake onto SOA; domain-averaged ammonia concentrations decrease by 31.3 % in the winter and 67.0 % in the summer with the highest uptake coefficient (10−3). As a result, the concentration of particulate matter is also significantly affected, with a distinct spatial pattern over different seasons. PM concentrations decreased during the winter, largely due to the reduction in ammonium nitrate concentrations. On the other hand, PM concentrations increased during the summer due to increased biogenic SOA (BIOSOA) production resulting from enhanced acid-catalyzed uptake of isoprene-derived epoxides. Since ammonia emissions are expected to increase in the future, it is important to include NH3 + SOA chemistry in air quality models.
- Article
(15719 KB) - Full-text XML
-
Supplement
(4366 KB) - BibTeX
- EndNote
As the most abundant basic gas in the atmosphere (Behera et al., 2013), gaseous ammonia (NH3) has long been considered responsible for controlling the eutrophication and acidification of ecosystems (Erisman et al., 2008; Sheppard et al., 2011; Sutton et al., 1993). More recently, studies also demonstrated the importance of ammonia in the formation of airborne fine particulate matter (PM2.5) (Vayenas et al., 2005; Wang et al., 2013; West et al., 1999). Through reactions with acidic species, ammonia is converted into ammonium salts, such as ammonium nitrate and ammonium sulfate, which constitute an important fraction of total PM2.5 mass (Behera and Sharma, 2010). These aerosols have been proven to affect human health (Lelieveld et al., 2015; Pope III et al., 2002), visibility (Ye et al., 2011), and the atmospheric radiative balance (Park et al., 2014; Xu and Penner, 2012). In the US, the largest ammonia emission source is agricultural activity (∼ 85 % of total US ammonia emissions) (Pinder et al., 2004, 2006), largely from animal waste and commercial fertilizer application, such as the intensive farming in California's Central Valley (Jovan and McCune, 2005) and industrialized hog farms in central North Carolina (Aneja et al., 2000; McCulloch et al., 1998). The ammonia-rich plumes from those areas drive most of the nitric acid into the particle phase, resulting in high PM2.5 concentrations in those regions (Baek and Aneja, 2004; Neuman et al., 2003). Recent studies have also shown that atmospheric ammonia has increased during the last two decades, a trend that is expected to continue as a result of global warming, increasing agricultural activity and intensifying fertilizer use due to a growing population (Amann et al., 2013; Galloway et al., 2008; Warner et al., 2017).
While the conversion of inorganic gases into particulate-phase sulfate, nitrate, and ammonium is now fairly well understood (Seinfeld and Pandis, 2016), there is considerable uncertainty over interactions between gas-phase ammonia and organic compounds in secondary organic aerosols (SOAs). Laboratory studies have shown that ammonia can react with SOA compounds in two ways. It can either react with organic acids to form ammonium salts (Na et al., 2007) or participate in reactions with certain carbonyl compounds forming heterocyclic nitrogen-containing organic compounds (NOCs) (Laskin et al., 2015; Updyke et al., 2012). In addition, a browning effect on SOA under NH3 exposure is observed by Updyke et al. (2012), indicating the production of light-absorbing products. These processes are not included in current air quality models, which could lead to overestimation of gaseous ammonia concentrations and thus inorganic aerosol concentration. Additionally, the neglect of these two processes may also result in underestimation of organics aerosol, especially species related to acid-catalyzed reactions (Lin et al., 2013), and in incorrect prediction of aerosol particle acidity.
Recently, chemical uptake coefficients for ammonia onto SOA were reported for the first time by Liu et al. (2015). Those coefficients were on the order of ∼ 10−3–10−2 for fresh SOA, decreasing significantly to < 10−5 after 6 h of reaction. They observed that the NOC mass contributed 8.9 ± 1.7 and 31.5 ± 4.4 wt % to the total α-pinene and m-xylene-derived SOA, respectively, and 4–15 wt % of the total nitrogen in the system. If such large fraction of SOA compounds can be converted to NOCs it can have large effect on both NH3 and PM concentrations.
In this work, we investigate the impact of ammonia uptake by SOA on PM2.5 and NH3 concentrations, by implementing a first-order loss rate for ammonia onto SOA into the Community Multiscale Air Quality (CMAQ) modeling system based on ammonia uptake coefficients reported by Liu et al. (2015). Air quality simulations over the continental US were performed with a range of uptake coefficients to determine the sensitivity of PM2.5 and NH3 concentration to the magnitude of the uptake coefficient. Furthermore, in order to investigate the seasonal impact on this process, simulations were conducted for both winter and summer. The modeling method used in this analysis will first be presented in Sect. 2. Then, simulation results will be analyzed based on both observational data and sensitivity comparisons between different scenarios in Sect. 3. Finally, in Sect. 4, the importance of including this process in air quality models will be discussed.
The CMAQ modeling system (Byun and Schere, 2006) is a widely used state-of-the-art chemical transport model. In the United States, it is among the most commonly used air quality models in attainment demonstrations for National Ambient Air Quality Standards for ozone and PM2.5 (US EPA, 2007). In this study, eight simulations were conducted using the latest 2017 release of CMAQ (version 5.2), including one base case simulation for the winter (Jan. 1 - Feb. 27, 2011), one base case simulation for the summer (1 July–30 August 2011), and three different NH3 uptake scenarios for each period. The carbon bond version 6 (CB6) mechanism (Yarwood et al., 2010) was used for the gas-phase chemistry, which includes 127 species as detailed on the website (Adams, 2017), and the AERO6 module was used for aerosol dynamics, which includes 21 inorganic species and 34 organic species (28 SOA and 6 primary organic species) as detailed on the CMASWIKI website (Pye, 2016). The modeling domain used in this study covers the contiguous US using a 12 km × 12 km horizontal-grid resolution (resulting in 396 (x) × 246 (y) = 97 416 grid cells) and a 29-layer logarithmic vertical structure (set on a terrain following sigma coordinate, from the surface to 50 hPa) with the depth of the first layer around 26 m. Only the simulation results from the first layer, representative of ground level, were used for the analysis in this study.
The meteorological fields were derived from NCEP FNL (Final) Operational Global Analysis data (NCEP, 2000) using the Weather Research and Forecasting Model (WRF, version 3.7) (Skamarock et al., 2008), with the MODIS land use database (Friedl et al., 2010) and the the Yonsei University (YSU) parametrization (Hong et al., 2006) for the planetary boundary layer. The WSM3 scheme (Hong et al., 2004) was used for the microphysics option of WRF, and the Kain–Fritsch convective parametrization (Kain, 2004) was used for cumulus physics. These fields were then processed using version 4.3 of Meteorology–Chemistry Interface Processor (MCIP) (Otte and Pleim, 2010). The initial and boundary conditions were obtained from the Model for Ozone and Related Chemical Tracers (MOZART v2.0) (Horowitz et al., 2003). Emissions were generated based on the 2014 National Emissions Inventory (NEI) (US EPA, 2017a) and processed by the Sparse Matrix Operator Kernel Emission (SMOKE, version 4.5) processor (US EPA, 2017b). Biogenic emissions were obtained from the Biogenic Emission Inventory System (BEIS) (Pierce and Waldruff, 1991), and emissions from cars, trucks, and motorcycles were calculated with MOBILE6 (US EPA, 2003).
In this study, the AERO6 module in CMAQ was updated to simulate the heterogeneous uptake of NH3 by SOA. AERO6 used the modal representation to simulate aerosol dynamics (Binkowski and Roselle, 2003). The size distribution of the aerosol particles is represented by three log-normal modes: the Aitken mode (size up to approximately 0.1 µm), the accumulation mode (size between 0.1 to 2.5 µm), and the coarse mode (size between 2.5 to 10 µm). The particles are assumed to be internally mixed within each mode. In the AERO6 modal approach, three integral properties of the size distribution are followed for mode j: the total particle number concentration Nj, the total wet surface area concentration Sj, and the total mass concentration mij of each individual chemical component i. In order to calculate the total uptake of NH3 by SOA, one must know the representative wet surface area concentration of SOA (SSOA) (SOA hygroscopic growth is not considered in the model), which can be calculated as follows (assuming a uniform density across different chemical components):
where y is the total number of SOA species in mode j, z is the total number of aerosol species in mode j, and x is the total number of modes that contain SOA species. Here, x = 2 since SOAs only exist in the Aitken mode and the accumulation mode. From SSOA the first-order rate of NH3 uptake can be calculated as
where γ is the reactive uptake coefficient for ammonia and is the average speed of NH3 molecules (609 m s−1 at 298 K). The above calculations were performed separately for each grid cell at every time step to obtain the effective first-order rate constant for each individual cell at each time step. The first-order rate constant of NH3 uptake was then multiplied by the gas-phase NH3 concentration to determine the loss rate of NH3 in each cell at each time step.
In this study, all NH3 taken up by SOA carbonyls is assumed to form NOCs, such as secondary imines and heteroaromatic compounds (Laskin et al., 2015). In this reaction, the carbonyl group of an SOA compound is converted into an imine group and a molecule of water is produced as a by-product. The imine product can further react by an intermolecular cyclization to produce heterocyclic organic compounds, with a loss of an additional water molecule (Laskin et al., 2014). The difference in molecular weights of two H2O molecules and one NH3 molecule (2 × 18 − 17 = 19 g mol−1) is small relative to a molecular weight of a typical SOA compound (about 200 g mol−1). Therefore, for the sake of simplicity, we neglected the loss of the mass of particulate organics mass directly due to the NH3 uptake in this simulation. This assumption is supported by experimental observations described by Horne et al. (2018), in which SOA particles exposed to ammonia in a smog chamber did not change their size distribution but showed clear evidence of incorporation of organic nitrogen into the particles in online and offline mass spectra. Although, the NH3 uptake process does not directly impact the mass of SOA, the conversion of NH3 into NOCs can affect the SOA mass indirectly due to particle acidity changes. The particle acidity is altered because strongly basic NH3, which is converted into weakly basic NOCs, is no longer available to form inorganic salts of NH. As the extent of neutralization of inorganic acids with NH3 is reduced, the particle acidity may increase. Figure S1 in the Supplement shows a schematic representation of the NH3 reactions considered in the model, including reversible function of inorganic salts and irreversible formation of NOCs. The ability of NOCs to neutralize inorganic acids to form salts is not considered (see Fig. S1) because NOCs are generally much weaker bases (e.g., imine pKb ∼ 10, pyrrole pKb = 13.6, pyridine pKb = 8.8) compared to NH3 (pKb = 4.8). In other words, once NH3 is converted into NOCs, it is no longer available to make inorganic salts of nitrate and sulfate.
As current laboratory data are not detailed enough to model the chemical uptake coefficient of ammonia by individual SOA species explicitly, a range of uptake coefficients was selected and applied to all SOA species. In the future, this approach can be refined by adopting more explicit reactions between ammonia and various types of SOA compounds. The ammonia uptake coefficients (γ) used in this study were based on the values reported in the work of Liu et al. (2015), as well as the maximum possible extended conversion of SOA carbonyls into NOCs. Liu et al. (2015) reported a range of possible uptake coefficients from 10−5 to 10−2. However, some of our initial modeling tests showed that the use of a 10−2 uptake coefficient value would lead to an unrealistic amount of NH3 taken up by SOA, where within a single time step the number of moles of NH3 taken up exceeded 10 % of the total moles of SOA in one grid cell. Experiments (Horne et al., 2018; Liu et al., 2015) suggest that only 10 % or less of SOA molecules can react with NH3 to form nitrogen-containing organic compounds. Additionally, in the study of Liu et al. (2015), the uptake coefficients are measured based on only a few SOA species (SOA formed from ozonolysis of α-pinene and OH oxidation of m-xylene); other SOA species might not have the same reactivity. Furthermore, the highest value of the uptake coefficient was only observed at the initial period of the experiment of Liu et al. (2015) and decreased rapidly over time. Based on the considerations above, an uptake coefficient of 10−3 was considered a more reasonable upper limit value for our application instead of 10−2. Thus, four simulations were performed for each period to investigate the sensitivity of NH3 removal to changes in the uptake coefficient: (a) base case with no NH3 uptake, (b) NH3 uptake with γ = 10−3, (c) NH3 uptake with γ = 10−4, and (d) NH3 uptake with γ = 10−5.
Results from each simulation were evaluated by comparing with observations from multiple monitoring networks. Then simulation results for scenario (b)–(d) are compared to the base case results in (a) to determine the impact of different uptake coefficients on different gas- and particle-phase species. The value of γ was assumed to remain constant in each scenario (i.e., no saturation or aging effects), which means each scenario represents an upper limit for the amount of NH3 that would be taken up by SOA with the chosen value of the uptake coefficient. No further changes were made to the model or its inputs between each scenario. Results of the first 7 days of each simulations were discarded as a model spin-up period to minimize the effect of initial conditions and allow sufficient time for the NH3 removal process to occur.
3.1 Model validation
First, base case simulation results of PM2.5, PM10, and O3 are compared with the observations from the US Environmental Protection Agency's Air Quality System (AQS) to evaluate the model performance. The AQS network (https://www.epa.gov/aqs) is geographically diverse and spans the entire US. It is also an excellent source of quality-assured measurements, with hourly recorded concentrations for PM2.5, PM10, and O3. The statistical parameters used in this study are the mean normalized gross bias (MNGB), mean normalized gross error (MNGE), mean fractional bias (MFB), and mean fractional error (MFE). Definitions of these parameters are presented precisely in Table S1 in the Supplement.
Table 1 shows good model performance for O3, as the statistics meet the recommended performance criteria (|MNGB| ≤ 15 % and MNGE ≤ 30 %) (Russell and Dennis, 2000). Additionally, the maps of MNGB values of O3 measured by individual stations are available in Fig. S2. This maps show that most of the stations have low bias with some underestimation over the northeast in the winter and some general overestimation around the country in the summer. Only the two base case simulations are shown in Table 1 and Fig. S2, because the change in the NH3 uptake coefficient has no impact on O3 in the model. Table 2 shows the statistics for PM2.5 for both the summer and winter. Cases satisfied the model performance criteria proposed by Boylan and Russell (2006) with MFE ≤ 75 % and |MFB| ≤ 60 %. Additionally, the maps of MFB values of PM2.5 measured by individual stations are available in Fig. S3. The model performance for winter is much better than for the summer, as the amount of PM2.5 is overestimated during the summer. The impact of different NH3 uptake coefficients on PM2.5 is also reflected in the statistics. For the winter, increasing the NH3 uptake coefficient leads to a decrease in the total PM2.5 and a slightly better model performance when compared to the observations. On the contrary, larger NH3 uptake coefficients cause higher PM2.5 concentration during the summer, resulting in larger discrepancies compared with measurements. The reasons for such seasonal differences will be analyzed in Sect. 3.2.4. The statistics of PM10 show much closer agreement between the simulation results and the observations than PM2.5, as shown on Table S2, with the MFB values for each site mapped in Fig. S4. The MFE is similar to that of PM2.5, while much smaller MFB values are found for the summer. Similar to PM2.5, the increase in the NH3 uptake coefficient leads to a lower PM10 concentration for the winter, but a higher PM10 concentration for the summer. One possible explanation for the different performance between PM2.5 and PM10 could be the underestimation of coarse-mode particles due to the mode–species limitation of CMAQ. Most of the SOA species are not allowed to grow into the coarse mode and their mass could be trapped in the accumulation mode and therefore cause this overestimation.
Table 1Comparison between the base case simulation results for O3 and observations from the AQS network. (Obs. stands for observation. Sim. stands for simulation. Corr. stands for correlation. No. sites means number of observation sites used for statistics.)

Table 2Comparison between simulation results for PM2.5 and observations from the AQS network. (Obs. stands for observation. Sim. stands for simulation. Corr. stands for correlation. No. sites means number of observation sites used for statistics.)
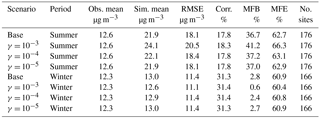
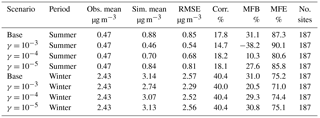
Table 3Comparison between simulation results for NH3 and observations from the AMoN network. (Obs. stands for observation. Sim. stands for simulation. Corr. stands for correlation. No. sites means number of observation sites used for statistics.)
Second, the simulated concentration of gas-phase NH3 is compared to observation data from the Ammonia Monitoring Network (AMoN). In each AMoN site, samples are deployed for 2-week periods. Details about the network and its sampling method can be found on NADP (2014). Table 3 shows the statistics between each simulation case and the measurement data, and the MFB values for ammonia measured by individual stations are presented in Fig. S5. The seasonal influence is quite clear in the statistics of the two base case simulations. Similar to PM2.5, the model overestimates the NH3 concentration for the summer, especially over the southeast and the Central Valley regions of California. On the contrary, the simulated NH3 concentration is underestimated for the winter. The impacts of different NH3 uptake coefficients on NH3 concentrations are consistent between the winter and the summer; the NH3 concentration decreases as the uptake coefficient increases. However, such impact is much more significant during the summer than the winter. Figure S6 shows the difference in MFE between the base cases and cases with different assumed values for NH3 uptake coefficients. For the winter cases, the overall impact on model performance is negligible. For the summer cases, improvements in model performance can be found in the southeast and the Central Valley regions of California. The choice of the γ = 10−4 appears to provide the greatest model performance improvement in the summer, based on both Table 3 and Fig. S6.
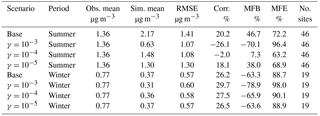
Table 4Comparison between simulation results for NH and observations from the CSN network. (Obs. stands for observation. Sim. stands for simulation. Corr. stands for correlation. No. sites means number of observation sites used for statistics.)
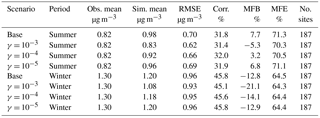
Table 5Comparison between simulation results for NO and observations from the CSN network. (Obs. stands for observation. Sim. stands for simulation. Corr. stands for correlation. No. sites means number of observation sites used for statistics.)
Finally, simulation results of individual inorganic aerosol compounds (e.g., NH, SO, and NO) are also compared with measurement data obtained from the EPA's Chemical Speciation Network (CSN). The CSN network collects 24 h integrated samples every day (midnight to midnight) of major fine-particle chemical components and most of the CSN sites are in urban areas. A detailed description of the network and its sampling protocol are available in Malm et al. (2004). The statistics for SO presented in Table S3 with the maps of MFB values for all individual sites (Fig. S11) indicate good model performance. There is good agreement between mean observed and simulated concentrations with small MFB and MFE values that satisfy the model performance goals proposed by Boylan and Russell (2006) (|MFB| ≤ 30 % and MFE ≤ 50 %). The statistics of other scenarios are not presented in the table, as the change in the NH3 uptake coefficient shows no observable impact on the SO statistics. This is due to the extremely low volatility of sulfuric acid, which forces almost the entire SO to be condensed into the aerosol phase, regardless of the concentration of NH3.
For NH (Table 4), in general, the statistics show a good model performance, as the MFB and MFE satisfied the model performance criteria proposed by Boylan and Russell (2006) in all eight scenarios. Additionally, Fig. S7 shows the level of bias (MFB) of individual CSN sites for the base case, which shows NH is considerably overestimated over the southeast but underestimated in the midwest regions of the country for both winter and summer. Based on Table 4, the NH is slightly overestimated in the base case for the summer period; however, the addition of NH3 uptake leads to a lower modeled NH concentration and reduced level of overestimation. Such improvements happen over most of the eastern US as well as the Central Valley of California, based on Fig. S8b and d, which present the difference in MFE between the base cases and cases with NH3 uptake coefficients. Similar to NH3, the γ = 10−4 case shows better model performance improvement than the γ = 10−3 case in the summer. For the winter, the NH concentration is slightly underestimated in the base case, so the decrease in the NH concentration caused by the increase in the NH3 uptake coefficient leads to an even larger underestimation. As shown on Fig. S8a and c, model performance is not improved in most of the stations, except over the southeast region.
Table 5 gives the statistics for NO. In general, the model overestimates the NO concentration for both periods, and a poor correlation is found for the summer. The relatively poor model performance with respect to NO is consistent with previous CMAQ studies (Appel et al., 2008; Eder and Yu, 2006). The addition of the NH3 uptake coefficient reduces the simulated NO concentration significantly. The γ = 10−3 case leads to a mean NO concentration which is much closer to the observed average than the base case in both simulated periods. Figure S9 shows the maps of MFB values for particulate nitrate measured by each station in the base cases. We find that the modeled NO is overestimated over the southeast region for both periods and also overestimated along the Central Valley of California during the summer period. The addition of NH3 uptake reduced such overestimation and improved the model performance in those regions as shown in Fig. S10, which presents the difference in MFE between base cases and cases with different NH3 uptake included. For the winter period, it is clear the γ = 10−3 case provides better model performance. For the summer period, the model performance improvement occurred on more observation sites in the γ = 10−4 case than the γ = 10−3 case. However, the γ = 10−3 case provides better improvement at some sites, although more sites suffer performance deterioration compared to the γ = 10−4 case. In summary, the model tends to perform better on the whole with NH3 uptake in SOA included with γ ∼ 10−3 to 10−4.
3.2 Air quality impacts
3.2.1 Impact on gas-phase NH3 and HNO3 concentrations
Figure S12 shows the time series of daily domain-averaged (averaged over 24 h and the simulation domain) NH3 for both the winter and summer, for different uptake coefficient values. In general, the NH3 concentration is reduced after the introduction of the SOA-based NH3 uptake process. The magnitude of the reduction is increased as the uptake coefficient increases. For the winter, the spatiotemporally averaged (averaged over entire period and the simulation domain) NH3 concentration for the base case is 0.44 ppb, while the value decreases to 0.43 ppb (−2.3 %) for the γ = 10−5 case, 0.41 ppb (−6.8 %) for the γ=10−4 case, and 0.31 ppb (−29.5 %) for the γ = 10−3 case. For the summer, the spatiotemporally averaged NH3 concentration for the base case is 2.30 ppb, while the value decreases to 2.10 ppb (−8.7 %) for the γ = 10−5 case, 1.58 ppb (−31.3 %) for the γ = 10−4 case, and 0.76 ppb (−67.0 %) for the γ = 10−3 case. The impact of the uptake process is higher for the summer due to larger SOA concentrations during the summer (spatiotemporally averaged 9.25 µg m−3 for the base case) than the winter (spatiotemporally averaged 2.72 µg m−3 for the base case).
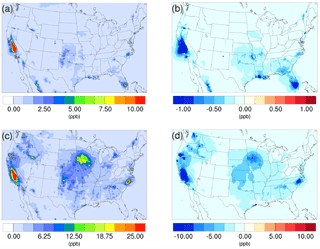
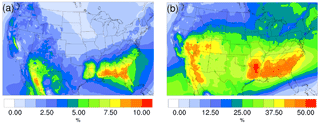
Figure 1Spatial distribution of time-averaged NH3 concentrations in the base case for (a) winter and (c) summer. Spatial distribution of the difference in time-averaged NH3 concentrations between the γ = 10−3 case and the base case for (b) winter and (d) summer. Negative values represent decreases in concentration with respect to the base case.
The spatial distribution of the impact over the simulated domain is also investigated. Figure 1a and c show the time-averaged spatial distribution of NH3 for the winter and summer base cases, while the differences between the γ = 10−3 case and the base case are shown in Fig. 1b and d. For both periods, the Central Valley of California is a hotspot for NH3 emissions, and the region exhibits the most significant impact due to the introduction of the new NH3 uptake mechanism. This is due to the intensive agricultural activities in this region including the heavy application of fertilizers (Krauter et al., 2002) and the year-round farming pattern supported by California's relatively warm climate. The hog farm industry is largely responsible for the high NH3 concentration, in North Carolina and north Iowa in the summer, where significant NH3 loss can also be spotted in the γ = 10−3 case. Agriculture and wild fires also produce some hotspots of ammonia concentration in others areas, such as southern Florida in the winter and several locations in northern California and Washington states, where NH3 concentrations also decreased significantly in the γ = 10−3 case. The spatial distribution of differences between the base case and the γ = 10−4 and γ = 10−5 cases is similar to the γ = 10−3 only with different scales. These differences are shown in Fig. S13.
As the condensation of HNO3 into the particle phase is directly associated with NH3 concentration, it is reasonable to infer that the introduction of the NH3 uptake mechanism could also impact the concentration of HNO3. Figure S14 shows the time series of daily-averaged HNO3 for both the winter and summer. In contrast to NH3, the integration of the NH3 uptake mechanism leads to an increase in HNO3 concentration, and the scale of magnitude of the increase rises as the uptake coefficient is increased, although its scale of variation is much smaller than that of NH3. For the winter, the difference between the base case and the γ = 10−5 case is very small (< 0.2 %) and remains insignificant for the γ = 10−4 case (∼ 1.2 %). Only the γ=10−3 case shows a significant increase in HNO3 as concentrations increase by 8.5 % (the spatiotemporally averaged concentration is 0.27 ppb for the base case and 0.30 ppb for the γ = 10−3 case). Similar to the NH3 variation, the impact becomes larger for the summer, where the spatiotemporally averaged HNO3 concentration for the base case is 0.51 ppb, while the value increases by 2.0 % (0.52 ppb) for the γ = 10−5 case, 7.8 % (0.55 ppb) for the γ = 10−4, case, and 19.6 % (0.61 ppb) for the γ = 10−3 case. These increase in HNO3 concentrations is due to the reduction in NH3 caused by the conversion of NH3 into NOCs, making less NH3 available for reaction with HNO3 to form the particle-phase NH4NO3.
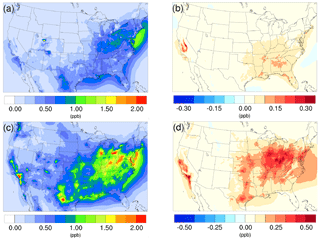
Figure 2Spatial distribution of time-averaged HNO3 concentrations in the base case for (a) winter and (c) summer. Spatial distribution of the difference in time-averaged HNO3 concentrations between the γ = 10−3 case and the base case for (b) winter and (d) summer. Positive values represent increases in concentration with respect to the base case.
The time-averaged spatial distributions of HNO3 for both the winter and summer base cases are presented in Fig. 2a and c. The northeast region exhibits relatively high HNO3 concentration for both periods, largely due to the high NOx (NO + NO2) emissions from transportation activities. The addition of the NH3 uptake process does not cause an obvious impact in this region for the winter, as the reduction of NH3 is very small (Fig. 1b) due to low SOA and NH3 concentrations in the base case. In contrast, the increase in HNO3 becomes much more significant for this region in the summer, as the loss of NH3 becomes greater due to larger NH3 and SOA concentrations in the base case. The winter hotspot around northeastern Utah (Uintah Basin) could be caused by the stagnant atmospheric conditions during the winter in the valley (Lee et al., 2014), which traps NOx emitted from local and remote sources located on the east side of the valley. The resulting NOx undergoes a nighttime reaction with O3, forming N2O5 (high N2O5 concentration is spotted in the model at the same place as shown on Fig. S24). Additionally, the lack of NH3 also favors the HNO3 accumulation, as a result, the addition of NH3 does not have much impact on this spot. The largest increase in HNO3 concentrations in winter is found over the Central Valley of California, which also corresponds to the largest NH3 reduction (Fig. 1b). For the summer, the largest impact occurs over the hotspot of southern California, where strong traffic emissions of NOx and active photochemistry provide a strong HNO3 source. The significant reduction of NH3 concentration from the south Central Valley could reduce the potential sink of HNO3 into the particle phase and leave more HNO3 in the gas phase. The spatial distribution of differences between the base case and the γ = 10−4 and γ = 10−5 cases is similar to the γ = 10−3 only with different scales, and they can be found in Fig. S15.
3.2.2 Impact on inorganic PM
One of the effects of the gas-phase NH3 reduction due to the inclusion of SOA-based NH3 conversion to NOCs would be the decrease in the NH concentration in the particle phase, as all NH originates from gas-phase NH3. Figure S16 shows the spatiotemporal evolution of daily-averaged NH for the winter and the summer. In general, the addition of NH3 uptake in the model causes a decrease in particle-phase NH concentration, and the impact is more significant for the summer than the winter. For the summer case, the average decrease in NH is 1.8 % for γ = 10−5, 10.7 % for γ = 10−4, and 28.2 % for γ = 10−3; for the winter case, the average decrease is 0.2 % for γ = 10−5, 2.3 % for γ = 10−4, and 13.2 % for γ = 10−3. Such behavior corresponds well to the level of NH3 reduction in Fig. S12 and is caused by the higher SOA concentrations during the summer.
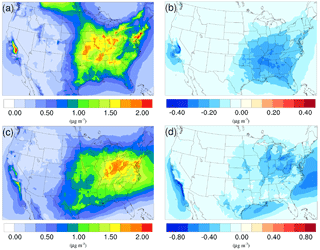
Figure 3Spatial distribution of time-averaged NH concentrations in the base case for (a) winter and (c) summer. Spatial distribution of the difference in time-averaged NH concentrations between the γ = 10−3 case and the base case for (b) winter and (d) summer. Negative values represent decreases in concentration with respect to the base case.
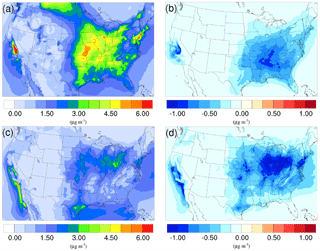
Figure 4Spatial distribution of time-averaged NO concentrations in the base case for (a) winter and (c) summer. Spatial distribution of the difference in time-averaged NO concentrations between the γ = 10−3 case and the base case for (b) winter and (d) summer. Negative values represent decreases in concentration with respect to the base case.
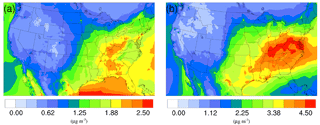
Figure 5Spatial distribution of time-averaged SO concentrations in the base case for (a) winter and (b) summer. The difference due to NH3 conversion into NOCs is not shown because it is very small.
The time-averaged spatial distributions of the NH concentration for both the winter and summer base case are shown on Fig. 3a and c. Most of the NH is concentrated over the eastern part of the US, as a result of high NH3 concentrations (see Fig. 1) in this region combined with the abundance of NH3 neutralizers (e.g., HNO3 and H2SO4). Another hotspot is the Central Valley of California and the South Coast Air Basin of California (Nowak et al., 2012), resulting from high NH3 emissions from the intensive agriculture (Fig. 1). In the presence of both HNO3 and H2SO4, NH3 is first neutralized by H2SO4 to form either (NH4)2SO4 or NH4HSO4 in the particle phase, while the rest of the NH3 reacts with HNO3 and forms particle-phase NH4NO3. The percentage of NH associated with NO, SO, and HSO could be investigated by comparing the spatial distribution of the NO concentration for the corresponding period in Fig. 4a and c and the SO in Fig. 5a and b. For the winter, the H2SO4 concentration is insufficient to neutralize all the NH3 for the mid-east region, so more NO is involved in the NH3 neutralization, and there are more nitrate particles than sulfate particles. For the summer, as the sulfate concentration almost doubles over the mid-east US compared to the winter, most of the NH3 is neutralized by H2SO4. This causes an absence of NO above this region and only appears on the surrounding region where sulfate concentration is low. For the West Coast and the Central Valley of California, the enriched NH mostly exists in the form of NH4NO3, as the sulfate concentration is low in this region for both periods. Figure 3b and d presents the spatial distribution of the difference in NH concentration between the γ = 10−3 case and the base case, which is highly correlated with the NH3 variation map (Fig. 1). The reduction in NH3 due to the SOA uptake directly impacts the available NH3 that could be condensed into the particle phase and reduces the NH concentration consequently. The spatial distribution of differences between the base case and the γ = 10−4 and γ = 10−5 cases is similar to the γ = 10−3 only with different scales, as shown in Fig. S17.
The concentration of NO also changes as a result of adding the NH3 conversion into NOCs. Figure S18 shows the variation in daily–spatially averaged NO concentration under different scenarios for both the winter and summer. Overall, adding the NH3 uptake mechanism leads to a decrease in NO concentrations for both periods. Similar to NH, the impact is more significant for the summer than the winter. The average reductions for the winter are 0.2 % for γ = 10−5, 1.9 % for γ = 10−4, and 10.9 % for γ = 10−3. For the summer, the average reductions are 1.9 % for γ = 10−5, 10.6 % for γ = 10−4, and 24.3 % for γ = 10−3. Such variations are similar to those of NH, where the γ = 10−5 case in the summer has similar reductions to the γ = 10−4 case in the winter. And the magnitude of the difference is also close to the difference in NH, indicating that almost all the NH reduction is from NH4NO3.
The spatial distributions of the NO variation due to the addition of the NH3 uptake mechanism (γ = 10−3) are presented in Fig. 4b and d for the winter and summer. By comparing with the base cases (see Fig. 4a and c), it is clear that most of the NO reduction occurs over regions with high NO concentration, such as the Central Valley of California, the South Coast Air Basin of California, and vast regions over the mid-east US. One exception is the high NO region over Canada on the north edge of Montana and North Dakota during the winter. Neither NH concentration nor NO concentration changes much, mostly because the SOA concentration is extremely low for that region (see Fig. 6a), so almost no NH3 is lost due to the SOA uptake. The same occurs in south Florida during the summer. The spatial distribution of differences between the base case and the γ = 10−4 and γ = 10−5 cases is similar to the γ = 10−3 only with different scales (shown in Fig. S19).
3.2.3 Impact on organic PM
Figure 6a and c show the time-averaged spatial distribution of SOA for the winter and summer base cases. For both seasons, high SOA concentrations are found over the southeastern US due to high vegetation coverage in this region, while hotspots in the northwestern region are caused by widespread fire events. The averaged SOA concentration is more than 3 times higher in the summer case (9.25 µg m−3) than in the winter (2.72 µg m−3), largely due to the much higher biogenic SOA (BIOSOA) concentrations (4.43 µg m−3 summer vs. 0.22 µg m−3 winter) resulting from elevated biogenic emissions in the warm season.
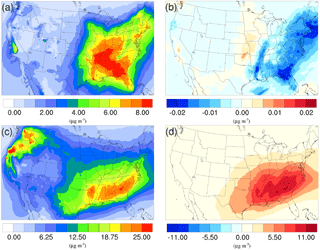
Figure 6Spatial distribution of time-averaged SOA concentrations in the base case for (a) winter and (c) summer. Spatial distribution of the difference in time-averaged SOA concentrations between the γ = 10−3 case and the base case for (b) winter and (d) summer. Positive values represent increases in concentration with respect to the base case, and negative values represent decreases in concentration with respect to the base case.
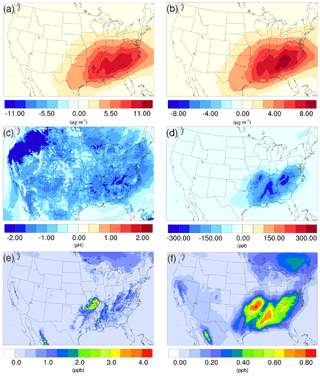
Figure 7Spatial distribution of the difference in time-averaged (a) biogenic SOA concentrations, (b) isoprene epoxydiols (IEPOX)-derived SOA concentrations, (c) particle acidity (pH), and (d) isoprene epoxydiols concentrations between the γ = 10−3 case and the base case during the summer. Spatial distribution of time-averaged (e) isoprene, and (f) isoprene epoxydiols concentration in the base case during the summer.
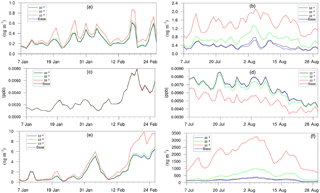
Figure 8Daily, spatially averaged concentrations of (a) particle-phase H+ in winter, (b) particle-phase H+ in summer, (c) isoprene epoxydiols in winter, (d) isoprene epoxydiols in summer, (e) isoprene-epoxydiol-derived SOA in winter, and (f) isoprene-epoxydiol-derived SOA in summer.
As mentioned in Sect. 2, the NH3 uptake parametrization used in this study does not directly add mass to SOA because the original SOA carbonyl and the NOCs they convert into have similar molecular weight. However, significant changes in SOA concentration are observed after implementing the NH3 uptake mechanism, which is indirectly caused by the changes in particle acidity (see below). As demonstrated in Fig. 6b and d, implementing the NH3 uptake mechanism has a significant impact on the SOA concentrations during the summer, but has almost no impact on SOA for the winter. Almost the entire increase in SOA concentrations in the summer is due to the mass change in biogenic SOA (see Figs. 7a and 6d; their average concentrations for the base case are in Fig. S20). Further investigation reveals that the majority of the increase (∼ 80 %) is caused by the nonvolatile AISO3 species (Fig. 7b), which is the isoprene epoxydiols (IEPOX)-derived SOA through the acid-catalyzed ring-opening reactions (Pye et al., 2013). This increase in AISO3 is caused by the increase in aerosol aqueous-phase acidity due to the reduction in NH after adding the NH3 conversion into NOCs. This increase in particle acidity corresponds well with the sensitivity study between NH3, SO, and particle pH presented in Fig. 2 of Weber et al. (2016), where particle pH is found to be more sensitive to NH3 concentrations than to SO concentrations. Figure 7c shows a large drop in pH value (∼ 0.9–2.3) (pH changes for other scenarios are shown in Fig. S21) in the southeast region where the increase in the AISO3 is most significant and there is a simultaneous decrease in IEPOX concentrations (Fig. 7d). The largest pH variation appears over the northwest region. However, there is no observable impact on SOA concentrations due to the extremely low concentration of both isoprene and IEPOX (see Fig. 7e and f) in this area. Moreover, the reduction in NH concentrations also increases the ratio of SO ∕ HSO, where SO can act as a nucleophile and promote the IEPOX uptake process. This also contributes to the increase in AISO3 in the γ = 10−3 case.
Figure 8 shows the time evolution of daily–spatially averaged H+, IEPOX, and AISO3 for both the winter and summer. Although the average H+ concentration in the base case is similar between two periods, the variation is much smaller for the winter largely due to the lower SO concentrations in the winter which restrain the acidity variation level. Additionally, lower SOA concentrations in winter also reduce the magnitude of NH variation. As a result, addition of the NH3 uptake mechanism does not have a large impact on the AISO3 concentration for most of the simulation (except for the last several days). On the contrary, the summer shows a significant increase in H+ concentrations as the NH3 uptake coefficient increases, while the concentration of IEPOX decreases. And the increase in AISO3 concentration is remarkable, with more than 10 times the growth on average between the γ = 10−3 case (1875.2 ng m−3) and the base case (181.75 ng m−3). The amount of growth on AISO3 seems linear with different values of the NH3 uptake coefficient (γ = 10−5: 16.2 %; γ = 10−4: 171.9 %; γ = 10−3: 931.6 %).
In addition to the isoprene epoxydiols pathway, other biogenic SOA species contribute the rest of the SOA changes (∼ 20 %), including other SOA species derived from isoprene (AISO1 and AISO2), from monoterpenes (ATRP1 and ATRP2), from sesquiterpenes (ASQT), and AOLGB, which represents the aged nonvolatile SOA origin from AISO1, AISO2, ATRP1, ATRP2, and ASQT. The common point with those SOAs (AISO1, AISO2, ATRP1, ATRP2, and ASQT) is that they all have a pathway to be formed through the oxidation between gas-phase NO3 radicals and their gas precursors. One possible explanation could be that the addition of NH3 uptake leads to an increase in gas-phase HNO3, which could shift the reaction balances between NO3 and HNO3 and leave more NO3 available for SOA oxidation.
3.2.4 Impact on total PM
Figure S22 presents the time evolution of daily-averaged concentrations of PM2.5 and PM10 in different scenarios during both periods. First, both the pattern and level of impact caused by the NH3 uptake mechanism is similar for PM2.5 and PM10, which indicates that most of the mass change due to this process occurs on fine particles. Secondly, the level of impact on both PM2.5 and PM10 is much more significant over the summer than the winter, which is consistent with previous analysis of individual species. Third, opposite impact patterns are found between the winter and summer. The inclusion of the NH3 uptake mechanism leads to a decrease in the total PM mass for the winter, which is caused by the reduction of inorganic NH and NO due to the decrease in the NH3 concentration, as detailed in Sect. 3.2.2. On the contrary, PM concentrations during the summer increase after adding the NH3 uptake mechanism. Although the concentration of inorganic species still decreases during the summer, the increase in biogenic SOA concentration, as detailed in Sect. 3.2.3, outpaces the decrease caused by inorganic species and leads to an overall increase in total PM mass for the summer. For the winter, the average PM2.5 concentration reduction is 0.07 % for the γ = 10−5 case, 0.59 % for the γ = 10−4 case, and 3.39 % for the γ = 10−3 case. For the summer, the average PM2.5 concentration increase is 0.14 % for the γ = 10−5 case, 2.05 % for the γ = 10−4 case, and 12.38 % for the γ = 10−3 case.
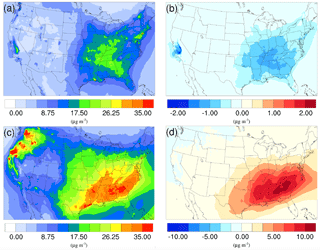
Figure 9Spatial distribution of time-averaged PM2.5 concentrations in the base case for (a) winter and (c) summer. Spatial distribution of the difference in time-averaged PM2.5 concentrations between the γ = 10−3 case and the base case for (b) winter and (d) summer. Positive values represent increases in concentration with respect to the base case, and negative values represent decreases in concentration with respect to the base case.
The spatial distribution of time-averaged PM2.5 concentration for the winter and summer is presented in Fig. 9a and c, respectively. Most of the high PM2.5 concentration happens over the mid-east US during the winter, with additional hotspots over the Central Valley of California, resulting in an overall average of 7.47 µg m−3. PM2.5 concentrations are highly correlated with the population density map of the US, indicating a dominant anthropogenic origin. The relatively low fraction of biogenic SOA in winter also supports this point (Fig. 10a). The model predicts a much higher PM2.5 concentration for the summer, with an average concentration of 16.17 µg m−3. The hotspots observed over the northwest of the country and coastal area over southeast Texas are caused by wild fire events. In general, high PM2.5 concentrations are predicted over the southeast of the US, where high fractions of biogenic SOA are presented in Fig. 10b. This could be a result of both high average temperatures during the summer and high vegetation density in that region. Figure 9b shows the variation in PM2.5 concentrations between the γ = 10−3 case and the base case for the winter. An overall reduction can be observed from the map, with the highest reduction around the Central Valley of California and a smaller reduction over the vast mid-east region. This is mostly caused by the decrease in NH4NO3 due to the reduction of gas-phase NH3 concentrations as discussed in Sect. 3.2.2. For the summer, although the decrease still appears over the northwest of the country, the prominent feature becomes a significant increase in PM2.5 concentrations over the southeast region. This is due to the increase in biogenic SOA resulting from the enhanced acid-catalyzed ring-opening reactions as detailed in Sect. 3.2.3.
In this study, the potential air quality impacts of the heterogeneous uptake of NH3 by SOA accompanied by formation of NOCs are investigated with the CMAQ model. Simulations over the continental US are performed for the winter and summer seasons of 2011 with a range of NH3 uptake coefficients reported in the literature. First, the simulation results for the two base case simulations are compared with observation data from different monitoring networks, and statistics show an overall good model performance for most of the criteria. The inclusion of the SOA-based NH3 conversion into NOCs has a significant impact on the statistics of NH3, NH, and NO, but does not affect O3 and SO. The overestimation of NH3 and NH for the summer is reduced by this new mechanism. Moreover, the prediction of NO is improved by this mechanism, given that the overestimation of NO concentration gradually subsides as the uptake coefficient increases.
The comparison between different uptake coefficient scenarios and the base case allows a more detailed understanding of the impact of this mechanism on both gas-phase and particle-phase species. Simulation results indicate a significant reduction in gas-phase NH3 due to conversion of NH3 into NOCs, and such reduction increases dramatically as the uptake coefficient increases. The highest spatially averaged reduction in gas-phase NH3 is 31.3 % in the winter and 67.0 % in the summer. This analysis is based on a range of uptake coefficients that span those reported in the literature. However, the actual value for each individual SOA could be lower or higher than the uniform uptake coefficient used in this study, although the magnitude of the impact still indicates the importance of including this process in air quality models. The seasonal differences are obvious as the impact is much more significant in the summer than in the winter, due to much higher NH3 and SOA concentration in the summer. The concentration of gas-phase HNO3 is also impacted by this new mechanism. As the NH3 concentration drops because it is being converted into NOCs, less HNO3 is neutralized by NH3, resulting in an overall increase in HNO3 concentration. Such increases can be as high as 8.5 % in the winter and 19.6 % in the summer for the largest uptake coefficient. Geographically, the biggest reduction in NH3 happens in the Central Valley of California during both seasons, the same location as the biggest increase in HNO3 in the winter. While for the summer, HNO3 increases more dramatically over the South Coast Air Basin of California and the northeast region of the country.
PM concentrations are found to decrease during the winter period, largely due to the reduction in ammonium nitrate formation caused by the decrease in gas-phase ammonia. The largest uptake scenario (γ = 10−3) leads to a 13.2 % reduction of NH, 10.6 % reduction of NO, and 3.4 % reduction of PM2.5 in the winter. The most significant reduction also happens over the Central Valley region of California with a highest PM2.5 drop of 2.0 µg m−3. On the other hand, PM concentrations are found to increase during the summer due to the increase in biogenic SOA production resulting from the enhanced acid-catalyzed ring-opening reactions. Although the reduction in ammonium nitrate is even larger in magnitude during the summer (28.2 % reduction in NH, 24.3 % reduction in NO) than the winter, the dramatic increase in biogenic SOA outpaced the decrease caused by ammonium nitrate to result in an overall increase in total PM (12.4 % increase in PM2.5). Most of the biogenic SOA increases occur over the southeast region of the US, where high vegetation density is located. The average increase in biogenic SOA is 0.9 % for γ = 10−5, 9.2 % for γ = 10−4, and 49.0 % for γ = 10−3. For the species (AISO3) that is responsible for most of the increase, the γ = 10−3 case leads to a 10-fold increase in concentration compared to the base case.
Results of this study show that the chemical uptake of NH3 by SOA can have a significant impact on the model-predicted concentration of important atmospheric pollutants, including NH3, HNO3, NH, NO, and biogenic SOA. The impact on the total PM has a distinct pattern on different seasons. Future laboratory studies should be conducted to identify the nature of the chemical reaction between NH3 and SOA species to provide more accurate model representation of the uptake process. Furthermore, better knowledge about basicity of NOCs is needed to verify whether they can neutralize inorganic acids. For example, single particle measurements conducted by Neuman et al. (2003) showed that organic aerosols also contributed to increases in fine-particle mass in regions with high NH3 emissions rates, suggesting that NH3 uptake can increase organic aerosol mass concentrations directly. Current air quality models only include one pathway for the acid-catalyzed SOA generation (based on the high NOx case in the study of Pye et al., 2013), and a more detailed representation of other acid-catalyzed pathways could lead to an even larger impact on the SOA concentration.
Simulation result data sets are available upon request as they are too big to upload online (812 GB). The original CMAQ (version 5.2) code for the base case simulation is available on the CMAS website: https://www.cmascenter.org/cmaq/. The updated CMAQ code including the NH3 uptake mechanism is available under the following link: http://albeniz.eng.uci.edu/software/CMAQv5.2_withNH3Uptake.zip. The CMAQ model has a GNU General Public License. The user can redistribute the model and/or modify the model under the terms of the GNU General Public License as published by the Free Software Foundation.
The supplement related to this article is available online at: https://doi.org/10.5194/acp-18-3641-2018-supplement.
The authors declare that they have no conflict of interest.
This publication was developed under Assistance Agreement no. EPA 83588101
awarded by the US Environmental Protection Agency to the Regents of the
University of California. It has not been formally reviewed by the EPA. The views
expressed in this document are solely those of the authors and do not
necessarily reflect those of the agency. The EPA does not endorse any products or
commercial services mentioned in this publication. We also express our
gratitude for UCI HPC assistance and especially to Harry Mangalam and Garr Updegraff
for their generous support, as well as to the UCI Research Computing group especially
Allen Schiano and Dana Roode.
Edited by: Kostas Tsigaridis
Reviewed by: two anonymous referees
Adams, L.: Mechanism for cb6r3_ae6_aq uses the following species, https://github.com/USEPA/CMAQ/blob/5.2/DOCS/User_Manual/Appendix_A/cb6r3_ae6_aq/CB6_species_table.md, last access: 15 December 2017. a
Amann, M., Klimont, Z., and Wagner, F.: Regional and global emissions of air pollutants: recent trends and future scenarios, Ann. Rev. Environ. Resour., 38, 31–55, 2013. a
Aneja, V. P., Chauhan, J., and Walker, J.: Characterization of atmospheric ammonia emissions from swine waste storage and treatment lagoons, J. Geophys. Res.-Atmos., 105, 11535–11545, 2000. a
Appel, K. W., Bhave, P. V., Gilliland, A. B., Sarwar, G., and Roselle, S. J.: Evaluation of the community multiscale air quality (CMAQ) model version 4.5: sensitivities impacting model performance; part II – particulate matter, Atmos. Environ., 42, 6057–6066, 2008. a
Baek, B. H. and Aneja, V. P.: Measurement and analysis of the relationship between ammonia, acid gases, and fine particles in Eastern North Carolina, J. Air Waste Manage. Assoc., 54, 623–633, 2004. a
Behera, S. N. and Sharma, M.: Investigating the potential role of ammonia in ion chemistry of fine particulate matter formation for an urban environment, Sci. Total Environ., 408, 3569–3575, 2010. a
Behera, S. N., Sharma, M., Aneja, V. P., and Balasubramanian, R.: Ammonia in the atmosphere: a review on emission sources, atmospheric chemistry and deposition on terrestrial bodies, Environ. Sci. Pollut. Res., 20, 8092–8131, 2013. a
Binkowski, F. S. and Roselle, S. J.: Models-3 Community Multiscale Air Quality (CMAQ) model aerosol component 1. Model description, J. Geophys. Res.-Atmos., 108, 4183, https://doi.org/10.1029/2001JD001409, 2003. a
Boylan, J. W. and Russell, A.G.: PM and light extinction model performance metrics, goals, and criteria for three-dimensional air quality models, Atmos. Environ., 40, 4946–4959, 2006. a, b, c
Byun, D. and Schere, K. L.: Review of the governing equations, computational algorithms, and other components of the Models-3 Community Multiscale Air Quality (CMAQ) modeling system, Appl. Mech. Rev., 59, 51–77, 2006. a
Eder, B. and Yu, S.: A performance evaluation of the 2004 release of Models-3 CMAQ, Atmos. Environ., 40, 4811–4824, 2006. a
Erisman, J. W., Sutton, M. A., Galloway, J., Klimont, Z., and Winiwarter, W.: How a century of ammonia synthesis changed the world, Nat. Geosci., 1, 636–639, 2008. a
Friedl, M. A., Sulla-Menashe, D., Tan, B., Schneider, A., Ramankutty, N., Sibley, A., and Huang, X.: MODIS Collection 5 global land cover: Algorithm refinements and characterization of new datasets, Remote Sens. Environ., 114, 168–182, 2010. a
Galloway, J. N., Townsend, A. R., Erisman, J. W., Bekunda, M., Cai, Z., Freney, J. R., Martinelli, L. A., Seitzinger, S. P., and Sutton, M. A.: Transformation of the nitrogen cycle: recent trends, questions, and potential solutions, Science, 320, 889–892, 2008. a
Hong, S.-Y., Dudhia, J., and Chen, S.-H.: A revised approach to ice microphysical processes for the bulk parameterization of clouds and precipitation, Mon. Weather Rev., 132, 103–120, 2004. a
Hong, S.-Y., Noh, Y., and Dudhia, J.: A new vertical diffusion package with an explicit treatment of entrainment processes, Mon. Weather Rev., 134, 2318–2341, 2006. a
Horne, J. R., Zhu, S., Montoya, J., Hinks, M. L., Nizkorodov, S. A., and Dabdub, D.: Reactive Uptake of Ammonia by Secondary Organic Aerosols: Implications for Air Quality, Atmos. Emviron., in review, 2018. a, b
Horowitz, L. W., Walters, S., Mauzerall, D. L., Emmons, L. K., Rasch, P. J., Granier, C., Tie, X., Lamarque, J. F., Schultz, M. G., Tyndall, G. S., Orlando, J. J., and Brasseur, G. P.: A global simulation of tropospheric ozone and related tracers: Description and evaluation of MOZART, version 2, J. Geophys. Res.-Atmos., 108, 4784, https://doi.org/10.1029/2002JD002853, 2003. a
Jovan, S. and McCune, B.: Air-quality bioindication in the greater central valley of calfornia, with epophytic macrolichen communities, Ecol. Appl., 15, 1712–1726, 2005. a
Kain, J. S.: The Kain–Fritsch convective parameterization: an update, J. Appl. Meteorol., 43, 170–181, 2004. a
Krauter, C., Goorahoo, D., Potter, C., and Klooster, S.: Ammonia emissions and fertilizer applications in California's Central Valley, Emission Inventories – Partnering for the Future, 11, 15–18, 2002. a
Laskin, A., Laskin, J., and Nizkorodov, S. A.: Chemistry of atmospheric brown carbon, Chem. Rev., 115, 4335–4382, 2015. a, b
Laskin, J., Laskin, A., Nizkorodov, S. A., Roach, P., Eckert, P., Gilles, M. K., Wang, B., Lee, H. J., and Hu, Q.: Molecular selectivity of brown carbon chromophores, Environ. Sci. Technol., 48, 12047–12055, 2014. a
Lee, L., Wooldridge, P. J., Gilman, J. B., Warneke, C., de Gouw, J., and Cohen, R. C.: Low temperatures enhance organic nitrate formation: evidence from observations in the 2012 Uintah Basin Winter Ozone Study, Atmos. Chem. Phys., 14, 12441–12454, https://doi.org/10.5194/acp-14-12441-2014, 2014. a
Lelieveld, J., Evans, J., Fnais, M., Giannadaki, D., and Pozzer, A.: The contribution of outdoor air pollution sources to premature mortality on a global scale, Nature, 525, 367–371, 2015. a
Lin, Y.-H., Knipping, E. M., Edgerton, E. S., Shaw, S. L., and Surratt, J. D.: Investigating the influences of SO2 and NH3 levels on isoprene-derived secondary organic aerosol formation using conditional sampling approaches, Atmos. Chem. Phys., 13, 8457–8470, https://doi.org/10.5194/acp-13-8457-2013, 2013. a
Liu, Y., Liggio, J., Staebler, R., and Li, S.-M.: Reactive uptake of ammonia to secondary organic aerosols: kinetics of organonitrogen formation, Atmos. Chem. Phys., 15, 13569–13584, https://doi.org/10.5194/acp-15-13569-2015, 2015. a, b, c, d, e, f, g
Malm, W. C., Schichtel, B. A., Pitchford, M. L., Ashbaugh, L. L., and Eldred, R. A.: Spatial and monthly trends in speciated fine particle concentration in the United States, J. Geophys. Res.-Atmos., 109, D03306, https://doi.org/10.1029/2003JD003739, 2004. a
McCulloch, R. B., Few, G. S., Murray, G. C., and Aneja, V. P.: Analysis of ammonia, ammonium aerosols and acid gases in the atmosphere at a commercial hog farm in eastern North Carolina, USA, Environ. Pollut., 102, 263–268, 1998. a
Na, K., Song, C., Switzer, C., and Cocker, D. R.: Effect of ammonia on secondary organic aerosol formation from α-pinene ozonolysis in dry and humid conditions, Environ. Sci. Technol., 41, 6096–6102, 2007. a
NADP: Ambient Ammonia Monitoring Network (AMoN), http://nadp.sws.uiuc.edu/AMoN/AMoNFactSheet.pdf (last access: 25 September 2017), 2014. a
NCEP: National Weather Service, NCEP FNL, Operational Model Global Tropospheric Analyses, NOAA, US Department of Commerce, continuing from July 1999, Research Data Archive at the National Center for Atmospheric Research, Computational and Information Systems Laboratory, https://doi.org/10.5065/D6M043C6, 2000. a
Neuman, J. A., Nowak, J. B., Brock, C. A., Trainer, M., Fehsenfeld, F. C., Holloway, J. S., Hübler, G., Hudson, P. K., Murphy, D. M., Nicks, D. K., and Orsini, D.: Variability in ammonium nitrate formation and nitric acid depletion with altitude and location over California, J. Geophys. Res.-Atmos., 108, 4557, https://doi.org/10.1029/2003JD003616, 2003. a, b
Nowak, J., Neuman, J., Bahreini, R., Middlebrook, A., Holloway, J., McKeen, S., Parrish, D., Ryerson, T., and Trainer, M.: Ammonia sources in the California South Coast Air Basin and their impact on ammonium nitrate formation, Geophys. Res. Lett., 39, L07804, https://doi.org/10.1029/2012GL051197, 2012. a
Otte, T. L. and Pleim, J. E.: The Meteorology-Chemistry Interface Processor (MCIP) for the CMAQ modeling system: updates through MCIPv3.4.1, Geosci. Model Dev., 3, 243–256, https://doi.org/10.5194/gmd-3-243-2010, 2010. a
Park, R. S., Lee, S., Shin, S.-K., and Song, C. H.: Contribution of ammonium nitrate to aerosol optical depth and direct radiative forcing by aerosols over East Asia, Atmos. Chem. Phys., 14, 2185–2201, https://doi.org/10.5194/acp-14-2185-2014, 2014. a
Pierce, T. E. and Waldruff, P. S.: PC-BEIS: a personal computer version of the biogenic emissions inventory system, J. Air Waste Manage. Assoc., 41, 937–941, 1991. a
Pinder, R. W., Strader, R., Davidson, C. I., and Adams, P. J.: A temporally and spatially resolved ammonia emission inventory for dairy cows in the United States, Atmos. Environ., 38, 3747–3756, 2004. a
Pinder, R. W., Adams, P. J., Pandis, S. N., and Gilliland, A. B.: Temporally resolved ammonia emission inventories: Current estimates, evaluation tools, and measurement needs, J. Geophys. Res.-Atmos., 111, D16310, https://doi.org/10.1029/2005JD006603, 2006. a
Pope III, C. A., Burnett, R. T., Thun, M. J., Calle, E. E., Krewski, D., Ito, K., and Thurston, G. D.: Lung cancer, cardiopulmonary mortality, and long-term exposure to fine particulate air pollution, J. Am. Med. Assoc., 287, 1132–1141, 2002. a
Pye, H. O., Pinder, R. W., Piletic, I. R., Xie, Y., Capps, S. L., Lin, Y. H., Surratt, J. D., Zhang, Z., Gold, A., Luecken, D. J., and Hutzell, W. T. : Epoxide pathways improve model predictions of isoprene markers and reveal key role of acidity in aerosol formation, Environ. Sci. Technol., 47, 11056–11064, 2013. a, b
Pye, H. O.: CMAQv5.1 SOA Update, https://www.airqualitymodeling.org/index.php/CMAQv5.1_SOA_Update (last access: 25 September 2017), 2016. a
Russell, A. and Dennis, R.: NARSTO critical review of photochemical models and modeling, Atmos. Environ., 34, 2283–2324, 2000. a
Seinfeld, J. H. and Pandis, S. N.: Atmospheric chemistry and physics: from air pollution to climate change, John Wiley & Sons, New York, 2016. a
Sheppard, L. J., Leith, I. D., Mizunuma, T., Neil Cape, J., Crossley, A., Leeson, S., Sutton, M. A., Dijk, N., and Fowler, D.: Dry deposition of ammonia gas drives species change faster than wet deposition of ammonium ions: evidence from a long-term field manipulation, Global Change Biol., 17, 3589–3607, 2011. a
Skamarock, W., Klemp, J., Dudhia, J., Gill, D., Barker, D., Duda, M., Huang, X., Wang, W., and Powers, J.: A description of the Advanced Research WRF Version 3, NCAR technical note, Mesoscale and Microscale Meteorology Division, National Center for Atmospheric Research, Boulder, Colorado, USA, 2008. a
Sutton, M., Pitcairn, C. E., and Fowler, D.: The exchange of ammonia between the atmosphere and plant communities, Adv. Ecol. Res., 24, 301–393, 1993. a
Updyke, K. M., Nguyen, T. B., and Nizkorodov, S. A.: Formation of brown carbon via reactions of ammonia with secondary organic aerosols from biogenic and anthropogenic precursors, Atmos. Environ., 63, 22–31, 2012. a, b
US EPA: User's Guide to MOBILE6.1 and MOBILE6.2, Environmental Protection Agency, Ann Arbor, USA, 2003. a
US EPA: Guidance on the use of models and other analyses for demonstrating attainment of air quality goals for ozone, PM2.5, and regional haze, US Environmental Protection Agency, Office of Air Quality Planning and Standards, Research Triangle Park, North Carolina, 2007. a
US EPA: 2014 National Emissions Inventory (NEI) Technical Support Document (TSD), https://www.epa.gov/sites/production/files/2016-12/documents/nei2014v1_tsd.pdf (last access: 12 July 2017), 2017a. a
US EPA: SMOKE v4.5 User's Manual, https://www.cmascenter.org/smoke/documentation/4.5/manual_smokev45.pdf (last access: 12 July 2017), 2017b. a
Vayenas, D. V., Takahama, S., Davidson, C. I., and Pandis, S. N.: Simulation of the thermodynamics and removal processes in the sulfate-ammonia-nitric acid system during winter: Implications for PM2.5 control strategies, J. Geophys. Res.-Atmos., 110, D07S14, https://doi.org/10.1029/2004JD005038, 2005. a
Wang, Y., Zhang, Q. Q., He, K., Zhang, Q., and Chai, L.: Sulfate-nitrate-ammonium aerosols over China: response to 2000–2015 emission changes of sulfur dioxide, nitrogen oxides, and ammonia, Atmos. Chem. Phys., 13, 2635–2652, https://doi.org/10.5194/acp-13-2635-2013, 2013. a
Warner, J., Dickerson, R., Wei, Z., Strow, L., Wang, Y., and Liang, Q.: Increased atmospheric ammonia over the world's major agricultural areas detected from space, Geophys. Res. Lett., 44, 2875–2884, 2017. a
Weber, R. J., Guo, H., Russell, A. G., and Nenes, A.: High aerosol acidity despite declining atmospheric sulfate concentrations over the past 15 years, Nat. Geosci., 9, 282–285, 2016. a
West, J. J., Ansari, A. S., and Pandis, S. N.: Marginal PM25: nonlinear aerosol mass response to sulfate reductions in the Eastern United States, J. Air Waste Manage. Assoc., 49, 1415–1424, 1999. a
Xu, L. and Penner, J. E.: Global simulations of nitrate and ammonium aerosols and their radiative effects, Atmos. Chem. Phys., 12, 9479–9504, https://doi.org/10.5194/acp-12-9479-2012, 2012. a
Yarwood, G., Jung, J., Whitten, G. Z., Heo, G., Mellberg, J., and Estes, M.: Updates to the Carbon Bond mechanism for version 6 (CB6), in: 2010 CMAS Conference, October 2010, Chapel Hill, NC, http://www.cmascenter.org/conference/2010/abstracts/emery_updates_carbon_2010. pdf (last access: 18 August 2017), 2010. a
Ye, X., Ma, Z., Zhang, J., Du, H., Chen, J., Chen, H., Yang, X., Gao, W., and Geng, F.: Important role of ammonia on haze formation in Shanghai, Environ. Res. Lett, 6, 024019, https://doi.org/10.1088/1748-9326/6/2/024019, 2011. a


