the Creative Commons Attribution 4.0 License.
the Creative Commons Attribution 4.0 License.
 | 12 Mar 2018
Ice-nucleating particle concentrations unaffected by urban air pollution in Beijing, China
Jie Chen
Zhijun Wu
Stefanie Augustin-Bauditz
Sarah Grawe
Markus Hartmann
Xiangyu Pei
Zirui Liu
Dongsheng Ji
Heike Wex
Exceedingly high levels of PM2.5 with complex chemical composition occur frequently in China. It has been speculated whether anthropogenic PM2.5 may significantly contribute to ice-nucleating particles (INP). However, few studies have focused on the ice-nucleating properties of urban particles. In this work, two ice-nucleating droplet arrays have been used to determine the atmospheric number concentration of INP (NINP) in the range from −6 to −25 ∘C in Beijing. No correlations between NINP and either PM2.5 or black carbon mass concentrations were found, although both varied by more than a factor of 30 during the sampling period. Similarly, there were no correlations between NINP and either total particle number concentration or number concentrations for particles with diameters >500 nm. Furthermore, there was no clear difference between day and night samples. All these results indicate that Beijing air pollution did not increase or decrease INP concentrations in the examined temperature range above values observed in nonurban areas; hence, the background INP concentrations might not be anthropogenically influenced as far as urban air pollution is concerned, at least in the examined temperature range.
- Article
(5019 KB) - Full-text XML
-
Supplement
(562 KB) - BibTeX
- EndNote


Formation of the ice phase in clouds can be modulated by aerosols emitted from anthropogenic and natural sources (Morris et al., 2014; Murray et al., 2012; Rosenfeld et al., 2008) via heterogeneous ice nucleation (Pruppacher et al., 1998). This results in a significant impact on the extent, lifetime, formation of precipitation and radiative properties of clouds (DeMott et al., 2010). Currently, four mechanisms are proposed for heterogeneous ice nucleation in mixed-phase clouds: deposition ice nucleation, condensation freezing, immersion freezing and contact freezing (Vali et al., 2015; Hoose and Möhler, 2012). It is under discussion whether condensation freezing is different from immersion freezing on a fundamental level (Wex et al., 2014) and whether at least some of the observed deposition ice nucleation can be attributed to pore condensation and freezing (Marcolli, 2014). For mixed-phase clouds, immersion freezing has been widely reported to be the most important ice nucleation mechanism (Ansmann et al., 2008; Murray et al., 2012; Westbrook and Illingworth, 2013). During the past decades, great efforts have been dedicated to understanding heterogeneous ice nucleation. However, it has become obvious that many fundamental questions in this field are still unsolved (Kanji et al., 2017).
Numerous studies have attempted to quantify the ice nucleation ability of selected aerosol particles of a specific composition in immersion mode, such as dust (DeMott et al., 2015; Kaufmann et al., 2016; DeMott et al., 2003), marine (Wilson et al., 2015; DeMott et al., 2016; Alpert et al., 2011) and biological particles (Pummer et al., 2012; Hartmann et al., 2013; Fröhlich-Nowoisky et al., 2015). Szyrmer and Zawadzki (1997), Hoose and Möhler (2012), Murray et al. (2012) and Kanji et al. (2017) are all reviews which give a more extensive overview over materials that can induce ice nucleation. In general, biogenic particles have been assumed to provide atmospheric ice-nucleating particles (INP) which are ice-active in the immersion mode at comparably high temperatures (above −15 ∘C, Murray et al., 2012; Petters and Wright, 2015). Ice activity at lower temperatures is attributed to mineral dust particles (Murray et al., 2012), while the role of soot particles in atmospheric ice nucleation is still debated (Kanji et al., 2017).
Biogenic particles in general have long been known to be able to induce ice nucleation at comparably high temperatures above −10 ∘C (e.g., Schnell and Vali, 1972). It has been widely accepted that biological particles can act as efficient INP, with some bacteria and fungi reported to possess the ability to arouse freezing at temperatures as high as −2 to −5 ∘C (Lundheim, 2002). Fungal spores (O'Sullivan et al., 2016; Pummer et al., 2015) and lichen (Moffett et al., 2015) are known to nucleate ice in the temperature range above −10 ∘C, while pollen (Augustin et al., 2013; Pummer et al., 2012) may compete with mineral dust particles in terms of their ability to nucleate ice, albeit not in terms of their atmospheric abundance.
Recognized as the dominant INP in mixed-phase clouds (Kamphus et al., 2010), particles from various mineral dusts were found to catalyze ice formation effectively in chamber experiments (Murray et al., 2012; Kanji et al., 2017). Among mineral dust particles, those containing K feldspar might be particularly ice-active (Atkinson et al., 2013).
In general, burning of liquid fuels produces soot particles (i.e., particles that are mostly organic), while burning of solid material, e.g., biomass or coal, will also produce ash particles which contain the inorganic components that made up the fuel. Umo et al. (2015) and Grawe et al. (2016) examined the ice activity of ash particles from wood and coal burning in the immersion mode and both found that these particles are ice-active. In Grawe et al. (2016), ash particles with atmospherically relevant sizes of 300 nm were examined and the most active particles came from a sample of fly ash from a coal burning power plant, inducing immersion freezing below −22 ∘C. Both Umo et al. (2015) and Grawe et al. (2016) suggest that ash particles might play a role in the atmosphere; however, they point to a lack of knowledge of their atmospheric abundance. Also, different ash samples showed different ice activities, and large differences in the results between the methods used for the examination were also described; i.e., it is still inconclusive whether ash particles might play an important role in atmospheric INP.
Although there has been a considerable number of studies aimed at understanding the ability of particles that contain black carbon (BC) acting as INP, the results are still controversial. Some studies show that BC-containing particles did not act as good INP (Schill et al., 2016; Chou et al., 2013). Chou et al. (2013) observed that soot particles from diesel engines and wood burning form ice at −40 ∘C, and unrealistically high relative humidity (RH) was needed for freezing initiation above this temperature. Schill et al. (2016) showed that neither fresh nor aged emissions from diesel engines contributed appreciably to atmospheric INP concentrations. However, some studies considered BC-containing particles as possible INP (Cozic et al., 2008; Levin et al., 2016; Cozic et al., 2007). Observation of abundant BC in ice particle residuals in field experiments suggested that some BC-containing particles may preferentially act as INP (Cozic et al., 2008). In the experiments conducted by Levin et al. (2016), emissions of different types of biomass fuel produced measurable concentrations of INP (0.1–10 cm−3) associated with higher BC concentration accounting for about 0–70 %. Determination of ice-nucleating properties of physically and chemically aged soot particles suggests that the heterogeneous ice nucleation activity of freshly emitted diesel soot particles is sensitive to some of the aging processes (Kulkarni et al., 2016).
In the atmosphere of urban areas with dense populations, various sources and complex aging transformations (such as coagulation, condensation of vapor and chemical reactions) of particles can be found. Particularly, urban aerosol may be rich in BC-containing particles resulting from anthropogenic activities, such as fossil fuel combustion and biomass burning (Bond et al., 2013), which were speculated to play a role in the formation of ice in clouds (Kanji et al., 2017). However, the ice-nucleating properties of particles produced in urban regions have rarely been the focus of previous studies. Exceptions are Knopf et al. (2010) and Corbin et al. (2012), examining the ice nucleation activity of particles in the anthropogenically influenced atmospheric aerosol in Mexico City and Toronto, respectively. In both studies the relative humidity at which measurements were made were below water vapor saturation (with respect to liquid water). Using filter samples, Knopf et al. (2010) state that organic particles included in their samples might potentially induce ice nucleation at conditions relevant to cirrus formation. Corbin et al. (2012) used a CFDC (Continuous-Flow Diffusion Chamber) operating at −33 ∘C together with a particle mass spectrometer. Statistical limitations impeded a statistical sound analysis, but their data suggest that dust particles, particles from biomass burning and particles containing elemental carbon might be sources of INP in their experimental conditions. They explicitly encourage further studies of these particle types concerning their role as possible INP.
In the present study, we measured the ice-nucleating activity of urban aerosols in parallel with BC and PM2.5 mass concentration and particle number concentrations in the atmosphere of the megacity Beijing, which is frequently experiencing heavy pollution. During heavy haze episodes, PM2.5 mass concentration can be several hundred micrograms per cubic meter and composed of a complex mixture of different chemical components (organic matter, inorganic ions and black carbon) (Zheng et al., 2016). The goal of this project is to find out whether anthropogenic sources which are dominant in the urban atmosphere significantly contribute to the local INP concentrations, focusing particularly on the ice-nucleating ability of BC in urban aerosols.
2.1 Sample collection and particle number measurement
The sampling site for particle collection was on the roof of a six-floor building (about 30 m above ground level) on the campus of Peking University (39∘59′20 N, 116∘18′26 E), located in the northwestern urban area of Beijing.
Particles with an aerodynamic diameter less than or equal to 2.5 micrometers (PM2.5) were collected on quartz fiber (Whatman, 1851-865) and PTFE filters (Whatman, 7592-104) using a 4-channel sampler with 2.5 µm impactors from 27 November 2016 to 1 December 2016 and 13 December 2016 to 22 December 2016. Daytime filters were collected from 08:00 to 20:00 and nighttime filters were collected from 20:00 to 08:00 with an air flow rate of 16.7 L min−1, resulting in a total volume of air sampled on each filter of ∼12 000 L. Note that all sample volumes used herein were converted to standard volumes. The quartz filters were treated before the sampling by heating them to 550 ∘C for 6 h. After sampling, all filters were kept at 18 ∘C during storage, and the INP analysis was done within 20 days, starting on 5 February 2017.
A scanning mobility particle sizer (SMPS, TSI Inc., USA) system was used to obtain particle number distribution in the 3–700 nm (electrical mobility diameter) size range during the sampling period, while an aerodynamic particle sizer (APS, TSI model 3321, TSI Inc., USA) measured particle number size distributions between 800 nm and 2.5 µm (aerodynamic diameter). The APS results were transformed from aerodynamic diameter to Stokes diameter with a particle density of 1.5 g cm−3, which was measured by a CPMA (centrifugal particle mass analyzer) and combined with the measured and inverted size distributions obtained from the SMPS. From these combined size distributions, we calculated the total particle number concentration of particles in the diameter range from 3 nm to 2.5 µm (Ntotal) and number concentrations of particles larger than 500 nm (N>500 nm). When comparing with filter results, we use 12 h average values of Ntotal and N>500 nm, where the averages were always made from 08:00 to 20:00 for daytime data and from 20:00 to 08:00 for nighttime data. N>500 nm was derived, as in general larger particles are expected to be more efficient INP, and also as this size range was selected in DeMott et al. (2010, 2015) to serve as a base for parameterizations of INP number concentrations.
Concentrations of BC were continuously measured by a multi-angle absorption photometer (5012 MAAP, Thermo Fisher Scientific, Waltham, MA, USA) utilizing a 637 nm LED as a light source (Müller et al., 2011). The instrument measures the absorption of particles collected on a filter with a time resolution of 5 min and automatically derives BC mass concentration from the measurement while accounting for multiple scattering occurring on the filter. It might be worth noting that a comparison of BC concentrations obtained from the MAAP with concentrations of elemental carbon (EC) determined by a filter-based SUNSET EC/OC analyzer during a different field campaign showed that both instruments measured the same trends, while the mean ratio of concentrations of BC to EC was about 1.35.
2.2 Chemical analysis
Two PTFE filters were always sampled in parallel, and while one was used for INP analysis, the other was selected for the total mass and water-soluble ion analysis. PM2.5 mass concentration was obtained with an analytical balance by the gravimetric method (Mettler Toledo AG285) (Yang et al., 2011). As for water-soluble inorganic compounds analysis, Guo et al. (2012) described the method for seven major ions (K+, Mg2+, Ca2+, , , and Cl−) measured by an ion chromatograph (DIONEX, ICS-2500/2000) based on the usage of PTFE filters. Post-sampling, all filters were stored in the refrigerator at −18 ∘C before analysis.
2.3 INDA and LINA analysis
Two devices called INDA (Ice Nucleation Droplet Array) and LINA (Leipzig Ice Nucleation Array) have been set up at the Leibniz Institute for Tropospheric Research (TROPOS) in Germany following the design described in Conen et al. (2012) and in Budke and Koop (2015), respectively. INDA was used to investigate the immersion freezing properties of the quartz fiber filter samples, while LINA was used to test the particles on PTFE filters.
INDA consists of a thermostat (JULABO FP40) with a 16 L cooling bath. A total of 96 circles (1 mm in diameter each) of each quartz filter were cut out by a punch and immersed separately in the tubes of a PCR (polymerase chain reaction) tray which each contained 50 µL distilled water. While Conen et al. (2012) originally used separate Eppendorf Tubes®, the use of PCR trays for immersion freezing studies was suggested before in Hill et al. (2016) and was adapted in the LINA setup. The PCR trays were placed on a sample holder and exposed to decreasing temperatures with a cooling rate of approximately 1 K min−1 in the cooling bath down to −30 ∘C. Real-time images of the PCR trays were recorded every 6 s by a CCD (charge-coupled device) camera. A flat light that was fixed at the bottom of the cooling bath helped to yield proper contrast between frozen and unfrozen droplets on the recorded pictures, so that frozen droplets could be identified according to the brightness change during the freezing process. A program recorded the current temperature of the cooling bath and related it to the real-time images from the CCD camera. The temperature in the PCR trays had been calibrated previously as described in Sect. A1.1 of the Appendix.
For the measurement of ice-nucleating particles at lower temperature, LINA was built according to an optical freezing array named BINARY, which was described in detail by Budke and Koop (2015). PTFE filters collected during the same period as quartz fiber filters were used for LINA. Half of the PTFE filter of each day was immersed in 10 mL distilled water and shaken for 1 h to wash particles off. For each measurement, 90 droplets with the volume of 1 µL were pipetted from the resulting suspension onto a thin hydrophobic glass slide (diameter 40 mm, thickness 0.13–0.16 mm, obtained from Marienfeld-Superior), with each droplet being contained in a separate compartment. These compartments were round holes with diameters of 3 mm, drilled into an aluminium plate with a diameter of 40 mm and a thickness of 14 mm. Both the hydrophobic glass slide and the aluminium plate with the compartments were surrounded by an aluminium ring with an inner diameter of 40 mm, which acted to keep the glass slide and aluminium plate in place. The slide, plate and ring were all arranged before the droplets were pipetted. A second thin glass slide was put on top of the plate so that the compartments were all separated from each other and evaporation of the droplets was prevented. The droplets were cooled on a Peltier element with a cooling rate of 1 K min−1. There was a thin oil (squalene) film between the hydrophobic glass slide and the Peltier element for optimal heat conductivity. The temperature on the glass slide had been determined previous to the experiments as described in Sect. 1.2 of the Appendix, and the temperature shift between that set on the Peltier element and that observed on the glass slide was accounted for in the data presented herein. The freezing process again was recorded by taking pictures with a CCD camera every 6 s and detecting the freezing based on a change in the reflectance of the droplets upon freezing.
As mentioned above, the temperature calibration for these two instruments is described in detail in Sects. A1.1 and A1.2 of the Appendix. The background freezing signal of pure distilled water and circles cut from clean filters were tested as well. These results are shown in Sect. A2 of the Appendix.
The measurements resulted in frozen fractions (fice) as defined in Eq. (1):
where Nfrozen is the number of frozen tubes or droplets at a certain temperature and Nt is the total number of tubes in PCR trays (i.e., 96) or droplets on the slides (i.e., 90).
The temperature-dependent cumulative number concentration of INP (NINP) per volume of sampled air was calculated according to Eq. (2), similarly to Vali (1971) and Conen et al. (2012):
where Vsampled is the volume of air converted to standard conditions (0 ∘C and 1013 hPa) from which the particles were collected that were suspended in each of the droplets in LINA or that were collected on each filter punch used for INDA measurements, respectively.
The chemical ion analysis in Sect. 3.1 and the determination of the PM2.5 mass concentration was done at Peking University. The filters used for INP measurements were brought to TROPOS where the INP measurements were then done. Filters were continuously cooled below 0 ∘C in a portable ice box during transport.
3.1 Severe PM2.5 pollution in Beijing
Figure 1 shows the time series of PM2.5 mass concentrations and chemical composition during the sampling period. The PM2.5 mass concentration with a mean value of 97.30±77.9 µg m−3 ranged from 6.54 µg m−3 up to 273.06 µg m−3. Here, the cases with PM2.5 above 50 µg m−3 were defined as polluted days, whereas the rest were defined as clean days. On average, the sulfate, nitrate and ammonia (SNA) accounted for around 35 % of PM2.5 during the whole period with an obvious enhancement on polluted days (53 %), indicating that generation of secondary particulate mass is one major contributor to the formation of particulate pollution, as has previously been described in Guo et al. (2010) and Zheng et al. (2016). In this study, when we refer to secondarily formed particulate matter, this will always mainly stand for SNA and secondary organic substances. Dust particles are in the coarse mode and only contribute little to the total PM2.5 load (Lu et al., 2015; Li and Shao, 2009). In these studies, Ca2+ as a tracer for dust particles showed a low proportion in PM2.5, suggesting that the dust particles also only contributed little to PM2.5 during our observations as well.
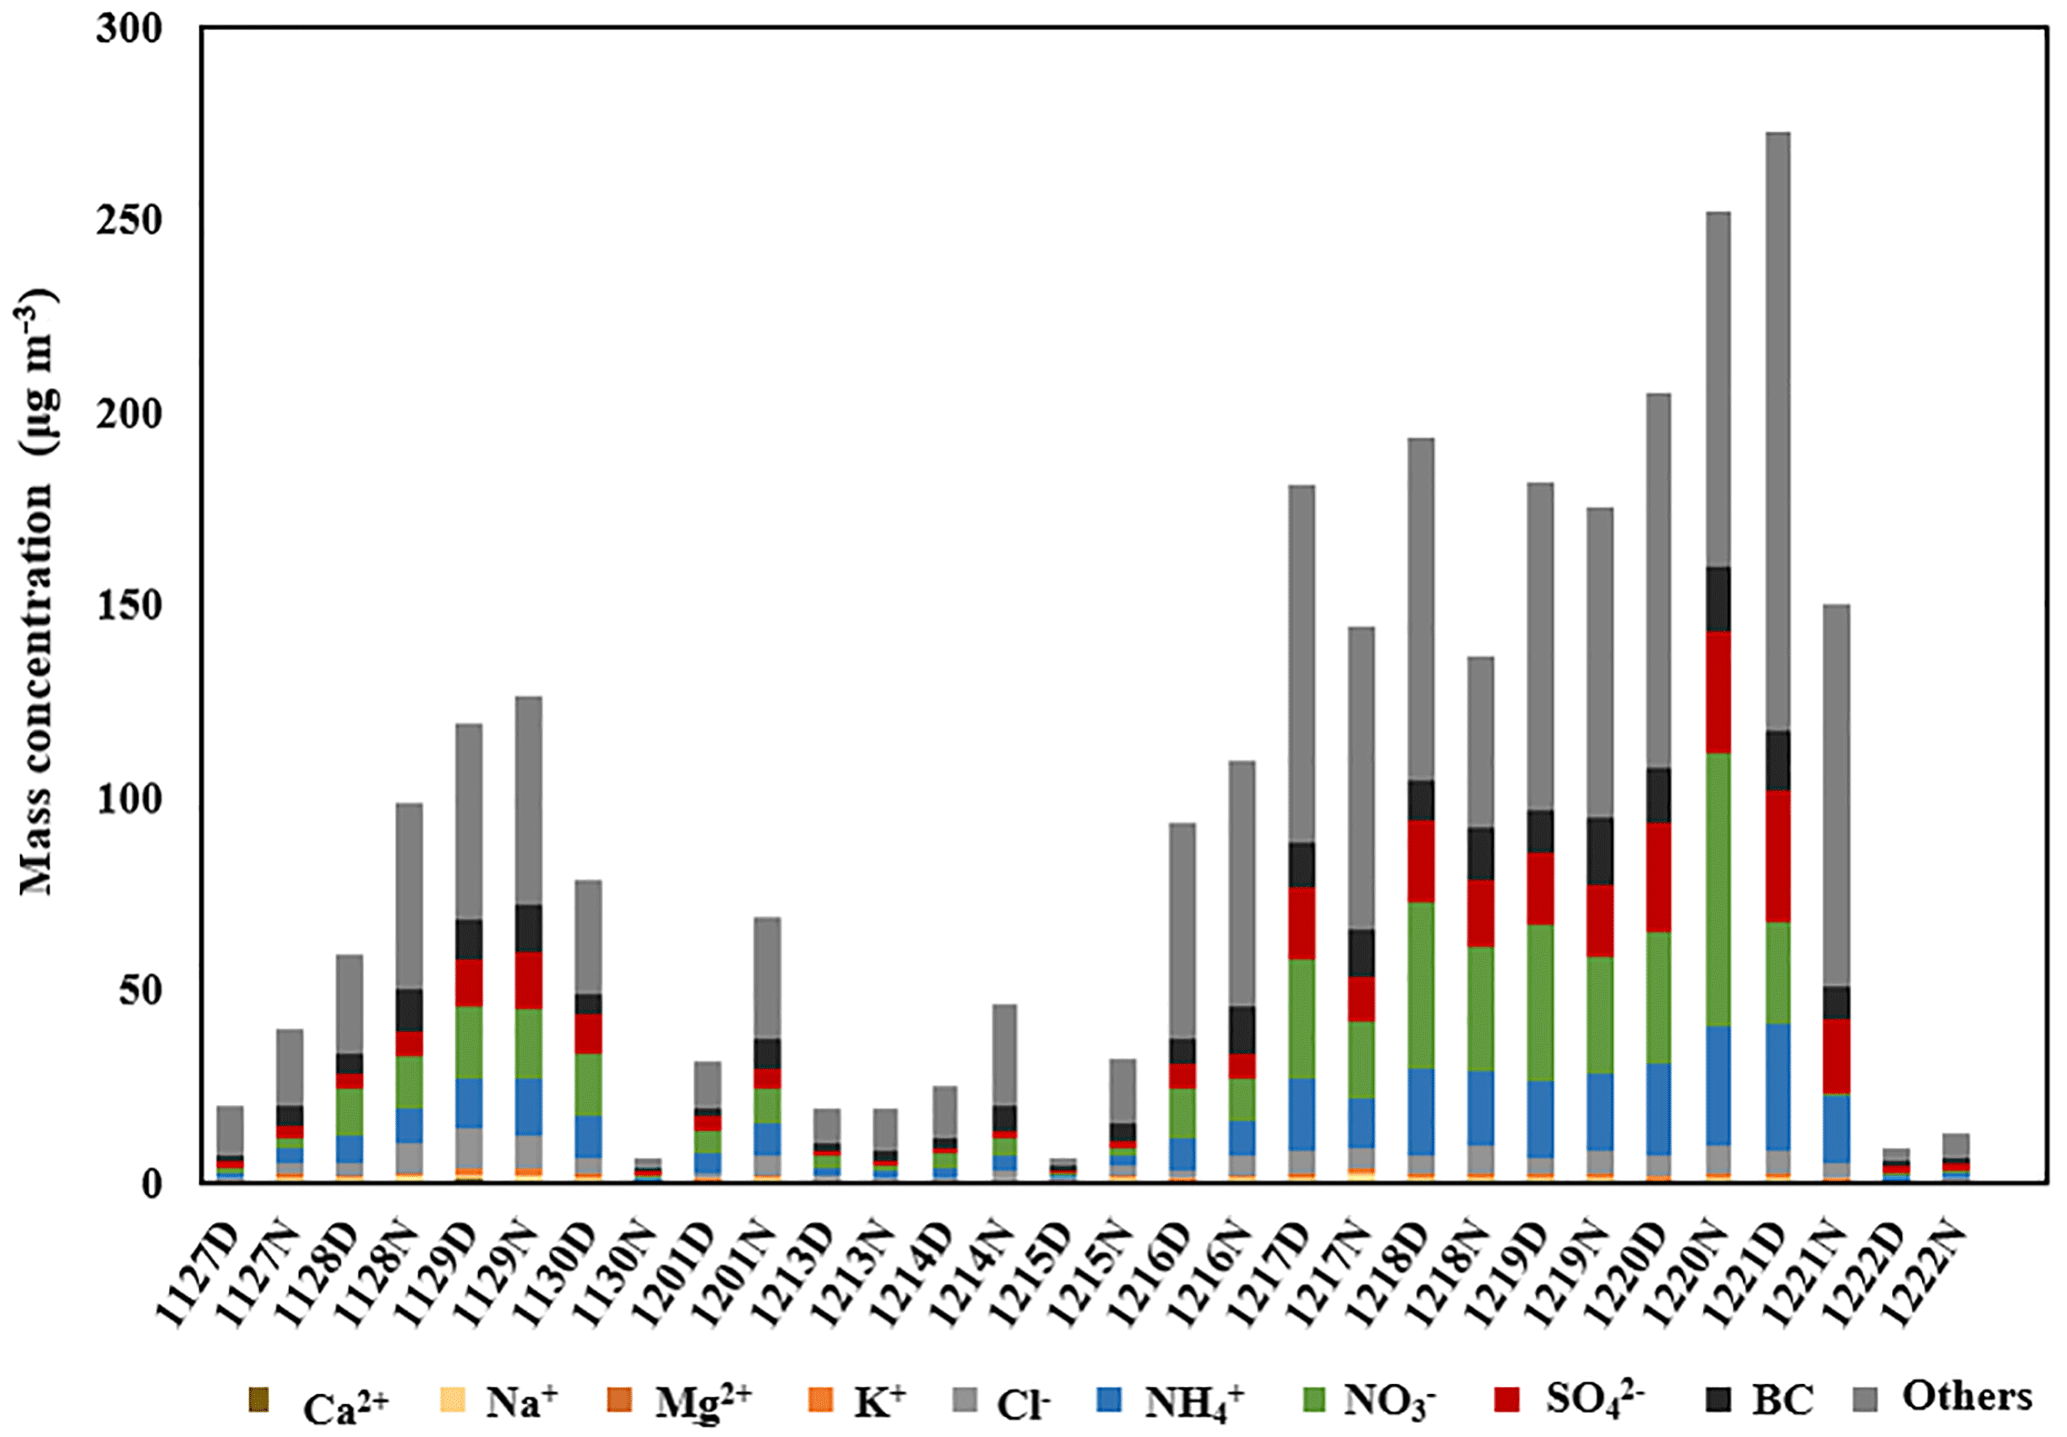
Figure 1The time series of PM2.5 concentrations and chemical composition. Data are shown for 15 different days; the dates are indicated in the x axis labeling and “D” and “N” stand for daytime and nighttime, respectively.
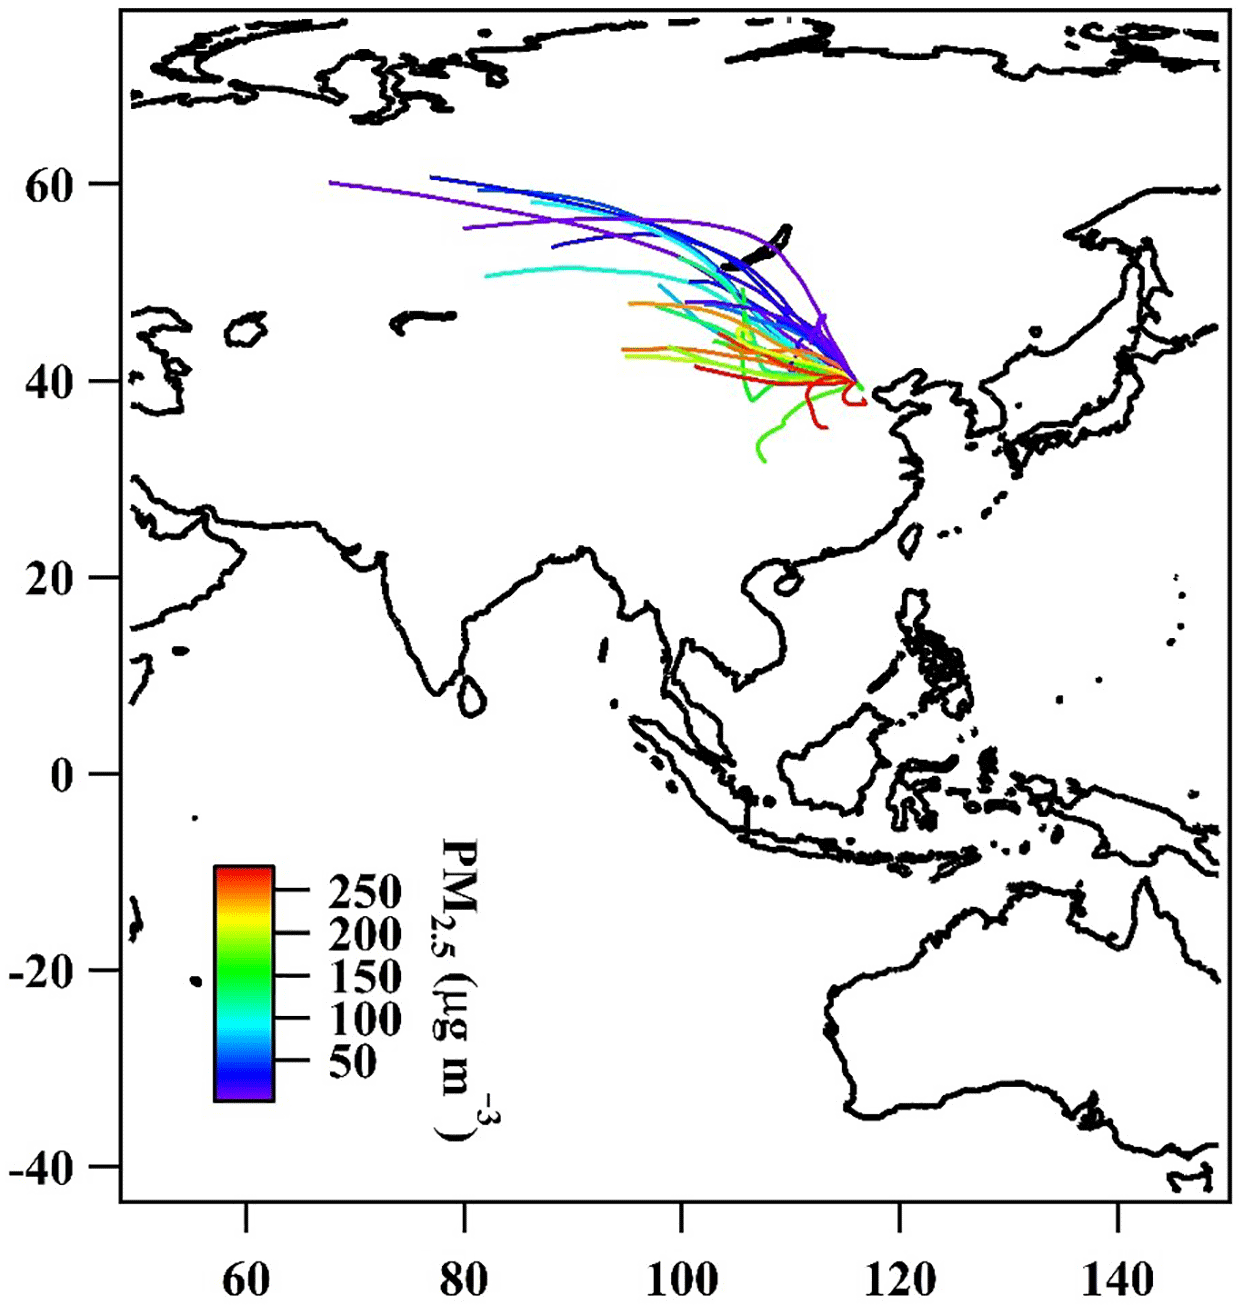
Figure 2The 2-day back-trajectories obtained by the NOAA HYSPLIT model color-coded with respect to PM2.5 mass concentration determined by PTFE filters.
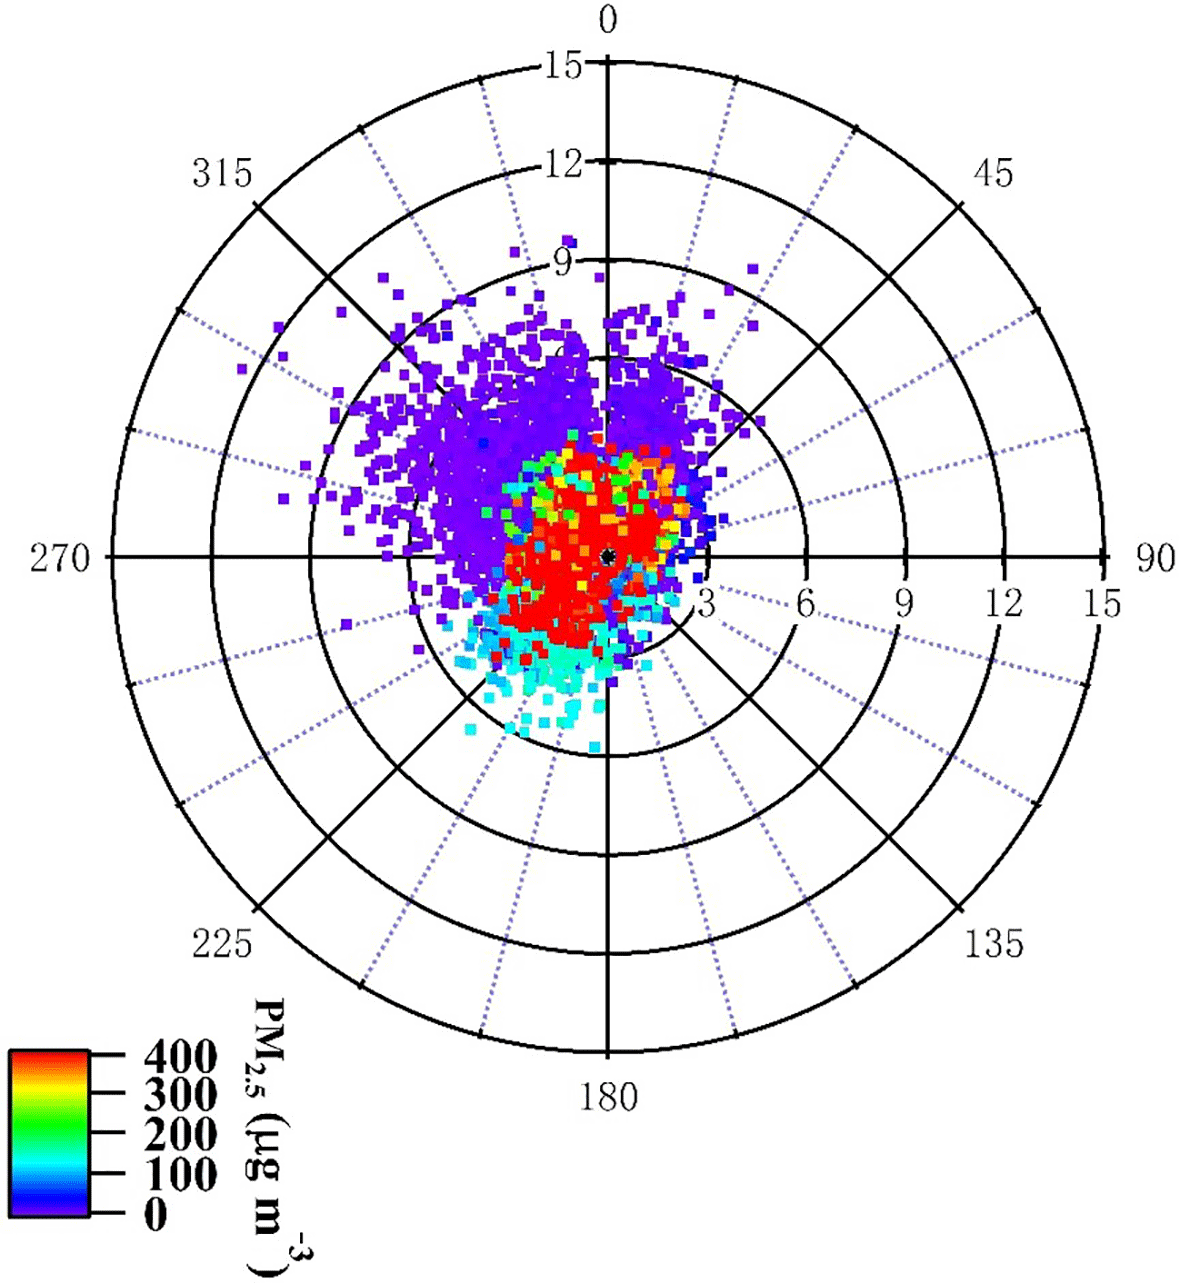
Figure 3Minutely recorded data for wind direction and wind speed color-coded with respect to PM2.5 mass concentration.
During the sampling period, BC mass concentrations varied from 0.50 µg m−3 on clean days up to 17.26 µg m−3 on polluted days. On average, the mean mass concentration of BC, 7.77±5.23 µg m−3, accounted for about 13 % of PM2.5. During nighttime, BC concentrations were higher than those during daytime due to stronger diesel engine emissions and a lower boundary layer (Guo et al., 2012). Our previous studies showed that secondarily and primarily formed organic particulate matter contributed to around 36 % of non-refractory PM1 detected by an aerosol mass spectrometer during wintertime in the atmosphere of Beijing (Hu et al., 2017).
Additionally, Fig. 2 shows 2-day back-trajectories obtained by the NOAA HYSPLIT model, with one trajectory related to each sampled filter, starting at the median sampling time of each filter. Figure 3 shows minutely recorded data for wind direction and wind speed collected by an Auto weather station (Met One Instruments Inc.) located on the same roof top as the aerosol sampling equipment. Both pictures are color-coded with respect to PM2.5 mass concentrations. The air masses that came from north or northwestern directions were generally coincident with higher wind speeds. They brought clean air with lower PM2.5 mass concentrations. They did cross desert regions; however, Beijing was reported to be affected by desert dust mainly only in spring (Wu et al., 2009). Typically, the air masses coming from the south and southwest of Beijing moved slowly and spent much more time over industrialized regions, resulting in high particulate matter mass concentrations. This pattern observed here is typical for Beijing, and these connections between wind direction and pollution levels in Beijing have been analyzed in detail previously in Wehner et al. (2008).
3.2 Particle number concentrations
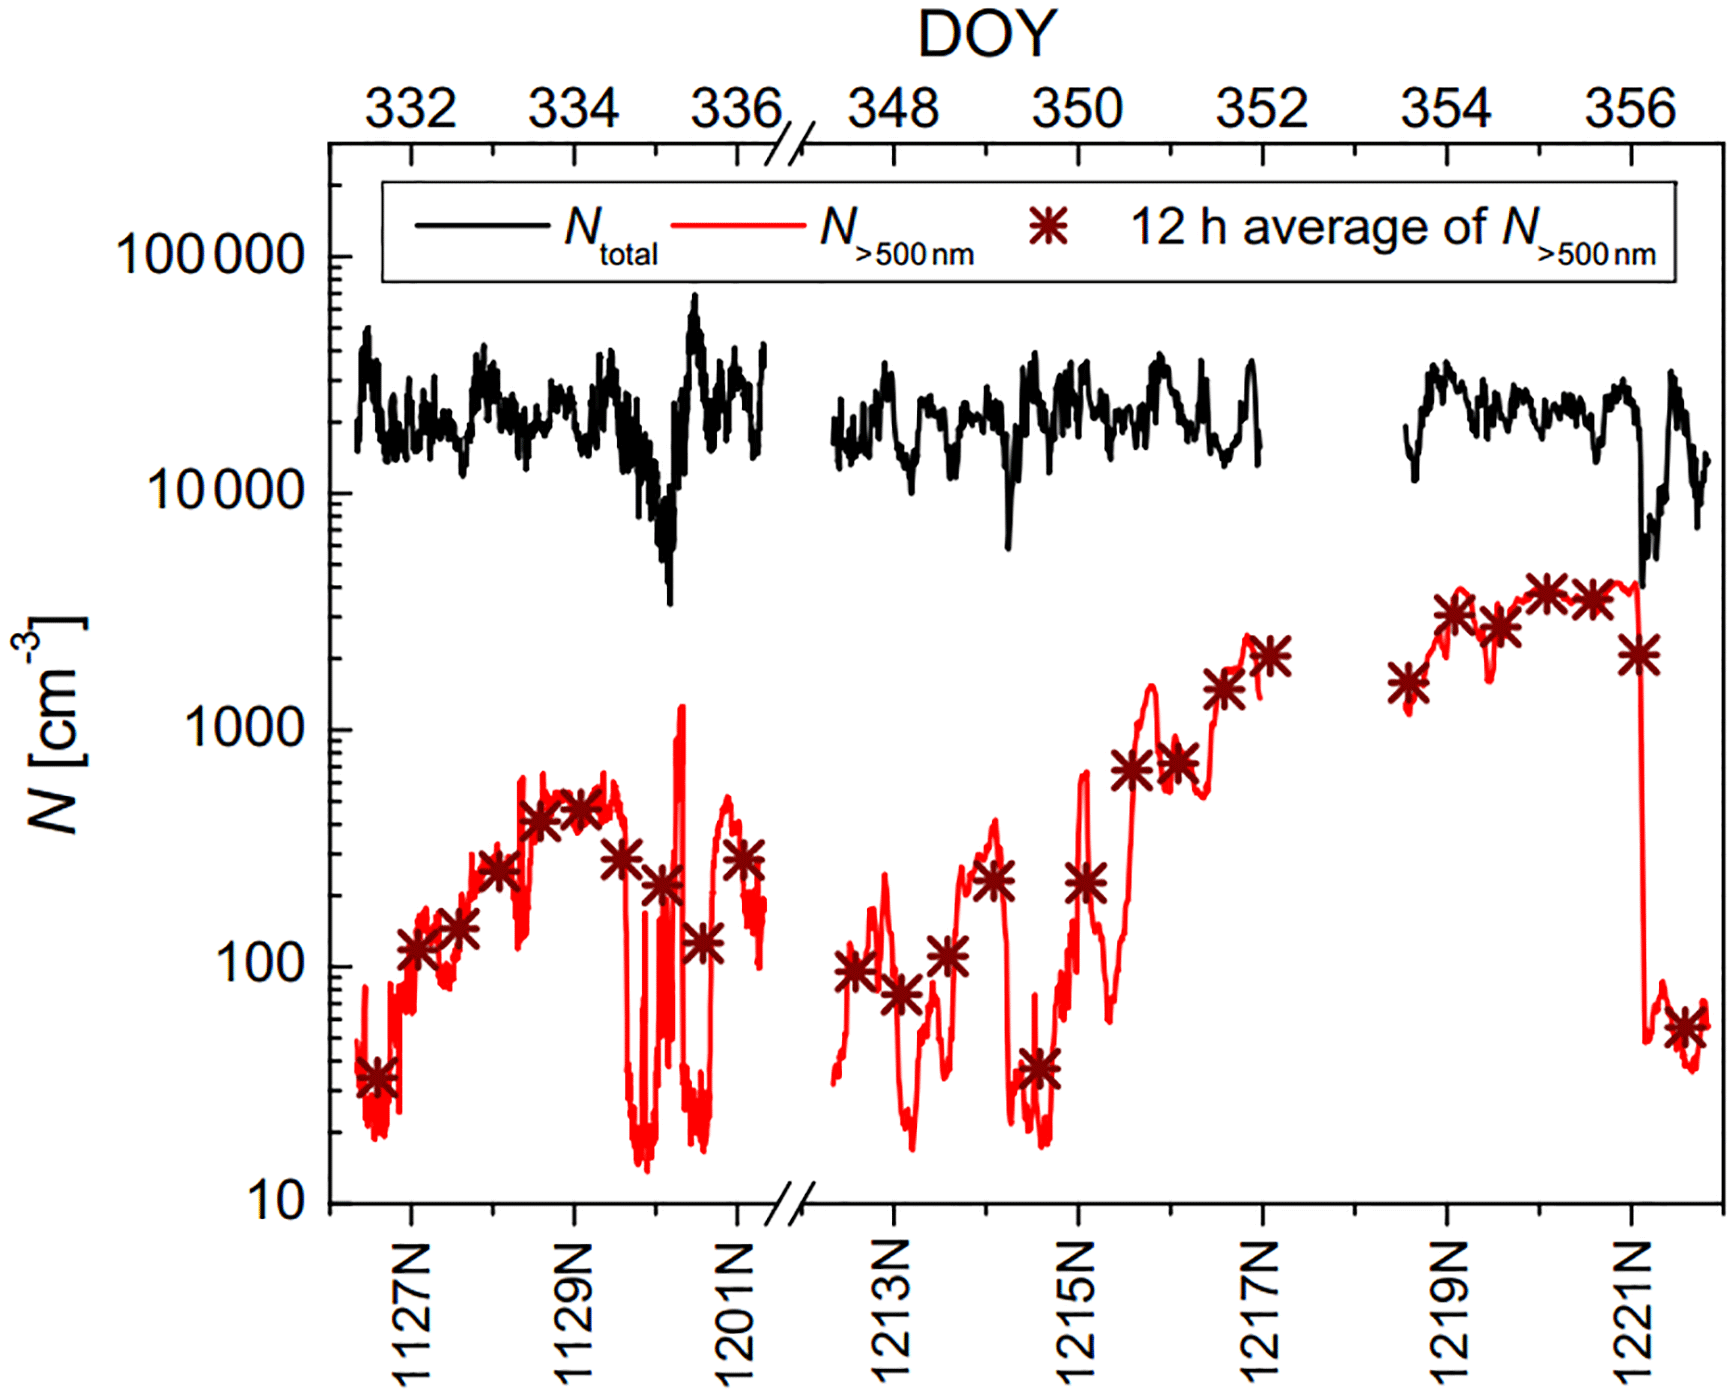
Figure 4 shows the time series of the total number concentration of particles from 3 nm up to 2.5 µm (Ntotal) and the number concentration of particles larger than 500 nm (N>500 nm), where Ntotal varied from 3×10³ to 7×104 cm−3 and N>500 nm varied from 10 to 4×103 cm−3. Obviously, in the atmosphere of Beijing during the sampling period, small particles less than 500 nm account for a large faction of the total particle number concentration, but during strong pollution events, a large increase in N>500 nm is also seen.
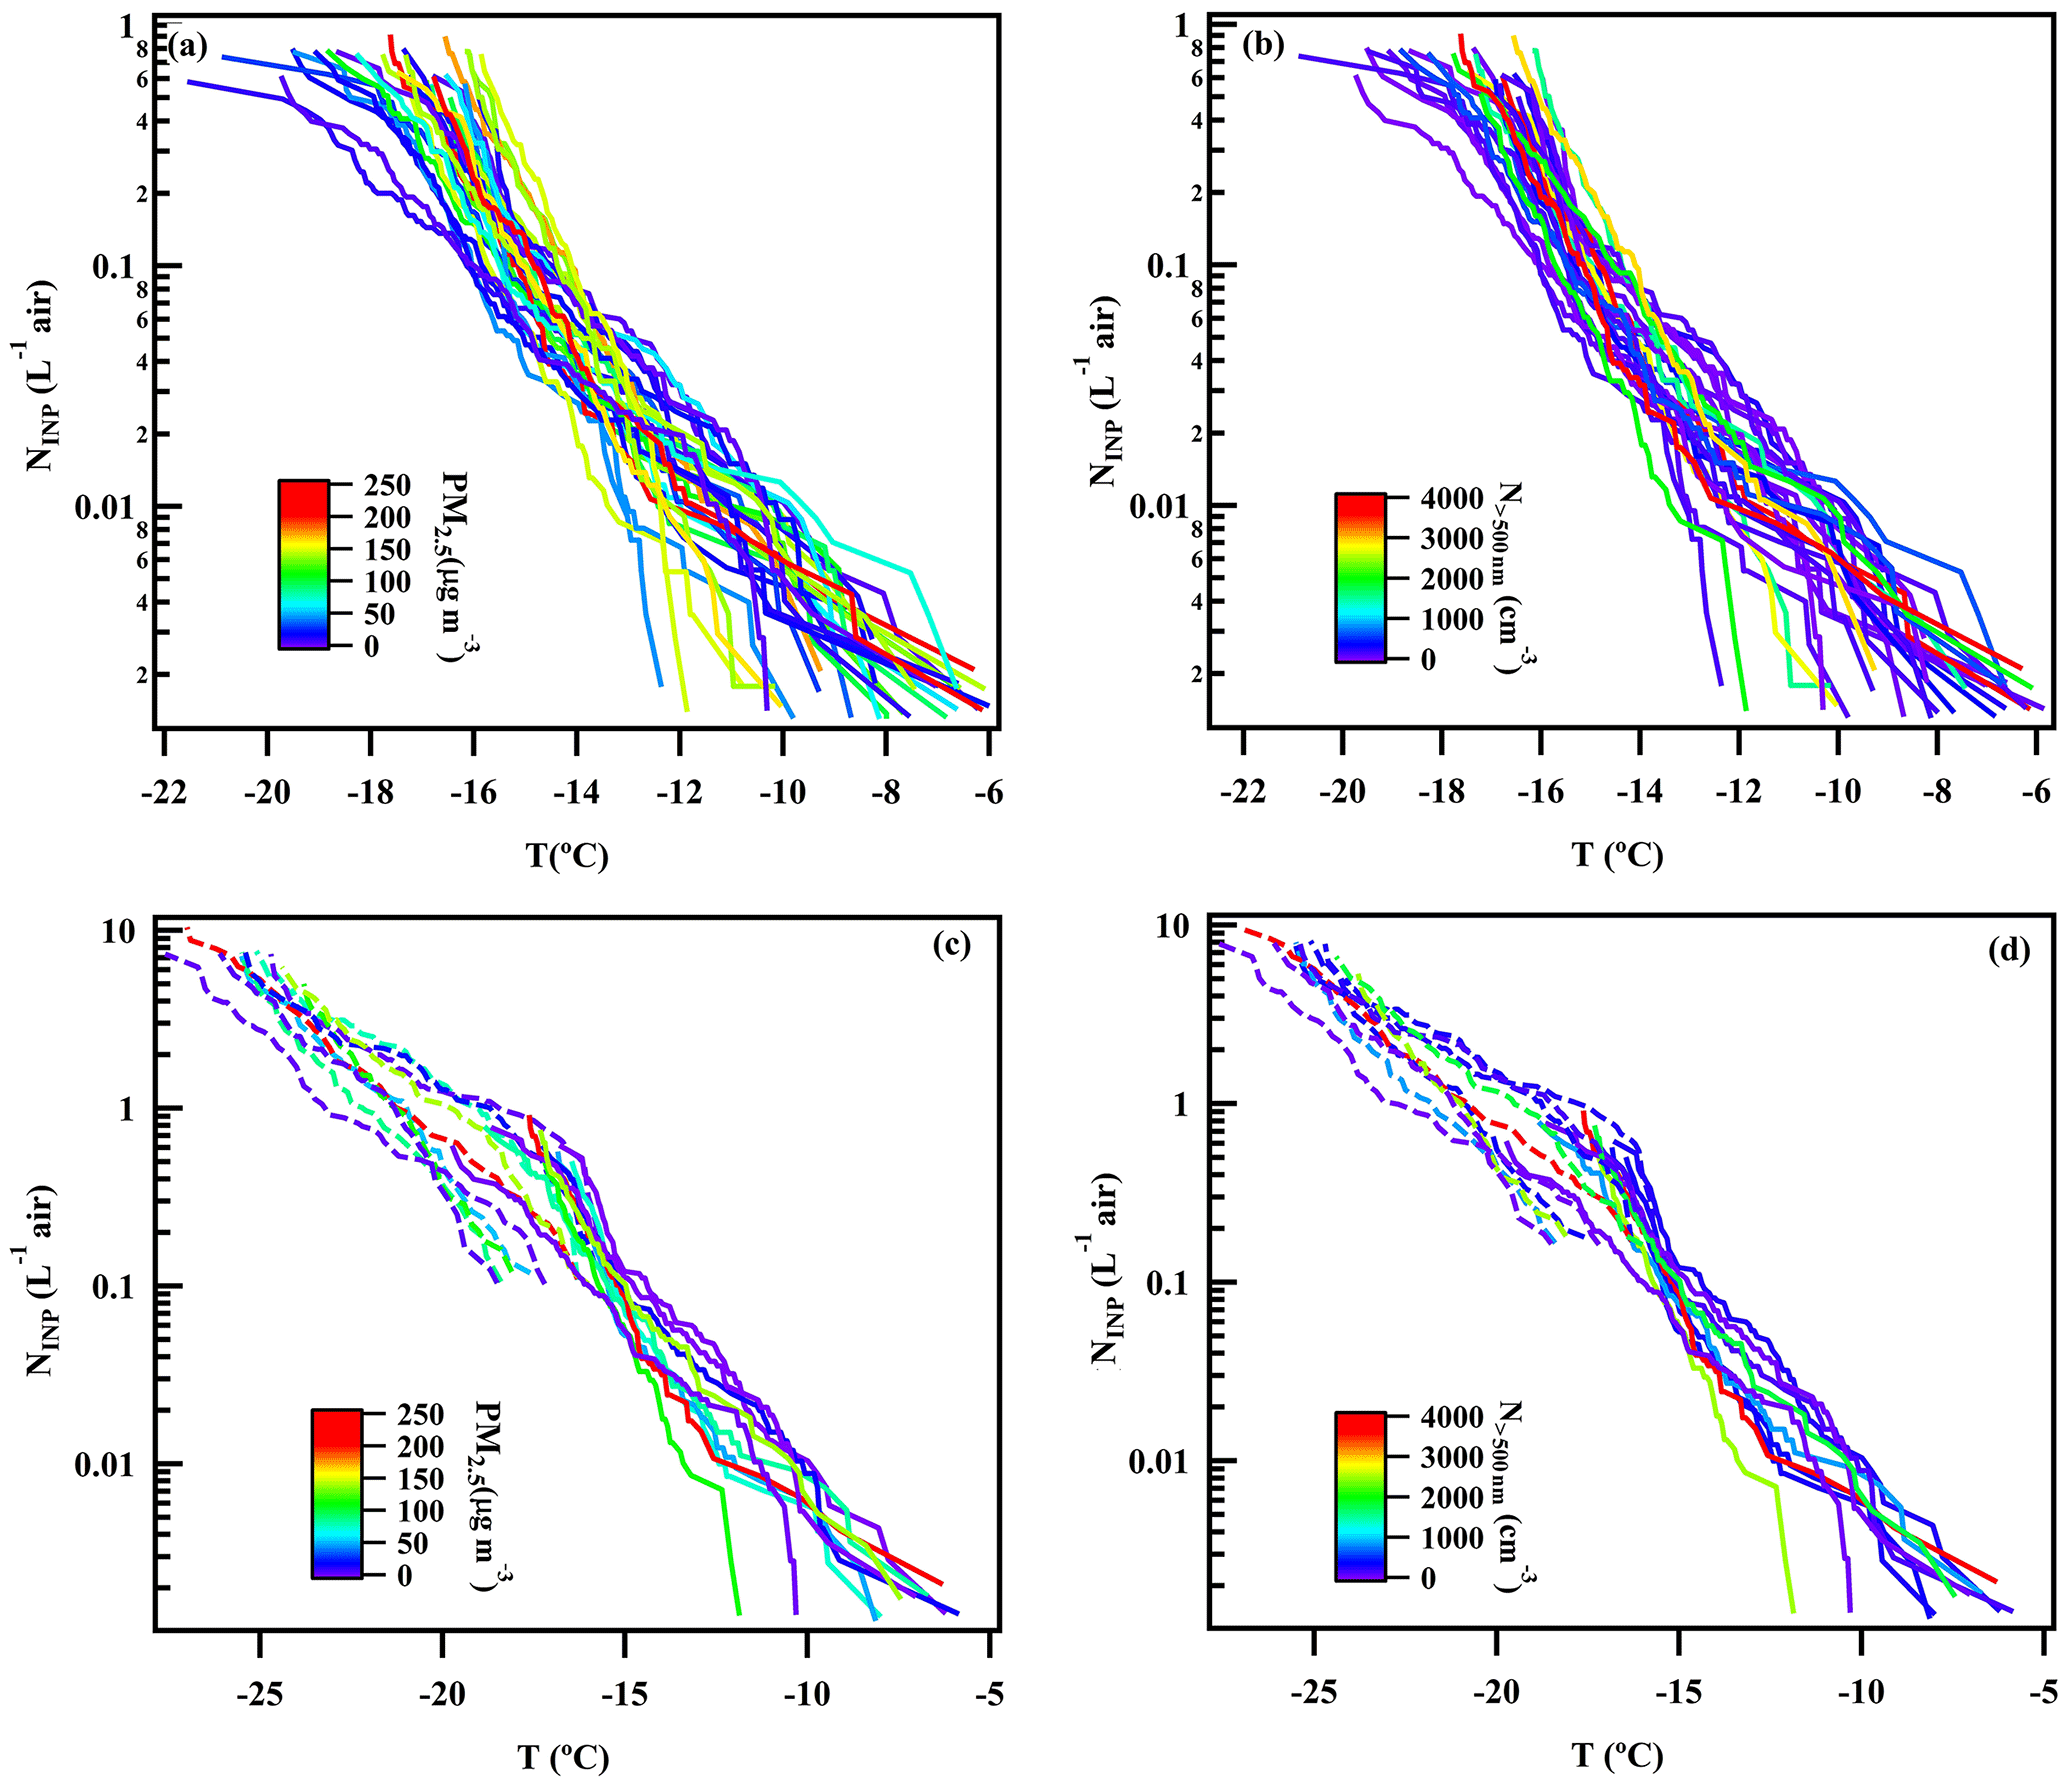
Figure 5NINP as a function of temperature. Panel (a) and (b) show INDA results colored by PM2.5 mass concentration and 12 h average N>500 nm, and panel (c) and (d) show 10 comparable results of INDA and LINA colored by PM2.5 mass concentration and 12 h average N>500 nm. Dotted lines represent LINA results, while solid lines represent INDA results.
Figure 5a and b show INP number concentrations (NINP) as a function of temperature for INDA measurements. The lines are color-coded depending on the PM2.5 mass concentration (Fig. 5a) and 12 h average N>500 nm (Fig. 5b) during the respective filter sampling, where each line (30 in total) represents an individual result of a filter. Exemplary measurement uncertainties are given in Sect. A3 of the Appendix. All filter samples had INP that were active at −12.5 ∘C and the highest freezing temperature was observed to be −6 ∘C. Overall, NINP varied from 10−3 to 1 L−1. Already at a first glance, there is no clear trend in NINP with PM2.5 mass concentration and 12 h average N>500 nm, indicating that the dominant pollutants of urban atmosphere may not significantly contribute to INP active down to roughly −16 ∘C in an urban region.
To verify the results observed in INDA at lower temperatures, PM2.5 collected by PTFE filters in the same period was used for LINA which can test the ice-nucleating properties of droplets down to below −20 ∘C. Washing particles off from the PTFE filters was more complete for some filters than for others. This was evident in varying large deviations in NINP from INDA and LINA measurements in the overlapping temperature range, where results determined from INDA were always similar to or higher than those from LINA, as particle removal by washing the filters was frequently incomplete. It is mentioned in Conen et al. (2012) that a quantitative extraction of particles from quartz fiber filters was not possible without also extracting large amounts of quartz fibers. We tried to overcome this issue by using PTFE filters, as degradation of the PTFE filter during washing does not occur due to the hydrophobic properties of the filter material. But we observed that not all particles were released into the water during the washing procedure (likely those collected deep within the filter), as filters frequently still looked greyish after washing, independent of the washing procedure (we experimented with different washing times of up to 4 h and with the use of an ultrasonic bath).
For our INDA measurements, punches of quartz filters were measured after they were immersed in water, representing the ice-nucleating properties of all particles collected (Conen et al., 2012). However, as already mentioned above, NINP derived from LINA measurements were lower than from INDA, due to particles that did not come off during washing. Based on our observations, we cannot recommend the use of sampling on PTFE filters followed by particle extraction in water. But we still decided to select those data from LINA measurements that showed the lowest deviation to the respective INDA results in the overlapping temperature range for use in this study. After calculating the deviation between INDA and LINA results, represented as the factor (NINP of INDA∕NINP of LINA), 10 LINA measurements from different days were selected to be used. For these measurements, the factor representing the deviation was in a range from 1.3 to 4.4. These data are shown in Fig. 5c and d. The LINA data are represented by the dotted lines and the respective INDA data from the same sampling periods are represented by solid lines. In the temperature range from −20 to −25 ∘C, results of LINA also show no clear trend in NINP with PM2.5 mass concentration and 12 h average N>500 nm, even though a lower temperature has been measured, extending our statement that urban pollution might not contribute to INP down to −25 ∘C.

Figure 6NINP at −16 ∘C as a function of mass concentrations of BC (a) and PM2.5 (b) and of 12 h average values of Ntotal (c). Furthermore, we show N>500 nm (d) and NINP at −16 ∘C derived based on DeMott et al. (2010) (e) and DeMott et al. (2015) (f) for daytime (red round symbols) and nighttime (black square symbols) samples.
3.3 Correlation of NINP with PM2.5, BC mass or particle number concentrations
There have been many studies carried out in field and laboratory experiments focusing on the ice-nucleating properties of BC particles, however, with inconclusive results. Some held the view that BC is not an efficient ice nucleation active species (Kamphus et al., 2010; Schill et al., 2016), whereas some described BC particles as possible INP (Cozic et al., 2008, 2007).
Table 1Coefficient of determination (R2) and a measure for the statistical significance of the assumption of a linear correlation (p) for the comparison of NINP at −16 ∘C with the different parameters shown in Fig. 5.
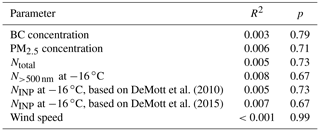
Here we selected NINP derived from INDA measurements at −16 ∘C and plotted them against BC (Fig. 6a), PM2.5 mass concentrations (Fig. 6b) and 12 h average values of Ntotal (Fig. 6c), N>500 nm (Fig. 6d) and NINP at −16 ∘C derived from DeMott et al. (2010) (Fig. 6e) and DeMott et al. (2015) (Fig. 6f). To determine the latter two, the 12 h averages of N>500 nm shown in Fig. 4 were used, following parameterizations suggested by DeMott et al. (2010, 2015). Linear fits are included in all panels of Fig. 6, and values for R2 and p for these fits are shown in Table 1. Our results discussed in the following, based on NINP at −16 ∘C, are similarly valid for all other temperatures down to −25 ∘C.
Figure 6a–f show that there was no clear trend between NINP and any of the displayed parameters, be it BC or PM2.5 mass concentration or any of the 12 h average particle number concentrations. Also the R2 and p values given in Table 1 clearly show that there was no correlation between NINP and any of the examined parameters. In the urban region of Beijing during winter, the INP could be assumed to be soot or ash particles from traffic emissions, biomass burning and coal combustion, or to be dust particles advected from the desert regions during prevailing northern and northwestern wind, or to originate from the biosphere. While mineral dust and biological particles are generally assumed to be the most abundant INP in the atmosphere (Murray et al., 2012; Kanji et al., 2017), the role of particles from combustion, i.e., of soot and ash particles, in INP is still controversial (Kanji et al., 2017). Our results indicate that BC particles did not correlate with INP concentrations in the urban atmosphere. It is possible that the BC particles emitted from coal burning, biomass burning and traffic emissions are not ice-active in the first place, or that they underwent atmospheric aging processes (such as coagulation, condensation upon vapor and chemical reactions), resulting in more internally mixed particles after emission (Pöschl, 2005), which might inactivate their potential to act as INP. In the atmosphere of Beijing, the aging timescale is much shorter than in cleaner urban environments, which was shown in Peng et al. (2016). For example, to achieve a complete morphology modification for BC particles in Beijing, the aging timescale was estimated to be 2.3 h, compared to 9 h in Houston (Peng et al., 2016). PM2.5 chemical composition indicated that the BC particles may be aged and coated by secondarily formed chemical components (SNA and other secondary organic materials) during the heavy haze episodes (Peng et al., 2016), thereby resulting in weakened heterogeneous ice nucleation activity of freshly emitted diesel soot particles (Kulkarni et al., 2016).
However, if a possible coating was soluble, it would dissolve both during immersion freezing and during our experiments and would not impede the ice activity of BC particles, unless it reacted chemically with an ice-active site. It has been observed that a coating did not impede the ice activity of mineral dust particles coated with nitric acid in Sullivan et al. (2010), and Wex et al. (2014) observed similar for particles coated with succinic acid or levoglucosan.
Another study conducted in Ulaanbaatar in Mongolia, a city suffering from severe air pollution, showed a low ice activity towards heterogeneous ice nucleation when the sulphur content of particles was highest (Hasenkopf et al., 2016). It is interesting to note that we observe the opposite in our study; i.e., the increase of PM2.5 mass concentration and percentage of SNA in PM2.5 during haze periods also seem to have no negative impact on INP concentrations. Not only did increased BC mass concentrations not increase the observed INP concentrations, but also, INP concentrations were not particularly low during pollution episodes. Furthermore, we conclude that the strong formation of secondary particulate matter during haze days would not contribute to INP. In addition, there is no clear difference of ice nucleation between day- and nighttime samples.
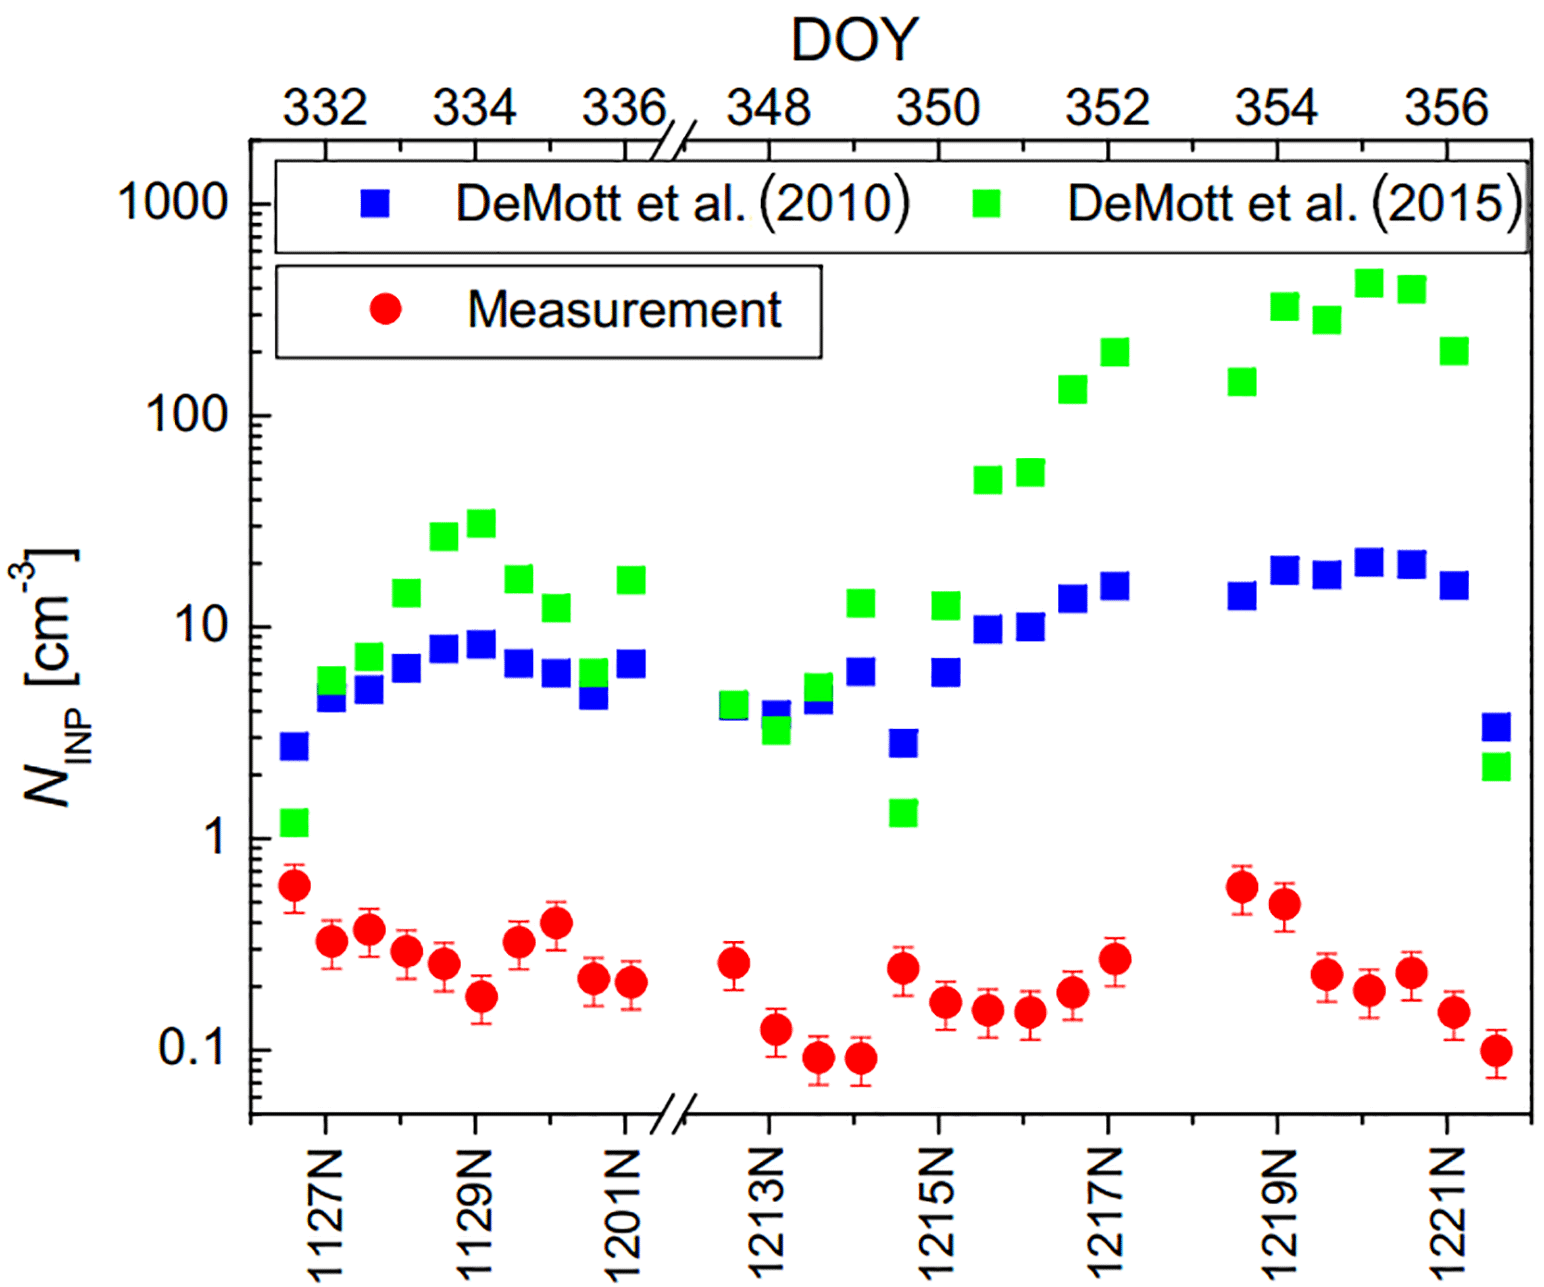
Figure 7The time series of measured NINP and NINP parameterized according to DeMott et al. (2010, 2015) at −16 ∘C.
The size distribution measurements show that the largest fraction of all particles occurred in the size range below 500 nm. However, during the strongest pollution event towards the end of our measurement period (17 December during daytime (1217D) till the night from 21 December to 22 December (1221N)), N>500 nm also increased noticeably to much larger values than before. In general, particles in this size range were also affected by the pollution, e.g., by an increase in the size of preexisting particles via atmospheric aging processes (such as coagulation, condensation and chemical reactions) in which particles advected from southern industrial areas of Beijing might also contribute. This is at the basis of the explanation as to why the parameterizations for NINP by DeMott et al. (2010, 2015) were not able to describe the measured values, as seen in Fig. 6e and f. Additionally, the time series of NINP at −16 ∘C, based on DeMott et al. (2010, 2015), are shown as blue and green squares in Fig. 7. Also shown are values for NINP at −16 ∘C as measured by LINA (red circles), i.e., the same values used in Fig. 6. Mostly, the parameterization by DeMott et al. (2015) yields larger values and a larger spread compared to the parameterization by DeMott et al. (2010), but naturally, both follow the trends in N>500 nm. A correction factor of 3, as suggested in DeMott et al. (2015), was not applied, as this would simply increase all respective values by this factor; i.e., it will not change the results. Indeed, during the pollution phase, the parameterizations overestimate the observed values by more than 2 orders of magnitude. But also during clean phases, neither N>500 nm nor the parameterizations by DeMott et al. (2010, 2015) correlate with NINP. In summary, this shows that pollution events not only did not add INP, but also that for the aerosol observed during our study, a parameterization of NINP based on particles in the size range >500 nm is not feasible. Interestingly, as will be briefly discussed in the next section, a much older parameterization by Fletcher (1962) captures NINP as measured in this study rather surprisingly well, at least within 1 order of magnitude (Fig. 8). In summary, during polluted days, the increase of BC concentration, secondary components (SNA) and other compounds contributing to PM2.5, as well as particle concentrations, have no impact on INP concentrations down to −25 ∘C in the urban region we examined in our study. This means that anthropogenic pollution did not contribute to the INP concentration. But it also indicates that anthropogenic pollution in Beijing did not deactivate the present INP, as polluted periods did not show particularly low INP concentrations, although aging and formation of secondary particulate matter typically are intense during times of strong pollution.

Figure 8NINP as derived from precipitation samples collected in Petters and Wright (2015) (grey area) and a parameterization based on Fletcher (1962) (black line), together with our results (dark green and brownish lines from INDA and LINA measurements, respectively).
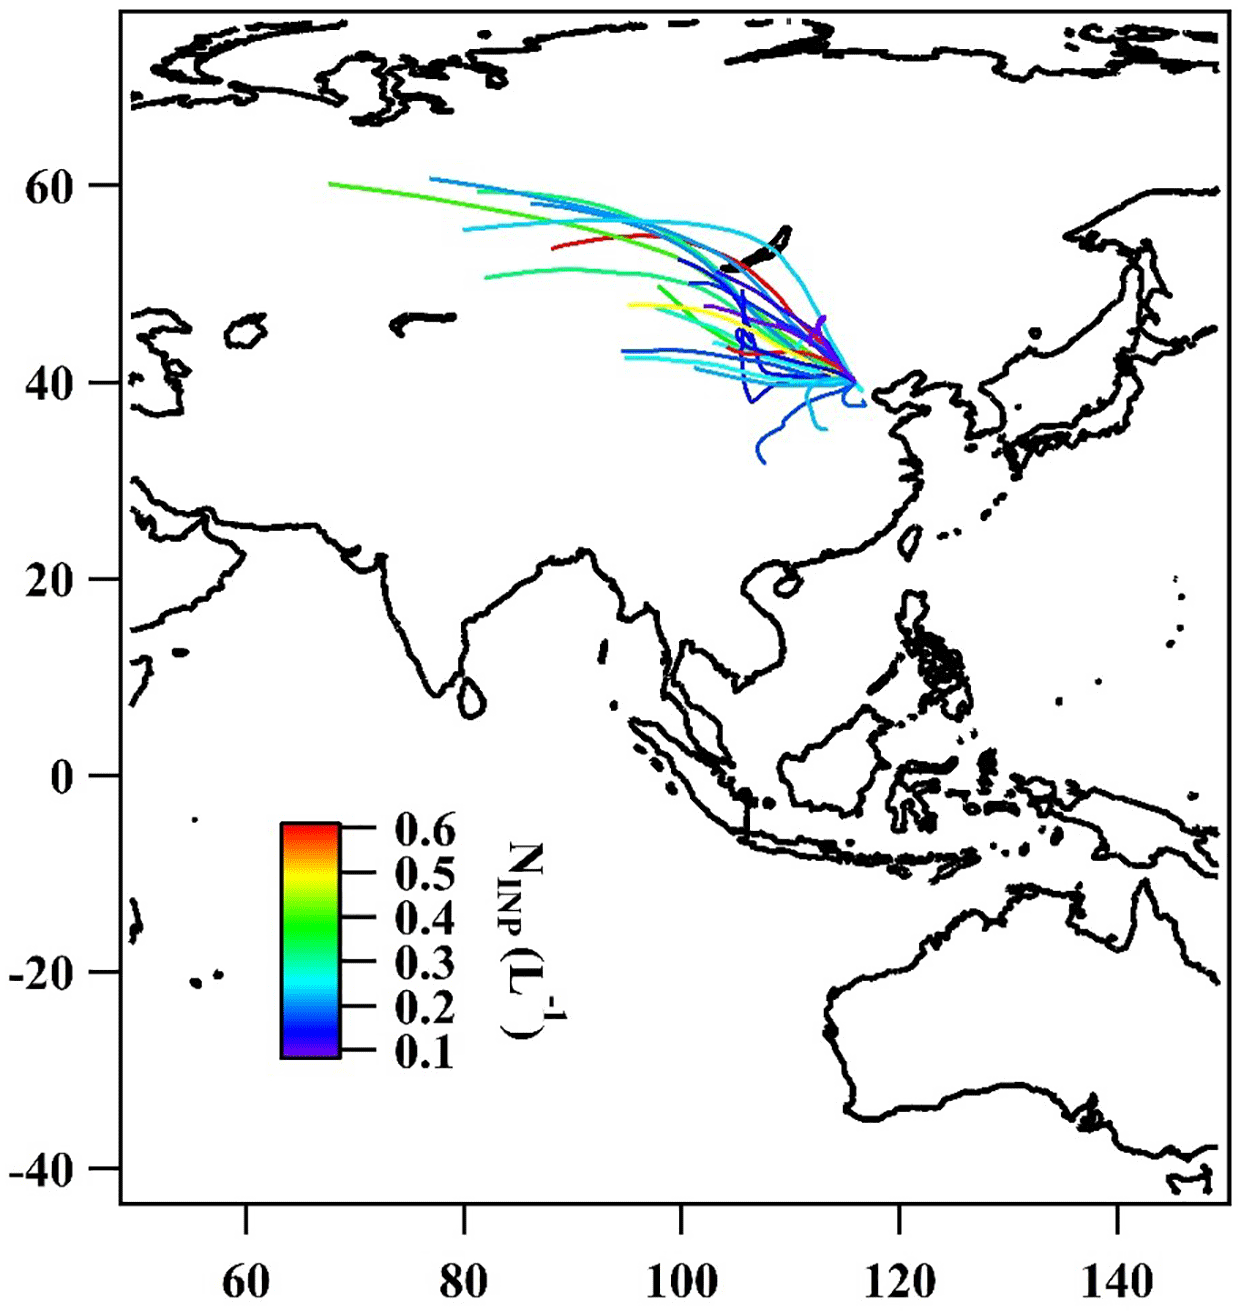
Figure 9The 2-day back-trajectories obtained by the NOAA HYSPLIT model color-coded with respect to INP concentration.
In addition to what we discussed above, also no correlation was observed between NINP and wind speed, as can be seen by the respective values for R2 and p given in Table 1. Figure 9 indicates that there was also no correlation with wind direction. The fact that we find no correlation with either wind speed or wind direction agrees with the desert regions towards the northwest not being efficient dust sources in winter and is an indication that we may have observed average background INP concentrations in Beijing during our measurements.
Additionally, also no correlation was found between any of the water-soluble constituents that were analyzed with ion chromatography and INP concentrations. This is not too astounding, as INP make up only a small fraction of all particles, as can be seen when comparing number concentrations from Figs. 4 and 7, and hence they make up only a small fraction of the mass, likely too small to be detected. Furthermore, a number of different components might contribute to INP, e.g., biological INP that are generally ice-active at higher temperatures (15 ∘C) and mineral dusts which are ice-active at lower temperatures; therefore one common tracer for INP might not be applicable. As far as K is concerned, which might be connected to K feldspar containing mineral dust particles with high ice activity (Atkinson et al., 2013), we only analyzed the water-soluble fraction; i.e., K related to feldspar would not have been analyzed. Moreover, K is also emitted by biomass burning and hence influenced by anthropogenic pollution. It remains to be seen whether a simple correlation between chemical constituents of the atmospheric aerosol and INP concentrations can be established at all.
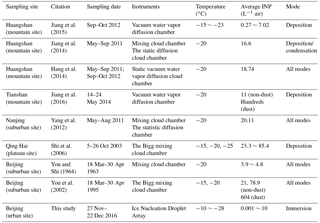
Table 2Comparison of INP measurements in different regions of China, including NINP (i.e., INP number concentrations) and corresponding temperature.
3.4 Comparison with literature
First, we compare our results with results of NINP derived from precipitation samples as collected in Petters and Wright (2015) as shown in Fig. 8. These literature data were mostly collected in various locations in North America and Europe, and none of these locations was one with strong anthropogenic pollution, different from the sample location in the present study. The NINP in our study varied from 10−3–10 in the temperature range of −10 to −25 ∘C. The data of this study (dark green and brownish lines) are within the range of values given in Petters and Wright (2015), in the whole temperature range for which INP concentrations were derived here. A comparison with Corbin et al. (2012) and Knopf et al. (2010), who also both examined INP in urban air in Toronto and Mexico City, respectively, is not possible due to different examined ice nucleation modes and also because they only measured at −34 ∘C (Corbin et al., 2012), i.e., outside of the temperature range examined in this study, or only ice onset temperatures were reported (Knopf et al., 2010). But we want to point out the fact that an older parameterization based on Fletcher (1962), which has been used for large-scale modeling, agrees well with our data (see Fig. 8) down to −20 ∘C. It should, however, also be pointed out that the variability that occurs in the data certainly cannot be captured by such a single line. But the increase in NINP towards lower temperatures as parameterized in Fletcher (1962) is similar to that of our data; though it should also be said that this parameterization is known to overestimate atmospheric observations at lower temperatures (roughly below −25 ∘C; see e.g., Meyers et al., 1992). A similar observation was recently described in Welti et al. (2017), in which the temperature trend of NINP down to −20 ∘C derived from filter samples taken on Santo Antão, Cabo Verde, also agreed well with the parameterization by Fletcher (1962), while at lower temperatures, the parameterization exceeded the measurements. In general, for the case of the Beijing air masses examined in this study, both the range of NINP given in Petters and Wright (2015) as well as the parameterization by Fletcher (1962) agree better with our measurements than the parameterizations by DeMott et al. (2010, 2015).
All of this is again indicative of the fact that severe air pollution in Beijing did not increase or decrease INP concentrations above or below values typically observed in other nonurban areas on the Earth, and hence, that the background INP concentrations, at least down to −25 ∘C, might in general not be directly anthropogenically influenced.
Measurements of NINP in China have been done as early as 1963 by You and Shi (1964), and a few further studies listed in Table 2 have been carried out in recent years. Table 2 includes some campaigns completed in different regions of China including mountains, plateaus and suburban districts with low PM2.5 concentration and BC-containing particles. In contrast to these observations, our study shows NINP detected in an urban region during highly polluted days with complex particle sources. In our study, immersion freezing was examined, while not all studies listed in Table 2 examined this ice nucleation mode. But due to the scarcity of data, we include the results from all these studies in our discussion here. Apparently, compared with results in Table 2, NINP determined for the urban site of this study (1 L−1 air at −20 ∘C) were at the lower end of reported values, which were up to roughly 20 L−1 air at −20 ∘C for non-dust events. The highest concentrations were observed for dust events with values up to 604 L−1 air at −20 ∘C detected at a suburban site in Beijing, showing that INP from mineral dust contribute to the overall NINP already at this temperature (You et al., 2002). Despite the difference among methods and ice-nucleating modes, this again suggests that urban pollution aerosol particles might not be efficient immersion freezing INP and that the ice-nucleating ability of particles in urban aerosols might originate from the nonurban background aerosol particles that are included in the urban aerosol, i.e., that INP observed in urban environments might have the same sources among bioaerosols and dust particles as nonurban INP. An additional contribution from urban biogenic or dust particles to the INP observed in this study cannot be fully excluded, but the agreement between our data and rural data presented in literature (see Fig. 8 and Table 2) corroborates our assumption that atmospheric INP in general originate from nonurban sources.
INP concentrations down to −25 ∘C determined from PM2.5 samples collected at an urban site of the megacity Beijing, China, in winter were found to not be influenced by the highly variable amount of air pollution, both in mass and particle number concentrations, that was present during the sampling period. Therefore, we conclude that neither BC nor other pollutants contributed to INP, including secondarily formed particulate mass. On the other hand, we also conclude that the present INP were not noticeably deactivated during strong pollution events. Particle number concentrations for particles with diameters >500 nm were affected by pollution events, and INP concentrations did not correlate with these concentrations. Therefore, as can be expected, parameterizations based on these concentrations (DeMott et al., 2010, 2015) do not reproduce the INP concentrations under these extreme conditions and yield values which are up to more than 2 orders of magnitude higher than the measured values. On the other hand, INP concentrations were in the middle of the range reported for atmospheric nonurban concentrations in Petters and Wright (2015) and at the lower end of reported values collected from previous atmospheric observations in China, while they were much lower than observations during dust events in China. From this, we conclude that INP concentrations might not be influenced directly by anthropogenic activities, at least not down to roughly −25 ∘C and maybe even below, and that particularly natural mineral dust sources might effect INP concentrations observed in China. It should be noted that ice nucleation observed at high freezing temperatures (particularly above −10 ∘C, but maybe as low as −20 ∘C) is typically attributed to biogenic ice activity. But while identifying the nature of the INP detected here is beyond the reach of our study, we assume that they originated from natural sources and not from anthropogenic combustion sources. However, it should be kept in mind that an indirect anthropogenic influence on INP concentrations is still possible due to land use changes and related changes in atmospheric dust loadings as well as due to vegetation changes and related changes in the biosphere.
Data presented in this publication are available in the Supplement.
A1 Temperature calibration and background of INDA and LINA
A1.1 Temperature calibration of INDA
The bath of the thermostat was well mixed during the cooling cycle, and the cooling rate was 1 K min−1. PCR trays were immersed into the cooling liquid such that the water level in the tubes was below the level of the liquid in the thermostat. The temperature inside the tubes was determined before the experiments by putting a temperature sensor into a tube during cooling. This was repeated for tubes in several locations. This worked down to −7 ∘C, below which the sensor induced freezing. In this temperature range, generally a small constant shift of 0.2 K was observed, which was assumed to be valid overall and was incorporated in the data at all temperatures. A comparison of data obtained for suspensions of Snomax with previous work done at TROPOS with LACIS (Leipzig Aerosol Cloud Interaction Simulator) and within INUIT (Ice Nuclei Research Unit, Wex et al., 2015) showed good agreement down to the lowest temperature at which the experiments for the comparison were run, which was −16 ∘C.
A1.2 Temperature calibration of LINA
The temperature on the glass slide in LINA was obtained by feeding an air flow with a known dew point temperature through the instrument, while the instrument cooled down at 1 K min−1, i.e., with the same freezing rate used in the experiments. The humidified air flow was obtained by mixing a dry air flow with an air flow that was humidified in a Nafion humidifier (Perma Pure MH-110-12S-4, Perma Pure, Toms River, New Jersey, USA) which was connected to a thermostat (HAAKE C25P, HAAKE GmbH, Karlsruhe, Germany) that kept the temperature in the humidifier at 10 ∘C. By mixing the two air streams, dew point temperatures below 0 ∘C were obtained. The dew point temperature was measured with a dew point mirror (Dew Prime I-S2, Edge Tech, Milford, Massachusetts, USA). The overall setup is based on the principle of a dew point mirror; i.e., the glass slide on the Peltier element in LINA started to fog when its temperature reached the dew point temperature adjusted in the air flow. Optical detection by the CCD camera was deployed similar to how it is used during measurements, i.e., taking a picture every 6 s. Subsequently detected greyscale images were compared to an image that was taken well before fogging began. Brightness differences between this original picture and the following pictures were taken and resulted in an S-shaped curve, reaching the maximum plateau once the glass slide was fogged over completely. A fit was applied to the curve in order to find the temperature where 50 % is fogged, which was taken to represent the actual temperature. Using this principle, the temperature on the glass plate in LINA was calibrated repeatedly at five different temperatures in the range from −2.3 to −22.3 ∘C. A comparison of data obtained for suspensions of pollen washing water with previous work done at TROPOS with LACIS (Augustin et al., 2013) showed good agreement down to the lowest temperature at which the experiments for the comparison were run, which was −25 ∘C.
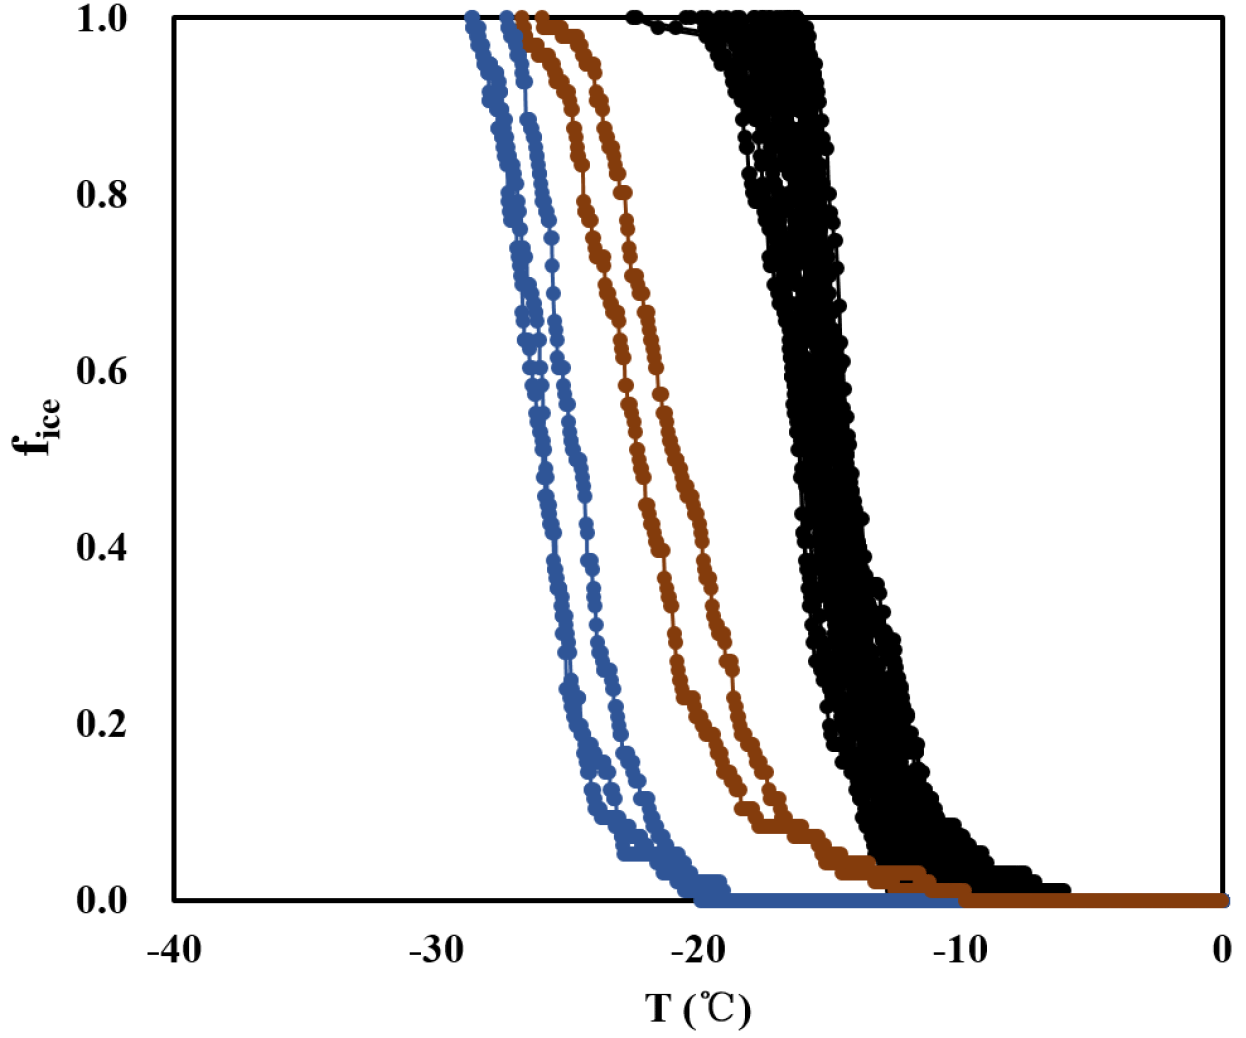
Figure A1Frozen fractions determined from INDA (black lines), together with background signals determined for pure water (blue lines) and for pure water containing punches of a clean filter (brown lines).
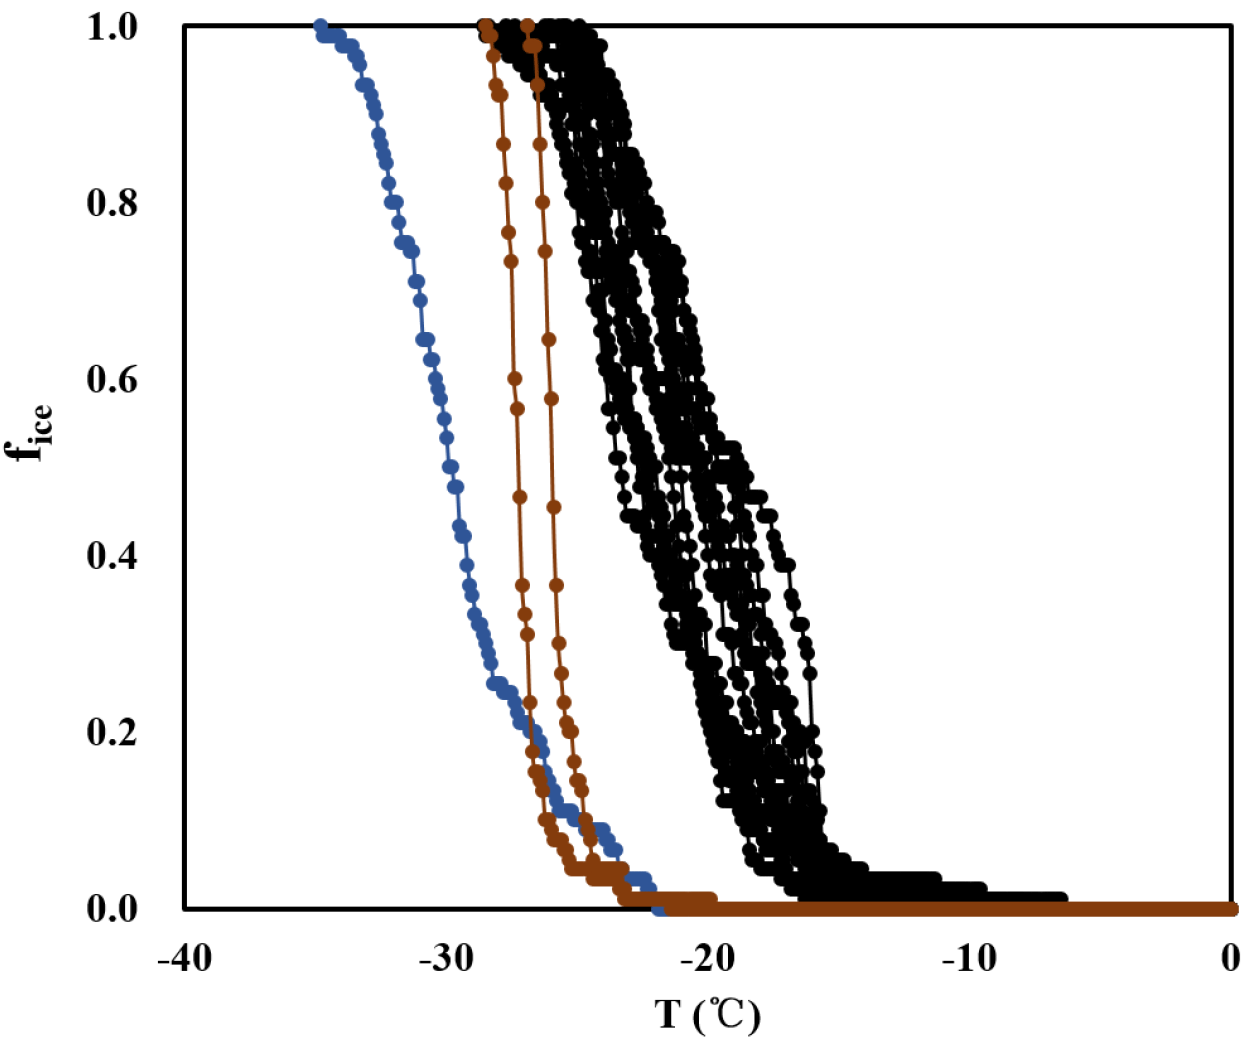
Figure A2Frozen fractions determined from LINA, together with background signals determined for pure water and for pure water in which a clean filter was put and washed, similar to the procedure for the samples.
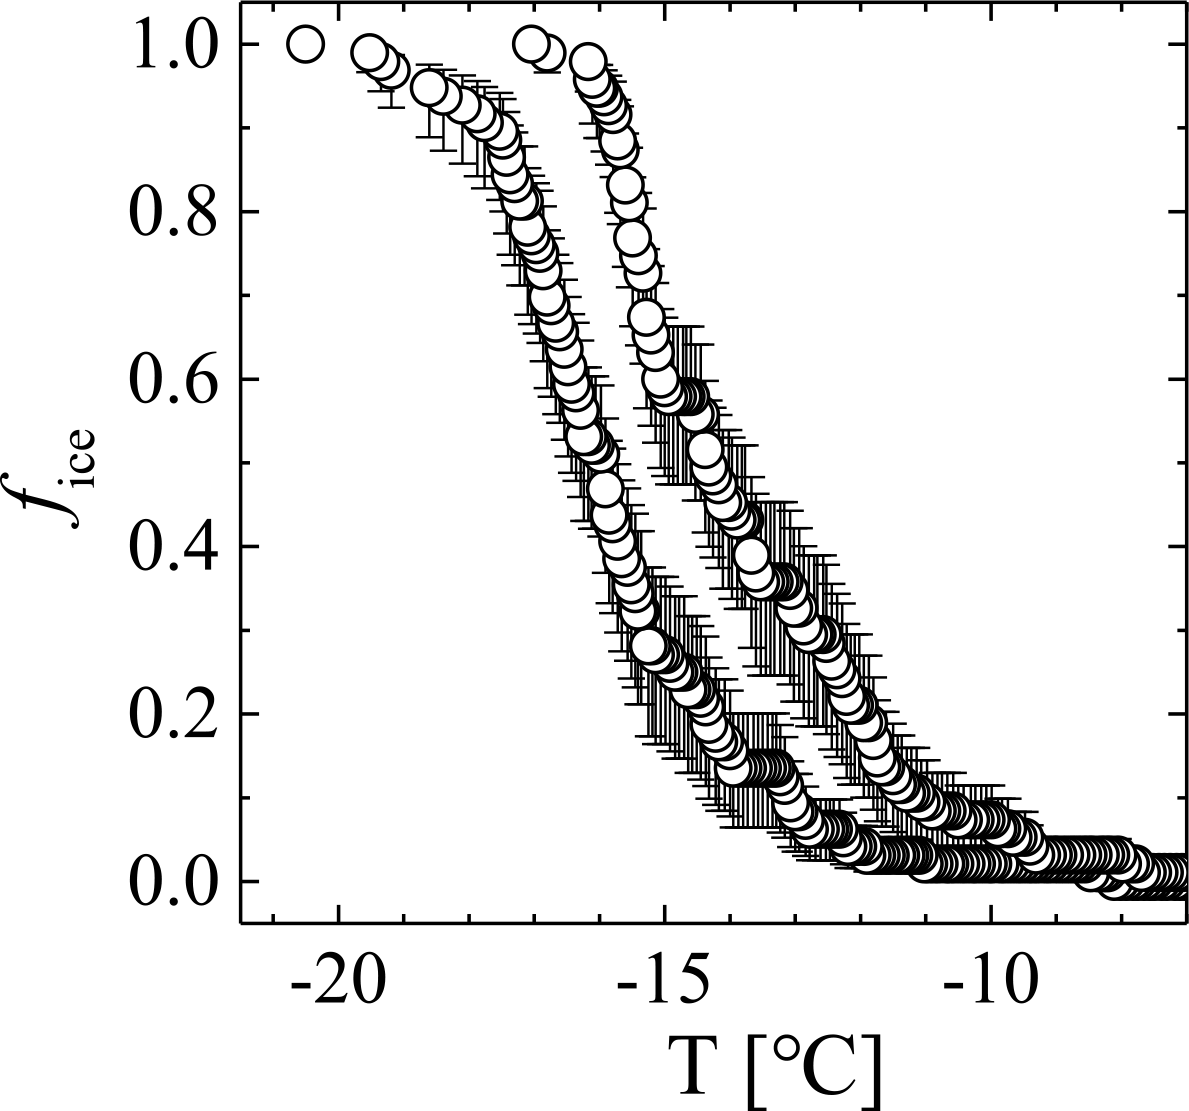
Figure A3The highest and lowest freezing curves detected with INDA together with the measurement uncertainty.
A2 Background measurement of INDA and LINA
In the background experiments of INDA, clean filters in distilled water froze from −10 to −26 ∘C, while filters with atmospheric particles froze from −6 to −22 ∘C. The fice of the clean filters was 5 to 14 times lower than the average fice of atmospheric samples at the same temperature, showing a low impact. In LINA measurements, the background of clean filters washed with distilled water was even lower, as droplets started to freeze at −22 ∘C. Figures A1 and A2 show the measured frozen fractions of the samples and the background from pure water and the water with clean filters for both INDA and LINA, to corroborate the finding that the measurements were well separated from the background.
A3 Measurement uncertainty for INP measurements
The highest and lowest freezing curves detected with INDA are shown exemplarily in Fig. A3 together with the measurement uncertainty. The derivation of the uncertainty was based on the fact that at each temperature, all INP that are ice-active at that or any higher temperature are Poisson-distributed to the examined droplets. It followed a method described in Harrison et al. (2016). For LINA, no uncertainties are given, as we know that washing off by the filters was incomplete, and the fraction of particles that was retained on the filters cannot be determined. The largest deviation that we allowed between LINA and INDA, i.e., a factor of 4.4 (see Sect. 3.2), is the basis for the maximum uncertainty for fice detected with LINA. For both INDA and LINA, the temperature uncertainty is 0.5 K.
The supplement related to this article is available online at: https://doi.org/10.5194/acp-18-3523-2018-supplement.
The authors declare that they have no conflict of interest.
This article is part of the special issue “Results from the ice nucleation research unit (INUIT) (ACP/AMT inter-journal SI)”. It is not associated with a conference.
This work is supported by the following projects: the National Natural Science
Foundation of China (41475127, 41571130021) and the Ministry of Science and
Technology of the People's Republic of China (2016YFC0202801) and by the DFG-funded Ice Nuclei Research Unit (INUIT, FOR 1525) (WE 4722/1-2) and the Swedish
Research Council (639-2013-6917).
Edited by: Daniel J. Cziczo
Reviewed by: two anonymous referees
Alpert, P. A., Aller, J. Y., and Knopf, D. A.: Initiation of the ice phase by marine biogenic surfaces in supersaturated gas and supercooled aqueous phases, Phys. Chem. Chem. Phys., 13, 19882–19894, https://doi.org/10.1039/c1cp21844a, 2011.
Ansmann, A., Tesche, M., Althausen, D., Müller, D., Seifert, P., Freudenthaler, V., Heese, B., Wiegner, M., Pisani, G., Knippertz, P., and Dubovik, O.: Influence of Saharan dust on cloud glaciation in southern Morocco during the Saharan Mineral Dust Experiment, J. Geophys. Res.-Atmos., 113, D04210, https://doi.org/10.1029/2007jd008785, 2008.
Atkinson, J. D., Murray, B. J., Woodhouse, M. T., Whale, T. F., Baustian, K. J., Carslaw, K. S., Dobbie, S., O'Sullivan, D., and Malkin, T. L.: The importance of feldspar for ice nucleation by mineral dust in mixed-phase clouds, Nature, 498, 355–358, https://doi.org/10.1038/nature12278, 2013.
Augustin, S., Wex, H., Niedermeier, D., Pummer, B., Grothe, H., Hartmann, S., Tomsche, L., Clauss, T., Voigtländer, J., Ignatius, K., and Stratmann, F.: Immersion freezing of birch pollen washing water, Atmos. Chem. Phys., 13, 10989–11003, https://doi.org/10.5194/acp-13-10989-2013, 2013.
Bond, T. C., Doherty, S. J., Fahey, D. W., Forster, P. M., Berntsen, T., DeAngelo, B. J., Flanner, M. G., Ghan, S., Kärcher, B., Koch, D., Kinne, S., Kondo, Y., Quinn, P. K., Sarofim, M. C., Schultz, M. G., Schulz, M., Venkataraman, C., Zhang, H., Zhang, S., Bellouin, N., Guttikunda, S. K., Hopke, P. K., Jacobson, M. Z., Kaiser, J. W., Klimont, Z., Lohmann, U., Schwarz, J. P., Shindell, D., Storelvmo, T., Warren, S. G., and Zender, C. S.: Bounding the role of black carbon in the climate system: a scientific assessment, J. Geophys. Res.-Atmos., 118, 5380–5552, https://doi.org/10.1002/jgrd.50171, 2013.
Budke, C. and Koop, T.: BINARY: an optical freezing array for assessing temperature and time dependence of heterogeneous ice nucleation, Atmos. Meas. Tech., 8, 689–703, https://doi.org/10.5194/amt-8-689-2015, 2015.
Chou, C., Kanji, Z. A., Stetzer, O., Tritscher, T., Chirico, R., Heringa, M. F., Weingartner, E., Prévôt, A. S. H., Baltensperger, U., and Lohmann, U.: Effect of photochemical ageing on the ice nucleation properties of diesel and wood burning particles, Atmos. Chem. Phys., 13, 761–772, https://doi.org/10.5194/acp-13-761-2013, 2013.
Conen, F., Henne, S., Morris, C. E., and Alewell, C.: Atmospheric ice nucleators active 12 ∘C can be quantified on PM10 filters, Atmos. Meas. Tech., 5, 321–327, https://doi.org/10.5194/amt-5-321-2012, 2012.
Corbin, J. C., Rehbein, P. J. G., Evans, G. J., and Abbatt, J. P. D.: Combustion particles as ice nuclei in an urban environment: evidence from single-particle mass spectrometry, Atmos. Environ., 51, 286–292, https://doi.org/10.1016/j.atmosenv.2012.01.007, 2012.
Cozic, J., Verheggen, B., Mertes, S., Connolly, P., Bower, K., Petzold, A., Baltensperger, U., and Weingartner, E.: Scavenging of black carbon in mixed phase clouds at the high alpine site Jungfraujoch, Atmos. Chem. Phys., 7, 1797–1807, https://doi.org/10.5194/acp-7-1797-2007, 2007.
Cozic, J., Mertes, S., Verheggen, B., Cziczo, D. J., Gallavardin, S. J., Walter, S., Baltensperger, U., and Weingartner, E.: Black carbon enrichment in atmospheric ice particle residuals observed in lower tropospheric mixed phase clouds, J. Geophys. Res.-Atmos., 113, D15209, https://doi.org/10.1029/2007jd009266, 2008.
DeMott, P. J., Sassen, K., Poellot, M. R., Baumgardner, D., Rogers, D. C., Brooks, S. D., Prenni, A. J., and Kreidenweis, S. M.: African dust aerosols as atmospheric ice nuclei, Geophys. Res. Lett., 30, 1732, https://doi.org/10.1029/2003gl017410, 2003.
DeMott, P. J., Prenni, A. J., Liu, X., Kreidenweis, S. M., Petters, M. D., Twohy, C. H., Richardson, M. S., Eidhammer, T., and Rogers, D. C.: Predicting global atmospheric ice nuclei distributions and their impacts on climate, P. Natl. Acad. Sci. USA, 107, 11217–11222, https://doi.org/10.1073/pnas.0910818107, 2010.
DeMott, P. J., Prenni, A. J., McMeeking, G. R., Sullivan, R. C., Petters, M. D., Tobo, Y., Niemand, M., Möhler, O., Snider, J. R., Wang, Z., and Kreidenweis, S. M.: Integrating laboratory and field data to quantify the immersion freezing ice nucleation activity of mineral dust particles, Atmos. Chem. Phys., 15, 393–409, https://doi.org/10.5194/acp-15-393-2015, 2015.
DeMott, P. J., Hill, T. C. J., McCluskey, C. S., Prather, K. A., Collins, D. B., Sullivan, R. C., Ruppel, M. J., Mason, R. H., Irish, V. E., Lee, T., Hwang, C. Y., Rhee, T. S., Snider, J. R., McMeeking, G. R., Dhaniyala, S., Lewis, E. R., Wentzell, J. J. B., Abbatt, J., Lee, C., Sultana, C. M., Ault, A. P., Axson, J. L., Diaz Martinez, M., Venero, I., Santos-Figueroa, G., Stokes, M. D., Deane, G. B., Mayol-Bracero, O. L., Grassian, V. H., Bertram, T. H., Bertram, A. K., Moffett, B. F., and Franc, G. D.: Sea spray aerosol as a unique source of ice nucleating particles, P. Natl. Acad. Sci. USA, 113, 5797–5803, https://doi.org/10.1073/pnas.1514034112, 2016.
Fletcher, N. H.: The physics of rainclouds, Cambridge University Press, 1962.
Fröhlich-Nowoisky, J., Hill, T. C. J., Pummer, B. G., Yordanova, P., Franc, G. D., and Pöschl, U.: Ice nucleation activity in the widespread soil fungus Mortierella alpina, Biogeosciences, 12, 1057–1071, https://doi.org/10.5194/bg-12-1057-2015, 2015.
Grawe, S., Augustin-Bauditz, S., Hartmann, S., Hellner, L., Pettersson, J. B. C., Prager, A., Stratmann, F., and Wex, H.: The immersion freezing behavior of ash particles from wood and brown coal burning, Atmos. Chem. Phys., 16, 13911–13928, https://doi.org/10.5194/acp-16-13911-2016, 2016.
Guo, S., Hu, M., Wang, Z. B., Slanina, J., and Zhao, Y. L.: Size-resolved aerosol water-soluble ionic compositions in the summer of Beijing: implication of regional secondary formation, Atmos. Chem. Phys., 10, 947–959, https://doi.org/10.5194/acp-10-947-2010, 2010.
Guo, S., Hu, M., Guo, Q., Zhang, X., Zheng, M., Zheng, J., Chang, C. C., Schauer, J. J., and Zhang, R.: Primary sources and secondary formation of organic aerosols in Beijing, China, Environ. Sci. Technol., 46, 9846–9853, https://doi.org/10.1021/es2042564, 2012.
Hang, S., Yan, Y., and Chunsong, L.: Development of new diffusion cloud chamber type and its observation study of ice nuclei in the Huangshan area., Chinese J. Atmos. Sci., 38, 13, https://doi.org/10.3878/j.issn.1006-9895.2013.12211, 2014.
Harrison, A. D., Whale, T. F., Carpenter, M. A., Holden, M. A., Neve, L., O'Sullivan, D., Vergara Temprado, J., and Murray, B. J.: Not all feldspars are equal: a survey of ice nucleating properties across the feldspar group of minerals, Atmos. Chem. Phys., 16, 10927–10940, https://doi.org/10.5194/acp-16-10927-2016, 2016.
Hartmann, S., Augustin, S., Clauss, T., Wex, H., Šantl-Temkiv, T., Voigtländer, J., Niedermeier, D., and Stratmann, F.: Immersion freezing of ice nucleation active protein complexes, Atmos. Chem. Phys., 13, 5751–5766, https://doi.org/10.5194/acp-13-5751-2013, 2013.
Hasenkopf, C. A., Veghte, D. P., Schill, G. P., Lodoysamba, S., Freedman, M. A., and Tolbert, M. A.: Ice nucleation, shape, and composition of aerosol particles in one of the most polluted cities in the world: Ulaanbaatar, Mongolia, Atmos. Environ., 139, 222–229, https://doi.org/10.1016/j.atmosenv.2016.05.037, 2016.
Hill, T. C. J., DeMott, P. J., Tobo, Y., Fröhlich-Nowoisky, J., Moffett, B. F., Franc, G. D., and Kreidenweis, S. M.: Sources of organic ice nucleating particles in soils, Atmos. Chem. Phys., 16, 7195–7211, https://doi.org/10.5194/acp-16-7195-2016, 2016.
Hoose, C. and Möhler, O.: Heterogeneous ice nucleation on atmospheric aerosols: a review of results from laboratory experiments, Atmos. Chem. Phys., 12, 9817–9854, https://doi.org/10.5194/acp-12-9817-2012, 2012.
Hu, W., Hu, M., Hu, W.-W., Zheng, J., Chen, C., Wu, Y., and Guo, S.: Seasonal variations in high time-resolved chemical compositions, sources, and evolution of atmospheric submicron aerosols in the megacity Beijing, Atmos. Chem. Phys., 17, 9979–10000, https://doi.org/10.5194/acp-17-9979-2017, 2017.
Jiang, H., Yin, Y., Yang, L., Yang, S., Su, H., and Chen, K.: The characteristics of atmospheric ice nuclei measured at different altitudes in the Huangshan Mountains in Southeast China, Adv. Atmos. Sci., 31, 396–406, https://doi.org/10.1007/s00376-013-3048-5, 2014.
Jiang, H., Yin, Y., Su, H., Shan, Y., and Gao, R.: The characteristics of atmospheric ice nuclei measured at the top of Huangshan (the Yellow Mountains) in Southeast China using a newly built static vacuum water vapor diffusion chamber, Atmos. Res., 153, 200–208, https://doi.org/10.1016/j.atmosres.2014.08.015, 2015.
Jiang, H., Yin, Y., Wang, X., Gao, R., Yuan, L., Chen, K., and Shan, Y.: The measurement and parameterization of ice nucleating particles in different backgrounds of China, Atmos. Res., 181, 72–80, https://doi.org/10.1016/j.atmosres.2016.06.013, 2016.
Kamphus, M., Ettner-Mahl, M., Klimach, T., Drewnick, F., Keller, L., Cziczo, D. J., Mertes, S., Borrmann, S., and Curtius, J.: Chemical composition of ambient aerosol, ice residues and cloud droplet residues in mixed-phase clouds: single particle analysis during the Cloud and Aerosol Characterization Experiment (CLACE 6), Atmos. Chem. Phys., 10, 8077–8095, https://doi.org/10.5194/acp-10-8077-2010, 2010.
Kanji, Z. A., Ladino, L. A., Wex, H., Boose, Y., Burkert-Kohn, M., Cziczo, D. J., and Krämer, M.: Chapter 1: Overview of ice nucleating particles, Meteor Monogr., Am. Meteorol. Soc., 58, 1–33, https://doi.org/10.1175/amsmonographs-d-16-0006.1, 2017.
Kaufmann, L., Marcolli, C., Hofer, J., Pinti, V., Hoyle, C. R., and Peter, T.: Ice nucleation efficiency of natural dust samples in the immersion mode, Atmos. Chem. Phys., 16, 11177–11206, https://doi.org/10.5194/acp-16-11177-2016, 2016.
Knopf, D. A., Wang, B., Laskin, A., Moffet, R. C., and Gilles, M. K.: Heterogeneous nucleation of ice on anthropogenic organic particles collected in Mexico City, Geophys. Res. Lett., 37, L11803, https://doi.org/10.1029/2010GL043362, 2010.
Kulkarni, G., China, S., Liu, S., Nandasiri, M., Sharma, N., Wilson, J., Aiken, A. C., Chand, D., Laskin, A., Mazzoleni, C., Pekour, M., Shilling, J., Shutthanandan, V., Zelenyuk, A., and Zaveri, R. A.: Ice nucleation activity of diesel soot particles at cirrus relevant temperature conditions: effects of hydration, secondary organics coating, soot morphology, and coagulation, Geophys. Res. Lett., 43, 3580–3588, https://doi.org/10.1002/2016gl068707, 2016.
Levin, E. J. T., McMeeking, G. R., DeMott, P. J., McCluskey, C. S., Carrico, C. M., Nakao, S., Jayarathne, T., Stone, E. A., Stockwell, C. E., Yokelson, R. J., and Kreidenweis, S. M.: Ice-nucleating particle emissions from biomass combustion and the potential importance of soot aerosol, J. Geophys. Res., 121, 5888–5903, https://doi.org/10.1002/2016jd024879, 2016.
Li, W. J. and Shao, L. Y.: Observation of nitrate coatings on atmospheric mineral dust particles, Atmos. Chem. Phys., 9, 1863–1871, https://doi.org/10.5194/acp-9-1863-2009, 2009.
Lu, Y., Chi, J., Yao, L., Yang, L., Li, W., Wang, Z., and Wang, W.: Composition and mixing state of water soluble inorganic ions during hazy days in a background region of North China, Sci. China Earth Sci., 58, 2026–2033, https://doi.org/10.1007/s11430-015-5131-5, 2015.
Lundheim, R.: Physiological and ecological significance of biological ice nucleators, Philos. T. Roy. Soc. B, 357, 937–943, https://doi.org/10.1098/rstb.2002.1082, 2002.
Marcolli, C.: Deposition nucleation viewed as homogeneous or immersion freezing in pores and cavities, Atmos. Chem. Phys., 14, 2071–2104, https://doi.org/10.5194/acp-14-2071-2014, 2014.
Meyers, M. P., Demott, P. J., and Cotton, W. R.: New primary ice-nucleation parameterizations in an explicit cloud model, J. Appl. Meteorol., 31, 708–721, 1992.
Moffett, B. F., Getti, G., Henderson-Begg, S. K., and Hill, T. C. J.: Ubiquity of ice nucleation in lichen – possible atmospheric implications, Lindbergia, 38, 39–43, 2015.
Morris, C. E., Conen, F., Alex Huffman, J., Phillips, V., Poschl, U., and Sands, D. C.: Bioprecipitation: a feedback cycle linking earth history, ecosystem dynamics and land use through biological ice nucleators in the atmosphere, Glob. Change Biol., 20, 341–351, https://doi.org/10.1111/gcb.12447, 2014.
Müller, T., Henzing, J. S., de Leeuw, G., Wiedensohler, A., Alastuey, A., Angelov, H., Bizjak, M., Collaud Coen, M., Engström, J. E., Gruening, C., Hillamo, R., Hoffer, A., Imre, K., Ivanow, P., Jennings, G., Sun, J. Y., Kalivitis, N., Karlsson, H., Komppula, M., Laj, P., Li, S.-M., Lunder, C., Marinoni, A., Martins dos Santos, S., Moerman, M., Nowak, A., Ogren, J. A., Petzold, A., Pichon, J. M., Rodriquez, S., Sharma, S., Sheridan, P. J., Teinilä, K., Tuch, T., Viana, M., Virkkula, A., Weingartner, E., Wilhelm, R., and Wang, Y. Q.: Characterization and intercomparison of aerosol absorption photometers: result of two intercomparison workshops, Atmos. Meas. Tech., 4, 245–268, https://doi.org/10.5194/amt-4-245-2011, 2011.
Murray, B. J., O'Sullivan, D., Atkinson, J. D., and Webb, M. E.: Ice nucleation by particles immersed in supercooled cloud droplets, Chem. Soc. Rev., 41, 6519–6554, https://doi.org/10.1039/c2cs35200a, 2012.
O'Sullivan, D., Murray, B. J., Ross, J. F., and Webb, M. E.: The adsorption of fungal ice-nucleating proteins on mineral dusts: a terrestrial reservoir of atmospheric ice-nucleating particles, Atmos. Chem. Phys., 16, 7879–7887, https://doi.org/10.5194/acp-16-7879-2016, 2016.
Pöschl, U.: Atmospheric aerosols: composition, transformation, climate and health effects, Angew. Chem. Int. Edit., 44, 7520–7540, https://doi.org/10.1002/anie.200501122, 2005.
Peng, J., Hu, M., Guo, S., Du, Z., Zheng, J., Shang, D., Zamora, M. L., Zeng, L., Shao, M., Wu, Y.-S., Zheng, J.,, Wang, Glen, C. R., Collins, D. R., Molina, M. J., and Zhang, R.: Markedly enhanced absorption and direct radiative forcing of black carbon under polluted urban environments, P. Natl. Acad. Sci. USA, 113, 4266, https://doi.org/10.1073/pnas.1602310113, 2016.
Petters, M. D. and Wright, T. P.: Revisiting ice nucleation from precipitation samples, Geophys. Res. Lett., 42, 8758–8766, https://doi.org/10.1002/2015GL065733, 2015.
Pruppacher, H. R., Klett, J. D., and Wang, P. K.: Microphysics of clouds and precipitation, Aerosol Sci. Tech., 28, 381–382, https://doi.org/10.1080/02786829808965531, 1998.
Pummer, B. G., Bauer, H., Bernardi, J., Bleicher, S., and Grothe, H.: Suspendable macromolecules are responsible for ice nucleation activity of birch and conifer pollen, Atmos. Chem. Phys., 12, 2541–2550, https://doi.org/10.5194/acp-12-2541-2012, 2012.
Pummer, B. G., Budke, C., Augustin-Bauditz, S., Niedermeier, D., Felgitsch, L., Kampf, C. J., Huber, R. G., Liedl, K. R., Loerting, T., Moschen, T., Schauperl, M., Tollinger, M., Morris, C. E., Wex, H., Grothe, H., Pöschl, U., Koop, T., and Fröhlich-Nowoisky, J.: Ice nucleation by water-soluble macromolecules, Atmos. Chem. Phys., 15, 4077–4091, https://doi.org/10.5194/acp-15-4077-2015, 2015.
Rosenfeld, D., Lohmann, U., Raga, G. B., O'Dowd, C. D., Kulmala, M., Fuzzi, S., Reissell, A., and Andreae, M. O.: Flood or Drought: how Do Aerosols Affect Precipitation?, Science, 321, 1309–1313, https://doi.org/10.1126/science.1160606, 2008.
Schill, G. P., Jathar, S. H., Kodros, J. K., Levin, E. J. T., Galang, A. M., Friedman, B., Link, M. F., Farmer, D. K., Pierce, J. R., Kreidenweis, S. M., and DeMott, P. J.: Ice-nucleating particle emissions from photochemically aged diesel and biodiesel exhaust, Geophys. Res. Lett., 43, 5524–5531, https://doi.org/10.1002/2016gl069529, 2016.
Schnell, R. C. and Vali, G.: Atmospheric ice nuclei from decomposing vegetation, Nature, 236, 163–165, 1972.
Shi, A. Y., Zheng, G. G., and You, L. G.: Observation and analysis on ice nucleus of Henan County of Qinghai Province in autumn 2003, J. Appl. Meteorol. Sci., 7, 245–249, 2006 (in Chinese).
Sullivan, R. C., Minambres, L., DeMott, P. J., Prenni, A. J., Carrico, C. M., Levin, E. J. T., and Kreidenweis, S. M.: Chemical processing does not always impair heterogeneous ice nucleation of mineral dust particles, Geophys. Res. Lett., 37, L24805, https://doi.org/10.1029/2010gl045540, 2010.
Szyrmer, W. and Zawadzki, I.: Biogenic and anthropogenic sources of ice-forming nuclei: a review, B. Am. Meteorol. Soc., 209–209, 1997.
Umo, N. S., Murray, B. J., Baeza-Romero, M. T., Jones, J. M., Lea-Langton, A. R., Malkin, T. L., O'Sullivan, D., Neve, L., Plane, J. M. C., and Williams, A.: Ice nucleation by combustion ash particles at conditions relevant to mixed-phase clouds, Atmos. Chem. Phys., 15, 5195–5210, https://doi.org/10.5194/acp-15-5195-2015, 2015.
Vali, G.: Quantitative evalutaion of experimental results on the heterogeneous freezing nucleation of supercooled liquids, J. Atmos. Sci., 28, 8, https://doi.org/10.1175/1520-0469(1971)028<0402:QEOERA>2.0.CO;2, 1971.
Vali, G., DeMott, P. J., Möhler, O., and Whale, T. F.: Technical Note: A proposal for ice nucleation terminology, Atmos. Chem. Phys., 15, 10263–10270, https://doi.org/10.5194/acp-15-10263-2015, 2015.
Wehner, B., Birmili, W., Ditas, F., Wu, Z., Hu, M., Liu, X., Mao, J., Sugimoto, N., and Wiedensohler, A.: Relationships between submicrometer particulate air pollution and air mass history in Beijing, China, 2004–2006, Atmos. Chem. Phys., 8, 6155–6168, https://doi.org/10.5194/acp-8-6155-2008, 2008.
Welti, A., Müller, K., Fleming, Z. L., and Stratmann, F.: Concentration and variability of ice nuclei in the subtropic, maritime boundary layer, Atmos. Chem. Phys. Discuss., https://doi.org/10.5194/acp-2017-783, in review, 2017.
Westbrook, C. D. and Illingworth, A. J.: The formation of ice in a long-lived supercooled layer cloud, Q. J. Roy. Meteor. Soc., 139, 2209–2221, https://doi.org/10.1002/qj.2096, 2013.
Wex, H., DeMott, P. J., Tobo, Y., Hartmann, S., Rösch, M., Clauss, T., Tomsche, L., Niedermeier, D., and Stratmann, F.: Kaolinite particles as ice nuclei: learning from the use of different kaolinite samples and different coatings, Atmos. Chem. Phys., 14, 5529–5546, https://doi.org/10.5194/acp-14-5529-2014, 2014.
Wex, H., Augustin-Bauditz, S., Boose, Y., Budke, C., Curtius, J., Diehl, K., Dreyer, A., Frank, F., Hartmann, S., Hiranuma, N., Jantsch, E., Kanji, Z. A., Kiselev, A., Koop, T., Möhler, O., Niedermeier, D., Nillius, B., Rösch, M., Rose, D., Schmidt, C., Steinke, I., and Stratmann, F.: Intercomparing different devices for the investigation of ice nucleating particles using Snomax® as test substance, Atmos. Chem. Phys., 15, 1463–1485, https://doi.org/10.5194/acp-15-1463-2015, 2015.
Wilson, T. W., Ladino, L. A., Alpert, P. A., Breckels, M. N., Brooks, I. M., Browse, J., Burrows, S. M., Carslaw, K. S., Huffman, J. A., Judd, C., Kilthau, W. P., Mason, R. H., McFiggans, G., Miller, L. A., Najera, J. J., Polishchuk, E., Rae, S., Schiller, C. L., Si, M., Temprado, J. V., Whale, T. F., Wong, J. P. S., Wurl, O., Yakobi-Hancock, J. D., Abbatt, J. P. D., Aller, J. Y., Bertram, A. K., Knopf, D. A., and Murray, B. J.: A marine biogenic source of atmospheric ice-nucleating particles, Nature, 525, 234–238, https://doi.org/10.1038/nature14986, 2015.
Wu, Z. J., Cheng, Y. F., Hu, M., Wehner, B., Sugimoto, N., and Wiedensohler, A.: Dust events in Beijing, China (2004–2006): comparison of ground-based measurements with columnar integrated observations, Atmos. Chem. Phys., 9, 6915–6932, https://doi.org/10.5194/acp-9-6915-2009, 2009.
Yang, F., Tan, J., Zhao, Q., Du, Z., He, K., Ma, Y., Duan, F., Chen, G., and Zhao, Q.: Characteristics of PM2.5 speciation in representative megacities and across China, Atmos. Chem. Phys., 11, 5207–5219, https://doi.org/10.5194/acp-11-5207-2011, 2011.
Yang, L., Yin, Y., Yang, S. Z., Jiang, H., Xiao, H., Chen, Q., Su, H., and Chen, C.: The measurement and analysis of atmospheric ice nuclei in Nanjing, Chinese J. Atmos. Sci., 37, 11, https://doi.org/10.3878/j.issn.1006-9895.2012.11252, https://doi.org/10.3878/j.issn.1006-9895.2012.11242, 2012 (in Chinese).
You, L. G. and Shi, A. Y.: Measurement and analysis of ice-nucleus concentration during the period from March 18th to April 30th in 1963 in Beijing, Acta Meteorol. Sin., 34, 548–554, 1964 (in Chinese).
You, L. G., Yang, S. Z., Wang, X. G. and Pi, J. X.: Study of ice nuclei concentration at Beijing in spring of 1995 and 1996, Acta Meteorol. Sin., 60, 101–109, https://doi.org/10.3321/j.issn:0577-6619.2002.01.012, 2002 (in Chinese).
Zheng, J., Hu, M., Peng, J., Wu, Z., Kumar, P., Li, M., Wang, Y., and Guo, S.: Spatial distributions and chemical properties of PM2.5 based on 21 field campaigns at 17 sites in China, Chemosphere, 159, 480–487, https://doi.org/10.1016/j.chemosphere.2016.06.032, 2016.