the Creative Commons Attribution 3.0 License.
the Creative Commons Attribution 3.0 License.
Assessment of emission scenarios for 2030 and impacts of black carbon emission reduction measures on air quality and radiative forcing in Southeast Asia
Didin Agustian Permadi
Robert Vautard
Our previously published paper (Permadi et al. 2018) focused on the preparation of emission input data and evaluation of WRF–CHIMERE performance in 2007. This paper details the impact assessment of the future (2030) black carbon (BC) emission reduction measures for Southeast Asia (SEA) countries on air quality, health and BC direct radiative forcing (DRF). The business as usual (BAU2030) projected emissions from the base year of 2007 (BY2007), assuming “no intervention” with the linear projection of the emissions based on the past activity data for Indonesia and Thailand and the sectoral GDP growth for other countries. The RED2030 featured measures to cut down emissions in major four source sectors in Indonesia and Thailand (road transport, residential cooking, industry, biomass open burning) while for other countries the Representative Concentration Pathway 8.5 (RCP8.5) emissions were assumed. WRF–CHIMERE simulated levels of aerosol species under BAU2030 and RED2030 for the modeling domain using the base year meteorology and 2030 boundary conditions from LMDZ-INCA. The extended aerosol optical depth module (AODEM) calculated the total columnar AOD and BC AOD for all scenarios with an assumption on the internal mixing state. Under RED2030, the health benefits were analyzed in terms of the number of avoided premature deaths associated with ambient PM2.5 reduction along with BC DRF reduction. Under BAU2030, the average number of the premature deaths per 100 000 people in the SEA domain would increase by 30 from BY2007 while under RED2030 the premature deaths would be cut down (avoided) by 63 from RED2030. In 2007, the maximum annual average BC DRF in the SEA countries was 0.98 W m−2, which would increase to 2.0 W m−2 under BAU2030 and 1.4 W m−2 under RED2030. Substantial impacts on human health and BC DRF reduction in SEA could result from the emission measures incorporated in RED2030. Future works should consider other impacts, such as for agricultural crop production, and the cost–benefit analysis of the measures' implementation to provide relevant information for policy making.
- Article
(3027 KB) - Full-text XML
- Companion paper
-
Supplement
(273 KB) - BibTeX
- EndNote


The interaction between aerosol (fine particles suspended in the atmosphere) and climate has gained an increasing attention from the scientific community, especially to assess various emission control measures for near-term climate change mitigation. Being black in color, black carbon (BC) particles in the atmosphere strongly absorb solar radiation, thus exerting a positive direct radiative forcing (DRF). BC is known as a short-lived climate forcing pollutant (SLCP) because of its short atmospheric lifetime of a few days to weeks as compared to the long-lived carbon dioxide, for example. BC interacts with the cloud formation processes and once depositing on snow it reduces the surface albedo and consequently affects Earth's radiation energy balance (Myhre et al., 2001). Several global modeling studies estimated present-day BC radiative forcing of +0.2–+1.1 W m−2; hence BC has been recognized as the second-most important global warming agent after CO2 (Bond et al., 2013; Ramanathan and Carmichael, 2008). Globally, measures aiming to reduce emissions of BC (and co-emitting pollutants) have been shown to reduce the number of premature deaths and slow down the temperature increase rate in the near future, i.e., bring in co-benefits, and there is more to be gained in Asia, where current emissions are high (UNEP-WMO, 2011; Shindell et al., 2012).
Southeast Asia (SEA) has high emissions from anthropogenic sources that contribute significantly to Asian and global emissions (Permadi et al., 2018). Overall, Asian emissions have been reported to have increased rapidly over the last few decades (Streets et al., 2003; Zhang et al., 2009; Ohara et al., 2007; EC/JRC-PBL, 2010). High levels of air pollution, especially fine particles or PM2.5 (particles with aerodynamic diameter ≤ 2.5 µm), that cause severe health effects (WHO, 2012) have been measured in Asian cities (Kim Oanh et al., 2006; Hopke et al., 2008). Global studies reported that efforts to reduce SLCP emissions (BC and ozone precursors) would help to reduce global warming immediately (UNEP-WMO, 2011; Shindell et al., 2012), which should complement those efforts addressing the long-lived greenhouse gases (GHGs) that require more time to realize. Developing Asia is also vulnerable to climate change, and hence reducing emissions of the SLCPs would bring in co-benefits in terms of avoiding excessive premature deaths, reducing the crop yield loss and slowing down the temperature increase rate (UNEP-WMO, 2011).
The co-benefit approach is being more and more recognized as an important concept to simultaneously address the problems of air pollution and climate change. However, so far it has not been adequately considered in policy making in many developing countries. A number of studies reported applications of the modeling tool to investigate impacts of emission reduction measures on the premature mortality and radiative forcing in East and South Asia (Saikawa et al., 2009; Aunan et al., 2006; Akimoto et al., 2015). There are no such detailed studies conducted for the SEA region where local/domestic and transboundary problems, e.g., regional haze, are important (Heil and Goldammer, 2001).
In this paper we focus on simulations of aerosol concentrations in SEA under two emission scenarios, projected for 2030, using the chemistry transport model (CTM) of CHIMERE (Vautard et al., 2001; Bessagnet et al., 2004). Our accompanying paper (Permadi et al., 2018) has detailed the SEA emissions and the evaluation of WRF–CHIMERE performance for PM10, PM2.5 and BC in SEA in the base year of 2007 (BY2007). The emission reduction scenario (RED2030) considered reduction measures to be implemented in four major anthropogenic source sectors (road transportation, residential cooking, industry and biomass open burning) in two large emitting SEA countries, Thailand and Indonesia. The changes in the BC DRF and in the number of avoided premature deaths between BY2007 and RED2030 were compared to those between BY2007 and the business as usual scenario (BAU2030) to highlight potential impacts. The results of this study would provide information to policy makers on the efficacy of different emission reduction measures and associated benefits for improving air quality, reducing health effects and mitigating BC DRF in SEA. To the best of our knowledge, this is the first study addressing air quality and BC DRF impacts for the SEA region, and so the results would contribute scientific evidences to promote the co-control approach that is currently not incorporated in the policy in any country in the region.
2.1 Model simulation
Details of the models used and their configurations have been presented in the accompanying paper (Permadi et al., 2018). The emission inputs were prepared based on two developed emission scenarios (BAU2030 and RED2030). The meteorological fields produced by WRF for 2007 were used for the simulation of scenarios in 2030. The base year of 2007 was selected because it was not affected by the strong El Niño and La Niña events (http://www.cpc.noaa.gov/products/analysis_monitoring/ensostuff/ensoyears.shtml). We also took advantage of the satisfactorily evaluated WRF performance for 2007 to examine the effects of the emission reductions alone under the scenarios. However, to account for the changes in the boundary conditions in the simulations of future emission scenarios, we used the chemistry boundary conditions obtained from the global chemistry–aerosol–climate model that couples online the LMDZ (Laboratoire de Météorologie Dynamique, version 4) general circulation model (Hourdin et al., 2006) and the INCA (INteraction with Chemistry and Aerosols, version 3) model (Hauglustaine et al., 2014) using the global Representative Concentration Pathway 8.5 (RCP8.5) emissions (Didier Hauglustaine, personal communication, 2013). Specifically, the concentrations of 27 pollutants, including aerosol and trace gases as the SEA domain boundary conditions (monthly average), were extracted from the global LMDZ-INCA simulation for the base year 2007 (BY2007) and 2030 (BAU2030 and RED2030) for 19 hybrid vertical pressure levels. The horizontal resolution is 1.9∘ in latitude and 3.75∘ in longitude of LMDZ-INCA output. Boundary conditions from the LMDZ-INCA were processed using the available routine in CHIMERE to read the monthly concentrations and get the information of the lateral (lat_con) and top boundary (top_con) concentrations. We used the ratio of simulated levels between 2030 and 2007 for each species to estimate the boundary conditions in 2030 and modified the model inputs. Accordingly, using the output levels of LMDZ-INCA for BC and organic carbon (OC) for the year of 2007 and 2030 we estimated the ratios of each BC and OC species between these 2 years (2030 ∕ 2007 ratios) and presented in Fig. S1 in the Supplement. Note that the biogenic emissions in 2030 were assumed to be the same as in 2007.
In the discussion of modeling results throughout the paper, two domains are defined as follows: (1) the modeling domain, covering the SEA countries and the southern part of China, and (2) the SEA domain, covering only the nine SEA countries in the domain. Note that base year emissions of East Timor were not provided by the Center for Global and Regional Environmental Research (CGRER) and hence it was not included in the SEA domain.
2.2 Emission scenarios
BAU2030 is a reference future scenario, named business as usual (BAU), representing the emissions in 2030. BAU was developed based on the assumption that the emissions would grow following the current trend of the activity data. For Indonesia and Thailand, two large emitting countries in SEA, the historical activity data available prior to 2007 were collected and the trends were examined over the period of the available data of 4–19 years (varying with emission source sector). Further, a simple regression analysis was conducted to analyze the linear relationship between the emissions and a selected proxy which was used to project the activity data to 2030 for the respective country. In principle, it is desirable to have long historical data periods for the emission projection (for Thailand and Indonesia). However, in 1997–1998 the region went through a drastic economic recession and so inclusion of the data before 1999 may induce a large bias. Therefore, even when a longer data period was available for a sector we still relied on the trend obtained for the period of 1999–2007. Note that only a short period of historical data (4 years) was available for the petroleum refinery and mining production sectors in Thailand, which may contribute more uncertainty to the BAU scenario emission results. Nevertheless, these sectors did not contribute significantly to the total emissions. The same emission factors (EFs) of 2007 were used for the emission estimation from the sources in 2030 and this may contribute a certain uncertainty to the projected emissions. In general, we should expect the EFs to be reduced in the future with the progressive technology intrusion. Nevertheless, if the vehicle age limit is not strictly enforced, more aged engines will have higher EFs in the future. For other countries and territories in the modeling domain, due to the limitation of historical activity data, the BAU emissions were projected using their GDP growth trends over the period 2000–2007. The BY2007 emission data for those countries were taken from the international databases that were provided at a different resolution (i.e., 0.5∘ × 0.5∘). Therefore, the spatial analysis of “grid conversion” in geographic information system (GIS) was used to convert the emission data in to the same grid resolution 30 × 30 km2 for the whole domain. The land mask map that was generated from the WRF model with a resolution of 30 × 30 km2 was used to regrid the emissions on the border between land and sea (assigning zero emissions to the sea area). The same spatial and temporal emission distribution patterns of 2007 were used in the BAU2030 emissions for the whole modeling domain.
The RED2030 scenario considers the PM emission cut for major emission sources in 2030. For Indonesia and Thailand, RED2030 emissions were calculated using the available official policy documents that mainstreamed both air quality and climate change mitigations in four major emission sectors (road transport, residential, industry and biomass open burning) as detailed in Table S1. These involved cleaner transportation fleets with at least Euro2 in Indonesia and Euro4 in Thailand for personal cars, while natural gas should be used in all public buses in Indonesia and all public buses and taxis in Thailand. The measures considered for residential cooking for Indonesia included the national program of conversion of kerosene to liquefied petroleum gas (LPG) for cooking (Permadi et al., 2017) and introduction of cleaner biomass fuel (for gasifier cookstove) to replace the traditional wood-fuel cookstoves. In Thailand, cleaner fuel, such as LPG, was introduced to replace wood fuel and charcoal, and rural electrification was implemented to enable application of electric cookstoves. In the industrial sector in Indonesia, fuel switching and process modernization were assumed for key industries such as cement, iron steel, pulp and paper and textile (ICCSR, 2009). In Thailand, measures focused on energy saving and maximum feasible reduction in key industries, such as the cement and iron steel industries, were considered following the policy action proposed by Chotichanathawewong and Thongplew (2012). For biomass open burning, Indonesia focused on the reduction of forest burning area target and zero burning of solid waste following the National Strategic Plan document (MoF, 2010). A clear target was set in Thailand to follow the National Master Plan of Open Burning Control (PCD, 2010), which mandated burning of no more than 48 000 ha yr−1 of forest area by 2030 and zero burning for crop residue implemented throughout the country.
For other countries in the modeling domain, due to the lack of relevant information, this study assumed that their emissions followed the RCP8.5 pathways (taken from http://tntcat.iiasa.ac.at:8787/RcpDb/) for the Asian region. Accordingly, under RCP8.5, in 2030 the SEA emissions of CH4 and NH3 would increase by 1.7 and 1.3 times, respectively, as compared to 2007, while non-methane volatile organic compounds (NMVOC) remained nearly the same during the period. For other pollutants (SO2, CO, NOx, BC and OC), some emission reductions were expected, i.e., 2030 emissions were 60–90 % of the respective 2007 emissions. Note that the same temporal and spatial emission distribution patterns of BY2007 were used also in RED2030 emissions.
2.3 Assessment of impacts on air quality and BC DRF
The potential impacts of the emission reduction scenarios on improvement of air quality (and hence health benefits) and mitigation of climate forcing were assessed and quantified. Impacts of emission reduction measures under RED2030 as compared to the reference scenario (BAU2030) were analyzed based on the number of premature deaths and BC DRF in SEA.
2.3.1 Premature death
The number of avoidable premature deaths resulting from the emission reduction measures was quantified based on the changes in the ambient PM2.5 levels and was calculated using Eq. (1) (Wang and Mauzeral, 2006; Saikawa et al., 2009):
where Δcases is the change in number of cases of mortality per year due to change in the annual ambient PM2.5 concentration; Iref is the baseline mortality rate (%); POP is the number of exposed population (person); CR is the concentration response coefficient for mortality rate (unit is % change in mortality and morbidity as a result of a 1 µg m−3 change in annual average PM2.5 concentration); and ΔC is the change in annual ambient PM2.5 concentration under a given different emission scenario.
We considered only the premature deaths because of the less comprehensive information available on the association between the morbidity and air pollution exposure as compared to that of the mortality (Saikawa et al., 2009). The PM2.5 annual concentration was used rather than BC alone following the recommendations of the WHO Task Force (WHO, 2012) that PM2.5 should continue to be used as the primary metric in quantifying the human exposure to PM and resulting health effects. Concentration response (CR) data were obtained from Smith et al. (2009) who indicated that every increase in PM2.5 by 1 µg m−3 is approximately associated with a 1.006 % increase in the risk of all-cause adult mortality for individuals of 20 years and older. The Iref data representing the adult mortality rate for all causes and both sexes (per 1000 people) for every nation included in the study domain were obtained from the United Nations database (http://data.un.org/Data.aspx?d=WHO&f=MEASURE_CODE:WHOSIS_000004) for the base year of 2007. The 0.5∘ resolution gridded population (POP) data were obtained from the Potsdam Institute for Climate Impact Research (PICIR) (http://clima-dods.ictp.it/Users/fcolon_g/ISI-MIP/UNWPP/) for both 2007 and 2030, and the data were further gridded to a finer resolution of 0.25∘ of the modeling domain. The proportions of adult population (age ≥ 20 years) for the countries were taken from the World Bank database (http://data.worldbank.org/indicator/SP.POP.0014.TO.ZS). This study assumed that the baseline mortality and age structure were distributed following the population density and were not changed between 2007 and 2030.
2.3.2 Black carbon aerosol optical depth (AOD)
The BC AOD values were calculated using the extended aerosol optical depth module (AODEM) with the 3-D aerosol concentration field generated by WRF–CHIMERE for BAU2030 and RED2030. The application detail of AODEM software and parameterization has been presented in our companion paper (Permadi et al., 2018).
Table 1Emissions of BY2007, BAU2030 and RED2030 for Indonesia, Thailand and other countries in the modeling domain.
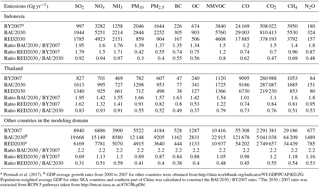
a Permadi et al. (2017). b GDP average
growth rates from 2000 to 2007 for other countries were obtained from
http://data.worldbank.org/indicator/NY.GDP.PCAP.KD.ZG.
Population-weighted average GDP for other SEA countries and southern part of
China was calculated to construct the BAU2030 ∕ BY2007 ratio.
cThe 2030 ∕ 2007 ratio was
extracted from RCP8.5 pathways
taken from http://tntcat.iiasa.ac.at:8787/RcpDb/.
2.3.3 BC DRF
To estimate the change in radiative forcing (ΔF), Eq. (2) was used following the approach presented in Chýlek and Wong (1995) and Kim et al. (2012).
where F0 is the solar irradiance constant (1370 W m−2) and T is the atmospheric transmission coefficient (0.79). The values of Ac (the total cloud fraction) and R (surface albedo) were taken from the WRF simulation results. The expression of (1−Ac) represents the clear-sky conditions; i.e., we consider only clear-sky BC DRF. The expression of (1−R)2 in the equation accounts for the multiple reflection of the aerosol layer. The surface τab is the absorption (BC AOD) and τsc is the scattering optical depths calculated by AODEM based on the BC burden; β is the back-scattering fraction, which was assumed to be 0.17 based on the measurements of Schnaiter et al. (2003). Note that, in the current vertical model setup, the top of the model domain was 500 hPa and thus the simulation results may not be able to capture the long-range transport (LRT) that took place above the domain top in the free-tropospheric layer and may subsequently underestimate BC AOD and BC DRF. However, above the domain top (> 5 km) the biomass open burning emissions of importance in the region may not have significant effects on the aerosol extinction coefficient, as shown by the Cloud-Aerosol Lidar with Orthogonal Polarization (CALIOP) observations (Campbell et al., 2013). Therefore, the uncertainty caused by the vertical model setup on the simulation results may not be significant considering the biomass open burning emissions in particular.
3.1 Emission scenarios
A summary of the annual emissions of key species in the base year of 2007 and in 2030 under two emission scenarios (BAU2030 and RED2030) from the modeling domain is given in Table 1. The annual emission changes under the scenarios are indicated by the respective ratios for each species. This section discussed in depth the emissions for two countries, Indonesia and Thailand, for which the specific activity data trends were considered for the emission scenarios development. Table S2 showed the increases in all activity data of the key anthropogenic sources in the countries except for forest fire emissions, which were actually expected to reduce due to a lower GDP from the forestry sector and less forest biomass/area available in the future. The most significant increase was for the number of registered vehicles in Indonesia, which in 2030 would be 3.1 times above that in 2007. In Thailand, the petroleum refinery product was also projected to increase by 3.3 times from the 2007 level and the number of vehicles by 2.2 times. The sectoral emissions of key species from these two countries under different scenarios are provided in Fig. S2.
For Indonesia, under BAU2030, the emissions of every species would increase with a ratio of 1.2–1.95 between BAU2030 and BY2007 (Table 1). The highest increase (1.95 times) would be expected for SO2 and this mainly reflects the increase in coal usage for the power generation and industry. Note that the use of the same SO2 EFs for BY2007 and BAU2030 emission calculation, as well as the assumption of no further emission control devices applied in the power and industry, may be the cause of this high increase rate for SO2. This may not represent the actual trend because the regulation on emission control will be more stringent in the future and thus less SO2 increase should be expected. The NOx emissions increase by 1.6 times was mainly due to the increasing trends of the oil and gas industry as well as traffic activities. Because of the dominant contributions from the residential combustion to their emissions, the population growth in the country during the period of 2007–2030 would increase emissions of CO, NMVOC and PM (PM10, PM2.5, BC, OC) by 1.2, 1.5 and 1.35–1.39 times, respectively. NH3 emissions were projected to increase by 1.6 times due to the livestock growth in the country. Among GHGs, CO2 would increase by 1.5 times while CH4 would increase by 1.4 times from the base year emissions.
For Thailand, the BAU2030 ∕ BY2007 ratios showing the increases of all species in Table 1 were highest for SO2 (1.95 times) and lowest for CO (1.01 times). The increases in SO2 and NOx emissions reflected the increasing rates of the coal consumption in particular and that is related to the ratio of projected energy consumption 2030 ∕ 2007 of 2.1 for industry (EPPO, 2008), as seen in Table S2. The intensification of agricultural production would increase the crop residue open burning that caused the increased emissions of PM species of PM10, PM2.5, BC and OC by 1.42–1.66, varying with species. Forest fire emissions were projected to reduce with estimated 2030 ∕ 2007 ratios of 0.7 (Indonesia) and 0.9 (Thailand), which were based on the trend of GDP in forestry (Indonesia) and the trend of forest area (Thailand). The emission increases for NH3 (1.55) and NMVOC (1.54) were mainly due to the livestock and industrial growth rates, respectively. GHGs emissions were also projected to increase by 1.10 (CO2), 1.61 (CH4) and 1.81 (N2O). The substantial increases of activity data levels under BAU2030 for both countries have brought about the increase in emissions for all species in both countries from the BY2007 levels.
The emission projection under BAU2030 for other countries in the modeling domain was made based on the GDP growth rate that was, for example, as high as 10.5–11.5 % for Cambodia, China and Myanmar (World Bank, 2012) over the period of 2000–2007. The BAU2030 emissions from other countries (than Indonesia and Thailand) in the modeling domain were assumed to grow following their population-weighted average GDP growth rates, averaged at 2.2 times. As compared to BY2007, the regional BC and CO2 emissions under BAU2030 in 2030 increased by about 1.89 and 1.41 times, respectively, and were well above the increase rate specified by the Intergovernmental Panel on Climate Change (IPCC) RCP6.0 for BC and CO2 of 1.03 and 1.23 times for SEA.
For Indonesia, the measures to be implemented in the RED2030 scenario would result in lower emissions as compared to BAU2030, with the ratios RED2030 ∕ BAU2030 being 0.3–0.92. The most significant emission reductions would be realized for aerosol species (PM10, PM2.5, BC and OC) with the RED2030 ∕ BAU2030 of 0.30–0.56 followed by CO (0.62) as seen in Fig. S2. The significant reductions for these species were expected because the included measures (Table S1) in all sectors aimed at reducing PM (BC) emissions which also would reduce CO, an accompanying gas emitted from these combustion sources. Among GHGs, the highest reduction was for CO2 with RED2030 ∕ BAU2030 ratio of 0.7 while lower reductions were shown for CH4 (0.96) and N2O (0.87). As compared to the base year, RED2030 would also feature more emission reductions for major aerosol species with the corresponding ratios of RED2030 ∕ BY2007 of 0.4–0.75 for PM species and 0.74 for CO. The RED2030 emissions were lower than the base year of 2007 for most species except for SO2, NH3, NMVOC and NOx, which were increased by 1.2–1.8 times.
For Thailand, RED2030 also featured the lower emissions than BAU2030, as expected. The reductions were about in the same ranges as for Indonesia. The emission ratios of RED2030 ∕ BAU2030 for different species were 0.37–0.93. More significant reductions were obtained for PM species, i.e., ratios of 0.37–0.55, followed by CO, a ratio of 0.73. Among the GHGs, the highest reduction would be for CH4 with the ratio of 0.81 followed by CO2 (0.84) and N2O (0.95). Similarly to the case of Indonesia, the emissions under RED2030 as compared to BY2007 were lower for PM species and CO, but higher for other species with the RED2030 ∕ BY2007 ratios of 1.2–1.6 (Table 1).
Sector-wise emissions in both countries showed that under RED2030 there would be a substantial reduction, as compared to BAU2030, resulting from the mitigation measures (Table S1) in the two countries for all sectors. The emission ratios of RED2030 ∕ BAU2030 for biomass open burning were 0.09–0.6, while for the residential sector the corresponding ratios were 0.14–0.99 for different species (Fig. S2). We observed some increasing trends of SO2 emissions from the residential sector when LPG was used to replace wood as cooking fuel because of its higher sulfur content. As for BC species, the emission ratios of RED2030 ∕ BAU2030 for biomass open burning and residential sector in Indonesia were 0.48 and 0.49, respectively, and in Thailand were 0.37 and 0.41, respectively. For the industry and transport sectors, the corresponding emission ratios for BC were 0.87 (Indonesia) and 0.6 (Thailand). Under BAU2030, the emissions of BC was rising steadily with a high rate from the BY2007 (Fig. S2).
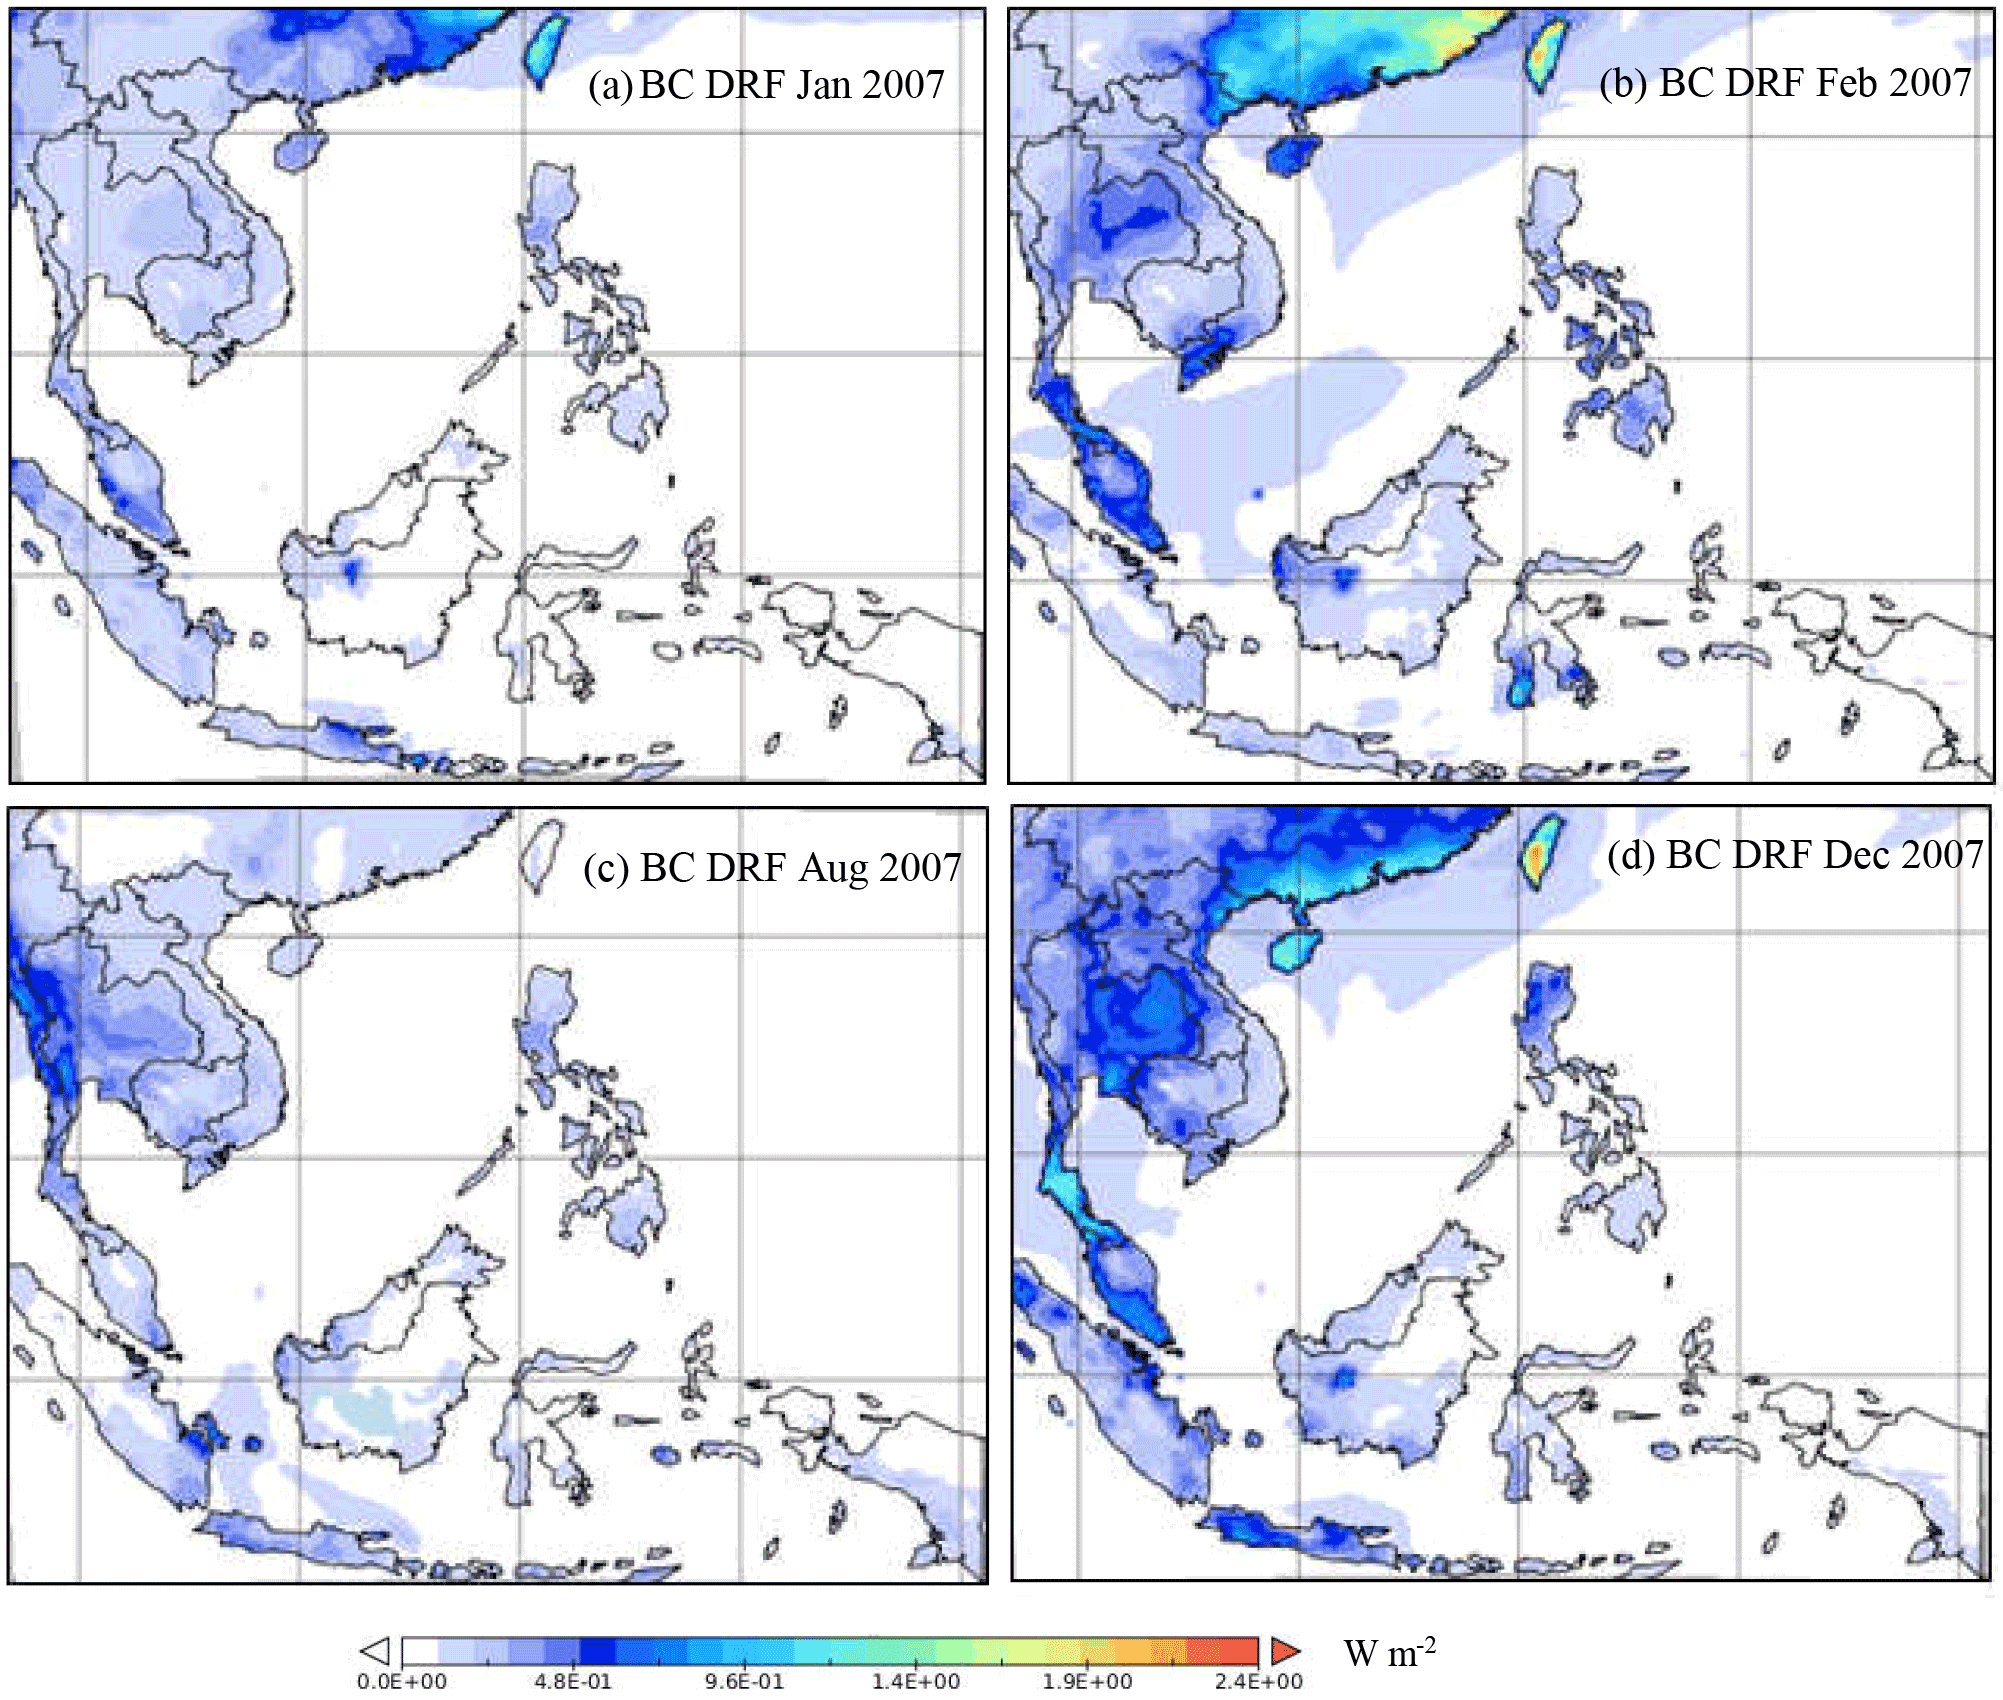
Figure 1Spatial distribution of monthly average BC direct radiative forcing for the selected months, BY2007.
For other countries in the modeling domain, the IPCC RCP8.5 was used to project the emissions under RED2030 and this was done using the regional (Asia) emission ratios between 2030 and 2007 emissions (using the IPCC emission database) for every species. As discussed above, the RED2030 featured the emission reductions from BY2007 for several species presented in Table 1, i.e., with the RED2030 ∕ BY2007 ratios of 0.84–0.88 for PM species, 0.69 for SO2 and 0.98 for CO. The emissions of NOx, NH3 and NMVOC in these countries did, however, increase by 1.05–1.3 times (Table 1).
Due to the insufficient information on air quality and climate policies of other countries in the modeling domain, this study focused primarily on the emission reduction measures for the countries of Indonesia and Thailand. Nevertheless, as highlighted in our accompanying paper (Permadi et al., 2018), collectively these two countries had the largest contributions in the domain, i.e., sharing 25–66 % of the total emissions from the SEA domain and 17–44 % of the total modeling domain (SEA plus southern part of China) for most of the species in 2007. This justified the importance of the emission reduction measures of these two countries for the SEA region. Note that the reductions of NH3, CH4 and N2O were relatively small in both countries because the major sources of these species were not addressed in the four source sectors considered for mitigation in this study. In contrast, the reductions PM species and CO were relatively more significant for both countries because the mitigation measures addressed the key sources of the species. It is interesting to note that our results for the national BC emission ratios between RED2030 and BY2007 for Indonesia (0.74) and Thailand (0.81) were close to the ratios between 2030 and 2007 BC emissions under the IPCC RCP2.6 scenario for the two countries of 0.82 and 0.81, respectively. For CO2, our emission ratios were 0.7 and 0.84, which were lower than the ratios estimated based on the IPCC RCP2.6 of 0.92 and 0.86, respectively. It therefore shows that the RED2030 does align with the IPCC RCP2.6 for the countries and therefore suggests that the current master plans in the two countries could lead to achieving the 2.0∘ target.
Table 2Summary of emission reduction scenarios for the SEA domain.
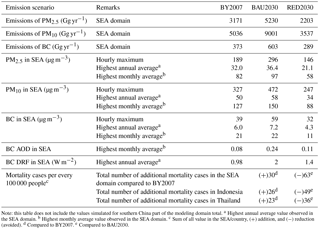
Note: this table does not include the values simulated for southern China part of the modeling domain total. a Highest annual average value observed in the SEA domain. b Highest monthly average value observed in the SEA domain. c Sum of all value in the SEA/country, (+) addition, and (−) reduction (avoided). d Compared to BY2007. e Compared to BAU2030.
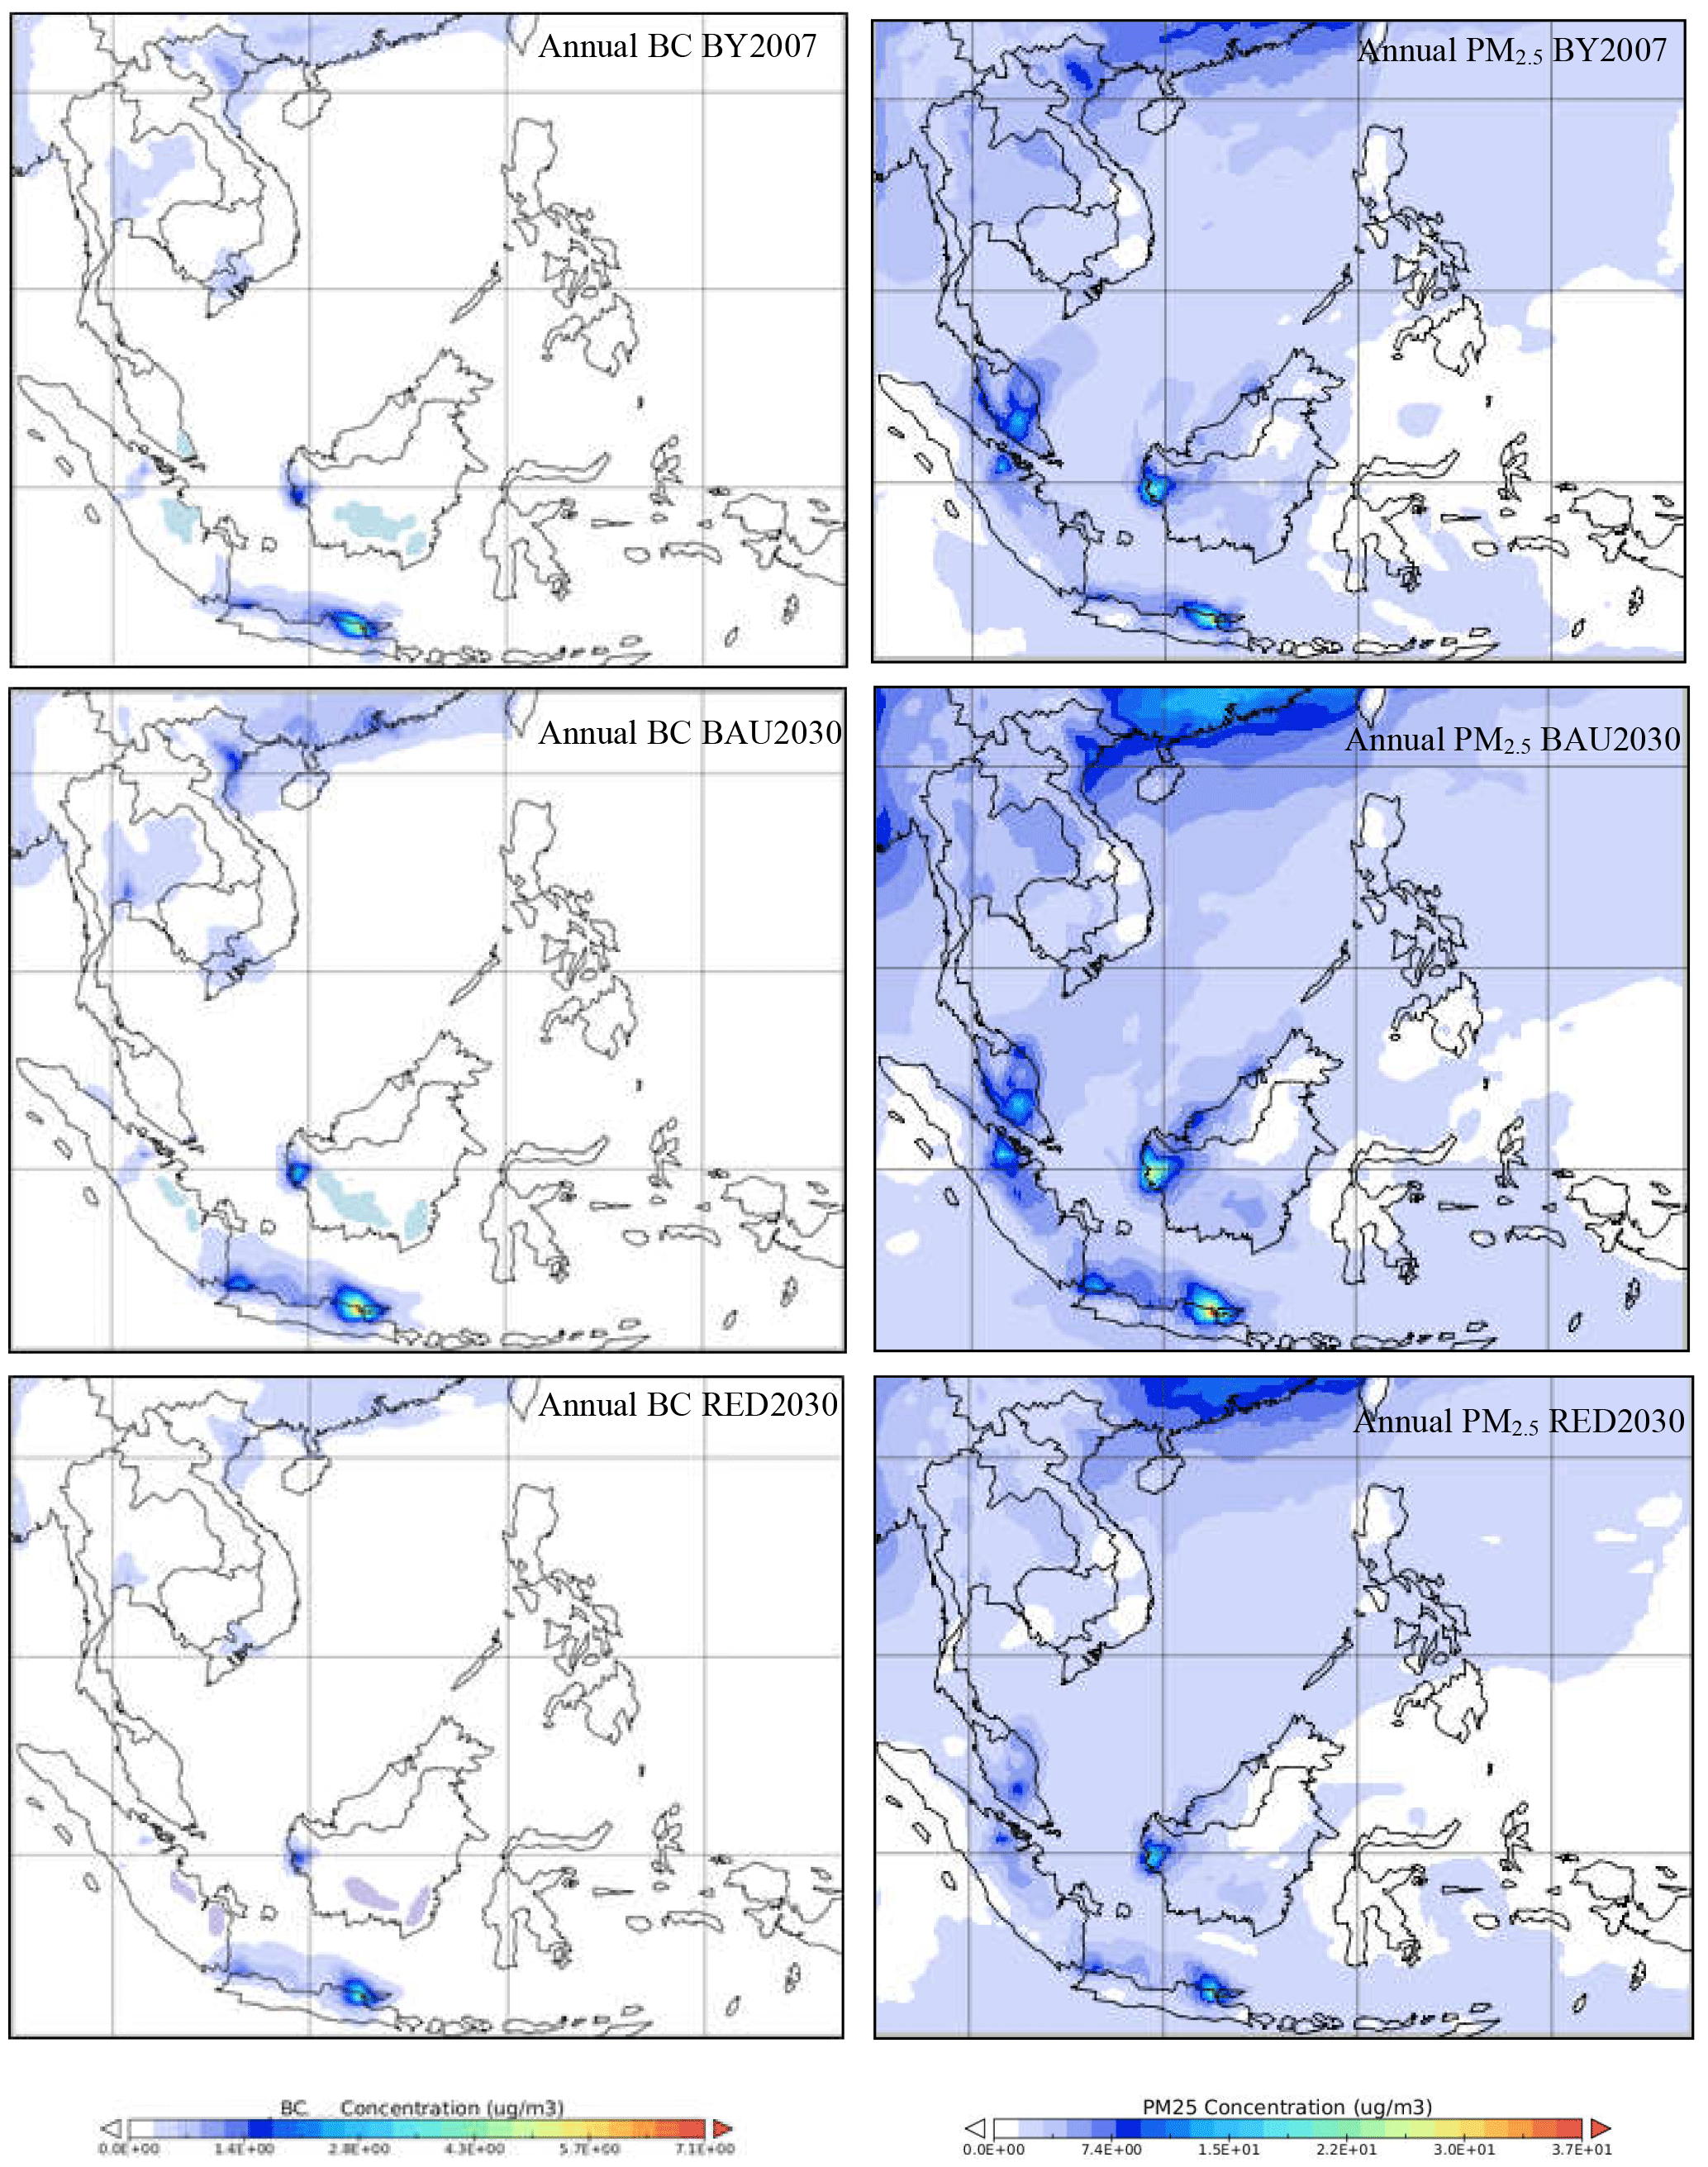
Figure 2Simulated annual average concentrations of BC and PM2.5 for BY2007, BAU2030 and RED2030 in µg m−3.
3.2 Impact assessment of emission reduction measures in 2030
Our impact assessment of emission reduction measures in 2030 covered the health impact in terms of the number of avoided premature deaths associated with reduced PM2.5 pollution and the reduction in BC DRF. The results of RED2030 were compared to those of BAU2030 to quantify the impacts of the emission reduction measures.
3.2.1 Air quality and premature deaths
PM and BC
A summary of the maximum PM2.5, PM10 and BC along with BC DRF and premature deaths under the scenarios is given in Table 2 for the SEA domain only, i.e., excluding the southern China part of the modeling domain. Annual average concentrations of BC and PM2.5 for BY2007 and two different scenarios of BAU2030 and RED2030 are presented in Fig. 2, which shows similar patterns of BC and PM2.5 for all scenarios but their maximum values were much higher under BAU2030 than other scenarios. Over SEA, maximum BC and PM2.5 were shown over the eastern part of Java (Indonesia) in all scenarios. The maximum BC values simulated for BAU2030 of 7.2 µg m−3 appeared over the eastern part of Java, which featured an increase by 1.2 µg m−3 from the BY2007. Under RED2030, the maximum BC in the SEA domain was 4.3 µg m−3, which is 2.9 µg m−3 lower than that under BAU2030.
For PM2.5, under BAU2030 there was an increase of the maximum level over the SEA domain, from 32 µg m−3 in BY2007 to 36 µg m−3. The emission reduction measures under RED2030 would reduce the SEA domain maximum PM2.5 to 21 µg m−3 (Table 2). The simulated maximum hourly concentrations of PM2.5, PM10 and BC under BY2007 were 189, 327 and 39 µg m−3, respectively, which increased to 296, 472 and 59 µg m−3, respectively, under the BAU2030. Measures implemented under RED2030 would reduce the hourly maximum concentrations of PM2.5, PM10 and BC to 146, 247 and 32 µg m−3 (Table 2). The hourly maximum concentrations of PM2.5 and PM10 occurred on the island of Borneo during the intensive period of biomass open burning, while that of BC occurred over the eastern part of Java. A sharp increase in the maximum hourly concentrations under BAU2030 (e.g., 1 h PM10 reached 472 µg m−3) also occurred in Borneo, where the emissions from crop residue open burning were assumed to be intensified.
The changes in the total BC and PM2.5 emissions in the domain were consistent with the emission changes under different scenarios. As discussed above, BAU2030 featured a total emission increase in the PM2.5 emissions (primary particles) in the SEA domain by 1.6 times as compared to BY2007 and in the BC emissions. In 2030, RED2030 would reduce the emissions of PM2.5 (primary) by 2.4 times and BC emissions by 2.1 times as compared to BAU2030. The ambient PM2.5 should also be composed of secondary particles and hence would be also affected by the changes in the precursors' emissions. The magnitude of changes in PM2.5 and BC emissions was not similar to the changes in their simulated ambient concentrations, suggesting influences of atmospheric processes of dispersion, removal, wet scavenging and the boundary conditions used for 2007 and 2030. Overall, the emission reduction measures implemented in four anthropogenic source sectors under RED2030 could maintain the PM2.5 and BC levels in 2030 quite close to or even lower than those in 2007 while under BAU2030 their levels would substantially increase.
Number of premature death
The impacts of the two emission scenarios on the number of premature deaths in 2030, i.e., BAU2030 vs. BY2007 and RED2030 vs. BAU2030, were quantified based on the ambient PM2.5 and the results (the difference) are presented in Fig. 3. The increase in annual PM2.5 levels under BAU2030 compared to BY2007 would bring the total number of additional premature deaths in SEA countries to around 201 000 (average of 30 per 100 000 people). In Indonesia, the total number of premature deaths under BAU2030 would be 52 628 cases (26 per 100 000 people) while in Thailand it would be 13 420 cases (23 per 100 000 people). Spatially, the maximum value of 7 cases per 100 000 people per grid was seen in the populated areas over the eastern part of Java, Indonesia.

Figure 3The difference in the number of mortality cases (cases per 100 000 people) between BAU2030 and BY2007 (BAU2030 − BY2007) and between BAU2030 and RED2030 (BAU2030 − By2007).
RED2030 would avoid a total number of premature deaths in SEA countries of 401 000 (63 per 100 000 people) from that estimated for BAU2030. In Indonesia, the number of avoided premature deaths would be 103 448 (49 per 100 000 people) while in Thailand it would be around 21 235 (36 per 100 000 people). More than 50 % the total number of avoided premature deaths in the SEA countries would be in Indonesia and Thailand, where the mitigation measures were considered. The values estimated in this study were lower than those by Shindell et al. (2012) for both Indonesia (74 per 100 000 people) and Thailand (68 per 100 000 people) (data extracted from http://www.giss.nasa.gov/staff/dshindell/Sci2012/FS5/). This is because our study considered a smaller set of emission reduction measures as compared to Shindell et al. (2012), who considered seven BC reduction measures and seven methane reduction measures in different sectors. In addition, the health effects in this study were quantified only for PM2.5 while Shindell et al. (2012) included effects of ground-level ozone as well as other co-emitting species of BC.
The uncertainty of modeled PM2.5 and BC was caused by several factors such as missing sources and other uncertainty in the emission inventory data, incorporation of LRT, grid average to point-based observation and so on. In addition, the limited observation data available have prevented a more comprehensive model performance evaluation. These would be translated into the uncertainty of the health and BC DRF effect results. Even though we used the change in the annual ambient PM2.5 concentration (ΔC) in the calculation of the health risk, the resulting impact of the intervention (emission reduction) may still contain a high uncertainty. Further, the regional and/or country-specific CR data for PM2.5 should be developed to improve the impact assessment of emission reduction scenarios on the premature mortality.
3.2.2 BC DRF
Black carbon DRF in SEA is of interest to understand the impacts of BC emissions on climate warming. Therefore, BC AOD (τab) was calculated as the difference between the total AOD (scattering + absorbing) and scattering AOD, i.e., following the same method presented in the literature (Landi and Curci, 2011). In our accompanying paper (Permadi et al., 2018), the results of BC AOD (using Eq. 2) for the BY2007 were used for the model evaluation without evaluation of BC. The monthly averages of BC DRF for the base year 2007 are presented in Fig. 1 for selected months of August (wet season in the northern part of the modeling domain but dry season in the southern part of the domain) and January, February and December (dry season in the northern but wet season in the southern part of the modeling domain). Note that the BC DRF values represent the forcing at the top of the model layer and not that at Earth's surface. In most of the cases, higher BC DRF was seen in the southern part of China, but in the following discussion we only focused on the results for the SEA countries, i.e., the SEA domain.
December had a vast area of high BC DRF in the SEA domain with the maximum monthly average value of 1.4 W m−2 (seen over peninsular Malaysia and western part of Java, Indonesia). The second highest monthly BC DRF was shown in February with a relative wide area of high values over the western part of peninsular Malaysia and western part of Kalimantan, Indonesia. In August, the BC DRF values were lower over the SEA domain with the maximum monthly average seen over the border between Thailand and Myanmar and in the province of Riau of Sumatra, Indonesia. January had the lowest BC DRF in all the presented months with the monthly maximum in the SEA domain of 0.9 W m−2, seen over the western part of peninsular Malaysia and eastern part of Java, Indonesia. The influence of the emissions from the up-wind part of the SEA domain was more pronounced in the months when the northeast monsoon was predominant (January, February and December). In these months, the highest monthly values were simulated outside the SEA domain, i.e., above the southern part of China and Taipei (maximum of 1.4–1.9 W m−2).
The monthly distributions of BC DRF were consistent to the simulated monthly BC AOD. In this study we assumed the internally mixed state for BC when calculating AOD by AODEM and this may overestimate the light absorption of BC (Jacobson, 2001). Our estimated BC DRF values are comparable to a previous study by Kim et al. (2012) who estimated the monthly BC DRF values for the Korean Peninsula of 1.2–1.5 W m−2, but our results were higher than the global average BC DRF suggested by Jacobson (2000) of 0.55 W m−2.
Note that there are several factors contributing to the uncertainty in estimating the BC DRF, such as underestimation of the LRT contribution due to the current model vertical setup, missing sources and other uncertainty in the emission inventory data. Further, BC DRF was calculated for clear-sky conditions, and therefore the effect of BC on the cloud microphysics (Chýlek et al., 1996) was not incorporated.
The spatial distributions of the simulated annual average BC DRF of BY2007, BAU2030 and RED2030 scenarios are presented in Fig. 4. In this section, we discussed only the values estimated for the SEA countries, i.e., excluding the high values occurred in the southern part of China. The maximum simulated BC DRF for the SEA countries under BAU2030 (2.0 W m−2) appeared over Riau province, Sumatra, Indonesia, and this is about 1 W m−2 higher than that in BY2007 (0.98 W m−2). Under RED2030, the highest BC DRF would be 1.4 W m−2 (appeared over Riau province, Indonesia), i.e., about 0.6 W m−2 lower than that of BAU2030. In Thailand, the maximum BC DRF in 2007 was 0.40 W m−2, appearing in Chonburi, which it increased by two times under BAU2030. Under RED2030, the maximum BC DRF in Thailand would be 0.48 W m−2, appearing at the same place, i.e., only a slight increase as compared to BY2007.
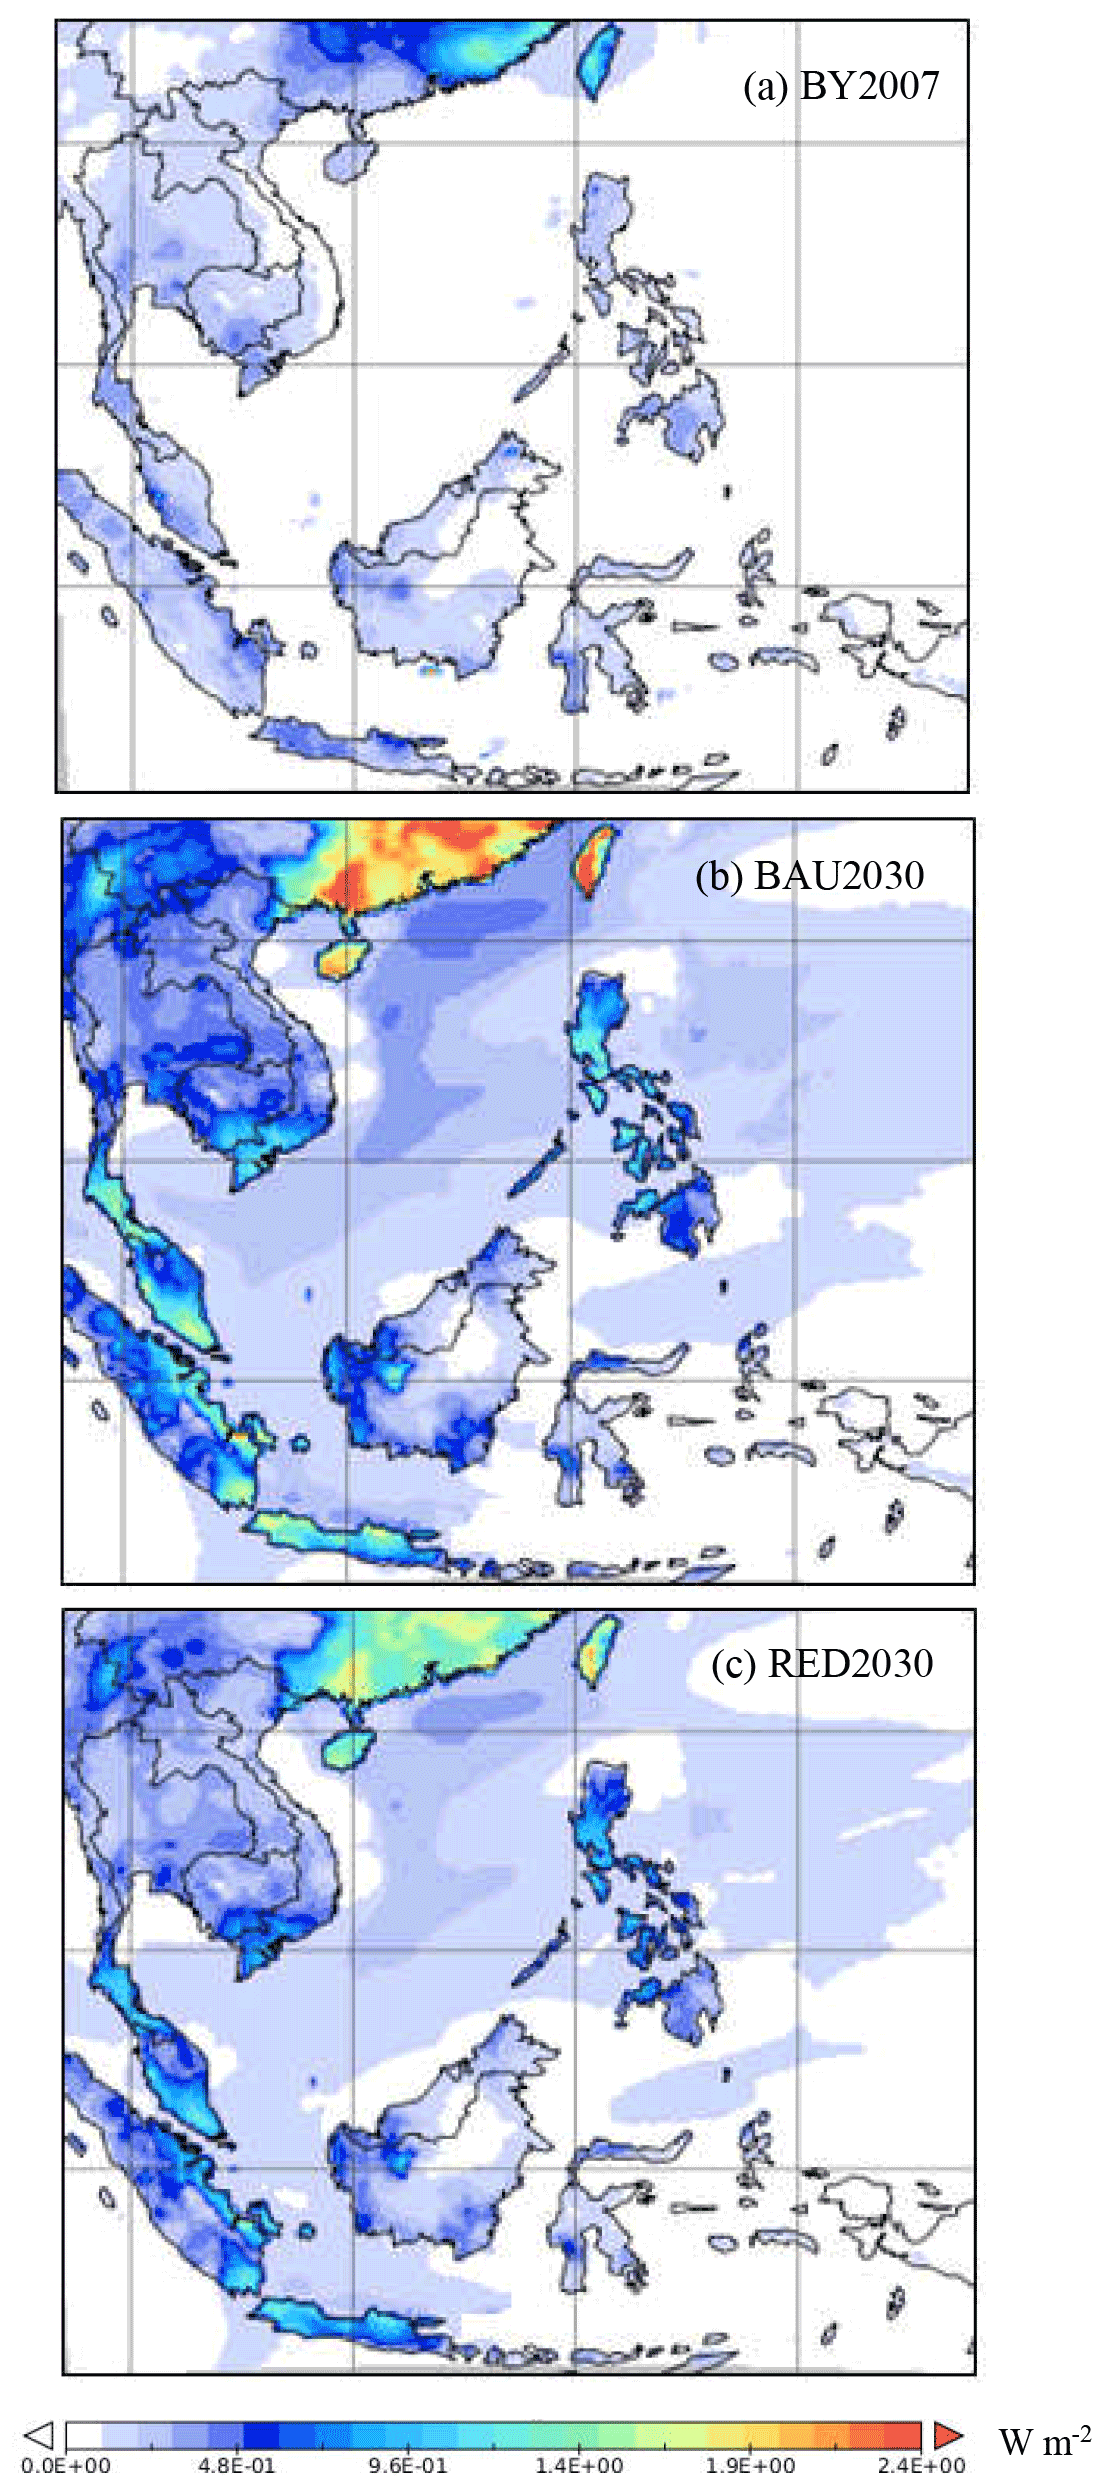
Figure 4Spatial distribution of annual average BC DRF under BY2007, BAU2030 and RED2030 scenarios.
Apart from Indonesia and Thailand, for which the mitigation measures were simulated, other countries in the modeling domain following the RCP8.5 emission pathway also gained benefits because the pollutants (i.e., SLCPs) were also mitigated in this IPCC scenario (Riahi et al., 2001) but not the major GHGs (Table 1). Other parts of the modeling domain, i.e., the southern part of China and other SEA countries, also gained quite similar ranges of the BC DRF reduction and the health benefits as Indonesia and Thailand under RED2030. It is worth mentioning, as seen in Table 1, that the BC emissions in the SEA domain were lower in RED2030 as compared to BY2007 but the AOD and BC DRF were higher than the respective BY2007 levels and these could be related to the emissions in other part of the domain and outside the modeling domain.
Our study thus demonstrated that the measures implemented to reduce BC (and PM) under RED2030 may bring in substantial benefits in avoiding the premature mortality and reduction in the BC DRF. Future studies should focus on the improvement of emission inventory data, modeling setup and the inclusion of the cloud microphysics in the radiative forcing calculation. The climate feedback should be expressed as the temperature changes in future studies. The impacts on crop production and materials should also be considered and the monetary values of the benefits should be presented to better inform policy makers and to promote mitigation measures for the SLCPs.
This study is a continuation of our previous paper (Permadi et al., 2018, focusing on the model performance evaluation for the BY2007) and presents the development of two emission scenarios for SEA in 2030 (BAU2030 and RED2030) to assess the associated impacts on the premature mortality and BC DRF in the region. BAU2030 assumed a linear increase of activity levels of the key anthropogenic sectors in Thailand and Indonesia and featured a BC emission increase by 1.6 times in Thailand and 1.3 times in Indonesia as compared to BY2007. For other countries in the domain the projection was done using the average GDP growth rate, and the emission growth rate was 2.2 times BY2007 for all species. RED2030 considered the emission reduction measures in four major anthropogenic sources for Indonesia and Thailand (road transport, residential combustion, industry, open burning), the two largest contributors to the SEA emissions, and featured a cut in BC emissions by 45 % in Indonesia and 51 % in Thailand as compared to BAU2030. The emission reductions for Thailand and Indonesia under RED2030, calculated based on their national master plans, were quite close to those specified for these countries under IPCC RCP2.6; thus, by implementing the current policies, the countries can contribute to the 2.0∘ target achievement.
With other countries in the modeling domain following the IPCC RCP8.5 pathway, the collective BC emissions from the domain under RED2030 would reduce by 16 % from the BY2007 amount. For the SEA domain, the BAU2030 featured a total emission increase in the BC and PM2.5 emissions by 1.6 times each as compared to BY2007. Under RED2030, the emissions of PM2.5 would reduce by 2.4 times and BC emissions would reduce by 2.1 times from the respective BAU2030 levels.
WRF–CHIMERE–AODEM modeling system simulation results provided the PM ambient concentrations (i.e., PM2.5, PM10, BC), AOD and BC DRF under different scenarios, which showed the substantial benefits of the emission reduction under RED2030 in improving regional air quality and BC DRF reduction. Under BAU2030, assuming “no intervention”, the increase in annual PM2.5 levels would induce an additional number of premature deaths of 30∕100 000 people above the BY2007 in the SEA domain. The reduction measures implemented under RED2030 would help to cut down (avoid) the total number of the premature deaths by 63 per every 100 000 people as compared to BAU2030. For the two countries where specific measures were to be implemented, RED2030 would help to avoid 49 premature deaths in Indonesia and 36 in Thailand per 100 000 people. RED2030 would also slow down the increase in the BC DRF over the SEA domain, i.e., lowering the maximum annual average BC DRF from 2.0 W m−2 under BAU2030 to 1.4 W m−2 under RED2030.
Future studies should assess the potential impacts of the emission reduction on agricultural crops (mainly via ozone formation) and this is important because agriculture is the major economic sector in SEA. Other pollutants (beside PM and BC) should be included in the assessment of health impacts. Likewise, for the long-term climate effects, the induced emission reduction of major GHGs by the measures should also be included. Multiyear simulations using an on-line coupled climate–chemistry modeling system should be conducted to provide a more realistic impact, resulting from emission reduction scenarios on air quality and climate in SEA.
All involved data including emissions and model results are available upon request to the corresponding author.
The supplement related to this article is available online at: https://doi.org/10.5194/acp-18-3321-2018-supplement.
The authors declare that they have no conflict of interest.
We acknowledged Didier Hauglustaine for sharing the simulation results
of the LMDZ-INCA used for the boundary conditions in this work. This
research was financially supported by the French government under the Asian
Institute of Technology (AIT)/Sustainable Development in the Context of
Climate Change (SDCC) – France Network cooperation and by the United States
Agency for International Development (USAID) under the PEER-SEA
(Partnerships for Enhanced Engagement in Research for Southeast Asia)
research project.
Edited by: Toshihiko Takemura
Reviewed by: two anonymous referees
Akimoto, H., Kurokawa, J., Sudo, K., Nagashima, T., Takemura, T., Klimont, Z., Amann, M., and Suzuki, K.: SLCP co-control approach in East Asia: Tropospheric ozone reduction strategy by simultaneous reduction of NOx/NMVOC and methane, Atmos. Environ., 122, 588–595, 2015.
Aunan, K., Fang, J., Hu, T., and Vennemo, H.: Climate Change and Air Quality – Measures with Co-Benefits in China, Environ. Sci. Technol., 40, 4822–4829, 2006.
Bessagnet, B., Hodzic, A., Vautard, R., Beekmann, M., Cheinet, S., Honoré, C., Liousse, C., and Rouil, L.: Aerosol modeling with CHIMERE – Preliminary evaluation at the continental scale, Atmos. Environ., 38, 2803–2817. 2004.
Bond, T. C., Doherty, S. J., Fahey, D. W., Forster, P. M., Berntsen, T., DeAngelo, B. J., Flanner, F. G., Ghan, S., Kärcher, B., Koch, D., Kinne, S., Kondo, Y., Quinn, P. K., Sarofim, M., Schultz, M. G., Schulz, M., Venkataraman, M., Zhang, H., Zhang, S., Bellouin, N., Guttikunda, S. K., Hopke, P. K., Jacobson, M. Z., Kaiser, J. W., Klimont, Z, Lohmann, U., Schwarz, J. P., Shindell, D., Storelvmo, T., Warren, S. G., and Zender, C. S.: Bounding the role of black carbon in the climate system: A scientific assessment, J. Geophys. Res.-Atmos., 118, 5380–5552, https://doi.org/10.1002/jgrd.50171, 2013.
Campbell, J. R., Reid, J. S., Westphal, D. L., Zhang, J., Tackett, J. L., Chew, B. N., Welton, E. J., Shimizu, A., Sugimoto, N., Aoki, K., and Winker, D. M.: Characterizing the vertical profile of aerosol particle extinction and linear depolarization over Southeast Asia and the Maritime Continent: the 2007-2009 view from CALIOP, Atmos. Res., 122, 520–543, https://doi.org/10.1016/j.atmosres.2012.05.007, 2013.
Chotichanathawewong, Q. and Thongplew, N.: Development Trajectory, Emission Profile, and Policy Actions: Thailand, ADBI Working Paper Series, Asian Development Bank Institute, Tokyo, Japan, 2012.
Chýlek, P. and Wong, J.: Effect of absorbing aerosols on global radiation budget, Geophys. Res. Lett., 22, 929–931, 1995.
Chýlek, P., Lesins, G., Videen, G., Wong, J., Pinnick, R., Ngo, D., and Klett, J.: Black carbon and absorption of solar radiation by clouds. J. Geophys. Res., 101, 365–371, 1996.
EC-JRC/PBL: European Commission, Joint Research Centre/Netherlands Environmental Assessment Agency. Emission Database for Global Atmospheric Research (EDGAR), release version 4.1, available at: http://edgar.jrc.ec.europa.eu (last access: 30 October 2017), 2010.
Energy Policy and Planning Office (EPPO): Energy statistics of Thailand, Bangkok, Thailand, available at: http://www2.eppo.go.th/info/YearBook/index.html (last access: 30 October 2017), 2008.
Hauglustaine, D. A., Balkanski, Y., and Schulz, M.: A global model simulation of present and future nitrate aerosols and their direct radiative forcing of climate, Atmos. Chem. Phys., 14, 11031–11063, https://doi.org/10.5194/acp-14-11031-2014, 2014.
Heil, A. and Goldammer, J. G.: Smoke-haze pollution: A review of the 1997 episode in Southeast Asia, Reg. Environ. Change, 2, 24–37, 2001.
Hopke, P. K., Cohen, D. D., Begum, B. A., Biswas, S. K., Ni, B., Pandit, G. G., Santoso, M., Chung, Y. S., Davy, P., Markwitz, A., Waheed, S., Siddique, N., Santos, F. L., Pabroa, P. C. B., Seneviratne, M. C. S., Wimolwattanapun, W., Bunprapob, S., Vuong, T. B., and Markowicz, A.: Urban air quality in the Asian region, Sci. Total Environ., 404, 103–112, 2008.
Hourdin, F., Musat, I., Bony, S., Braconnot, P., Codron, F., Dufresne, J.-L., Fairhead, L., Filiberti, M.-A., Friedlingstein, P., Grandpeix, J.-Y., Krinner, G., Levan, P., Li, Z.-X., and Lott, F.: The LMDZ4 general circulation model: climate performance and sensitivity to parametrized physics with emphasis on tropical convection, Clim. Dynam., 27, 787–813, 2006.
ICCSR: Indonesia climate change sectoral roadmap: synthesis report, Minister of National Development Planning, Jakarta, Indonesia, 2009.
Jacobson, M. Z.: A physically-based treatment of elemental carbon optics: Implications for global direct forcing of aerosols, Geophys. Res. Lett., 27, 217–220, 2000.
Jacobson, M. Z.: Strong radiative heating due to the mixing state of black carbon in atmospheric aerosols, Nature, 409, 695–697, https://doi.org/10.1038/35055518, 2001.
Kim, Y. M., Lee, S. B., Bae, G. N., Park, S. S., Han, K. M., Park, R. S., Song, C. H., and Park, H. S.: Distribution and direct radiative forcing of BC aerosols over Korean peninsula, Atmos. Environ., 58, 45–55, 2012.
Kim Oanh, N. T., Upadhyay, N., Zhuang, Y. H, Hao, Z. P., Murthy, D. V. S, Lestari, P., Villarine, J. T., Chengchua, K., Co, H. X., Dung, N. T., and Lindgren, E. S.: Particulate air pollution in six Asian cities: Spatial and temporal distributions, and associated sources, Atmos. Environ., 40, 3367–3380, 2006.
Landi, T. C. and Curci, G.: Modeling aerosol optical properties with AODEM: accounting for non-sphericity of dust particles, Geophys Research Abstracts, 13, EGU2011-3958, available at: http://meetingorganizer.copernicus.org/EGU2011/ EGU2011-3958.pdf (last access: 30 October 2017), 2011.
Ministry of Forestry (MoF): Strategic Plan 2010–2014 of Ministry of Forestry, Government Decree of Ministry of Forestry number P.08/Menhut-II/2010, Jakarta, Indonesia, 2010.
Myhre, G., Myhre, A., and Stordal, F.: Historical evolution of radiative forcing of climate, Atmos. Environ., 35, 2361–2373, https://doi.org/10.1016/S1352-2310(00)00531-8, 2001.
Ohara, T., Akimoto, H., Kurokawa, J., Horii, N., Yamaji, K., Yan, X., and Hayasaka, T.: An Asian emission inventory of anthropogenic emission sources for the period 1980–2020, Atmos. Chem. Phys., 7, 4419–4444, https://doi.org/10.5194/acp-7-4419-2007, 2007.
PCD: National Master Plan for Open Burning Control, Thailand Pollution Control Department, Bangkok, Thailand, 2010.
Permadi, D. A., Sofyan, A., and Kim Oanh, N. T.: Assessment of emissions of greenhouse gases and air pollutants in Indonesia and impacts of national policy for elimination of kerosene use in cooking, Atmos. Environ., 154, 82–94, 2017.
Permadi, D. A., Kim Oanh, N. T., and Vautard, R.: Integrated emission inventory and modeling to assess distribution of particulate matter mass and black carbon composition in Southeast Asia, Atmos. Chem. Phys., 18, 2725–2747, https://doi.org/10.5194/acp-18-2725-2018, 2018.
Ramanathan, V. and Carmichael, G.: Global and regional climate changes due to black carbon, Nat. Geosci., 1, 221–227, https://doi.org/10.1038/ngeo156, 2008.
Riahi, K., Rao, S., Krey, V., Cho, C., Chirkov, V., Fischer, G., Kindermann, G., Nakicenovic, N., and Rafaj, P.: RCP8.5 – A scenario of comparatively high greenhouse gas emissions, Climatic Change, 109, 33–57, https://doi.org/10.1007/s10584-011-0149-y, 2001.
Saikawa, E., Naik, V., Horowitz, L. W., Liu, J., and Mauzerall, D. L.: Present and potential future contributions of sulfate, black and organic carbon aerosols from China to global air quality, premature mortality and radiative forcing, Atmos. Environ., 44, 2814–2822, 2009.
Schnaiter, M., Horvath, H., Mohler, O., Naumann, K.-H., Saatho, H., and Schock, O. W.: UV-VIS-NIR spectral optical properties of soot and soot-containing aerosols, J. Aerosol Sci., 34, 1421–1444, 2003.
Shindell, D., Kuylenstierna, J., Vignatti, E., Van Dingenen, R., Amann, M., Klimont, Z., Anenberg, S. C., Muller, N., Janssens-Maenhout, G., Raes, F., Schwartz, J., Faluvegi, G., Pozzoli, L., Kupiainen, K., Höglund-Emberson, L., Streets, D., Ramanathan, V., Hicks, K., Kim Oanh, N. T., Milly, G., Williams, M., Demkine, V., and Fowler, D.: Simultaneously mitigating near-term climate change and improving human health and food security, Science, 335, 183–189, https://doi.org/10.1126/science.1210026, 2012.
Smith, K. R., Jerrett, M., Anderson, H. R., Burnett, R. T., Stone, V., and Derwent, R.: Public health benefits of strategies to reduce greenhouse-gas emissions: health implications of short-lived greenhouse pollutants, Lancet, 374, 2091–2103, 2009.
Streets, D. G., Bond, T. C., Carmichael, G. R., Fernandes, S. D., Fu, Q., He, D., Klimont, Z., Nelson, S. M., Tsai, N. Y., Wang, M. Q, Woo, J. H., and Yarber, K. F.: An inventory of gaseous and primary aerosol emissions in Asia in the year 2000, J. Geophys. Res., 108, 8809, https://doi.org/10.1029/2002JD003093, 2003.
UNEP-WMO: Integrated assessment of black carbon and tropospheric ozone, United Nations Environment Programme and World Meteorological Organization, Nairobi, Kenya, 2011.
Vautard, R., Beekmann, M., Roux, J., and Gombert, D.: Validation of a hybrid forecasting system for the ozone concentrations over the Paris area, Atmos. Environ., 35, 2449–2461, 2001.
Wang, X. and Mauzerall, D. L.: Evaluating impacts of air pollution in China on public health: Implications for future air pollution and energy policies, Atmos. Environ., 40, 1706–1721, 2006.
WHO: Health effects of black carbon, World Health Organization Regional Office for Europe, Copenhagen, Denmark, 2012.
World Bank: The world bank data: GDP per capita, The World Bank Group, Washington, 2012, available at: https://data.worldbank.org/indicator/NY.GDP.PCAP.CD (last access: 30 October 2017), 2012.
Zhang, Q., Streets, D. G., Carmichael, G. R., He, K. B., Huo, H., Kannari, A., Klimont, Z., Park, I. S., Reddy, S., Fu, J. S., Chen, D., Duan, L., Lei, Y., Wang, L. T., and Yao, Z. L.: Asian emissions in 2006 for the NASA INTEX-B mission, Atmos. Chem. Phys., 9, 5131–5153, https://doi.org/10.5194/acp-9-5131-2009, 2009.