the Creative Commons Attribution 4.0 License.
the Creative Commons Attribution 4.0 License.
 | 28 Feb 2018
Long-term cloud condensation nuclei number concentration, particle number size distribution and chemical composition measurements at regionally representative observatories
Silvia Henning
Stefano Decesari
Bas Henzing
Helmi Keskinen
Karine Sellegri
Jurgita Ovadnevaite
Mira L. Pöhlker
Joel Brito
Aikaterini Bougiatioti
Adam Kristensson
Nikos Kalivitis
Iasonas Stavroulas
Samara Carbone
Anne Jefferson
Minsu Park
Patrick Schlag
Yoko Iwamoto
Pasi Aalto
Mikko Äijälä
Nicolas Bukowiecki
Mikael Ehn
Göran Frank
Roman Fröhlich
Arnoud Frumau
Erik Herrmann
Hartmut Herrmann
Rupert Holzinger
Gerard Kos
Markku Kulmala
Nikolaos Mihalopoulos
Athanasios Nenes
Colin O'Dowd
Tuukka Petäjä
David Picard
Christopher Pöhlker
Ulrich Pöschl
Laurent Poulain
André Stephan Henry Prévôt
Erik Swietlicki
Meinrat O. Andreae
Paulo Artaxo
Alfred Wiedensohler
John Ogren
Atsushi Matsuki
Seong Soo Yum
Frank Stratmann
Urs Baltensperger
Aerosol–cloud interactions (ACI) constitute the single largest uncertainty in anthropogenic radiative forcing. To reduce the uncertainties and gain more confidence in the simulation of ACI, models need to be evaluated against observations, in particular against measurements of cloud condensation nuclei (CCN). Here we present a data set – ready to be used for model validation – of long-term observations of CCN number concentrations, particle number size distributions and chemical composition from 12 sites on 3 continents. Studied environments include coastal background, rural background, alpine sites, remote forests and an urban surrounding. Expectedly, CCN characteristics are highly variable across site categories. However, they also vary within them, most strongly in the coastal background group, where CCN number concentrations can vary by up to a factor of 30 within one season. In terms of particle activation behaviour, most continental stations exhibit very similar activation ratios (relative to particles > 20 nm) across the range of 0.1 to 1.0 % supersaturation. At the coastal sites the transition from particles being CCN inactive to becoming CCN active occurs over a wider range of the supersaturation spectrum.
Several stations show strong seasonal cycles of CCN number concentrations and particle number size distributions, e.g. at Barrow (Arctic haze in spring), at the alpine stations (stronger influence of polluted boundary layer air masses in summer), the rain forest (wet and dry season) or Finokalia (wildfire influence in autumn). The rural background and urban sites exhibit relatively little variability throughout the year, while short-term variability can be high especially at the urban site.
The average hygroscopicity parameter, κ, calculated from the chemical composition of submicron particles was highest at the coastal site of Mace Head (0.6) and lowest at the rain forest station ATTO (0.2–0.3). We performed closure studies based on κ–Köhler theory to predict CCN number concentrations. The ratio of predicted to measured CCN concentrations is between 0.87 and 1.4 for five different types of κ. The temporal variability is also well captured, with Pearson correlation coefficients exceeding 0.87.
Information on CCN number concentrations at many locations is important to better characterise ACI and their radiative forcing. But long-term comprehensive aerosol particle characterisations are labour intensive and costly. Hence, we recommend operating “migrating-CCNCs” to conduct collocated CCN number concentration and particle number size distribution measurements at individual locations throughout one year at least to derive a seasonally resolved hygroscopicity parameter. This way, CCN number concentrations can only be calculated based on continued particle number size distribution information and greater spatial coverage of long-term measurements can be achieved.
- Article
(3635 KB) - Full-text XML
-
Supplement
(606 KB) - BibTeX
- EndNote


Cloud droplets are formed by activation of a subset of aerosol particles called cloud condensation nuclei (CCN), which affect the radiative properties of clouds through modifying the cloud droplet number concentration (CDNC), cloud droplet size, cloud lifetime and precipitation processes (e.g. Rosenfeld et al., 2014). To date, radiative forcing through aerosol–cloud interactions (ACI) constitutes the least understood anthropogenic influence on climate (IPCC, 2013): the uncertainty in aerosol-induced radiative forcing of ±0.70 W m−2 (from a mean of −0.55 W m−2) is twice the uncertainty for CO2 (±0.35, mean +1.68 W m−2). This uncertainty propagates through the calculation of climate sensitivity, a variable that expresses the global temperature increase for given emission scenarios (Andreae et al., 2005; Seinfeld et al., 2016). It remains a significant challenge to reduce these uncertainties and to thereby increase our confidence in predictions of global and regional climate change (IPCC, 2013; Lee et al., 2013; Seinfeld et al., 2016).
The number concentration of CCN is not the only factor determining the CDNC; the dynamics and structure of the cloud is profoundly important as well. Reutter et al. (2009) found that cloud droplet formation can be limited by the presence of CCN (CCN-limited regime), by the updraft velocity (updraft-limited regime) or both (transition regime). Globally, however, the CCN-limited regime prevails (Rosenfeld et al., 2014). Among the main factors driving the uncertainty in simulating CCN abundance are the aerosol particle number size distributions, size-dependent removal processes, the contribution of boundary layer new particle formation events to particle number concentration and their size, the particle number size distribution of emitted primary particles, the particle activation diameter, the formation of biogenic and anthropogenic secondary organic aerosol (SOA), and the processing of SO2 in clouds into particulate sulfate (e.g. Croft et al., 2009; Lee et al., 2013; Wilcox et al., 2015). Information on aerosol hygroscopicity is also needed to constrain uncertainty (Rosenfeld et al., 2014). These factors affect the ability of aerosol particles to form CCN on a large scale and in long-term periods as well as on the regional scale and in short-term periods.
To improve model performance, data from measurements of particle number size distribution, CCN number concentrations, aerosol particle chemical composition and hygroscopicity are needed (Carslaw et al., 2013; Ghan and Schwartz, 2007; Rosenfeld et al., 2014; Seinfeld et al., 2016). Satellite observations, covering large scales and longtime horizons, can provide proxies of these variables. However, the resolution is often too coarse to study detailed ACIs (Rosenfeld et al., 2014, 2016; Shinozuka et al., 2015) and other shortcomings exist. For example, a common proxy is aerosol optical depth (AOD). It has been found that the correlation of AOD with CCN number concentrations, a key assumption in this approach, is strongly dependent on ambient relative humidity (RH) and aerosol types. Furthermore, these correlations become less reliable when sea salt and mineral dust constitute an important fraction of the particle number, a situation which can be relevant over the ocean or deserts (Liu and Li, 2014). This makes in situ measurements indispensable and therefore numerous studies of CCN activity have been carried out in a variety of environments, ranging from remote marine over continental background to urban locations, and in the laboratory (e.g. Andreae, 2009a; Asmi et al., 2012; Bougiatioti et al., 2009; Crosbie et al., 2015; Cubison et al., 2008; Ervens et al., 2010; Jurányi et al., 2010; Paramonov et al., 2015; Rose et al., 2011; Whitehead et al., 2014; Wong et al., 2011). Most of these observations focus on relatively short time periods and some attempt to capture specific circumstances such as biomass burning events (e.g. Bougiatioti et al., 2016) or focus on the hygroscopicity of specific aerosol particle components such as black carbon (e.g. Schwarz et al., 2015) or organic carbon (e.g. Frosch et al., 2011). While such studies provide detailed insights into CCN activation processes and contribute to our comprehensive understanding of ACI, they cannot address questions of regional and temporal CCN variability. However, those aspects are crucial for model evaluation. Also, knowledge of the size distribution, composition and hygroscopicity of aerosol components, and atmospheric aerosols in different environments as well as appropriate representation in model simulations, is important to quantify aerosol radiation interactions as a function of relative humidity.
They are best addressed through long-term observations at regionally representative locations. Among the scarce examples of such studies are observations at the high alpine site Jungfraujoch (Jurányi et al., 2011), in the Amazon rain forest (Pöhlker et al., 2016) or several other European stations (Mace Head, Ireland, coastal background; Hyytiälä, Finland, boreal forest and Vavihill, Sweden, rural background) before or during the European Integrated project on Aerosol Cloud Climate and Air Quality Interactions (EUCAARI) experiment (Fors et al., 2011; Paramonov et al., 2015; Sihto et al., 2011). Further examples of long-term studies include a study at an urban background site in Vienna, Austria (Burkart et al., 2011), at a regionally representative site in the Yangtze River Delta (Che et al., 2016) or at an urban site in Shanghai (Leng et al., 2013). In addition to revealing the seasonal and regional variability in CCN number concentrations and associated variables, such long-term studies can address the question of which specific aerosol particle characteristics need to be monitored to provide data sets with which models can be effectively evaluated. Such studies are particularly valuable given general constraints that will not allow operating very comprehensive aerosol characterisation equipment over long periods of time at many locations. One specific question is whether CCN number concentrations need to be measured directly, e.g. with cloud condensation nuclei counters (CCNC) or whether they can be inferred by knowing the critical diameter at which particles activate as cloud droplets. A simple parameterization was developed from the κ–Köhler theory (Petters and Kreidenweis, 2007), which links aerosol particle hygroscopicity with the critical diameter at a given supersaturation and hence leaves the particle number size distribution as determining variable for CCN number concentrations. The hygroscopicity parameter, κ, can be calculated from the aerosol particle chemical composition. So theoretically, it would not be necessary to operate a CCNC if particle number size distribution and chemical composition measurements were available. This, however, leads to the question of which degree of detail is needed for the chemical composition and mixing state of the aerosol particles to derive their hygroscopicity. However, there is no unanimous conclusion in the literature. Some studies find that the variability in aerosol size distribution is more important than the variability in chemical composition (e.g. Dusek et al., 2006; Ervens et al., 2007) and a review (Andreae and Rosenfeld, 2008) suggests that a global hygroscopicity parameter of κ = 0. ± 0.1 and κ = 0.7 ± 0.2 can be useful as a first approximation for continental and marine aerosol, respectively. Conversely, other studies stress the importance of not only knowing the bulk composition of particles but also their size-resolved chemical composition and state of mixing or even the more detailed composition of organic carbon. This is because organic aerosol usually constitutes an important fraction of the CCN relevant aerosol mass around the globe (Zhang et al., 2007) and more oxygenated aerosol tends to be more hygroscopic (Cubison et al., 2008; Duplissy et al., 2008; Frosch et al., 2011; Jimenez et al., 2009; Massoli et al., 2010; Wong et al., 2011). In addition, several studies have investigated the effect of organic surfactants that can decrease the surface tension (e.g. Charlson et al., 2001; Facchini et al., 2000). It is expected that the effect of surface tension suppression by surfactants is smaller than predicted by the classical Köhler theory due to surface-bulk partitioning effects unless liquid–liquid phase separation occurs (Sorjamaa et al., 2004). A recent study, however, shows that a combination of liquid–liquid phase separation, surfactants and specific particle size distributions could increase the CCN number concentration by a factor of 10 compared to climate model predictions (Ovadnevaite et al., 2017). More generally, the importance of a detailed knowledge of the particle chemical composition for CCN activity depends on the distance from the source as more aged particles tend to assume similar particle number size distributions and hygroscopic characteristics (e.g. Andreae, 2009b; Ervens et al., 2010).
In this study, we present long-term observations from 12 locations of collocated particle number size distributions, CCN number concentrations and, in some cases, aerosol particle chemical composition measurements. Eight of these stations are part of the European Aerosols, Clouds, and Trace gases Research InfraStructure (ACTRIS, http://www.actris.eu/), while the other observatories are located in South Korea, Japan, the USA and Brazil. They cover a range of environments such as coastal and rural backgrounds, urban and high alpine conditions, as well as boreal, Arctic and rain forest characteristics. We explore the frequency distributions and seasonal cycles of various variables (CCN number concentration, critical diameter, κ values and others), the persistence of CCN number concentrations in winter and summer, and particle activation behaviour. We also perform closure studies based on the κ–Köhler parameterization and test the sensitivity of results to simplified assumptions regarding aerosol chemical composition, particle number concentrations and size distributions.
2.1 Measurement sites and instrumentation
Figure 1a shows the locations of the 12 observatories, which span a wide range of environments. Four stations are located near the coast, covering Arctic (BRW), Mediterranean (FIK), Atlantic (MHD) and Pacific conditions (NOT). Two alpine stations in Europe (PUY, JFJ) represent the continental background and partly free tropospheric air masses, while three observatories near sea level in Europe characterise the rural background conditions (MEL, CES, VAV). The boreal (SMR) and rain forest (ATT) environments are represented by one station each, as well as one urban location in Asia (SEO; compare grouping in Fig. 1b). Table 1 provides an overview of each station's characteristics and representativeness.
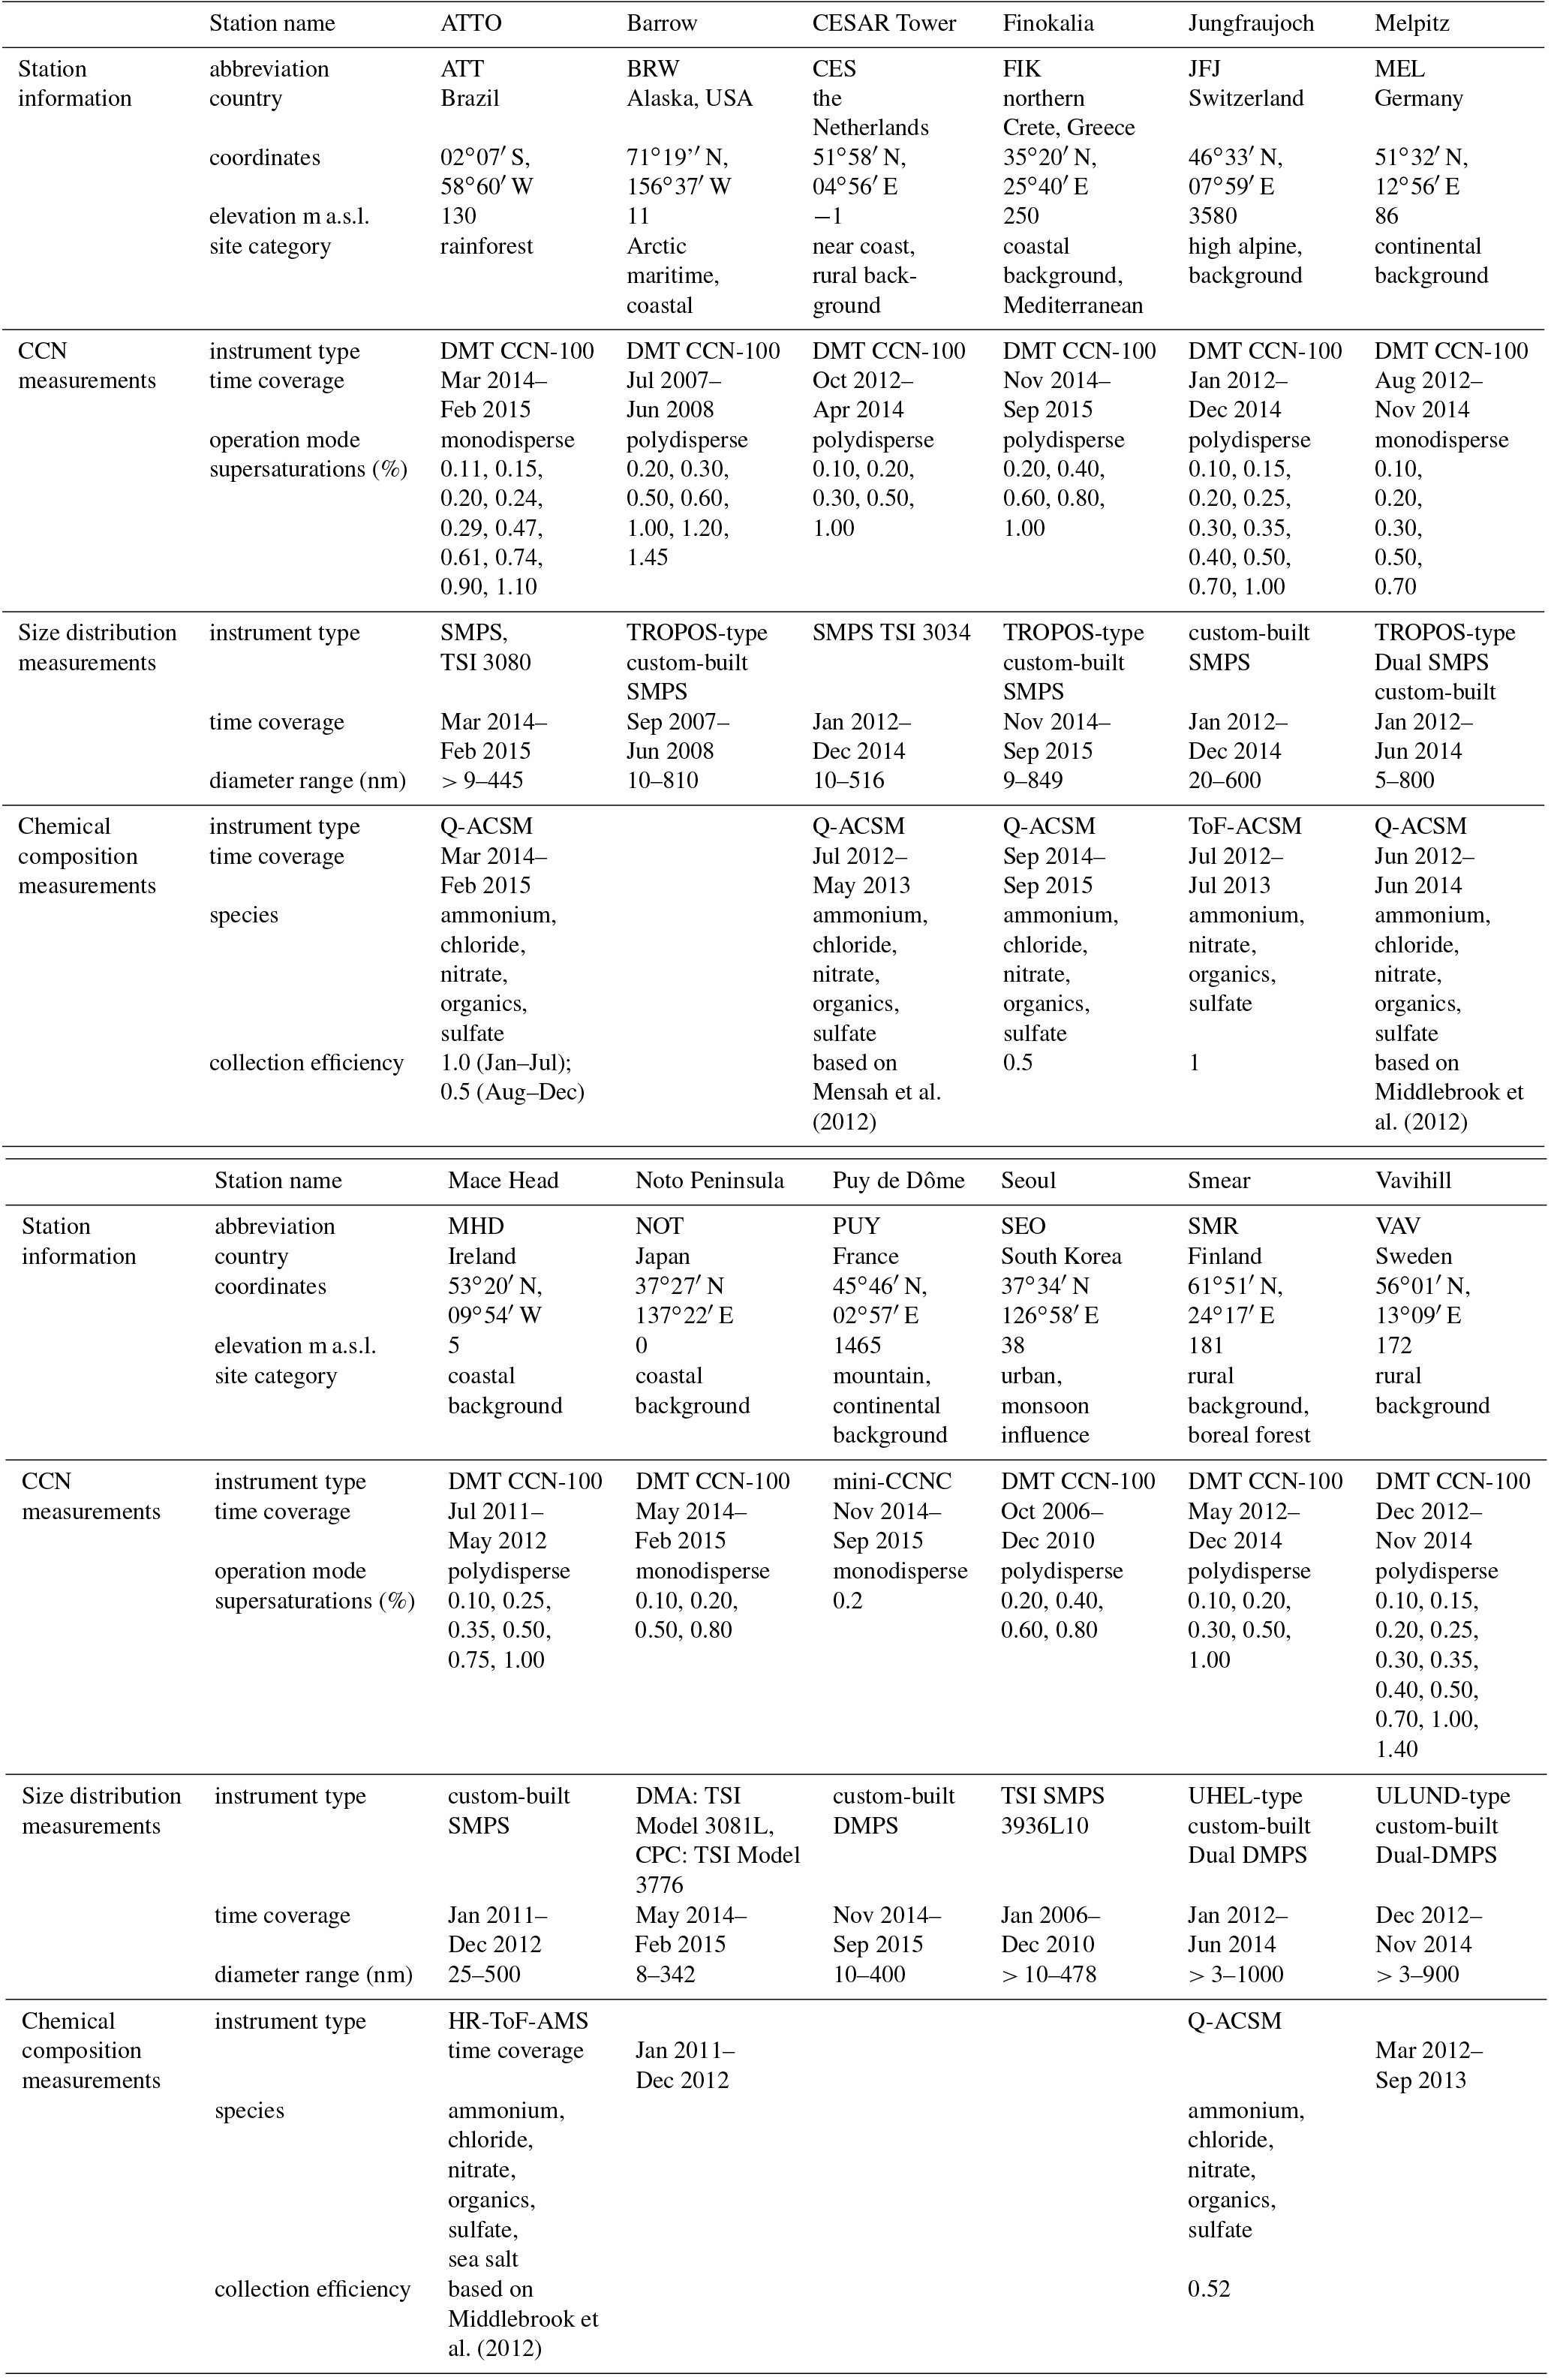
This study uses data from concomitant measurements of CCN number concentrations, particle number size distributions and, where available, bulk aerosol particle chemical composition. Table 1 lists the instrumental and operational details. All information regarding each station's inlet system, instrument descriptions and sampling details is given in the related data descriptor paper (Schmale et al., 2017), except for the rainforest station (ATTO), which is described in Pöhlker et al. (2016). Since the focus is on long-term observations rather than short-term intensive field campaigns, the data used were chosen to cover at least 75 % of each season within 12 consecutive months. Seasons are defined as December, January, February (DJF); March, April, May (MAM); June, July, August (JJA) and September, October, November (SON) if not referred to otherwise.
Briefly, CCN number concentrations were measured with the CCNC-100 model by Droplet Measurement Technologies (DMT; Roberts and Nenes, 2005) in all cases except at Puy de Dôme, where a miniature version of this instrument was deployed (Sullivan et al., 2009). Most stations measured in the polydisperse mode, where the activation of the entire aerosol population is measured at a given supersaturation. At four stations (ATT, MEL, PUY, NOT), CCN number concentrations were determined in the monodisperse mode, whereby particles are selected by a differential mobility analyzer (DMA) that scans through a range of particle diameters upstream of the CCNC. Regardless of the operation mode, this work considers exclusively the time series of the bulk activated aerosol, meaning that monodisperse CCN number concentrations were integrated over the covered size ranges.
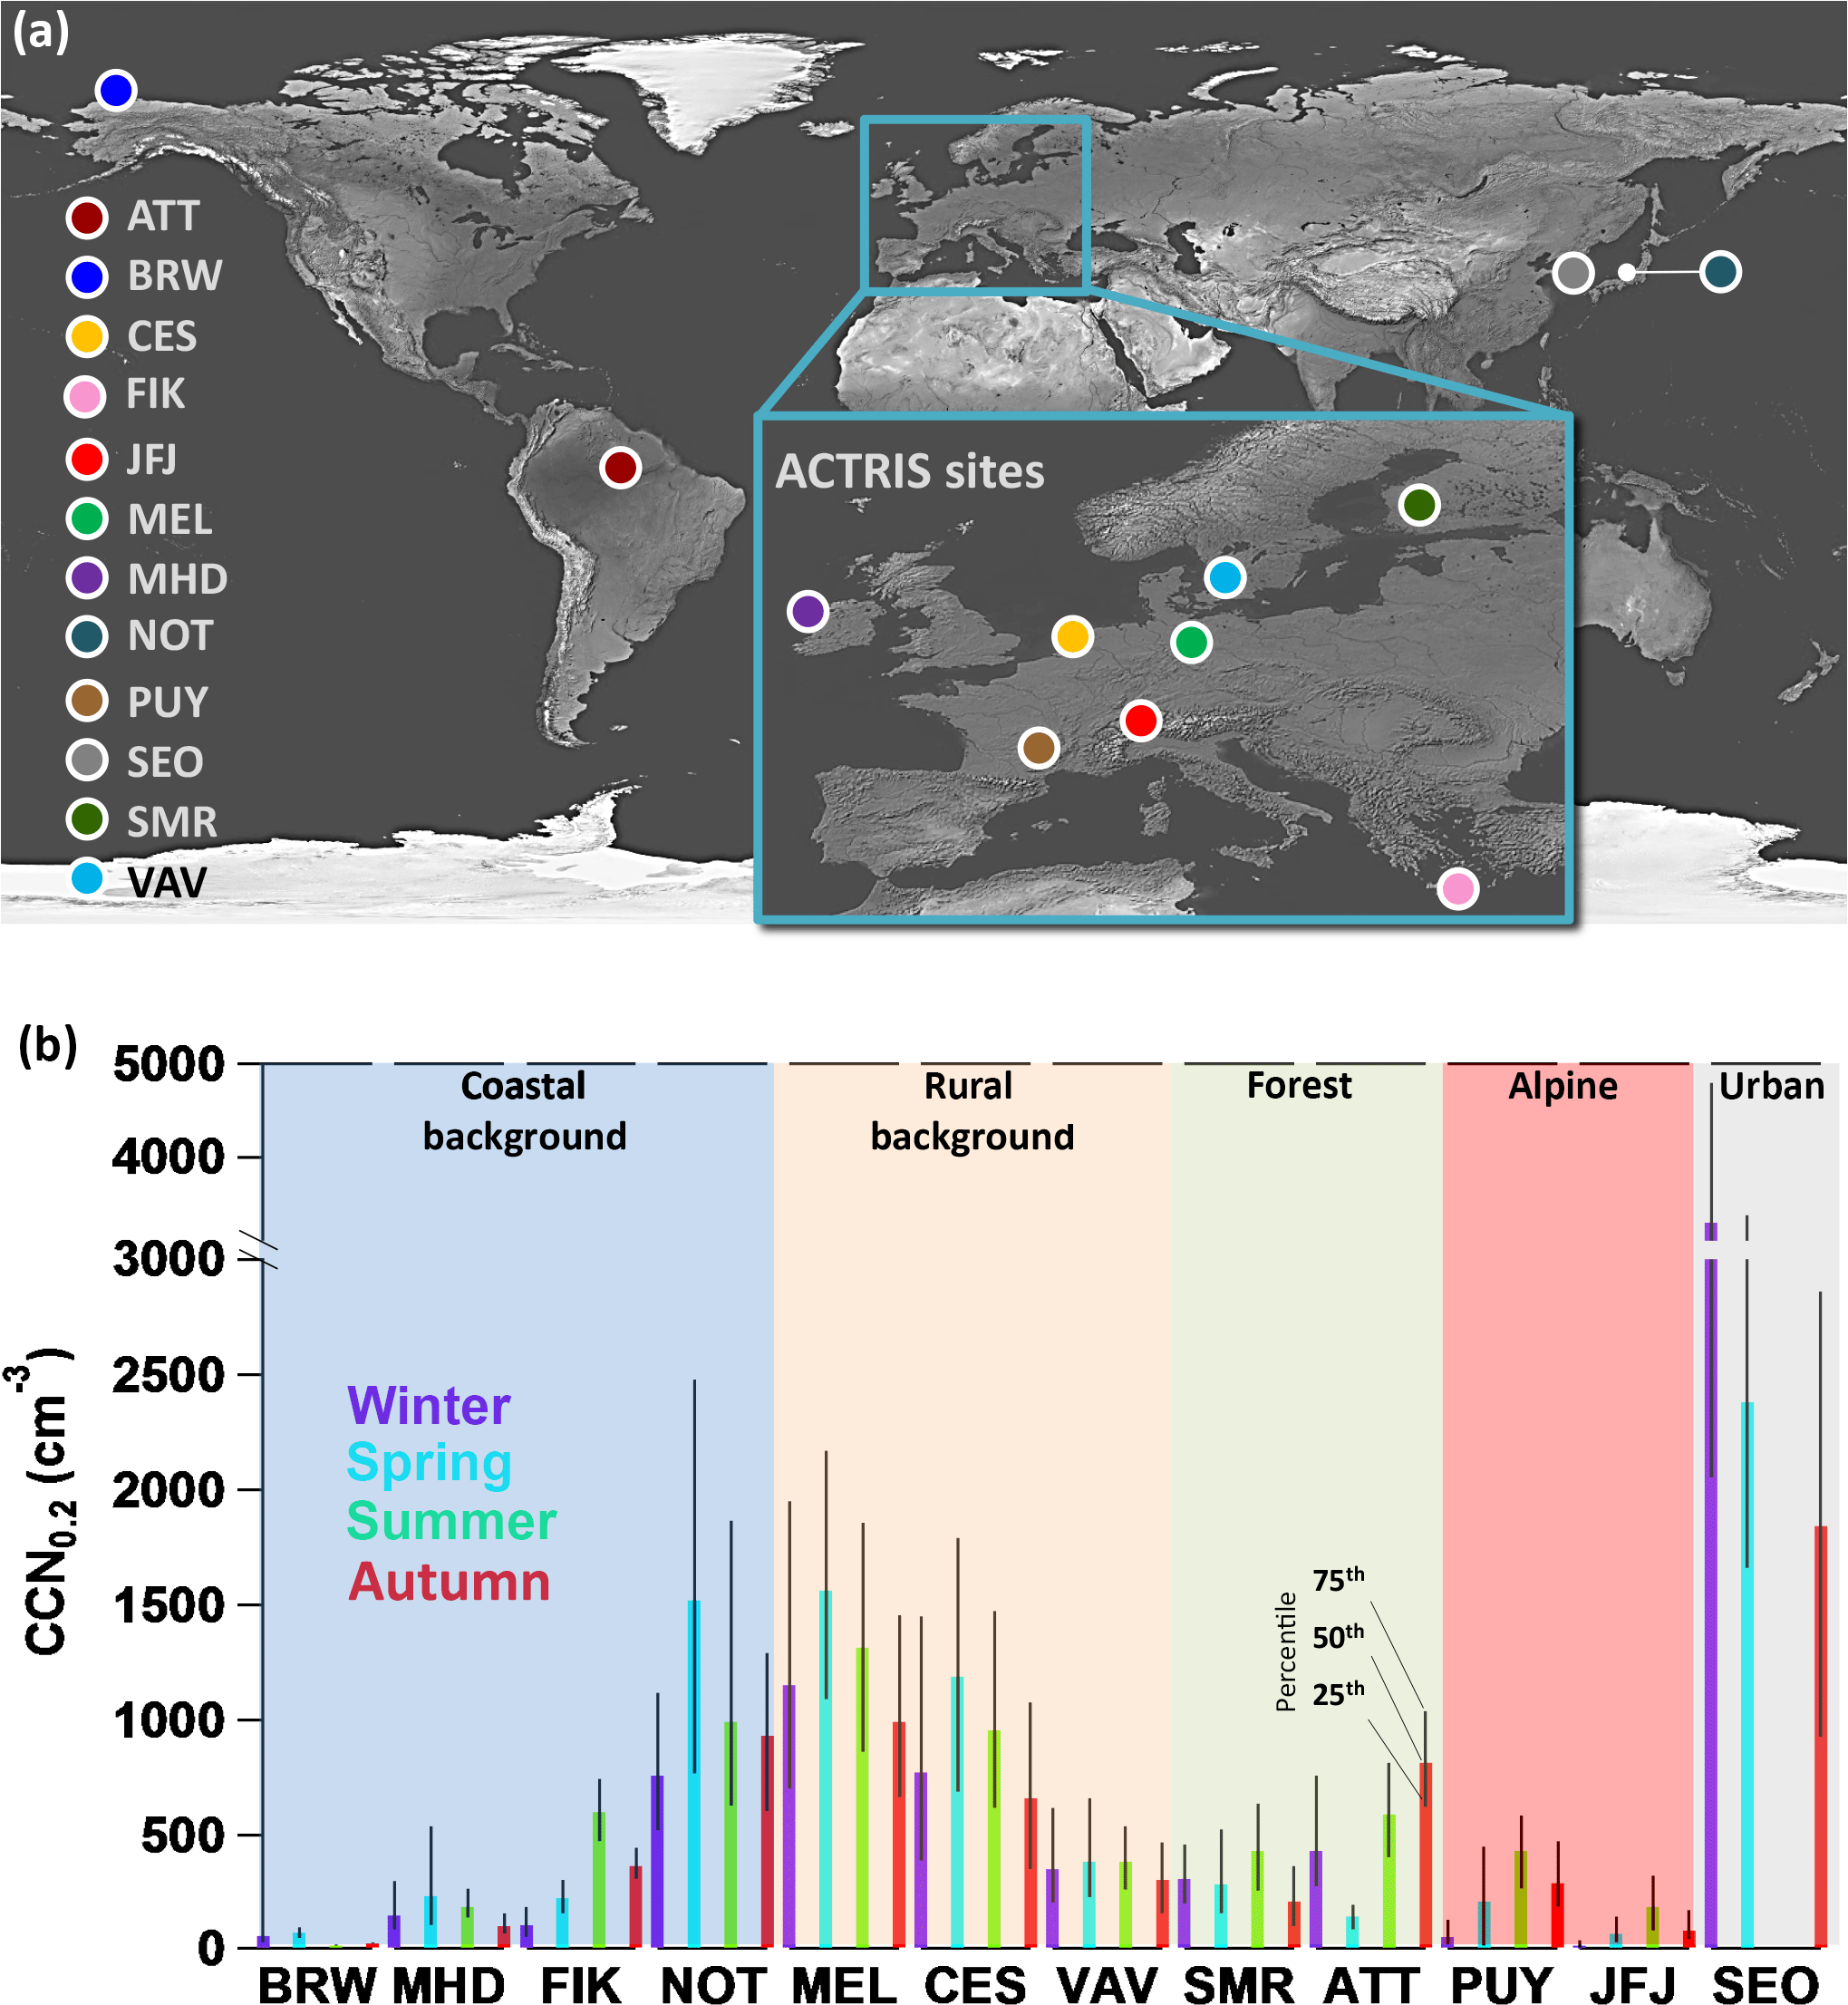
Figure 1(a) Map showing all measurement sites. Station abbreviations are given in Table 1. All stations in Europe are part of the ACTRIS network. This map is adapted from Natural Earth III and Schmale et al. (2017). (b) Median and interquartile ranges of the seasonal CCN number concentrations at a supersaturation of 0.2 % are displayed for each station. The shaded areas group the stations into the classifications indicated.
Particle number size distributions were obtained by a variety of mobility particle size spectrometers (MPSS) as listed in Table 1, which are either commercially available or custom-built. All custom-built versions have been intercompared at the World Calibration Center for Aerosol Physics (Wiedensohler et al., 2012, 2018) or audited by it.
Table 1List of measurement sites participating in this synthesis study. Station names followed by an asterisk (*) are part of the ACTRIS network. Abbreviations correspond to those within the Global Atmosphere Watch network/programme.
Submicron aerosol particle chemical compositions were measured by two different types of aerosol mass spectrometers. The high-resolution time-of-flight aerosol mass spectrometer (HR-ToF-AMS) operated at Mace Head has been described by DeCarlo et al. (2006) in general and in particular for Mace Head by Ovadnevaite et al. (2014). The aerosol chemical speciation monitor (ACSM), deployed at all other stations, has been introduced by Ng et al. (2011) and the first official ACTRIS intercomparison is described in Crenn et al. (2015). The intercomparison covers all quadrupole ACSMs, except the one deployed at ATTO, which is described in Pöhlker et al. (2016). On Jungfraujoch, a time-of-flight ACSM was operated as described by Fröhlich et al. (2013, 2015). All aerosol mass spectrometer types are able to provide the mass concentrations of standard chemical species that include particulate ammonium, chloride, nitrate, organics and sulfate in the submicron size range. Table 1 lists which species are available at each station; missing species mean that their concentrations were below the detection limit. At Mace Head, the sea salt content of the submicrometer aerosol is given in addition based on a specific method introduced by Ovadnevaite et al. (2012). Table 1 also lists the collection efficiency (CE) of each mass spectrometer. The CE depends on the transmission of particles into the instrument and their chemical composition and is hence an instrument and site-specific factor (Huffman et al., 2005; Middlebrook et al., 2012).
Additionally, at the time of data collection, equivalent black carbon (BC) mass concentrations were available for the stations JFJ (aethalometer model AE31, Magee Scientific), MEL and MHD (multi-angle absorption photometer, MAAP, Thermo Scientific), which are used for the sole purpose of calculating the hygroscopicity parameter κ (see Sect. 2.3.2). For stations where no concomitant BC concentration time series were available, BC mass fractions from the literature were used as approximation as described in Sect. 2.3.2.
2.2 Data treatment and quality assurance
The collection, harmonisation and quality assurance of the data sets presented here are described in detail in the data descriptor by Schmale et al. (2017). Data have a time resolution of 1 hour and represent standard temperature and pressure (STP) conditions. The time resolution of CCN number concentrations at Puy de Dôme (PUY) and ATTO are 4 and 6 hours, respectively, because the scans over the submicron aerosol size range in monodisperse mode took longer. Most instruments measuring particle number size distributions had been intercompared, audited or the data had been published previously (see Table 9 in Schmale et al., 2017). The same was the case for the chemical composition data (same reference). For that reason, emphasis was given to the quality check of the CCN number concentrations that had not previously been published in most cases. Exceptions are the data from Seoul (Kim et al., 2014) and ATTO (Pöhlker et al., 2016), whereby the latter station is not included in Schmale et at. (2017). Note that the aerosol sample flow was kept at a relative humidity < 40 % at all sites except in Seoul, meaning that particle size can be biased large. For all polydisperse data sets where measurements at a supersaturation of 1.0 % were available, the total CCN number concentration was compared to the total particle number concentration in all instances when the contribution of particles < 30 nm was at most 10 %. It is expected that at such a high supersaturation, almost all particles > 30 nm activate. Hence the data points are expected to group around the 1 : 1 line within the target uncertainty of 10 % (Wiedensohler et al., 2012). Figure 4 in Schmale et al. (2017) shows that most instruments performed reasonably well, with the exception of the CCNCs at the Cesar (CES) and Jungfraujoch (JFJ) stations. At CES the CCN number concentration is strongly underestimated, and the underestimation increases with increasing supersaturation. Discrepancies are as large as a factor of 3.3 in the geometric mean for 1.0 % supersaturation. This suggests that small particles, activating at higher supersaturation, were not sufficiently accounted for by the CCNC. As this was not due to insufficient droplet growth to the detection limit of 1 µm of the optical particle counter in the CCNC, the bias most likely originated from particle losses in the sampling line to the CCNC. Since this cannot be accounted for across the various supersaturations, the data set has not been corrected. Therefore the CCN number concentrations reported for CES represent a lower limit. Details for JFJ have already been discussed in Schmale et al. (2017). More details for both stations are provided in Sect. S1 in the Supplement (hereafter referred to as Sect. S1).
At the observatories in Melpitz (MEL), NOT and PUY, CCN were not measured at a supersaturation of 1.0 % but in monodisperse mode. Therefore, the integrated particle number concentration above the critical diameter at a measured supersaturation (diameter at which particles activate) was plotted against the integrated CCN number above the same diameter. The CCN number size distribution data at both stations compare well with the particle number size distributions (see Fig. 5 in Schmale et al., 2017).
All data (except for ATTO) are available from: http://actris.nilu.no/Content/products. The ATTO data have been published by Pöhlker et al. (2016).
2.3 Data analyses
2.3.1 Frequency distributions, seasonal cycles and persistence
The CCN number concentration frequency distributions were calculated in 200 bins with a logarithmic (log10) spacing of 0.023, starting with 1 particle (cm−3). Frequency distributions of the particle number size distributions' geometric mean diameter (Dg) were calculated for the available particle diameter range at each station, and also starting at a lower cut-off of 20 nm for comparability. The frequency distributions of Dg as well as the critical diameters (Dcrit) are based on 105 bins with a logarithmic (log10) spacing of 1∕64. The value of Dcrit was derived from integrating the particle number size distributions from their maximum diameters to that diameter at which the integrated particle number equaled the measured CCN number concentration (see also Sect. 2.3.2, Eq. 5). All frequency distributions are normalised to the number of data points at each station.
Seasonal cycles are represented by the monthly medians calculated from the hourly values of the respective variable (4 and 6 hourly data for CCN at PUY and ATT, respectively). If a particular month is covered several times in a time series, the median of all data acquired in that month is derived. Additionally, the interquartile range has been calculated in the same way.
The CCN number concentrations at the regionally representative stations discussed here are influenced by a variety of factors that include the microphysical and chemical characteristics of the particles, atmospheric transport, dry and wet particle deposition, synoptic patterns, and seasonal source strengths. For example, the boreal forest produces more SOA in the growing season (summer) than in winter. Determining the persistence of CCN number concentrations, i.e. the duration over which their concentration remains similar, can help to identify regionally relevant factors that significantly influence the abundance of CCN. At each station, the persistence was calculated by auto-correlating the time series for the winter (DJF) and summer (JJA) months. Data gaps of less than 1 day were filled by the average of the preceding four data points. Large data gaps, exceeding 1 day, were not filled. Instead shorter periods of the season were auto-correlated separately and then averaged. This was the case for JFJ and BRW in winter, and MHD, FIK and BRW in summer. The auto-correlation function “acf” in the program R (version 3.3.1) was applied to the time series of CCN at a supersaturation of 0.2 % with 1 hour time resolution, except for ATT and PUY where the highest time resolutions were 6 and 4 hours, respectively. The significance level of the auto-correlation was determined by calculating the large lag standard error, Ecorr, of the auto-correlation coefficient, accounting for the interdependency between auto-correlation coefficients, following Eq. (1):
with N being the number of data points, rk the correlation coefficient at lag k and K < k with K being the last lag of a specific calculation step. The higher the number of observations, the larger Ecorr becomes, and with this the likelihood of identifying a potentially randomly high correlation at a large lag as significant. The persistence of a property is determined by the time coordinate at which the auto-correlation curve crosses the large lag standard error curve.
2.3.2 Hygroscopicity parameter kappa (κ) and CCN closure
The hygroscopicity parameter, κ, quantifies the Raoult effect, i.e. the relationship between the particle's hygroscopic equilibrium growth factor (GF) and corresponding water activity. When assuming a surface tension and using the Köhler equation, which combines the Raoult and Kelvin effects to the related GF and RH at equilibrium, the κ value unambiguously relates the dry particle size with the critical supersaturation (Petters and Kreidenweis, 2007): the higher the value of κ, the higher the hygroscopicity of a particle (Zieger et al., 2017). The κ of a mixed particle can be derived in good approximation from the particle chemical composition following a simple mixing rule as given in Eq. (2) when the κ value of each component i is known (Petters and Kreidenweis, 2007):
with εi being the volume fraction of component i. The volume fraction of each component was derived from its measured mass concentrations and density (1.4 g cm−3 was assumed for organic aerosol) in this work.
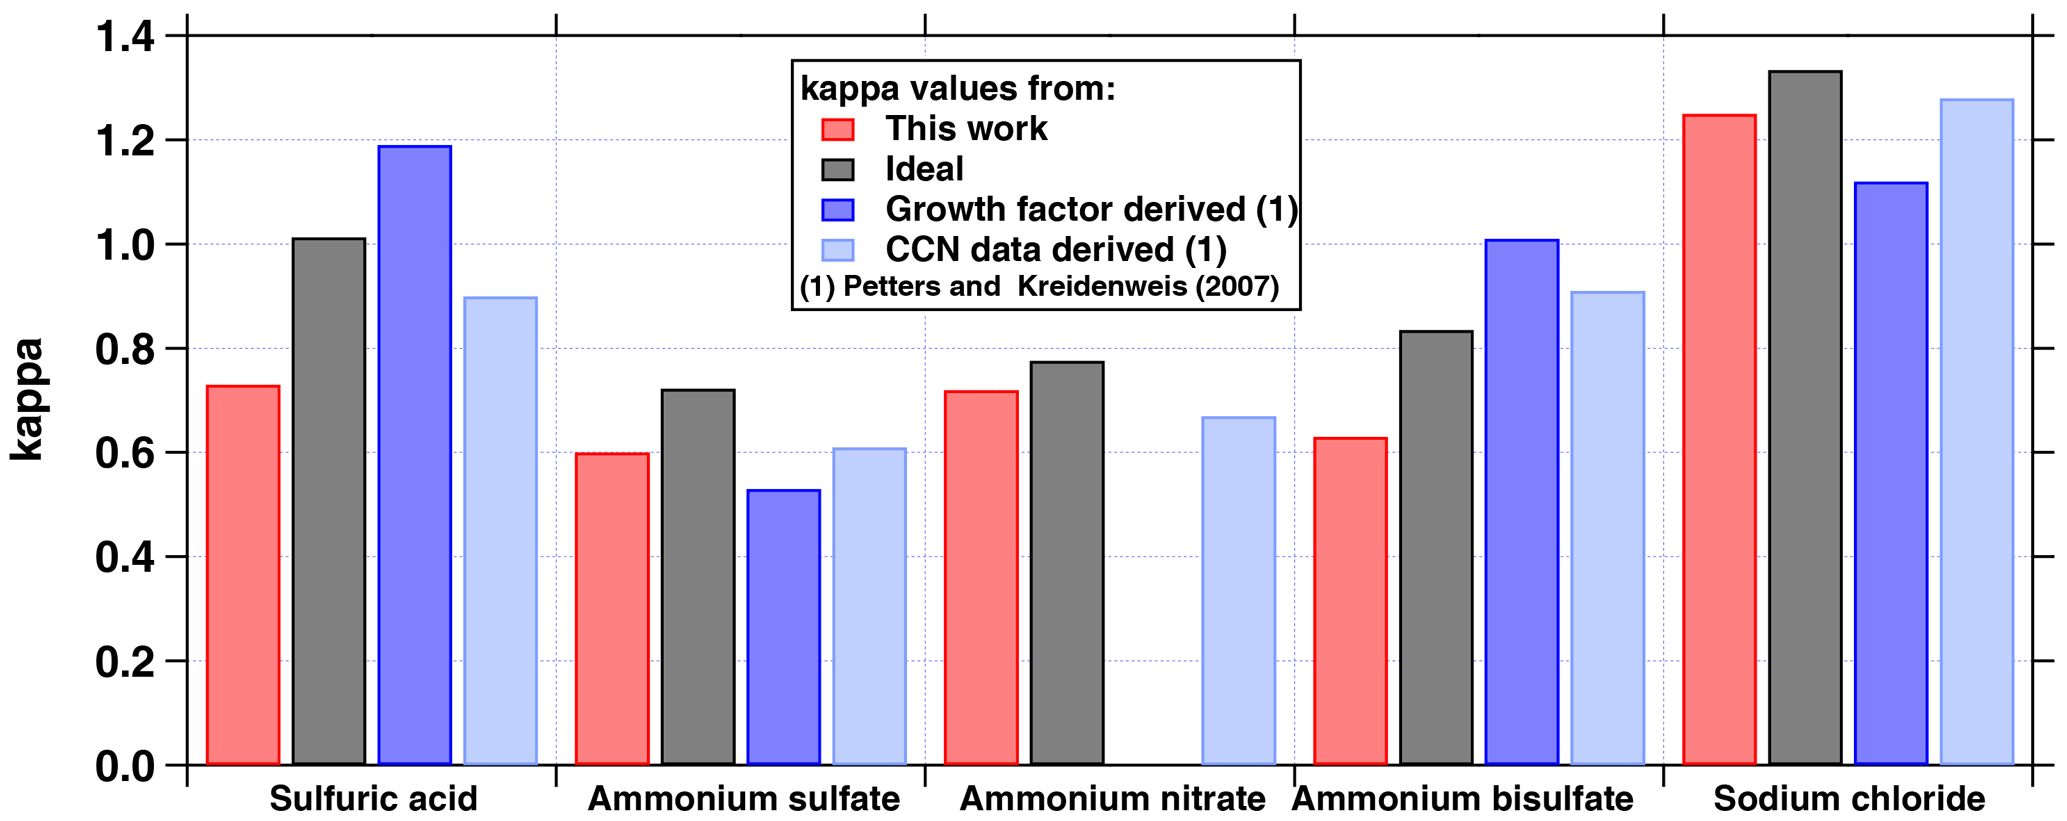
Figure 2Comparison of average hygroscopicity parameters (κmean) provided in Table 1 in Petters and Kreidenweis (2007) with the κ values derived in this work based on a water activity of 0.9975 at the point of CCN activation as input to the E-AIM model II and IV (http://www.aim.env.uea.ac.uk/aim/model2/model2a.php). The water activity was derived from the following assumptions: κ = 0.3, supersaturation SS = 0.5 %, temperature T = 5 ∘C, and surface tension σ = 74.95 mN m−1. The ideal κ values refer to a water activity of 1. Note that the growth-factor-derived values in Petters and Kreidenweis (2007) are based on a water activity of about 0.9. For NaCl the value reported in Petters and Kreidenweis (2007) is too low and should be around 1.5 instead (Zieger et al., 2017).
The κ values of pure substances typically depend on water activity. Petters and Kreidenweis (2007) provide κ values for a variety of chemical components including inorganic salts and acids. These, however, only partly refer to conditions at the point of particle activation. We therefore calculated the pure component κ values for a reference water activity of aw = 0.9975 following Petters and Kreidenweis (2007):
Vs is the volume of the dry particulate matter and Vw the volume of water. The reference aw was chosen to reflect the water activity in the solution droplet at the point of CCN activation for a supersaturation of 0.5 %, temperature of 5 ∘C, corresponding pure water surface tension of 74.95 mN m−1 and κ of 0.3. These properties and conditions are typical for cloud formation in ambient clouds and they imply a critical dry particle diameter of 63 nm. Note that the temperature has only a minimal effect on the κ of a pure component, while it affects CCN activation through the temperature dependence of surface tension and the Kelvin effect. This reference water activity was used as input to the E-AIM model II and IV (http://www.aim.env.uea.ac.uk/aim/aim.php), by which the particulate water content was calculated for the pure salts and inorganic acids in aqueous solution. The E-AIM II model is an equilibrium thermodynamic model including the following ions: H+, NH, SO, NO and H2O. It is valid from 328 K to about 200 K. Model IV includes Na+ and Cl− and is valid from 180 to 330 K. Based on this, the GFs and ,from that, the κ values were calculated for sulfuric acid, ammonium sulfate, ammonium bisulfate, ammonium nitrate and sodium chloride, accounting for the solution density which is provided by the AIM model. Note, we did not account for the water content of the chemical species in dry conditions, e.g. RH = 10 %. The chemical species were derived from ions quantified by the mass spectrometric measurements following the procedure suggested by Gysel et al. (2007). The results (shown in Fig. 2) are generally similar to and slightly lower than the ideal κ (aw = 1), but can be larger or smaller than the values provided in Petters and Kreidenweis (2007). Note that the value for NaCl in Petters and Kreidenweis (2007) is too low, instead of 1.12 it should be around 1.5 (Zieger et al., 2017).
In our study, we assume that chloride is present in the form of NaCl and apply the κ value as shown in Fig. 2. For MHD, the contribution of submicron sea salt has been calculated by the data originators after Ovadnevaite et al. (2011a) to which we assign the same κ value. Given that the AMS and ACSM do not fully detect sea salt components which are present in the submicron aerosol (Salter et al., 2015), this contribution to sea salt mass contributions is likely to be underestimated at all other stations close to the sea and where chemical composition data are available (e.g. CES, FIK), except at MHD.
For particulate organics, we use a κ of 0.1, following observations in a variety of environments (e.g. Dusek et al., 2010; Gunthe et al., 2009, 2011; Jurányi et al., 2009; Rose et al., 2010, 2011). It should be noted, however, that κorg has been observed to be higher in other studies, especially when the organic aerosol becomes more oxygenated ,that is, when chemical aging has taken place (e.g. Chang et al., 2010; Massoli et al., 2010). At an O : C ratio of 0.2, i.e. non-oxygenated organic matter, κorg tends to be < 0.10, while it increases towards 0.25 or higher at a ratio near 1.0 (e.g. Wong et al., 2011). At some forest sites, significant organic particle mass is produced in situ and the atmospheric processing during transport might have only a small influence. A previous study in the Amazon rain forest revealed that the κ value of the bulk aerosol is only slightly larger than 0.1, when the organic aerosol mass fraction is close to 1. At the boreal forest site (SMR), however, the κ value seems to fall in between 0.1 and 0.2 for high organic mass fractions (Paramonov et al., 2013). It is conceivable that the in situ contribution to organic aerosol mass from biogenic emissions are smaller than in the rain forest, and hence that forest emissions upwind are transported and chemical processes over hours to days play a larger role in determining κorg. At sites like CES, which are classified as background sites but located relatively close to urban agglomerations (20 and 30 km from Rotterdam and Utrecht, respectively), the observed organic matter might have been sufficiently processed to become more hygroscopic than what is normally observed in the urban environment (e.g. Ervens et al., 2010). For BC we use κ = 0 (e.g. Hitzenberger et al., 2003; Rose et al., 2011; Tritscher et al., 2011).
With these κ values for individual components, we calculate the bulk aerosol hygroscopicity with Eq. (2) in five variations:
-
deriving all chemical components, including salts and acids, using the ammonium, nitrate, sulfate and chloride ions, and organics from the aerosol chemical composition data, and no BC (referred to as “”);
-
only with ion-balanced (IB) inorganic components, which excludes acids and bisulfates, but with organics, and no BC (“”);
-
similar to 1 but including BC (“”);
-
similar to 2 but including BC (“”);
-
κ = 0.3.
For alternatives 2 and 4, the measured number of sulfate and nitrate ions was neutralised with a calculated amount of ammonium. We chose to calculate ammonium because the quantification of ammonium with the aerosol mass spectrometer is subject to higher uncertainty than for sulfate and nitrate. Chloride was assumed to be present as sodium chloride. All particulate sulfate and nitrate were assumed to be inorganic, because most composition data were obtained from unit mass resolution ACSM measurements, which do not allow apportioning these ions to organic species. The contribution of particulate sulfate to ammonium sulfate, ammonium bisulfate and sulfuric acid were obtained after Eq. (2) in Gysel et al. (2007) when using prediction alternative 1 and 3. For the stations MEL, MHD and JFJ, BC time series were available. For stations where no BC time series were available at the point of data collection, seasonal or yearly average values were taken from the literature. For ATTO, BC concentrations were obtained from Fig. 30 in Andreae et al. (2015), for CES from Schlag et al. (2016), for SMR from Hyvärinen et al. (2011) and for FIK from Bougiatioti et al. (2014). Results for all κ values are provided in Table 2. It must be noted that when using bulk aerosol particle chemical composition data from AMS or ACSM measurements, the larger particles (all instruments used inlet lenses with an upper cut-off of 1 µm) will dominate the aerosol mass. Hence, the composition information is representative of the size range around the peak of the mass size distribution and might not reflect the composition of the majority of particles when small particles dominate the number concentration. This can be the case when new particle formation happens, e.g. at SMR or MEL (Manninen et al., 2010). In the presence of mostly accumulation mode particles, however, good agreement between hygroscopic GF measurements and its derivation from bulk aerosol composition data has been found for SMR, e.g. Raatikainen et al. (2010). At JFJ earlier studies deriving κ from hygroscopic tandem DMAs and the CCNC resulted in κ = 0.20 and 0.24 (Jurányi et al., 2011 and Kammermann et al., 2010a, respectively), showing that the method of deriving the particle hygroscopicity can play a role at some locations.
The size of the particles is an even more important determining factor for a particle's ability to act as CCN than the κ value. Hence, for all stations where particle number size distribution and chemical composition data are available, we can predict the number of CCN particles at a given supersaturation (SS). using the κ–Köhler equation (Eq. 6, Petters and Kreidenweis, 2007). This equation describes the equilibrium saturation ratio S (ratio of the partial vapour pressure of water and the saturation vapour pressure of water) over an aqueous solution droplet:
with D0 being the dry particle diameter, Ddrop the droplet diameter, σsol the surface tension of the solution (we use a surface tension of water of 72.86 mN m−1 corresponding to 20 ∘C, which is close to the sample air temperature in the CCNC), ϑw the partial molar volume of water in the solution (which was assumed to be the molar volume of pure water), R the universal gas constant and T the temperature. The first term on the right hand side of the equation is a semi-empirical formulation of the Raoult term, i.e. for the water activity aw expressed with dry size, droplet size and κ value. More details are given elsewhere (e.g. Jurányi et al., 2010; Petters and Kreidenweis, 2007). The maximum of Eq. (4), with Ddrop being the independent variable, describes the critical supersaturation for a particle with given dry size and κ value. Similarly, the critical dry diameter (Dcrit) for a certain supersaturation and κ value describes the dry size for which the corresponding critical supersaturation equals this supersaturation. The critical dry diameter was numerically derived from Eq. (4) (rather than using simplified and approximate analytical solutions).
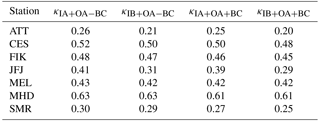
Table 2Median values (based on all data) for the bulk particle composition-derived hygroscopicity parameter kappa (κ) at each station with particle chemical composition measurements. The subscripts to κ indicate which species were or were not included: “IA + OA − BC” for inorganic aerosol and organic aerosol mass but no black carbon; “IB + OA − BC” for ion-balanced inorganic aerosol and organic aerosol mass but no black carbon; “IA + OA + BC” for inorganic aerosol, organic aerosol mass and black carbon; and “IB + OA + BC” for ion-balanced inorganic aerosol, organic aerosol mass and black carbon.
Having determined Dcrit at a given SS and assuming equal composition of all particles with similar size, we can calculate the number of activated particles by integrating the particle number size distribution from its maximum diameter (Dmax) down to Dcrit following Eq. (5):
NCCN(SS) can then be compared to the number of CCN at the same SS measured by the CCNC (i.e. a closure study).
At stations with simultaneous particle number size distribution and polydisperse CCN measurements, κ can alternatively be derived by first estimating Dcrit with Eq. (5). This approach is only approximate for externally mixed aerosols. However, assuming a sharp activation cut-off, which is a priori incorrect in such cases, results in largely compensating errors (Kammermann et al., 2010a), thus still providing valid results.
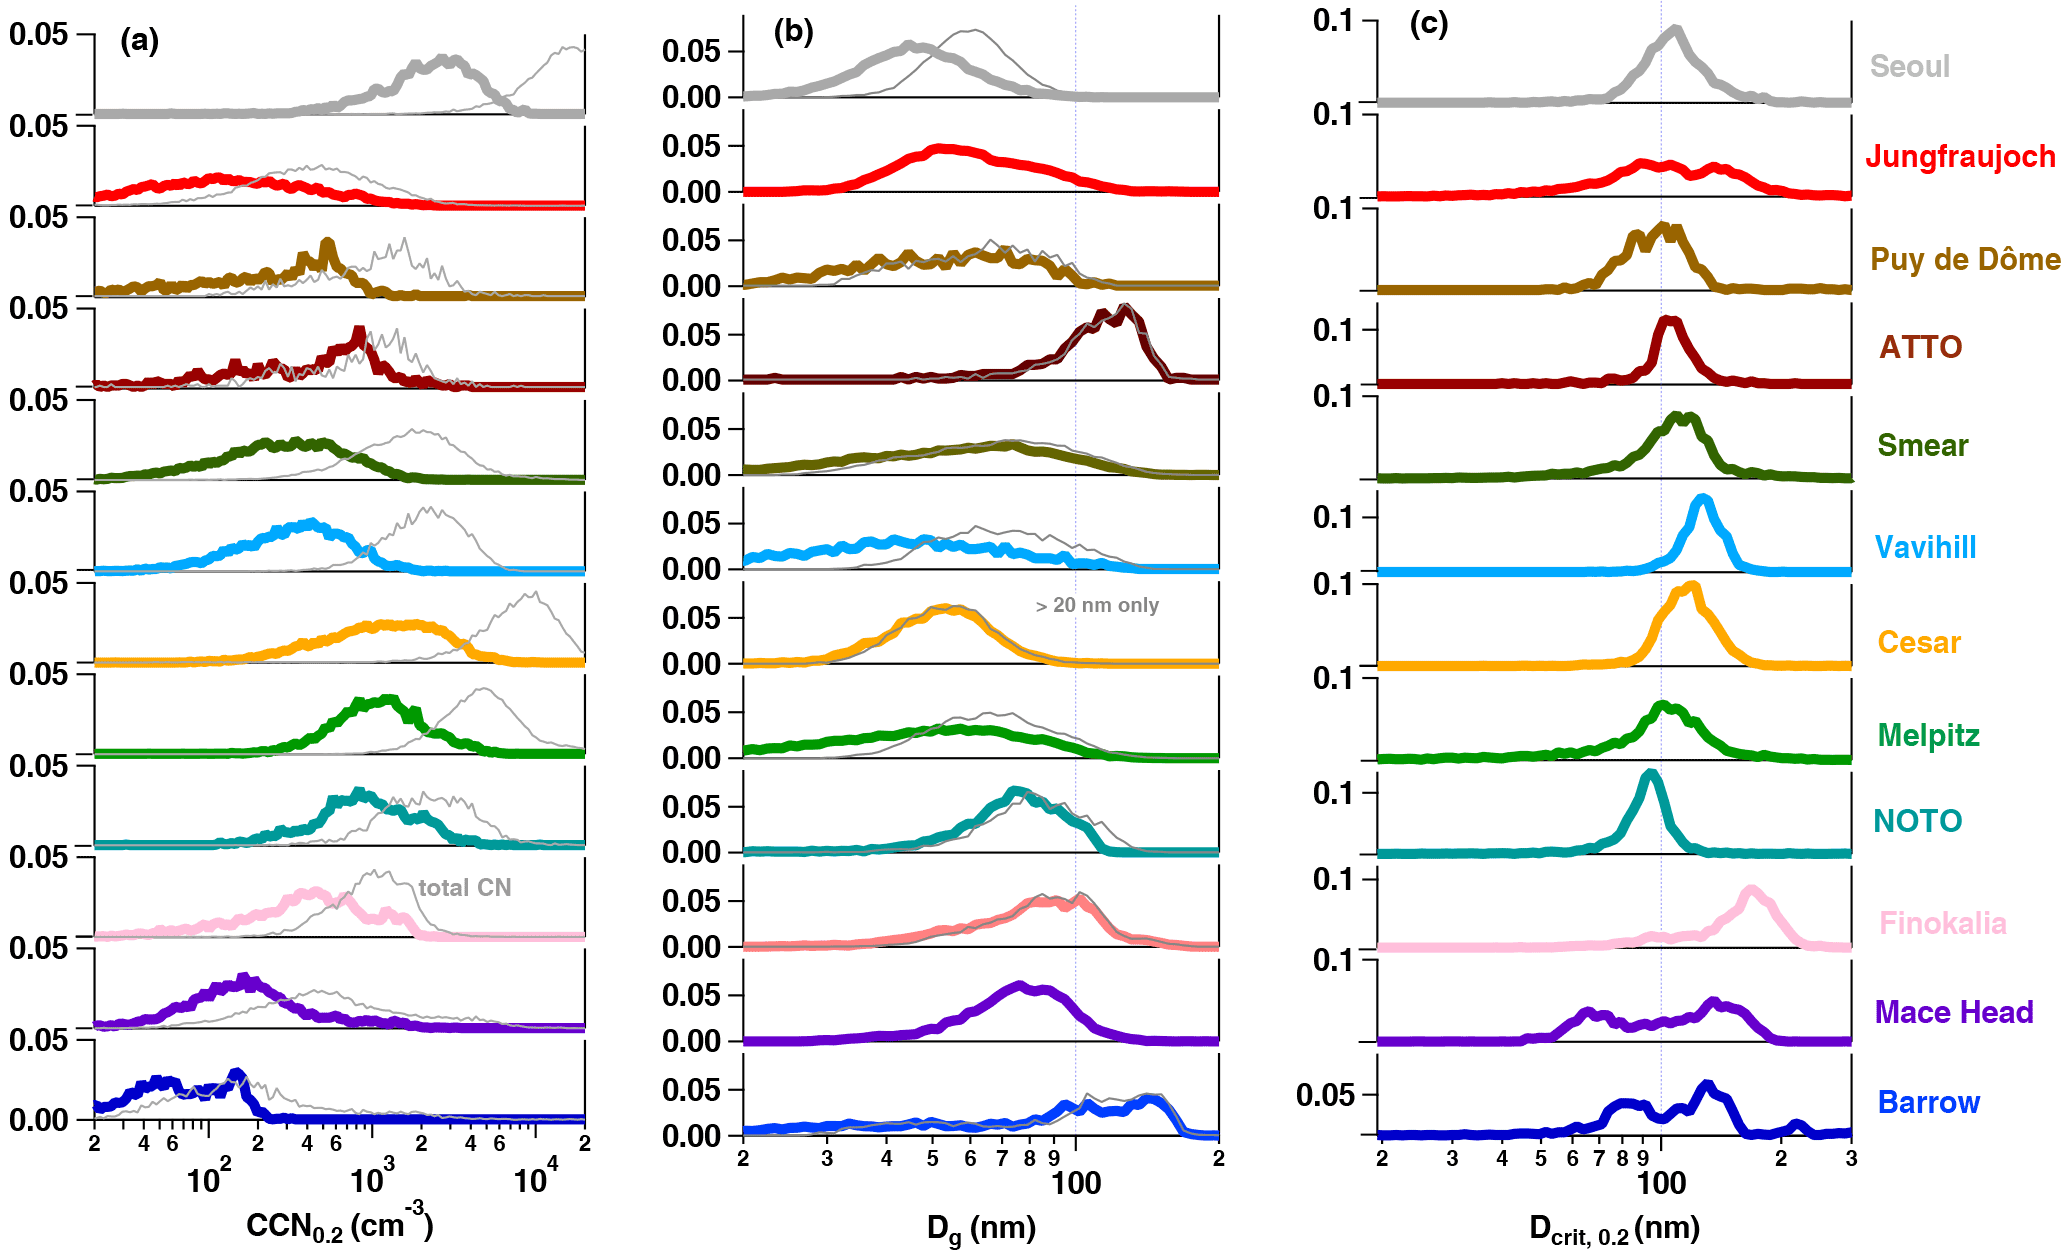
Figure 3(a) Normalised frequency distributions of CCN number concentration at SS = 0.2 % and total particle number in light grey, (b) geometric mean diameter Dg, and (c) critical diameter Dcrit at SS = 0.2 %. The grey lines in (b) are based on size distributions starting at 20 nm. The critical diameter is derived from the total CCN concentration (SS = 0.2 %) and the integrated particle number concentration starting from the largest diameter (see Sect. 2.2.2 for details). Note that seasons are not represented by an equal number of data points at each station which can lead to small biases in the frequency distributions. In (a) and (c) all axes start at 0.00.
3.1 Frequency distributions, seasonal cycles and persistence
Figure 1b provides an overview of CCN number concentration at SS = 0.2 % (CCN0.2) per season at each station. Coloured bars indicate the median while the black bars are a surrogate for seasonal variability spanning the interquartile range. The observatories are grouped by their station classification (see coloured shadings). It becomes apparent that there can be a large variability in CCN0.2 number concentrations within one station category. Within the coastal background station category, the median values can be < 100 cm−3 at BRW and higher than 1500 cm−3 at NOT in spring. In the rural background category, in spring the largest difference is found between MEL with about 1600 cm−3 and VAV with about 400 cm−3. Reasons are discussed in detail further below.
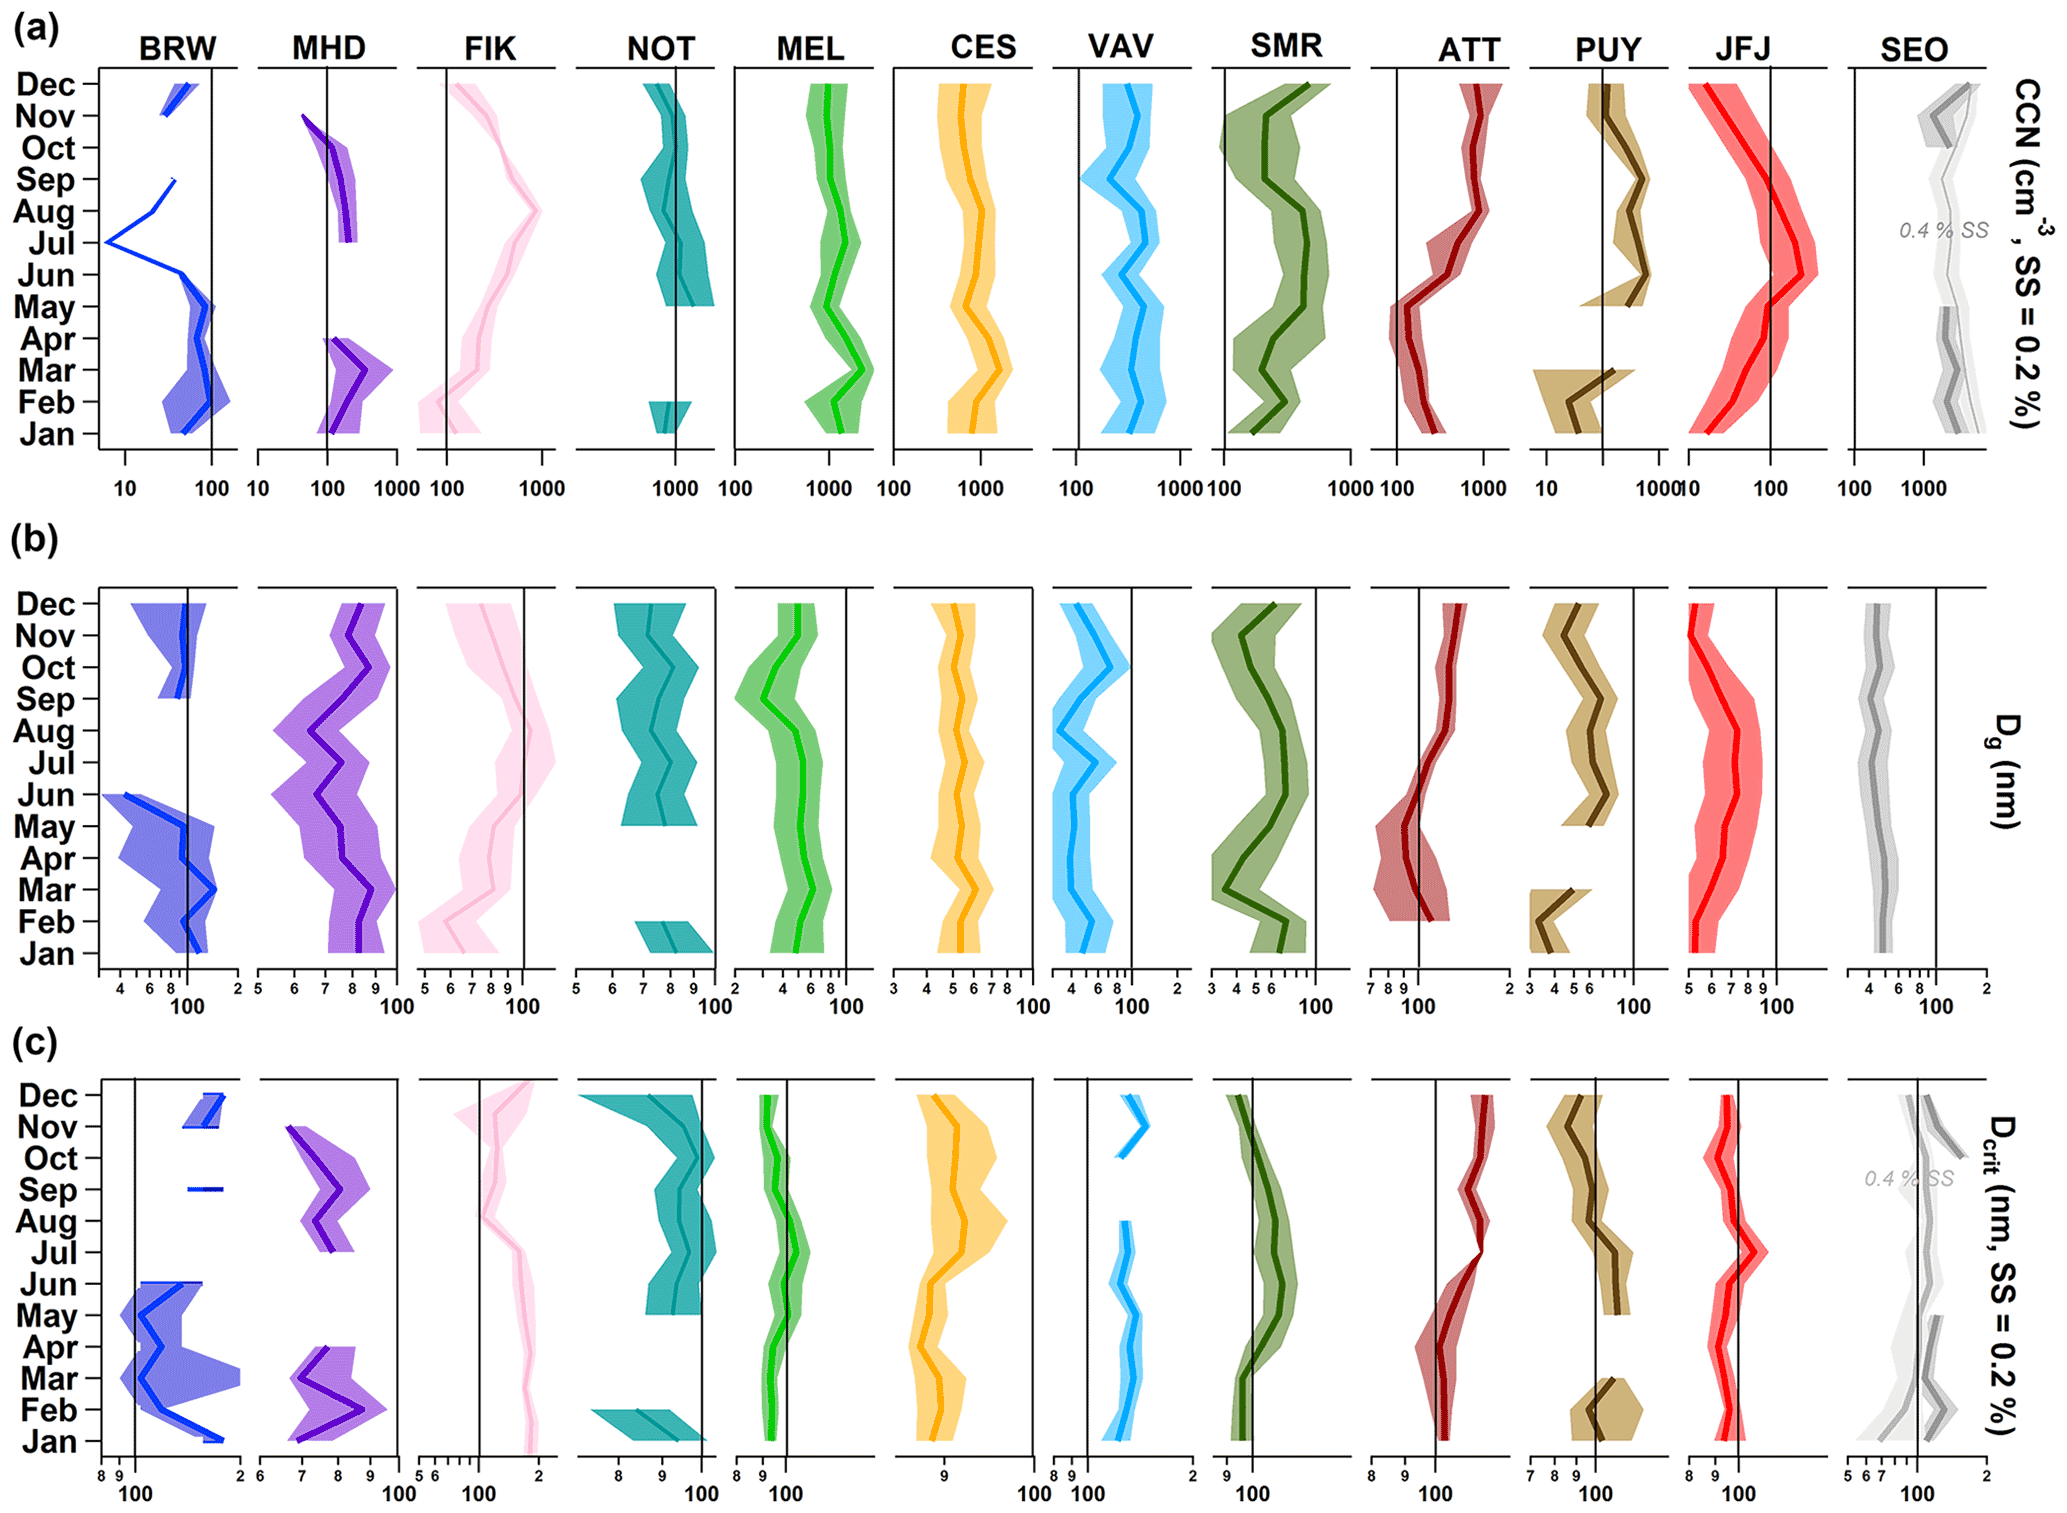
Figure 4Seasonal cycles (median and interquartile range) of (a) CCN0.2 number concentration, (b) Dg and (c) Dcrit at SS = 0.2 %. Note that only particles sizes > 20 nm were taken into account. The black vertical bars are placed at the same x-axis value in each panel for each station for better comparability. For SEO, data at SS = 0.2 % was limited. In order to display the full seasonal cycle, values for SS = 0.4 % are also shown. Note that the number of overlapping data points at VAV for CCN number concentration and particle number size distribution in October is < 200, i.e. < 10 days. No monthly median was derived. Also note, if the interquartile range seems to be missing, variations are so small that they do not appear beyond the thick median line.
Figure 3 shows normalised frequency distributions of CCN0.2, the Dg of the entire particle number size distributions (limited to sizes > 20 nm) and Dcrit at SS = 0.2 % as derived from Eq. (5) based on the CCN and particle number size distribution measurements only. The highest frequency of low CCN0.2 number concentrations (< 200 cm−3) can be found at the Arctic site BRW, which is characteristic of the Arctic maritime environment (Barrie, 1986). Similarly low number concentrations are observed at the mountain sites PUY and JFJ with almost no contribution of > 1000 cm−3. This is expected as they represent continental background conditions as well as the free troposphere, mostly during winter and night-time, but also occasionally during summer (e.g. Herrmann et al., 2015; Venzac et al., 2009). Higher concentrations can be due to boundary layer air mass injections, especially during summer. Note that a potential influence from touristic activities was removed from the data sets (e.g. Fröhlich et al., 2015; Venzac et al., 2009). Low number concentrations are also found at the coastal site MHD (with the highest occurrence of CCN0.2 densities of 200 cm−3), which for certain periods reflects the clean marine conditions over the Atlantic Ocean (Ovadnevaite et al., 2014). The coastal environments of FIK in the Mediterranean and NOT in the Pacific Ocean exhibit generally higher concentrations (between 200 and 2000 cm−3) due to particular pollution influences which ,for example, include long-range transport of NE European pollution and biomass burning plumes (Bougiatioti et al., 2016) and long-range transport of East Asian pollution plumes (Iwamoto et al., 2016), respectively. In terms of CCN number concentrations, the NOT site is in fact similar to the European rural background sites MEL and CES, which experience higher concentrations than the higher latitude continental background site in VAV and the substantially cleaner boreal forest environment (SMR, both < 1000 cm−3). The highest concentrations are seen in the urban environment of Seoul (SEO, 1000–5000 cm−3). While CCN0.2 concentrations are generally mono-modally distributed at all sites, the tropical rain forest observatory (ATT) and the Arctic station (BRW) exhibit bimodal distributions spanning a wide range of possible CCN number concentrations between 20–2000 and 20–200 cm−3, respectively. As seen more clearly in the seasonal cycle (see Fig. 4), for ATTO this is due to the conditions of the rainy and dry seasons, as well as forest fires and other long-range transported air pollution influences (Pöhlker et al., 2016; Whitehead et al., 2016). At BRW the Arctic haze period leads to higher CCN number concentrations than observed in the remainder of the year.
Using Dg as a proxy for aerosol size distributions, Fig. 3b shows that similar particle number size distributions do not always imply similar frequencies of CCN number concentrations. For example, the two mountain stations (JFJ, PUY) do not show similar frequency distributions of CCN0.2 while they do for Dg, because the particle number concentration at PUY is higher and therefore more particles activate. BRW and MHD, while similar in their CCN0.2 frequency distribution, exhibit significantly different particle geometric mean diameters: mostly > 100 nm at BRW and mostly < 100 nm at MHD. The Nordic country stations (SMR, VAV) present similar particle number size distributions. This is true for the particle number size distributions with and without particles < 20 nm considered. The difference in results of Dg when excluding particles < 20 nm is due to frequent new particle formation events at these locations (Manninen et al., 2010). The largest particles are observed in the most remote places, the Arctic (BRW) and the rain forest station (ATT) with high frequencies of Dg > 100 nm.
The critical diameters at SS = 0.2 %, being an indication for the particle hygroscopicity, as shown in Fig. 3c, provide yet another perspective on the diverse aerosol populations. Differences in aerosol sources might not necessarily be visible in the size distributions, whereas they can show up in terms of hygroscopicity. At a constant SS, a smaller Dcrit is expected for more hygroscopic particles such as sea salt. This is reflected by the Dcrit distributions at MHD and BRW. The distributions are bimodal with high Dcrit occurrences of greater and smaller than 100 nm, suggesting that the smaller mode is associated with sea salt and the other CCN active marine aerosols in the case of MHD (Ovadnevaite et al., 2011b) and the generally highly hygroscopic Arctic background aerosol in BRW (Lathem et al., 2013). The second, less hygroscopic mode can be associated with a variety of other aerosol sources such as particles transported from inland sources which include peat combustion, traffic and industrial emission sources (Ovadnevaite et al., 2011b; Taylor et al., 2016) for MHD, or industrial or biomass burning pollution plumes in the Arctic (Lathem et al., 2013). In the Mediterranean environment the distribution is not bimodal, although it exhibits a small plateau for slightly more hygroscopic particles around 100 nm, while the majority of particles are on average less hygroscopic (high Dcrit occurrence at 180 nm) than in the other coastal areas. This might be due to European pollution outflow and biomass burning plumes (Bougiatioti et al., 2016). At NOT – despite the influence of two distinct sources, marine aerosol and long-range transported anthropogenic pollution (Iwamoto et al., 2016) – only a mono-modal distribution of Dcrit is found (peak at 90 nm). This is likely due to the dominant wind direction from the west. Particles from different sources are hence continuously mixed and low-volatility gaseous components condense on all types of particles, which results in a mono-modal size distribution. This is different from MHD and BRW where different wind directions advect aerosol from different sources. At most other locations, the distributions of Dcrit are relatively narrow and centred around or are slightly larger than 100 nm for SS = 0.2 %, except for JFJ. Here, a second mode around 150 nm is also found, most likely originating from boundary layer air mass injections in summer, as the seasonal cycle of Dcrit suggests in Fig. 4c. Investigation of diurnal cycles clearly shows that aerosol hygroscopicity decreases with boundary layer air mass injections due to changes in aerosol chemical composition (Jurányi et al., 2011; Kammermann et al., 2010a). Note that the second mode is likely over-weighted in Fig. 3c because there are more summers than winter seasons in the data set. In Fig. 4 monthly data were averaged and are hence equally weighted.
The seasonal cycles of CCN0.2 number concentration, Dg, and Dcrit show characteristic differences between the locations (Fig. 4). As mentioned above, boundary layer air masses are uplifted in summer at JFJ, which is evident from the enhanced CCN number concentration, a median of 240 cm−3 compared to about 20 cm−3 in winter (compare also with Jurányi et al., 2011) and the total particle number concentration (see Sect. S3 for all stations). At the same time, particles are larger (Dg about 75 nm in summer versus 50 nm in winter; Fig. 4b), but less hygroscopic (Dcrit > 100 nm versus < 100 nm; Fig. 4c). A similar seasonal cycle exists at PUY, although less pronounced, likely due to its lower elevation. Both forest environments also show seasonal cycles. In the boreal forest (SMR), CCN0.2 number concentrations in spring and autumn are lower (200 cm−3) than in summer (430 cm−3) and also in winter even though the total particle number concentration is lower in winter than in the transition seasons (see Sect. S3). The low CCN0.2 number concentrations in spring and autumn coincide with smaller particle sizes. In spring and autumn, new particle formation events contribute substantially to the particle number concentration (Dal Maso et al., 2005). Those newly formed particles stay smaller than during summer because there are less VOC oxidation products available that would condense on the particles. However, these particles still have a rather high organic mass fraction, which makes them less hygroscopic. Thus, the CCN0.2 and particle number concentrations are smaller in spring and autumn compared to the summer (Paramonov et al., 2013; Petäjä et al., 2005). Note that while we refer to CCN at a supersaturation of 0.2 %, small particles could contribute to the CCN number concentration at higher supersaturations in which case the lower concentrations in spring and autumn might not be as apparent. During summer, particles are larger on average with a Dg of 70 nm, but have a similar hygroscopicity (Dcrit around 110 nm) to the spring and autumn particles (Dcrit around 100 nm) owing to the larger fraction of organic aerosol components (compare Fig. 7). Nevertheless, more CCN0.2 can be observed due to an increase in the overall particle number concentration likely owing to high pressure periods in which air masses from the south arrive carrying aged anthropogenic and biogenic particles. In the rain forest (ATT), concentrations are low during the rainy season (< 500 cm−3) early in the year when natural aerosol sources dominate (China et al., 2016; Pöhlker et al., 2012; Wang et al., 2016) and higher during the dry season (> 500 cm−3) as a result of in-basin transport of emissions from deforestation fires (Pöhlker et al., 2016). In the rainy season, the biogenic (natural) particles are also smaller (Dg of 90 nm versus 130 nm in the dry season) and seem to be more hygroscopic, with a Dcrit of about 100 nm. Seoul (SEO) is subject to monsoon influence in summer (June through September). However, in the urban environment the impact of the rainy season is not clearly visible, neither in the CCN0.2 number concentration nor in the average particle size. This is likely due to the continuous emission of particles from urban sources. The variations of Dcrit, < 100 nm in winter and > 100 nm in summer, seem to suggest that aerosol particles are more hygroscopic in winter than in summer, potentially due to changes in emission sources. At BRW, the influence of Arctic haze (Barrie, 1986) is evident from roughly a factor of 5 higher CCN0.2 number concentrations in late winter and spring with concentrations around 100 cm−3. Also at FIK, the seasonal cycle is characterized by pollution events occurring in summer (CCN0.2 > 500 cm−3), which are associated with long-range transport of biomass burning aerosol containing larger size particles and the absence of precipitation (Bougiatioti et al., 2016). The coastal sites at the Atlantic (MHD) and Pacific (NOT) show relatively large variability in all measured parameters without exhibiting a distinct seasonal cycle. At MHD particles tend to be smaller in summer (Dg around 70 nm). In summer, sea salt contributes less to the MHD aerosol particle population, which results in a smaller Dg. More sea spray in winter, because of higher wind speeds and wave breaking, explains the smaller Dcrit (70 nm versus 80 nm in summer) in that season (Yoon et al., 2007). At NOT, CCN0.2 number concentrations seem to be lower in winter (< 1000 cm−3) compared to other seasons (> 1000 cm−3). This might be related to convection, cloud and precipitation formation, and hence wet particle removal, induced by the interplay of the cold winter monsoon and the warm currents at the ocean surface. The rural and continental background stations in Europe all show relatively flat seasonal cycles.
While the seasonal cycles inform how aerosol particle properties change over longer timescales, i.e. months, auto-correlation of the hourly CCN0.2 number concentration time series can provide insights into the variability over shorter (synoptic) timescales, i.e. days. Figure 5 shows the persistence of CCN0.2 number concentrations for winter (DJF) and summer (JJA). The persistence is essentially a metric for how long the pattern of CCN number concentrations “remains similar” (see Sect. 2.3.1). This does not exclude periodic variations on shorter timescales, such as diurnal cycle or simply an unvaried number concentration cycle, but the observed persistence as long as the amplitude of the periodic variations and the averages over the cycles remain similar. At MEL, CES and SMR, for example, the winter persistence is larger than 5 days, which is most likely related to the relatively stable weather patterns in winter when atmospheric blocking situations occur, which are anti-cyclonic, quasi-stationary high-pressure systems persisting for several days up to weeks that disturb the otherwise predominant westerly flow (Sillmann and Croci-Maspoli, 2009). Conversely, in summer, persistence is only 2 days for MEL and CES likely reflecting a combination of the much more variable weather conditions and genuine changes in aerosol particle characteristics due to short- and medium-range transport, as well as intermittent new particle formation events (Manninen et al., 2010). Also, the amplitude of the boundary layer height between night and day is quite large introducing differences in particle concentrations due to dilution effects. At the mountain stations, the persistence is longer in summer. It is driven by the regularity of the boundary layer injections and the resulting high particle number concentrations (Herrmann et al., 2015). It has to be noted that, in this case, the high persistence is an indication of a regular pattern rather than a constant CCN0.2 number concentration. In the rain forest, the rainy season is characterized by a longer persistence (7.5 days) than the dry season (2 days) potentially owing to the regular rain events, i.e. similar to the boundary layer injections at the mountain stations. FIK shows higher persistence during summer (5 days) than winter (< 3 days), while the opposite is the case for all other coastal stations. At FIK weather patterns are stable in summer and air masses originate from the N-NE sector for more than 80 % of the time (Kouvarakis et al., 2000). For VAV the longer persistence in summer (4.5 versus 2 days) as represented in this data set might reflect a peculiarity of the particular observation period. Generally, similar to SMR, CES and MEL, more stable conditions in winter are expected. The long persistence in winter at BRW (5.7 days) reflects the stable Arctic atmosphere which gets perturbed during spring and summer, when the Arctic haze conditions fade. Note, since there was not enough data coverage for BRW in the summer months, springtime (M, A) is shown. Persistence is low in SEO (1.2 days) and there is virtually no difference between seasons, likely due to the station's vicinity to emission sources that drive variability rather than synoptic patterns.
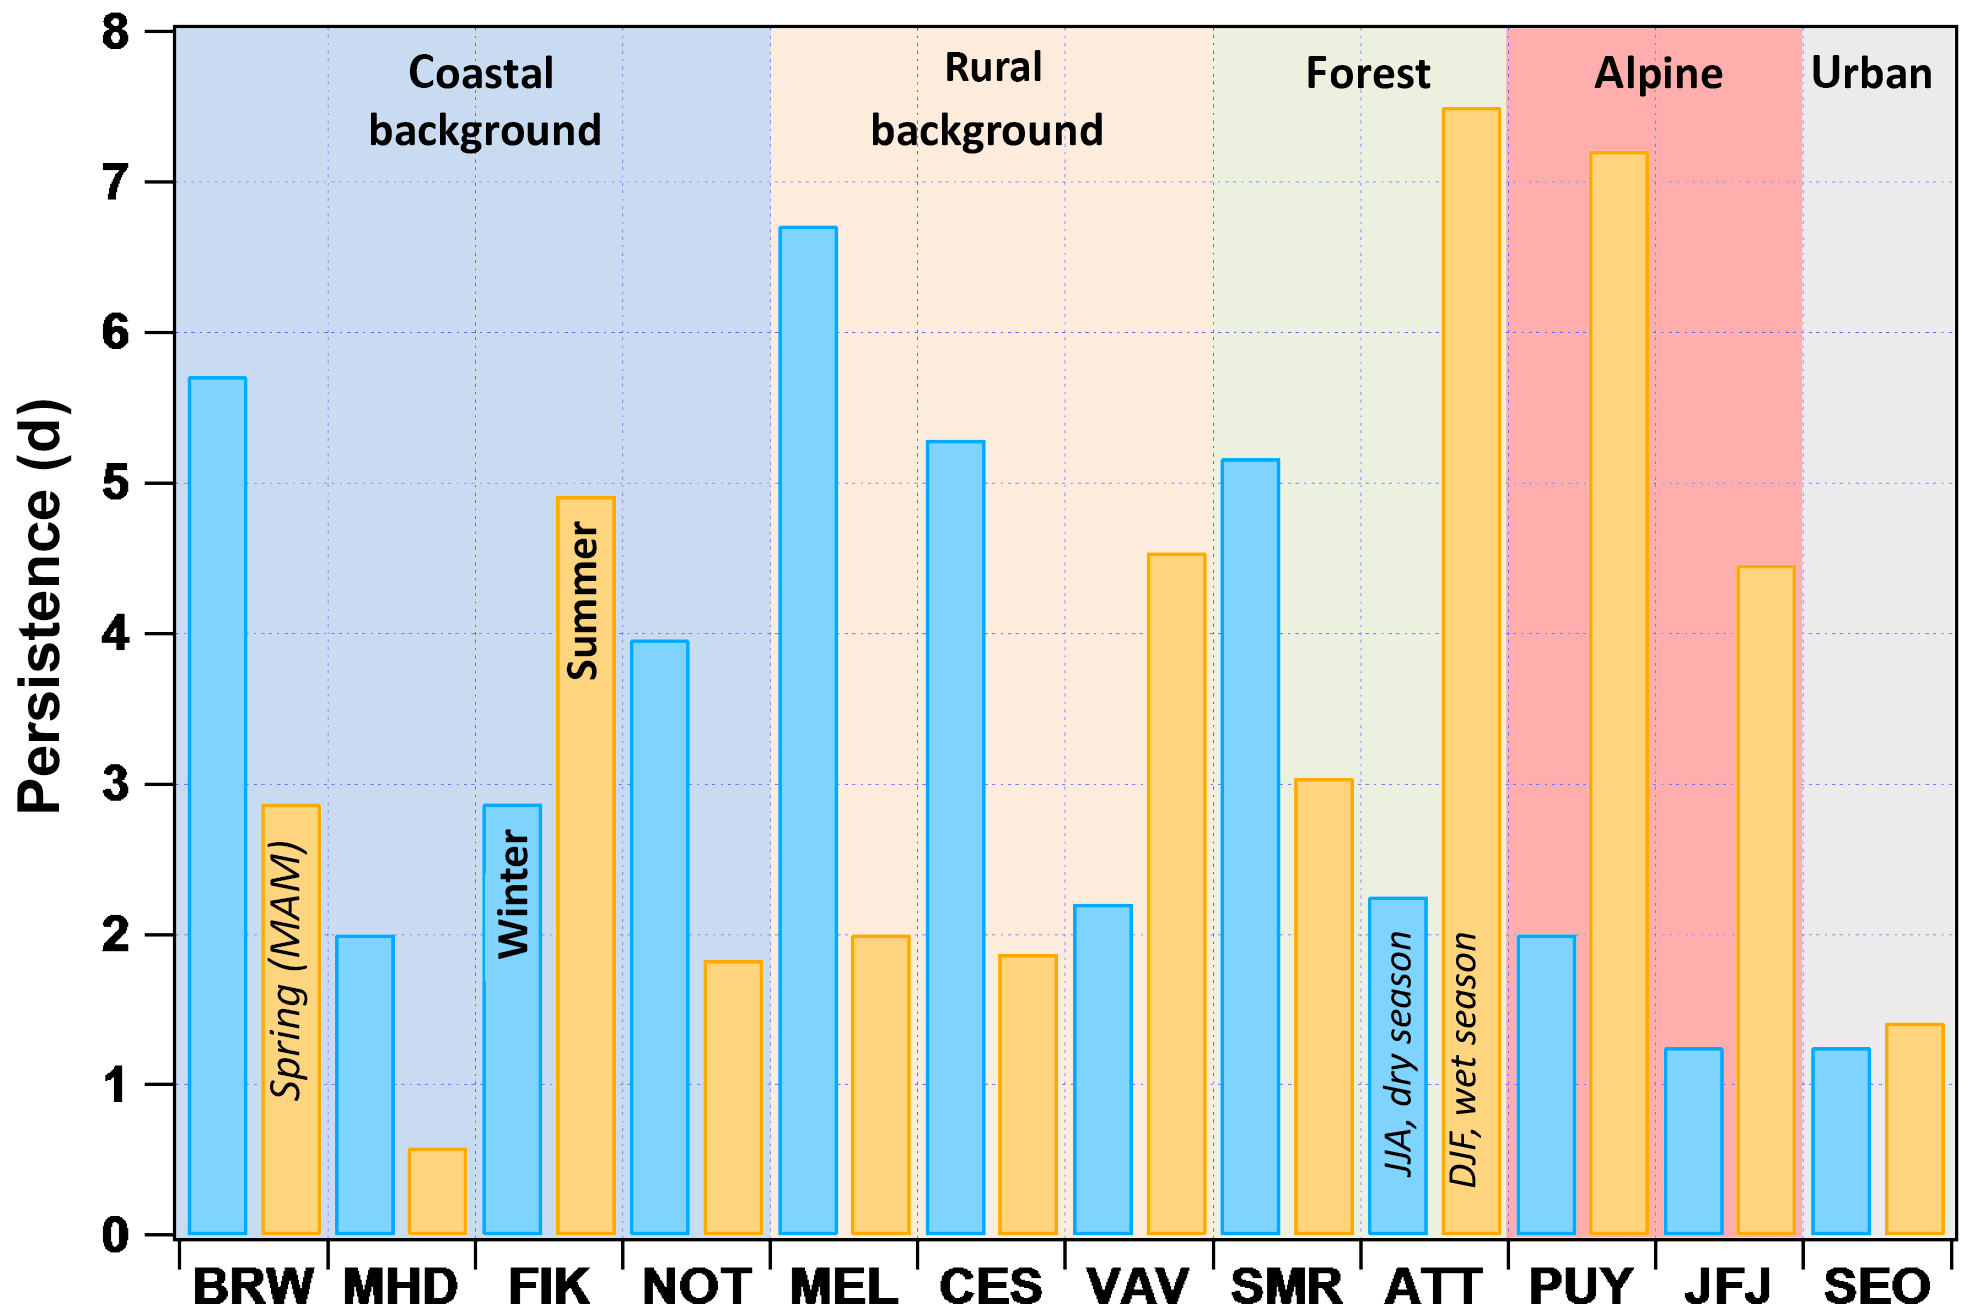
Figure 5Persistence of CCN number concentrations at SS = 0.2 % in days for winter (DJF) and summer (JJA). Note that for BRW there were not sufficient data during summer, so spring values are shown, and since ATTO is located in the tropics, wet and dry seasons are different as indicated.
3.2 Activation
To compare the activation behaviour of particles at all sites, we calculated the activation ratio (AR) for each measured SS based on the particle number size distribution > 20 nm. Further, to explore how the AR changes with SS, we form the ratio of AR at each SS (ARx) to AR at SS = 0.5 % (AR0.5). If CCN number concentrations were not measured at SS = 0.5 % the value was linearly interpolated. Results are shown in Fig. 6. Figure 6a shows all non-coastal sites, and Fig. 6b the coastal sites. The dashed black line represents a logarithmic fit through all curves following Eq. (6):
with A = 0.46 ± 0.02 and b = 1.31 ± 0.02. A steep slope means that the aerosol particle population activation is sensitive to small changes in the SS, while a flat slope indicates that a further increase in SS would not have a large impact on the AR. The curves in Fig. 6a suggest that particles at all non-coastal sites, except for the rain forest location, have comparable activation properties with changing SS. This reflects the results shown in Fig. 3. These sites have similar ranges for the critical and geometric mean diameters. When fitting the average of the non-coastal curves, A would be 0.54 ± 0.01 and b = 1.41 ± 0.01. Particles observed in the rain forest follow the general non-coastal curve up to SS = 0.5 %. Thereafter, the curve flattens, meaning that the aerosol particle population is rather insensitive to higher SS and that most particles activate at SS ≤ 0.5 %. The frequency distribution of Dg at ATTO (Fig. 3b) suggests that most particles are larger than 100 nm which will already activate at supersaturations lower than SS = 0.5 %. Regarding the lower activation ratio at higher SS, Pöhlker et al. (2016) link it to the influence of nearby biomass burning emissions and hence smaller less hygroscopic particles. Also, previous studies (e.g. Gunthe et al., 2009) confirmed this finding by showing that particles with an electrical mobility diameter < 90 nm are less hygroscopic than larger particles, owing to the difference in composition. The mass fraction of inorganic constituents is higher in larger particles.
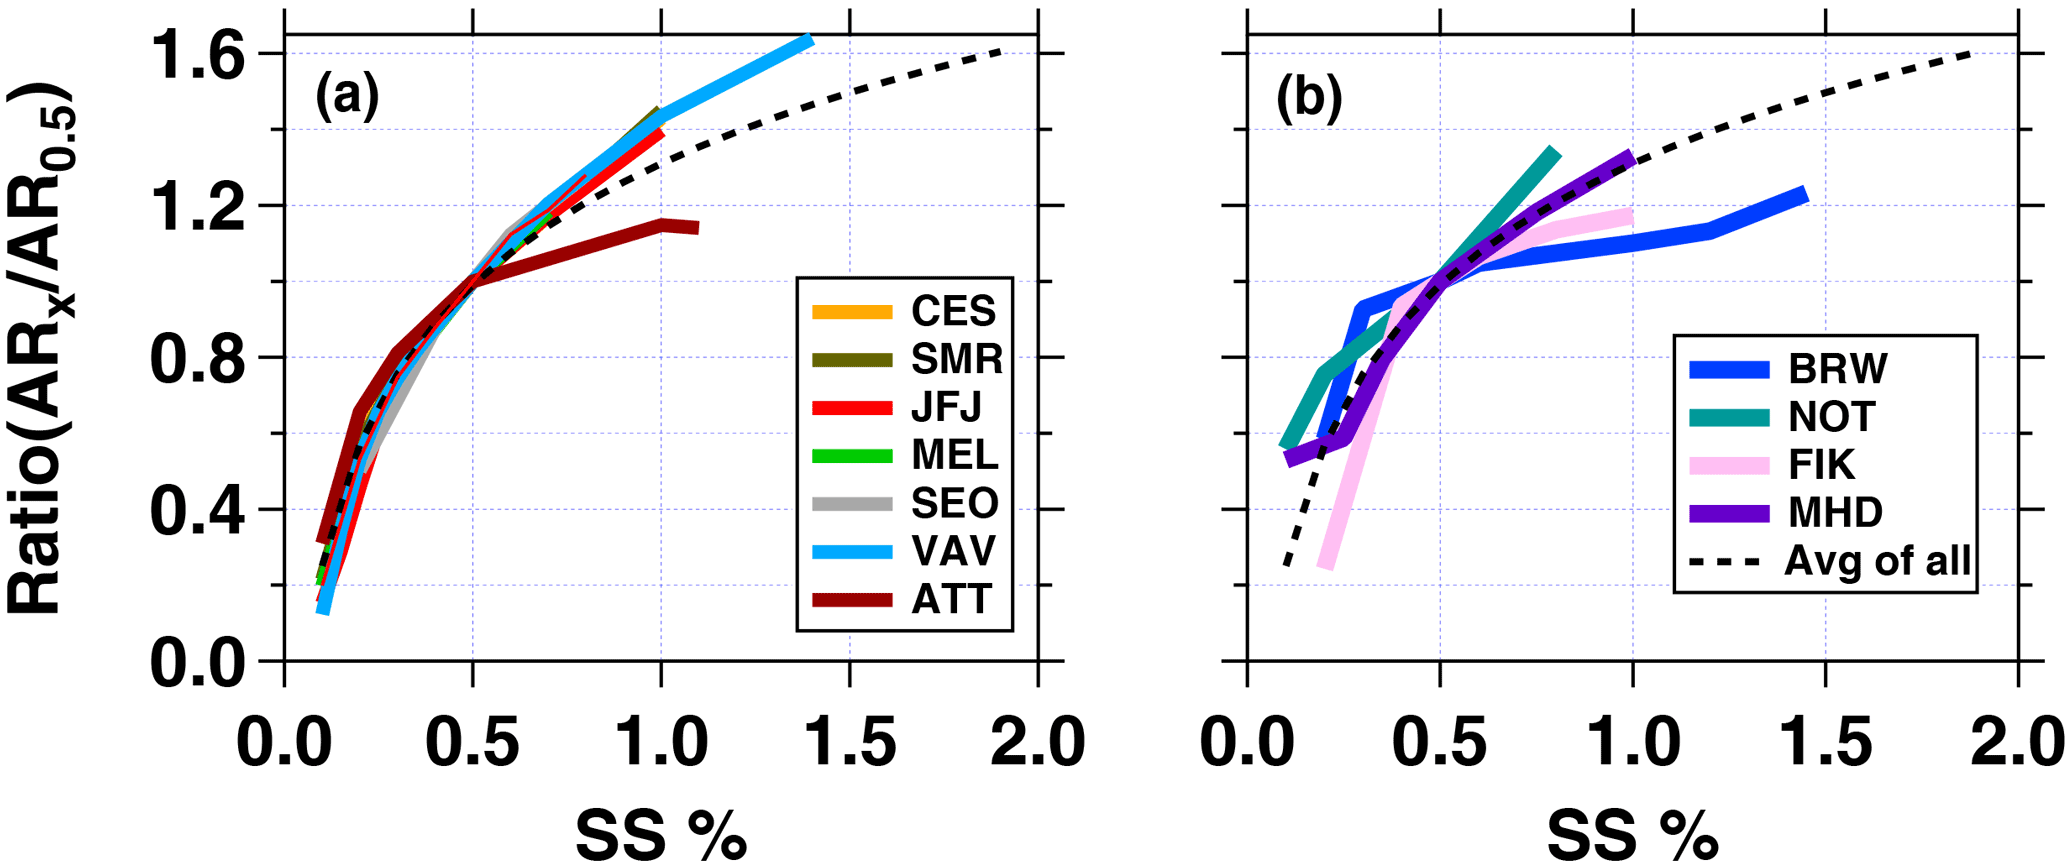
Figure 6Ratio of activation ratios for all measured SS (%) over the activation ratio at 0.5 % SS for each station. At SS = 0.5 % (x-axis) the ratio is 1. Activation ratios are based on particle size distributions starting at 20 nm. (a) Shows non-coastal sites, while (b) groups all coastal sites. The black dotted line is the average fit through all curves from (a) and (b), whereby y = A ⋅ ln(SS %) + b with A = 0.46 ± 0.02 and b = 1.31 ± 0.02.
The curves for the coastal sites exhibit more spread at both low and high SS (compare also Fig. 3). In the Arctic (BRW), for example, the curve suggests that most particles activate already at SS ≤ 0.3 %, which is in line with the measured large particles sizes and the observation that Arctic background aerosol particles are generally highly hygroscopic (Lathem et al., 2013). A similar observation is true for the Mediterranean environment. The observed activation behaviour at MHD follows the average from all curves (dashed line) while particles at NOT are still sensitive to higher SS, similar to the “land-based” observations. This is most likely due to the influence from long-range transported anthropogenic air pollution at the site.
Overall it seems that at the coastal sites, the mixing between anthropogenic and natural (marine) sources leads to a complex behaviour of particle activation. Conversely, at continental sites the natural (biogenic) sources lead to size-distributions and hygroscopic characteristics that are comparable to the anthropogenic ones. For instance, new particle formation events supply ultrafine particles in place of combustion particles. As a consequence, very different places like JFJ, SMR, CES, MEL and SEO show similar geometric mean diameters and hence similar particle activation curves. For further details regarding the seasonal cycles of AR we refer the reader to Sect. S3.
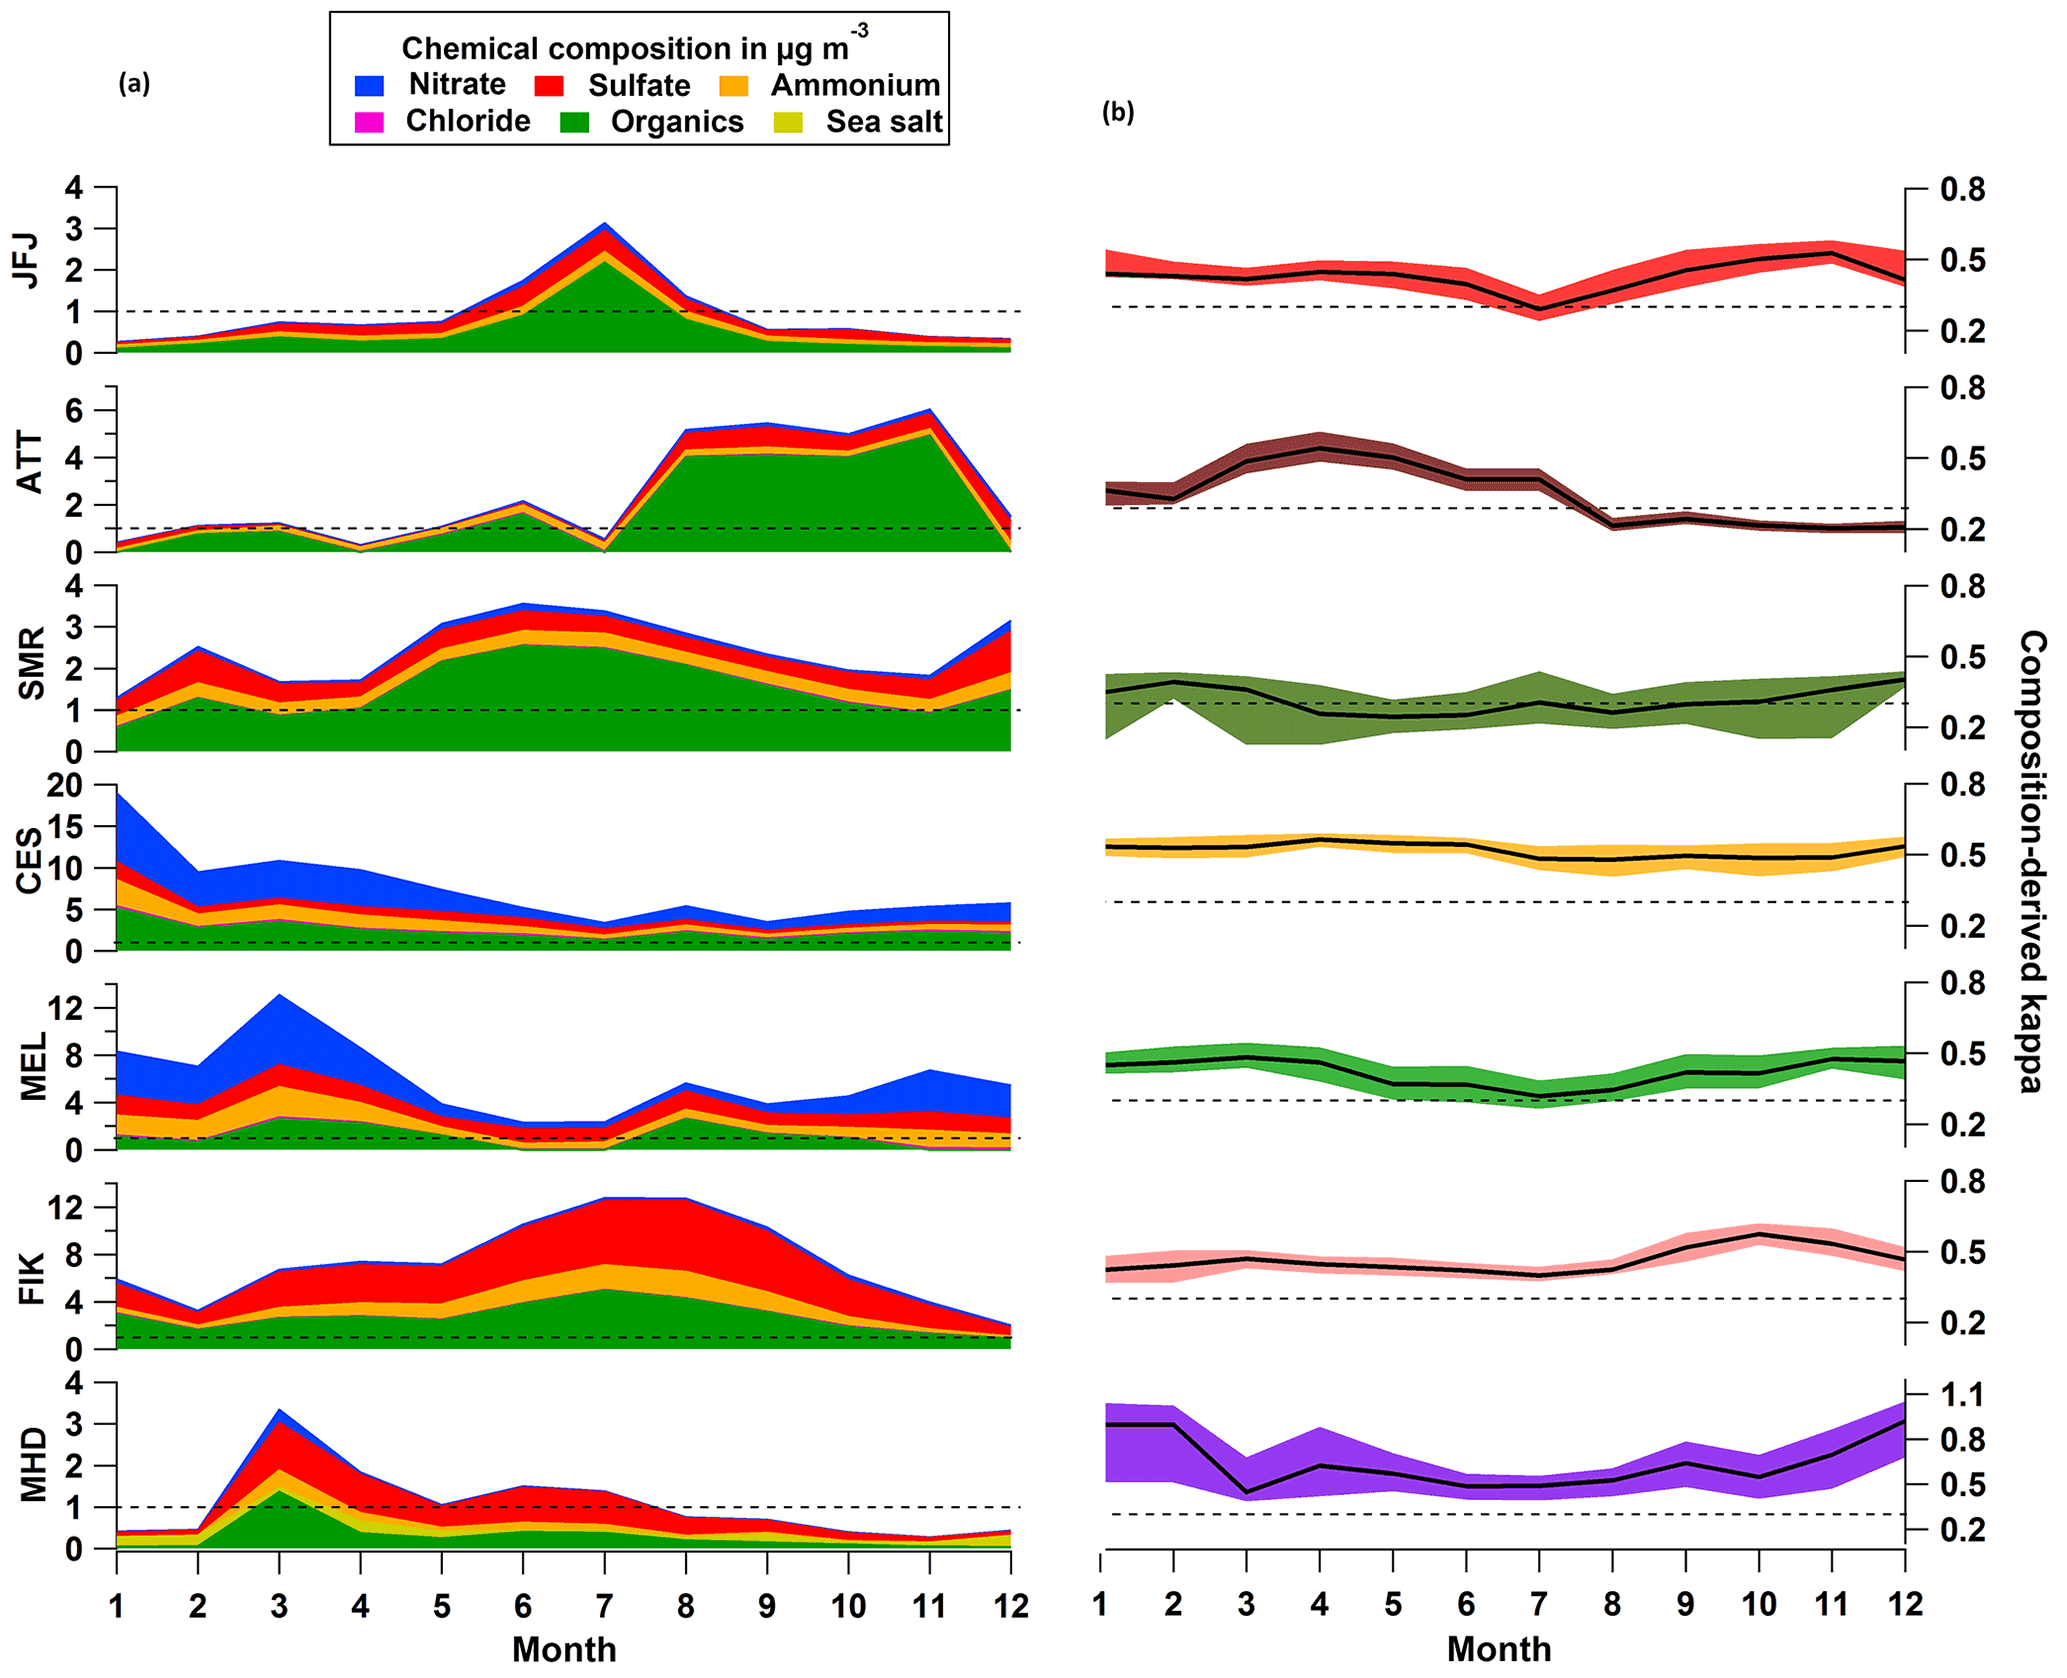
Figure 7(a) Monthly median chemical composition as measured by each station's mass spectrometer (see Table 1 for details on the type of spectrometer). The horizontal dashed line is placed at 1 µg m−3 for easy comparison of mass concentrations between stations. (b) Median (black line) and interquartile range of composition-derived κ values per month. The dashed black line is located at κ = 0.3. Note, we do not show monthly BC concentrations where available here, because the displayed κ values are based only on the mass spectrometric data.
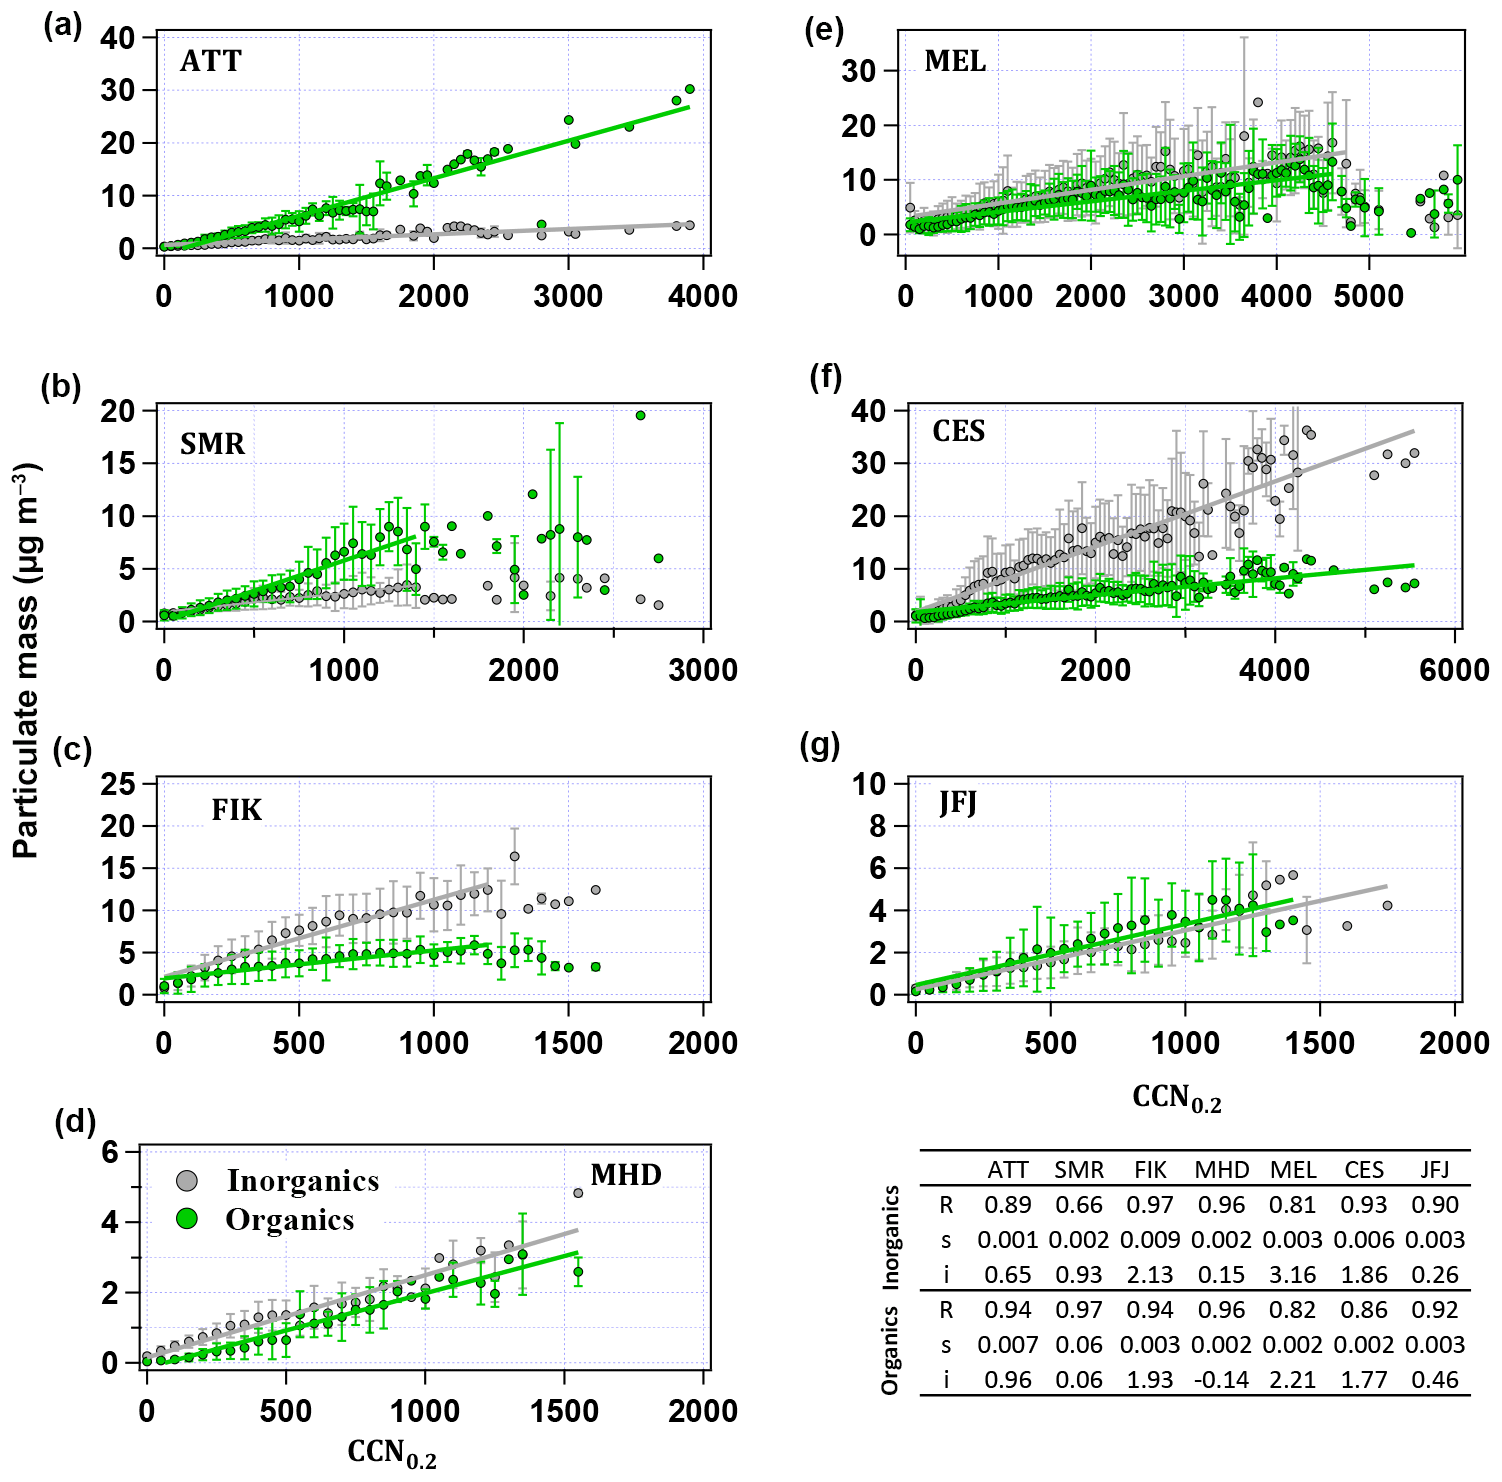
Figure 8Binned averages and standard deviations of inorganic and organic particle mass concentrations versus CCN0.2. The mass concentrations are averaged over bins of 50 particles cm−3. Green and grey lines are linear fits through the points with all parameters given in each panel. The table provides the linear regression data: R stands for correlation coefficient, s for slope and i for intercept.
3.3 Aerosol chemical composition and the composition-derived hygroscopicity parameter κ
At seven stations, the aerosol particle chemical composition was measured by means of different types of aerosol mass spectrometers (see Table 1 for details). Figure 7 shows the seasonal cycle of inorganic and organic median mass concentrations on the left, and the evolution of κ on the right throughout the year as median value and interquartile range. At most stations, nitrate plays a minor role except for the rural background stations CES and MEL, where it especially contributes during the colder months with up to 40 %. These two stations are closest to the central European high-NOx region (Beirle et al., 2004). The mass fraction of organics is mostly below 50 % at the two sites, and the hygroscopicity of the particles appears to be driven by the inorganic components, predominantly by ammonium nitrate. The larger the fractional contribution of nitrate (), the higher κ becomes: at CES κ ≥ 0.83 × + 0.11 and at MEL κ ≥ 0.82 × + 0.12 (not shown). Note that especially for the European sites, it might be possible that a considerable fraction of nitrate is present in the form of organic nitrate (Kiendler-Scharr et al., 2016), which is likely to influence the hygroscopicity. Similarly, particulate sulfate can be present as organosulfate (Vogel et al., 2016) in which case particle hygroscopicity would be overestimated. At all other stations, organics can play a more important role in terms of mass contribution (up to 80 % at SMR, ATTO and JFJ, and up to 40 % at MHD and FIK) and determination of the κ value. In the boreal forest, organics constitute the largest mass fraction throughout the year and especially during summer. In this season, the boreal forest is actively growing and producing more VOCs, whose oxidation products either condense on pre-existing particles or contribute to new particle formation events. Organic matter can dominate the particle composition, especially in the absence of long-range transport of other chemical constituents. In the rain forest (ATT), organic matter also dominates, contributing some 60–70 % to PM1 throughout the year. Therefore, some of the observed hygroscopicity changes can be associated with differences in organic aerosol composition (i.e. its oxidation state), rather than differences in inorganic/organic fractions. At the high alpine site (JFJ) the influence of organic matter (up to 70 % mass contribution) becomes most important in summer because of boundary layer air mass uplift, and again the impact on the calculated κ is evident. At the coastal sites in the Mediterranean (FIK) and Atlantic (MHD), the non-refractory submicron aerosol particle mass is driven by inorganic components, predominantly sulfate (mass contribution of up to 50 %). However, increased organic particle mass is observed during the biomass burning season at FIK with 40 % mass contribution (Bougiatioti et al., 2016), when κ reaches a minimum, and in springtime at MHD (also 40 %), as has been observed previously (Ovadnevaite et al., 2014). At MHD, κ is generally > 0.5 owing to the influence of sea salt, but at the same time is also very variable (0.45 to 0.92 in the monthly median) owing to the mixed influences of marine organic aerosol and anthropogenic air pollution.
Figure 8 provides a further indication of how the CCN number concentration is related to the aerosol particle mass and chemical composition. Binned averages and standard deviations of inorganic (ammonium, nitrate, sulfate, chloride and sea salt) and organic particle mass are shown against CCN0.2 number concentrations. Bins represent 50 particles cm−3. The solid lines are the linear fits through inorganic and organic mass concentration data with all parameters indicated in the table. Generally, the correlation between particle mass and CCN0.2 number concentration is high and similar for organic and inorganic components (R > 0.81 for all cases except for inorganics at SMR where R = 0.66). The similarity might be an indication for internally mixed particles or the co-existence of different particle types at the observatories. At CES, the CCN number concentration is more strongly influenced by the inorganic aerosol particle mass, as can be concluded from the higher correlation coefficient compared to the one of CCN0.2 number concentration and organic particle mass (R = 0.93 versus 0.86). At FIK, the correlation coefficient with inorganics is only slightly higher (0.97 versus 0.94), while at MEL, MHD and JFJ they are roughly equal. This relates to the average over the whole year, while seasonally there can be significant differences, as Fig. 7 shows. In the forest environments, correlations of CCN number concentrations with organic particle mass are higher than for inorganic particle mass (0.94 versus 0.89 at ATTO, and 0.97 versus 0.66 at SMR). From this perspective, it is clear that knowing the share of organic particle mass is important for understanding the activation behaviour of the specific particle population at each site.
A negative relationship of the composition-derived value and the ratio of organic to inorganic particle mass can be observed as shown in Fig. 9. Generally, the curve follows a two-component system that can be described by Eq. (2), with i standing for the inorganic and organic aerosol components. The figure indicates how well κ can be described when knowing the organic to inorganic aerosol ratio. The spread in κ values between locations, especially at lower ratios, is due to the heterogeneity in the composition of the inorganic particle components. For example, at CES and MEL ammonium nitrate constitutes a large fraction of the inorganic aerosol mass, while at ATT and SMR particulate sulfate such as salt or acid dominates. However, the vertical distance in the lines for ATT and SMR shows that it makes a significant difference whether sulfate is present as sulfuric acid (κ = 0.73) or as ammonium sulfate (κ = 0.6). For SMR, similar observations have been made investigating the relationship of the organics-to-sulfate ratio to the GFs for certain particle sizes (Hong et al., 2014). For higher ratios, κ values from all stations converge when assuming one single hygroscopicity for OA, i.e. κorg = 0.1, because κorg starts to dominate the result. Note that the asymptotic-like approach of the curves towards a certain κ value cannot be interpreted as κorg > 0.1 for that reason.
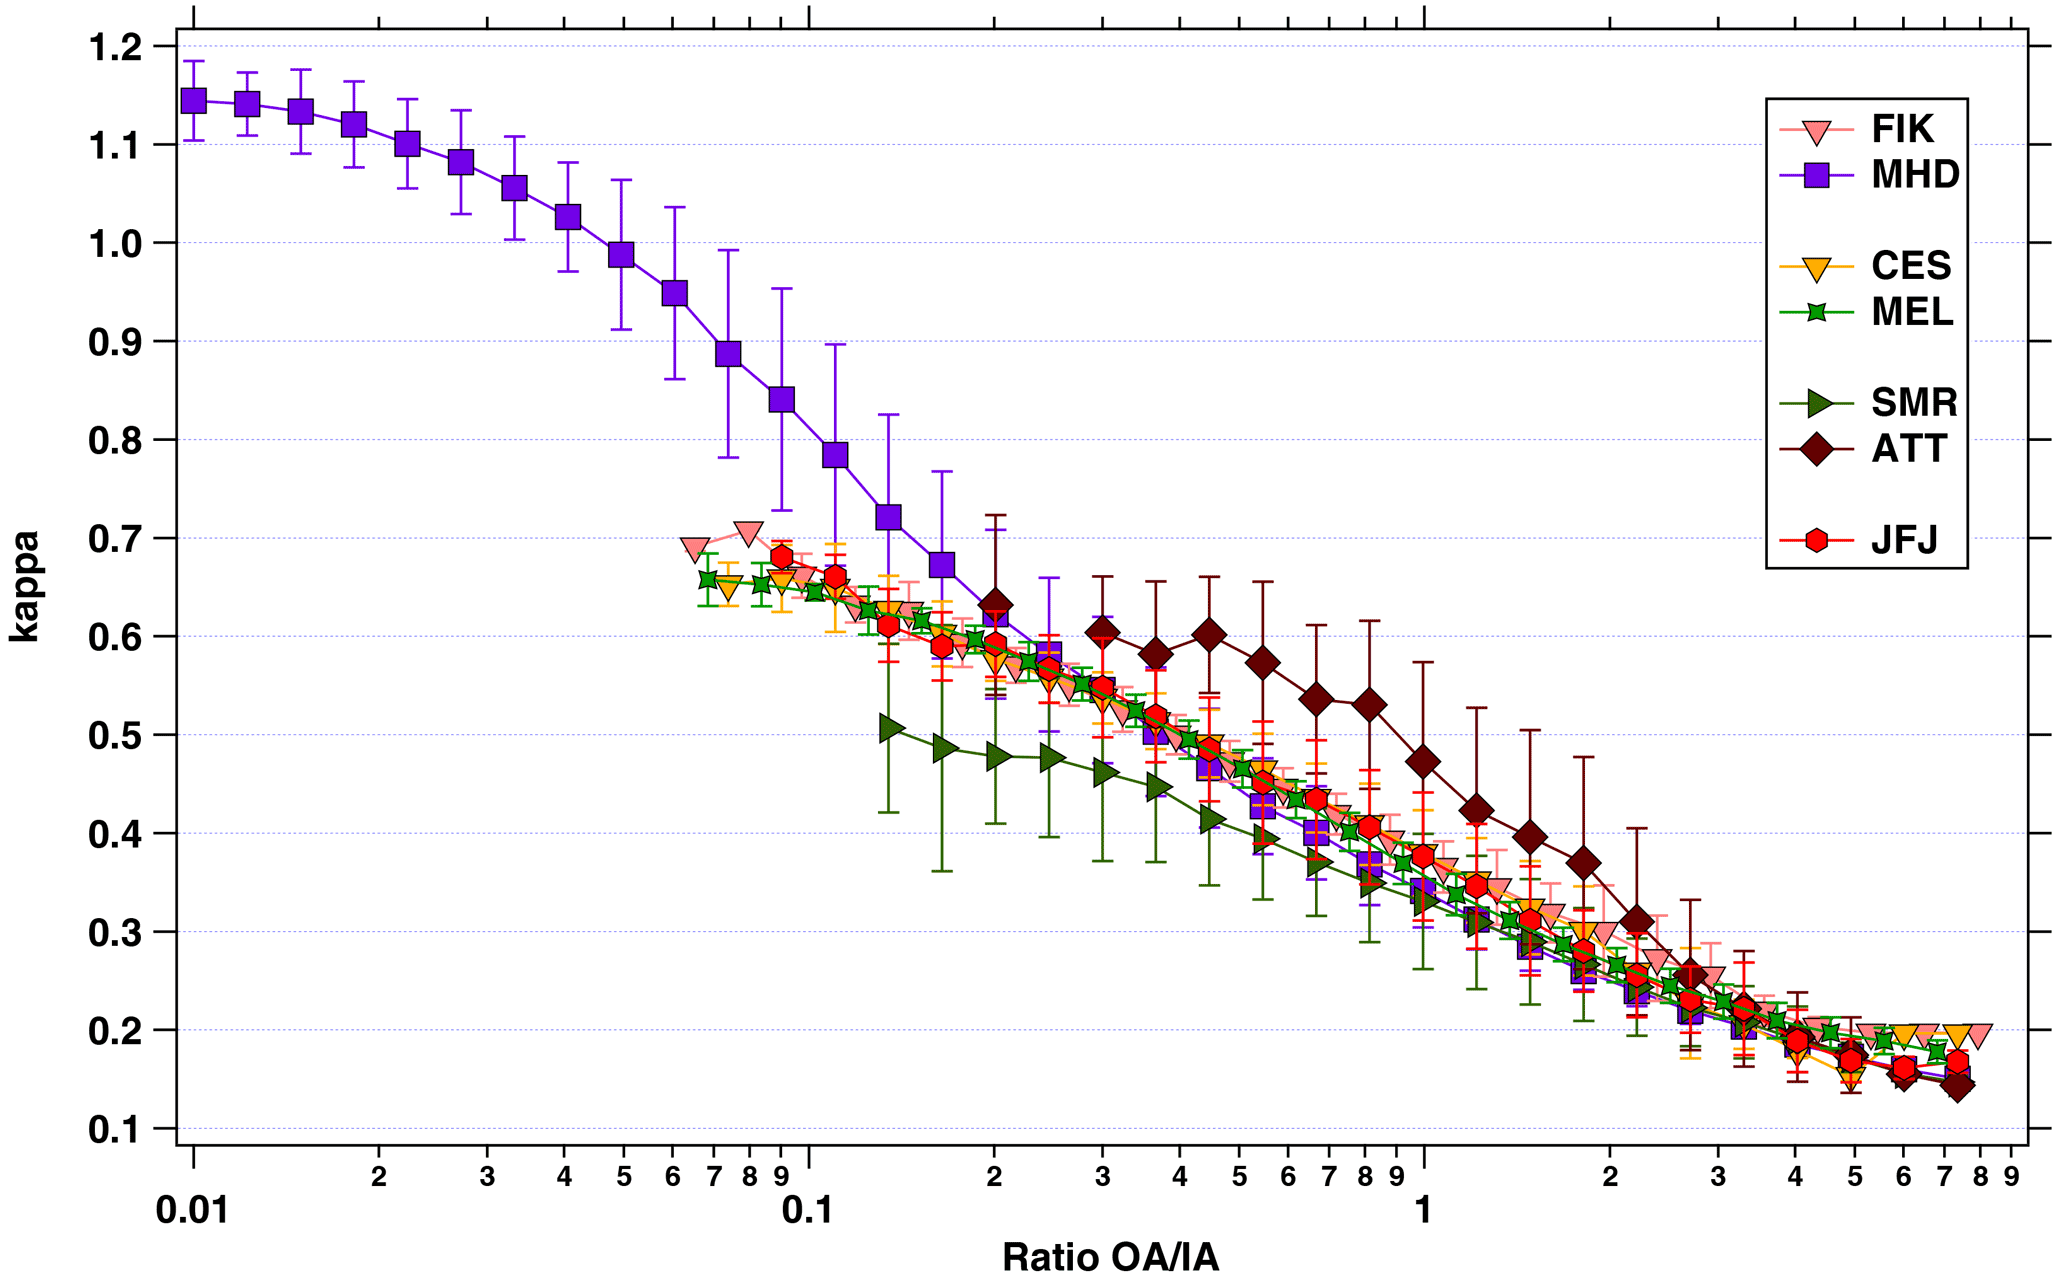
Figure 9Relationship of the composition-derived hygroscopicity parameter, κ, to the binned and averaged ratio of organic (OA) to inorganic (IA) aerosol components. The vertical bars denote the standard deviation. Note that the asymptotic-like approach of the curves towards a κ value higher than 0.1 cannot be interpreted as κ being larger than 0.1 for these sites, because κ = 0.1 was used as assumption to derive the κ values shown on the y-axis. Note that the standard deviation for the lowest OA ∕ IA ratios at FIK are so small that they do not go beyond the symbol.
3.4 Closure study
Achieving closure between measured and predicted CCN number concentrations has been tried in a large number of studies reflecting conditions in a variety of environments such as cities, high alpine stations, and boreal, tropical and mid-latitude forests etc. (e.g. Almeida et al., 2014; Asmi et al., 2012; Hong et al., 2014; Jurányi et al., 2010; Kammermann et al., 2010b; Pöhlker et al., 2016; Wu et al., 2013). Most of these studies, however, rely on relatively short data sets from days to several weeks at most. Ervens et al. (2010) present an overview of closure studies from six different sites and an extensive comparison with other studies discussing the influence of the particles' mixing state and the hygroscopicity of the organic fraction, as well as the distance from emission sources. Generally, they find that ratios of predicted over measured CCN number concentrations can range from 0.2 to 7.9, with results further away from emission sources becoming more reliable. This observation has been confirmed, for example, by closure studies at the high alpine sites, which are relatively far away from emission sources (Asmi et al., 2012; Jurányi et al., 2010). However, other studies suggest that poor performance of closure studies near sources can likely be attributed to difficulties in measuring the relevant aerosol properties with sufficient resolution in time and at relevant particle sizes, rather than to intrinsic limitations of the applied κ–Köhler theory (Jurányi et al., 2013). Ervens et al. (2010) suggest that organic particle matter can be treated as hygroscopic (they use κorg = 0.12) a few tens of kilometres downwind from emission sources. With this κorg value and varied assumptions about aerosol particle hygroscopicity and state of mixing – that can lead to similar results due to compensating effects – reasonable closure within a factor of 2 can be achieved, even though the true nature of the aerosol particle population is not known. Jurányi et al. (2010) also show that uncertainties in the bulk κ value can lead to only a factor of 2 difference between measurement and prediction at low SS and even less at high SS. Larger discrepancies hence suggest that either the classical κ–Köhler theory does not hold (e.g. because of the particles' surface tension, Ovadnevaite et al., 2017; kinetic limitations; or other reasons) or, which is mostly the case, that there are issues with the measured data of particle number concentration, size distribution and CCN number concentrations (see Sect. S2).
Based on these previous results and the fact that all stations with available chemical composition data are at least 20 km away from large emission sources, we performed simple closure studies assuming internal mixtures and a κorg value of 0.1. We focus on the long-term performance of the instruments that were run in monitoring mode, implying less attendance than during intensive field campaigns, and the sensitivity of the results to changes in the following assumptions:
-
varying the approach to translate composition measurements to κ values as given in Table 2,
-
applying a fixed shape of the particle number size distribution (the average of the entire data set) while keeping the total number concentration of particles temporally variable as measured and applying and
-
applying the temporally variable particle number size distribution, but scaled to the median particle number concentration as measured at each station with .
This approach is similar to the one shown by Jurányi et al. (2010) in their Fig. 6, focusing on a 1 month data set at JFJ. Within this study, however, closure performance of seven stations over at least one year can be compared.
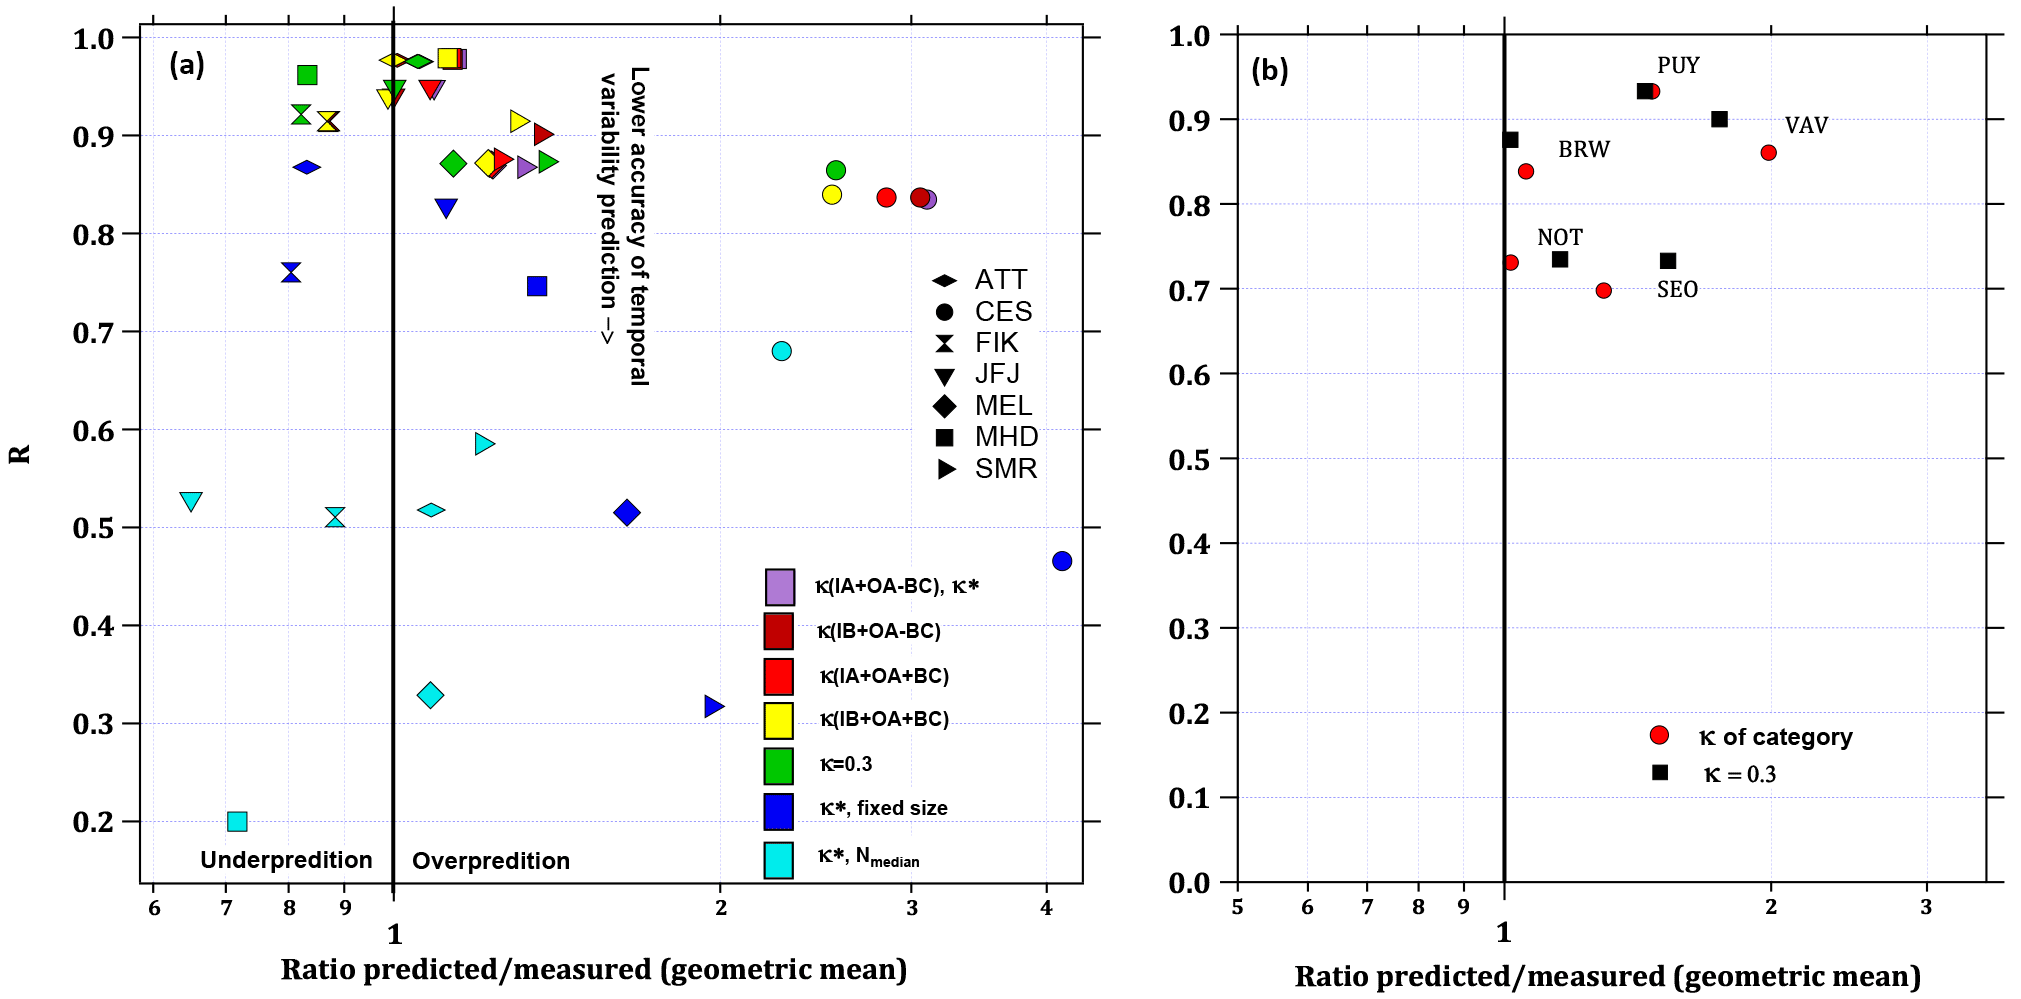
Figure 10(a) Results from closure studies for the seven stations with aerosol chemical composition data. The coefficient of the correlation between predicted to measured CCN number concentration at SS = 0.5 % is shown in the vertical axis while the geometric mean of the ratio of predicted and measured CCN number concentration is given on the horizontal axis. The different marker symbols represent the stations while the colours indicate details of the closure study. Kappa values refer to how the hygroscopicity parameter was calculated as described in Sect. 2.3.2 and as listed in Table 2. “Fixed size” refers to closure studies where the fixed average shape of all size distributions from the data set was applied while keeping the temporally variable particle number concentrations as measured at each station. “Nmedian” means that closure studies were performed fixing the particle number concentration at each station to its median value while keeping the temporally variable shape of the size distribution. (b) Closure results for all stations without chemical composition data using κ = 0.3 and an average kappa per site category – VAV: rural background, κ = 0.48; PUY: alpine, κ = 0.41 (e.g. JFJ); BRW and NOT: coastal background, κ = 0.55; SEO: urban, κ = 0.1.
Table 3Comparison of geometric to arithmetic mean values of the ratios of predicted and measured CCN0.5 number concentrations based on calculations with the composition-derived .
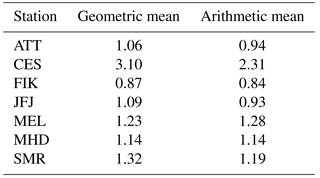
The results are shown in Fig. 10a for SS = 0.5 % with the correlation coefficient of predicted over measured particle number concentrations on the vertical axis and the geometric mean of the particle number concentration ratio on the horizontal axis. We use the geometric instead of the arithmetic mean, because particle and CCN number concentrations are log-normally distributed. This can result in slightly different mean values compared to the arithmetic mean, which has been used more frequently in previous studies (e.g. Ervens et al., 2010). Table 3 provides a comparison of both means. The correlation coefficient is a measure of the agreement between instruments over time, i.e. the stability of instrumental performance. The ratio of the predicted and measured CCN0.5 number concentrations indicates the quality of the average prediction with 1 being a perfect prediction and numbers < 1 (> 1) being an under- (over-)prediction. Looking only at closure results with and , predictions fall within a range of ratios between 0.87 and 1.37, which qualifies as a rather good agreement compared to the findings in the overview by Ervens et al. (2010), but reflect a similar range of results as described by Kammermann et al. (2010b) based on hygroscopicity tandem DMA studies. Values for the correlation coefficient R fall between 0.87 and 0.98, i.e. the accuracy of predicting temporal variability is high. This means that for this particular selection of stations, only the average bulk hygroscopicity of the particles needs to be known to obtain a realistic estimate of the CCN number concentration. Data for the CES observatory are located in the area of over-prediction between a factor of 2.5 and 3.1 due to losses of small particles in the aerosol sampled by the CCNC (see Sects. 2.2 and S1 for more details). Results are shown nevertheless for completeness. Including BC concentrations in the calculation of κ has a limited influence on the overall closure performance, not enlarging the range of predicted versus measured data. This means that for long-term observations, neglecting the BC mass concentrations has only a limited effect at such types of sites. Slight variations in the chemical composition and, with that, in the aerosol particle hygroscopicity only play a minor role for the accurate prediction of CCN0.5 number concentrations that fall within a factor of 2 for this data set. This has been expressed in a number of previous studies (e.g. Dusek et al., 2006; Jurányi et al., 2011; Jurányi et al., 2010; Pöhlker et al., 2016). Even a fixed κ of 0.3 can represent the aerosol particle hygroscopicity sufficiently well for CCN predictions, with a range of 0.82 to 1.38 for the ratio of predicted over measured CCN0.5 number concentrations. A κ of 0.3 has been suggested earlier to be generally representative of polluted continental environments (Andreae and Rosenfeld, 2008). This also seems to hold for other environments that partly represent free tropospheric conditions (JFJ) and the Amazon rain forest conditions in the dry and rainy season including natural forest emissions and long-range transport of Amazonian and African biomass burning aerosol pollution, as well as Saharan dust (ATT). Coastal sites (MHD, FIK) can also be represented by the same κ value. However, this value is too high for the city in East Asia (SEO).
An influence on the closure results is also observed when the shape of the particle number size distribution is fixed, but scaled to the measured particle number concentration at each site (dark blue symbols in Fig. 10a). The predictability of averaged CCN0.5 number concentrations decreases moderately for all stations (except CES), and is within the boundaries of the ratio of 0.80 and 1.96. However, the correlation between the predicted and measured CCN number concentration naturally decreases as the fixed shape of the particle number size distribution does not represent the changing number fraction of particles with diameters larger than Dcrit over time. The correlation coefficient drops more strongly for the MEL and SMR, which is due to the regular presence of a large numbers of small particles at these observatories due to new particle formation events (Birmili and Wiedensohler, 2000; Dal Maso et al., 2005; Manninen et al., 2010). The relatively large fraction of small particles can be seen in Fig. 3b expressed as the Dg frequency. The fixed shape of the particle number size distribution represents these two stations least accurately.
Keeping the number concentration of particles fixed at each station's median and scaling the temporally variable particle number size distribution to it, generally results in the poorest predictability (ratios between 0.65 and 2.28). The temporal prediction skills drop to correlation coefficients < 0.7 for all stations as the temporal variability in the data set is mostly driven by changes in particle number concentrations. This is especially true for MHD, where the correlation coefficient is as low as 0.2, because the particle concentrations are more variable at this location than at any other one (see Fig. 4 in Schmale et al., 2017).
Applying these observations to the stations without aerosol chemical particle composition measurements, we performed closure studies at SS = 0.5 % based on a calculated average κ value per site category: rural background, κ = 0.48 from MEL and CES; PUY: alpine, κ = 0.41 from JFJ; BRW and NOT: coastal background, κ = 0.55 from MHD and FIK. For the urban station, SEO, we use κ = 0.1 (Schmale et al., 2017). In addition, κ = 0.3 is applied to all stations. Results are shown in Fig. 10b. CCN number concentrations can be reproduced within 1.02 and 1.99 for the category-averaged κ values and within 1.03 and 1.75 for κ = 0.3. For NOT the averaged κ value is representative, likely because of the mixture of the highly hygroscopic sea salt and sulfur-rich marine accumulation mode particles with the local aerosol populations. At BRW, the Arctic coastal environment, particles seem slightly less hygroscopic, leading to better results with κ = 0.3 rather than 0.55. For SEO, the urban κ value is also better suited than the suggested global average of 0.3, while for PUY there is only a small difference between the alpine and global average κ values. At VAV, the rural background κ value is too high, leading to a significant over-prediction by a factor of 2. In the previous estimate at the rural continental site, VAV, by Paramonov et al. (2015), κ values are around or below 0.3 depending on dry particle diameter, which are closer to the κ values presented in Table 2 at the forest station SMR. This is not surprising since the size distributions at VAV and SMR are similar (Fig. 3) and VAV is also a northern station, and is surrounded by forest regions similar to SMR. Furthermore, it is possible that particulate nitrate and sulfate at CES and MEL were associated with organic matter in which case the hygroscopicity of the particles would be overestimated even though results in Fig. 10a do not suggest so. Hence, care must be taken when choosing representative κ values. Two stations in the same site category could have κ values that are actually significantly different (compare the forest stations in Fig. 9), and two stations in two different site categories could have similar κ values.
In general, the correlation coefficients range between 0.70 and 0.93 for site-category-specific κ values and for an invariant κ value of 0.3. Given that these κ values do not reflect the temporal variability of the chemical composition at the stations, the prediction accuracy is reasonably high.
Other than the varied parameters shown in Fig. 10a, the value of the surface tension of the solution in the droplet might play a role. Based on JFJ data, using the closure calculations with , a 30 % decrease (increase) in σsol would result in a 17 % under-prediction (over-prediction of 25 %, see Sect. S2) of CCN0.5. This is within the range of change introduced by fixing the particle number concentration or size distribution. However, such a large change in σsol is not likely as a 30 % decrease can happen if very strong surfactants are present (Petters and Kreidenweis, 2013). Furthermore, small errors in determining the measured instrument supersaturation will have very little influence on the ratio of predicted versus measured CCN number concentrations, i.e. roughly 5 % when misrepresenting SS by an assumed 10 % (see Sect. S2). Based on this, determining the particle number concentration and size distribution as precisely as possible is most important for the successful prediction of CCN number concentrations at regionally representative observatories in all regions studied here.
For model simulations, this means that it should be sufficient to represent the particle number concentration and size distribution correctly and roughly the chemical composition. However, it remains to be shown whether this is true for other stations not studied here.
We have analysed long-term data from collocated measurements of CCN number concentrations, particle number size distributions and, in some cases, submicron aerosol chemical composition from different regions.
4.1 Regional variability
It is evident that CCN number concentrations vary considerably with region. However, there are only a few long-term studies that have compared number concentrations from the same station category across different regions. Previous model studies (Pringle et al., 2009) have investigated the effect of applying particle number size distribution data representative of one region to another when attempting to predict the number of cloud droplets, and found that errors can be as large as 75 % in the high latitudes and in regions with persistent stratocumuli. Even though the number of stations is limited to 12, this study comprises sites from Europe, the Americas and Asia with four stations representing coastal background, three stations rural background, two alpine sites, two forest sites and one urban location. Our results (Figs. 1b, 3 and 4) show that CCN0.2 number concentrations do not only vary considerably by region but also within one station category, e.g. by up to a factor of 30 in spring among the coastal stations between the Arctic and Asian Pacific, or by up to a factor of 4 in spring among the rural background stations. The alpine stations exhibit differences around a factor of 2, while the two particular forest environments are relatively similar despite representing high and tropical latitudes. In terms of particle activation behaviour, Fig. 6 shows that, while most non-coastal stations exhibit similar characteristics, the Amazon rain forest is different, and there is a relatively large spread among the coastal stations. This demonstrates that a broad regional data coverage is necessary to understand the actual variability of CCN0.2 number concentrations especially for coastal sites.
4.2 Seasonal variability
CCN0.2 number concentrations follow a seasonal cycle at most stations (Figs. 4 and 5). This means that short-term measurements can only be representative of the season in which they were performed. A comparison with data from the short-term EUCAARI data set relying on comparable measurement protocols (Paramonov et al., 2015), covering three of the stations discussed here for a short duration, shows significant differences in the CCN0.2 number concentrations. At CES, this study's average concentration is 4 times higher than the EUCAARI summer 2008 data. In the Amazon, the winter 2008 average represents only 10 % of the annual average covered here; and at FIK, the summer through autumn observations in 2007 covering the biomass burning season result in an average concentration that is twice as high as the full year 2015 measurements. Comparing our data with EUCAARI data covering one or more years and not overlapping with our observation period at JFJ, SMR and VAV results in discrepancies no larger than a factor of 1.3, and for MHD in a factor of 2. This means that the long-term observations covered in this study are largely representative for those sites; however, inter-annual variability can still lead to differences in concentrations. Looking at CCN0.2 number concentration persistence, all stations, except the urban environment, show marked differences between winter and summer. This indicates as well that short-term observations cannot be extrapolated over seasons, an important aspect to keep in mind when comparing model results with observations.
4.3 Prediction of CCN0.5 number concentrations
From the closure studies, we learn that when applying a simple κ–Köhler formulation assuming internal mixture and size-independent particle hygroscopicity, the geometric mean ratio between predicted and measured CCN0.5 number concentrations end up in the range between 0.87 and 1.37. The ratio exhibits a high reproducibility of temporal variability reflected by statistically significant correlation coefficients between 0.87 and 0.98. This prediction accuracy is rather high compared to previous synthesis studies that found a range between 0.2 and 7.9 (Ervens et al., 2010), potentially owing to the relatively remote location of the observatories discussed here and the apparently high data quality. These results were obtained by using the ion composition to derive κ for inorganic aerosol constituents, while κorg was assumed to be 0.1 and no information on BC mass concentrations was used. Assuming κorg = 0.1 worked sufficiently well in the present study, as the OA contribution to the submicron aerosol mass is mostly below 50 %, except at the forest sites, where it is higher. In the latter case, however, κorg = 0.1 still seems to be a reasonable approximation. Pöhlker et al. (2016) determined an effective κorg of 0.12 for the Amazon rainforest. When assuming an overall κ = 0.3, similarly good agreement between measured and predicted CCN0.5 number concentrations is obtained.
Sensitivity studies show that the temporal variability in CCN0.5 number concentrations would be poorly represented with an unknown actual particle number concentration, i.e. the correlation coefficient drops below 0.7 for all stations and as low as 0.2 for MHD. Also an invariant particle number size distribution can lead to very low correlation coefficients of < 0.35 for some stations. This means that temporally resolved data of particle number concentration and their size distribution are essential to predict CCN0.5 number concentrations. Conversely, a fixed κ value does not significantly reduce the correlation coefficients but influences the CCN0.5 number concentration predicted on average (Fig. 10). Care must be taken when applying station-type averaged κ values to stations of the same category without chemical observations. While on average the prediction accuracy lies within a factor of 1.36, for individual stations the overestimation can be as large as 200 %, in this case for VAV. VAV belongs to the rural background site category, which apparently is not suitable for VAV in terms of predicted CCN0.5 number concentrations from site-category-specific κ values. Namely, VAV κ values are more similar to the values at the forest station category.
4.4 General implications
The potential CCN number concentration alone cannot determine the actual CDNC, the variable that is important to describe cloud radiative properties. Other factors such as the updraft velocity and the resulting water vapour supersaturation, at which particles are activated, play an important role (Reutter et al., 2009). The CCN-limited regime applies to lower CCN number concentrations of, for example, less than 9000 cm−3 for SS = 0.2 % and a κ value around 0.4, which is roughly representative of this data set. This means that all stations considered here would fall into the CCN-limited regime, except for SEO occasionally. Against this background and given the results of the closure studies performed here with , CCN number concentration predictions are within the range of roughly ±30 % for stations with aerosol particle chemical composition information. Based on Sotiropoulou et al. (2006), who found that errors in CCN prediction result at most in half the error for CDNC, we find that CDNC can be predicted within ±15 % from data collected at regionally representative observatories. Similarly, Moore et al. (2013) found a CDNC sensitivity of 10–30 % to CCN abundance over the continents, which would further reduce the uncertainties of CDNC predictions based on this data set. Considering our results for stations without particle chemical observations, CCN number concentrations are overestimated on average by 36 %, leading to CDNC overestimation of ≤ 18 %. However, at individual stations like VAV, the CCN number concentration is overestimated by a factor of 2 in our closure experiments which would result in an overestimation of ≤ 50 % of the CDNC. Such a misrepresentation would result in precipitation underestimation for locations with shallow cloud formation, as precipitation efficiency in shallow convection is reduced with increasing CDNC (Andreae and Rosenfeld, 2008; Rosenfeld, 2000).
4.5 Recommendations
Given that operating extensive equipment for aerosol particle characterisation is expensive and labour intensive, it will not be possible to undertake the same observational efforts as discussed here at many stations across the globe. However, information of the CCN number concentration in many locations is important for modelling ACI more accurately and to constrain their radiative forcing better. Based on this study, we can recommend that observations of particle number size distributions at regionally representative sites would be sufficient when CCN number concentration measurements are run in parallel for the duration of at least one year. From the collocated observations, a temporally resolved κ value based on the simple formulation of the κ–Köhler theory can be derived and applied to the particle number size distribution to derive the CCN number concentration once the direct measurements have been concluded. This avoids operational expenses from sustained operation of a CCNC as well as from instruments capable of producing highly time-resolved aerosol chemical composition data. This statement is, however, only applicable to the context of investigating ACI as discussed here. Chemical composition measurements are indispensable in other contexts, e.g. when studying air quality. Furthermore, suggesting to find an alternative to measuring highly time-resolved particle chemical composition is not to say that such data are not desirable, especially because they allow for source apportionment studies that can provide results that are highly valuable to interpret CCN number concentrations (e.g.r Bougiatioti et al., 2016). In the ACI context, not using composition-derived κ values also circumvents added uncertainty from the measured aerosol chemical component concentrations and the bias towards the mass size distribution maximum. With respect to monitoring only particle number size distributions and applying a critical diameter to derive CCN number concentrations, a study for JFJ confirms that such an approach is reasonable; Hoyle et al. (2016) showed that 79 % of the variance in CDNC can be explained by the CCN number concentration based on a Dcrit of 80 nm. Based on the suggested simplified measurement strategy together with our observation of high CCN number concentration variability within site categories, it is conceivable to operate several “migrating CCNCs” around the world where long-term particle number size distribution data are already available. These CCNCs would have to be calibrated regularly at the World Calibration Centre for Aerosol Physics in Leipzig, Germany, to assure data quality (http://actris-ecac.eu/reports.html).
Last but not least, we encourage the modelling community to make use of this data set to evaluate CCN results near the observatories and discuss the simulation skills of the models, and to provide recommendations for priority observation sites where our simplified measurement recommendation can be employed.
All data are available from: http://actris.nilu.no/Content/products; data for the ATTO station have been submitted as Supplement to Pöhlker et al. (2016).
The supplement related to this article is available online at: https://doi.org/10.5194/acp-18-2853-2018-supplement.
JS, MG, UB and FS devised the study. JS analysed the data and wrote the manuscript. SH, SD, BH, HK, KS, JO, JB, AB, AK, NK, IS, SC, AJ, MP, PS, YI, UP, LP, AM, SY, UB and MG contributed to the data interpretation. PA, MÄ, NB, ME, GF, RF, AF, EH, HH, RH, GK, MK, NM, AN, CD, TP, DP, CP, AP, ES, MA, PA, AW and JO provided detailed information on the data sets. All authors were involved in the data acquisition and commented on the manuscript.
The authors declare that they have no conflict of interest.
This article is part of the special issue “BACCHUS – Impact of Biogenic versus Anthropogenic emissions on Clouds and Climate: towards a Holistic UnderStanding (ACP/AMT/GMD inter-journal SI)”. It is not associated with a conference.
The authors acknowledge funding from the European FP7 project BACCHUS (grant
agreement no. 49603445) and the Horizon 2020 research and innovation
programme ACTRIS-2 Integrating Activities (grant agreement no. 654109).
Long-term measurements at Jungfraujoch are supported by the International
Foundation High Altitude Research Stations Jungfraujoch and Gornergrat and
MeteoSwiss in the framework of the Global Atmosphere Watch (GAW) programme.
This work was supported by the Swiss State Secretariat for Education, Research
and Innovation (SERI) under contract number 15.0159-1. The opinions expressed
and arguments employed herein do not necessarily reflect the official views of
the Swiss Government. Measurements at Mace Head are supported by HEA-PRTLI4 Environment and
Climate Change: Impact and Responses programme and EPA Ireland. The research at
Cabauw has received funding from the European Union Seventh Framework
Programme (FP7, grant agreement no. 262254). We appreciate the support from
KNMI in hosting the experiment at Cabauw and for the access to
meteorological data from the tower. We also thank Philip Croteau (Aerodyne
Research) for his support on the Cabauw ACSM measurements regarding the data
acquisition and evaluation. The research at Noto was supported by JSPS
Grant-in-Aid for Young Scientists (A, grant no. JP26701001). The research
in Seoul was supported by Grant KMIPA 2015-1030. For the operation of the
ATTO site, we acknowledge the support by the German Federal Ministry of
Education and Research (BMBF contract 01LB1001A) and the Brazilian
Ministério da Ciência, Tecnologia e Inovação (MCTI/FINEP
contract 01.11.01248.00) as well as the Amazon State University (UEA),
FAPEAM, LBA/INPA and SDS/CEUC/RDS-Uatumã. This paper contains results of
research conducted under the Technical/Scientific Cooperation Agreement
between the National Institute for Amazonian Research, the State University
of Amazonas, and the Max-Planck-Gesellschaft e.V.; the opinions expressed
are the entire responsibility of the authors and not of the participating
institutions. We highly acknowledge the support by the Instituto Nacional de
Pesquisas da Amazônia (INPA). We thank the Max Planck Society (MPG) and
the Max Planck Graduate Center with the Johannes Gutenberg University Mainz (MPGC).
The research at Vavihill has been supported by the Swedish research councils VR
and FORMAS, the Swedish Environmental Protection Agency, and the strategic research area MERGE.
The research at Hyytiälä was supported by the Academy of Finland's Centres of
Excellence Programme (grant no. 307331).
Aerosol property measurements performed at the PUY station are partly supported
by the Service National d'Observation (SNO) CLAP. We thank all observatories'
operational teams for their continuous efforts. Athanasios Nenes thanks the Georgia Power
faculty Chair and Cullen-Peck faculty fellowship funds.
Edited by: Hinrich Grothe
Reviewed by: two anonymous referees
Almeida, G. P., Brito, J., Morales, C. A., Andrade, M. F., and Artaxo, P.: Measured and modelled cloud condensation nuclei (CCN) concentration in São Paulo, Brazil: the importance of aerosol size-resolved chemical composition on CCN concentration prediction, Atmos. Chem. Phys., 14, 7559–7572, https://doi.org/10.5194/acp-14-7559-2014, 2014.
Andreae, M. O.: Correlation between cloud condensation nuclei concentration and aerosol optical thickness in remote and polluted regions, Atmos. Chem. Phys., 9, 543–556, https://doi.org/10.5194/acp-9-543-2009, 2009a.
Andreae, M. O.: A New Look at Aging Aerosols, Science, 326, 1493–1494, 2009b.
Andreae, M. O. and Rosenfeld, D.: Aerosol-cloud-precipitation interactions. Part 1. The nature and sources of cloud-active aerosols, Earth-Sci. Rev., 89, 13–41, 2008.
Andreae, M. O., Jones, C. D., and Cox, P. M.: Strong present-day aerosol cooling implies a hot future, Nature, 435, 1187–1190, 2005.
Andreae, M. O., Acevedo, O. C., Araùjo, A., Artaxo, P., Barbosa, C. G. G., Barbosa, H. M. J., Brito, J., Carbone, S., Chi, X., Cintra, B. B. L., da Silva, N. F., Dias, N. L., Dias-Júnior, C. Q., Ditas, F., Ditz, R., Godoi, A. F. L., Godoi, R. H. M., Heimann, M., Hoffmann, T., Kesselmeier, J., Könemann, T., Krüger, M. L., Lavric, J. V., Manzi, A. O., Lopes, A. P., Martins, D. L., Mikhailov, E. F., Moran-Zuloaga, D., Nelson, B. W., Nölscher, A. C., Santos Nogueira, D., Piedade, M. T. F., Pöhlker, C., Pöschl, U., Quesada, C. A., Rizzo, L. V., Ro, C.-U., Ruckteschler, N., Sá, L. D. A., de Oliveira Sá, M., Sales, C. B., dos Santos, R. M. N., Saturno, J., Schöngart, J., Sörgel, M., de Souza, C. M., de Souza, R. A. F., Su, H., Targhetta, N., Tóta, J., Trebs, I., Trumbore, S., van Eijck, A., Walter, D., Wang, Z., Weber, B., Williams, J., Winderlich, J., Wittmann, F., Wolff, S., and Yáñez-Serrano, A. M.: The Amazon Tall Tower Observatory (ATTO): overview of pilot measurements on ecosystem ecology, meteorology, trace gases, and aerosols, Atmos. Chem. Phys., 15, 10723–10776, https://doi.org/10.5194/acp-15-10723-2015, 2015.
Asmi, E., Freney, E., Hervo, M., Picard, D., Rose, C., Colomb, A., and Sellegri, K.: Aerosol cloud activation in summer and winter at puy-de-Dôme high altitude site in France, Atmos. Chem. Phys., 12, 11589–11607, https://doi.org/10.5194/acp-12-11589-2012, 2012.
Barrie, L. A.: Arctic air-pollution – An overview of current knowledge, Atmos. Environ., 20, 643–663, 1986.
Beirle, S., Platt, U., Wenig, M., and Wagner, T.: Highly resolved global distribution of tropospheric NO2 using GOME narrow swath mode data, Atmos. Chem. Phys., 4, 1913–1924, https://doi.org/10.5194/acp-4-1913-2004, 2004.
Birmili, W. and Wiedensohler, A.: New particle formation in the continental boundary layer: Meteorological and gas phase parameter influence, Geophys. Res. Let., 27, 3325–3328, 2000.
Bougiatioti, A., Fountoukis, C., Kalivitis, N., Pandis, S. N., Nenes, A., and Mihalopoulos, N.: Cloud condensation nuclei measurements in the marine boundary layer of the Eastern Mediterranean: CCN closure and droplet growth kinetics, Atmos. Chem. Phys., 9, 7053–7066, https://doi.org/10.5194/acp-9-7053-2009, 2009.
Bougiatioti, A., Stavroulas, I., Kostenidou, E., Zarmpas, P., Theodosi, C., Kouvarakis, G., Canonaco, F., Prévôt, A. S. H., Nenes, A., Pandis, S. N., and Mihalopoulos, N.: Processing of biomass-burning aerosol in the eastern Mediterranean during summertime, Atmos. Chem. Phys., 14, 4793–4807, https://doi.org/10.5194/acp-14-4793-2014, 2014.
Bougiatioti, A., Bezantakos, S., Stavroulas, I., Kalivitis, N., Kokkalis, P., Biskos, G., Mihalopoulos, N., Papayannis, A., and Nenes, A.: Biomass-burning impact on CCN number, hygroscopicity and cloud formation during summertime in the eastern Mediterranean, Atmos. Chem. Phys., 16, 7389–7409, https://doi.org/10.5194/acp-16-7389-2016, 2016.
Burkart, J., Steiner, G., Reischl, G., and Hitzenberger, R.: Long-term study of cloud condensation nuclei (CCN) activation of the atmospheric aerosol in Vienna, Atmos. Environ., 45, 5751–5759, 2011.
Carslaw, K., Lee, L., Reddington, C., Pringle, K., Rap, A., Forster, P., Mann, G., Spracklen, D., Woodhouse, M., and Regayre, L.: Large contribution of natural aerosols to uncertainty in indirect forcing, Nature, 503, 67–71, 2013.
Chang, R. Y.-W., Slowik, J. G., Shantz, N. C., Vlasenko, A., Liggio, J., Sjostedt, S. J., Leaitch, W. R., and Abbatt, J. P. D.: The hygroscopicity parameter (κ) of ambient organic aerosol at a field site subject to biogenic and anthropogenic influences: relationship to degree of aerosol oxidation, Atmos. Chem. Phys., 10, 5047–5064, https://doi.org/10.5194/acp-10-5047-2010, 2010.
Charlson, R. J., Seinfeld, J. H., Nenes, A., Kulmala, M., Laaksonen, A., and Facchini, M. C.: Reshaping the theory of cloud formation, Science, 292, 2025–2026, 2001.
Che, H. C., Zhang, X. Y., Wang, Y. Q., Zhang, L., Shen, X. J., Zhang, Y. M., Ma, Q. L., Sun, J. Y., Zhang, Y. W., and Wang, T. T.: Characterization and parameterization of aerosol cloud condensation nuclei activation under different pollution conditions, Scient. Rep., 6, 24497, https://doi.org/10.1038/srep24497, 2016.
China, S., Wang, B., Weis, J., Rizzo, L., Brito, J., Cirino, G. G., Kovarik, L., Artaxo, P., Gilles, M. K., and Laskin, A.: Rupturing of biological spores as a source of secondary particles in Amazonia, Environ. Sci. Technol., 50, 12179–12186, 2016.
Crenn, V., Sciare, J., Croteau, P. L., Verlhac, S., Fröhlich, R., Belis, C. A., Aas, W., Äijälä, M., Alastuey, A., Artiñano, B., Baisnée, D., Bonnaire, N., Bressi, M., Canagaratna, M., Canonaco, F., Carbone, C., Cavalli, F., Coz, E., Cubison, M. J., Esser-Gietl, J. K., Green, D. C., Gros, V., Heikkinen, L., Herrmann, H., Lunder, C., Minguillón, M. C., Mocnik, G., O'Dowd, C. D., Ovadnevaite, J., Petit, J.-E., Petralia, E., Poulain, L., Priestman, M., Riffault, V., Ripoll, A., Sarda-Estève, R., Slowik, J. G., Setyan, A., Wiedensohler, A., Baltensperger, U., Prévôt, A. S. H., Jayne, J. T., and Favez, O.: ACTRIS ACSM intercomparison – Part 1: Reproducibility of concentration and fragment results from 13 individual Quadrupole Aerosol Chemical Speciation Monitors (Q-ACSM) and consistency with co-located instruments, Atmos. Meas. Tech., 8, 5063–5087, https://doi.org/10.5194/amt-8-5063-2015, 2015.
Croft, B., Lohmann, U., Martin, R. V., Stier, P., Wurzler, S., Feichter, J., Posselt, R., and Ferrachat, S.: Aerosol size-dependent below-cloud scavenging by rain and snow in the ECHAM5-HAM, Atmos. Chem. Phys., 9, 4653–4675, https://doi.org/10.5194/acp-9-4653-2009, 2009.
Crosbie, E., Youn, J.-S., Balch, B., Wonaschütz, A., Shingler, T., Wang, Z., Conant, W. C., Betterton, E. A., and Sorooshian, A.: On the competition among aerosol number, size and composition in predicting CCN variability: a multi-annual field study in an urbanized desert, Atmos. Chem. Phys., 15, 6943–6958, https://doi.org/10.5194/acp-15-6943-2015, 2015.
Cubison, M. J., Ervens, B., Feingold, G., Docherty, K. S., Ulbrich, I. M., Shields, L., Prather, K., Hering, S., and Jimenez, J. L.: The influence of chemical composition and mixing state of Los Angeles urban aerosol on CCN number and cloud properties, Atmos. Chem. Phys., 8, 5649–5667, https://doi.org/10.5194/acp-8-5649-2008, 2008.
Dal Maso, M., Kulmala, M., Riipinen, I., Wagner, R., Hussein, T., Aalto, P. P., and Lehtinen, K. E.: Formation and growth of fresh atmospheric aerosols: eight years of aerosol size distribution data from SMEAR II, Hyytiala, Finland, Boreal Environ. Res., 10, 323–336, 2005.
DeCarlo, P. F., Kimmel, J. R., Trimborn, A., Northway, M. J., Jayne, J. T., Aiken, A. C., Gonin, M., Fuhrer, K., Horvath, T., Docherty, K. S., Worsnop, D. R., and Jimenez, J. L.: Field-deployable, high-resolution, time-of-flight aerosol mass spectrometer, Anal. Chem., 78, 8281–8289, 2006.
Duplissy, J., Gysel, M., Alfarra, M. R., Dommen, J., Metzger, A., Prevot, A. S. H., Weingartner, E., Laaksonen, A., Raatikainen, T., Good, N., Turner, S. F., McFiggans, G., and Baltensperger, U.: Cloud forming potential of secondary organic aerosol under near atmospheric conditions, Geophys. Res. Lett., 35, L03818, https://doi.org/10.1029/2007GL031075, 2008.
Dusek, U., Frank, G. P., Hildebrandt, L., Curtius, J., Schneider, J., Walter, S., Chand, D., Drewnick, F., Hings, S., Jung, D., Borrmann, S., and Andreae, M. O.: Size matters more than chemistry for cloud-nucleating ability of aerosol particles, Science, 312, 1375–1378, 2006.
Dusek, U., Frank, G. P., Curtius, J., Drewnick, F., Schneider, J., Kürten, A., Rose, D., Andreae, M. O., Borrmann, S., and Pöschl, U.: Enhanced organic mass fraction and decreased hygroscopicity of cloud condensation nuclei (CCN) during new particle formation events, Geophys. Res. Lett., 37, L03804, https://doi.org/10.1029/2009GL040930, 2010.
Ervens, B., Cubison, M., Andrews, E., Feingold, G., Ogren, J. A., Jimenez, J. L., DeCarlo, P., and Nenes, A.: Prediction of cloud condensation nucleus number concentration using measurements of aerosol size distributions and composition and light scattering enhancement due to humidity, J. Geophys. Res.-Atmos., 112, D10S32, https://doi.org/10.1029/2006JD007426, 2007.
Ervens, B., Cubison, M. J., Andrews, E., Feingold, G., Ogren, J. A., Jimenez, J. L., Quinn, P. K., Bates, T. S., Wang, J., Zhang, Q., Coe, H., Flynn, M., and Allan, J. D.: CCN predictions using simplified assumptions of organic aerosol composition and mixing state: a synthesis from six different locations, Atmos. Chem. Phys., 10, 4795–4807, https://doi.org/10.5194/acp-10-4795-2010, 2010.
Facchini, M. C., Decesari, S., Mircea, M., Fuzzi, S., and Loglio, G.: Surface tension of atmospheric wet aerosol and cloud/fog droplets in relation to their organic carbon content and chemical composition, Atmos. Environ., 34, 4853–4857, 2000.
Fors, E. O., Swietlicki, E., Svenningsson, B., Kristensson, A., Frank, G. P., and Sporre, M.: Hygroscopic properties of the ambient aerosol in southern Sweden – a two year study, Atmos. Chem. Phys., 11, 8343–8361, https://doi.org/10.5194/acp-11-8343-2011, 2011.
Fröhlich, R., Cubison, M. J., Slowik, J. G., Bukowiecki, N., Prévôt, A. S. H., Baltensperger, U., Schneider, J., Kimmel, J. R., Gonin, M., Rohner, U., Worsnop, D. R., and Jayne, J. T.: The ToF-ACSM: a portable aerosol chemical speciation monitor with TOFMS detection, Atmos. Meas. Tech., 6, 3225–3241, https://doi.org/10.5194/amt-6-3225-2013, 2013.
Fröhlich, R., Cubison, M. J., Slowik, J. G., Bukowiecki, N., Canonaco, F., Croteau, P. L., Gysel, M., Henne, S., Herrmann, E., Jayne, J. T., Steinbacher, M., Worsnop, D. R., Baltensperger, U., and Prévôt, A. S. H.: Fourteen months of on-line measurements of the non-refractory submicron aerosol at the Jungfraujoch (3580 m a.s.l.) – chemical composition, origins and organic aerosol sources, Atmos. Chem. Phys., 15, 11373–11398, https://doi.org/10.5194/acp-15-11373-2015, 2015.
Frosch, M., Bilde, M., DeCarlo, P. F., Jurányi, Z., Tritscher, T., Dommen, J., Donahue, N. M., Gysel, M., Weingartner, E., and Baltensperger, U.: Relating cloud condensation nuclei activity and oxidation level of α-pinene secondary organic aerosols, J. Geophys. Res.-Atmos., 116, D22212, https://doi.org/10.1029/2011JD016401, 2011.
Ghan, S. J. and Schwartz, S. E.: Aerosol Properties and Processes: A Path from Field and Laboratory Measurements to Global Climate Models, B. Am. Meteorol. Soc., 88, 1059–1083, 2007.
Gunthe, S. S., King, S. M., Rose, D., Chen, Q., Roldin, P., Farmer, D. K., Jimenez, J. L., Artaxo, P., Andreae, M. O., Martin, S. T., and Pöschl, U.: Cloud condensation nuclei in pristine tropical rainforest air of Amazonia: size–esolved measurements and modeling of atmospheric aerosol composition and CCN activity, Atmos. Chem. Phys., 9, 7551–7575, https://doi.org/10.5194/acp-9-7551-2009, 2009.
Gunthe, S. S., Rose, D., Su, H., Garland, R. M., Achtert, P., Nowak, A., Wiedensohler, A., Kuwata, M., Takegawa, N., Kondo, Y., Hu, M., Shao, M., Zhu, T., Andreae, M. O., and Pöschl, U.: Cloud condensation nuclei (CCN) from fresh and aged air pollution in the megacity region of Beijing, Atmos. Chem. Phys., 11, 11023–11039, https://doi.org/10.5194/acp-11-11023-2011, 2011.
Gysel, M., Crosier, J., Topping, D. O., Whitehead, J. D., Bower, K. N., Cubison, M. J., Williams, P. I., Flynn, M. J., McFiggans, G. B., and Coe, H.: Closure study between chemical composition and hygroscopic growth of aerosol particles during TORCH2, Atmos. Chem. Phys., 7, 6131–6144, https://doi.org/10.5194/acp-7-6131-2007, 2007.
Herrmann, E., Weingartner, E., Henne, S., Vuilleumier, L., Bukowiecki, N., Steinbacher, M., Conen, F., Collaud Coen, M., Hammer, E., Jurányi, Z., Baltensperger, U., and Gysel, M.: Analysis of long-term aerosol size distribution data from Jungfraujoch with emphasis on free tropospheric conditions, cloud influence, and air mass transport, J. Geophys. Res.-Atmos., 120, 9459–9480, 2015.
Hitzenberger, R., Giebl, H., Petzold, A., Gysel, M., Nyeki, S., Weingartner, E., Baltensperger, U., and Wilson, C. W.: Properties of jet engine combustion particles during the PartEmis experiment. Hygroscopic growth at supersaturated conditions, Geophys. Res. Lett., 30, 1779, https://doi.org/10.1029/2003GL017294, 2003.
Hong, J., Häkkinen, S. A. K., Paramonov, M., Äijälä, M., Hakala, J., Nieminen, T., Mikkilä, J., Prisle, N. L., Kulmala, M., Riipinen, I., Bilde, M., Kerminen, V.-M., and Petäjä, T.: Hygroscopicity, CCN and volatility properties of submicron atmospheric aerosol in a boreal forest environment during the summer of 2010, Atmos. Chem. Phys., 14, 4733–4748, https://doi.org/10.5194/acp-14-4733-2014, 2014.
Hoyle, C. R., Webster, C. S., Rieder, H. E., Nenes, A., Hammer, E., Herrmann, E., Gysel, M., Bukowiecki, N., Weingartner, E., Steinbacher, M., and Baltensperger, U.: Chemical and physical influences on aerosol activation in liquid clouds: a study based on observations from the Jungfraujoch, Switzerland, Atmos. Chem. Phys., 16, 4043–4061, https://doi.org/10.5194/acp-16-4043-2016, 2016.
Huffman, J. A., Jayne, J. T., Drewnick, F., Aiken, A. C., Onasch, T., Worsnop, D. R., and Jimenez, J. L.: Design, modeling, optimization, and experimental tests of a particle beam width probe for the Aerodyne aerosol mass spectrometer, Aerosol Sci. Tech., 39, 1143–1163, 2005.
Hyvärinen, A. P., Kolmonen, P., Kerminen, V. M., Virkkula, A., Leskinen, A., Komppula, M., Hatakka, J., Burkhart, J., Stohl, A., Aalto, P., Kulmala, M., Lehtinen, K. E. J., Viisanen, Y., and Lihavainen, H.: Aerosol black carbon at five background measurement sites over Finland, a gateway to the Arctic, Atmos. Environ., 45, 4042–4050, 2011.
IPCC: Climate Change 2013: The Physical Science Basis, in: Contribution of Working Group I to the Fifth Assessment Report of the Intergovernmental Panel on Climate Change, Cambridge University Press, Cambridge, UK and New York, NY, USA, 2013.
Iwamoto, Y., Kinouchi, K., Watanabe, K., Yamazaki, N., and Matsuki, A.: Simultaneous measurement of CCN activity and chemical composition of fine-mode aerosols at Noto peninsula, Japan, in autumn 2012, Aerosol Air Qual. Res., 16, 2107–2118, 2016.
Jimenez, J. L., Canagaratna, M. R., Donahue, N. M., Prevot, A. S. H., Zhang, Q., Kroll, J. H., DeCarlo, P. F., Allan, J. D., Coe, H., Ng, N. L., Aiken, A. C., Docherty, K. S., Ulbrich, I. M., Grieshop, A. P., Robinson, A. L., Duplissy, J., Smith, J. D., Wilson, K. R., Lanz, V. A., Hueglin, C., Sun, Y. L., Tian, J., Laaksonen, A., Raatikainen, T., Rautiainen, J., Vaattovaara, P., Ehn, M., Kulmala, M., Tomlinson, J. M., Collins, D. R., Cubison, M. J., Dunlea, E. J., Huffman, J. A., Onasch, T. B., Alfarra, M. R., Williams, P. I., Bower, K., Kondo, Y., Schneider, J., Drewnick, F., Borrmann, S., Weimer, S., Demerjian, K., Salcedo, D., Cottrell, L., Griffin, R., Takami, A., Miyoshi, T., Hatakeyama, S., Shimono, A., Sun, J. Y., Zhang, Y. M., Dzepina, K., Kimmel, J. R., Sueper, D., Jayne, J. T., Herndon, S. C., Trimborn, A. M., Williams, L. R., Wood, E. C., Middlebrook, A. M., Kolb, C. E., Baltensperger, U., and Worsnop, D. R.: Evolution of organic aerosols in the atmosphere, Science, 326, 1525–1529, 2009.
Jurányi, Z., Gysel, M., Duplissy, J., Weingartner, E., Tritscher, T., Dommen, J., Henning, S., Ziese, M., Kiselev, A., Stratmann, F., George, I., and Baltensperger, U.: Influence of gas-to-particle partitioning on the hygroscopic and droplet activation behaviour of α-pinene secondary organic aerosol, Phys. Chem. Chem. Phys., 11, 8091–8097, 2009.
Jurányi, Z., Gysel, M., Weingartner, E., DeCarlo, P. F., Kammermann, L., and Baltensperger, U.: Measured and modelled cloud condensation nuclei number concentration at the high alpine site Jungfraujoch, Atmos. Chem. Phys., 10, 7891–7906, https://doi.org/10.5194/acp-10-7891-2010, 2010.
Jurányi, Z., Gysel, M., Weingartner, E., Bukowiecki, N., Kammermann, L., and Baltensperger, U.: A 17 month climatology of the cloud condensation nuclei number concentration at the high alpine site Jungfraujoch, J. Geophys. Res.-Atmos., 116, D10204, https://doi.org/10.1029/2010JD015199, 2011.
Jurányi, Z., Tritscher, T., Gysel, M., Laborde, M., Gomes, L., Roberts, G., Baltensperger, U., and Weingartner, E.: Hygroscopic mixing state of urban aerosol derived from size-resolved cloud condensation nuclei measurements during the MEGAPOLI campaign in Paris, Atmos. Chem. Phys., 13, 6431–6446, https://doi.org/10.5194/acp-13-6431-2013, 2013.
Kammermann, L., Gysel, M., Weingartner, E., and Baltensperger, U.: 13-month climatology of the aerosol hygroscopicity at the free tropospheric site Jungfraujoch (3580 m a.s.l.), Atmos. Chem. Phys., 10, 10717-10732, 2010a.
Kammermann, L., Gysel, M., Weingartner, E., Herich, H., Cziczo, D. J., Holst, T., Svenningsson, B., Arneth, A., and Baltensperger, U.: Subarctic atmospheric aerosol composition: 3. easured and modeled properties of cloud condensation nuclei, J. Geophys. Res.-Atmos., 115, D04202, https://doi.org/10.1029/2009JD012447, 2010b.
Kiendler-Scharr, A., Mensah, A. A., Friese, E., Topping, D., Nemitz, E., Prevot, A. S. H., Äijälä, M., Allan, J., Canonaco, F., Canagaratna, M., Carbone, S., Crippa, M., Dall Osto, M., Day, D. A., De Carlo, P., Di Marco, C. F., Elbern, H., Eriksson, A., Freney, E., Hao, L., Herrmann, H., Hildebrandt, L., Hillamo, R., Jimenez, J. L., Laaksonen, A., McFiggans, G., Mohr, C., O'Dowd, C., Otjes, R., Ovadnevaite, J., Pandis, S. N., Poulain, L., Schlag, P., Sellegri, K., Swietlicki, E., Tiitta, P., Vermeulen, A., Wahner, A., Worsnop, D., and Wu, H. C.: Ubiquity of organic nitrates from nighttime chemistry in the European submicron aerosol, Geophys. Res. Lett., 43, 7735–7744, 2016.
Kim, J. H., Yum, S. S., Shim, S., Kim, W. J., Park, M., Kim, J.-H., Kim, M.-H., and Yoon, S.-C.: On the submicron aerosol distributions and CCN number concentrations in and around the Korean Peninsula, Atmos. Chem. Phys., 14, 8763–8779, https://doi.org/10.5194/acp-14-8763-2014, 2014.
Kouvarakis, G., Tsigaridis, K., Kanakidou, M., and Mihalopoulos, N.: Temporal variations of surface regional background ozone over Crete Island in the southeast Mediterranean, J. Geophys. Res.-Atmos., 105, 4399–4407, 2000.
Lathem, T. L., Beyersdorf, A. J., Thornhill, K. L., Winstead, E. L., Cubison, M. J., Hecobian, A., Jimenez, J. L., Weber, R. J., Anderson, B. E., and Nenes, A.: Analysis of CCN activity of Arctic aerosol and Canadian biomass burning during summer 2008, Atmos. Chem. Phys., 13, 2735–2756, https://doi.org/10.5194/acp-13-2735-2013, 2013.
Lee, L. A., Pringle, K. J., Reddington, C. L., Mann, G. W., Stier, P., Spracklen, D. V., Pierce, J. R., and Carslaw, K. S.: The magnitude and causes of uncertainty in global model simulations of cloud condensation nuclei, Atmos. Chem. Phys., 13, 8879–8914, https://doi.org/10.5194/acp-13-8879-2013, 2013.
Leng, C., Cheng, T., Chen, J., Zhang, R., Tao, J., Huang, G., Zha, S., Zhang, M., Fang, W., Li, X., and Li, L.: Measurements of surface cloud condensation nuclei and aerosol activity in downtown Shanghai, Atmos. Environ., 69, 354–361, 2013.
Liu, J. and Li, Z.: Estimation of cloud condensation nuclei concentration from aerosol optical quantities: influential factors and uncertainties, Atmos. Chem. Phys., 14, 471–483, https://doi.org/10.5194/acp-14-471-2014, 2014.
Manninen, H. E., Nieminen, T., Asmi, E., Gagné, S., Häkkinen, S., Lehtipalo, K., Aalto, P., Vana, M., Mirme, A., Mirme, S., Hõrrak, U., Plass-Dülmer, C., Stange, G., Kiss, G., Hoffer, A., Töro, N., Moerman, M., Henzing, B., de Leeuw, G., Brinkenberg, M., Kouvarakis, G. N., Bougiatioti, A., Mihalopoulos, N., O'Dowd, C., Ceburnis, D., Arneth, A., Svenningsson, B., Swietlicki, E., Tarozzi, L., Decesari, S., Facchini, M. C., Birmili, W., Sonntag, A., Wiedensohler, A., Boulon, J., Sellegri, K., Laj, P., Gysel, M., Bukowiecki, N., Weingartner, E., Wehrle, G., Laaksonen, A., Hamed, A., Joutsensaari, J., Petäjä, T., Kerminen, V.-M., and Kulmala, M.: EUCAARI ion spectrometer measurements at 12 European sites – analysis of new particle formation events, Atmos. Chem. Phys., 10, 7907–7927, https://doi.org/10.5194/acp-10-7907-2010, 2010.
Massoli, P., Lambe, A. T., Ahern, A. T., Williams, L. R., Ehn, M., Mikkilä, J., Canagaratna, M. R., Brune, W. H., Onasch, T. B., Jayne, J. T., Petäjä, T., Kulmala, M., Laaksonen, A., Kolb, C. E., Davidovits, P., and Worsnop, D. R.: Relationship between aerosol oxidation level and hygroscopic properties of laboratory generated secondary organic aerosol (SOA) particles, Geophys. Res. Lett., 37, L24801, https://doi.org/10.1029/2010GL045258, 2010.
Mensah, A. A., Holzinger, R., Otjes, R., Trimborn, A., Mentel, Th. F., ten Brink, H., Henzing, B., and Kiendler-Scharr, A.: Aerosol chemical composition at Cabauw, The Netherlands as observed in two intensive periods in May 2008 and March 2009, Atmos. Chem. Phys., 12, 4723–4742, https://doi.org/10.5194/acp-12-4723-2012, 2012.
Middlebrook, A. M., Bahreini, R., Jimenez, J. L., and Canagaratna, M. R.: Evaluation of composition-dependent collection efficiencies for the Aerodyne aerosol mass spectrometer using field data, Aerosol Sci. Tech., 46, 258–271, 2012.
Moore, R. H., Karydis, V. A., Capps, S. L., Lathem, T. L., and Nenes, A.: Droplet number uncertainties associated with CCN: an assessment using observations and a global model adjoint, Atmos. Chem. Phys., 13, 4235–4251, https://doi.org/10.5194/acp-13-4235-2013, 2013.
Ng, N. L., Herndon, S. C., Trimborn, A., Canagaratna, M. R., Croteau, P. L., Onasch, T. B., Sueper, D., Worsnop, D. R., Zhang, Q., Sun, Y. L., and Jayne, J. T.: An Aerosol Chemical Speciation Monitor (ACSM) for routine monitoring of the composition and mass concentrations of ambient aerosol, Aerosol Sci. Tech., 45, 780–794, 2011.
Ovadnevaite, J., Ceburnis, D., Bialek, J., Berresheim, H., and O'Dowd, C.: Quantitative real time sea salt measurements by HR-ToF-AMS, poster presentation, European Aerosol Conference, Manchester, UK, 2011a.
Ovadnevaite, J., Ceburnis, D., Martucci, G., Bialek, J., Monahan, C., Rinaldi, M., Facchini, M. C., Berresheim, H., Worsnop, D. R., and O'Dowd, C.: Primary marine organic aerosol: A dichotomy of low hygroscopicity and high CCN activity, Geophys. Res. Lett., 38, L21806, https://doi.org/10.1029/2011GL048869, 2011b.
Ovadnevaite, J., Ceburnis, D., Canagaratna, M., Berresheim, H., Bialek, J., Martucci, G., Worsnop, D. R., and O'Dowd, C.: On the effect of wind speed on submicron sea salt mass concentratio and source fluxes, J. Geophys. Res., 117, D16201, https://doi.org/10.1029/2011JD017379, 2012.
Ovadnevaite, J., Ceburnis, D., Leinert, S., Dall'Osto, M., Canagaratna, M., O'Doherty, S., Berresheim, H., and O'Dowd, C.: Submicron NE Atlantic marine aerosol chemical composition and abundance: Seasonal trends and air mass categorization, J. Geophys. Res.-Atmos., 119, 11850–11863, 2014.
Ovadnevaite, J., Zuend, A., Laaksonen, A., Sanchez, K. J., Roberts, G., Ceburnis, D., Decesari, S., Rinaldi, M., Hodas, N., Facchini, M. C., Seinfeld, J. H., and O' Dowd, C.: Surface tension prevails over solute effect in organic-influenced cloud droplet activation, Nature, 546, 637–641, 2017.
Paramonov, M., Aalto, P. P., Asmi, A., Prisle, N., Kerminen, V.-M., Kulmala, M., and Petäjä, T.: The analysis of size-segregated cloud condensation nuclei counter (CCNC) data and its implications for cloud droplet activation, Atmos. Chem. Phys., 13, 10285–10301, https://doi.org/10.5194/acp-13-10285-2013, 2013.
Paramonov, M., Kerminen, V.-M., Gysel, M., Aalto, P. P., Andreae, M. O., Asmi, E., Baltensperger, U., Bougiatioti, A., Brus, D., Frank, G. P., Good, N., Gunthe, S. S., Hao, L., Irwin, M., Jaatinen, A., Jurányi, Z., King, S. M., Kortelainen, A., Kristensson, A., Lihavainen, H., Kulmala, M., Lohmann, U., Martin, S. T., McFiggans, G., Mihalopoulos, N., Nenes, A., O'Dowd, C. D., Ovadnevaite, J., Petäjä, T., Pöschl, U., Roberts, G. C., Rose, D., Svenningsson, B., Swietlicki, E., Weingartner, E., Whitehead, J., Wiedensohler, A., Wittbom, C., and Sierau, B.: A synthesis of cloud condensation nuclei counter (CCNC) measurements within the EUCAARI network, Atmos. Chem. Phys., 15, 12211–12229, https://doi.org/10.5194/acp-15-12211-2015, 2015.
Petäjä, T., Kerminen, V.-M., Hämeri, K., Vaattovaara, P., Joutsensaari, J., Junkermann, W., Laaksonen, A., and Kulmala, M.: Effects of SO2 oxidation on ambient aerosol growth in water and ethanol vapours, Atmos. Chem. Phys., 5, 767–779, https://doi.org/10.5194/acp-5-767-2005, 2005.
Petters, M. D. and Kreidenweis, S. M.: A single parameter representation of hygroscopic growth and cloud condensation nucleus activity, Atmos. Chem. Phys., 7, 1961–1971, https://doi.org/10.5194/acp-7-1961-2007, 2007.
Petters, M. D. and Kreidenweis, S. M.: A single parameter representation of hygroscopic growth and cloud condensation nucleus activity – Part 3: Including surfactant partitioning, Atmos. Chem. Phys., 13, 1081–1091, https://doi.org/10.5194/acp-13-1081-2013, 2013.
Pöhlker, C., Wiedemann, K. T., Sinha, B., Shiraiwa, M., Gunthe, S. S., Smith, M., Su, H., Artaxo, P., Chen, Q., Cheng, Y., Elbert, W., Gilles, M. K., Kilcoyne, A. L. D., Moffet, R. C., Weigand, M., Martin, S. T., Pöschl, U., and Andreae, M. O.: Biogenic potassium salt particles as seeds for secondary organic aerosol in the Amazon, Science, 337, 1075–1078, 2012.
Pöhlker, M. L., Pöhlker, C., Ditas, F., Klimach, T., Hrabe de Angelis, I., Araújo, A., Brito, J., Carbone, S., Cheng, Y., Chi, X., Ditz, R., Gunthe, S. S., Kesselmeier, J., Könemann, T., Lavric, J. V., Martin, S. T., Mikhailov, E., Moran-Zuloaga, D., Rose, D., Saturno, J., Su, H., Thalman, R., Walter, D., Wang, J., Wolff, S., Barbosa, H. M. J., Artaxo, P., Andreae, M. O., and Pöschl, U.: Long-term observations of cloud condensation nuclei in the Amazon rain forest – Part 1: Aerosol size distribution, hygroscopicity, and new model parametrizations for CCN prediction, Atmos. Chem. Phys., 16, 15709–15740, https://doi.org/10.5194/acp-16-15709-2016, 2016.
Pringle, K. J., Carslaw, K. S., Spracklen, D. V., Mann, G. M., and Chipperfield, M. P.: The relationship between aerosol and cloud drop number concentrations in a global aerosol microphysics model, Atmos. Chem. Phys., 9, 4131–4144, https://doi.org/10.5194/acp-9-4131-2009, 2009.
Raatikainen, T., Vaattovaara, P., Tiitta, P., Miettinen, P., Rautiainen, J., Ehn, M., Kulmala, M., Laaksonen, A., and Worsnop, D. R.: Physicochemical properties and origin of organic groups detected in boreal forest using an aerosol mass spectrometer, Atmos. Chem. Phys., 10, 2063–2077, https://doi.org/10.5194/acp-10-2063-2010, 2010.
Reutter, P., Su, H., Trentmann, J., Simmel, M., Rose, D., Gunthe, S. S., Wernli, H., Andreae, M. O., and Pöschl, U.: Aerosol- and updraft-limited regimes of cloud droplet formation: influence of particle number, size and hygroscopicity on the activation of cloud condensation nuclei (CCN), Atmos. Chem. Phys., 9, 7067–7080, https://doi.org/10.5194/acp-9-7067-2009, 2009.
Roberts, G. and Nenes, A.: A Continuous-Flow Streamwise Thermal-Gradient CCN Chamber for Atmospheric Measurements, Aerosol Sci. Tech., 39, 206–221, https://doi.org/10.1080/027868290913988, 2005.
Rose, D., Nowak, A., Achtert, P., Wiedensohler, A., Hu, M., Shao, M., Zhang, Y., Andreae, M. O., and Pöschl, U.: Cloud condensation nuclei in polluted air and biomass burning smoke near the mega-city Guangzhou, China – Part 1: Size-resolved measurements and implications for the modeling of aerosol particle hygroscopicity and CCN activity, Atmos. Chem. Phys., 10, 3365–3383, https://doi.org/10.5194/acp-10-3365-2010, 2010.
Rose, D., Gunthe, S. S., Su, H., Garland, R. M., Yang, H., Berghof, M., Cheng, Y. F., Wehner, B., Achtert, P., Nowak, A., Wiedensohler, A., Takegawa, N., Kondo, Y., Hu, M., Zhang, Y., Andreae, M. O., and Pöschl, U.: Cloud condensation nuclei in polluted air and biomass burning smoke near the mega-city Guangzhou, China – Part 2: Size-resolved aerosol chemical composition, diurnal cycles, and externally mixed weakly CCN-active soot particles, Atmos. Chem. Phys., 11, 2817–2836, https://doi.org/10.5194/acp-11-2817-2011, 2011.
Rosenfeld, D.: Suppression of Rain and Snow by Urban and Industrial Air Pollution, Science, 287, 1793–1796, 2000.
Rosenfeld, D., Andreae, M. O., Asmi, A., Chin, M., de Leeuw, G., Donovan, D. P., Kahn, R., Kinne, S., Kivekäs, N., Kulmala, M., Lau, W., Schmidt, S., Suni, T., Wagner, T., Wild, M., and Quaas, J.: Global observations of aerosol–cloud–precipitation–climate interactions, Rev. Geophys., 52, 750–808, https://doi.org/10.1002/2013RG000441, 2014.
Rosenfeld, D., Zheng, Y., Hashimshoni, E., Pöhlker, M. L., Jefferson, A., Pöhlker, C., Yu, X., Zhu, Y., Liu, G., Yue, Z., Fischman, B., Li, Z., Giguzin, D., Goren, T., Artaxo, P., Barbosa, H. M. J., Pöschl, U., and Andreae, M. O.: Satellite retrieval of cloud condensation nuclei concentrations by using clouds as CCN chambers, P. Natl. Acad. Sci. USA, 113, 5828–5834, https://doi.org/10.1073/pnas.1514044113, 2016.
Salter, M. E., Zieger, P., Acosta Navarro, J. C., Grythe, H., Kirkevåg, A., Rosati, B., Riipinen, I., and Nilsson, E. D.: An empirically derived inorganic sea spray source function incorporating sea surface temperature, Atmos. Chem. Phys., 15, 11047–11066, https://doi.org/10.5194/acp-15-11047-2015, 2015.
Schlag, P., Kiendler-Scharr, A., Blom, M. J., Canonaco, F., Henzing, J. S., Moerman, M., Prévôt, A. S. H., and Holzinger, R.: Aerosol source apportionment from 1-year measurements at the CESAR tower in Cabauw, the Netherlands, Atmos. Chem. Phys., 16, 8831–8847, https://doi.org/10.5194/acp-16-8831-2016, 2016.
Schmale, J., Henning, S., Henzing, B., Keskinen, H., Sellegri, K., Ovadnevaite, J., Bougiatioti, A., Kalivitis, N., Stavroulas, I., Jefferson, A., Park, M., Schlag, P., Kristensson, A., Iwamoto, Y., Pringle, K., Reddington, C., Aalto, P., Äijälä, M., Baltensperger, U., Bialek, J., Birmili, W., Bukowiecki, N., Ehn, M., Fjæraa, A. M., Fiebig, M., Frank, G., Fröhlich, R., Frumau, A., Furuya, M., Hammer, E., Heikkinen, L., Herrmann, E., Holzinger, R., Hyono, H., Kanakidou, M., Kiendler-Scharr, A., Kinouchi, K., Kos, G., Kulmala, M., Mihalopoulos, N., Motos, G., Nenes, A., O'Dowd, C., Paramonov, M., Petäjä, T., Picard, D., Poulain, L., Prévôt, A. S. H., Slowik, J., Sonntag, A., Swietlicki, E., Svenningsson, B., Tsurumaru, H., Wiedensohler, A., Wittbom, C., Ogren, J. A., Matsuki, A., Yum, S. S., Myhre, C. L., Carslaw, K., Stratmann, F., and Gysel, M.: Collocated observations of cloud condensation nuclei, particle size distributions, and chemical composition, Scient. Data, 4, 170003, https://doi.org/10.1038/sdata.2017.3, 2017.
Schwarz, J. P., Perring, A. E., Markovic, M. Z., Gao, R. S., Ohata, S., Langridge, J., Law, D., McLaughlin, R., and Fahey, D. W.: Technique and theoretical approach for quantifying the hygroscopicity of black-carbon-containing aerosol using a single particle soot photometer, J. Aerosol. Sci., 81, 110–126, 2015.
Seinfeld, J. H., Bretherton, C., Carslaw, K. S., Coe, H., DeMott, P. J., Dunlea, E. J., Feingold, G., Ghan, S., Guenther, A. B., Kahn, R., Kraucunas, I., Kreidenweis, S. M., Molina, M. J., Nenes, A., Penner, J. E., Prather, K. A., Ramanathan, V., Ramaswamy, V., Rasch, P. J., Ravishankara, A. R., Rosenfeld, D., Stephens, G., and Wood, R.: Improving our fundamental understanding of the role of Aerosol–cloud interactions in the climate system, P. Natl. Acad. Sci. USA, 113, 5781–5790, 2016.
Shinozuka, Y., Clarke, A. D., Nenes, A., Jefferson, A., Wood, R., McNaughton, C. S., Ström, J., Tunved, P., Redemann, J., Thornhill, K. L., Moore, R. H., Lathem, T. L., Lin, J. J., and Yoon, Y. J.: The relationship between cloud condensation nuclei (CCN) concentration and light extinction of dried particles: indications of underlying aerosol processes and implications for satellite-based CCN estimates, Atmos. Chem. Phys., 15, 7585–7604, https://doi.org/10.5194/acp-15-7585-2015, 2015.
Sihto, S.-L., Mikkilä, J., Vanhanen, J., Ehn, M., Liao, L., Lehtipalo, K., Aalto, P. P., Duplissy, J., Petäjä, T., Kerminen, V.-M., Boy, M., and Kulmala, M.: Seasonal variation of CCN concentrations and aerosol activation properties in boreal forest, Atmos. Chem. Phys., 11, 13269–13285, https://doi.org/10.5194/acp-11-13269-2011, 2011.
Sillmann, J. and Croci-Maspoli, M.: Present and future atmospheric blocking and its impact on European mean and extreme climate, Geophys. Res. Lett., 36, L10702, https://doi.org/10.1029/2009GL038259, 2009.
Sorjamaa, R., Svenningsson, B., Raatikainen, T., Henning, S., Bilde, M., and Laaksonen, A.: The role of surfactants in Köhler theory reconsidered, Atmos. Chem. Phys., 4, 2107–2117, https://doi.org/10.5194/acp-4-2107-2004, 2004.
Sotiropoulou, R.-E. P., Medina, J., and Nenes, A.: CCN predictions: Is theory sufficient for assessments of the indirect effect?, Geophys. Res. Lett., 33, L05816, https://doi.org/10.1029/2005GL025148, 2006.
Sullivan, R. C., Moore, M. J. K., Petters, M. D., Kreidenweis, S. M., Roberts, G. C., and Prather, K. A.: Effect of chemical mixing state on the hygroscopicity and cloud nucleation properties of calcium mineral dust particles, Atmos. Chem. Phys., 9, 3303–3316, https://doi.org/10.5194/acp-9-3303-2009, 2009.
Taylor, J. W., Choularton, T. W., Blyth, A. M., Flynn, M. J., Williams, P. I., Young, G., Bower, K. N., Crosier, J., Gallagher, M. W., Dorsey, J. R., Liu, Z., and Rosenberg, P. D.: Aerosol measurements during COPE: composition, size, and sources of CCN and INPs at the interface between marine and terrestrial influences, Atmos. Chem. Phys., 16, 11687–11709, https://doi.org/10.5194/acp-16-11687-2016, 2016.
Tritscher, T., Jurányi, Z., Martin, M., Chirico, R., Gysel, M., Heringa, M. F., DeCarlo, P. F. , Sierau, B., Prévôt, A. S. H., Weingartner, E., and Baltensperger, U.: Changes of hygroscopicity and morphology during ageing of diesel soot, Environ. Res. Lett., 6, 034026, https://doi.org/10.1088/1748-9326/6/3/034026, 2011.
Venzac, H., Sellegri, K., Villani, P., Picard, D., and Laj, P.: Seasonal variation of aerosol size distributions in the free troposphere and residual layer at the puy de Dôme station, France, Atmos. Chem. Phys., 9, 1465–1478, https://doi.org/10.5194/acp-9-1465-2009, 2009.
Vogel, A. L., Schneider, J., Müller-Tautges, C., Phillips, G. J., Pöhlker, M. L., Rose, D., Zuth, C., Makkonen, U., Hakola, H., Crowley, J. N., Andreae, M. O., Pöschl, U., and Hoffmann, T.: Aerosol chemistry resolved by mass spectrometry: Linking field measurements of cloud condensation nuclei activity to organic aerosol composition, Environ. Sci. Technol., 50, 10823–10832, 2016.
Wang, J., Krejci, R., Giangrande, S., Kuang, C., Barbosa, H. M. J., Brito, J., Carbone, S., Chi, X., Comstock, J., Ditas, F., Lavric, J., Manninen, H. E., Mei, F., Moran-Zuloaga, D., Pöhlker, C., Pöhlker, M. L., Saturno, J., Schmid, B., Souza, R. A. F., Springston, S. R., Tomlinson, J. M., Toto, T., Walter, D., Wimmer, D., Smith, J. N., Kulmala, M., Machado, L. A. T., Artaxo, P., Andreae, M. O., Petäjä, T., and Martin, S. T.: Amazon boundary layer aerosol concentration sustained by vertical transport during rainfall, Nature, 539, 416–419, 2016.
Whitehead, J. D., Irwin, M., Allan, J. D., Good, N., and McFiggans, G.: A meta-analysis of particle water uptake reconciliation studies, Atmos. Chem. Phys., 14, 11833–11841, https://doi.org/10.5194/acp-14-11833-2014, 2014.
Whitehead, J. D., Darbyshire, E., Brito, J., Barbosa, H. M. J., Crawford, I., Stern, R., Gallagher, M. W., Kaye, P. H., Allan, J. D., Coe, H., Artaxo, P., and McFiggans, G.: Biogenic cloud nuclei in the central Amazon during the transition from wet to dry season, Atmos. Chem. Phys., 16, 9727–9743, https://doi.org/10.5194/acp-16-9727-2016, 2016.
Wiedensohler, A., Birmili, W., Nowak, A., Sonntag, A., Weinhold, K., Merkel, M., Wehner, B., Tuch, T., Pfeifer, S., Fiebig, M., Fjäraa, A. M., Asmi, E., Sellegri, K., Depuy, R., Venzac, H., Villani, P., Laj, P., Aalto, P., Ogren, J. A., Swietlicki, E., Williams, P., Roldin, P., Quincey, P., Hüglin, C., Fierz-Schmidhauser, R., Gysel, M., Weingartner, E., Riccobono, F., Santos, S., Grüning, C., Faloon, K., Beddows, D., Harrison, R., Monahan, C., Jennings, S. G., O'Dowd, C. D., Marinoni, A., Horn, H.-G., Keck, L., Jiang, J., Scheckman, J., McMurry, P. H., Deng, Z., Zhao, C. S., Moerman, M., Henzing, B., de Leeuw, G., Löschau, G., and Bastian, S.: Mobility particle size spectrometers: harmonization of technical standards and data structure to facilitate high quality long-term observations of atmospheric particle number size distributions, Atmos. Meas. Tech., 5, 657–685, https://doi.org/10.5194/amt-5-657-2012, 2012.
Wiedensohler, A., Wiesner, A., Weinhold, K., Birmili, W., Hermann, M., Merkel, M., Müller, T., Pfeifer, S., Schmidt, A., Tuch, T., Velarde, F., Quincey, P., Seeger, S., and Nowak, A.: Mobility Particle Size Spectrometers: Calibration Procedures and Measurement Uncertainties, Aerosol Sci. Tech., 52, 146–164, https://doi.org/10.1080/02786826.2017.1387229, 2018.
Wilcox, L. J., Highwood, E. J., Booth, B. B. B., and Carslaw, K. S.: Quantifying sources of inter-model diversity in the cloud albedo effect, Geophys. Res. Lett., 42, 1568–1575, 2015.
Wong, J. P. S., Lee, A. K. Y., Slowik, J. G., Cziczo, D. J., Leaitch, W. R., Macdonald, A., and Abbatt, J. P. D.: Oxidation of ambient biogenic secondary organic aerosol by hydroxyl radicals: Effects on cloud condensation nuclei activity, Geophys. Res. Lett., 38, L22805, https://doi.org/10.1029/2011GL049351, 2011.
Wu, Z. J., Poulain, L., Henning, S., Dieckmann, K., Birmili, W., Merkel, M., van Pinxteren, D., Spindler, G., Müller, K., Stratmann, F., Herrmann, H., and Wiedensohler, A.: Relating particle hygroscopicity and CCN activity to chemical composition during the HCCT-2010 field campaign, Atmos. Chem. Phys., 13, 7983–7996, https://doi.org/10.5194/acp-13-7983-2013, 2013.
Yoon, Y. J., Ceburnis, D., Cavalli, F., Jourdan, O., Putaud, J. P., Facchini, M. C., Decesari, S., Fuzzi, S., Sellegri, K., Jennings, S. G., and O'Dowd, C. D.: Seasonal characteristics of the physicochemical properties of North Atlantic marine atmospheric aerosols, J. Geophys. Res.-Atmos., 112, D04206, https://doi.org/10.1029/2005JD007044, 2007.
Zhang, Q., Jimenez, J. L., Canagaratna, M. R., Allan, J. D., Coe, H., Ulbrich, I., Alfarra, M. R., Takami, A., Middlebrook, A. M., Sun, Y. L., Dzepina, K., Dunlea, E., Docherty, K., DeCarlo, P. F., Salcedo, D., Onasch, T., Jayne, J. T., Miyoshi, T., Shimono, A., Hatakeyama, S., Takegawa, N., Kondo, Y., Schneider, J., Drewnick, F., Borrmann, S., Weimer, S., Demerjian, K., Williams, P., Bower, K., Bahreini, R., Cottrell, L., Griffin, R. J., Rautiainen, J., Sun, J. Y., Zhang, Y. M., and Worsnop, D. R.: Ubiquity and dominance of oxygenated species in organic aerosols in anthropogenically-influenced Northern Hemisphere midlatitudes, Geophys. Res. Lett., 34, L13801, https://doi.org/10.1029/2007GL029979, 2007.
Zieger, P., Väisänen, O., Corbin, J. C., Partridge, D. G., Bastelberger, S., Mousavi-Fard, M., Rosati, B., Gysel, M., Krieger, U. K., Leck, C., Nenes, A., Riipinen, I., Virtanen, A., and Salter, M. E.: Revising the hygroscopicity of inorganic sea salt particles, Nat. Commun., 8, 15883, https://doi.org/10.1038/ncomms15883, 2017.